Draft National Awareness of ENERGY STAR 2010 toEPA 2 … · Consolidated Edison Company of New York...
84
NATIONAL AWARENESS OF ENERGY STAR ® FOR 2009 ANALYSIS OF CEE HOUSEHOLD SURVEY 2010
Transcript of Draft National Awareness of ENERGY STAR 2010 toEPA 2 … · Consolidated Edison Company of New York...

NATIONAL AWARENESS OF ENERGY STAR® FOR 2009ANALYSIS OF CEE HOUSEHOLD SURVEY
2010

TABLE OF CONTENTS
Contents
Acknowledgements ................................................................................... ii
Executive Summary ............................................................................. ES-1
Introduction ................................................................................................ 1
Methodology Overview .............................................................................. 2
Key Findings............................................................................................... 5
Recognition .................................................................................................................. 5 Understanding ........................................................................................................... 12 Influence .................................................................................................................... 17 Information Sources ................................................................................................... 23
Appendix A: Detailed Methodology ...................................................... A-1
1 Questionnaire Design ............................................................................................ A-1 2 Sampling ................................................................................................................ A-6 3 Data Collection .................................................................................................... A-13 4 National Analysis ................................................................................................. A-14
Appendix B: Demographics .................................................................. B-1
Appendix C: Additional Questions From 2010 Survey ....................... C-1
1 ENERGY STAR Designation ................................................................................ C-1 3 ENERGY STAR Product Satisfaction ................................................................... C-2 4 Consumer Perceptions ......................................................................................... C-4 5 Purchasing Decisions ......................................................................................... C-12 6 CFL Purchaser Questions .................................................................................. C-13
Appendix D: 2010 Survey Questions and Flow Chart* ....................... D-1
Appendix E: Large and non-large DMAs Compared .......................... E-1
1 Purpose of Comparison ......................................................................................... E-1 2 Recognition ............................................................................................................ E-3 3 Understanding ....................................................................................................... E-3 4 Influence ................................................................................................................ E-7 5 Demographics...................................................................................................... E-11

ii
ACKNOWLEDGEMENTS The U.S. Environmental Protection Agency (EPA) would like to thank the Consortium for Energy Efficiency (CEE) and its members for making its survey data available for this analysis. The following CEE member organizations sponsored the 2010 survey: Cape Light Compact Consolidated Edison Company of New York (Con Edison) Long Island Power Authority National Grid New York State Energy Research and Development Authority Northeast Utilities Northwest Energy Efficiency Alliance NSTAR Electric Southern California Edison The United Illuminating Company Unitil We Energies Wisconsin Focus on Energy Xcel Energy
In addition, EPA would like to acknowledge Monica Nevius and Julie Caracino for their oversight of CEE data collection efforts; and Miriam Goldberg, Ryan Barry, Karen Rothkin, and Aaron Schneider of KEMA Inc.; and Jocelyn Turkel, Grant Halloran, and Sarah Duffy of The Cadmus Group, Inc. for data analysis and report preparation. Recommended citation:
EPA Office of Air and Radiation, Climate Protection Partnerships Division. National Awareness of ENERGY STAR® for 2010: Analysis of 2010 CEE Household Survey. U.S. EPA, 2011.

ES-1
EXECUTIVE SUMMARY In the fall of 2010, members of the Consortium for Energy Efficiency (CEE) sponsored the eleventh national household survey of consumer awareness of ENERGY STAR. Each year, the survey objectives have largely been the same: to collect national data on consumer recognition, understanding, and purchasing influence of the ENERGY STAR label, as well as data on messaging and product purchases. CEE members may choose to supplement the national sample by adding additional data points in order to assess label awareness in their local service territories. In 2010, additional surveys were conducted in the states of Massachusetts and New York (except Long Island), and the metropolitan areas of Denver and Minneapolis/St. Paul. As in all previous years, CEE and sponsoring members made the survey data publicly available to the EPA ENERGY STAR program for analysis. This report discusses the results of the CEE 2010 ENERGY STAR Household Survey, building on prior years’ survey results and focusing on the extent to which consumers recognize the ENERGY STAR label, understand its intended messages, and utilize (or are influenced by) the label in their energy-related purchase decisions. Research questions of interest included: Where do consumers see or hear about the ENERGY STAR label?
How does increased publicity affect recognition, understanding, and influence of the ENERGY STAR label?
Which key messages about the ENERGY STAR label are consumers retaining?
Do consumers demonstrate loyalty to the ENERGY STAR label? Key Findings at the National Level Eighty-three percent of households recognized the ENERGY STAR label when
shown the label. This is a statistically significant increase from the 77 percent finding in 2009.
Eighty-four percent of households had a high or general understanding of the label’s purpose. Furthermore, the proportion of households that demonstrated a general understanding was small compared with the proportion that demonstrated a high understanding (11 percent versus 73 percent).
Sixty-four percent of households associated the ENERGY STAR label with “efficiency or energy savings.”
Of households that recognized the ENERGY STAR label (aided) and purchased a product in a relevant product category within the past 12 months, 77 percent
ES-2
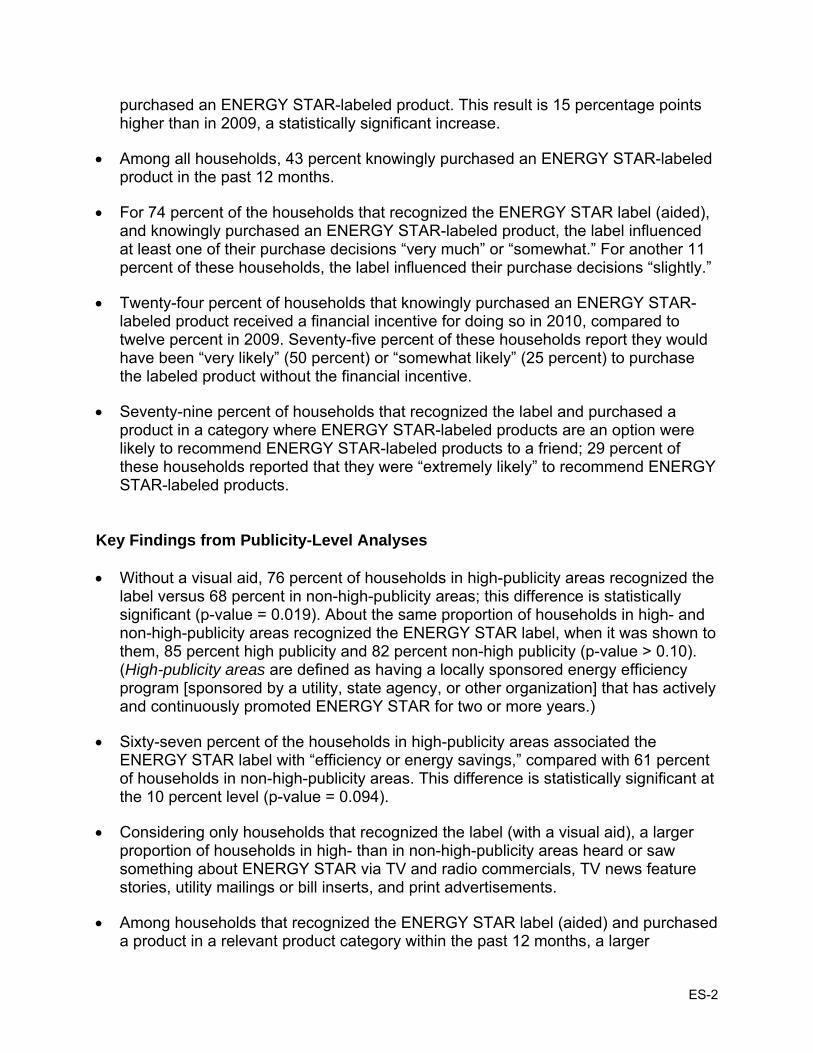
purchased an ENERGY STAR-labeled product. This result is 15 percentage points higher than in 2009, a statistically significant increase.
Among all households, 43 percent knowingly purchased an ENERGY STAR-labeled product in the past 12 months.
For 74 percent of the households that recognized the ENERGY STAR label (aided), and knowingly purchased an ENERGY STAR-labeled product, the label influenced at least one of their purchase decisions “very much” or “somewhat.” For another 11 percent of these households, the label influenced their purchase decisions “slightly.”
Twenty-four percent of households that knowingly purchased an ENERGY STAR-labeled product received a financial incentive for doing so in 2010, compared to twelve percent in 2009. Seventy-five percent of these households report they would have been “very likely” (50 percent) or “somewhat likely” (25 percent) to purchase the labeled product without the financial incentive.
Seventy-nine percent of households that recognized the label and purchased a product in a category where ENERGY STAR-labeled products are an option were likely to recommend ENERGY STAR-labeled products to a friend; 29 percent of these households reported that they were “extremely likely” to recommend ENERGY STAR-labeled products.
Key Findings from Publicity-Level Analyses Without a visual aid, 76 percent of households in high-publicity areas recognized the
label versus 68 percent in non-high-publicity areas; this difference is statistically significant (p-value = 0.019). About the same proportion of households in high- and non-high-publicity areas recognized the ENERGY STAR label, when it was shown to them, 85 percent high publicity and 82 percent non-high publicity (p-value > 0.10). (High-publicity areas are defined as having a locally sponsored energy efficiency program [sponsored by a utility, state agency, or other organization] that has actively and continuously promoted ENERGY STAR for two or more years.)
Sixty-seven percent of the households in high-publicity areas associated the ENERGY STAR label with “efficiency or energy savings,” compared with 61 percent of households in non-high-publicity areas. This difference is statistically significant at the 10 percent level (p-value = 0.094).
Considering only households that recognized the label (with a visual aid), a larger proportion of households in high- than in non-high-publicity areas heard or saw something about ENERGY STAR via TV and radio commercials, TV news feature stories, utility mailings or bill inserts, and print advertisements.
Among households that recognized the ENERGY STAR label (aided) and purchased a product in a relevant product category within the past 12 months, a larger

ES-3
proportion of households in non-high- than in high-publicity areas purchased a labeled product (81 percent vs. 73 percent, p-value = 0.089).
Conclusions This eleventh national study of household awareness of the ENERGY STAR label confirms key findings from the previous years’ surveys: Substantial portions of U.S. households in the surveyed population recognize,
understand, and are influenced by the ENERGY STAR label.
The proportion of households that exhibit only a general understanding of the label is small (11 percent) compared with the proportion of households that exhibit a high understanding (73 percent).
This study found ENERGY STAR label aided recognition in non-high-publicity areas to be quite similar to recognition in high-publicity areas. It should be noted that during 2010, as part of the American Recovery and Reinvestment Act of 2009, the U.S. Department of Energy made funding available to U.S. states and territories to support consumer rebates for ENERGY STAR qualified appliances.
Publicity efforts of active regional/local energy efficiency program sponsors increase unaided recognition of the label. These efforts also appear to have an effect on the understanding of the label, with a larger proportion of households in high- than non-high-publicity areas associating the label with “energy efficiency/savings.”

1
INTRODUCTION In the fall of 2010, members of the Consortium for Energy Efficiency (CEE) sponsored the eleventh national household survey of consumer awareness of ENERGY STAR. Each year, the survey objectives have largely been the same: to collect national data on consumer recognition, understanding, and purchasing influence of the ENERGY STAR label, as well as data on messaging and product purchases. CEE members may choose to supplement the national sample in order to assess label awareness in their local service territories. To this end, in 2010 additional surveys were conducted in two states—Massachusetts, and New York (except Long Island)—and two Nielsen Designated Market Areas® (DMA)—Denver and Minneapolis-St. Paul. As in the ten previous years, CEE and sponsoring members made the survey data publicly available for this analysis. This report discusses the results of the CEE 2010 ENERGY STAR Household Survey, building on prior years’ survey results and focusing on the extent to which consumers recognize the ENERGY STAR label, understand its intended messages, and utilize (or are influenced by) the label in their energy-related purchase decisions. Research questions of interest included the following: Where do consumers see or hear about the ENERGY STAR label?
How does increased publicity affect recognition, understanding, and influence of the ENERGY STAR label?
Which key messages about the ENERGY STAR label are consumers retaining?
Do consumers demonstrate loyalty to the ENERGY STAR label? The remainder of this report summarizes the survey and analysis methodology; provides key findings regarding ENERGY STAR label recognition, understanding, influence, and information sources. It also contains appendices presenting detailed survey methodology (Appendix A), demographic information (Appendix B), additional questions from the 2010 survey (Appendix C), a copy of the 2010 questionnaire (Appendix D), and analysis of responses from additional households not currently included in the national analysis (i.e., Non-Top-57 DMAs) (Appendix E). In all cases, the results presented in this report were weighted to obtain results applicable at the national level (please refer to Appendix A for details on the weighting methodology).

2
METHODOLOGY OVERVIEW During September 2010, CEE fielded a questionnaire to obtain information at the national level on consumer awareness of the ENERGY STAR label (please refer to Appendix A for a more detailed outline of the survey methodology). A random sample of households that are members of an internet panel was surveyed. Both the internet panel as a whole and the sample of households completing the survey were selected by address-based sampling and recruited by telephone.1 The panel is designed to be representative of the U.S. population. This year’s questionnaire was similar to the ones CEE fielded in 2000-2009. As in previous years, CEE and its sponsoring members made the survey data available to EPA for analysis. The survey was a national survey. The sampling frame for this national survey included all households in the largest DMAs that together accounted for about 70 percent of U.S. television households (the largest 57 DMAs). In addition, some CEE members chose to sponsor more intensive sampling (i.e., an oversample) in selected localities, referred to here as sponsor areas. In 2010, there were four sponsor areas:
Massachusetts New York state (with the exception of Long Island) Denver DMA Minneapolis-St. Paul DMA
Sponsor areas are not limited to the 57 largest DMAs. Prior to 2010, the national sample covered only the 57 largest DMAs and any portion of the sponsor areas that fell outside the 57 largest DMAs. In 2010, the national sample added a stratum grouping the remaining 153 DMAs.2 Thus, the complete frame for the study was all 210 DMAs. However, to facilitate comparisons across years, the national results were based only on data collected from respondents from the 57 largest DMAs. Data collected from respondents not in the 57 largest DMAs, but in a sponsor area or in the national Non-Top-57 sample, are not included in the main body of the report but are provided in Appendix E. Some of the 57 largest DMAs are also included in the sponsor areas and therefore were oversampled. The data from these respondents (as well as from the other respondents in the 57 largest DMAs) received an appropriate weight in the analysis in order to generate valid national results and facilitate comparison with data from other years.
1 In previous years, the panel was recruited via random-digit dial. Knowledge Networks, the firm that conducts the survey each year, believes that address-based sampling (ABS) offers advantages, including coverage of cell-phone-only households, and analysis of non-response bias. More information is available at http://www.knowledgenetworks.com/accuracy/fall-winter2010/abs-fall2010.html. 2 The addition 153 non-large DMAs are not included in the national analysis results presented in the body of this report.

3
As in previous years’ studies, the Top-57 DMAs in the sampling frame were classified by publicity category. The original intent of the classification was to be able to assess the effect of local energy efficiency program publicity on awareness. The majority of these local efficiency programs historically have been supported by utility rate-payer funded energy efficiency programming. However, during 2010, as part of the American Recovery and Reinvestment Act (ARRA) of 2009, the U.S. Department of Energy also made funding available to U.S. states and territories to support consumer rebates for ENERGY STAR qualified appliances. A decision was made to retain the same publicity classification procedure used in the past 9 years and to retain the prior year’s publicity classification of the 57 largest DMAs—in essence preserving the historical classification for future study years, which was based on the following criteria: High publicity: Active local ENERGY STAR promotion recently sponsored by a
utility, state agency, or other organization for two or more continuous years. The activities must include sustained promotions and publicity from non-federal sources.
Low publicity: Federal campaign activities only and no significant regional program sponsor activities.
Other: All other DMAs. The key working definitions are below: Recent: The 2 years of activity must include the time period during which the
survey was in the field.
Sustained: The 2 years of activity must be continuous.
Significant: In addition to any direct federal publicity efforts, a DMA’s publicity efforts must include a deliberate and multifaceted regional program sponsor investment in ENERGY STAR programming, such as direct marketing efforts or the creation and distribution of promotional material.
Although the sample design was based on the 2010 publicity classifications, given the significant short-term publicity and funding associated with ARRA, for the purpose of this report, low publicity and other publicity are combined in the analysis and referenced as non-high publicity areas. Another reason to combine these categories in the analysis is that over time, the population of low-publicity DMAs has dropped to about 15 percent, while high-publicity DMAs now account for about half of U.S. television households. The sample was stratified by area and within an area by publicity category. Each sponsor area is also further stratified by large versus non-large DMA. The CEE members who fund the oversample for a sponsor area determine the total number of sampling points allocated to the sponsor area as a whole. This total number of

4
sampling points is then allocated across sponsor area strata proportional to population. While the dataset has always been appropriately weighted in the national analysis, in 2010, for the first time, the number of respondents in each stratum was chosen in proportion to that stratum’s share of the U.S. population living in DMAs. As in the past for the national sample, the three publicity categories (the top 57 DMAs) comprise 1,000 respondents. This report presents the 2010 survey results at the national level and by publicity category. Results are presented on consumer recognition and understanding, and purchasing influence of the ENERGY STAR label, as well as on messaging, product purchases, and information sources that consumers use in their purchasing decisions. In this report, the following terminology is used in comparing results across years or sub-categories. (1) The term “significant” implies statistical significance. In other words, differences between proportions that are described as “significant” are at least statistically different at the 10-percent level of significance. In some cases, the p-values are given to provide the exact level of statistical significance. (2) Unless stated otherwise, terms such as “smaller,” “larger,” “increase,” or “decrease” refer to changes that are statistically significant at the 10-percent level or better. (3) The term “similar” implies that there is no statistical difference between the results being compared at the 10-percent level of significance. In other words, the difference between the results is within the bounds that would be expected from chance variation in a random sample.

5
KEY FINDINGS RECOGNITION In 2010, 83 percent of households recognized the ENERGY STAR label when shown the label (i.e., aided recognition). Seventy-two percent of households recalled having seen or heard of the ENERGY STAR label without first being shown the label (i.e., unaided recognition). For purposes of this analysis, respondents were said to recognize the ENERGY STAR label if they had seen or heard of the label before the survey. Recognition of the label was explored in two ways. Unaided recognition was measured by asking if the respondent had seen or heard of the ENERGY STAR label without showing the label. Delivery of the survey by internet made it possible to measure unaided recognition. Aided recognition was measured by showing respondents the ENERGY STAR label and then asking if they had seen or heard of the label. Both methods are useful measurements of label recognition, although unaided recognition is the more conservative of the two. Recognition results for both the 2010 and 2009 surveys are summarized in the following table. The 2010 and 2009 aided and unaided recognition of the ENERGY STAR label results are statistically different at the 1-percent level (aided p=0.008, unaided p=0.005).
Recognition of the ENERGY STAR Label [Base = All respondents]
Recognize ENERGY STAR Label
2010 2009
Aided (n=1,641)
Unaided (n=1,521)
Aided (n=1,034)
Unaided (n=917)
Yes 83% 72% 77% 64% Standard error 1.3% 1.7% 2.0% 2.4%
Note: The unaided recognition results for both years were based on the question ES1: “Have you ever seen or heard of the ENERGY STAR label?” The aided recognition results were based on five questions. (1) ES3A and (2) ES3B were asked if ES1 = “yes.” ES3A: “Is this the label you have seen or heard of before?”—whether the old or new label was shown was randomly determined. ES3B: “Have you seen or heard of this version of the ENERGY STAR label?” —where the label shown was the one not shown previously. (3) ES3C and (4) ES3D were asked if ES1 = “no.” ES3C: “Please look at the ENERGY STAR label on the left. Have you ever seen or heard of this label?”—whether the old or new label was shown was randomly determined. ES3D: “Have you seen or heard of this version of the ENERGY STAR label?”—where the label shown was the one not shown previously. (5) ES6 was asked if either ES1 = “no” or both ES3A and ES3B = “no.” ES6: “Now that you have had the opportunity to see the ENERGY STAR label, do you recall seeing or hearing anything about it before this survey?”— where both the old and new labels were shown.

6
Recognition by Publicity Category In 2010, aided and unaided recognition were similar in high- and non-high-publicity areas. After being shown the ENERGY STAR label, 85 percent of households in high-publicity areas, and 82 percent in non-high-publicity areas recognized the label; this difference was not statistically significant (p-value = 0.348). Unaided recognition was 76 percent in high-publicity areas and 68 percent in non-high-publicity areas; this difference was statistically significant at the 5-percent level for unaided recognition (p-value = 0.019).
Recognition of the ENERGY STAR Label by Publicity Category [Base = All respondents]
** High- and non-high-publicity area proportions are statistically different from each other at the 5-percent
level of significance (p-value0.05).
85%
76%
82%
68%
0%
10%
20%
30%
40%
50%
60%
70%
80%
90%
100%
Aided (n=1,641) **Unaided (n=1,521)
High Publicity
Non-High Publicity

7
Product Associations Households that recognized the ENERGY STAR label (aided) indicate strong association between products historically supported by regional energy efficiency programs (refrigerators, washing machines, dishwashers, compact fluorescent light bulbs, etc.,) and the ENERGY STAR label. Survey respondents that recognized the ENERGY STAR label (aided) were asked, “What types of products, goods, and services do you think of when you think of the ENERGY STAR label?” (survey question QA). The figure on the next page presents the results for this question, which indicate unprompted product associations. Unprompted, appliances, refrigerators, and washing machines showed the strongest associations with the label at 43, 37, and 34 percent, respectively. Though it does not have an ENERGY STAR specification, clothes dryers showed the fourth strongest association with the label at 30 percent. The next most strongly associated products (unprompted) were dishwashers, stoves/ovens, and air conditioners, at 16, 13, and 13 percent, respectively. Of the top eight product associations, only televisions are significantly different from the 2009 results—five percentage points higher. The list of products mentioned by households without prompting also includes two products, in addition to clothes dryers, that do not have an ENERGY STAR specification: microwave ovens and stoves/ovens. One product showed a significant decrease in unprompted association: windows. The other product to show a significant change, stereo/radio was mentioned slightly more frequently than in 2009; however, stereo/radio was mentioned by one percent or less of the respondents. When prompted, eighty-six percent of households had seen the label on refrigerators. Washing machines (77 percent) and dishwashers (73 percent) were the next products most commonly associated with the ENERGY STAR label. Windows, gas water heaters, room air conditioners, central A/C, microwave ovens, and televisions, followed next in a range of 45 to 51 percent. While 46 percent of households associated microwave ovens with the ENERGY STAR label, as mentioned above, they are not an ENERGY STAR-labeled product. Thirteen out of 28 products show a significant increase in prompted product association. No products show a significant decrease in prompted association compared to 2009.

8
Unprompted Product Association with the ENERGY STAR Label [Base = Recognize label (aided), n = 1,237]
Note: QA: “What types of products, goods, or services do you think of when you think of the ENERGY STAR label? Please write your answers below.”
*** 2010 and 2009 proportions are statistically different from each other at the 1-percent level of significance (p-value≤0.01). The proportion of households in 2010 is larger than 2009 for television.
** 2010 and 2009 proportions are statistically different from each other at the 15-percent level of significance (p-value≤0.05). The proportion of households in 2010 is larger than 2009 for stereo/radio.
* 2010 and 2009 proportions are statistically different from each other at the 10-percent level of significance (p-value0.10). The proportion of households in 2010 is smaller than 2009 for window.
<1%<1%
<1%<1%
<1%1%
1%
1%
1%2%
3%3%
4%
6%
7%
8%8%
9%
9%11%
11%13%
13%16%
30%34%
37%
43%
0% 20% 40% 60% 80% 100%
Thermostat
Vacuum cleaner
Boiler
Insulation
Computer printer
Fan
Dehumidifier
VCR/DVD
**Stereo/radio
*Window
Heater
Furnace
Microwave oven
Freezer
No product
Electronics
Computer or monitor
Lighting
Water heater
Other
***Television
Air conditioner
Stove/oven
Dishwasher
Clothes Dryer
Washing machine
Refrigerator
Appliance

9
Prompted Product Association with the ENERGY STAR Label [Base = Recognize label (aided)3]
Note: Q5 (a, b, and c): “Now we’re going to ask you about several groups of products. As you review the list, please select each of the products, product literature, or packaging on which you have seen the ENERGY STAR label.”
*** 2010 and 2009 proportions are statistically different from each other at the 1-percent level of significance (p-value≤0.01). The proportion of households in 2010 is larger than 2009 for all starred values.
** 2010 and 2009 proportions are statistically different from each other at the 5-percent level of significance (p-value0.05).The proportion of households in 2010 is larger than 2009 for all starred values.
* 2010 and 2009 proportions are statistically different from each other at the 10-percent level of significance (p-value0.10). The proportion of households in 2010 is larger than 2009 for all starred values.
3 Respondents were asked about three sets of product groupings: (1)(a) Heating and Cooling Products and Home Office Equipment, (2)(b) Home Appliances/Lighting and Home Electronics, and (3)(c) Building Materials and Buildings. The sample sizes, n, for these sets of product groupings are 1,268, 1,269, and 1,230 respectively.
<1%<1%
<1%<1%<1%<1%15%16%18%20%20%21%21%
24%26%26%
31%32%
37%45%46%47%48%48%
51%73%
77%86%
0% 20% 40% 60% 80% 100%
ScannerFax machine
**Audio product*Skylight
DehumidifierRoofing material
*Copying machine**Computer printer
**ThermostatHeat pump
**All-in-one printer**DVD
Lighting fixture**Newly built home
InsulationDoor
Compact fluorescent light bulbFurnace/boiler
Computer or monitor***Television
***Microwave ovenCentral A/C
*Room air conditionerGas water heater
Window**Dishwasher
Washing machine***Refrigerator

10
Product Associations by Publicity Category Regional energy efficiency program sponsors have traditionally focused on promoting ENERGY STAR qualified lighting, refrigerators, room air conditioners, washing machines, dishwashers, programmable thermostats4, and new homes. More recently, program sponsors have begun to promote ENERGY STAR qualified water heaters and TVs in some parts of the country. In addition, some programs that have traditionally promoted ENERGY STAR appliances might have begun promoting higher levels of efficiency due to local market conditions, or discontinued other promotions in anticipation of state-run ENERGY STAR appliance rebate programs coming online in response to the American Recovery and Reinvestment Act. Key findings from this year’s analysis of product association by publicity category include the following. A significantly larger proportion of households in high- than non-high-publicity
areas associated the following products with the ENERGY STAR label when prompted: dishwashers, TVs, furnaces and boilers, and thermostats (which no longer qualify for ENERGY STAR labeling).5
A significantly smaller proportion of households in high- than in non-high-publicity areas associated heat pumps with the label when prompted.
Furnaces and boilers were mentioned more often in high-publicity areas than low in the three previous reports, which is consistent with the 2010 difference between high- and non-high-publicity groups. The significant result for heat pumps was also found in each of the previous 4 and 6 years, respectively. Heat pump technology is better suited to, and more prevalent in warmer climates, which are more likely to be non-high-publicity areas.
4 EPA suspended the use of the ENERGY STAR label for programmable thermostats December 31, 2009. While EPA recognizes the potential for programmable thermostats to save significant amounts of energy, there continue to be questions regarding the net savings and environmental benefits achieved due to variations in consumer understanding and usage of programmable thermostats. EPA is working to develop a related Residential Climate Control specification. For more information visit energystar.gov/productdevelopment. 5 Ibid.

11
Prompted Product Association with the ENERGY STAR Label by Publicity Category [Base = Recognize label (aided)6]7
** High- and non-high-publicity area proportions are statistically different from each other at the 5-percent level of
significance (p-value0.05).
* High- and non-high-publicity area proportions are statistically different from each other at the 10-percent level of significance (p-value0.10).
6 As discussed in footnote 3, respondents were asked about three sets of product groupings. In Heating and Cooling Products and Home Office Equipment, the sample sizes for high- and non-high - publicity areas are 759 and 509, respectively. For Home Appliances/Lighting and Home Electronics they are 761 and 508, and for Building Materials and Buildings they are 738 and 492. 7 The percent labels on the bars are rounded to nearest whole number. Therefore bars with the same label may not appear to be the same length.
10%
7%
11%
16%
11%
11%
14%
16%
23%
16%
18%
20%
27%
19%
26%
25%
31%
28%
34%
47%
49%
45%
41%
49%
50%
69%
76%
85%
9%
9%
13%
14%
15%
15%
16%
17%
17%
21%
21%
22%
23%
24%
26%
27%
31%
36%
40%
47%
47%
48%
48%
48%
52%
76%
79%
87%
0% 20% 40% 60% 80% 100%
Fax machine
Scanner
Audio product
Roofing material
Dehumidifier
Skylight
Copying machine
Computer printer
*Heat pump
*Thermostat
All-in-one printer
DVD
Newly built home
Lighting fixture
Door
Insulation
Compact fluorescent light bulb
**Furnace/boiler
Computer or monitor
Central A/C
Room air conditioner
Microwave oven
*Television
Gas water heater
Window
*Dishwasher
Washing machine
Refrigerator
High Publicity
Non-High Publicity

12
UNDERSTANDING
In 2010, 84 percent of households had at least a general understanding of the ENERGY STAR label. Furthermore, the proportion of households that exhibited only a general understanding (11 percent) was small compared with the proportion that exhibited a high understanding (73 percent). The level of understanding was investigated by asking respondents what messages came to mind when they saw the ENERGY STAR label. Based on the reported messages, a respondent’s understanding was classified as high, general, or no understanding. The 2010 and 2009 survey results on the level of understanding of the ENERGY STAR label are provided in the following table. There are no statistical differences between 2010 and 2009.
Understanding of the ENERGY STAR Label [Base = All respondents]
Level of Understanding of the Label
2010 (n=1,707)
2009 (n=1,091)
2008 (n=1,881)
High understanding 73% 70% 68% General understanding 11% 11% 10% No understanding 16% 19% 22%
Total 100% 100% 100% Note: The level of understanding of the ENERGY STAR label is determined using the open-ended responses to two questions (1) ES2: “What does the ENERGY STAR label mean to you?”, and (2) ES4A1: “Please look at the ENERGY STAR labels on the left. Type the messages that come to mind when you see the ENERGY STAR label.” In all years except 2006, all respondents were asked either ES2 or ES4A1, depending on their answers to ES1. Respondents that answered "Yes" to ES1 were then asked ES2, while all other respondents were asked ES4A1.

13
Understanding by Publicity Category The level of understanding of the ENERGY STAR label was similar in high- and non-high-publicity areas. Eighty-three percent of households in high-publicity areas had at least a general understanding of the label compared with 85 percent of households in non-high-publicity areas. The difference between the publicity areas is not statistically significant at the 10-percent level. Among those households with at least a general understanding of the ENERGY STAR label, more households exhibited a high degree of understanding in both publicity categories.
Understanding of the ENERGY STAR Label by Publicity Category [Base = All respondents]
Publicity Category At Least General
Understanding of Label
High 83% Non-high 85%
Difference (High minus Non-High) -1%
p-value 0.622
Understanding of the ENERGY STAR Label by Publicity Category [Base = All respondents]
** For General Understanding, high- and non-high-publicity area proportions are statistically different from each
other at the 5-percent level of significance (p-value0.05).
9% 14%
74%71%
0%
10%
20%
30%
40%
50%
60%
70%
80%
90%
100%
High Publicity Non-High Publicity
High Understanding General Understanding

14
Understanding of Label Messaging Open-ended responses to the questions on the level of understanding of the ENERGY STAR label are an indicator of how effectively EPA communicates its messages through the label. These responses are used in the analysis of understanding in the previous section. By far, the most common message associated with the label was “energy efficiency or energy savings,” which is considered high understanding of the label. Sixty-four percent of households surveyed associated the ENERGY STAR label with this message. The second most common response was “environmental benefit” offered by 13 percent of households, which is also considered high understanding of the label. Between 2009 and 2010 there was an increase in the proportion of respondents saying “save money on operation,” “energy/environmental product standards,” “quality,” “electricity,” “product standards, no environmental link,” and “confuses with EnergyGuide.” There was a decrease in “environmental benefit,” and “mentions specific products.”
Messages of the ENERGY STAR Label [Base = All respondents]
*** 2010 and 2009 proportions are statistically different from each other at the 1-percent level of significance (p-value≤0.01).
** 2010 and 2009 proportions are statistically different from each other at the 5-percent level of significance (p-value≤0.05).
* 2010 and 2009 proportions are statistically different from each other at the 10-percent level of significance (p-value≤0.10).
<1%
<1%
1%
2%
2%
2%
3%
5%
9%
3%
4%
7%
8%
13%
64%
0% 20% 40% 60% 80% 100%
Save money on purchase
***Product standards no environmental link
*Quality
***Mentions specific products
Environmental no link to benefit
Government backing
**Confuses with EnergyGuide
**Electricity
Energy no link to efficiency
Energy conservation
Savings (not linked to operation)
**Energy/environmental product standards
***Save money on operation
**Environmental benefit
Energy efficiency/savings
General Understanding
High Understanding

15
Understanding of Label Messaging by Publicity Category More respondents (67 percent) in high-publicity regions were likely to volunteer “energy efficiency/savings” than in non-high-publicity regions (61 percent), which is significant at the 10-percent level. For other messages, the proportion of households that associated the message with the ENERGY STAR label was similar for high- and non-high-publicity areas.
Messages of the ENERGY STAR Label by Publicity Category [Base = All respondents]
*High- and non-high-publicity area proportions are statistically different from each other at the 10-percent level of significance (p-value≤0.10).
<1%
<1%<1%
2%
3%
3%
3%
6%
10%
3%
4%
6%
7%
13%
61%
1%1%
1%
2%
2%
2%
3%
4%
9%
4%
4%
7%
9%
12%
67%
0% 20% 40% 60% 80% 100%
Save money on purchase
Quality
Product standards no environmental link
Mentions specif ic products
Environmental no link to benefit
Government backing
Confuses with EnergyGuide
Electricity
Energy no link to efficiency
Energy conservation
Savings (not linked to operation)
Energy/environmental product standards
Save money on operation
Environmental benefit
*Energy efficiency/savings
High Publicity Non-High Publicity
High Understanding
General Understanding

16
Understanding of the ENERGY STAR Label by Aided Recognition
Households that recognized the ENERGY STAR label when shown the label were more likely to have at least a general understanding of the label than those that did not recognize the label. In 2010, 87 percent of households that recognized the ENERGY STAR label had at least a general understanding of it, while among households that did not recognize the label, 74 percent had at least a general understanding of it. The 13 percentage point difference in understanding between households that recognized the label and those that did not is statistically significant at the 1-percent level. The proportion of households who did not recognize the label but had at least a general understanding of it rose to 74 percent in 2010, up from 63 percent in 2009; this increase is statistically significant at the 10-percent level.
Understanding of the ENERGY STAR Label by Aided Recognition [Base = All respondents]
Recognize ENERGY STAR Label Aided
At Least General Understanding of Label
2010 2009 Yes 87% 87% No 74% 63%
Difference (Yes minus No) 13% 24% p-value 0.002 <0.0001

17
INFLUENCE
The survey provided some insight into consumers’ decisions to purchase ENERGY STAR-labeled products, including the following: The proportion of households nationwide that recognized the ENERGY STAR
label and knowingly purchased an ENERGY STAR-labeled product
The influence of the ENERGY STAR label on purchase decisions
The role of rebates or financing in decisions to buy ENERGY STAR-labeled products
The loyalty of purchasers to ENERGY STAR-labeled products
Purchases of ENERGY STAR-labeled Products In order to estimate the percent of all households that knowingly purchased an ENERGY STAR product, the following three proportions were multiplied: The proportion of all households that recognized the ENERGY STAR label
(aided)
Of the households that recognized the label (aided), the proportion that purchased a product in a product category that has an ENERGY STAR specification
Of the households that recognized the label (aided) and purchased a product in a relevant category, the proportion that knowingly purchased an ENERGY STAR-labeled product
The result is that 43 percent of all households knowingly purchased an ENERGY STAR product in the past twelve months. This result is statistically different (higher), at the 1-percent level, from the 2009 result. It is not significantly different from the 2008 estimate (40 percent), suggesting that the 2009 result was not part of a downward trend.
Purchased ENERGY STAR (Base = All respondents)
Purchased ENERGY STAR product 2010 (n=1,641)
2009 (n=1,034)
2008 (n=1,805)
Estimate (yes) 43% 33% 40% Standard Error 2.2% 2.6% 2.3%
*** 2010 and 2009 results are statistically different from each other at the 1-percent level of significance (p-value≤0.01). 2010 and 2008 results are statistically similar (p-value >0.10).

18
An increase or decrease in the percent of all households that knowingly purchased an ENERGY STAR product could be due to changes in any of the three proportions listed above between 2009 and 2010. Aided recognition increased from 77 percent to 83 percent and knowingly purchased an ENERGY STAR product increased from 62 percent to 77 percent; both increases were statistically significant at the 1-percent level. There was no significant change (at the 10-percent level) for the proportion that purchased a product.
Purchases of ENERGY STAR by Publicity Category The proportion of all households that knowingly purchased an ENERGY STAR product in high- versus non-high-publicity areas is 43 and 44 percent, respectively. This difference is not significant at the 10-percent level (p-value = 0.757). The market penetration of ENERGY STAR products increased in high-publicity categories from 32 percent in 2009 to 43 percent in 2010. This difference is significant at the 5-percent level (p-value = 0.023).
National Household Market Penetration of ENERGY STAR
Products by Publicity Category [Base = All respondents]
Publicity Category % Households
High 43% Non-High 44% Difference (High minus Non-High) -1.4%
p-value 0.757

19
Three proportions are used to calculate the proportion of all households that knowingly purchased an ENERGY STAR product: aided recognition of the program label, purchase of a relevant product, and the proportion of those purchasers that bought ENERGY STAR products. In 2010, the differences between high- and non-high-publicity areas are not statistically significant for aided recognition and purchase of a relevant product. However the proportion of purchasers that knowingly purchased an ENERGY STAR product is 81 percent in non-high-publicity areas, while in high-publicity areas it is 73 percent.
National Household Market Penetration of ENERGY STAR Products by Publicity Category
[Base = All respondents]
Aided
RecognitionPurchased
Product
Knowingly Purchased
ENERGY STAR product
High 85% 69% 73% Non-High 82% 66% 81%
Difference 2.5% 2.7% -7.9%
p-value 0.349 0.463 0.089
Influence of the ENERGY STAR Label In 2010, for 74 percent of households that knowingly purchased an ENERGY STAR- labeled product, the label influenced at least one of their purchase decisions “very much” or “somewhat.” This is not statistically different from the 2009 result of 80 percent (p-value = 0.164). Nearly half of the households that knowingly purchased an ENERGY STAR-labeled product, reported having been influenced “very much” by the label. For 11 percent of households, the label influenced their purchase decisions “slightly.” Fifteen percent of households reported the presence of the ENERGY STAR label had no influence on their purchase. These findings are not significantly different from those of 2009.

20
Influence of the ENERGY STAR Label on Purchase Decisions8 [Base = Recognize label (aided) and ENERGY STAR purchasers]
Influence of the Label on Purchasing Decisions
2010 (n=556)
Maximum
2009 (n=277)
Maximum
Very much 48% 47% Somewhat 26% 33% Slightly 11% 7% Not at all 15% 13%
Total 100% 100%
Note: Q8: “For each ENERGY STAR-labeled product you purchased, how much did the ENERGY STAR label influence your purchase decision?”
Influence of the ENERGY STAR Label by Publicity Category The purchase decisions of 54 percent of households in high-publicity areas were influenced "very much" by the ENERGY STAR label, compared to 42 percent in non-high-publicity areas; this difference is significant at the 10-percent level. When these proportions are added to the proportions of households for which the ENERGY STAR label was “somewhat” influential in their purchasing decisions, the high- to non-high-publicity area comparison is 76 to 71 percent, respectively, which is not statistically different at the 10-percent level of significance. The combined “very much, somewhat, or slightly” proportion is 89 percent in high-publicity areas, and 80 percent in non-high-publicity areas. This difference is significant at the 10 percent level.
Influence of the ENERGY STAR Label on Purchase Decisions by Publicity Category [Base = Recognize label (aided) and ENERGY STAR purchasers, n = 556]
Publicity Category Very much Very much
or somewhat
Very much, somewhat, or slightly
High 54% 76% 89%
Non-High 42% 71% 80%
Difference (High minus Non-High ) 12% 5% 8%
p-value 0.054 0.357 0.080
8 Respondents that recognize the label (aided) and purchased an ENERGY STAR-labeled product are asked Q8 (“For each ENERGY STAR-labeled product you purchased, how much did the ENERGY STAR label influence your purchase decision?”) for each ENERGY STAR-labeled product they purchased. The results presented in this table use the highest influence rating provided by respondents that purchased more than one ENERGY STAR-labeled product.

21
Rebate and Financing Influence From 2009 to 2010, the percentage of households that knowingly purchased an ENERGY STAR-labeled product and received rebates or reduced-rate financing increased from 12 percent to 24 percent. This difference is statistically significant at the 1-percent level (p-value =0.002). Of these households in 2010, 50 percent would have been “very likely” to purchase the ENERGY STAR product if financial incentives had not been available. This increase of 13 percentage points from the previous year is not statistically significant. Another 25 percent would have been “somewhat likely” to purchase without a rebate in 2010. This leaves 20 percent that would have been “slightly likely” and 5 percent “not at all likely.” None of these are significantly different from 2009.
Received Financial Incentive for an ENERGY STAR Product Purchased [Base = Recognize label (aided) and ENERGY STAR purchaser]
Received Financial Incentive for an ENERGY STAR Product Purchased
% Households
2010 (n=521)
2009 (n=261)
Yes*** 24% 12%
No 76% 88% Total 100% 100%
Note: Q9: “Did you receive rebates or reduced-rate financing for any ENERGY STAR-labeled product(s) you purchased?”
*** 2010 and 2009 results are statistically different from each other at the 1-percent level of significance (p-value≤0.01).
Influence of Rebates and Financing on Purchasing Decisions
[Base = Recognize label (aided), ENERGY STAR purchaser, and received an incentive]
Likelihood Purchase ENERGY STAR Product Without Financial Incentive
% Households
2010 (n=133)
2009 (n=45)
Very likely 50% 37% Somewhat likely 25% 25% Slightly likely 20% 19% Not at all likely 5% 18%
Total 100% 100%
Note: Q10: “If rebates or reduced-rate financing had not been available, how likely is it that you would have purchased the ENERGY STAR-labeled product?”

22
Loyalty to ENERGY STAR Loyalty to ENERGY STAR is investigated by asking respondents who knowingly purchased an ENERGY STAR-labeled product how likely they would be to recommend ENERGY STAR products to a friend. Respondents were asked to report this likelihood on a scale of 0 to 10, where 0 means “extremely unlikely” and 10 means “extremely likely”. As can be seen in the table below, 29 percent of households who knowingly purchased an ENERGY STAR-labeled product reported they would be “extremely likely” to recommend ENERGY STAR products to a friend. This proportion is similar to the 2009 value. The likelihood of recommending ENERGY STAR products to a friend is greater than “6” for 79 percent of these households. This is consistent with the previous year’s result of 79 percent.
Loyalty to ENERGY STAR [Base = Recognize label (aided) and purchasers]
Likelihood Recommend
ENERGY STAR Products
% Households
2010 (n=577)
2009 (n=202)
10 - Extremely likely 29% 28%9 24% 22%8 16% 15%7 10% 13%6 7% 14%5 8% 2%4 2% 3%3 1% 1%2 1% 1%1 1% 2%0 - Extremely unlikely 2% 0%
Total 100% 100%
Notes: Q11: “How likely are you to recommend ENERGY STAR-labeled products to a friend?”] is measured on an 11-point scale, where 0 =“Extremely unlikely” and 10 =“Extremely likely.”
23
INFORMATION SOURCES
Sources Seen Sixty-nine percent of households have seen something about ENERGY STAR on appliance or electronics labels, and 68 percent of households have seen something about ENERGY STAR in store displays. Forty-eight percent of households heard or saw something about ENERGY STAR on TV commercials. Between 20 and 28 percent of households saw something about ENERGY STAR on or in utility mailings or bill inserts, EnergyGuide labels, or in newspaper or magazine advertisements. Significantly more households in 2010 than in 2009 saw something about ENERGY STAR in direct mail or circular advertisements (13 percent compared to 8 percent). The proportion informed by their lender rose from less than one percent (0.002) in 2009 to one percent in 2010. All other responses were statistically similar to the proportions from the 2009 survey.

24
Sources Saw or Heard Something About ENERGY STAR [Base = Recognize label (aided), n = 1,219]
Note: SO1: “Where did you see or hear something about ENERGY STAR? Please mark all that apply.” ** 2010 and 2009 proportions are statistically different from each other at the 5-percent level of significance (p-
value0.05). Proportion of households in 2010 is larger than in 2009 for Direct mail or circular advertisement and Lender.
* 2010 and 2009 proportions are statistically different from each other at the 10-percent level of significance (p-value0.10). Proportion of households in 2010 is larger than in 2009 for labels on appliances or electronic equipment.
Sources Seen by Publicity Category
For several information sources, the proportion of households that heard or saw something about ENERGY STAR was significantly larger in high- than in non-high-publicity areas. This was the case for TV commercials, utility mailings and bill inserts, newspaper or magazine advertisements, radio commercials, and TV news feature stories. Other sources of information are not significantly different between high- and non-high-publicity areas.
<1%2%2%4%6%7%7%8%8%
13%14%14%15%
21%25%28%
48%68%69%
0% 20% 40% 60% 80% 100%
**Lender
Other
Realtor
Contractor
Billboard
Friend, neighbor, relative, or co-worker
Homebuilder
TV news feature story
Radio commercial
**Direct mail or circular advertisement
Newspaper or magazine article
Salesperson
Internet
Yellow EnergyGuide label
Newspaper or magazine advertisement
Utility mailing or bill insert
TV commercial
Displays in stores
*Labels on appliances or electronic equipment

25
Sources Saw or Heard Something About ENERGY STAR by Publicity Category [Base = Recognize label (aided), n = 1,219]
*** High- and non-high-publicity area proportions are statistically different from each other at the 1-percent level
of significance (p-value≤0.01). Proportion of households in high-publicity areas are higher than in non-high.
** High- and non-high-publicity area proportions are statistically different from each other at the 5-percent level of significance (p-value≤0.05). Proportion of households in high-publicity areas are higher than in non-high.
* High- and non-high-publicity area proportions are statistically different from each other at the 10-percent level of significance (p-value≤0.10). Proportion of households in high-publicity areas are higher than in non-high.
<1%
1%
3%
4%
6%
7%
8%
6%
5%
11%
13%
12%
14%
21%
21%
21%
42%
66%
68%
1%
2%
2%
3%
6%
6%
7%
9%
11%
14%
15%
16%
16%
21%
29%
34%
54%
70%
70%
0% 20% 40% 60% 80% 100%
Lender
Other
Realtor
Contractor
Billboard
Friend, neighbor, relative, or co-worker
Homebuilder
*TV news feature story
***Radio commercial
Direct mail or circular advertisement
Salesperson
Newspaper or magazine article
Internet
Yellow EnergyGuide label
**Newspaper or magazine advertisement
***Utility mailing or bill insert
***TV commercial
Displays in stores
Labels on appliances or electronic equipment
High PublicityNon-High Publicity

A-1
APPENDIX A: DETAILED METHODOLOGY
During September 2010, the Consortium for Energy Efficiency (CEE) fielded a questionnaire to obtain information at the national level on consumer awareness and understanding of the ENERGY STAR label, the value accrued to the label in the eyes of consumers, satisfaction with labeled products, and other ENERGY STAR-related information. The questionnaire was similar to the Internet/WebTV-based questionnaires fielded in previous years (2001 through 2009). As in the 10 previous years, CEE and its members sponsoring the survey made the survey data available to EPA for analysis. In 2001, a rigorous comparative analysis of the results obtained via a mail survey versus an internet survey was conducted. The results from the two survey methods were comparable for most major indicators.9 Results from that time-frame were also analogous to telephone surveys for aided recognition.10 This report discusses the results of the 2010 CEE ENERGY STAR Household Survey, building on prior years’ survey results and focusing on the extent to which consumers recognized the ENERGY STAR label, understood its intended messages, and utilized (or were influenced by) the label in their energy-related purchase decisions. Research questions of interest included: Where do consumers see or hear about the ENERGY STAR label?
How does increased publicity impact consumer ENERGY STAR label recognition, understanding, and influence?
Which key messages about the ENERGY STAR label are consumers retaining?
Do consumers demonstrate loyalty to the ENERGY STAR label? The survey was fielded from September 16 through September 30, 2010. The remainder of Appendix A discusses the questionnaire design, sampling and weighting methodologies, data collection, and the national analysis. See Appendix D for survey questions.
1 QUESTIONNAIRE DESIGN
In 2010, CEE conducted the ENERGY STAR survey using a questionnaire designed to be delivered by Internet/WebTV. The survey was conducted via an interactive internet format with a random sample of households that are members of an internet-based panel. Both the panel as a whole and the sample of households completing the survey were selected by address-based sampling and recruited by 9 National Analysis of CEE 2001 ENERGY STAR Household Surveys. U.S. EPA, 2002. 10 Tannenbaum, Bobbi and Shel Feldman. “ENERGY STAR Awareness as a Function of Survey Method.” IEPEC, 2001.

A-2
telephone.11 Participants in this survey were then randomly selected from the panel. Only one member per household in the random sample was contacted. Households selected for previous years’ surveys were not eligible to participate in the 2010 survey. The panel is designed to be representative of the U.S. population. Panel members without their own internet access are provided with a laptop and an Internet service connection. Households that already have Internet service receive other incentives to participate in the panel. Panel members respond to questionnaires administered to them via the internet. They receive no more than three to four short questionnaires each month, and are expected to respond to a certain percentage of them. Data collected using the 2010 internet questionnaire may in most cases be compared with data collected using the internet questionnaires fielded in previous years, for which CEE was also responsible. 1.1 Survey Objectives CEE had several broad objectives in designing the 2010 questionnaire, including: To maintain consistency with the CEE 2000 and 2001 mail questionnaires and
the internet questionnaires fielded in 2001 and subsequent years
To fine-tune the questionnaire based on lessons learned from prior years’ analyses of the CEE survey while maintaining the ability to analyze the results of the 2010 survey against those from the 2009 CEE survey
The 2010 internet questionnaire addressed the following:
Respondent recognition and understanding of the ENERGY STAR label
Key messages communicated by the ENERGY STAR label
Products on which respondents have seen the ENERGY STAR label
Products that respondents have shopped for or purchased in the past year
Products that respondents have purchased that displayed the ENERGY STAR label on the product, packaging, or instructions
Influence of the presence or absence of the ENERGY STAR label on the purchase decision
11 In previous years, the panel was recruited via random-digit dial. Knowledge Networks believes that ABS offers advantages, including coverage of cell-phone-only households, and analysis of non-response bias. More information is available at http://www.knowledgenetworks.com/accuracy/fall-winter2010/abs-fall2010.html.

A-3
Whether purchases of ENERGY STAR-labeled products involved rebates or reduced-rate financing
Likelihood of having purchased ENERGY STAR-labeled products in the absence of rebates or reduced-rate financing
Likelihood of recommending ENERGY STAR-labeled products to a friend and other measures of loyalty to the ENERGY STAR label
Satisfaction with ENERGY STAR-labeled products versus products without the ENERGY STAR label
Demographic questions (most of the demographic questions were not asked in the internet survey as the demographic characteristics of the respondents were already on file)
Recognition and understanding of the yellow EnergyGuide labels 1.2 Internet Questionnaire The interactive format of an internet questionnaire allows questions to be asked in a way that is not possible with a printed questionnaire. On printed questionnaires respondents can see questions in advance and may be tempted to read the entire questionnaire before completing it, potentially educating themselves in a limited way about the subject and affecting their responses. The internet questionnaires (after questions about the yellow EnergyGuide label) ask respondents—without showing the ENERGY STAR label—whether they have ever seen or heard of the ENERGY STAR label. Responses to this question should thus be comparable to those obtained through a telephone survey. The internet questionnaires then show the ENERGY STAR label(s) (which is not possible with a telephone survey) and ask again about recognition and understanding. As a result, responses to these questions should be comparable to those obtained through a mail survey where respondents are shown the label. Another difference between a mail questionnaire and an internet questionnaire is that the latter—like a telephone questionnaire using computer-assisted telephone interviewing (CATI)—can program lines of questions based on responses to earlier questions. For example, respondents to an internet questionnaire who say they have bought a given product in the past year can then be asked whether that specific product (or its packaging or instructions) had the ENERGY STAR label. Thus, the internet survey is able to combine some of the attributes of both print and telephone surveys.

A-4
1.3 Changes to the Questionnaire The 2010 questionnaire was very similar to the 2009 questionnaire. Respondents were asked about the same list of products as in the 2009 survey. The product lists are used for the following survey questions: Q5(b): Please select each of the products, product literature, or packaging on which you have seen the ENERGY STAR label. Q6A: Have you or someone else in your household been shopping in a store in the last 12 months for any of the products listed below? Q7A: On which products did you see the ENERGY STAR label? Q8: How much did the ENERGY STAR label influence your purchase decision? Q12(b): Which of these products have you purchased in the last 12 months? QC: In general, how satisfied are you with each of the following products you purchased? The logic of one of those questions, Q6A, changed slightly in 2010. Prior to this year, the question asked for a single yes or no response if anyone in the household had been shopping for any of the list of 26 products. In 2010, nine items on that list were asked about individually, as Q6A1_1 through Q6A1_9; the remainder of the list are asked about in a new question, Q6A2 which, as in previous years, records one answer for all 17. Q6A2: Have you or someone else in your household been shopping in a store in the last 12 months for any of the products listed below? For every product mentioned in Q6A1_1-Q6A1_9, a follow-up Q6B1_1-Q6B1_9 is asked: Q6B1: When you shopped for _____, did you look for the ENERGY STAR label? Question Q16 asks how strongly respondents agree or disagree with a list of statements about ENERGY STAR. In 2010, three new statements were added to the list. Q16q. ENERGY STAR-labeled products are no different from other products. Q16r. In the long run, I don’t believe ENERGY STAR-labeled products save me
money. Q16s. I don’t trust that ENERGY STAR-labeled products save the energy they’re
supposed to.

A-5
1.4 Determination of Aided Recognition In the 2010 analysis, the determination of aided recognition was based on the responses to five questions. This is the same sequence and numbering used in the 2009 survey. Specifically: ES3A: Is this the label you have seen or heard of before? (Respondents were randomly shown either the old or new ENERGY STAR label. This question was asked to respondents who said they had seen or heard of the ENERGY STAR label.) ES3B: Have you seen or heard of this version of the ENERGY STAR label? (In this question, asked after ES3A, respondents were shown the label not shown in the previous question.) ES3C: Please look at the ENERGY STAR label on the left. Have you ever seen or heard of this label? (Respondents were randomly shown either the old or new ENERGY STAR label. This question was asked to respondents who said they had not seen or heard of or didn’t know whether they had seen or heard of ENERGY STAR.) ES3D: Have you seen or heard of this version of the ENERGY STAR label? (In this question, asked after ES3C, respondents were shown the label not shown in the previous question.) ES6: Now that you had the opportunity to see the ENERGY STAR label, do you recall seeing or hearing anything about it before this survey? (This question was asked to respondents who answered “no” or “don’t know” to ES3A and ES3B. It was also asked to all respondents who answered ES3C and ES3D.) Respondents who answered ES3A, ES3B, ES3C, ES3D, or ES6 “yes” were
categorized as recognizing the ENERGY STAR label (aided).
Respondents who did not answer ES3A, ES3B, ES3C, or ES3D “yes” and answered ES6 “no,” were categorized as not recognizing the label (aided).
Respondents who did not answer ES3A, ES3B, ES3C, or ES3D “yes” and answered ES6 “don’t know” or refused to answer ES6 were not included in the analysis of aided recognition. (Their data were set to missing.)

A-6
2 SAMPLING
2.1 Designated Marketing Areas’ Publicity Categories The same publicity classification procedure used in the past 9 years was used in 2010. The original intent of the classification was to be able to assess the effect of local energy efficiency program publicity on awareness. The majority of these local efficiency programs historically have been supported by utility rate-payer funded energy efficiency programming. However, during 2010, as part of the American Recovery and Reinvestment Act (ARRA) of 2009, the U.S. Department of Energy also made funding available to U.S. states and territories to support consumer rebates for ENERGY STAR qualified appliances. A decision was made to retain the same publicity classification procedure to retain the prior years’ publicity classification of the 57 largest DMAs—in essence preserving the historical classification for future study years, which was based on the following criteria: High publicity: Active local ENERGY STAR program recently sponsored by a
utility, state agency, or other organization for 2 or more continuous years. The activities must include sustained promotions and publicity from non-federal sources.
Low publicity: Federal campaign activities only and no significant regional program sponsor activities.
Other: All other DMAs. The key working definitions are: Recent: The 2 years of activity must include the time period during which the
survey was in the field.
Sustained: The 2 years of activity must be continuous.
Significant: In addition to any direct federal publicity efforts, publicity efforts must include a deliberate and multifaceted regional program sponsor investment in ENERGY STAR programming, such as direct marketing efforts or the creation and distribution of promotional material.

A-7
Each of the Top 57 DMAs was classified according to these three criteria, and sampled based on that classification. Non-top-57 DMAs were not classified. Although the sample frame was based on the 2009 publicity classifications, given the significant short-term publicity and funding associated with ARRA, for the purpose of this report, low publicity and other publicity are combined in the analysis and referenced as non-high publicity areas. Another contributing factor to combine these categories in the analysis is that over time, the population of low-publicity DMAs has dropped to about 15 percent, while high-publicity DMAs now account for about half of U.S. television households. 2.2 Sample Design The survey was a national survey. The sampling frame for this national survey included all households in any DMAs that together accounted for about 70 percent of U.S. television households. Prior to 2010, the sample covered only the 57 largest DMAs. In 2010, the national sample added a stratum grouping the remaining 153 DMAs. In addition, CEE members may choose to sponsor more intensive sampling (i.e., an oversample) in selected localities, referred to here as sponsor areas. In 2010, there were four sponsor areas:
Massachusetts New York state (with the exception of Long Island) Denver DMA Minneapolis-St. Paul DMA
The complete frame for the study was all 210 DMAs. However, to facilitate comparisons across years, the national results were based only on data collected from respondents from the 57 largest DMAs. Data collected from respondents not in the 57 largest DMAs, are discussed separately, in Appendix E. Some of the 57 largest DMAs are also included in the four sponsor areas and therefore were oversampled. The data from these respondents (as well as from the other respondents in the 57 largest DMAs) received an appropriate weight in the analysis in order to generate valid national results and facilitate comparison with data from other years. As in previous years’ studies, the DMAs in the sampling frame were classified by publicity category, so the effect of local energy efficiency program publicity on national awareness could be considered. The same publicity classification procedure used in the past 9 years was used this year.12
Each sponsor area is also further stratified by large versus non-large DMA. The CEE members who fund the oversample for a sponsor area determine the total number of sampling points allocated to the sponsor area as a whole. This total number of sampling points is then allocated across sponsor area strata proportional to population.
12 None of the 57 largest DMAs changed publicity category between 2009 and 2010.

A-8
Program publicity has expanded over the past ten years. Originally, high-publicity, low-publicity, and other groups had similar numbers of households, and so the sample was allocated equally among the three groups. In 2010, for the first time, the number of respondents in each stratum was chosen in proportion to that stratum’s share of the U.S. population living in DMAs. As in the past for the national sample, the three publicity categories (the top 57 DMAs) comprise 1,000 respondents. This year, the national sample includes another 430 respondents from the Non-Top-57 DMAs.13 A list of the large DMAs and their publicity category assignments is provided in the table below. A list of the DMAs included in the sponsor area and their publicity category assignments follows. Lastly, the large DMAs and the DMAs in the sponsor areas are shown on a map along with their publicity categories.
13 These are not included in the main body of the paper. Their potential influence on national analysis is discussed in Appendix E.

A-9
Large (Top 57) DMAs14
Rank Designated Market Area (DMA)
TV Households 2009-2010
Number % of US Publicity Category
1 New York 7,493,530 6.524 High 2 Los Angeles 5,659,170 4.927 High 3 Chicago 3,501,010 3.048 High 4 Philadelphia 2,955,190 2.573 Other 5 Dallas-Ft. Worth 2,544,410 2.215 Other 6 San Francisco-Oak-San Jose 2,503,400 2.179 High 7 Boston (Manchester) 2,410,180 2.098 High 8 Atlanta 2,387,520 2.079 High 9 Washington, DC (Hagrstwn) 2,335,040 2.033 High
10 Houston 2,123,460 1.849 Other 11 Detroit 1,890,220 1.646 Other 12 Phoenix (Prescott) 1,873,930 1.631 High 13 Tampa-St. Pete (Sarasota) 1,833,990 1.597 Other 14 Seattle-Tacoma 1,805,810 1.572 High 15 Minneapolis-St. Paul 1,732,050 1.508 High 16 Miami-Ft. Lauderdale 1,539,380 1.340 Other 17 Cleveland-Akron (Canton) 1,538,090 1.339 Other 18 Denver 1,520,750 1.324 Other 19 Orlando-Daytona Bch-Melbrn 1,455,620 1.267 Other 20 Sacramnto-Stkton-Modesto 1,404,580 1.223 High 21 St. Louis 1,249,450 1.088 Other 22 Portland, OR 1,188,770 1.035 High 23 Pittsburgh 1,154,950 1.005 Other 24 Charlotte 1,147,910 0.999 Other 25 Indianapolis 1,119,760 0.975 Other 26 Baltimore 1,107,820 0.964 Other 27 Raleigh-Durham (Fayetvlle) 1,093,170 0.952 Low 28 San Diego 1,073,390 0.934 High 29 Nashville 1,019,010 0.887 Low 30 Hartford & New Haven 1,010,630 0.880 High 31 Kansas City 944,060 0.822 Other 32 Columbus, OH 941,360 0.820 Other 33 Salt Lake City 918,670 0.800 High 34 Cincinnati 904,030 0.787 Low 35 Milwaukee 901,790 0.785 High 36 Greenvll-Spart-Ashevll-And 865,810 0.754 Low 37 San Antonio 830,000 0.723 Low 38 West Palm Beach-Ft. Pierce 776,080 0.676 Low 39 Grand Rapids-Kalmzoo-B.Crk 743,420 0.647 Other 40 Birmingham (Ann, Tusc) 742,140 0.646 Low 41 Harrisburg-Lncstr-Leb-York 740,430 0.645 Other 42 Las Vegas 721,780 0.628 High 43 Norfolk-Portsmth-Newpt Nws 709,880 0.618 Low
14 Publicity categories are the same as 2009.

A-10
Rank Designated Market Area (DMA)
TV Households 2009-2010
Number % of US Publicity Category
44 Albuquerque-Santa Fe 694,040 0.604 Other 45 Oklahoma City 694,030 0.604 Low 46 Greensboro-H.Point-W.Salem 691,380 0.602 Low 47 Jacksonville 679,120 0.591 Low 48 Memphis 678,730 0.591 Low 49 Austin 668,310 0.582 High 50 Louisville 667,660 0.581 High 51 Buffalo 633,930 0.552 High 52 Providence-New Bedford 633,220 0.551 High 53 New Orleans 619,610 0.539 Other 54 Wilkes Barre-Scranton 593,480 0.517 Low 55 Fresno-Visalia 579,180 0.504 High 56 Little Rock-Pine Bluff 564,490 0.491 Low 57 Albany-Schenectady-Troy 554,070 0.482 High
Total 81,362,890 70.833
Sponsor Areas
Sponsor Area Publicity Category
DMA (Large and Small)
Massachusetts High
Large: all Small: all * Springfield-Holyoke (rank 111) Large: partial * Boston (Manchester) (rank 7) * Providence-New Bedford (rank 53) * Albany-Schenectady-Troy (rank 57)
New York(with the exception of Long Island)
High
Large: all Small: all Large: partial * New York (rank 1) * Buffalo (rank 52) * Albany-Schenectady-Troy (rank 57) Small: partial * Syracuse (rank 83) * Rochester (rank (80) * Burlington-Plattsburgh (rank 94) * Binghamton (rank 157) * Utica (rank 170) * Elmira (Corning) (rank 176) * Watertown (rank 177)
Minneapolis-St. Paul High Large: all * Minneapolis-St. Paul (rank 15)
Denver Other Large: all *Denver (rank 16)

A-11
Large (Top 57) DMAs and Sponsor Areas by Publicity Category15
2.3 Weighting Procedures Knowledge Networks, the company that provided the internet survey service, developed the weights used in the analysis. Knowledge Networks first adjusted its panel members for known disproportions due to the panel’s original selection and recruitment design and then proceeded with a post-stratification weighting that accounted for differences between the panel and the U.S. population. The adjustment to this typical sampling weight approach was based on geographic and demographic characteristics known for both the panel and the population (refer to Appendix B). It effectively scales up under-represented population dimensions in the panel and scales down dimensions that are over-represented in the panel. This more closely aligned the panel with the basic demographic characteristics of the U.S. population.
15 There were no large DMAs or sponsor areas in either Alaska or Hawaii.
H
HH
HH
H
H
H L
L
HO
O
O
L HL
L
L
O LO
O
LL O
L LL
L
O
OO
O
OOL
OO
OH
H
H
H “High” publicity categoryL “Low” publicity categoryO “Other” publicity category
CEE sponsor area ranking in Top 57 DMAs
CEE sponsor area not ranking in Top 57 DMAs
O
OH
HH
H
H
H
H
2010
H
O
H
O
HH
H

A-12
After the field data are collected, Knowledge Networks further adjusted the sampling weight to account for survey non-response. The correction for survey non-response is analogous to the adjustment for differences between the panel members and the U.S. population. It was based on geographic and demographic characteristics known for both the sample of panel survey completes and the entire sampling frame for the study. The weighting scaled up under-represented population dimensions and scaled down over-represented dimensions in the sample of survey completes. This more closely aligned the sample of survey completes with the basic demographic characteristics of the entire sampling frame for the study.

A-13
3 DATA COLLECTION
3.1 Survey Fielding Period
The survey began on September 16 and closed on September 30, 2010. 3.2 Response Rate
The overall response rate was 10 percent for the CEE 2010 ENERGY STAR Household Survey. This level of response is typical for Knowledge Networks’ surveys. For an internet survey, the response rate is defined as the product of the return rate, which is survey-specific, and the recruitment rate. The return rate is the ratio of the number of questionnaires completed to the number of panel members asked to complete the questionnaire. For the CEE 2010 ENERGY STAR Household Survey, the return rate was 61 percent. While this number is quite high, it must be adjusted by the recruitment rate, which is the number of households that agreed to participate in the Knowledge Networks panel as a proportion of the number of households asked to participate. The recruitment rate was 16 percent. Thus, the response rate for the CEE 2010 ENERGY STAR Household survey was the product of the survey-specific return rate of 61 percent and the recruitment rate of 16 percent. This product is equivalent to the ratio of the number of questionnaires completed to the number of households that were offered the opportunity to be in the study.
CEE 2010 ENERGY STAR Household Survey Response Rate16
Sendout/requested 2,791
Completed 1,707
Return rate 61%
Recruitment rate 16%
Response rate 10%
16 Only respondents from Top-57 DMAs are included in this table.

A-14
4 NATIONAL ANALYSIS
4.1 DMAs Included To facilitate comparisons across years, the national results were based only on data collected from respondents from the 57 largest DMAs. Data collected from respondents not in the 57 largest DMAs are not included in this analysis. Some of the 57 largest DMAs are also included in the sponsor areas and therefore were oversampled. The data from these respondents, as well as from the other respondents in the 57 largest DMAs, received an appropriate weight in the analysis in order to generate valid national results and comparison with data from other years. In Appendix E key analysis from the report (based on the 57 largest DMAs) is replicated for the Non-Top-57 DMAs and for All DMAs (large and non-large). 4.2 Treatment of “Don’t Know” Responses and Refusals
For most questions, how “don’t know” responses or refusals are handled has a negligible effect on the results. Still, it is necessary to make a decision as to how they should be handled. The results presented in this report for a given question do not include “don’t know” responses or refusal to answer (i.e., the results for a given question were calculated after any “don’t know” responses to that question or refusals to answer that question were set to missing).

B-1
APPENDIX B: DEMOGRAPHICS This appendix presents the relationship between the demographic characteristics found in the weighted survey data and the corresponding characteristics in the study population of all U.S. households. Professional survey and data collection firms make significant efforts to ensure the rigor of their methods and to produce the highest quality results. Each year, Knowledge Networks—the company that maintains the internet-based survey panel used in this analysis—strives to create a panel that is representative of the U.S. population. However, as in any survey effort, those who respond to surveys tend to be different from those who do not. In this case, the panel used for this survey may contain subjects that are receptive to the incentive-for-service tradeoff and introduce associated biases. Weighting used in the analyses of this report is applied to account for differences between the internet-based panel and the U.S. population. If weighting was accomplished perfectly, the distribution of various demographic characteristics in the weighted survey data would be the same as the distribution of those characteristics in national Census data. For most demographic characteristics, the two distributions are quite similar. This suggests the weighted survey results are a reasonable representation of the study population. A summary of the comparisons of demographic characteristics is provided in the table below. Detailed comparisons are provided in tables presented at the end of this appendix.
Summary of Distribution Comparisons
Demographic Characteristic Largest Difference (Absolute Value):
Survey Estimate Less Census %
Number of persons in household One 7.0% Householder/respondent age 65 or older 5.9%
Householder/respondent gender Gender +/- 1.4%
Dwelling type Single-family, attached 3.9%
Own/rent Own/rent +/- 0.2%
Household annual income $15,000-$24,999 3.2%
The largest differences (in absolute value) between the weighted survey data and national Census data, at between six and seven percentage points, are the number of persons in the household, and the proportion of householder/respondent age that are 65 years of age or older. The difference in the number of single-family, attached residences is the next largest, at almost four percentage points, and the difference in proportion of households in the $15,000-$24,999 income category is the next largest at 3.2 percentage points. The combined under-representation of 65 years of age or older households and under-representation of single-person households are not expected to bias the survey results in any particular direction. Differences between the weighted survey data and Census data for other demographic characteristics of the population—own/rent, and gender—are all quite small, at less than two percentage points.

B-2
Household Size Distribution
Number of Persons in Household 2010
Census % Dwelling
Unitsa
Survey Estimate Minus Census
% Dwelling Units
One 27% -7.0%
Two 33% -0.1%
Three 16% 2.5%
Four 14% 1.7%
Five or more 10% 2.8%
Total (%) 100%
Total (1,000s) 111,806
a U.S. Census Bureau, American Housing Survey, 2009, Table 2-9.
Age Distribution
Householder/ Respondent Age 2010
Census %
Householdersa
Survey Estimate
Minus Census %
Householders 18-24b 5% 5.6%
25-34 17% 1.9%
35-44 20% -0.7%
45-54 21% -2.3%
55-64 17% 1.4%
65 or older 21% -5.9%
Total (%) 100%
Total (1,000s) 111,806
a U.S. Census Bureau, American Housing Survey, 2009, Table 2-9.
Gender Distribution
Householder/ Respondent Gender 2009
Census %
Populationa
Survey Estimate Minus Census % Population
Female 51% 1.4%
Male 49% -1.4%
Total (%) 100%
U.S. Census Bureau, 2005-2009 American Community Survey 5-Year Estimates

B-3
Dwelling Type Distribution
Dwelling Type 2010 Census
% Dwelling Unitsa
Survey Estimate Minus
Census % Dwelling
Units Single-family, detached 65% 0.4%
Single-family, attached 5% 3.4%
Bldg. (>=2 units) 23% -2.2%
Mobile home 6% -1.7%
Total (%) 100%
Total (1,000s) 111,806
a U.S. Census Bureau, American Housing Survey, 2009, Table 2-1.
Own/Rent Distribution
Own/Rent 2010
Census %
Householdsa
Survey Estimate
Minus Census% Households
Own 68% 0.2%
Rent 32% -0.2%
Total (%) 100%
Total (1,000s) 111,806
a U.S. Census Bureau, American Housing Survey, 2009, Table 2-1.
Income Distribution
Total Household Annual Income (before taxes) 2010
Census % Householdsa
Survey Estimate Minus Census % Households
Less than $15,000 13% 2.6%
$15,000-$24,999 12% -3.2%
$25,000-$49,999 25% 1.6%
$50,000-$74,999 18% 1.6%
$75,000 and over 32% -2.6%
Total (%) 100%
Total (1,000s) 117,538
a U.S. Census Bureau, CPS Annual Demographic Survey March Supplement in 2010, Table HINC-01 Selected Characteristics of Households, by Total Money Income (2009 data)

C-1
APPENDIX C: ADDITIONAL QUESTIONS FROM 2010 SURVEY
This appendix presents the results of additional ENERGY STAR related questions in the 2010 survey that were added by CEE since 2005; and were not discussed in the main body of the report. Topics included in this appendix include:
ENERGY STAR Designation
ENERGY STAR Product Satisfaction
Consumer Perceptions
Purchasing Decisions
CFL Purchaser Questions
1 ENERGY STAR DESIGNATION
Forty-three percent of households that recognized the ENERGY STAR label (aided) thought that the U.S. government decides if a product deserves the label. This is statistically similar to the 2009 result. Twenty-two percent of households thought the product manufacturers make this decision, up from 17 percent in 2009 (p-value = 0.058). Eighteen percent thought the Underwriters Laboratories make the decision.
Designates ENERGY STAR-Labeled Product (Base = Recognize label (aided), n=856)
Note: QB: “As far as you know, who decides if a product deserves the ENERGY STAR label?”
* 2010 and 2009 proportions are statistically different from each other at the 10-percent level of significance (p-value≤0.10).
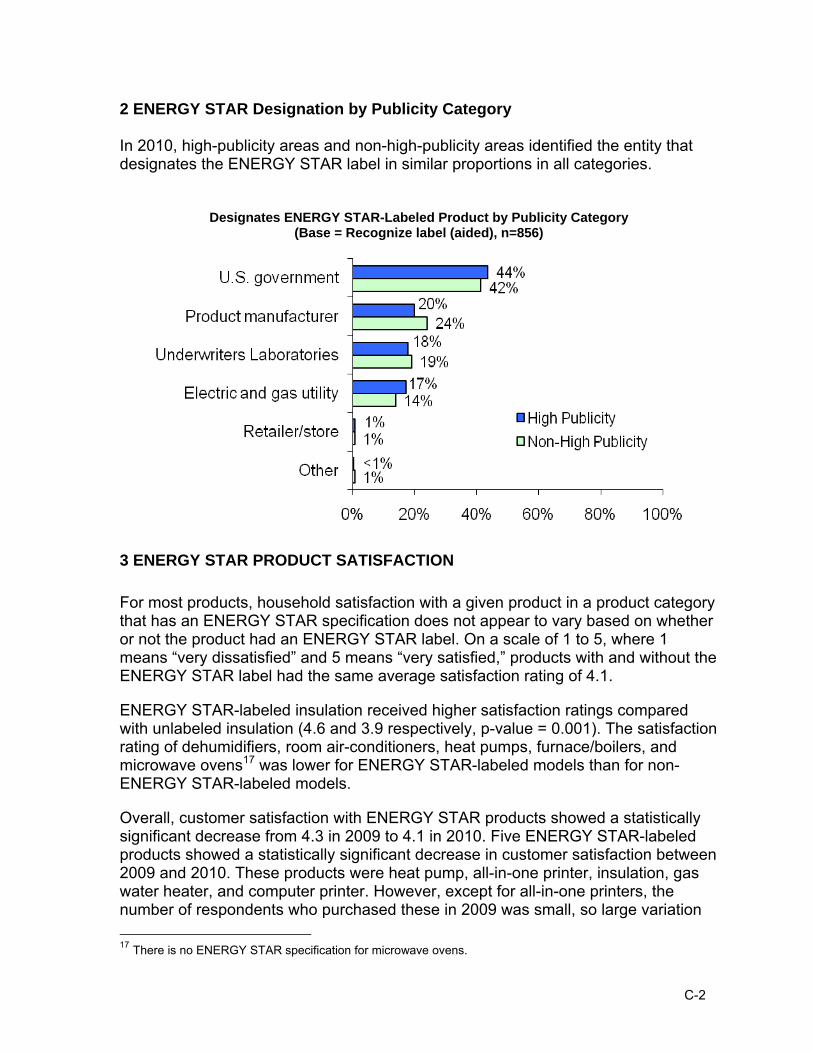
C-2
2 ENERGY STAR Designation by Publicity Category In 2010, high-publicity areas and non-high-publicity areas identified the entity that designates the ENERGY STAR label in similar proportions in all categories.
Designates ENERGY STAR-Labeled Product by Publicity Category (Base = Recognize label (aided), n=856)
3 ENERGY STAR PRODUCT SATISFACTION
For most products, household satisfaction with a given product in a product category that has an ENERGY STAR specification does not appear to vary based on whether or not the product had an ENERGY STAR label. On a scale of 1 to 5, where 1 means “very dissatisfied” and 5 means “very satisfied,” products with and without the ENERGY STAR label had the same average satisfaction rating of 4.1.
ENERGY STAR-labeled insulation received higher satisfaction ratings compared with unlabeled insulation (4.6 and 3.9 respectively, p-value = 0.001). The satisfaction rating of dehumidifiers, room air-conditioners, heat pumps, furnace/boilers, and microwave ovens17 was lower for ENERGY STAR-labeled models than for non-ENERGY STAR-labeled models.
Overall, customer satisfaction with ENERGY STAR products showed a statistically significant decrease from 4.3 in 2009 to 4.1 in 2010. Five ENERGY STAR-labeled products showed a statistically significant decrease in customer satisfaction between 2009 and 2010. These products were heat pump, all-in-one printer, insulation, gas water heater, and computer printer. However, except for all-in-one printers, the number of respondents who purchased these in 2009 was small, so large variation
17 There is no ENERGY STAR specification for microwave ovens.

C-3
in opinion might be expected. No ENERGY STAR-labeled products showed an increase in customer satisfaction over the same period.
ENERGY STAR vs. Non-ENERGY STAR-Labeled Product Satisfaction (Bases = Recognize label (aided) and purchased specified product18)
*** ENERGY STAR and Non-ENERGY STAR product proportions are statistically different from each other at the 1-percent level of significance (p-value0.01).
** ENERGY STAR and Non-ENERGY STAR product proportions are statistically different from each other at the 5-percent level of significance (p-value0.05).
* ENERGY STAR and Non-ENERGY STAR product proportions are statistically different from each other at the 10-percent level of significance (p-value0.10).
18
ne = number of respondents that recognized the label (aided) and purchased this product with an ENERGY STAR label n0 = number of respondents that recognized the label (aided) and purchased this product without an ENERGY STAR label
4.3
3.9
4.5
4.4
3.92.9
4.7
5.03.4
3.6
4.2
4.0
4.1
4.0
4.13.6
3.1
3.4
4.0
3.9
3.9
4.93.7
4.0
3.9
4.2
4.7
4.5
4.1
2.7
3.1
3.3
3.5
3.63.7
3.7
3.93.9
3.9
4.0
4.0
4.0
4.1
4.14.2
4.2
4.2
4.2
4.2
4.3
4.34.4
4.5
4.6
4.6
4.7
4.8
4.1
0 1 2 3 4 5
*Heat pump (ne=8, n0=7)
Computer printer (ne=46, n0=32)
**Dehumidif ier (ne=23, n0=9)
**Microwave oven (ne=68, n0=21)
Dishwasher (ne=94, n0=19)
Washing machine (ne=98, n0=24)
**Room air conditioner (ne=75, n0=25)
Fax Machine (ne=9, n0=1)
All-in-one printer (ne=108, n0=50)
Refrigerator (ne=132, n0=29)
Scanner (ne=10, n0=11)
DVD (ne=96, n0=69)
Door (ne=64, n0=12)
Compact f luorescent light bulb (ne=210, n0=133)
Television (ne=171, n0=98)
Gas water heater (ne=42, n0=11)
Central A/C (ne=23, n0=10)
Copying machine (ne=7, n0=3)
Computer or monitor (ne=159, n0=98)
Skylight (ne=11, n0=4)
Lighting f ixture (ne=102, n0=61)
**Furnace/boiler (ne=19, n0=9)
Window (ne=86, n0=18)
Thermostat (ne=30, n0=19)
***Insulation (ne=42, n0=11)
Roof ing materials (ne=35, n0=19)
Newly built home (ne=13, n0=7)
Audio product (ne=41, n0=31)
Overall (ne=574, n0=400)
Average Satisfaction (1=very dissatisfied, 5=very satisfied)
ENERGY STAR-labeled product Non-ENERGY STAR-labeled product

C-4
4 CONSUMER PERCEPTIONS
Survey respondents that recognized the ENERGY STAR label (aided) were asked to indicate how strongly they agree or disagree with a number of attitudinal statements about ENERGY STAR-labeled products.19 The statements were shown to respondents in random order.
For purposes of discussion, the statements are grouped into three categories:
Environmental and social responsibility messaging
Purchasing preference
Product attributes and performance
The 2010 survey results indicate that households generally agree with positive statements about the ENERGY STAR label and disagree with negative statements about the label.20 Similar to 2009 results, few statements elicit strong agreement or strong disagreement among substantial proportions of households; in contrast, a number of statements generated neutral responses from a sizeable proportion of households. A more detailed discussion of the findings regarding the attitudinal statements is provided on the following pages.
19 These statements are numbered Q16a through Q16s in the survey. 20 In this discussion, the term “agree” is used to correspond to survey responses of “strongly agree” or “somewhat agree.” Similarly, the term “disagree” corresponds to survey responses of “strongly disagree” or “somewhat disagree.”
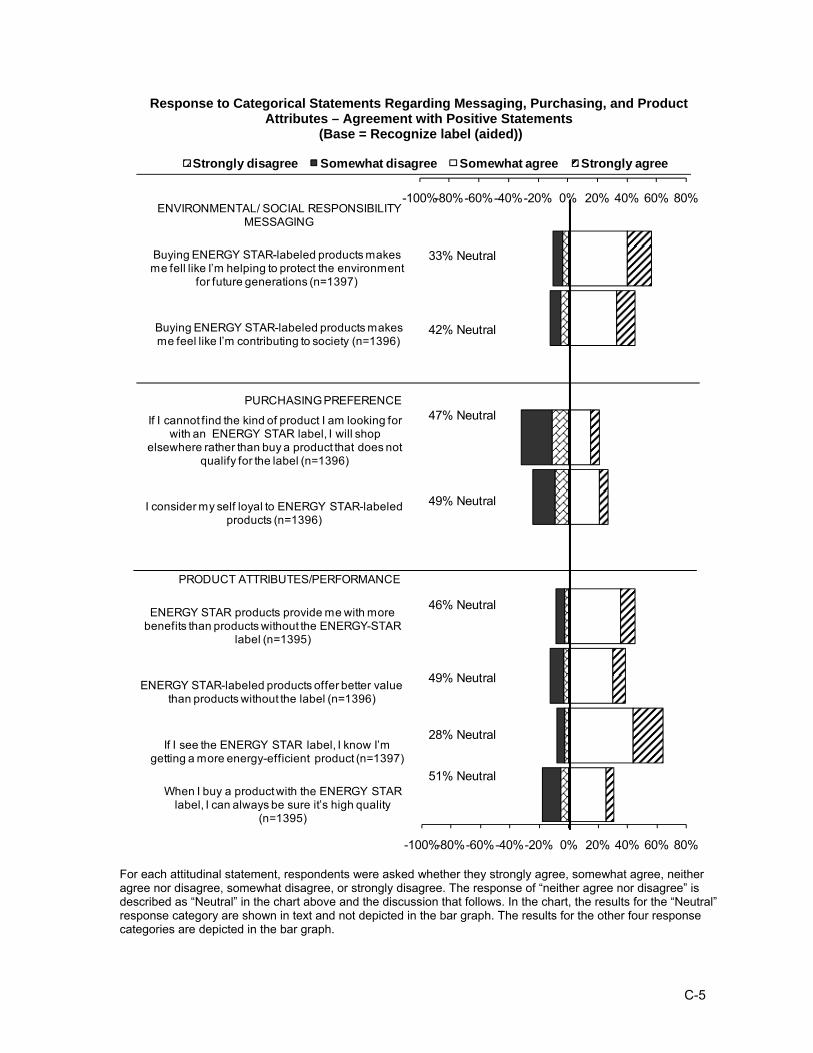
C-5
Response to Categorical Statements Regarding Messaging, Purchasing, and Product Attributes – Agreement with Positive Statements
(Base = Recognize label (aided))
For each attitudinal statement, respondents were asked whether they strongly agree, somewhat agree, neither agree nor disagree, somewhat disagree, or strongly disagree. The response of “neither agree nor disagree” is described as “Neutral” in the chart above and the discussion that follows. In the chart, the results for the “Neutral” response category are shown in text and not depicted in the bar graph. The results for the other four response categories are depicted in the bar graph.
-100%-80%-60%-40%-20% 0% 20% 40% 60% 80%
When I buy a product with the ENERGY STAR label, I can always be sure it’s high quality
(n=1395)
If I see the ENERGY STAR label, I know I’m getting a more energy-efficient product (n=1397)
ENERGY STAR-labeled products offer better value than products without the label (n=1396)
ENERGY STAR products provide me with more benefits than products without the ENERGY-STAR
label (n=1395)
PRODUCT ATTRIBUTES/PERFORMANCE
I consider my self loyal to ENERGY STAR-labeled products (n=1396)
If I cannot find the kind of product I am looking for with an ENERGY STAR label, I will shop
elsewhere rather than buy a product that does not qualify for the label (n=1396)
PURCHASING PREFERENCE
Buying ENERGY STAR-labeled products makes me feel like I’m contributing to society (n=1396)
Buying ENERGY STAR-labeled products makes me fell like I’m helping to protect the environment
for future generations (n=1397)
ENVIRONMENTAL/ SOCIAL RESPONSIBILITY MESSAGING
Strongly disagree Somewhat disagree Somewhat agree Strongly agree
33% Neutral
42% Neutral
47% Neutral
49% Neutral
46% Neutral
49% Neutral
28% Neutral
51% Neutral
-100%-80%-60%-40%-20% 0% 20% 40% 60% 80%
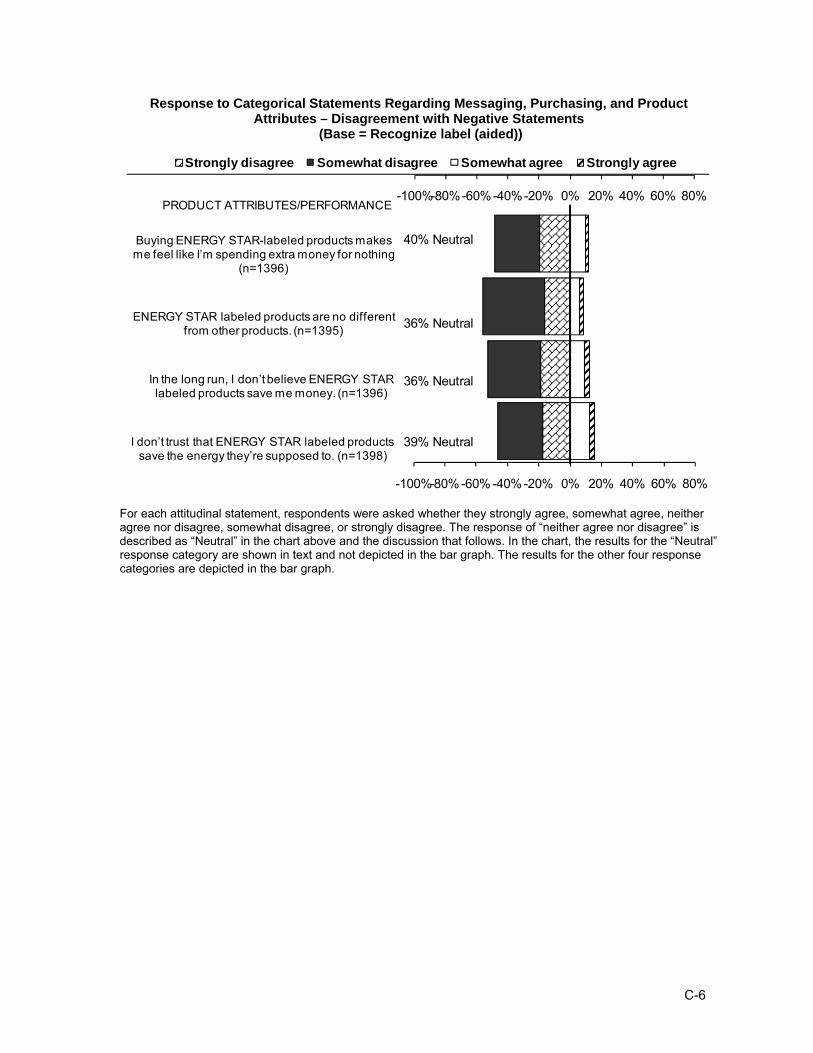
C-6
Response to Categorical Statements Regarding Messaging, Purchasing, and Product Attributes – Disagreement with Negative Statements
(Base = Recognize label (aided))
For each attitudinal statement, respondents were asked whether they strongly agree, somewhat agree, neither agree nor disagree, somewhat disagree, or strongly disagree. The response of “neither agree nor disagree” is described as “Neutral” in the chart above and the discussion that follows. In the chart, the results for the “Neutral” response category are shown in text and not depicted in the bar graph. The results for the other four response categories are depicted in the bar graph.
-100%-80%-60% -40%-20% 0% 20% 40% 60% 80%
I don’t trust that ENERGY STAR labeled products save the energy they’re supposed to. (n=1398)
In the long run, I don’t believe ENERGY STAR labeled products save me money. (n=1396)
ENERGY STAR labeled products are no different from other products. (n=1395)
Buying ENERGY STAR-labeled products makes me feel like I’m spending extra money for nothing
(n=1396)
PRODUCT ATTRIBUTES/PERFORMANCE
Strongly disagree Somewhat disagree Somewhat agree Strongly agree
40% Neutral
36% Neutral
36% Neutral
39% Neutral
-100%-80%-60%-40%-20% 0% 20% 40% 60% 80%

C-7
4.1 Environmental and Social Responsibility Messaging The development of the environmental and social responsibility messaging of the ENERGY STAR label has been a strong focus of the national ENERGY STAR education campaign. In the 2010 survey, two statements addressed the label’s messaging in these areas: “Buying ENERGY STAR-labeled products makes me feel like I’m helping to protect the environment for future generations” and “Buying ENERGY STAR-labeled products makes me feel like I’m contributing to society.” Of the thirteen statements that explore consumer attitudes toward the ENERGY STAR label and products, these two ranked second and third in terms of the proportion of households who strongly agree with the statements. These two statements had the same ranking in the four previous years. The proportion strongly agreeing with each statement decreased slightly, from 22 percent to 16 percent, and from 17 percent to 12 percent, respectively (both p-values < 0.05). Most of the change was picked up by their neutral responses. Of households that recognize the ENERGY STAR label, 56 percent either strongly or somewhat agree with the statement that by buying ENERGY STAR-labeled products they feel they are helping protect the environment, 6 percentage points less than in 2009. Forty-five percent of ENERGY STAR aware households strongly or somewhat agree that by purchasing ENERGY STAR-labeled products they feel they are contributing to society, eight percentage points less than in 2009. Both of these decreases are significant at the 5-percent level, and were reflected in increased neutral values. 4.2 Purchasing Preferences Increasing consumers’ preferences for purchasing ENERGY STAR-labeled products is also an intended outcome of the national education campaign. In the 2010 survey, two separate statements were included to investigate households’ views of their purchasing preferences with respect to ENERGY STAR-labeled products. In 2010, twenty-one percent of households either strongly or somewhat agree with the statement, “If I cannot find the kind of product I am looking for with an ENERGY STAR label, I will shop elsewhere rather than buy a product that does not qualify for the label.” This is the same proportion as in 2009. More households (31 percent) either strongly or somewhat disagree, as in 2009. However, the largest proportion of households—47 percent—are neutral in their level of agreement or disagreement with this statement of their purchasing behavior. Similar to 2009, twenty-seven percent of households agree with the second statement addressing households’ views of their purchasing preferences: “I consider myself loyal to ENERGY STAR products.” Disagreement with this statement was 24 percent, also similar to 2009.

C-8
4.3 Product Attributes and Performance A third goal of the national ENERGY STAR education campaign has been to inform consumers that ENERGY STAR-labeled products are more energy efficient than non-labeled products. The degree to which this goal is being accomplished is addressed in the 2010 survey by asking respondents their level of agreement or disagreement with the statement “If I see the ENERGY STAR label, I know I’m getting a much more energy-efficient product.” Sixty-four percent of respondents either strongly or somewhat agree with this statement. This indicates a high perception among consumers that the ENERGY STAR label indicates superior performance with respect to energy efficiency relative to products without the label.
Additionally, the statement “It seems like most products have the ENERGY STAR label these days” show 48%percent of respondents either somewhat or strongly agree with this statement. Only 11% percent disagreed with the statement. This suggests people are recognizing the label on many products. The survey addressed perceptions of product quality. Survey respondents were asked the level at which they agreed or disagreed with the statement “When I buy a product with the ENERGY STAR label, I can always be sure it’s high quality.” The results show that 31 percent of households either strongly or somewhat agree with this statement—almost twice as many as those who strongly or somewhat disagree—51 percent are neutral. The proportion strongly disagreeing in 2010 rose slightly, from three to five percent (p-value=0.057). Otherwise, household agreement and disagreement with this statement is similar to last year’s results. A number of attitudinal statements were included in the survey to measure consumers’ perceptions of ENERGY STAR-labeled product value. One of these statements is “ENERGY STAR products provide me with more benefits than products without the ENERGY STAR label.” The results show that nearly half of households (46 percent) either strongly or somewhat agree with the statement, while only nine percent of households disagreed. However, on another statement “ENERGY STAR-labeled products offer better value than products without the label.” The proportion that either strongly or somewhat agrees in 2010 was 39 percent, up from 35 percent in 2009; this is mostly due to a six percentage point increase in the proportion that “agree” (p-value = 0.035). A similar proportion disagreed (12 percent in 2010, 10 percent in 2009). Six percent fewer were neutral in 2010 (49 percent) than in 2009 (55 percent, p-value = 0.073). The results related to the statement “Buying ENERGY STAR-labeled products makes me feel like I’m spending extra money for nothing” provide additional information on perceptions of product value. Here, nearly half (48 percent) of all households who recognize the ENERGY STAR label strongly or somewhat disagree with the statement, while 40 percent of households are neutral. Only 12 percent agree with this statement. The proportions of households that agree and disagree with this statement in 2010 are similar to the 2009 results.

C-9
In 2010, the following new statements about product performance were added; all three are negative statements.
The statement, “I don’t trust that ENERGY STAR-labeled products save the energy they’re supposed to” had only 15 percent agreement, and over three times as much disagreement (46 percent).
The statement, “In the long run, I don’t believe ENERGY STAR-labeled products save me money” had only twelve percent agreement, and over four times as much disagreement (52 percent).
Finally, the statement, “I don’t trust that ENERGY STAR-labeled products save the energy they’re supposed to” received only nine percent agreement, and 56 percent disagreement.

C-10
4.4 Consumer Perceptions by Publicity Category The 2010 results also suggest that local and regional efforts to publicize ENERGY STAR have been successful in affecting consumer perception of the label. There are statistically significant differences between high- and non-high-publicity areas for three of the thirteen attitudinal statements. A larger proportion of people in high-publicity areas (51 percent) than non-high-publicity areas (45 percent) disagree with the statement, “Buying ENERGY STAR-labeled products makes me feel like I’m spending extra money for nothing,” (p-value = 0.068). Similar proportions in high-publicity and non-high publicity regions are neutral on the statement. The proportion agreeing with the statement, “Buying ENERGY STAR-labeled products makes me feel like I’m contributing to society” is larger in high-publicity areas than in non-high areas, 49 percent to 41 percent (p-value = 0.041). Six of those eight percentage points are found in the “neutral” category (which falls short of statistical significance, p-value=0.103). Similar proportions in high and non-high areas disagree with the statement (12 and 13 percent). In high-publicity areas, 30 percent of respondents agree with the statement, “I consider myself loyal to ENERGY STAR-labeled products”, compared to 24 percent of respondents in non-high publicity areas (p-value = 0.099). The proportion that is neutral is larger in non-high publicity areas (52 percent) than in high-publicity areas (45 percent, p-value = 0.089). The remaining population disagrees with the statement with similar frequency in both groups. The level of consumers’ agreement, disagreement, and neutrality is similar in high- and non-high-publicity areas for the following statements:
“ENERGY STAR products provide me with more benefits than products without the ENERGY-STAR label.”
“ENERGY STAR-labeled products offer better value than products without the label.” “If I cannot find the kind of product I am looking for with an ENERGY STAR label, I will shop elsewhere rather than buy a product that does not qualify for the label.” “Buying ENERGY STAR-labeled products makes me feel like I’m helping to protect the environment for future generations.”
“It seems like most products have the ENERGY STAR label these days.”
“If I see the ENERGY STAR label, I know I’m getting a more energy-efficient product.”
“When I buy a product with the ENERGY STAR label, I can always be sure it’s high quality.”

C-11
“ENERGY STAR-labeled products are no different from other products.”
“In the long run, I don’t believe ENERGY STAR-labeled products save me money.”
“I don’t trust that ENERGY STAR-labeled products save the energy they’re supposed to.”

C-12
5 PURCHASING DECISIONS
At the end of the survey, respondents were asked to characterize their role in the household purchasing decisions. The results indicate that the vast majority of those represented are primary decision makers, meaning they usually make household purchasing decisions alone or share equally in these decisions. As can be seen below, this varies little across product categories. Seventy-seven percent of individuals were primary decision makers for their household’s home electronics purchases, whereas this was true for 60 percent of purchases of building materials.
Role in Household Purchasing Decisions (Base = All respondents)
67%
74%
73%
77%
60%
15%
14%
13%
14%
17%
19%
13%
14%
9%
23%
0% 20% 40% 60% 80% 100%
Heating & Cooling Products (n=1,658)
Home Office Equipment (n=1,649)
Home Appliances / Lighting (n=1,666)
Home Electronics (n=1,668)
Building Materials (n=1,632)
Usually make decisions or share decisions equally
Give input to decisions
Have no input in decisions

C-13
6 CFL PURCHASER QUESTIONS
Similar to previous years, all respondents are asked what products they have purchased in the last 12 months, with additional questions being asked of those who purchased CFLs and fixtures. Twenty percent and ten percent of households purchased compact fluorescent light bulbs (CFLs) and fixtures, respectively. Respondents that purchased compact fluorescent light bulbs (CFLs) were asked the following questions:
“Did you install the compact fluorescent light bulb(s) you purchased in a light fixture?”
o If yes, then ask “Which type of bulb(s) did you replace?”
An overwhelming majority (96 percent) of CFL purchasers indicated they installed the purchased CFL. This result did not vary significantly by publicity category. Respondents that installed CFLs were then asked if the purchased CFL was used to replace a CFL or an incandescent light bulb. In 2010, 64 percent of households replaced an incandescent light bulb with the purchased CFL compared to 74 percent in 2009. This result is statistically significant at the 10-percent level. However, in 2010, 36 percent of households replaced a CFL with a purchased CFL compared to 26 percent in 2009. This result was statistically significant at the 10-percent level. Similar to last year, the difference between proportions of households in high- and non-high-publicity areas that replaced incandescent bulbs is not significant at the 10-percent level.

C-14
Type of Light Bulb Replaced with a CFL (Base = Installers of Compact Fluorescent Light Bulbs, n=387)
Note: Q12(e) “Which type of bulb(s) did you replace?”
40%
60%
32%
68%
0% 20% 40% 60% 80% 100%
CFL
Incandescent
High PublicityNon-High Publicity

C-15
Consistent with previous years, purchasers that recognize the ENERGY STAR label are asked if they saw the label on the product(s) they purchased. Respondents that reported purchasing an ENERGY STAR-labeled lighting fixture were asked:
“Which kind of ENERGY STAR-labeled lighting fixture did you purchase?”
Fifty-three percent of ENERGY STAR-labeled lighting fixture purchasers report purchasing a compact fluorescent-based lighting fixture. These results do not vary significantly by publicity category.
Type of ENERGY STAR-Labeled Lighting Fixture Purchased (Base = Purchasers of ENERGY STAR Lighting Fixture, n=48)
Note: Q8A 1-4. Which kind of ENERGY STAR-labeled lighting fixture did you purchase? ** 2010 and 2009 proportions are statistically different from each other at the 5-percent level of significance
(p-value0.05). Proportion of households in 2010 is larger than in 2009.
29%
20%
53%
0% 20% 40% 60% 80% 100%
Other type of lighting fixture
**LED-based lighting fixture
Compact fluorescent-based lighting fixture

D-1
APPENDIX D: 2010 SURVEY QUESTIONS AND FLOW CHART* *Questions that are new to the 2010 survey are presented in bold and italic font.

D-2

D-3

D-4

D-5

D-6

D-7

D-8

E-1
APPENDIX E: LARGE AND NON-LARGE DMAS COMPARED 1 PURPOSE OF COMPARISON In 2010, CEE members sponsored the collection of additional households not currently included in the national analysis (i.e., Non-Top-57 DMAs). CEE extended the data collection to the 30 percent of television households not covered by the 57 most populous Nielsen DMAs to provide sample coverage for CEE members outside the Top-57 DMAs. This appendix compares key metrics of awareness for the following three groups:
1. Top-57 DMAs: The 57 most populous DMAs. These DMAs account for 70 percent of U.S. television households. These are the data used for the national report.
2. Non-Top-57 DMAs: The remaining 153 DMAs (ranked 58 through 210) that account for the remaining 30 percent of U.S. television households. These DMAs have historically been excluded from the national analysis. The Non-Top-57 DMAs is comprised of 430 households, plus 76 households from the non-Large DMAs of the sponsored oversamples, in Massachusetts and New York states.
3. All DMAs: The Top-57 and the Non-Top-57 DMAs combined. These 210 DMAs account for the entire population of U.S. television households.
Key metrics covered in this appendix are:
Aided and unaided recognition of the ENERGY STAR label
Understanding of the label message
Influence of the ENERGY STAR label on product purchase choices
Loyalty and recommendation of labeled products
Demographic differences of the Non-Top-57 from the Top-57
Summary of Findings Responses from Top-57 DMAs are statistically similar to responses from All DMAs in the following analysis variables:
Aided and unaided recognition
High and general understanding of the ENERGY STAR label

E-2
Messages of the ENERGY STAR label
The proportion of all households that knowingly purchased an ENERGY STAR product
Influence of label on purchase
Receipt of, and influence of, an incentive for purchase of labeled product
Loyalty to ENERGY STAR
Households in Non-Top-57 DMAs give statistically different responses than households in the Top-57 in the following analysis variables:
General Understanding
Influence of incentive on purchase
Loyalty to ENERGY STAR
The Top-57 and All DMA groups are similarly distributed among demographic variables including income, gender, age, household composition, race/ethnicity, marital status, education, employment, and internet access.
All DMAs are statistically different from Top-57 DMAs in three correlated demographic variables:
Geographic region
Resident lives in a metropolitan statistical area or not
Housing type

E-3
2 RECOGNITION In 2010, 82 percent of households in All DMAs recognized the ENERGY STAR label when shown the label (i.e., aided recognition). The Top-57 and Non-Top-57 were statistically similar, 83 percent and 81 percent recognized the label when shown it, respectively. Seventy-one percent of All DMA households recalled seeing or hearing of the ENERGY STAR label without first being shown the label (i.e., unaided recognition). This was also similar in the Top-57 (72 percent) and Non-Top-57 (69 percent) households.
Recognition of the ENERGY STAR Label [Base = All respondents]
Recognize ENERGY STAR
Label
All DMAs Top 57 DMAs Non-Top-57 DMAs
Aided (n=2,127)
Unaided (n=1,944)
Aided (n=1,641)
Unaided (n=1,521)
Aided (n=486)
Unaided (n=423)
Yes 82% 71% 83% 72% 81% 69%Standard error 1.2% 1.5% 1.3% 1.7% 2.2% 2.9%
Note: The unaided recognition results were based on the question ES1: “Have you ever seen or heard of the ENERGY STAR label?” The aided recognition results were based on five questions. (1) ES3A and (2) ES3B were asked if ES1 = “yes.” ES3A: “Is this the label you have seen or heard of before?”—whether the old or new label was shown was randomly determined. ES3B: “Have you seen or heard of this version of the ENERGY STAR label?” —where the label shown was the one not shown previously. (3) ES3C and (4) ES3D were asked if ES1 = “no.” ES3C: “Please look at the ENERGY STAR label on the left. Have you ever seen or heard of this label?”—whether the old or new label was shown was randomly determined. ES3D: “Have you seen or heard of this version of the ENERGY STAR label?”—where the label shown was the one not shown previously. (5) ES6 was asked if either ES1 = “no” or both ES3A and ES3B = “no.” ES6: “Now that you have had the opportunity to see the ENERGY STAR label, do you recall seeing or hearing anything about it before this survey?”— where both the old and new labels were shown.
3 UNDERSTANDING
In 2010, 83 percent of households in all DMAs had at least a general understanding of the ENERGY STAR label. In Top-57 DMAs this proportion was 84 percent, and in non-top 57 DMAs it was 81 percent. Differences among the three groups are not statistically significant.

E-4
Understanding of the ENERGY STAR Label [Base = All respondents]
At Least General
Understanding of Label
At Least General
Understanding of Label
All DMAs (n=2,213) 83% Top 57 DMAs (n=1,707) 84%Top 57 DMAs (n=1,707) 84% Non-Top 57 DMAs (n=506) 81%
Difference -1% Difference 3%p-value 0.592 p-value 0.240
Note: The level of understanding of the ENERGY STAR label is determined using the open-ended responses to two questions (1) ES2: “What does the ENERGY STAR label mean to you?”, and (2) ES4A1: “Please look at the ENERGY STAR labels on the left. Type the messages that come to mind when you see the ENERGY STAR label.”
The proportion of households that exhibited a high understanding was consistent across Top-57 and Non- Top-57 DMAs (73 and 74 percent respectively). The proportion of households that exhibit only a general understanding of the ENERGY STAR label in Non-Top-57 DMAs is significantly smaller than in Top-57 DMAs (7 and 11 percent respectively, p-value0.05).
Understanding of the ENERGY STAR Label [Base = All respondents]
All DMAs (n=2213)
Top 57 DMAs (n=1707)
Non-Top 57 DMAs (n=506)
High Understanding 73% 73% 74% General Understanding *10% **11% 7% No Understanding 17% 16% 19%
** For “General Understanding”, Top 57 and Non-Top 57 proportions are statistically different from
each other at the 5-percent level of significance (p-value0.05).
* For “General Understanding”, All DMAs and Non-Top 57 proportions are statistically different from each other at the 10-percent level of significance (p-value0.10).

E-5
3.1 Understanding of Label Messaging Open-ended responses to the questions on the level of understanding of the ENERGY STAR label are an indicator of how effectively EPA communicates its messages through the label. These responses are used in the analysis of understanding in the previous section. By far, the most common message associated with the label was “energy efficiency or energy savings,” which is considered high understanding of the label. Sixty-six percent of households in All DMAs surveyed associated the ENERGY STAR label with this message (64 percent in Top-57 DMAs and 68 percent in Non-Top-57 DMAs). The second most common response was “environmental benefit” offered by 13 percent of households, which is also considered high understanding of the label. There are no significant differences between All DMAs and Top-57 DMAs.Top-57 and Non-Top-57 DMAs are quite similar to one another: no difference is bigger than four percentage points. Top-57 DMA respondents are less likely to mention energy with no link to efficiency than their Non-Top-57 DMA counterparts (five versus nine percent, p-value < 0.05), and slightly more likely to say that labeled products save money on the purchase price (both values less than 1 percent, p-value < 0.05).

E-6
Messages of the ENERGY STAR Label [Base = All respondents]
** Top-57 and Non-Top-57 DMA proportions are statistically different from each other at the 5-percent level of
significance (p-value≤0.05).
<1%
1%
1%
1%
1%
1%
2%
5%
5%
4%
5%
8%
7%
13%
68%
<1%
<1%
2%
2%
2%
2%
3%
5%
9%
3%
4%
7%
8%
13%
64%
0% 20% 40% 60% 80% 100%
**Save money on purchase
Product standards no environmental link
Quality
Mentions specific products
Environmental no link to benefit
Government backing
Confuses with EnergyGuide
Electricity
**Energy no link to efficiency
Energy conservation
Savings (not linked to operation)
Energy/environmental product standards
Save money on operation
Environmental benefit
Energy efficiency/savings
Top-57 DMAs
Non-Top-57 DMAs
High Understanding
General Understanding

E-7
3.2 Understanding of the ENERGY STAR Label by Aided Recognition Households that recognized the ENERGY STAR label when shown the label were more likely to have at least a general understanding of the label than those that did not recognize the label. In 2010, 87 percent of households that recognized the ENERGY STAR label had at least a general understanding of it. This result is statistically the same for all DMAs, Top-57 DMAs, and Non-Top 57 DMAs. Among households that did not recognize the label, 71 percent from All DMAs had at least a general understanding of it. Differences between Top-57 and Non-Top-57 DMAs are not statistically significant at the 10-percent level. The difference between respondents that recognized the label when shown, and those that did not, is statistically significant for all three samples (p-value < 0.0001).
Understanding of the ENERGY STAR Label by Aided Recognition [Base = All respondents]
Recognize ENERGY STAR Label Aided
At Least General Understanding of Label
All DMAs Top 57 DMAs
Non-Top 57 DMAs
Yes 87% 87% 86%
No 71% 74% 66%
Difference (Yes minus No) 16% 13% 20%
p-value <0.0001 <0.0001 <0.0001
All DMAs, Top-57, and Non-Top-57 are statistically similar whether or not they recognized the label.
4 INFLUENCE
The survey provided some insight into consumers’ decisions to purchase ENERGY STAR-labeled products, including the following: The proportion of households nationwide that recognized the ENERGY STAR
label and knowingly purchased an ENERGY STAR-labeled product
The influence of the ENERGY STAR label on purchase decisions
The role of rebates or financing in decisions to buy ENERGY STAR-labeled products
The loyalty of purchasers to ENERGY STAR-labeled products

E-8
4.1 Purchases of ENERGY STAR-labeled Products In order to estimate the percent of all households that knowingly purchased an ENERGY STAR product, the following three proportions were multiplied: The proportion of all households that recognized the ENERGY STAR label
(aided)
Of the households that recognized the label (aided), the proportion that purchased a product in a product category that has an ENERGY STAR specification
Of the households that recognized the label (aided) and purchased a product in a relevant category, the proportion that knowingly purchased an ENERGY STAR product
The result is that 41 percent of all households knowingly purchased an ENERGY STAR product in the past twelve months. This result is statistically similar to the results in Top-57 DMAs and in Non-Top-57 DMAs at the 10-percent level.
Purchased ENERGY STAR (Base = All respondents)
Knowingly Purchased
ENERGY STAR product
All DMAs (n=906)
Top 57 (n=733)
Non-Top-57 (n=173)
Estimate 41% 43% 36% Standard Error 2% 2% 4%
All DMAs, Top-57, and Non-Top-57 are statistically similar (p>0.10).
There were no differences in any of the three component proportions between the Top-57 and All DMAs. Respondents in the Top-57 were more likely (67 percent) to have purchased a product than respondents in the Non-Top-57 DMAs (61 percent), but purchasers in either region were equally likely to have bought an ENERGY STAR product.
Purchased ENERGY STAR
Aided
Recognition Purchased
Product
Knowingly Purchased ENERGY
STAR product Top 57 83% 67% 77% Non-Top-57 81% 61% 74%
Difference 2.8% 6.2% 3.3%
p-value 0.276 0.094 0.535

E-9
4.2 Influence of the ENERGY STAR Label In 2010, for 74 percent of households that knowingly purchased an ENERGY STAR- labeled product, the label influenced at least one of their purchase decisions “very much” or “somewhat.” This is not statistically different from the results in Top-57 DMAs or Non-Top-57 DMAs. For eleven percent of households, the label influenced their purchase decisions “slightly.” Fifteen percent of households reported the presence of the ENERGY STAR label had no influence on their purchase. These findings are not significantly different from the results in Top-57 DMAs or Non-Top-57 DMAs.
Influence of the ENERGY STAR Label on Purchase Decisions [Base = Recognize label (aided) and ENERGY STAR purchasers]
Influence of the Label on Purchasing Decisions
All DMAs (n=687)
Maximum
Top 57 DMAs
(n=556) Maximum
Non-Top-57 DMAs (n=131)
Maximum
Very much 48% 47% 46% Somewhat 26% 26% 28% Slightly 11% 11% 13% Not at all 15% 15% 14%
Total 100% 100% 100%
Note: Q8: “For each ENERGY STAR-labeled product you purchased, how much did the ENERGY STAR label influence your purchase decision?”
All DMAs, Top-57, and Non-Top-57 are statistically similar (p>0.10).

E-10
4.3 Rebate and Financing Influence In 2010, the percentage of households that knowingly purchased an ENERGY STAR-labeled product and received rebates or reduced-rate financing was 23 percent. This result is statistically similar in Top-57 and Non-Top-57 DMAs.
Received Financial Incentive for an ENERGY STAR Product Purchased [Base = Recognize label (aided) and ENERGY STAR purchaser]
Received Financial Incentive for an ENERGY STAR Product Purchased
% Households
All DMAs
(n=645)
Top 57 DMAs
(n=521)
Non-Top-57 DMAs
(n=124)
Yes 23% 24% 18%
No 77% 76% 82%
Total 100% 100% 100% Note: Q9: “Did you receive rebates or reduced-rate financing for any ENERGY STAR-labeled product(s) you purchased?”
All DMAs, Top-57, and Non-Top-57 are statistically similar (p>0.10).
Respondents that received rebates or financing were then asked about their likelihood of purchasing an ENERGY STAR product had there been no incentive. Top-57 and Non-Top-57 DMAs were significantly different, though the Top-57 DMAs were statistically similar to the All DMAs group, for all four possible responses. Half of the respondents in the Top-57 said it was “very likely” they would have purchased ENERGY STAR without an incentive, but only 23 percent of respondents in Non-Top-57 agreed. Seventy-one percent of Non-Top-57 respondents replied that the purchase would have been “somewhat likely” compared to only 25 percent of respondents in Top-57 DMAs. Due to small sample sizes, the reader should use caution when interpreting the results for the Non-Top-57.
Influence of Rebates and Financing on Purchasing Decisions [Base = Recognize label (aided), ENERGY STAR purchaser, and received an incentive]
Likelihood Purchase ENERGY STAR Product Without Financial Incentive
% Households
Top 57 DMAs
(n=133)
Non-Top-57 DMAs (n=24)
**Very likely 50% 23% ***Somewhat likely 25% 71% **Slightly likely 19% 6% **Not at all likely 5% 0%
Total 100% 100%
Note: Q10: “If rebates or reduced-rate financing had not been available, how likely is it that you would have purchased the ENERGY STAR-labeled product?”
*** Top 57 and Non-Top 57 proportions are statistically different from each other at the 1-percent level of significance (p-value0.01).
** Top 57 and Non-Top 57 proportions are statistically different from each other at the 5-percent level of significance (p-value0.05).

E-11
4.4 Loyalty to ENERGY STAR Loyalty to ENERGY STAR is investigated by asking respondents who knowingly purchased an ENERGY STAR-labeled product how likely they would be to recommend ENERGY STAR products to a friend. Respondents were asked to report this likelihood on a scale of 0 to 10, where 0 means “extremely unlikely” and 10 means “extremely likely.” As can be seen in the table below, 30 percent of households who knowingly purchased an ENERGY STAR-labeled product reported they would be “extremely likely” to recommend ENERGY STAR products to a friend. This proportion was statistically similar in Top-57 and Non-Top-57 DMAs.
Loyalty to ENERGY STAR [Base = Recognize label (aided) and purchasers]
Likelihood Recommend ENERGY STAR Products
% Households
All DMAs (n=711)
Top 57 DMAs
(n=577)
Non-Top-57 DMAs
(n=530)
10 - Extremely likely 30% 29% 31% 9 24% 24% 24% 8 15% 16% 13% 7 11% 10% 14% 6 8% 7% 9% 5 7% 8% ** 3% 4 1% 2% 1% 3 1% 1% 1% 2 0% 1% 0% 1 1% 1% 1% 0 - Extremely unlikely 2% 2% 2%
Total 100% 100% 100%
Notes: q11: “How likely are you to recommend energy star-labeled products to a friend?”] Is measured on an 11-point scale, where 0 =“extremely unlikely” and 10 =“extremely likely.
**Top 57 and Non-Top 57 proportions are statistically different from each other at the 5-percent level of significance (p-value0.05). Top-57 responses were statistically similar to All DMAs responses in all cases.
5 DEMOGRAPHICS The Top-57 and All DMA groups are similarly distributed among demographic variables including income, gender, age, household composition, race/ethnicity, marital status, education, employment, and internet access. There are differences in the geographic distribution of the Top-57 and All DMA groups. Non-Top-57 areas are more likely to be located in the South and Midwest. Differences are within four percentage points.

E-12
Respondent Geographic Region [Base = All respondents]
All DMAs Top-57 DMAs
**Northeast 18% 22% **South 21% 17% *Midwest 38% 34% *West 23% 26%
** Top 57 and All DMA proportions are statistically different from each other at the 5-percent level of significance (p-value0.05).
* Top 57 and All DMA proportions are statistically different from each other at the 10-percent level of significance (p-value0.10).
Respondents from Top-57 DMAs are more likely to live in metropolitan areas than those from All DMAs. That correlation is not surprising, as both DMA ranking and the census bureau MSA designation are measures of population density, but are not equivalent.
Respondent Residential Location [Base = All respondents]
All DMAs Top-57 DMAs
***Metro 83% 91% ***Non-Metro 17% 9%
***Top 57 and All DMA proportions are statistically different from each other at the 1-percent level of significance (p-value0.01).
The survey also shows that respondents in Top-57 DMAs are more likely to live in apartment buildings (23 percent) than those in All DMAs (19 percent, p-value = 0.028). Conversely, in the country overall, people are slightly more likely to live in single family detached houses (67 percent) than Top-57 DMA residents (64 percent), statistically significant (p-value = 0.088), though the difference is small.
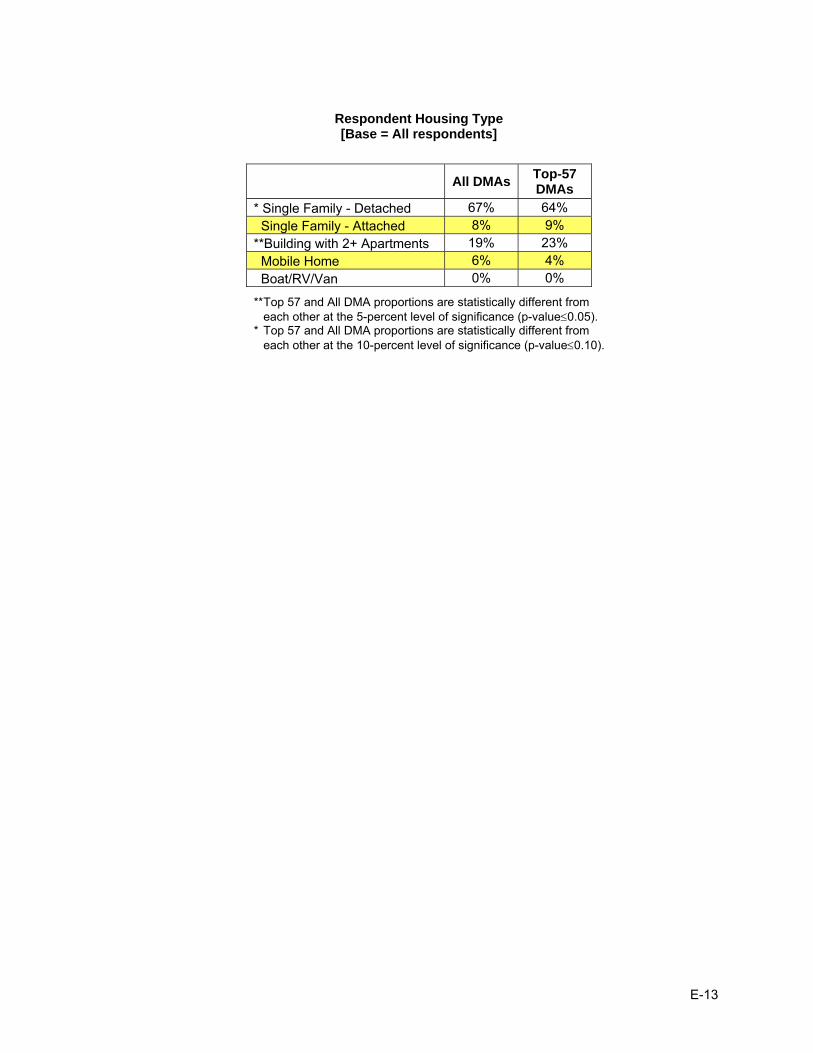
E-13
Respondent Housing Type [Base = All respondents]
All DMAsTop-57 DMAs
* Single Family - Detached 67% 64% Single Family - Attached 8% 9% **Building with 2+ Apartments 19% 23% Mobile Home 6% 4% Boat/RV/Van 0% 0%
** Top 57 and All DMA proportions are statistically different from each other at the 5-percent level of significance (p-value0.05).
* Top 57 and All DMA proportions are statistically different from each other at the 10-percent level of significance (p-value0.10).