DRAFT MASTER PLAN UPDATE – FACILITY REQUIREMENTS
73
Draft Master Plan Update Sacramento International Airport JACOBSEN|DANIELS Date: July, 2020 DRAFT MASTER PLAN UPDATE – FACILITY REQUIREMENTS
Transcript of DRAFT MASTER PLAN UPDATE – FACILITY REQUIREMENTS

Draft Master Plan Update Sacramento International Airport
JACOBSEN|DANIELS
Date: July, 2020
DRAFT MASTER PLAN UPDATE – FACILITY REQUIREMENTS

Draft Master Plan Update Sacramento International Airport
Page Left Blank Intentionally

3-iii Draft Master Plan Update Sacramento International Airport
TABLE OF CONTENTS – FACILITY REQUIREMENTS
3.1 AIRFIELD REQUIREMENTS ............................................................................................................ 3-1 KEY RECOMMENDATIONS FROM 2004 MASTER PLAN ........................................................ 3-1 CRITICAL (DESIGN) AIRCRAFT ............................................................................................. 3-1 DEMAND-CAPACITY ANALYSIS ........................................................................................... 3-6
3.1.3.1 CAPACITY ANALYSIS INPUTS ........................................................................................... 3-6 3.1.3.2 HOURLY CAPACITY ESTIMATES ....................................................................................... 3-9 3.1.3.3 ANNUAL SERVICE VOLUME ........................................................................................... 3-11
RUNWAY LENGTH REQUIREMENTS .................................................................................. 3-12 3.1.4.1 MAXIMUM TAKEOFF WEIGHT ....................................................................................... 3-12 3.1.4.2 DETAILED AIRLINE-SPECIFIC TAKEOFF PERFORMANCE .................................................. 3-14
TAXIWAY AND OPERATIONAL REQUIREMENTS.................................................................. 3-16 SUMMARY OF AIRFIELD REQUIREMENTS ........................................................................... 3-17
3.2 PASSENGER TERMINAL COMPLEX REQUIREMENTS ..................................................................... 3-19 BACKGROUND ................................................................................................................ 3-19 AIRCRAFT GATES AND PARKING ....................................................................................... 3-20
3.2.2.1 GROUND SERVICE EQUIPMENT ................................................................................... 3-22 HOLDROOMS .................................................................................................................. 3-23 AIRLINE CHECK-IN ........................................................................................................... 3-25
3.2.4.1 TERMINAL A CHECK-IN REQUIREMENTS ....................................................................... 3-26 3.2.4.2 TERMINAL B CHECK-IN REQUIREMENTS ....................................................................... 3-27
PASSENGER SECURITY SCREENING .................................................................................. 3-27 AUTOMATED PEOPLE MOVER .......................................................................................... 3-29 CHECKED BAGGAGE INSPECTION SYSTEM ...................................................................... 3-30 PASSENGER BAGGAGE CLAIM ......................................................................................... 3-31 OUTBOUND/INBOUND BAGGAGE SYSTEMS ................................................................... 3-32
3.2.9.1 OUTBOUND BAGGAGE MAKEUP ................................................................................. 3-32 3.2.9.2 INBOUND BAGGAGE HANDLING ................................................................................ 3-33
U.S. CUSTOMS AND BORDER PROTECTION SCREENING ................................................. 3-34 TERMINAL REQUIREMENTS SUMMARY .............................................................................. 3-35
3.3 GROUND TRANSPORTATION AND PARKING REQUIREMENTS .................................................... 3-37 GROUND TRANSPORTATION FORECASTS ........................................................................ 3-37
3.3.1.1 GT GROWTH SCENARIO 1: CURRENT TNC GROWTH .................................................. 3-37

3-iv Draft Master Plan Update Sacramento International Airport
3.3.1.2 GT GROWTH SCENARIO 2: MODERATE TNC GROWTH ............................................... 3-37 3.3.1.3 GT GROWTH SCENARIO 3: HIGH TNC GROWTH ........................................................ 3-37
PUBLIC PARKING FACILITIES ............................................................................................. 3-38 3.3.2.1 PARKING DEMAND AND PARKING REQUIREMENTS ...................................................... 3-39
RENTAL CAR FACILITIES REQUIREMENTS ........................................................................... 3-41 3.3.3.1 CUSTOMER SERVICE BUILDING .................................................................................... 3-41 3.3.3.2 CONRAC GARAGE ....................................................................................................... 3-42 3.3.3.3 QUICK TURNAROUND AREA ........................................................................................ 3-43 3.3.3.4 ADDITIONAL STORAGE/CONRAC EMPLOYEE PARKING ................................................ 3-44
EMPLOYEE PARKING ........................................................................................................ 3-45 ROADWAYS ..................................................................................................................... 3-45
3.3.5.1 ON-AIRPORT ................................................................................................................ 3-45 CURBSIDES ...................................................................................................................... 3-48
3.3.6.1 CURBSIDE REQUIREMENTS METHODOLOGY ............................................................... 3-48 3.3.6.2 DESIGN HOUR VOLUMES AND ASSUMPTIONS ............................................................. 3-49 3.3.6.3 CURBSIDES REQUIREMENTS ......................................................................................... 3-49
3.4 AIR CARGO REQUIREMENTS ..................................................................................................... 3-51 FACILITIES ........................................................................................................................ 3-51 FORECAST DEMAND ........................................................................................................ 3-51 REQUIREMENTS ............................................................................................................... 3-52
3.4.3.1 CARGO BUILDING REQUIREMENTS .............................................................................. 3-52 3.4.3.2 CARGO RAMP REQUIREMENTS ..................................................................................... 3-52
3.5 GENERAL AVIATION REQUIREMENTS ......................................................................................... 3-55 FACILITIES ........................................................................................................................ 3-55 FORECAST DEMAND ........................................................................................................ 3-55 REQUIREMENTS ............................................................................................................... 3-55
3.6 AIRLINE SUPPORT REQUIREMENTS ............................................................................................. 3-57 FUEL STORAGE ................................................................................................................ 3-57 IN-FLIGHT CATERING ....................................................................................................... 3-60
3.7 AIRPORT SUPPORT REQUIREMENTS ........................................................................................... 3-61 AIRPORT ADMINISTRATION .............................................................................................. 3-61 AIRPORT MAINTENANCE .................................................................................................. 3-62 AIRCRAFT RESCUE AND FIREFIGHTING ............................................................................. 3-63
3.8 UTILITIES REQUIREMENTS .......................................................................................................... 3-65 WATER ............................................................................................................................. 3-65 SANITARY SEWER ............................................................................................................. 3-66 STORM DRAINAGE ........................................................................................................... 3-66 ELECTRICAL AND COMMUNICATIONS ............................................................................. 3-67

3-v Draft Master Plan Update Sacramento International Airport
NATURAL GAS .................................................................................................................. 3-67
TABLE OF FIGURES
Figure 3-1 MD-11 AC Characteristics ...................................................................................................... 3-2 Figure 3-2 Runway Operating Configurations ........................................................................................... 3-8 Figure 3-3 Hourly Runway Capacity Vs. Peak Hour Demand .................................................................... 3-11 Figure 3-4 Annual Service Volume Vs. Demand ...................................................................................... 3-12 Figure 3-5 Observed Peak Occupancies at Individual Parking Facilities (2017–2018) ................................ 3-39 Figure 3-6 Estimated Public Parking Needs in Different PALs .................................................................... 3-40 Figure 3-7 Hourly Rental and Return Transactions at SMF ........................................................................ 3-41 Figure 3-8 Highway Capacity Manual Roadway Capacity ........................................................................ 3-46 Figure 3-9 Traffic Generators and Roadway Links ................................................................................... 3-46 Figure 3-10 General Cargo Apron Layout .............................................................................................. 3-53 Figure 3-11 Boeing 767F Dimensions .................................................................................................... 3-54 Figure 3-12 Existing Capacity Compared To 3-, 5-, 7-, And 9-Day Reserves ............................................. 3-60

3-vi Draft Master Plan Update Sacramento International Airport
TABLE OF TABLES
Table 3-1 Runway Design Standards Matrix, C/D/E - IV ............................................................................. 3-4 Table 3-2 Taxiway Design Standards Based on Airplane Design Group (ADG) ............................................ 3-5 Table 3-3 Taxiway Design Standards Based on Taxiway Design Group (TDG) .............................................. 3-5 Table 3-4 Aircraft Classification ............................................................................................................... 3-6 Table 3-5 Aircraft Fleet Mix ..................................................................................................................... 3-7 Table 3- 6 Runway Use ........................................................................................................................... 3-9 Table 3-7 Hourly Runway Capacity ........................................................................................................ 3-10 Table 3-8 Annual Service Volume .......................................................................................................... 3-12 Table 3-9 Runway Length Requirements at MTOW .................................................................................. 3-13 Table 3-10 Runway Length Requirements to Select Destinations ................................................................ 3-15 Table 3-11 Maximum Monthly Temperatures .......................................................................................... 3-16 Table 3-12 Peak Hour Passenger Demand by Terminal ........................................................................... 3-20 Table 3-13 Ratio Method Gate Requirements ......................................................................................... 3-21 Table 3-14 DDFS Method Gate Requirements ........................................................................................ 3-22 Table 3-15 Holdroom Areas Required by Aircraft Type ............................................................................ 3-23 Table 3-16 Existing Holdroom Area Summary ......................................................................................... 3-24 Table 3-17 Holdroom Requirements ...................................................................................................... 3-25 Table 3-18 Airline Check-In Requirements .............................................................................................. 3-27 Table 3-19 SSCP Requirements ............................................................................................................. 3-28 Table 3-20 APM Requirements .............................................................................................................. 3-30 Table 3-21 CBIS Requirements .............................................................................................................. 3-31 Table 3-22 Baggage Claim Requirements .............................................................................................. 3-32 Table 3-23 Outbound/Inbound Baggage System Requirements ................................................................ 3-34 Table 3-24 Ground Transportation Mode Share under Three Different Growth Scenarios ........................... 3-38 Table 3-25 Occupancy at 5th Busiest Day at Different Parking Products .................................................... 3-38 Table 3- 26 Projected Total Public Parking Demand ................................................................................ 3-39 Table 3-27 Estimated Public Parking Facility Needs ................................................................................. 3-40 Table 3-28 Public Parking Deficiencies in Different PALs .......................................................................... 3-41 Table 3-29 Customer Service Area Requirements .................................................................................... 3-42 Table 3-30 ConRAC Garage Requirements ............................................................................................ 3-43 Table 3-31 Facility Requirements of the Quick Turnaround Area .............................................................. 3-44 Table 3-32 Additional Storage and ConRAC Employee Parking Requirements ........................................... 3-45 Table 3-33 Employee Parking Requirements ........................................................................................... 3-45 Table 3-34 Peak-Hour Traffic Generation ............................................................................................... 3-47 Table 3-35 Roadway Capacity Summary ................................................................................................ 3-48 Table 3-36 Curbside Capacity Summary ................................................................................................ 3-50 Table 3-37 Air Cargo Building Requirements (High Growth Scenario) ....................................................... 3-52 Table 3-38 Historical Fuel and Aircraft Operations Data for 2018 by Month ............................................. 3-58 Table 3-39 Projected ADPM Airline Jet Fuel Demand and Gross Storage Requirements .............................. 3-59 Table 3-40 Aircraft Rescue and Fire Fighting Index Classifications ............................................................ 3-63 Table 3-41 Historical and Projected Water Demands .............................................................................. 3-65 Table 3-42 Historical and Projected Wastewater Flows ............................................................................ 3-66

3-1 Draft Master Plan Update Sacramento International Airport
3.1 AIRFIELD REQUIREMENTS This section summarizes the assessment of airfield facility requirements for Sacramento International Airport (SMF or the Airport). The following analyses are completed:
• Evaluate the airfield recommendations from the 2004 Master Plan (adopted in 2007)
• Evaluate the need for new or modified airfield facilities to meet airport design standards
• Recommend the appropriate critical aircraft based upon forecast demand and the Airport’s anticipated role from now through a 20-year planning horizon
• Analyze airfield/airspace demand-capacity for existing conditions versus the forecasts of future aircraft operations using MITRE’s runwaySimulator1 and Federal Aviation Administration (FAA) Advisory Circular (AC) 150/5060-5, Airport Capacity and Delay
• Determine the required runway length for the existing and future fleet mix
It should be noted that the Sacramento County Department of Airports (SCDA or the Department) has initiated the process to update the Airport’s runway headings from 16R/34L and 16L/34R to 17R/35L and 17L/35R, respectively, to accommodate for the continuous shift in magnetic heading. Department staff will remove and replace the existing runway markings as well as submit the required documents to record the updates with the appropriate governing offices in 2020. All associated operational procedures and airport documentation will be updated as well.
KEY RECOMMENDATIONS FROM 2004 MASTER PLAN Key recommendations from the previous master plan are listed below.
• Extend Runway 16L/34R by 2,400 feet to a length of 11,000 feet
• Improve supporting taxiway infrastructure
CRITICAL (DESIGN) AIRCRAFT According to FAA AC 150/5700-17, Critical Aircraft and Regular Use Determination, the critical (design) aircraft is defined as the most demanding aircraft type that uses the airport on a regular basis (defined as 500 annual operations or more). Based on the Traffic Flow Management System Count (TFMSC) data, the McDonnell Douglas MD-11F, operated by Federal Express (FedEx), conducted 745 operations in 2018. These FedEx operations include some operations by DC-10 aircraft (both aircraft are airplane design group IV). The MD-11F, therefore, represents the aircraft with the most demanding characteristics expected to be accommodated at the Airport. Its design characteristics are depicted in Figure 3-1. Based on recent discussions with FedEx, the company does not plan to retire this aircraft in the near future and is expected to continue serving the Airport using the MD-11 through the 20-year planning period. Based on recent discussions with the passenger air carrriers serving SMF, there are no anticipated short-term (5-year) substantive changes to the fleet mix that would result in a change to the critical aircraft.
1 FAA uses the results of an airport capacity tool called the runwaySimulator model, developed by MITRE. The tool is designed to assess an airport's existing capacity, as well as capacity improvements such as new infrastructure or flight procedures. https://www.faa.gov/airports/planning_capacity/runwaysimulator/

3-2 Draft Master Plan Update Sacramento International Airport
Figure 3-1 MD-11 AC Characteristics
Source: MD-11 Airplane Characteristics for Airport Planning, Revision “F”, Issued May 2011

3-3 Draft Master Plan Update Sacramento International Airport
The three main characteristics of the critical aircraft that drive airport design requirements are the aircraft approach category (AAC), airplane design group (ADG), and taxiway design group (TDG).
The AAC categorizes aircraft according to their typical approach speeds and is denoted with letters ranging from “A” to “E,” in order of increasing approach speed. With an approach speed of 153 knots, the MD-11 falls within AAC “D”. The ADG categorizes aircraft according to wingspan and tail height and is denoted with roman numerals ranging from “I” to “VI,” in order of increasing wingspan. With a wingspan of 170.5 feet and a tail height of 58.8 feet, the MD-11 has an ADG of “IV”. Table 3-1 provides the runway design standards for a DIV aircraft.
FAA criteria for taxiway design are defined in terms of ADG and TDG. TDG is based on the dimensions of the undercarriage of the aircraft. The aircraft with the most demanding TDG expected to use the Airport regularly is the MD-11, classified as a TDG 6 aircraft. Table 3-2 provides the taxiway design standards for ADG IV, and Table 3-3 for a TDG 6 aircraft. For definitions of terms or abbreviation, or other details referenced within the tables, refer to the referenced source document.

3-4 Draft Master Plan Update Sacramento International Airport
Table 3-1 Runway Design Standards Matrix, C/D/E - IV
Note: Values in the table are rounded to the nearest foot. 1 foot = 0.305 meters
Source: FAA Advisory Circular 150-5300-13A, Airport Design

3-5 Draft Master Plan Update Sacramento International Airport
Table 3-2 Taxiway Design Standards Based on Airplane Design Group (ADG)
Note: 1 – These values are based on wingtip clearances. If direction reversal between parallel taxiways is needed, use this dimension or the dimension specified in Table 4-14 or Table 4-15 in FAA AC 150-5300-13A, whichever is largest
Source: FAA Advisory Circular 150-5300-13A, Airport Design
Table 3-3 Taxiway Design Standards Based on Taxiway Design Group (TDG)
Source: FAA Advisory Circular 150-5300-13A, Airport Design
3-6 Draft Master Plan Update Sacramento International Airport
DEMAND-CAPACITY ANALYSIS Airfield capacity is typically defined as the maximum number of annual or peak-period aircraft operations that an airfield can accommodate. The FAA refers to this metric as the annual service volume (ASV). If demand approaches capacity, even for periods within the peak hour (busiest operational period on a given day), then costly delays may result. Conversely, for airfield facilities that have excess capacity, airports can realize cost savings by right-sizing those facilities. To evaluate the SMF system’s capacity against forecast demand, airfield capacity was estimated using FAA AC 150/5060-5, Airfield Capacity and Delay, and the FAA’s hourly capacity estimates for SMF that were prepared by MITRE using runwaySimulator.
Calculations for capacity analyzed SMF’s runway-use configurations, the forecast aircraft fleet mix, and historical weather data.
3.1.3.1 Capacity Analysis Inputs The assumptions and inputs used to calculate the airfield capacity include fleet mix, weather conditions, and runway use. Additionally, the model takes into account arrival and departure procedures, aircraft performance, and air traffic separation requirements. The following sections summarize the key model inputs (i.e. fleet mix, weather, and runway use), while subsequent inputs (i.e. aircraft performance and air traffic separation) are based on manufacturing and industry standards.
2.3.1.1 Aircraft Fleet Mix
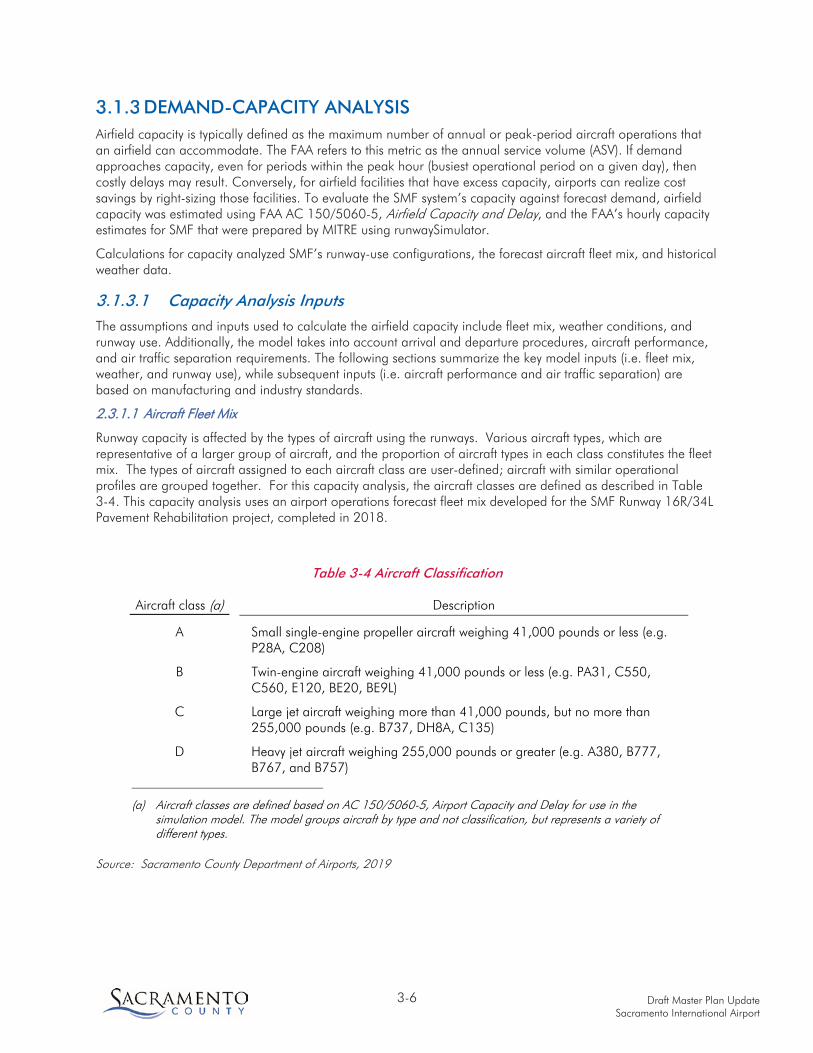
Runway capacity is affected by the types of aircraft using the runways. Various aircraft types, which are representative of a larger group of aircraft, and the proportion of aircraft types in each class constitutes the fleet mix. The types of aircraft assigned to each aircraft class are user-defined; aircraft with similar operational profiles are grouped together. For this capacity analysis, the aircraft classes are defined as described in Table 3-4. This capacity analysis uses an airport operations forecast fleet mix developed for the SMF Runway 16R/34L Pavement Rehabilitation project, completed in 2018.
Table 3-4 Aircraft Classification
Aircraft class (a) Description
A Small single-engine propeller aircraft weighing 41,000 pounds or less (e.g. P28A, C208)
B Twin-engine aircraft weighing 41,000 pounds or less (e.g. PA31, C550, C560, E120, BE20, BE9L)
C Large jet aircraft weighing more than 41,000 pounds, but no more than 255,000 pounds (e.g. B737, DH8A, C135)
D Heavy jet aircraft weighing 255,000 pounds or greater (e.g. A380, B777, B767, and B757)
(a) Aircraft classes are defined based on AC 150/5060-5, Airport Capacity and Delay for use in the simulation model. The model groups aircraft by type and not classification, but represents a variety of different types.
Source: Sacramento County Department of Airports, 2019

3-7 Draft Master Plan Update Sacramento International Airport
Passenger, cargo, general aviation (GA), and military operations were each assigned a category based on their typical operating characteristics at SMF, as follows:
• Passenger: Assumed as Class C and D
• Cargo: Air carrier assumed as Class D
• General Aviation: Itinerant assumed as Class B, local assumed as Class A
• Military: Assumed as Class D and B
The fleet mix data from the forecast fleet mix developed for the SMF Runway 16R/34L Pavement Rehabilitation project is presented in Table 3-5.
Table 3-5 Aircraft Fleet Mix
FAA Aircraft Class Fleet mix distribution Baseline (2016) PAL 4 (2035)
A 7% 6% B 7% 6% C 83% 85% D 3% 3% 100% 100%
Source: Sacramento County Department of Airports, 2019
2.3.1.2 Weather Conditions
Weather conditions – namely cloud ceiling and visibility – play a role in determining the air traffic control (ATC) procedures being used at the Airport, and in turn, affect runway capacity. Cloud ceiling and visibility levels that govern changes in ATC procedures were identified during discussions with FAA air traffic controllers at the SMF airport traffic control tower (ATCT), as follows:
• Visual meteorological conditions (VMC): Cloud ceiling at least 3,500 feet above ground level (AGL) and reported visibility at least five statute miles, under which controllers can conduct visual approaches and apply visual separations.
• Instrument meteorological conditions (IMC): Cloud ceiling less than 3,500 feet AGL or reported visibility less than five statute miles, under which controllers must conduct instrument landing system (ILS) approaches and apply full radar separations.
Weather observations at the Airport were analyzed to estimate the percentages of time that these conditions occur, based on hourly observed weather data from 2009 through 2018 from the National Oceanic and Atmospheric Administration (NOAA). The analysis concluded that the Airport operates under VMC conditions approximately 91% of the time, and under IMC conditions for the remaining 9%.
2.3.1.3 Runway-Use Configurations
Runway use refers to the typical way in which an airfield is operated and is dependent on wind direction, weather conditions, obstructions, and other operational factors such as night-time noise abatement procedures. The FAA has sole discretion and authority over aircraft operations and air traffic control procedures, with safety as the priority. Runway operating configurations were reviewed and confirmed with SMF ATCT staff. The typical runway operating configurations and percent occurrences used in the modeling are summarized in Figure 3-2.

3-8 Draft Master Plan Update Sacramento International Airport
Figure 3-2 Runway Operating Configurations
Source: Analysis of runway use data from the Aircraft Noise and Operations Management System (ANOMS) database for 2013-2018, and hourly weather observations from 2013-2018 from the National Oceanic and Atmospheric Administration (NOAA)
Under VMC, north flow includes independent operation of arrivals and departures on Runways 34L and 34R. South flow consists of independent operation of arrivals and departures on Runways 16R and 16L. Therefore, capacity in VMC is equivalent in both north and south flow.
Under IMC, north flow includes arrivals to and departures from Runway 34L and departures only from Runway 34R. No arrivals are assumed on Runway 34R since it does not have a precision approach. South flow consists
34% 18%
66% 82%

3-9 Draft Master Plan Update Sacramento International Airport
of dependent approaches to Runways 16R and 16L, staggered by 3 nautical miles, and departures on Runways 16R and 16L.
The SCDA utilizes the Aircraft Noise and Operations Management System (ANOMS), to monitor aircraft operations at SMF. ANOMS’ historical database was used to estimate occurrence of the generalized runway use patterns. Data from 2013 through 2018 indicates that north flow occurred approximately 33% of the time, and south flow occurred 67% of the time. The ANOMS data were used to further verify north flow and south flow under VMC and IMC, shown in Table 3-6.
Table 3- 6 Runway Use
Flow Direction
Weather condition North South
All Weather 33% 67%
VMC 34% 66%
IMC 18% 82%
Source: Aircraft Noise and Operations Management System (ANOMS), 2013 through 2018, Sacramento County Department of Airports
2.3.1.4 Aircraft Performance and Aircraft Separation
While fleet mix, weather, and runway configuration account for the majority of capacity calculation components, there are other criteria the analysis takes into account like aircraft performance (i.e. runway occupancy times, and final approach speeds) and aircraft separation. These are based on manufacturer’s specifications, FAA safety requirements, and air traffic control standards and are automatically factored into Mitre’s hourly capacity calculation in runwaySimulator, unless deviations from standard conditions are manually applied. For SMF, the default conditions were applied.
3.1.3.2 Hourly Capacity Estimates Hourly runway capacities were taken directly from MITRE’s runwaySimulator estimates that were prepared for the FAA. The resulting estimates of the hourly runway capacities for the various runway uses and weather conditions at the Airport for baseline and planning activity level (PAL) 4 are summarized in Table 3-7. Capacity was calculated assuming 50% arrivals, meaning that the number of arrivals equals the number of departures, representing a daily average for the Airport. Hourly capacities for a given airfield, flow direction, and weather condition may differ if there are proportionally more arrivals or departures. For example, the hourly capacity may vary if the demand in that hour represents an arrival peak (for example, 70% arrivals) or a departure peak (for example, 70% departures). Weighted hourly capacity was calculated following the methodology outlined in FAA Advisory Circular 150/5060-5, Airport Capacity and Delay.

3-10 Draft Master Plan Update Sacramento International Airport
Table 3-7 Hourly Runway Capacity
Runway use/weather
condition
Hourly Capacity (C) (a)
Runway use/ weather
condition occurrence
(P) (b)
Weighting factor (W)
(c) PxCxW PxW
Baseline (2018)
VMC South 135 62.9% 1 84.9 53.4
VMC North 135 26.3% 1 35.5 9.3
IMC South 94.3 9.2% 15 130.1 11.9
IMC North 68 1.6% 20 21.8 0.34
Baseline (2018) Weighted hourly capacity (Cw) = 104.9
PAL 4 (2038)
VMC South 135 62.9% 1 85 53.4
VMC North 135 26.3% 1 35.6 9.3
IMC South 94.3 9.2% 15 130.1 11.9
IMC North 68 1.6% 20 21.8 0.34
PAL 4 (2038) Weighted hourly capacity (Cw) = 104.9
Sources:
(a) Total hourly capacity at 50 % arrivals calculated using Mitre’s runwaySimulator analysis
(b) Analysis of runway use data from the FAA ASPM database for 2013-2018, and hourly weather observations from the National Oceanic and Atmospheric Administration (NOAA) for 2013-2018
(c) Table 3-1, AC 150/5060-5
The resulting hourly runway capacities and weighted hourly capacity for the baseline and PAL 4 fleet mixes are displayed on Figure 3-3, and compared against peak hour demand in 2018 (34 hourly operations) and 2038 (54 hourly operations). Peak demand used for this analysis is calculated from total operations (including GA and military) as per Section 2 - Forecast.
Estimated hourly runway capacity for all combinations of weather condition and runway use is above the peak hour demand for baseline and PAL 4, suggesting that airfield related delays will be minimal, and additional runway capacity will not be needed during peak hours through the forecast period.

3-11 Draft Master Plan Update Sacramento International Airport
Figure 3-3 Hourly Runway Capacity Vs. Peak Hour Demand
Source: MITRE’s runwaySimulator estimates prepared for the FAA
3.1.3.3 Annual Service Volume ASV is a reasonable estimate of the annual capacity of an airfield configuration. ASV is not a “hard ceiling;” rather, it has been established in practice that as the level of actual annual aircraft operations approaches ASV, there is a disproportionate increase in aircraft delays. ASV takes into account differences in runway utilization, weather conditions, and aircraft fleet mix over a one-year period. ASV is calculated using the following formula:
• ASV = Cw x D x H
Where:
Cw is the weighted average hourly capacity of the runway system
D is the ratio of annual demand to average day peak month (ADPM) demand
H is the ratio of ADPM demand to average peak hour demand
Cw was calculated using the hourly capacities Mitre prepared using runwaySimulator. The remaining ASV parameters (“D” and “H”) were based on the forecast annual, ADPM, and peak hour operations, and are summarized in Table 3-8.
Applying these parameters to the calculated weighted hourly capacity estimates yields an estimate of ASV for 2018 and 2038, summarized in Table 3-8.

3-12 Draft Master Plan Update Sacramento International Airport
Table 3-8 Annual Service Volume
Year Peak Hour Ops Cw D H ASV
Baseline (2018) 34 104.9 352 10.3 386,892
PAL 4 (2038) 54 104.9 352 10.3 382,081
Source: MITRE’s runwaySimulator estimates prepared for the FAA and SMF Peak Hour Forecast
The estimated ASV in comparison to the annual operations for Baseline (2018) and PAL 4 (2038) is shown on Figure 3-4. Generally, planning for airfield capacity improvements should begin when aviation activity is approaching 60% of the ASV and actual development should begin when 80% of the airfield’s capacity is reached. As illustrated, ASV can accommodate the forecast demand (53% of forecast demand by PAL 4), suggesting that additional runway capacity and other capacity-related airfield improvements are not needed within the planning period.
Figure 3-4 Annual Service Volume Vs. Demand
Source: Sacramento County Department of Airports, 2019
RUNWAY LENGTH REQUIREMENTS This section summarizes the evaluation of runway length requirements for the Airport. The takeoff length requirements associated with aircraft types based on the existing and future fleet mix were evaluated using the process outlined in FAA AC 150/55325-4B; specifically, determining runway length requirements for long-haul routes at maximum takeoff weight (MTOW). Aircraft serving long-haul destinations at the Airport do not do so at MTOW; therefore, these requirements were further refined in a more detailed analysis of specific combinations of aircraft types and routes using airline flight planning data.
3.1.4.1 Maximum Takeoff Weight To determine runway length requirements, FAA AC 150/55325-4B states, “long-haul routes should set the operating takeoff weight equal to the MTOW.” Because the Airport serves transcontinental and Hawaiian destinations, which are considered long-haul, the assumption that aircraft operate at MTOW is consistent with the guidance from the AC. The takeoff runway length requirements at MTOW were estimated using requirement
0
50,000
100,000
150,000
200,000
250,000
300,000
350,000
400,000
450,000
2018 2023 2028 2033 2038
Ope
ratio
ns
ASV Total Operations

3-13 Draft Master Plan Update Sacramento International Airport
charts provided in the Airplane Characteristics for Airport Planning manuals published by Airbus SE and the Boeing Company. The following assumptions were incorporated into the runway length estimates:
• Field elevation at sea level, which approximates the Airport elevation of 27 feet Mean Sea Level (MSL)
• Ambient temperature of 94°F, the mean daily maximum temperature historically experienced at the Airport during summer months. However, “high temperature” conditions published in the various manufacturers’ planning manuals reflect an ambient temperature of 86°F, eight degrees lower than the Airport’s. To adjust for this difference, a linear interpolation between airport elevation and standard day temperature was made, resulting in an assumed Airport elevation of 2,250 feet MSL
• Balanced field length, meaning that the takeoff run available (TORA), takeoff distance available (TODA), and accelerate-stop distance (ASDA) would be identical for both runway directions
• Use of the most common engine types for the aircraft type under consideration
• No obstacles that might limit payload
• Zero wind
• Dry runway conditions
Runway length requirements for selected aircraft in the existing and future fleet mixes at MTOW are presented in Table 3-9.
Table 3-9 Runway Length Requirements at MTOW
Aircraft type Engine type MTOW (lbs.) Required runway
length (ft.)
B737-700 CFM56-7B-24 154,500 10,000 A319 IAE V2522-A5 167,300 8,400 A320 IAE V2527-A5 170,600 7,700 B737-800 CFM56-7B-26 174,200 9,100 A321 IAE V2533-A5 205,900 12,000 B767-200F PW 4060 396,000 11,250 MD-11F CF6-80C2D1F 631,000 11,200
Notes: Takeoff length requirements are shown for a temperature of 94°F (mean-maximum temperature of the hottest month in Sacramento) and Airport elevation at sea level (adjusted to reflect temperature). Assumes calm wind, dry runway, and zero runway gradient. Obstacles which may limit payload are not considered within these results.
Source: Analysis of Aircraft Characteristics for Airport Planning, published by the Boeing Company and Airbus SE, JP Airline-Fleets International, 2011, and FAA AC 150/5325-4B, Runway Length Requirements for Airport Design.
Based on a fleet mix analysis conducted in 2016, the Boeing 737-700 has the most operations at SMF, while the B767-200F, MD-11F, and DC-10 are the largest aircraft using the Airport on a regular basis.
On occasion large aircraft will stop for fuel at SMF while awaiting clearance into airports in the San Francisco Bay Area during inclement weather. While some of these aircraft at MTOW may require a runway longer than that existing at SMF, these aircraft are mostly empty of fuel when they land at SMF and plan re-fueling to become airborne with less than the existing 8,605 feet of runway length.

3-14 Draft Master Plan Update Sacramento International Airport
As other aircraft are either integrated into airlines’ fleets, or increase operations at SMF, the runway extension analysis completed in the 2004 Master Plan will be further reviewed and considered to ensure no disruption to the capabilities of aircraft utilization and performance at the Airport. It is anticipated that the Airbus A321 will begin regular service at SMF in the future, resulting in the critical design aircraft for the Airport changing from the current MD-11F to the A321. When this happens, runway lengths and concourse gates will require more detailed analysis to accommodate operations, especially long-haul routes, by this aircraft, as per Table 3-9.
3.1.4.2 Detailed Airline-Specific Takeoff Performance Following completion of the initial MTOW runway length analysis as summarized in the previous section, a detailed analysis of the takeoff performance of select aircraft in the fleet mix was completed to refine the runway length requirements.
For this more detailed analysis, the Airport’s existing route network was examined, and combinations of aircraft types and destinations were selected. Although heavy widebody aircraft typically require the most takeoff runway length, these aircraft types do not operate to destinations that would be considered long-haul from the Airport relative to their maximum ranges. Instead, runway length requirements at SMF are driven by narrow-body aircraft operating to long-haul destinations such as the East Coast and Hawaii. Long-haul service to these destinations accounted for 17.5% of passenger airline departures in 2018, with 14.5% to East Coast destinations and 3% to Hawaii.
While the data published by aircraft manufacturers used in the MTOW analysis are intended for planning purposes, they do not precisely represent specific airline operating procedures or aircraft operating data specific to the Airport. Factors such as engine type, engine thrust settings, flap settings, and winglets all have a potential impact on a given aircraft’s operational characteristics. Additional factors such as en route winds, airway routings, and required fuel reserves also impact the amount of fuel that must be carried; thus, the amount of runway length needed for a specific route.
In the detailed analysis, required runway length was calculated using aircraft takeoff weight computation methodologies and data used by airlines for flight planning purposes. Each aircraft manufacturer’s Airplane Flight Manual was used for the allowable takeoff weight calculations, and the Boeing/Jeppesen flight planning system was used for payload-range calculations.
This analysis takes into consideration the following factors that can affect aircraft takeoff performance:
• Environmental and physical characteristics, including ambient temperature and en route wind conditions
• Standard airline operating procedures, operating weights, and engine types
• Additional allowances and reserves typically incorporated by airlines beyond those established in the aircraft manufacturers’ planning manuals
All of the performance analyses reported in this section reflect the following assumptions regarding environmental and physical conditions:
• Ambient temperature of 94°F
• Airport elevation of 27 feet MSL2
• Dry runway
• Calm wind at takeoff
The following assumptions were made about airline operating procedures:
• Full takeoff thrust
2 A linear interpolation between airport elevation and standard day temperature was made to account for higher ambient temperature resulting in an assumed Airport elevation of 2,250 feet MSL.

3-15 Draft Master Plan Update Sacramento International Airport
• Optimum takeoff flap setting and optimum takeoff speed
• 100% passenger load factor and zero belly cargo
• 168 pounds average passenger weight (average of male and female average weight), including baggage to continental United States destinations; 188 pounds average passenger weight, including baggage to Hawaii
• 85% average annual enroute winds
• Standard U.S. domestic reserve fuel for continental US destinations
• Fuel reserve based on extended operations (ETOPS) critical fuel requirements for Hawaiian destinations
• No takeoff obstacles
Table 3-10 presents the results of the airline-specific analysis.
Table 3-10 Runway Length Requirements to Select Destinations
Aircraft type Airline Destination Required runway
length (ft.)
B737-800 United IAD 7,100 B767-300ER Hawaiian HNL 6,720
Notes: Runway length requirements assume 100% passenger load factor and no belly cargo
Source: Flight Engineering analysis, July 2018
The need for a runway extension was analyzed in the 2004 SMF Master Plan. At the time of the 2004 Master Plan, the most demanding aircraft over the planning period was the B-747-400ER. At maximum gross take-off weight and at standard day and hot day temperatures, a runway length of 11,000 feet was needed for the B-747-400ER to fly non-stop to London or Frankfurt (without the runway extension, these flights would require a fueling stop). The north end of Runway 34R was determined to be the preferred location for an extension relative to airfield configuration as well as runway protection zone requirements. Technological advancements in aircraft performance and other factors have not driven a critical need for a runway extension at SMF, but such an extension is still depicted on the current airport layout plan (ALP) as a runway extension continues to remain an option.
Changing climatic conditions will be an additional driver for longer runway lengths at SMF as ambient temperatures increase and impact aircraft performance. Hotter temperatures mean larger, heavier aircraft, traveling farther, will need more runway length for takeoff. Table 3-11 shows the average monthly temperatures, as recorded at KSAC (the nearest weather station) from 2010 to 2019. The red blocks indicate temperatures higher than in year 2010. It is expected that the trend of warming temperatures will continue.

3-16 Draft Master Plan Update Sacramento International Airport
Table 3-11 Maximum Monthly Temperatures
Source: NOAA - NWS Sacramento
TAXIWAY AND OPERATIONAL REQUIREMENTS Discussions with SCDA operations staff and FAA SMF ATCT staff revealed areas on the airfield that contribute to airfield congestion or are operationally deficient. Although existing taxiway capacity is adequate to meet forecast demand, the following taxiway improvements would enhance the operational efficiency of the airfield system and are recommended:
• The runway exits on Runway 16R/34L are not optimally located, increasing arrival runway occupancy times. For Runway 16R arrivals, Taxiway A10 is located approximately 4,000 feet from the runway threshold, too close for most aircraft types to slow down and exit the runway. For Runway 34L arrivals, there are no high-speed runway exits and aircraft must slow before making a 90-degree turn to exit the runway. Additional high-speed runway exits for Runway 16R/34L would reduce arrival runway occupancy time. Improvements to Taxiway A are recommended.
• Improvements to taxiway fillets to accommodate the MD-11 under design requirements recommended in the recently revised FAA AC 150/5300-13A, Airport Design, are recommended and will be constructed as part of the Taxiway A reconstruction.
• Hold pads are used to sequence the departure queue or to allow aircraft not ready for departure, because of mechanical problems, weather, or other reasons, to stay clear of the departure queue without taxiing onto the runway. Providing bypass capability on the ends of Runways 16L, 34L, and 34R would improve operational flexibility.
• Currently, Taxiways G1 and G2 are limited in the gross aircraft load the pavement can accommodate, however they frequently accommodate aircraft up to the size of private charters using the Boeing 757. Taxiways G1 and G2 are planned to be consolidated into one taxiway that has the pavement strength and design criteria to accommodate TDG 5 aircraft.
• Taxiway P is planned to be relocated and will continue to serve TDG 3 aircraft to the GA and FAA facilities.
• Taxiway Y4 is limited to aircraft with a wingspan of less than 118 feet (ADG III) because of its proximity to Concourse B. Larger aircraft are not anticipated to use this taxiway due to its location.
KSACYear Jan Feb Mar Apr May Jun Jul Aug Sep Oct Nov Dec Annual2010 54.2 60.2 64.9 66.3 75.2 87.7 91 88.3 88.7 76.3 63.9 56.3 72.752011 53.8 59.5 61.8 69.8 74 83.4 90.2 91.3 91.2 77.7 61.4 58.7 72.732012 60.5 62.6 62.5 71.7 82.2 86.7 91.4 93.5 90.4 76.9 65.7 55.1 74.932013 55.8 62.3 69.4 77.9 82.6 89.2 93.1 90.5 85.2 78.2 68.3 59.1 75.972014 65.7 63.3 69.6 75.1 84 90.1 92.7 89.7 89.1 82.4 66.7 59.8 77.352015 59.9 66.6 74.9 75.9 77.4 92.7 92.3 92.3 89.5 84.3 62.6 55.9 77.032016 57.4 67.6 66.8 75.5 81.8 90.8 92.4 90.5 87.4 74.2 64.8 54.7 75.332017 53.9 59.6 67.5 69.7 81.7 90.1 95.8 92.9 88 79.9 63.5 59.9 75.212018 57.6 63.6 64.2 71.2 78.5 89.4 95 89.1 87.5 80.3 67 57.7 75.092019 58.8 55.1 63.6 73.9 74.8 89.3 91.8 93.7 86.9 79.5 69.5 57.9 74.57
% change 2010 - 2019 8% -8% -2% 11% -1% 2% 1% 6% -2% 4% 9% 3% 2%
Mean 57.76 62.04 66.52 72.7 79.22 88.94 92.57 91.18 88.39 78.97 65.34 57.51 75.10Max 65.7 67.6 74.9 77.9 84 92.7 95.8 93.7 91.2 84.3 69.5 59.9Min 53.8 55.1 61.8 66.3 74 83.4 90.2 88.3 85.2 74.2 61.4 54.7
MAXIMUM MONTHLY TEMPERATURES

3-17 Draft Master Plan Update Sacramento International Airport
• The shoulder widths of Taxiways D and Y east of Taxiway Y2 lack the 30 feet required for TDG 5 aircraft and the 30 feet required for TDG 6 aircraft.
SUMMARY OF AIRFIELD REQUIREMENTS The results of the airfield requirements analysis indicate that there will be sufficient runway capacity to accommodate the forecast demand through PAL 4. Runway capacity will exceed forecast demand through the planning period, even under poor weather conditions, suggesting that no additional runway capacity is needed. The demand and phasing for the runway extension, currently shown on the ALP, will be analyzed in greater detail when the A321 (or similar aircraft) becomes the critical aircraft, when more long-haul routes are introduced at SMF, or when climatic conditions create enough of an impediment to aircraft performance. The localized taxiway improvements for operational benefits discussed in Section 3.1.5 are also recommended.

3-18 Draft Master Plan Update Sacramento International Airport
Page Left Blank Intentionally

3-19
3.2 PASSENGER TERMINAL COMPLEX REQUIREMENTS The requirements for various functional elements of the passenger terminal complex are based on projected passenger demand for the following areas of the terminal complex:
• Terminal Landside: functional areas of the terminal that are non-secure and accessible to the public, such as ticketing and baggage claim lobbies
• Terminal Airside: functional areas of the terminal that are secure and accessible to passengers who have been screened at a Security Screening Checkpoint (SSCP) or authorized personnel carrying the appropriate credentials
BACKGROUND The passenger terminal complex at the Airport consists of two terminals and associated concourses: Terminal A and Concourse A, and Terminal B and Concourse B. The terminals are indirectly connected via inter-terminal bus routes, a parking garage, and a network of pedestrian paths, but do not share any operational connections, such as the automated people mover (APM) or inter-terminal baggage facilities, and operate as two independent facilities.
Terminal A was most recently renovated from 2017-2019. The renovation consisted of the installation of new, common use check-in and ticketing facilities, expanded security checkpoint queueing, an additional security checkpoint lane, automated secured area exit lanes, and a passenger lounge in Terminal A. In Concourse A, new common use boarding gate counters, a new elevator in the north wing, new carpet, flooring, lighting, and paint in the hold rooms, and the addition of a baggage sortation pier to allow multiple airlines to use the existing in-line baggage screening system were added. Concourse A provides 12 contact gates and facilities on two levels. A 13th contact gate is scheduled for airline use in the near future.
Terminal B is a two-building facility consisting of a landside processor building that houses ticketing, check-in, inbound and outbound baggage functions, public offices, concessions, and Central Utility Plant functions. The Concourse B building accommodates aircraft gates, holdrooms, additional concessions, a Transportation Security Administration (TSA) SSCP, and U.S. Customs and Border Protection (CBP) screening facilities. A passenger lounge was recently added to the Concourse B concession area. The two buildings are connected by an APM system that shuttles passengers back and forth at regular intervals.
The original Terminal B was demolished and the site was repurposed to provide a landscaped buffer zone on the landside and apron paving for aircraft parking on the airside. The original terminal roadway was left in place. Facility requirements have been identified for the following key functional elements:
• Aircraft gates and parking
• Holdrooms
• Airline check-in
• Passenger security screening
• Checked Baggage Inspection System (CBIS)
• APM
• Domestic baggage claim
• Outbound/inbound baggage systems
• CBP facilities

3-20
Facility requirements for each of the functional elements in the passenger terminal were derived using the passenger forecast demand, and specifically the peak hour passenger forecast for PAL 1, PAL 2, PAL 3, and PAL 4 as presented in Section 2 - Forecasts. The terminal modeling program from Airport Cooperative Research Program (ACRP) Report 25, Airport Passenger Terminal Planning and Design, Volume 2 (ACRP Model) was also used for this analysis. Peak passenger flows in each terminal, based on the design day flight schedule (DDFS), determined the quantity required for each terminal element to provide adequate processing capacity.
Level of Service (LOS) “C” is used for the purpose of this analysis. ACRP Report 25 defines LOS, in the context of airport terminal planning, “as either qualitatively or quantitatively, the service provided to airport travelers at various points within the airport terminal building. It often relates to the degree of congestion or crowding experienced by travelers at the passenger and baggage processing facilities in the terminal building.” A LOS “C” standard means “good”; a condition of stable flow that provides acceptable throughput, and where the related systems are in balance.
The peak month for SMF is June, where on average, 7.4% of the total annual enplaned passengers will depart SMF (446,000 total departing passengers). The baseline for this analysis follows the forecast, which utilizes 2018 data. Existing conditions are considered to be year 2019.
For Terminal A, the design hour of the ADPM is between 6:00 AM and 7:00 AM when the number of departing passengers is approximately 5% of the daily departures (14,800 total departing passengers) in the base year.
• 707 passengers depart Terminal A in the peak hour (base year).
For Terminal B, the design hour of the ADPM is between 8:00 PM and 9:00 PM when the number of departing passengers is approximately 8% of the daily departures (14,800 total departing passengers) in the base year.
• 1,185 passengers depart Terminal B in the peak hour (base year).
Table 3-12 Peak Hour Passenger Demand by Terminal
Base (2018) PAL1 PAL2 PAL3 PAL4 Total Annual Enplanements (Millions) 6.03 7.36 8.20 9.15 10.17 Peak Hourly Departing Passengers (Terminal A) 707 1,309 1,465 1,604 1,723 Peak Hourly Arriving Passengers (Terminal A) 892 1,220 1,286 1,448 1,454 Peak Hourly Departing Passengers (Terminal B) 1,185 1,470 1,668 1,953 2,417 Peak Hourly Arriving Passengers (Terminal B) 1,463 1,728 1,851 1,971 2,119 TOTAL PEAK HOUR DEPARTING PAX 1,590 2,667 2,945 3,233 3,502 TOTAL PEAK HOUR ARRIVING PAX 1,967 2,192 2,620 2,777 2,940
Note 1: Peak hourly departing and arriving passengers in each terminal as per DDFS.
Note 2: Total Peak hour passengers as per forecast.
Source: J|D calculations based on DDFS, March 2020
AIRCRAFT GATES AND PARKING The requirements analysis for aircraft gates and parking was derived from two analyses: 1) a ratio method analysis that considers turns per gate, and 2) a design day flight schedule (DDFS) gate method analysis.
Ratio Method Analysis
The ratio method considers turns per gate, defined as the number of daily departing flights in the DDFS divided by the number of gates in use. The number of turns per gate under the baseline DDFS with the existing number of gates is indicative of the airlines operating from Terminal A and Terminal B, respectively. Terminal A, which features legacy airlines such as American, Delta, and United, operates with 5.00 turns per gate, while Terminal B, which features Southwest and low-cost carriers, operates with 6.21 turns per gate. The results of this analysis are shown in Table 3-13.
The first calculation, “no new gates, calculate turns”, in Table 3-13, shows how much aircraft turns would grow if the future DDFS were applied to the existing gate inventory. However, it may not be reasonable to expect

3-21
Terminal A to operate with 7.42 turns per gate or for Terminal B to operate with 8.47 turns per gate, without significant changes to existing airline operations. This implies a need for at least some new gates.
The second calculation, “hold turns, calculate new gates”, shown in Table 3-13, calculates the number of new gates needed to accommodate the future DDFS while holding the existing turns per gate ratio constant. This implies that each terminal would need three or four new gates by PAL 2 and three additional gates by PAL 4 for a total increase of 13 gates at the Airport.
Table 3-13 Ratio Method Gate Requirements
No new gates - Calculate turns Hold turns - Calculate new gates
Baseline DDFS Existing Gates PAL 2 PAL 4 PAL 2 PAL 4
Terminal A 60 flights 12 gates
5.00 turns
76 flights 12 gates
6.33 turns
89 flights 12 gates
7.42 turns
76 flights 15.2 -> 15 gates
+3 gates 5.00 turns
89 flights 17.8 -> 18 gates
+6 gates 5.00 turns
Terminal B 118 flights 19 gates
6.21 turns
142 flights 19 gates
7.47 turns
161 flights 19 gates
8.47 turns
142 flights 22.9 -> 23 gates
+4 gates 6.21 turns
161 flights 25.9 -> 26 gates
+7 gates 6.21 turns
Total 178 flights 31 gates
5.74 turns
218 flights 31 gates
7.03 turns
250 flights 31 gates
8.06 turns
218 flights 38.0 -> 38 gates
+7 gates 5.74 turns
250 flights 43.6 -> 44 gates
+13 gates 5.74 turns
Source: J|D calculations based on DDFS, March 2020
DDFS Gate Method Analysis
The gating analysis considers the existing aircraft gate inventory (Section1 - Inventory), aircraft compatibility (the number of flights in the baseline and future DDFS that can only be accommodated at one or two gates), and existing airline gate allocation. Since Gate A13 in Terminal A is currently not in service, it was not used. There are a few common use gates at SMF, but most are preferential use (gates are used by a specific airline), and no aircraft were gated on another airline’s preferential use gate for this analysis. Additional assumptions included a 30-minute buffer time before and after each flight and a 20-minute tow-off and tow-on time for operations from, and to, remain overnight (RON) parking positions.
There are 20 total RON positions; seven near Concourse A and 13 near Concourse B. Sacramento International Airport is an origin and destination (O&D) airport, where most of its passengers originate from the surrounding region and depart to other airports, or they arrive to visit the Sacramento region. An O&D airport does not have many connecting flights, though it is acknowledged that Southwest will connect some passengers. Many morning flights originating from SMF use aircraft stored overnight.
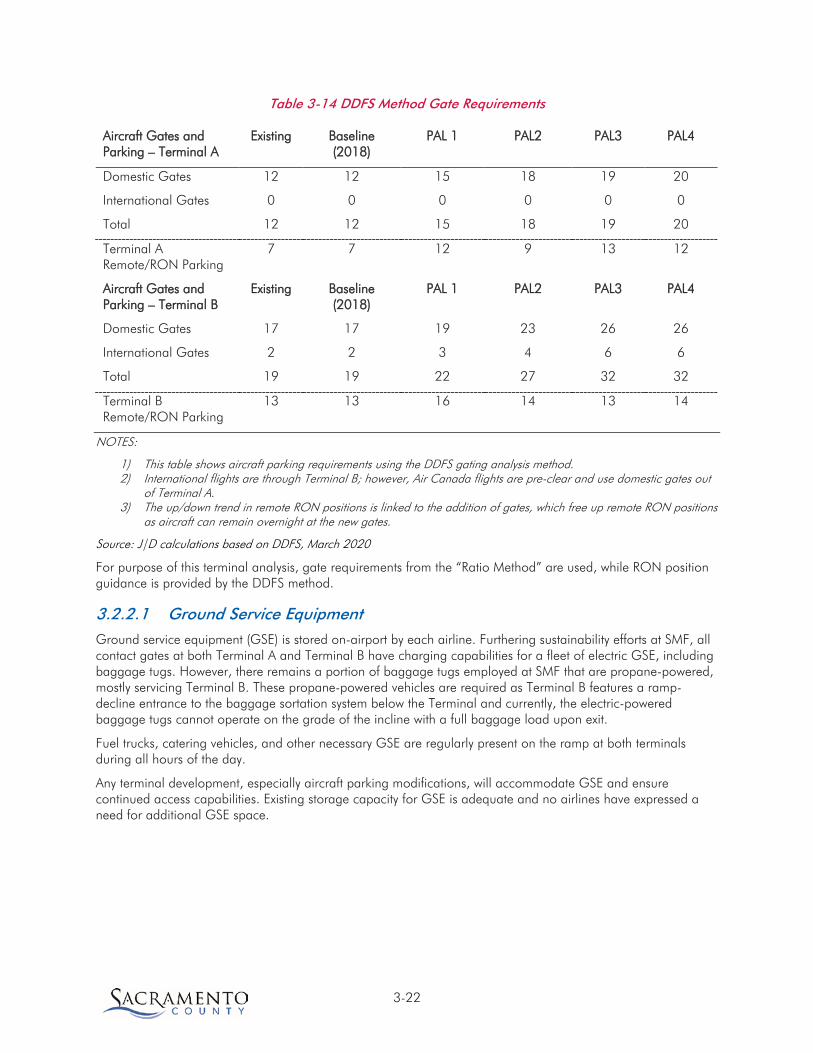
The results of this analysis are shown in Table 3-14. The existing gate and RON assignments are discussed in Section 1 - Inventory.
3-22
Table 3-14 DDFS Method Gate Requirements
Aircraft Gates and Parking – Terminal A
Existing Baseline (2018)
PAL 1 PAL2 PAL3 PAL4
Domestic Gates 12 12 15 18 19 20
International Gates 0 0 0 0 0 0
Total 12 12 15 18 19 20
Terminal A Remote/RON Parking
7 7 12 9 13 12
Aircraft Gates and Parking – Terminal B
Existing Baseline (2018)
PAL 1 PAL2 PAL3 PAL4
Domestic Gates 17 17 19 23 26 26
International Gates 2 2 3 4 6 6
Total 19 19 22 27 32 32
Terminal B Remote/RON Parking
13 13 16 14 13 14
NOTES:
1) This table shows aircraft parking requirements using the DDFS gating analysis method. 2) International flights are through Terminal B; however, Air Canada flights are pre-clear and use domestic gates out
of Terminal A. 3) The up/down trend in remote RON positions is linked to the addition of gates, which free up remote RON positions
as aircraft can remain overnight at the new gates.
Source: J|D calculations based on DDFS, March 2020
For purpose of this terminal analysis, gate requirements from the “Ratio Method” are used, while RON position guidance is provided by the DDFS method.
3.2.2.1 Ground Service Equipment Ground service equipment (GSE) is stored on-airport by each airline. Furthering sustainability efforts at SMF, all contact gates at both Terminal A and Terminal B have charging capabilities for a fleet of electric GSE, including baggage tugs. However, there remains a portion of baggage tugs employed at SMF that are propane-powered, mostly servicing Terminal B. These propane-powered vehicles are required as Terminal B features a ramp-decline entrance to the baggage sortation system below the Terminal and currently, the electric-powered baggage tugs cannot operate on the grade of the incline with a full baggage load upon exit.
Fuel trucks, catering vehicles, and other necessary GSE are regularly present on the ramp at both terminals during all hours of the day.
Any terminal development, especially aircraft parking modifications, will accommodate GSE and ensure continued access capabilities. Existing storage capacity for GSE is adequate and no airlines have expressed a need for additional GSE space.

3-23 Draft Master Plan Update Sacramento International Airport
HOLDROOMS Holdrooms are areas adjacent to the gates inside both terminals where passengers wait and queue before boarding flights. The areas are generally unobstructed, allowing for some efficiencies of shared space between adjacent gates and include passenger boarding processing counters, boarding pass readers, and other associated functions. It is noted that other areas at the Airport not immediately adjacent to aircraft gates, such as food courts, are also used by passengers waiting to board flights. However, for the purpose of this analysis, holdroom requirements omit areas not immediately adjacent to the aircraft gate.
Holdroom areas required by aircraft type, and existing holdroom areas in both terminals at SMF, are summarized in Table 3-15 and Table 3-16. Common use counters, backscreens, and boarding pass scanners are provided so that any airline can use the equipment when boarding aircraft, although airline proprietary boarding equipment and procedures may limit the efficiency of operations at unassigned gates.
Table 3-15 Holdroom Areas Required by Aircraft Type
Aircraft Typical seats (a) Holdroom area (b)
(sq. ft.)
B737-900 179 1,732 B757-200 185 1,791 A321neo 196 1,897 B757-300 234 2,265 B767-300 264 2,556 B777-200 277 2,681 A330-200 278 2,691
(a) Typical seats took the average seating arrangement of the airlines using that particular aircraft.
(b) Holdroom area required was estimated based on the methodology described in this section.
Source: Alaska Airlines, American Airlines, Delta Air Lines, United Airlines.

3-24 Draft Master Plan Update Sacramento International Airport
Table 3-16 Existing Holdroom Area Summary
Gate Airline Area provided (square feet) Largest aircraft
Area required (square feet)
Concourse A A1 Delta 1,306 A321neo 1,897 A2 American 2,277 A321neo 1,897 A3 Delta 2,193 A321neo 1,897 A4 American 1,098 A321neo 1,897 A5 American 849 B767-300 2,556 A10 Delta 1,511 A321neo 1,897 A11 common use 2,391 A321neo 1,897 A12 Delta 1,556 A321neo 1,897
A13 common use 2,200 A321neo 1,897
A14 United 1,597 A321neo 1,897 A15 United 1,594 A321neo 1,897 A16 United 1,989 A321neo 1,897 A17 United 2,054 A321neo 1,897 Total 22,615 25,320
Concourse B B1-B3 NUMBERS RESERVED FOR FUTURE USE B4 common use 3,207 A330-200 2,691 B5 Alaska 1,965 B737-900 1,732 B6 common use 2,431 B737-900 1,732 B7 Alaska 2,000 B757-200 1,791 B8 common use
/international 1,929 B777-200 2,392
B9 Alaska 2,181 B737-900 1,732
B10 common use /international
1,859 B737-900 1,732
B11 Spirit 2,123 B737-900 1,732 B12 Southwest 2,270 B737-900 1,732 B14 Southwest 1,925 B737-900 1,732 B15 Southwest 2,200 B737-900 1,732 B16 Southwest 2,338 B737-900 1,732 B17 Southwest 2,200 B737-900 1,732 B18 Southwest 2,342 B737-900 1,732 B19 Southwest 2,167 B737-900 1,732
B20 Southwest 2,322 B737-900 1,732
B21 Southwest 2,166 B737-900 1,732
B22 common use 2,807 B737-900 1,732
B23 Southwest 2,657 B737-900 1,732
Total 43,089
34,586 Source: Sacramento County Department of Airports, 2019

3-25 Draft Master Plan Update Sacramento International Airport
The requirements analysis for the holdrooms focused on the median holdroom area required in each concourse for an approximate total future holdroom calculation in each concourse, and the gate requirements from the “Ratio Method” analysis. For Concourse A, 1,897 square feet was used for each holdroom, and for Concourse B, 1,732 square feet was used for each holdroom. Using this median calculation, Concourse A already requires additional holdroom space, while Concourse B will not require additional holdroom space until PAL 4 (Table 3-17).
Table 3-17 Holdroom Requirements
Source: Sacramento County Department of Airports, 2019
AIRLINE CHECK-IN Airline check-in facilities provide for the processing of passengers and baggage via curbside check-in, lobby check-in, and self-service check-in. The analysis for this functional element identifies the number and capacity of check-in processors in the existing terminals (a processor is a passenger touch-point, such as a ticket counter or electronic kiosk used for ticketing or baggage check-in) and the queuing space that accommodates passengers checking in for their flights. This analysis takes into account any current unused positions.
Currently, Terminal A is arranged with a traditional linear ticket counter, with each airline staffing their own counters. Some self-service kiosks support common use operations (can be used by a passenger of any airline), while other kiosks are airline specific. All baggage collected at the counters are processed in a centralized baggage collection system.
• Capacity for Terminal A is constrained due to the original facility design, which compartmentalizes the ticketing and baggage check-in functions.
• There are four vacant agent positions in Terminal A, and three vacant skycap (curbside) positions in Terminal A.
Currently, Terminal B is arranged with island-style ticket counters distributed across the ticket hall facility. Each “island” feeds into a common CBIS and makeup area, allowing for a true common use operation. The use of overhead dynamic signage allows for the re-assigning of ticket counters as needed. With appropriate setup time and because of the centralized CBIS, any airline can use any counter or kiosk for check-in of passengers and baggage, which increases capacity.
• The total number of check-in processors includes the 27 unused agent counter locations in the south lobby area of Terminal B, and four vacant skycap (curbside) positions.
• The queuing capacity at Terminal B is dedicated to each ticket counter island and is not impacted by traffic at adjacent counters.
During the design hour, the following assumptions were made:
• There is no self-tagging option at the Airport, so passengers with baggage must access a full service or bag drop counter.
• Airline check-in requirements were developed using a maximum queue time of 10 minutes as the level-of-service standard for all airlines (LOS “C”).
Holdrooms (Area in Square Feet) Existing Base
(2018) PAL1 PAL2 PAL3 PAL4
Concourse A (based on 1,897 sq.ft./ea) 22,615 22,764 26,558 28,455 32,249 34,146
Concourse B (based on 1,732 sq.ft./ea) 43,089 32,908 36,372 39,836 41,568 45,032
Total Holdroom Area 65,704 57,569 66,559 80,910 91,467 93,364

3-26 Draft Master Plan Update Sacramento International Airport
• The peak 30-minute window determines the number of staffed counters, kiosks, and curbside pick-up required. (It is assumed that during the peak 30-minute window half of the design hour passengers will be utilizing ticketing services—50%).
• 30% of the passengers will require the use of staffed counters for Terminal A, and 30% for Terminal B.
• 75% of the passengers will use kiosks for Terminal A, and 75% for Terminal B (this accounts for some overlap of passengers requiring counter assistance after using a kiosk).
• 5% of traffic at Terminal A and Terminal B is connecting traffic.
• The average time spent at a counter per passenger is three minutes; maximum desired wait time for a counter is 10 minutes to meet LOS “C” standards.
• The average time spent at a kiosk per passenger is one minute and 30 seconds; maximum desired wait time for a kiosk is two minutes.
• To analyze the number of counters and kiosks required at the terminals, the following formula is used:
𝐶𝐶𝑋𝑋 =𝑃𝑃2 ∗ 𝑃𝑃𝑈𝑈 ∗ (1 − 𝑃𝑃𝐶𝐶) ∗ 𝑃𝑃𝑡𝑡
30 + 𝑊𝑊𝑡𝑡
• Where:
Cx = Number of counters or kiosks required
P = Rolling hour peak departing passengers
Pu = Percent of passengers utilizing ticketing services
Pc = Percentage of connecting passengers
Pt = Processing time per passenger expressed in minutes per passenger
30 minutes is used for number of minutes during peak half hour
Wt = Maximum desired wait time
3.2.4.1 Terminal A Check-In Requirements There is a need for nine staffed counter spaces in the baseline. By PAL 4 there will be a need for 21 staffed counters. The existing 22 bag drop counters will be sufficient through PAL 4. Table 3-18 summarizes the Terminal A check-in requirements.
• There is a need for five additional check-in counters by PAL 4.
At Terminal A, there are currently 36 kiosks in the ticketing lobby. Of the 36 kiosks, 26 of them are exclusively used by individual airlines while 10 are available as common use. The formula for determining required kiosks is the same formula as for determining required counters, but with different inputs listed in the assumptions.
• There is a need for five additional kiosks by PAL 4 (Table 3-18).
Future passenger demand requires adequate space for passengers to queue for counters and kiosks. There is a total queueing area in the ticketing lobby of Terminal A of 3,715 square feet. Using the International Air Transportation Association (IATA) LOS table, the typical area per passenger required to achieve LOS “C” is 16 square feet. This assumes an average of 1.5 bags per passenger.
To provide LOS “C” for kiosks, 14 square feet is required per passenger with a maximum of two passengers per bank of airline allotted kiosks. There are four banks of kiosks in Terminal A, which means a maximum of eight passengers waiting in queue. Terminal A has less lobby queuing space, therefore fewer people can wait in line before reaching the maximum 10-minute wait time for a check-in counter and 2-minute wait time for a kiosk.
• There is sufficient check-in lobby queue space at Terminal A through PAL 4 (Table 3-18).

3-27 Draft Master Plan Update Sacramento International Airport
3.2.4.2 Terminal B Check-In Requirements The number of passengers requiring staffed counter space in Terminal B for the baseline is 14, with 14 bag drop counters also required in the baseline. By PAL 4, there will be a need for 29 total staffed positions and 28 total bag drop locations. Table 3-18 summarizes the Terminal B check-in requirements.
• No additional staffed counter space or bag drop locations are required through PAL 4.
At Terminal B, there are currently 44 kiosks in the ticketing lobby. The formula for determining the number of required kiosks follows the same formula as that for counters but with different inputs listed in the assumptions.
• By PAL 4, 56 kiosks will be required to meet demand; 12 more kiosks than existing (Table 3-18).
Future passenger demand will require adequate queuing space for counters and kiosks. There is a total queueing area in the ticketing lobby of Terminal B of 12,032 square feet. Using the IATA LOS table, the typical area per passenger required to achieve LOS “C” is 16 square feet. This also assumes an average of 1.5 bags per passenger.
For kiosks, at LOS “C” there is a requirement of 14 square feet per passenger and a maximum wait of two passengers per bank of airline allotted kiosks. Terminal B has more lobby queuing space, therefore more people can wait in line without going over a 2-minute wait.
• There is sufficient check-in lobby queue space at Terminal B through PAL 4 (Table 3-18).
Table 3-18 Airline Check-In Requirements
Terminal A Number of Processors Existing Baseline
(2018) PAL1 PAL2 PAL3 PAL4
Agent Counters 16 9 16 17 19 21 Bag Drop Counters 22 10 16 17 19 21 Kiosks 36 19 31 34 38 41 Curbside (with Bag Check) 7 1 2 2 3 3
Lobby Queuing Space 3,715 884 1,962 2,320 2,447 2,572 Terminal B Number of Processors Existing Baseline
(2018) PAL1 PAL2 PAL3 PAL4
Agent Counters 48 14 18 20 23 29 Bag Drop Counters 48 14 17 20 23 28 Kiosks 44 28 34 39 46 56 Curbside (with Bag Check) 10 2 2 3 3 4
Lobby Queuing Space 12,032 1,818 2,266 2,567 3,012 3,760 Source: Sacramento County Department of Airports, 2019
PASSENGER SECURITY SCREENING Each of the existing terminals has a single SSCP that provides equipment and facilities where passengers transitioning from the landside to the airside, including employees, and contractors, are screened as required by the TSA. According to the local TSA director, the number of passengers than can be processed by a single standard lane per hour is 150, and for a single expedited (PreCheck) lane, throughput per hour is 220 passengers.
The passenger screening facility in Terminal A is located on the second floor of the terminal. Passengers transition from the first-floor ticketing lobby to the second floor, where they enter a large queuing and divestiture area. There are seven SSCP lanes, two of which are dedicated to TSA PreCheck.

3-28 Draft Master Plan Update Sacramento International Airport
The SSCP for Terminal B is located north of the APM station in Concourse B and has a large queuing, divestiture, and recomposure areas. The SSCP is currently equipped with 10 lanes, four of which are used for TSA PreCheck, however one lane swings between standard and TSA PreCheck, according to TSA.
In both terminals, a security bypass is provided for appropriately-badged employees and escorted guests, so the number of non-passengers who go through the checkpoint is minimal. Employees who pass through the SSCP, and known crew members of the airlines, account for approximately 5% of the total security lane throughput.
SSCP requirements were developed by comparing existing SSCP throughput capabilities, peak passenger demand, and maximum desired wait time:
• Formula for determining SSCP requirements:
𝐶𝐶𝑋𝑋 =𝑃𝑃2∗ 𝐴𝐴𝑇𝑇 ∗ 𝑃𝑃ℎ ∗
30 + 𝑊𝑊𝑡𝑡
60
*Rounded up to nearest whole number
• Where:
Cx = Number of SSCP lanes required
P = Peak hour departing passengers
Ph = Processing rate of passengers per hour (170 per hour in Concourse A; 178 per hour in Concourse B)
At = Additional traffic (non-passenger, employees, known crew members) assumed to be 5%
Wt = Maximum desired wait time
Once the formula is solved for Cx, the ACRP model determines the number of passengers arriving and being processed per minute. The required queueing area is calculated by multiplying the passengers waiting in the queue line by the LOS for security screening lines from IATA. To achieve LOS “C”, this area is 10.8 square feet per person. The SSCP requirements are summarized in Table 3-19.
• Terminal A will need additional screening lanes by PAL 1.
• Terminal B will need additional screening lanes by PAL 2. Terminal B will also need additional queuing area by PAL 3.
Table 3-19 SSCP Requirements
Passenger Security Screening Existing 2018 (Base)
PAL 1 PAL 2 PAL 3 PAL 4
Terminal A: Total Number of Screening Lanes
5 3 6 7 8 8
Number of PreCheck Lanes 2 2 3 3 3 3
Total Lanes 7 5 9 10 11 11
Queuing Area (sq.ft.) 7,400 1,129 2,248 2,560 2,772 2,865
Terminal B: Total Number of Screening Lanes
6 8 7 8 9 11
Number of PreCheck Lanes 4 2 3 3 4 5
Total Lanes 10 10 10 11 13 16
Queuing Area (sq.ft.) 4,870 2,988 3,911 4,688 4,975 5,382
Source: Sacramento County Department of Airports, 2019

3-29 Draft Master Plan Update Sacramento International Airport
AUTOMATED PEOPLE MOVER Terminal B uses an APM system to shuttle passengers between the landside building and the airside concourse. The APM is a train system automatically controlled by computers and tied into the building systems. A monitoring system, which includes human controllers, ensures safe, reliable operation. This is the usual method of transportation between the two buildings.
During emergency operations, procedures are in place to transfer passengers between the two buildings. However, these procedures require that SCDA staff are present when evacuating APM cars or moving passengers between either building. If passengers require evacuation mid-trip, the incline of the existing APM system does not meet the requirements of the Americans with Disabilities Act (ADA) and some passengers could be faced with a potentially physically challenging situation. There is also no protection from the elements outside of the APM cars along the incline or between the terminal and concourse.
The APM is located post check-in, so passengers are unlikely to bring oversize baggage. This maximizes the number of passengers who can be carried on each train as well as their ability to board/deboard during the 25-second dwell time.
The present configuration of the APM system is two single-car trains, each car with a design holding capacity of 65 passengers. It should be noted that the normal holding capacity is 50 passengers. The system has a 91-second cycle time, which includes headway, dwell, and door cycles. This normal cycle time can be affected by people holding the door open or otherwise delaying the trains.
The APM station at each building provides two circulation paths, separating entraining and detraining passengers. The entraining platform can accommodate two complete trainloads of people standing, and allow for queuing and access to the vehicles as they arrive.
The APM system has redundant power supplies, emergency generator capacity, and the ability to operate either of the trains manually and independently, thus reducing the potential for a complete service disruption.
• APM requirements were developed by dividing the passenger load by the system capacity, using the following formula:
𝐶𝐶𝐶𝐶 = 𝑃𝑃/𝑃𝑃ℎ
• Where:
Cx = Number of APM cars required
P = Rolling Hour Departing Passengers
Ph = Capacity of APM system car in passengers per hour (1,980)
The design capacity of the two-car system is 2,570 passengers per hour in each direction. The “normal” capacity of the two-car system is 1,980 passengers per hour in each direction. The peak hour of passengers departing to Concourse B from Terminal B is 1,185 in the base year. The peak hour for arriving passengers returning to Terminal B from Concourse B in the base year is 1,463 passengers.
• Additional cars should be added by PAL 4, which forecasts 2,417 departing passengers (Table 3-20).
The existing queueing space for passengers waiting for the APM is 2,457 square feet in Terminal B for departing passengers, and 3,830 square feet in Concourse B for arriving passengers (Table 3-20).
• The queueing area for both departing and arriving passengers is adequate through PAL 4, assuming an IATA LOS “C” of 14 square feet per passenger (Table 3-20).

3-30 Draft Master Plan Update Sacramento International Airport
Table 3-20 APM Requirements
Automated People Mover - Terminal B Only
Existing (2019) Base (2018) PAL1 PAL2 PAL3 PAL4
Cars per Train/2 Trains (1,980 Passengers/Hour/Car) - Departures
1,980 1,185 1,470 1,668 1,953 2,417
Queuing Space – Departures (sq.ft.) 2,457 912 1,132 1,284 1,504 1,861
Cars per Train/2 Trains (1,980 Passengers/Hour/Car) - Arrivals 1,980 1,463 1,728 1,851 1,971 2,119
Queuing Space – Arrivals (sq.ft.) 3,830 1,127 1,331 1,425 1,518 1,632
Source: Sacramento County Department of Airports, 2019
CHECKED BAGGAGE INSPECTION SYSTEM Both terminals provide a CBIS consisting of conveyor equipment, controls, Explosives Detection Systems (EDS), and resolution systems for the screening of checked baggage by the TSA. Terminal A uses a centralized CBIS that allows any airline bag anywhere in the system to be merged, screened, and then sorted to the various airlines for loading onto aircraft. Terminal B also uses a centralized CBIS that allows any airline bag anywhere in the system to be merged, screened, and then sorted to the various airlines for loading onto aircraft.
These systems have redundant capabilities, allowing parts of the system to be taken out of service for maintenance or convenience. These systems can also recirculate baggage, if necessary, to level out the demand peaks if the capacity of the EDS equipment is exceeded.
Discrete makeup devices are provided for each airline for sorting baggage and loading it onto carts for transfer to the aircraft. These devices can be reassigned to different airlines via software, if required, due to maintenance or capacity issues. The devices are configured as either a straight device, where bags slowly advance down the belt until they are loaded onto a cart, or a carousel, where they circulate around the device until they are loaded.
The Terminal B CBIS cannot be physically expanded, but anticipated advances in EDS screening technology will allow for additional throughput for the existing CBIS equipment in both terminals.
• Checked baggage screening requirements were developed by analyzing the existing EDS capacity (number of bags per hour through the system) using the following approach and assumptions:
𝐶𝐶𝐶𝐶 = �𝑃𝑃 ∗𝐵𝐵𝐵𝐵𝐵𝐵ℎ� + 1
• Where:
Cx = Number of EDS machines required
P = Peak number of departing passengers
Bp = Average number of checked bags per passenger (0.8)
Bh = Processing rate of EDS machines; 550 bags per hour in both SMF terminals
+1 = An extra machine is required as an online spare due to scheduled maintenance of the EDS equipment
• Solving for a single passenger, the requirement for EDS machines is given below:
o EDS in Terminal A: 0.0018 EDS machines per passenger
o EDS in Terminal B: 0.0015 EDS machines per passenger

3-31 Draft Master Plan Update Sacramento International Airport
Design capacity of the Terminal A CBIS is 1,760 bags per hour, using 550 bags per hour for inline systems and 330 bags per hour for standalone systems. This also assumes a N+1 function of EDS machines in the CBIS. Using a factor of 0.8 checked bags per passenger, this is equivalent to 2,200 bags per hour.
• One additional EDS machine will be required in Terminal A by PAL 4 (Table 3-21).
Design capacity of the Terminal B CBIS is 2,750 bags per hour, assuming a N+1 function of EDS machines in the CBIS. Using a factor of 0.8 checked bags per passenger, this is equivalent to 3,438 bags per hour.
• The baggage system for Terminal B is adequate through PAL 4 (Table 3-21).
Table 3-21 CBIS Requirements
Baggage Security Screening - Number of Primary EDS Machines Existing Base
(2018) PAL1 PAL2 PAL3 PAL4
Terminal A 3 2 3 3 3 4 Terminal B 6 3 3 3 4 5 Total 9 5 6 6 7 9
Source: Sacramento County Department of Airports, 2019
PASSENGER BAGGAGE CLAIM Passenger baggage claim lobbies are provided in both terminals for claiming of checked baggage. Passengers can check Baggage Information Display System (BIDS) monitors to see where their bags will be arriving, as well as signage to direct them to the appropriate device.
Terminal A provides baggage claim via three 165-foot-long, flat-plate baggage claim devices. These flow-through devices go from the baggage drop off area on the airside into the terminal and then out again, in a continuous loop. The devices do not allow for circulation of the passengers completely around them, so passengers typically stand at a single spot and wait for their bags, which can cause crowding at the ends of the devices. Over-sized baggage is accommodated with manual chutes located adjacent to the devices.
Terminal B provides four, 180-foot-long, sloped-plate baggage claim carousels with full access around the devices for passengers. Bags are delivered from the basement baggage handling area. The bags move up through the floor opening into the center of the devices and then descend onto the carousels. There is adequate queuing and circulation area around the belt to allow people to stand and circulate, and retrieve and stage their bags. Over-sized baggage is accommodated with a centralized, dedicated, over-sized baggage belt.
The carousels in both terminals are dynamically signed and allow true common use function.
• Domestic baggage claim requirements were developed using the following formula and assumptions:
𝐶𝐶𝐶𝐶 = ��𝑃𝑃 ∗ 𝑃𝑃𝑃𝑃 ∗𝐵𝐵𝐵𝐵1.3
� + ��(𝑃𝑃 ∗ 𝑃𝑃𝑃𝑃 ∗ 𝐵𝐵𝐵𝐵) − �𝑃𝑃 ∗ 𝑃𝑃𝑃𝑃 ∗𝐵𝐵𝐵𝐵1.3
�� ∗ 0.3�� ∗ 𝐹𝐹
• Where:
Cx = Amount of baggage claim frontage required
P = Passengers deplaning in the peak 20 minutes (peak hour deplaning * .50)
Pt = Percent terminating passengers (95% assuming 5% connecting traffic)
Bp = Average number of checked bags per passenger (0.8)
Ps = Average party size (assumed 1.3 for SMF)
F = Amount of frontage in feet required by each person (1.5)
Using the formula above for Terminal A, the base year peak will have 238 total people at baggage claim. At 1.5 feet per passenger, this means a requirement of 357 linear feet of claim frontage (Table 3-22).

3-32 Draft Master Plan Update Sacramento International Airport
At Terminal A, passengers were assumed to gather within 10 feet of the carousels. Each carousel occupies a total area of approximately 4,336 square feet (based on actual measurement). The base requirement for space then is three carousels at 13,008 sq.ft.
• By PAL 2, the Airport will need to install one new baggage carousel at Terminal A and will need more area for claiming baggage (Table 3-22).
Using the formula above for Terminal B, the base year peak will have 441 people at baggage claim. At 1.5 feet per passenger, this equates to 585 feet of claim frontage required in the base year. Each carousel, offset 10 feet, occupies an area of 5,833 square feet (based on actual measurement). The base requirement for space then is four carousels at 23,333 square feet.
• By PAL 2, the Airport will need to install one new baggage carousel at Terminal B (Table 3-22).
Table 3-22 Baggage Claim Requirements
Terminal A Baggage Claim Existing Base (2018) PAL1 PAL2 PAL3 PAL4
Total Presentation Frontage (LF) 495 357 488 514 579 582 Number of Carousels/Devices (165 feet/device) 3 3 3 4 4 4
Total Area for Claiming Baggage (sq.ft.)
13,008 13,008 13,008 17,344 17,344 17,344
Terminal B Baggage Claim Total Presentation Frontage (LF) 720 585 691 740 788 848 Number of Carousels/Devices (180 feet/carousel) 4 4 4 5 5 5
Total Area for Claiming Baggage (sq.ft.) 35,000 23,333 23,200 29,000 29,000 29,000
Source: Sacramento County Department of Airports, 2019
OUTBOUND/INBOUND BAGGAGE SYSTEMS The outbound/inbound baggage systems described in this section are the portions of the conveyor belt used to provide an area for the loading and unloading of baggage carts to and from aircraft. Generally, these areas are secured and not seen by the general public, but are an important element in the operation of the facility.
3.2.9.1 Outbound Baggage Makeup This analysis identifies the number of baggage carts required at the baggage makeup carousels.
The existing Terminal A baggage makeup areas are located on the ramp level. The area assigned to United Airlines consists of a carousel device and a pier device with a diverter. Although programming allows bags to be directed to the carousel or to the adjacent pier, this function is not currently utilized, so all bags are delivered to the carousel.
Delta Air Lines has its own carousel which receives baggage from CBIS. This carousel is located in a facility constructed between Gate A2 and Gate A11. From the carousel, the bags are loaded into staged baggage carts and towed to the waiting aircraft.
• There are a total of 30 cart staging positions in Terminal A.
Baggage makeup devices are located in the basement of Terminal B. They consist of a pair of carousels for use by Southwest Airlines, and pairs of piers for the other airlines. Program logic in the Baggage Handling System routes bags to individual piers or carousels based on the airlines’ assigned location. The bags are manually loaded from the carousels or piers into the baggage carts and towed to aircraft via a tunnel.

3-33 Draft Master Plan Update Sacramento International Airport
Terminal B was originally designed assuming four carts per gate and two piers assigned to each airline. Because of the size of Southwest Airlines’ operation, two carousels were provided instead of piers to accommodate greater cart staging. Airline operational needs or preferences have affected actual requirements.
• There are a total of 89 available cart staging positions in Terminal B.
Outbound baggage cart staging requirements are developed using the following approach and assumptions:
• Cart staging requirement formula:
𝐶𝐶𝐶𝐶 = 𝑃𝑃 ∗𝐵𝐵𝐵𝐵𝑆𝑆
• Where:
Cx = Number of cart staging spaces required
P = Peak departing passengers
Bh = Average number of checked bags per passenger (0.8)
S = Average capacity of baggage cart (40)
• Solving for a single passenger, the requirement for cart staging is:
o Terminal A and Terminal B: 0.02 carts per passenger
• Cart staging for a flight begins two hours before the scheduled departure time and ends 15 minutes before the scheduled departure time.
• The average number of checked bags per passenger is 0.8 (this number could decrease as checked baggage fees become more common).
There are currently 30 cart staging positions in Terminal A, which means that baggage for 1,250 passengers can be staged simultaneously. The existing outbound baggage system will require additional cart staging positions by PAL 3, as shown in Table 3-23.
There are currently 89 cart staging positions in Terminal B, which means that baggage for 4,450 passengers can be staged simultaneously. The existing outbound baggage system meets demand through PAL 4, as shown in Table 3-23.
3.2.9.2 Inbound Baggage Handling The existing baggage claim facilities use direct feed devices; therefore, a section of each device is exposed to the public (presentation frontage), and a nonpublic section is exposed to baggage handlers (offload frontage).
The devices in Terminal A are fed from the rear wall onto the flow-through devices. Any bags not claimed as they circulate through the public area run back through the rear of the building. This slightly degrades the efficiency of the feeds as portions of the belt holding bags cannot be used to transfer additional bags.
• Terminal A provides 96 linear feet of unloading area for inbound baggage.
The devices in Terminal B are fed from individual belts that proceed through the building and drop onto the carousels. The belts offer sufficient presentation and transfer length and do not become too crowded to accommodate all the luggage being delivered to the belt.
• Terminal B provides 211 linear feet of unloading area for inbound baggage.
Inbound baggage frontage requirements were based on a planning ratio of 0.3 feet of offload frontage for every foot of presentation frontage.
• Requirement for inbound baggage offload frontage is developed using the following formula:
𝐶𝐶𝐶𝐶 = 𝑃𝑃 ∗ 𝐵𝐵𝐵𝐵 ∗ 𝐹𝐹𝑁𝑁∗ 𝑅𝑅

3-34 Draft Master Plan Update Sacramento International Airport
• Where:
Cx = Amount of baggage offload frontage required
P = Peak arriving passengers
Bp = Average number of checked bags per passenger (0.8)
F = Amount of frontage required by each bag (2 ft)
N = Number of flights that can be claimed on a device per hour (4)
R = Ratio of offload belt required for each foot of baggage claim presentation (0.3 ft)
• Solving for a single passenger, the requirement for inbound frontage is:
o Terminal A and Terminal B: 0.12 linear feet per passenger
The total offload frontage available in Terminal A is 96 linear feet. By PAL 4, 175 linear feet will be required (Table 3-23).
The total offload frontage available in Terminal B is 211 linear feet. By PAL 4, 255 linear feet will be required (Table 3-23).
Table 3-23 Outbound/Inbound Baggage System Requirements
Outbound Baggage Makeup - Number of Cart Staging Positions
Existing (2019) Base (2018) PAL1 PAL2 PAL3 PAL4
Terminal A 30 15 27 30 33 35 Terminal B 89 24 30 34 40 49 Total 119 39 57 64 73 84 Inbound Baggage Handling - Offload Frontage (LF)
Terminal A 96 108 147 155 174 175 Terminal B 211 176 208 223 237 255 Total 307 284 355 378 411 430
Source: Sacramento County Department of Airports, 2019
U.S. CUSTOMS AND BORDER PROTECTION SCREENING A CBP screening facility provides for the screening of arriving international passengers for immigration status, claim of international baggage, and the processing of passengers and baggage through customs. At SMF, the facility is located in Terminal B and consists of all the offices, sterile corridors, and auxiliary facilities required to provide these functions to accommodate up to 400 passengers per hour. With minor modifications and installation of a second baggage claim device, the existing facility could accommodate almost 800 passengers per hour. The following key functional components described in the CBP design standards were considered in this analysis.
Sterile Circulation Corridor: Arriving international passengers must enter the facility through either the dual-use sterile corridor on the concourse level or the ramp level entrance; for most purposes, the sterile corridor is used. The existing configuration ties two gates, B8 and B10, to the CBP facility. The parking layout for this configuration allows for either two narrow-body aircraft or a single widebody aircraft (up to a Boeing 777-200), to park and unload into the facility.
Primary Processing: All arriving international passengers must be examined and screened by CBP officers at the primary processing area to determine nationality and/or admissibility into the United States. Terminal B currently has four, two-position booths, providing eight processing positions.
Baggage Claim: After primary processing, passengers with checked baggage proceed to the international baggage claim area within the CBP facility. Most CBP passengers have checked bags, so the bag claim

3-35 Draft Master Plan Update Sacramento International Airport
facilities get a much higher usage than would be typical for a domestic flight. The current configuration has a single, 160-linear-foot claim device.
Secondary Processing: The CBP identifies a subset of arriving international passengers for additional processing and examination. These passengers, along with their baggage, are directed or escorted to the CBP secondary processing area downstream from the baggage claim. The number of passengers directed to secondary processing varies greatly with the type of flight and the origination point. The time required for examination varies as well, but typically this activity does not limit a facility’s capacity or efficiency.
CBP design requirements allow for the design of facilities in specific increments. The smallest allowable facility must be sized to accommodate 400 to 799 passengers per hour. The next step is 800 to 1,199 passengers per hour. The CBP offices at SMF allow for a maximum capacity of 799 passengers per hour.
Discussions with CBP personnel revealed that there is a maximum of three international flights currently arriving within a one-hour time span. One of the flights arrives at the beginning of that hour, and the other two are within a few minutes of each other, but at the end of the hour. The first flight, therefore is almost entirely processed by the time the other two flights arrive.
The two international flights arriving at 10:39 PM are operated by B-737-800s, which carry a maximum of 175 passengers. These 350 passengers can be adequately served by the existing customs screening facility, however another flight within this timeframe will require at least one additional baggage carousel to be installed (there is existing space for this additional baggage facility).
International passenger enplanements are expected to grow from 132,946 in the baseline to 318,200 by PAL 4; a growth of approximately 2.4 times baseline. The load factor is expected to stay consistent at 84%.
This high-level analysis presumed two international peak arrivals growing by a factor of 2.4 in PAL 4, which means a peak of five international arrivals can be expected by PAL 4. This high-level analysis also presumed 175 passengers per arriving flight (100% load factor), which means approximately 875 passengers can be expected to arrive in the peak hour by PAL 4.
• CBP will require expanded facilities by PAL 4.
TERMINAL REQUIREMENTS SUMMARY The terminal requirements analysis revealed that the following elements will require some expansion as passenger activity levels increase: aircraft gates, aircraft remain overnight positions, holdroom space, check-in facilities, security screening checkpoints, baggage handling systems, and CBP facilities.
To effectively meet demand and thoughtfully expand terminal facilities, further discussions are required with airlines, TSA, and other stakeholders, to understand priorities and coordinate with their individual planning efforts. Each tenant and agency are constantly evaluating their needs, level of service, and level of investment to meet passenger demand within the confines of existing terminal space. Technology and equipment trends over the years (such as common use terminal equipment and sloped plate baggage conveyors) have focused on fewer staffed ticket counters, more self-service kiosks, and less check-in baggage. Fluidity and flexibility within the terminal environment is essential to incorporating the changes in technology, methodology, and customer trends to deliver the most efficient terminal operation possible. Additional consideration must also be given to events like the 9/11 attacks and the current coronavirus pandemic, which impact space requirements. The coronavirus pandemic is causing not only airports to rethink their operations, but also airport tenants to consider new social distancing measures.

3-36 Draft Master Plan Update Sacramento International Airport
Page Left Blank Intentionally

3-37 Draft Master Plan Update Sacramento International Airport
3.3 GROUND TRANSPORTATION AND PARKING REQUIREMENTS This section summarizes requirements for key on-airport ground access and parking facilities, and describes the assumptions and methodology used to determine these requirements. This chapter addresses facility requirements for public and employee parking, rental car facilities, roadways, and curbsides. Requirements are primarily based on data and observations collected in 2017 and 2018.
Three ground transportation (GT) growth scenarios, prepared for this landside analysis, were considered to develop requirements for each ground access and parking component.
GROUND TRANSPORTATION FORECASTS A comprehensive ground access model was developed to estimate the number of trips that each GT mode generates at the Airport. Initially, demand for all modes were projected for PAL 1 based on three different growth scenarios using baseline (2018) trip totals. Demand for PAL 2, PAL 3, and PAL 4 were increased in proportion to the passenger growth forecast presented in Section 2 - Forecasts. The influence of transportation network companies (TNCs) on the overall mode shares also guided the growth scenarios.
3.3.1.1 GT Growth Scenario 1: Current TNC Growth This scenario assumes that TNCs maintain their mode share of 10.5% in the future, with no significant growth or decline in demand. This implies strong Rent-A-Car (RAC) and parking demand, which represent about 16% and 35.5% of total ground transportation trips, respectively.
3.3.1.2 GT Growth Scenario 2: Moderate TNC Growth This scenario assumes that although TNC growth is gradually levelling off, it still has potential to cut into the market share of other GT modes. Under this growth scenario, demand for parking at SMF decreases to approximately 32% from 35.5%, RAC mode share remains strong at 15%, and Commercial Vehicles (CVs) decline to a 1.8% market share from the current 6.4% market share.
3.3.1.3 GT Growth Scenario 3: High TNC Growth Growth Scenario 3 assumes continued growth of TNCs, reaching the projected mode share of 27.6% at PAL 1 and then increasing in proportion to the growth forecast for passengers. It also assumes that the mode share of private vehicles reaches 40%, growing from its current mode share of 31.5%. At the same time, parking demand in this scenario drops to 27.6%.
Table 3-24 summarizes the forecast for the five major ground transportation modes under three different scenarios.

3-38 Draft Master Plan Update Sacramento International Airport
Table 3-24 Ground Transportation Mode Share under Three Different Growth Scenarios
Modes 2016 2017 GT Scenario 1 GT Scenario 2 GT Scenario 3
Parking 43.4% 39.2% 35.5% 31.8% 27.6%
RACs 19.0% 17.2% 16.1% 15.0% 13.2%
CVs except TNCs 9.6% 8.2% 6.4% 4.6% 3.1%
TNCs 5.1% 8.7% 10.5% 12.4% 16.0%
Private Vehicles 22.9% 26.7% 31.5% 36.2% 40.1%
Source: Sacramento County Department of Airports, 2019
PUBLIC PARKING FACILITIES Future parking requirements are calculated to accommodate the design day parking demand. Typically, a design day is selected that represents approximately 95% of demand on the peak parking days throughout the year. At SMF however, peak demand does not occur on the same day across different parking products, as shown in Table 3-25.
Table 3-25 Occupancy at 5th Busiest Day at Different Parking Products
Year
Hourly B (capacity: 618)
Garage (capacity: 5,255)
Economy (capacity: 6,585)
Daily Lot (capacity: 3,045)
Day Occupancy Day Occupancy Day Occupancy Day Occupancy
2017 11/24 604 10/20 4,547 11/24 6,394 11/24 3,034
2018 11/07 600 11/22 4,814 05/11 6,445 09/29 3,045
Source: Sacramento County Department of Airports, 2019
Consequently, this analysis does not attempt to define one single day as the design day. Instead, it considers the sum of peak demand observed at different facilities (i.e. the 5th busiest day of the year in 2018) to define ultimate parking demand. Occupancy of different parking products (i.e. parking garage, economy parking, hourly B lot, and daily lot) were examined separately. The 5th highest daily occupancy across all parking products was 14,309 in 2018; and the sum of each facility’s individual 5th highest daily occupancy was 14,904. This parking demand was then converted to design day requirements by adding an industry standard 10% buffer of additional spaces to allow customers to find a parking space without undue search time. Figure 3-5 illustrates historical peak occupancies at SMF by different parking products.

3-39 Draft Master Plan Update Sacramento International Airport
Figure 3-5 Observed Peak Occupancies at Individual Parking Facilities (2017–2018)
Source: Sacramento County Department of Airports, 2019
3.3.2.1 Parking Demand and Parking Requirements
Future parking demand, presented in Table 3-26, is projected based on Growth Scenario 2, assuming moderate TNC growth cutting into the parking mode share, reducing it from 35.5% to 31.8%. The total parking demand is assumed to increase in proportion to the growth of originating passengers following the baseline aviation forecast. Table 3-26 presents the total public parking demands (i.e. estimated annual transactions) at SMF for different PALs.
Table 3- 26 Projected Total Public Parking Demand
Annual Transactions
Baseline (2018) PAL 1 (2023) PAL 2 (2028) PAL 3 (2033) PAL 4 (2038)
1,899,773 2,075,154 2,312,510 2,581,070 2,868,251
Source: Jacobsen|Daniels, 2020
Parking facility needs were first estimated to accommodate future demand. Facility requirements (i.e. surplus/deficit) were calculated by subtracting existing capacity. Facility needs for individual parking products in different PALs were estimated by growing the respective fifth busiest occupancy in proportion to the parking demand (Table 3-27).
0
2,000
4,000
6,000
8,000
10,000
12,000
14,000
16,000
18,000
Park
ing
Occ
upan
cy
ECONOMY GARAGE DAILY LOT HOURLY B

3-40 Draft Master Plan Update Sacramento International Airport
Table 3-27 Estimated Public Parking Facility Needs
Parking Products
Baseline (2018) Estimated Peak Daily Demand
Capacity Design Day Peak Demand /1
PAL 1 (2023)
PAL 2 (2028)
PAL 3 (2033)
PAL (2038)
Garage 5,255 4,814 5,258 5,860 6,540 7,268
Hourly B 618 600 655 730 815 906
Daily Lot 3,052 3,045 3,326 3,707 4,137 4,597
Economy 6,585 6,445 7,040 7,845 8,756 9,731
NOTE: 1/ 5th busiest or 5th high occupancy day was considered as the design day.
Source: Jacobsen|Daniels, 2020
Figure 3-6 summarizes total public parking demand at SMF showing the current capacity (dashed lines represent capacity) as well as future needs for close-in and remote parking facilities. While close-in facilities refer to any parking products where customers typically walk to/from a terminal, which is approximately 1,000 feet from a terminal, remote facilities require shuttle service to transport customers to/from a terminal. The Garage, Hourly B Lot, and half of the Daily Lot (closest to the garage) are close-in parking facilities. The economy lot and remaining portion of the Daily Lot serve as remote parking facilities where customers typically park for longer durations.
Figure 3-6 also depicts a growing parking demand at SMF. Estimated demand is projected to increase by approximately 10%, 25%, and 41% in PAL 1, PAL 2, and PAL 3 respectively, compared against 16,394 total parking spaces during the peak period in the baseline (2018). Total public parking demand is projected to grow as high as 24,572 total parking spaces by PAL 4. Public parking demand is assumed to grow in proportion to passenger growth under the baseline forecast, considering a mode share cut due to moderate TNC growth.
Figure 3-6 Estimated Public Parking Needs in Different PALs
Source: Jacobsen|Daniels, 2020

3-41 Draft Master Plan Update Sacramento International Airport
There are currently 7,399 close-in parking spaces to support a peak demand for 7,630 close-in spaces in 2018, and 8,108 remote parking spaces to support a peak demand for 8,764 remote spaces in the 2018 baseline forecast with moderate TNC growth. These deficits in public parking capacity continue to develop, with total deficits reaching 9,246 spaces by PAL 4 (Table 3-28).
Table 3-28 Public Parking Deficiencies in Different PALs
Baseline (2018) PAL 1 (2023) PAL 2 (2028) PAL 3 (2033) PAL 4 (2038)
Deficit
Close-in 231 936 1,889 2,967 4,121
Remote 657 1,466 2,561 3,800 5,125
Total Deficit 888 2,564 2,401 4,450 9,246
Source: Jacobsen|Daniels, 2020
RENTAL CAR FACILITIES REQUIREMENTS Requirements for a Consolidated Rental Car facility (ConRAC) were developed using facility utilization rates based on the 15th highest hourly transactions of rental and return. A questionnaire was provided to RAC industry personnel for entering hourly transactions of the previous calendar year (2018). The questionnaire also asked for hourly transaction information, average service time, as well as the size and configuration of existing facilities. Each of the nine rental car companies completed and returned the questionnaire. Data from the questionnaire was then used to estimate facility needs. These baseline needs were then projected for PAL 1 using GT Growth Scenario 2 (presented in Table 3-24) and increased in proportion to the passenger enplanement forecast (presented in Section 2 – Forecasts), to estimate the facility requirements for different PALs. Figure 3-7 depicts an hourly rentals and returns comparison between the average transactions during the peak month (September) and the highest rental and return transactions.
Figure 3-7 Hourly Rental and Return Transactions at SMF
Source: Sacramento County Department of Airports (SCDA), 2019
3.3.3.1 Customer Service Building The customer service building (CSB) is used to process rental car transactions of arriving customers. The average time to process customer transactions at the counter during the peak rental hour primarily determines the number of counter positions required. This, along with the percentage of customers that bypass the counter, determines the space required for a customer service area. The following formula is used to calculate the customer service area:
• 15th Highest (Peak) Rental Hour × Avg. trxns. time × (1 – % of Customer bypass counter) = Rental Counters Required
0100200300400500
0:00
2:00
4:00
6:00
8:00
10:0
0
12:0
0
14:0
0
16:0
0
18:0
0
20:0
0
22:0
0
Rent
als #
(a) Hourly Rental Transactions
Peak Month Avg. Rentals Highest Rentals15th Highest Rentals
0
100
200
300
0:00
2:00
4:00
6:00
8:00
10:0
0
12:0
0
14:0
0
16:0
0
18:0
0
20:0
0
22:0
0
Retu
rns #
(b) Hourly Return Transactions
Peak Month Avg. Returns Highest Returns

3-42 Draft Master Plan Update Sacramento International Airport
According to the aggregate questionnaire results, 34 regular counter positions are required to process peak hour rentals across the different brands, while approximately 40% of the customers are assumed to bypass the counter areas and proceed directly to the vehicle area. The CSB is estimated to require 22,500 sq.ft. by PAL 4, which includes CSB counters, RAC administration space, lobby space, and circulation space.
Questionnaire results also show that the average time to process customer transactions at the counter during the peak rental hour is approximately six minutes (which translates to ten transactions per hour). Table 3-29 presents the customer service counter facility requirements for baseline (2018) through PAL 4.
Table 3-29 Customer Service Area Requirements
Customer Service Area Components
Baseline (2018)
PAL 1 (2023)
PAL 2 (2028)
PAL 3 (2033)
PAL 4 (2038)
qty sq ft qty sq ft qty sq ft qty sq ft qty sq ft
CSB Queue/Counter (120 sq ft per counter)
34 4,080 37 4,440 42 5,040 45 5,400 50 6,000
RAC Admin Space (150 sq ft per counter)
5,100 5,550 6,300 6,750 7,500
CSB Lobby Space (90 sq ft per counter)
3,060 3,330 3,780 4,050 4,500
Subtotal sq. ft. 12,240 13,320 15,120 16,200 18,000
Circulation (25% of subtotal sq ft)
3,060 3,330 3,780 4,050 4,500
Total sq. ft. 15,300 16,650 18,900 20,250 22,500
Source: Jacobsen|Daniels, 2020
3.3.3.2 ConRAC Garage The Garage is the primary facility of a ConRAC, and is comprised of five elements:
• Ready spaces: Spaces where vehicles are parked prior to being rented by customers in a parking bay configuration
• Return spaces: Spaces where vehicles are returned by customers in a nose-to-tail parking configuration
• Flex spaces: Spaces that can be used for either ready or return operations and include pavement striping for both
• Customer service booths: Transaction booths in the ConRAC Garage for premium customers who bypass CSB counters
• Exit plaza: Security booth where all customers with rented vehicles leave the garage
Rental car companies prefer to have additional ready spaces and cars available to accommodate excess demand beyond the anticipated hourly transactions. Excess demand can arise from unplanned operational challenges, such as delayed flights. When flights are delayed, the number of vehicles expected to be rented by delayed customers adds to the next hour's expected transactions. To deal with such events, rental car companies prefer additional capacity for both ready and return spaces. At similar airports to SMF, an average of two hours of ready car capacity and 1.5 hours of return capacity are used to develop the facility requirements to accommodate peak period demand, which is in this case, the 15th highest rental/return hour. ConRAC garage facility requirements are calculated using the following formulas:

3-43 Draft Master Plan Update Sacramento International Airport
• 15th Highest (Peak) Rental Hour × 2 Ready spaces each = Ready Spaces
• 15th Highest (Peak) Return Hour × 1.5 Return spaces each = Return Spaces
• 15th Highest (Peak) Rental Hour × Average transactions time = Exit Booths
Table 3-30 summarizes the facility requirements for baseline (2018) through PAL 4 demand.
Table 3-30 ConRAC Garage Requirements
ConRAC Garage Components
Baseline (2018)
PAL 1 (2023)
PAL 2 (2028)
PAL 3 (2033)
PAL 4 (2038)
qty sq ft qty sq ft qty sq ft qty sq ft qty sq ft
Ready Spaces (345 sq ft per space)
894 308,430 1,022 352,590 1,139 392,955 1,270 438,150 1,410 486,450
Return Spaces (270 sq ft per space)
576 155,520 656 177,120 732 197,640 815 220,050 905 244,350
Customer Service Booths (600 sq ft per booth)
10 6,000 10 6,000 10 6,000 10 6,000 10 6,000
Exit Booths (1,000 sq ft per booth) 18 18,000 19 19,000 20 20,000 21 21,000 24 24,000
Exit Booth Queue Area (2,750 sq ft per booth)
49,500 52,250 55,000 57,750 66,000
Subtotal sq. ft. 537,450 606,960 671,595 742,950 826,800
Circulation (20% of subtotal sq ft)
97,590 110,942 123,319 137,040 152,160
Total sq. ft. 635,040 717,902 794,914 879,990 978,960
Source: Jacobsen|Daniels, 2020
3.3.3.3 Quick Turnaround Area The Quick Turnaround Area (QTA) is a separate facility that supports fueling, vacuuming, washing, and light maintenance of rental cars. It is comprised of four parts:
• Wash bays: Drive through car wash facilities used by RAC employees to wash returned vehicles
• Fuel/vacuum stations: Dedicated fuel pumps and vacuums used by RAC employees to refuel and clean vehicles
• Maintenance bays: Vehicle servicing sites for mechanics to perform light maintenance (oil changes and tire rotation)
• Staging spaces: Used to park returned vehicles waiting for a car wash/vacuum. Ready vehicles can also be parked in staging spaces after being processed through the QTA and before being returned to the ready area
The number of fuel/vacuum nozzles required to service peak hour demand is estimated based on the average processing time. The average time to process a car at a fuel/vacuum position includes the dwell time until a position is available for the next vehicle. The utilization rate, or number of vehicles that can be processed per hour and per nozzle, is calculated by dividing the number of return transactions in the peak hour by the average service time. The following formulas illustrate the methodology used for these calculations:
• 15th Highest Return Hour ÷16 hours/operating day × Avg. process time = Fuel/Vac/Wash positions

3-44 Draft Master Plan Update Sacramento International Airport
• 15th Highest Return Hour ÷16 hours/operating day × Avg. repair time = Maintenance bays
• Fuel / Vac Positions × Number of Cars processed per hour = Quick Turnaround Spaces
Table 3-31 summarizes the QTA facility requirements for baseline (2018) through PAL 4.
Table 3-31 Facility Requirements of the Quick Turnaround Area
Quick Turnaround Area Components
Baseline (2018)
PAL 1 (2023)
PAL 2 (2028)
PAL 3 (2033)
PAL 4 (2038)
qty sq ft qty sq ft qty sq ft qty sq ft qty sq ft
Fueling/Vac Positions (500 sq ft per position)
57 28,500 65 32,500 72 36,000 80 40,000 89 44,500
Wash Bays (2,000 sq ft per bay)
12 24,000 12 24,000 14 28,000 15 30,000 17 34,000
Maintenance Bays (1,000 sq ft per bay)
20 20,000 21 21,000 24 24,000 26 26,000 30 30,000
QTA Spaces (200 sq ft per space) 256 51,200 292 58,400 322 64,400 358 71,600 398 79,600
QTA Admin Support (175 sq ft per fuel/vac position)
9,975 11,375 12,600 14,000 15,575
QTA Storage (75 sq ft per position)
4,275 4,875 5,400 6,000 6,675
QTA Circulation around Fuel/CW/Admin
65,681 71,531 80,650 88,500 99,081
QTA Perimeter Circulation 101,816 111,841 125,525 138,050 154,716
Total sq. ft. 305,447 335,522 376,575 414,150 464,147
Source: Jacobsen|Daniels, 2020
3.3.3.4 Additional Storage/ConRAC Employee Parking Rental car companies use the vehicle storage area (overflow parking) to store vehicles away from the ConRAC Garage and QTA. Dedicated parking for rental car employees is ideally provided adjacent to QTA and requires access controls.
Additional storage is calculated by subtracting total ready/return and QTA spaces from the peak idle fleet. Peak idle fleet numbers were reported by each rental car brand that observed a single highest peak idle event, unless impacted by an anomaly such as a major tourist or weather event. Current rental car facility employee parking needs were also reported by each rental car company and then increased by 5% incrementally for each PAL.
Table 3-32 summarizes the additional storage and rental car facility employee parking requirements for the baseline (2018) year through PAL 4.

3-45 Draft Master Plan Update Sacramento International Airport
Table 3-32 Additional Storage and ConRAC Employee Parking Requirements
Additional Storage and Employee Parking
Baseline (2018)
PAL 1 (2023)
PAL 2 (2028)
PAL 3 (2033)
PAL 4 (2038)
qty sq ft qty sq ft qty sq ft qty sq ft qty sq ft
Overflow Storage (200 sq ft per storage)
3,956 791,177 4,491 898,143 5,011 1,002,172 5,595 1,119,077 6,217 1,243,485
Employee Parking (345 sq ft per space)
395 136,275 415 143,089 435 149,903 454 156,716 474 163,530
Total sq. ft. 927,452 1,041,232 1,152,074 1,275,793 1,407,015
Source: Jacobsen|Daniels, 2020
EMPLOYEE PARKING As described in Section 1 - Inventory, the SCDA provides parking for Airport and tenant employees in eight parking facilities throughout the terminal area with a total capacity of 1,784 spaces.
Typically, airport employment grows at a lower rate than air carrier operations forecasts. If employee parking demand grows at half of the rate of forecast air carrier operations, or 1.0% over 20 years, and it is assumed that facilities are relatively full in the baseline, then employee parking need will grow by approximately 400 spaces to a total requirement of approximately 2,175 (Table 3-33). This analysis also assumes that individual tenants will continue to provide parking for their employees on their respective lease sites.
Table 3-33 Employee Parking Requirements
Base
(2018) PAL1 PAL2 PAL3 PAL4
AAGR
(2018-2038)
Air Carrier Operations 118,863 129,333 142,002 156,190 171,087 2%
Employee Parking Demand 1,784 1,875 1,971 2,071 2,175 1%
Source: Jacobsen|Daniels, 2020
ROADWAYS
3.3.5.1 On-Airport Roadway requirements are determined using observed or estimated peak hour traffic volumes to and from key traffic generators in the terminal core. Future volumes are estimated using anticipated growth in enplanements. Future needs are refined in the alternatives analysis when the location of significant traffic generators such as parking garages or rental car facilities change.
The peak-hour volumes are compared to roadway capacity, calculated using roadway speeds and number of lanes, assuming a desired LOS “C”, and applying the highway capacity manual methods shown in Figure 3-8. For example, many of the airport roadways analyzed feature two lanes and speed limits of 35 mph. According to Figure 3-8, a 35-mph roadway performing at LOS “C” has a capacity of approximately 900 vehicles per hour, per lane, or 1,800 vehicles per hour on the roadway.

3-46 Draft Master Plan Update Sacramento International Airport
Figure 3-8 Highway Capacity Manual Roadway Capacity
Source: Highway Capacity Manual
A comparison of existing and future roadway volumes to calculated roadway capacities is achieved through a volume to capacity ratio (V/C). Traffic engineering principles generally dictate that when a roadway V/C ratio reaches 0.7, the roadway should be considered for additional lanes, and when V/C reaches 0.9, the roadway fails to perform its function.
Figure 3-9 shows the on-airport traffic generators considered in the roadway capacity analysis, along with the numbered and highlighted roadway links that were evaluated.
Figure 3-9 Traffic Generators and Roadway Links
Source: Jacobsen|Daniels, 2020
Peak-hour roadway volumes are calculated under baseline and future conditions using the ground access model described in Section 1 – Inventory, supplemented with peak-hour transaction activity for rental car and parking facilities. The generators were compared to total airport and entry traffic counted in a one-day traffic count on

3-47 Draft Master Plan Update Sacramento International Airport
April 13, 2018, which showed approximately 1,650 vehicles entering and 1,560 vehicles exiting SMF in the peak hour. For future planning activity levels, peak-hour volumes are escalated similarly to enplanement growth, with no shift to other ground access modes applied. Sensitivity testing to mode shift was considered, but was not determined to significantly impact the final results of this analysis. Table 3-34 shows the peak-hour entry and exit volumes used for each of the traffic generators.
Table 3-34 Peak-Hour Traffic Generation
Facility
Entries Exits
Baseline PAL 2 PAL 4 Baseline PAL 2 PAL 4
Terminal A Garage 207 265 338 198 253 323
Curb #1 – Terminal A Private 319 408 519 227 291 370
Curb #2 – Terminal A Commercial Vehicles
30 38 49
Daily Lot 69 88 112 66 84 107
GTC TA 106 136 173
GTC TB 159 204 259
East Economy Lot 89 114 145 85 109 139
RAC 247 316 403 235 301 383
Employee Parking 35 45 57 35 45 57
Curbs #3-6 – Terminal B Arrivals 523 669 852 341 436 555
Hourly B Lot 131 168 213 125 160 204
West Economy Lot / Cell Phone Lot 26 33 43 25 32 41
Source: Jacobsen|Daniels, 2020
Table 3-35 summarizes the peak hour volumes, roadway speed, number of lanes, calculated roadway capacity, and volume to capacity ratio under baseline and future conditions.

3-48 Draft Master Plan Update Sacramento International Airport
Table 3-35 Roadway Capacity Summary
Link
s
Lane
s
Spee
d
Cap
acity
Baseline PAL 2 PAL 4
Peak
Hr
Volu
me
Demand/ Capacity Ratio
Peak
Hr
Volu
me
Demand/Capacity Ratio
Peak
Hr
Volu
me
Demand/Capacity Ratio
1 2 35 1,800 1,350 0.75 1,728 0.96 2,201 1.22
2 1 35 900 325 0.36 416 0.46 530 0.59
3 2 35 1,800 1,675 0.93 2,144 1.19 2,730 1.52
4 2 35 1,800 663 0.37 848 0.47 1,080 0.60
5 2 25 1,400 680 0.49 870 0.62 1,108 0.79
6 2 35 1,800 973 0.54 1,245 0.69 1,585 0.88
7 2 35 1,800 284 0.16 364 0.20 464 0.26
8 3 35 2,700 1,602 0.59 2,051 0.76 2,611 0.97
9 2 25 1,400 1,337 0.96 1,712 1.22 2,180 1.56
10 1 35 900 265 0.29 339 0.38 432 0.48
11 1 35 900 26 0.03 33 0.04 43 0.05
12 1 35 900 25 0.03 32 0.04 41 0.05
13 1 35 900 333 0.37 426 0.47 542 0.60
14 1 25 700 320 0.46 410 0.59 522 0.75
Source: Jacobsen|Daniels, 2020
Table 3-35 indicates that the primary airport entry and exit roadways generally do not have sufficient capacity to accommodate future demand, and will likely need to be expanded.
Note that there may be other minor generators of traffic such as personnel working in the public safety building, fixed base operator (FBO), ATCT, shuttle bus maintenance facility, and other facilities that are not considered in this analysis. However, since the trip generation is aligned with observed total traffic volumes, the conclusions from this analysis are directionally useful.
CURBSIDES
3.3.6.1 Curbside Requirements Methodology The curbside portion of the terminal roadways, where the primary pickup and drop-off functions are accommodated, is often the most constrained element of Airport roadway operations. For this analysis, the curbside roadways are divided into separate facilities according to:
• Passenger Terminal (A or B) • Whether users are predominantly dropping off, picking up, or a mix of both operations

3-49 Draft Master Plan Update Sacramento International Airport
• Whether users are private vehicles, commercial vehicles, airport shuttles, or a mix of multiple user types
Curbside length requirements are determined based on the peak-hour or design hour volumes of vehicles observed on the curbside and then compared to existing facility size to determine future need.
3.3.6.2 Design Hour Volumes and Assumptions Volumes are determined using a combination of (percentage) mode splits from the ground access model along with limited traffic count and vehicle classification counts from prior planning efforts. Curbside roadway volumes are also referenced from the roadway analysis in the previous section.
Prior planning efforts conducted limited traffic volume counts in 2018 and a one-day vehicle classification count with dwell time survey on April 13, 2018. The volumes observed on that day are similar to those calculated using the ground access model and origin-destination methodology in Section 3.3.1.
The two-hour dwell time survey that was conducted was not performed during the peak hour of curbside activity, and therefore does not represent accurate peak-hour dwell times. Instead, dwell time assumptions were applied from ACRP Report 40, Airport Curbside and Terminal Area Roadway Operations, which recommends three minutes of dwell time per drop-off operation and four minutes per pickup operation, with an additional minute for multi-passenger shuttles.
The required curbside space is calculated using the equation below:
𝐶𝐶𝐶𝐶𝐶𝐶𝐶𝐶𝐶𝐶𝐶𝐶𝐶𝐶𝐶𝐶 𝑆𝑆𝐵𝐵𝑆𝑆𝑆𝑆𝐶𝐶𝐶𝐶 𝑅𝑅𝐶𝐶𝑅𝑅𝐶𝐶𝐶𝐶𝐶𝐶𝐶𝐶𝐶𝐶 = 𝐷𝐷𝐶𝐶𝐶𝐶𝐶𝐶𝐷𝐷𝐷𝐷 𝐵𝐵𝐻𝐻𝐶𝐶𝐶𝐶 𝑉𝑉𝐻𝐻𝑉𝑉𝐶𝐶𝑉𝑉𝐶𝐶(𝐷𝐷𝑤𝑤𝐶𝐶𝑉𝑉𝑉𝑉 𝑃𝑃𝐶𝐶𝑉𝑉𝐶𝐶 𝐶𝐶𝐷𝐷 𝑉𝑉𝐶𝐶𝐷𝐷)
60∗ 𝑃𝑃𝐶𝐶𝑆𝑆𝑃𝑃 𝑆𝑆𝑆𝑆𝑃𝑃𝐶𝐶𝑎𝑎𝐶𝐶𝑃𝑃𝑎𝑎 𝑓𝑓𝑆𝑆𝑆𝑆𝑃𝑃𝐻𝐻𝐶𝐶
The number of curbside loading spaces is multiplied by a typical vehicle length of 25 feet for private vehicle and TNCs and 40 feet for buses and larger shuttles.
3.3.6.3 Curbsides Requirements Table 3-36 shows the required curbside length in the baseline year and for future planning activity levels. Based on this analysis, the existing total airport curbside roadway capacity is adequate through PAL 3, but capacity at each terminal or at specific curbsides may not be sufficient.

3-50 Draft Master Plan Update Sacramento International Airport
Table 3-36 Curbside Capacity Summary
Baseline PAL 1 PAL 2 PAL 3 PAL 4
Curbside Existing Curb length
Hourly Volume
Curbside Required
(ft)
Hourly Volume
Curbside Required
(ft)
Hourly Volume
Curbside Required
(ft)
Hourly Volume
Curbside Required
(ft)
Hourly Volume
Curbside Required
(ft)
TA Inner 825 425 725 524 875 583 950 651 1,075 724 1,150 TA Outer 825 50 240 62 240 69 240 77 320 85 320 TA GTC 1,000 106 360 131 420 146 450 162 510 180 540 Terminal A Subtotal 2,650 581 1,325 716 1,535 798 1,640 890 1,905 989 2,010 TB Upper West 425 278 500 342 600 382 650 426 725 473 800 TB Upper East 425 228 425 281 500 313 575 349 600 388 650 TB Lower West 425 196 475 241 575 269 625 300 700 334 750 TB Lower West CVs 500 51 200 63 225 70 250 78 300 87 300 TB Lower East 425 157 375 193 475 216 500 241 575 267 625 TB Lower East (Shuttles) 425 36 200 44 240 49 240 55 320 61 320 TB GTC (TNC Only) 600 159 325 196 375 218 425 244 450 271 500 Terminal B Subtotal 3,225 1,105 2,500 1,361 2,990 1,517 3,265 1,693 3,670 1,882 3,945 Airport Total 5,875 1,686 3,825 2,077 4,525 2,315 4,905 2,583 5,575 2,871 5,955
Source: Jacobsen|Daniels, 2020
The upper level curbside at Terminal B appears to be capacity constrained on the west side in the baseline year and on both east and west sides by PAL 1. However, various operational measures could be employed to increase throughput capacity, reducing the need for new curbside facilities including:
• Providing alternate drop-off locations for TNCs • Enforcing shorter drop-off times and reducing average dwell times • Balancing airline check-in operations between Terminal B east and west
One facility-based solution to providing alternate drop-off and pickup locations is constructing a new consolidated ground transportation center (GTC), which would offer customer service benefits and efficiencies for ground transportation operations.

3-51 Draft Master Plan Update Sacramento International Airport
3.4 AIR CARGO REQUIREMENTS To analyze the air cargo requirements at SMF, it is necessary to understand the airport system plan that the County of Sacramento has adopted for its four airports (Sacramento International, Mather Airport, Executive Airport, and Franklin Field). The system plan identifies Mather Airport as a general aviation and cargo reliever to SMF. Even with this relationship, it is still expected that a certain segment of the region’s air cargo demand will continue to be processed at SMF.
Producers of time-sensitive items that are located in the Yolo area of the I-5 corridor and along the Roseville and Rocklin area of the I-80 corridor find that SMF is more conveniently located for their overnight shipments. The all-cargo carriers, therefore, may decide to continue operations at SMF for business reasons. The passenger air carriers serving SMF will also continue to carry a portion of the region’s cargo as belly freight.
This analysis presents the requirements that will be necessary to accommodate the cargo volumes that are forecast for SMF. It is important for the SCDA to monitor the growth in air cargo at the Airport and to revise its requirements as necessary, depending on any acceleration or deceleration in the rate of growth and the ability of Mather Airport to fulfill its reliever role.
FACILITIES Historic air cargo industry trends indicate that due to cargo carrier schedules (peaking), handling techniques, containerization rates, share of connecting cargo, and local factors, a range of 1.0 to 2.0 square feet per annual enplaned ton is considered adequate for cargo buildings that support cargo operations at small- to medium-sized airports. However, this facility sizing equation has recently been proven inadequate for addressing new trends in the air cargo industry. For the foreseeable future, design of air cargo facilities should provide a large degree of flexibility, recognizing that the industry is subject to large changes in both traffic and technology. A major force in this change is the recent increasing demand for short term shipping from online retailers. It is anticipated that as one-day and same-day shipping becomes a greater expectation from online retail customers that the space requirements for air cargo facilities will increase.
Due to these trends, it is recommended that airports consider a higher cargo facility square footage for warehousing space and flexibility to increase the availability of aircraft parking, warehousing, and sort equipment. It is recommended that the average building range of 3.0 to 4.0 square feet per annual enplaned ton be utilized for long-range cargo planning purposes at the Airport. These metrics are consistent with those recommended by cargo carriers at the Airport. Conversations with cargo operators indicate a strong cargo growth scenario expected across the industry, implying a need for additional space and an update to typically used metrics during cargo facility planning. The projected activity at SMF supports the high-growth scenario cargo forecast presented in Section 2 – Forecasts when determining future cargo facility needs.
FORECAST DEMAND As presented in Section 2 – Forecasts, the total air freight tonnage is projected to increase from 109,197 tons in the baseline (2018) to 296,296 tons in PAL 4 (2038) with an annual growth rate of 5.1% (high growth scenario). Due to the variable future of air cargo, this analysis uses a ratio of 3.5 square feet per annual enplaned ton of cargo to estimate facility requirements. Based on this ratio, the estimated cargo volume for PAL 4 will require a warehouse capacity of approximately 1,037,036 square feet. Assuming that no additional air cargo carriers move to Mather Airport, the capacity of the Airport’s cargo warehouse space will need to be increased significantly by PAL 4.

3-52 Draft Master Plan Update Sacramento International Airport
REQUIREMENTS
3.4.3.1 Cargo Building Requirements Using the metric of 3.5 square feet per annual enplaned ton of cargo, the estimated cargo volume for PAL 4 will require warehouse capacity of approximately 1,037,036 square feet. Actual space requirements will depend primarily on the needs of individual carriers using the cargo facilities at the Airport and the type of cargo they process. For example, the express integrator carriers process time sensitive express freight, which is usually transported in full container loads passing through highly automated facilities. In contrast, passenger carrier belly hold cargo typically moves in smaller lot sizes and in break-bulk form, requiring more storage space per annual ton.
The degree of automation planned for a particular facility also affects warehouse space requirements. At many airports, cargo warehouses have become storage facilities because of the inability to process and distribute cargo in a timely manner. The majority of air cargo shipment time is spent in various ground systems (e.g., trucks).
The projected air cargo building space requirements for the Airport are shown in Table 3-37.
Table 3-37 Air Cargo Building Requirements (High Growth Scenario)
Year Annual Enplaned Cargo
(tons)
Building Requirements
(sq. ft.)
PAL 1 (2023) 153,155 536,043
PAL 2 (2028) 200,167 700,585
PAL 3 (2033) 243,534 852,369
PAL 4 (2038) 296,296 1,037,036
Source: Sacramento County Department of Airports, 2019
3.4.3.2 Cargo Ramp Requirements An air cargo apron must be sized to accommodate peak demand. The existing air cargo aprons are in two locations: 1) the northern apron, which is 600 feet in length, and 2) the southern apron, which is 500 feet in length.
Based on discussions with cargo operators, to meet future demand, a cargo apron should accommodate up to seventeen B-767F aircraft during a peak period. A B-767F is a typical air cargo aircraft and has a wingtip to wingtip width of 156 feet (Figure 3-11). ACRP Report 96, Apron Planning and Design Guidebook, defines the dimensional factors most relevant to the planning and design of apron facilities:
• Wingspan: 156 feet for a B-767F aircraft (ADG IV)
• Clearance between the front of a parked aircraft and a building face to accommodate tug maneuvering or cargo nose loading in front of the aircraft: 20 feet nose-to-building distances of for ADG IV aircraft
• Separation between the wingtips of aircraft, as well as between wingtips and any fixed or movable object: 25 feet for ADG IV aircraft
• 5 feet of clearance between the wingtip of a parked aircraft and the edge of a marked service road
• Taxiway centerline to fixed or movable object for ADG IV: 130 feet
• Taxilane centerline to fixed or movable object for ADG IV: 113 feet

3-53 Draft Master Plan Update Sacramento International Airport
Considering these design guidelines, one B-767F requires a ramp width of approximately 206 feet. To accommodate seventeen B-767F aircraft, the required length of apron space is approximately 3,500 feet. A general apron layout is shown in Figure 3-10.
With a tail height of 52 feet, the B-767F can be parked no closer than 955 feet from the centerline of Runway 16R/34L. The existing cargo apron areas are capable of accommodating this spacing requirement; however, to accommodate future air cargo aircraft parking positions, alternative sites should be evaluated.
The importance of adequate air cargo apron space directly adjacent to the face of an air cargo building cannot be overemphasized. For marketability and operational efficiency, this air cargo facility design parameter is considered the primary factor used by air cargo operators when leasing space.
Figure 3-10 General Cargo Apron Layout
Sources: Dimensions from ACRP Report 96, Apron Planning and Design Guidebook; Drawing by Jacobsen|Daniels

3-54 Draft Master Plan Update Sacramento International Airport
Figure 3-11 Boeing 767F Dimensions
Sources: Boeing 747-400 Airplane Characteristics for Airport Planning

3-55 Draft Master Plan Update Sacramento International Airport
3.5 GENERAL AVIATION REQUIREMENTS This section summarizes general aviation facility requirements at SMF. GA activity includes all flight operations by aircraft other than scheduled or charter passenger aircraft and military aircraft. GA covers a range of activity from recreational flights on small single-engine or multi-engine propeller-driven aircraft, to operations by larger corporate or business jet aircraft. GA facility requirements, expressed in terms of total land area, were developed considering the activity forecasts in Section 2 - Forecasts, current leases, discussions with the FBO and other GA operators, and SCDA policies.
As part of the system of airports operated by Sacramento County, the Airport’s role is accommodating the region’s commercial passenger travel, but SMF is also committed to accommodating GA activity at the Airport. Facilities and services for corporate and turbine GA aircraft are analyzed in the sections below.
FACILITIES The GA facilities at the Airport are described in Section 1 – Inventory. While GA facilities at the Airport include the Textron Aviation Sacramento Service Center, and a corporate hangar, the Airport’s FBO, SACjet, handles the majority of local and itinerant GA traffic.
SACjet occupies a site that consists of a 40,000-square-foot hangar used for aircraft storage and maintenance and a 6,500-square-foot building that accommodates the FBO’s administrative offices, a pilots’ lounge, and other crew and passenger amenities. SACjet also operates and maintains an additional 12,000 square feet of hangar space and 15,000 square feet of apron space west of the FAA Flight Inspection Field Office hangar. The SACjet apron encompasses 340,000 square feet and can accommodate aircraft weighing up to 320,000 pounds.
FORECAST DEMAND The total number of general aviation operations at the Airport is forecast to increase an average of 0.3% per year from the baseline in 2018 (8,881 operations) through 2038 (9,429 operations). Operations of GA aircraft are categorized as local or itinerant. Local operations are flights that operate within visual range or close to an airport. Itinerant operations include those flights that leave an airport destined for another airport and require the filing of flight plans with the local air traffic control authorities. As per the forecast in Section 2, itinerant operations are forecast to grow from 6,820 in 2018 to 6,885 in 2038. Local operations are forecast to grow from 2,061 in 2018 to 2,404 in 2038. Eighteen aircraft are based at the Airport. This number is forecast to remain unchanged through PAL 4.
REQUIREMENTS As described in the FBO Lease and Development Agreement, a multi-phase expansion of the GA area at the Airport has been planned. The FBO development includes the facility needs of other GA operators on the airfield. The total land area identified for all phases of the planned expansion—including the existing site—is 1,280,000 square feet, or approximately 30 acres. Subtracting the size of the existing GA facilities, which encompasses approximately 8 acres, leaves an additional planned expansion of 22 acres. Consultation with SCDA and representatives from SACjet indicates that the planned expansion of the GA site is sufficient to accommodate forecast GA demand through PAL 4.
Discussions with SACjet revealed an operational deficiency related to aircraft access to the GA apron and with the apron load. Specifically, Taxiways G1 and G2—the access taxiways to the GA apron—are limited in the gross aircraft load the pavement can accommodate. These taxiways are also unable to accommodate aircraft with wingspans greater than 118 feet. A recommendation for addressing this deficiency is described in Section

3-56 Draft Master Plan Update Sacramento International Airport
2.5. While the GA apron is designed to accommodate typical GA aircraft on a regular basis, larger charter aircraft sometimes use FBO services. Regular use of larger aircraft, such as the Boeing 757, will cause the GA apron pavement to deteriote faster. The GA apron load deficiency should be addressed if larger aircraft start to use the apron and FBO more frequently in future years.
Textron continues to see a need for an aircraft maintenance facility supporting Textron Aviation products. In discussions for this master plan update, Textron has stated that while there are no defined plans regarding increasing building size or leasing additional facilities in the near term, needs may change over time as new Textron Aviation products are introduced to the market.

3-57 Draft Master Plan Update Sacramento International Airport
3.6 AIRLINE SUPPORT REQUIREMENTS This section analyzes the future growth of airline support facilities at the Airport. The requirements for each support facility area were based on discussions with SCDA staff, discussions with support facility operators, and examining forecast activity at the Airport.
FUEL STORAGE The Airport’s fuel farm is northeast of the aircraft rescue and firefighting (ARFF) station, on the east side of Earhart Drive. The fuel farm is supplied with a 12-inch-diameter pipeline owned and operated by Wickland Oil Company, and is connected to the Kinder Morgan pipeline in the City of West Sacramento.
The fuel farm includes one horizontal 2,000-gallon waste fuel storage tank, one self-contained 12,000‑gallon AvGas storage tank, and three vertical 1,764,000-gallon jet fuel storage tanks. Jet fuel is stored “in series,” meaning that fuel is received in the first tank for initial filtering, then moved to the second tank for additional filtering, and then finally dispensed to aircraft fueling trucks from the third tank. A 10-inch underground loop fuel delivery system around Concourse B with in-ground fuel pits at each gate has been constructed but is not in use because a connection to the fuel farm has not yet been installed. This connection and next phase of the concourse fueling system is intended to be implemented as part of a concourse expansion project.
The fuel farm is owned by an airline consortium led by Southwest Airlines and is operated by Allied Aviation under contract with Southwest.
Requirements were based on an analysis of historical fuel flow and aircraft operations data for 2018, shown in Table 3-38, and the following planning guidelines and assumptions:
• In July, 9,078,172 gallons of jet fuel was dispensed from the fuel farm for 5,435 aircraft departures. This equates to roughly 175 daily aircraft departures using 1,670 gallons of jet fuel per departure.
• Jet fuel reserves, in days’ supply, were estimated by dividing the net usable storage capacity by the average daily fuel dispensed at the Airport in this peak month. The net usable storage capacity was assumed to be 90% of the gross storage capacity of the tanks, equaling 4,762,800 gallons. The fuel farm had 16 days of fuel storage capacity in July 2018.
• At present, approximately 5,292,000 gallons (gross storage capacity) of jet fuel are stored on a 1.7-acre site that includes areas for storage tanks as well as facilities to support the fueling operation. This equates to a planning factor of 0.014 square feet of land required per gallon of storage, assumed to remain constant over the planning period.
• Future jet fuel requirements were projected by determining the product of three factors: forecast ADPM airline departures, average jet fuel dispensed per aircraft departure in the peak month, and the number of days of reserves desired.

3-58 Draft Master Plan Update Sacramento International Airport
Table 3-38 Historical Fuel and Aircraft Operations Data for 2018 by Month
Aircraft departures (a) Average jet
fuel
Date Fuel dispensed
(gal)
Average daily consumption
(gal) Monthly
total Average
daily
dispensed per departure (gal)
January 5,440,948 175,514 4,728 153 1,151 February 5,725,462 184,692 4,236 151 1,352 March 6,517,073 210,228 4,932 159 1,321 April 6,814,624 219,827 4,990 166 1,366 May 7,843,178 253,006 5,327 172 1,472 June 8,650,240 279,040 5,333 162 1,622 July 9,078,172 292,844 5,435 175 1,670 August 8,640,873 278,738 5,472 177 1,579 September 7,733,228 249,459 5,176 173 1,494 October 8,111,449 261,660 5,465 176 1,484 November 6,807,091 219,584 5,123 171 1,329 December 7,804,706 251,765 5,370 173 1,453
Total 89,167,044 239,696 61,587 167 1,441
(a) Includes passenger and cargo aircraft.
Source: Sacramento County Department of Airports, 2019.
Projected jet fuel requirements are presented in Table 3-39 and Figure 3-12. Fuel storage requirements are expressed in two ways: (1) in terms of gross tank storage volume so that SCDA can accommodate future demand for storage capacity without interfering with the business decisions of the passenger and all-cargo airlines, and (2) in terms of land area required so that SCDA can ensure that no other facilities encroach on the area required for future fuel storage development.
As shown on Table 3-39, the existing 4,762,800 gallons of jet fuel storage capacity (assuming 90% of total storage is usable), situated on approximately 1.7 acres of land, provides capacity well in excess of the required capacity through the end of the planning period regardless of whether the Airport designates a policy of storing three, five, seven, or nine days supply of jet fuel onsite. No additional fuel storage capacity or land area is required in the planning period. Assuming a maximum velocity of five feet per second, a common industry standard, a six-inch supply line is sufficient to meet projected demands. Fuel is currently delivered by a 12-inch supply line, which is more than adequate to convey the Airport’s projected jet fuel demands for the PALs.

3-59 Draft Master Plan Update Sacramento International Airport
Table 3-39 Projected ADPM Airline Jet Fuel Demand and Gross Storage Requirements
Base (2018) PAL 1 (2023) PAL 2 (2028) PAL 3 (2033) PAL 4 (2038)
Annual aircraft operations 129,959 153,833 169,447 186,402 203,703
Peak month aircraft operations (8.4% of annual total) 11,436 12,866 14,172 15,590 17,038
Average day peak month (ADPM) aircraft operations 350 415 457 502 549
ADPM jet fuel dispensed per departure (gallons) (a) 1,670 1,670 1,670 1,670 1,670
ADPM jet fuel demand (gallons) 292,789 346,575 381,752 419,951 458,929
Jet fuel storage requirements (gallons) (b)
3-day reserve supply 975,962 1,155,251 1,272,508 1,399,836 1,529,763
Land requirements (acres) 0.3 0.4 0.4 0.4 0.5
5-day reserve supply 1,626,604 1,925,418 2,120,847 2,333,061 2,549,605
Land requirements (acres) 0.5 0.6 0.7 0.7 0.8
7-day reserve supply 2,277,246 2,695,585 2,969,186 3,266,285 3,569,447
Land requirements (acres) 0.7 0.9 1.0 1.0 1.1
9-day reserve supply 2,927,887 3,465,752 3,817,525 4,199,509 4,589,289
Land requirements (acres) 0.9 1.1 1.2 1.3 1.5
(a) Based on peak-month (July 2018) activity (b) Includes adjustment factor to account for "bottoms" in tank (90% of gross tank capacity contains usable fuel).
Source: Sacramento County Department of Airports, 2019.

3-60 Draft Master Plan Update Sacramento International Airport
Figure 3-12 Existing Capacity Compared To 3-, 5-, 7-, And 9-Day Reserves
Source: Sacramento County Department of Airports, 2019
The number of days’ supply of fuel that should be stored onsite in reserve is a business decision to be made by the airlines. The number and configuration of the tanks to be provided are also determined by the airlines based on operating considerations, such as the tank filling and fuel settling process, as well as the reserve supply desired. The Airport designates its fuel policy decisions based on airline needs.
IN-FLIGHT CATERING LSG Sky Chefs, which provides in-flight catering services to the passenger airlines serving the Airport, leases a 140,000-square-foot site with a 30,000-square-foot building in the area southwest of Terminal B, between the United Air Freight building and the United States Postal Service (USPS) facility.
The need for flight kitchens has diminished somewhat over the past decade as airlines have cut back on complimentary onboard meal services. Even with the slight increase in “buy-on-board” meal services, these on-board meals can be packaged and distributed more efficiently than the hot meals common in the past.
LSG Sky Chefs representatives indicated, during interviews for this Master Plan Update, that they are satisfied with their current facilities and do not see their needs changing over the forecast period. The interior of this building has also been recently renovated. The existing flight kitchens at the Airport are adequately sized to serve forecast growth at the Airport.
0
1,000,000
2,000,000
3,000,000
4,000,000
5,000,000
6,000,000
Baseline(2018)
PAL 1 (2023) PAL 2 (2028 PAL 3 (2033) PAL 4 (2038)
3-day reserve supply 5-day reserve supply
7-day reserve supply 9-day reserve supply
Capacity

3-61 Draft Master Plan Update Sacramento International Airport
3.7 AIRPORT SUPPORT REQUIREMENTS The requirements for each airport support area were identified based on discussions with SCDA staff, discussions with support facility operators, and the forecast activity presented in Section 2 - Forecasts.
This analysis identifies additional airport support facilities space (this includes concourse space) and the replacement of some support facilities within the planning period. The facilities requiring replacement are near the end of their useful life for their originally intended purposes. Further analyses will be required to understand whether these facilities may still be utilized as storage space in lieu of demolition. However, staff and office space will need to be accommodated in a new facility.
The Airport’s ATCT is an aging facility that has been in operation since the airport’s opening in 1967. A siting study, completed in 2009, recommended a new ATCT location site on the north side of the Airport (there exists a reserved plot of land on the north airfield, centrally located between the runways for a new ATCT). At this time, there are no plans to move forward with the construction of the new facility, mostly due to funding issues.
AIRPORT ADMINISTRATION The Department occupies office space in both terminal buildings. Approximately 20,000 square feet of office space is provided across both levels of Terminal A, a portion of which houses the Communications Center as well as a large meeting room. Approximately 40 square feet of additional vacant administrative facilities are located on Level 01 of Terminal A.
SCDA administrative offices are located on Level 04 of Terminal B, occupying approximately 16,000 square feet. Other administrative spaces in Terminal B occupy approximately 3,300 square feet on Level 00, 2,000 square feet on Level 01, 8,700 square feet on Level 02, and 600 square feet on Level 03.
Other Airport administration staff are located outside of the terminal buildings, in the following facilities:
• The Operations Building provides approximately 10,000 square feet of space on two floors. The building was remodeled in 2013, and houses operations, badging and security functions, and the Sheriff’s Department. The existing building is of optimal size relative to the current and future needs of its occupants. This building will remain in use until a future reconfiguration of airport infrastructure, roadway or otherwise, deems relocation necessary, or until the end of the facility’s useful life.
• The Central Warehouse Building consists of warehouse space, support offices, and the Airport’s Information Technology (IT) department. The building accommodates approximately 32,000 square feet of office and warehouse space on the first floor and 1,300 square feet of IT storage space on the mezzanine. The existing building is of optimal size relative to the current and future needs of its occupants. This building will remain in use until a future reconfiguration of airport infrastructure, roadway or otherwise, deems relocation necessary, or until the end of the facility’s useful life.
To keep pace with increasing levels of enplanements, it is estimated that by PAL 4, the Department will need to increase staff levels by approximately 40%. This high-level analysis is based on a ratio between existing enplanements and staff levels extrapolated to PAL 4, where it was determined that currently, administrative staff space equates to approximately 260 square feet per employee. Therefore, a 40% increase in staff will require an additional, approximately 35,000 square feet of administrative staff space.

3-62 Draft Master Plan Update Sacramento International Airport
AIRPORT MAINTENANCE Airport maintenance functions are performed by a variety of groups at the Airport, as described below:
• The Call Center accepts maintenance requests for all SCDA airports.
• Pride Industries, a contractor, cleans the public use space in both terminals. The Airport’s Custodial Services staff clean airport administrative space and some tenant areas, such as the FAA offices.
• The Department of General Services (DGS), Airport District is responsible for the maintenance of SCDA facilities. The staff consists of stationary engineers (responsible for heating and air conditioning, interior lighting, and all related mechanical systems), electricians (responsible for runway and taxiway lighting, parking lot lighting, and all primary electrical systems), painters, plumbers, and carpenters. DGS also maintains the water and sewage systems in accordance with Sacramento County Water Resources guidelines.
• Airfield Maintenance is responsible for providing primary maintenance and repair services of runways, taxiways and ramp areas, roadways and parking areas, signage and markings, and refuse disposal systems.
• Equipment Maintenance is responsible for servicing and repairing over 500 SCDA vehicles and pieces of equipment, including busses, fire trucks, cars, pick-ups, dump trucks, tractors, large and small mowers, and street sweepers. They also manage the carwash facility, fuel station, 20 or more emergency generators, and a compressed natural gas (CNG) station, which will eventually be removed entirely from SMF after the bus fleet fully transitions to electric buses, by approximately 2027.
• Parks Maintenance is responsible for maintaining approximately 140 acres of developed, intensive landscaping at the Airport. Parks Maintenance also provides hundreds of acres of weed abatement services for adjacent properties, service roads, fence lines, service ramps, runways, taxiways, Airport parking lots, and roads.
Interviews with airport maintenance staff estimate that maintenance staff will grow from 79 to approximately 90 over the next five to ten years. Staffing levels are assessed annually in coordination with the budget and airport demand. Airport maintenance staff are provided accommodations at a variety of facilities on the Airport. Airport maintenance facilities include the following:
• The Physical Plant Maintenance Building is a 14,000-square-foot facility containing offices, shops, and storage. This building accommodates Design and Development, Parks Maintenance, General Services, Custodial Services, and the Call Center.
• The Airport Maintenance Building, for Airport maintenance equipment storage and repair, is located in the midfield area adjacent to the ARFF station. Of the building’s 15,000 square feet, approximately 5,700 square feet is used for storage. Repair activities occupy approximately 5,900 square feet, and administrative and office space occupies approximately 3,400 square feet. West of the airport maintenance building is an additional storage facility housing equipment from the elements as well as an area used as a bulk scrap yard.
• Electrician and Painter Trailers are located in the north airfield area adjacent to the Airport Maintenance building.
Building and airfield maintenance facility needs do not necessarily increase proportionally with aviation activity, but are more a function of the overall pavement, grassy areas, terminal square footage requiring maintenance, and climatic conditions. Therefore, Airport maintenance requirements were developed based on information provided by SCDA staff, who identified a total land requirement of 18 acres, or 784,080 square feet of land for expansion in support of airport operations (which includes storage, maintenance, and refuse/recycling yards). Department staff also identified several operational deficiencies that result from Airport maintenance functions being located in separate facilities and different locations at the Airport.

3-63 Draft Master Plan Update Sacramento International Airport
AIRCRAFT RESCUE AND FIREFIGHTING Sacramento County Airport Fire currently has 33 members providing ARFF, structural and wildland fire suppression, and emergency medical services (EMS). It is staffed by a crew of seven, manning two ARFF apparatus and a Type 1 engine company.
ARFF requirements and facility recommendations are provided in Title 14, Code of Federal Regulations, Part 139 (14 CFR Part 139), Certification and Operations: Land Airports Serving Certain Air Carriers. Airports certificated under 14 CFR Part 139 must comply with specific ARFF criteria, including response time requirements and extinguishing agent requirements. The regulations within 14 CFR Part 139 are used to determine the ARFF Index (A through E) for airports serving certificated air carriers based on the length of the longest aircraft operated at the airport by an airline conducting an average of five or more scheduled departures per day, computed on an annual basis. The appropriate amount of ARFF equipment for an airport is based on the ARFF Index.
The five ARFF indices are listed in Table 3-40, with details of specific requirements to meet each index.
Table 3-40 Aircraft Rescue and Fire Fighting Index Classifications
Airport ARFF Index
Required number of vehicles Aircraft length (feet)
Scheduled daily
departures Agent plus water for foam
A 1
Less than 90; More than 1; 500# sodium-based DC or Halon 1211 or clean agent; or 450# potassium-based
DC plus water to produce 100 gallons of AFFF
Greater than or equal to 90, but less
than 126 Less than 5
B 1 or 2
Greater than or equal to 90, but less
than 126;
More than or equal to 5;
Index A plus 1,500 gallons of water Greater than or
equal to 126, but less than 159
Less than 5
C 2 or 3
Greater than or equal to 126, but
less than 159;
More than or equal to 5;
Index A plus 3,000 gallons of water Greater than or
equal to 159, but less than 200
Less than 5
D 3
Greater than or equal to 159, but
less than 200;
More than or equal to 5;
Index A plus 4,000 gallons of water Greater than or equal to 200
Less than 5
E 3 Greater than or equal to 200
Greater than or equal to 5
Index A plus 6,000 gallons of water
AFFF = Aqueous Film Forming Foam DC = Dry Chemical
Source: Advisory Circular 150/5220-10E, Guide Specifications for Aircraft Rescue and Firefighting (ARFF) Vehicles, June 2011

3-64 Draft Master Plan Update Sacramento International Airport
The Airport’s ARFF is currently classified as Index C. The regulations in 14 CFR Part 139 state that Index C relates to airports where the operating aircraft are at least 126 feet long, but less than 159 feet long, with at least five daily departures. With the projected fleet mix for the Airport taken into account, it was determined that the ARFF facility will continue to be required to meet Index C standards throughout the planning period. While there are operations by aircraft classified as Index D at SMF, the average number of daily departures by these aircraft is expected to remain below five through PAL 4.
Because the ARFF station already operates five vehicles (excluding a command vehicle), exceeding Index C requirements, it is not expected that additional ARFF equipment will be required through the planning period. However, the existing facility is nearing the end of its useful life and requires replacement in the immediate future. An approximately 20,000 square foot replacement facility is currently planned with construction beginning in 2020 and anticipated completion within one year, to adequately support ARFF operations.

3-65 Draft Master Plan Update Sacramento International Airport
3.8 UTILITIES REQUIREMENTS This section identifies the requirements for providing utility services to the Airport through PAL 4. Utility service requirements were assessed for water, sanitary sewer, storm sewer, electrical, communications (telephone, internet, and cable), natural gas, and jet fuel.
Existing demand was estimated based on a review of historical records of utilities provided by SCDA. Future demands were then estimated by scaling existing demands based on projected passenger demand. The capacity of the existing infrastructure was then compared against estimated future demands.
WATER The Airport obtains its potable water from the City of Sacramento Water Treatment Plant. Water for domestic and fire protection demands is delivered to a water storage and pumping facility near the intersection of Power Line Road and Bayou Road, on the south side of Interstate 5. From the water storage tanks, a distribution loop increases the effectiveness of the water system by supplying from two directions, which minimizes pipe sizes, and allows for continued flow if a segment of the loop needs to be serviced.
Potable water is provided for sanitary uses (restrooms, cleaning, etc.), drinking, commercial operations (restaurants, etc.), and fire flow. Projected Airport water usage was estimated by scaling existing demands based on projected increases in passenger demand. A review of water use by month over the past decade shows that historically, July has averaged the most water use. One aberration occurred in 2018, when September had peak use.
Peak flows for PAL 1 through PAL 4 were estimated using water usage from an average day in the month of July, 2018. In addition to meeting passenger needs, the County requires the delivery of 3,000 gallons per minute (GPM) for fire suppression to the Airport, which is accounted for in this analysis. Table 3-41 contains a summary of the projected water demands.
Table 3-41 Historical and Projected Water Demands
Year Total Volume
MGY Peak Flow
MGD Peak + Fire Flow
MGD
Baseline (2018) 214 0.60 4.92
PAL 1 (2023) 260 0.73 5.05
PAL 2 (2028) 290 0.82 5.14
PAL 3 (2033) 324 0.91 5.23
PAL 4 (2038) 360 1.02 5.34
Note: Numbers reported in million gallons per day (MGD) or per year (MGY).
Source: Sacramento County Department of Airports, 2019.
The projected maximum daily demand of 5.34 million gallons per day (MGD) for PAL 4 was used to determine requirements through the planning period. There is currently a 24-inch water pipeline in place originating at the Sacramento County Water Agency (SCWA) off-site water storage and pumping facility and connecting to the Airport at the southern border of the site. The current 24-inch supply pipe is adequate to convey the Airport’s projected water flows through PAL 4.

3-66 Draft Master Plan Update Sacramento International Airport
SANITARY SEWER The Airport receives waste water collection service from the Sacramento Area Sewer District (SASD). Due to the general flat slope of the site, the on-site sanitary sewer collection system is relatively shallow but provides enough slope to convey sewage primarily by gravity flow. The only area from which wastewater is not transported solely by gravity flow is in the north airfield, where wastewater is transported by gravity flow to a point north of the Biffy Station. The sanitary sewer system then transports the waste by a force main down to the sanitary sewer gravity mains. The sanitary sewer gravity mains then converge before connecting into the SASD’S 18-inch Meister Way Connection.
Projected wastewater flows were estimated by scaling existing demands based on projected increases in passenger demand. Although this method does not account for minor uses such as staff and mechanical uses, passenger demand is the broadest measure of anticipated growth and provides estimates sufficient for planning purposes. Peak flows were estimated using an average day in July to determine the anticipated facility requirements for the different PALs. Table 3-43 contains a summary of the projected wastewater flows.
Table 3-42 Historical and Projected Wastewater Flows
Year Total Volume
MGY Peak Flow
MGD
Baseline (2018) 72 0.20
PAL 1 (2023) 87 0.25
PAL 2 (2028) 97 0.27
PAL 3 (2033) 108 0.31
PAL 4 (2038) 121 0.34
Note: Numbers reported in million gallons per day (MGD) or per year (MGY).
Source: Sacramento County Department of Airports, 2019.
The projected daily peak flow of 0.34 MGD for PAL 4 was used to review capacity. Assuming a pipe slope of 0.5%, the current 18-inch-diameter Meister Way Connection has a capacity of 7.4 MGD, adequate to convey the Airport’s projected wastewater flows through PAL 4.
STORM DRAINAGE The Airport’s existing storm drainage is a gravity flow system that is bifurcated at the center of the Airport. Water on the western side of the property flows to the Airport West Ditch and water on the eastern side of the property flows to the Airport East Ditch. Once in the Ditch system, the water is transported off the Airport property via gravity flow southward to the Reclamation District 1000 (RD 1000) West Drainage Canal and then to the existing RD 1000 pumping plant Number 5, where it is discharged into the Sacramento River.
Increased surface runoff and soil erosion are often associated with airport expansion. An increase in impermeable surfaces will have an effect on future storm drainage demands. Specifically, an increase in the impermeable surface area of the Airport site will cause less rainfall to percolate into the groundwater and direct more water into the drainage network increasing flows on-site and downstream of the Airport. To reduce the percent of impervious surfaces and runoff volumes on-site and off-site, it is recommended that future improvement projects use Low Impact Development (LID) and Best Management Practices (BMPs) wherever practical and effective. An example of this kind of practice is using bioretention systems. Bioretention systems

3-67 Draft Master Plan Update Sacramento International Airport
consist of depressed vegetated areas with porous engineered soils designed to capture and treat urban runoff and infiltrate treated water to the subsurface where existing site soils allow.
ELECTRICAL AND COMMUNICATIONS The Airport obtains its electrical service from Sacramento Municipal Utility District (SMUD) and an on-site photovoltaic (PV) facility. SMUD services the Airport from two 69 kilovolt (kV) feeder lines rated to supply 25 megavolt amperes (MVA), which both connect into a substation. The substation is connected to three primary facilities: The North Vault, East Vault, and the West Vault. All three electrical vaults provide a looped power distribution system, with redundant paths to critical facilities. In addition to electrical service obtained through SMUD, the Airport operates a 7.9-Megawatt (MW) PV facility covering 56 acres of land. The PV facility is capable of generating 15,500,000 kilowatt-hours per year. Emergency backup power is provided to the individual buildings by local emergency generators.
During the peak month in 2018 the Airport used an average of 121 megawatt-hours (MWh) each day, this equates to an average hourly demand of 5.04 megawatts. This is well below the capacity of the two 69 kV feeder lines and PV facility currently installed. In addition to the existing electrical supply lines, spare electrical conduits have been provided along the Airport’s main utility corridor for any future expansions. Given that capacity currently far exceeds demand, it is anticipated that the existing distribution system will serve all Airport facilities as needed through PAL 4.
The Airport obtains its communication services from SureWest, AT&T, and T-Mobile. The communications network enhances Airport security, and provides an effective communication interface between central control operators, passengers, and facilities. The Airport’s fiber optic service, supplied and maintained by Integrity Data & Fiber, is used for the Airport’s automated vehicle identification and parking access revenue control.
Communication lines run within a main utility corridor along with other utilities and branch out to buildings. Additional communication conduits are currently provided along the Airport’s main utility corridor for any future expansions.
NATURAL GAS The Airport receives natural gas service from Pacific Gas & Electric Company (PG&E). The Airport is connected to a six-inch diameter, 60-psi (pounds per square inch) PG&E distribution pipeline, which supplies a four-inch on-site distribution line.
Natural gas is used at the Airport for heating, concession operations, and a cogeneration package. Based on existing conditions (existing utility records), the average demand for natural gas is estimated at five cubic feet per passenger per year. Peak flows were estimated using projected peak hour passenger demand for the different PALs. The peak flow for PAL 4 was estimated to be 1,400 cubic feet per hour (CFH). Using the method established in the 2003 international fuel gas code, it was determined that the on-site four-inch distribution loop can supply approximately 30,000 CFH, sufficient to serve all Airport facilities beyond PAL 4.