DRAFT FOR DISCUSSION – DO NOT CITE - World...
55
DRAFT FOR DISCUSSION – DO NOT CITE Higher Education Institutions in Thailand and Malaysia – can they deliver? Yesim Yilmaz Director, Fiscal and Legislative Affairs Office of Revenue Analysis, DC Email: [email protected] March, 2010
Transcript of DRAFT FOR DISCUSSION – DO NOT CITE - World...

DRAFT FOR DISCUSSION – DO NOT CITE
Higher Education Institutions in Thailand and Malaysia – can they deliver?
Yesim YilmazDirector, Fiscal and Legislative Affairs
Office of Revenue Analysis, DCEmail: [email protected]
March, 2010

1
Contents
I. Introduction ............................................................................................................................. 2
II. Setting the stage – macroeconomic indicators and labor market conditions ....................... 4
III. Higher Education Institutions, Indicators, and Outcomes ................................................. 12
A. Higher Education Structure and Coverage..................................................................... 13
B. Enrollment Indicators..................................................................................................... 17
C. Main reforms.................................................................................................................. 19
D. Governance..................................................................................................................... 20
E. Admissions ..................................................................................................................... 21
F. Financial Aid...................................................................................................................... 22
G. Private tertiary education ............................................................................................... 23
H. International Students and Staff ..................................................................................... 25
I. Quality Assurance.............................................................................................................. 26
J. Research and Development................................................................................................ 27
K. University-Industry Linkages......................................................................................... 28
L. Finance Indicators .......................................................................................................... 28

2
IV. Labor market outcomes— demand for skills, skill shortages and mismatches, and firm level efforts to close the skills gap................................................................................................ 30
A. Demand for Skilled Labor.............................................................................................. 30
B. Shortages in the supply of skilled and professional labor.............................................. 34
C. Skills mismatches in the labor market............................................................................ 38
D. Firm level efforts to address skills shortages and mismatches....................................... 45
V. Addressing skill mismatches and shortages - Next steps................................................... 49
I. Introduction
Despite a long history of higher education reforms, scarcity of skilled, competent employees continues to be one of the biggest policy concerns in Thailand and Malaysia. Firm-level evidence suggests that skill shortages and mismatches pose significant barriers to growth in these two countries: roughly one third of companies in Thailand and one fifth in Malaysia identify skill and educational shortages among major obstacles for successful operation and growth of their businesses.1
Higher education has become far more important in providing the skills workers need the most. In 2006, 10 percent of Thai employees think that the skills that they need the most can only be provided by higher education institutions (up from 12 percent in 2003); 22 percent of employees in Malaysian manufacturing sector and 39 percent of employees in the Malaysian service sector shared this view (both up, from 16 percent and 34 percent respectively, in 2002).2
Given the changes in the industry structures in both countries, this is no surprise. As a result,
1 These findings are from Enterprise Surveys conducted by the World Bank. The data for Malaysia is from 2007 and Thailand for 2006. Enterprise Survey data are available at http://www.enterprisesurveys.org. 2 Many workers still think elementary and secondary education is the most important source of skills they need, but their share is lower today, compared to a few years ago. See tabulation of workers’ responses to the question “What level of the Education system should have provided you with the skills you are lacking the most?” below. The source of this data is the two enterprise surveys conducted in these countries (Data from 2006 and 2003 in Thailand and 2006 and 2001 Malaysia):
THA 2006 MYS 2007 M MYS 2007 S

3
Thailand and Malaysia has taken important steps in reforming their higher education institutions since early nineties. According to data compiled by UNESCO, enrollment in ISCED 5A institutions3 increased by 6.7 percent annually between 2001 and 2006 in Malaysia and by 3.7 percent in Thailand—significantly above the population growth rates of about 2 percent in Malaysia and 0.75 percent in Thailand over the same period. Liberalization of higher education (that is, lowering barriers to entry) has contributed the greatest to the rapid expansion in the number of higher education institutions and students. In both counties, there is increased emphasis on multiple paths to degrees, specifically through private education institutions.
Yet, skill mismatches and shortages continue, as further evidenced by firms’ inability to fill vacant positions for professional or skilled employees despite high wage premiums. One fifth of all the companies have reported vacancies in professional positions in Thailand while 45 percent of service sector firms in Malaysia face vacancies for similar positions, which they cannot fill for over six weeks (seven weeks in Thailand) on average. These vacancies continue despite the thirty four (Malaysia) to seventy six (Thailand) percent wage premium college graduates earn [Udomsaph and Zeufack, 2006].4 The persistence labor market mismatches suggest that further work is required to improve quality of the students and higher education institutions, achieve a greater scale of skills matches, and equalize access to education.
This comparative study of the higher education systems of Thailand and Malaysia seeks to answer three questions:
1. What are the main higher education related skills gaps in Thailand and Malaysia? 2. What does the supply of skills look like, specifically as provided by universities?3. What are the main constraints faced by Malaysia and Thailand in addressing the
“relevance” challenge, both within and outside higher education?
The study is organized as follows: the second section sets the stage by comparing the basic social and economic indicators for both countries. The third section focuses on the institutional
Percentag Change from last Percentag Change from last Percentag Change from last
Primary 41% -9% 12% -3% 7% -1%Secondary 36% 3% 48% -5% 39% -9%University 10% 2% 22% 6% 39% 5%Vocational 13% 3% 18% 2% 15% 4%
3 According to International Standard Classification of Education (ISCED) as adopted by UNSESCO in 1997, Tertiary Type A (ISCED 5A) programs cover most bachelor’s degrees—these are largely theory-based and are designed to provide sufficient qualifications for entry to advanced research programs and professions with high skill requirement. Tertiary-type A programs have a minimum cumulative theoretical duration (at tertiary level) of three years’ full-time equivalent, although they typically last four or more years. Tertiary-type B programs are typically shorter than those of tertiary-type A and focus on practical, technical or occupational skills for direct entry into the labor market, although some theoretical foundations may be covered in the respective programs. They have a minimum duration of two years full-time equivalent at the tertiary level. These descriptions are taken from OECD’s website and can be accessed at http://stats.oecd.org/glossary/detail.asp?ID=1436. 4 See, also Yusuf and Nabeshima [2009] for an analysis of the employers’ perceptions of and collaboration with universities in and around Penang, Malaysia.

4
characteristics and outcomes of the higher education system. The fourth section looks at the labor market outcomes of higher education in these two countries, using firm level evidence from business surveys. The fifth section concludes by discussing the main constraints Malaysia and Thailand face in addressing the skills challenge and by providing various policy options that can help relax these constraints.
II. Setting the stage – macroeconomic indicators and labor marketconditions
Thailand and Malaysia are two of the relatively similar economies in East Asia Pacific—each have approximately ten percent of its economy in agricultural production, forty percent in services and the remaining half in industrial production (Figure 1). Foreign direct investment in both countries was at about 4 percent of the GDP in 2007 notwithstanding different growth patterns since 2001 (Figure 2). On a per capita basis, foreign direct investment is much higher in Malaysia at $116 compared to $73 in Thailand, suggesting that the world’s utilization of Malaysian labor force is higher.5
Figure 1 – Composition of the economy, 2007 Figure 2 – Foreign direct investment as a % of GDP
Source: World Development Indicators, April 2009
GDP growth in both countries has fluctuated since 2001, but continues to be above the population growth rate. Prior to the financial crises of 2008, both Malaysia and Thailand grew at above five percent for a consecutive seven years. Since 2008 GDP growth continued to be positive, despite significantly below trend. Both countries have been experiencing reductions in annual population growth rate—Malaysia’s population grew by 1.7 percent to reach 26.7 million in 2008 while Thailand’s grew at 0.6 percent to reach 67.4 million (Figure 3). Because of the
5 Despite similar shares of industry in the economy, per capita energy consumption in Malaysia is significantly higher than Thailand—in 2006 per capita electric power consumption in Malaysia was about 3400 kWh, compared to 2000 kWh in Thailand, and energy consumption per capita was equivalent of 2600 kg of oil, compared to 1500 in Thailand. These differences in energy consumption suggest that there are market differences in the subsectors of the economies of the two countries.

5
differences in earlier growth, Malaysia’s per capita income continues to be almost double the per capita income in Thailand, both measured in constant dollars, and in terms of purchasing power (Figure 4).
Figure 3 – Economic and demographic growth in Malaysia and Thailand, 2001 - 2008
Source: World Development Indicators, April 2009
Figure 4 – Per capita income and purchasing power in Malaysia and Thailand, 2001 - 2007
Source: World Development Indicators, April 2009
Structure of the labor market in two countries is significantly different—21.5 percent of the labor force is engaged in household production in Thailand compared to only 4.8 percent in Malaysia. These statistics are not surprising given Thailand’s relatively larger rural population share—according to World Development Indicators data, 69 percent of total population Thailand lives in rural areas whereas only 30 percent of the population in Malaysia lives in rural areas. Conversely, 76.2 percent of the total labor force is wage and salaried employees in Malaysia compared to 43.7 percent in Thailand. Finally, 19 percent of the total labor force is self-employed in Malaysia compared to nearly 35 percent in Thailand (Figure 5). Interestingly,

6
illiteracy rate among youth and adults is much higher in Malaysia at 2.8 and 11.3 percent, compared to 2 percent among the youth and 7.4 percent among adults in Thailand.
Figure 5 – Structure of the labor force and unemployment by education level
Source: International Labor Organization
Figure 6 – Highest Degree of Education Attended, and years of formal education completed, by firm type
Source: Enterprise Surveys, Workers modules
Average education of Thai labor force is close to 12 years compared to 10.5 years for Malaysian labor force employed in the manufacturing sector and 13.2 years for those employed in the service sector (data from 2006). Management and professional employees have the highest years of education—with close to 16 years in Thailand according to the latest data, and 14 years across service sector firms in Malaysia. Across all types of workers, Thai employees have attained higher degrees and received more education, but the difference is more pronounced among professional workers (Table 1). According to human resources managers of firms, 20 percent of the Thai labor force holds has attended higher education institutions (down from 23 percent in 2004) compared to 17 percent among Malaysia, but this percentage among

7
service sector employees go up to 52 percent. In both countries firms that export at least 30 percent of their output and firms with foreign direct investment typically have a more educated workforce (Table 2). The difference in the educational attainment of workers in manufacturing and service sectors hold true when the same question is also posed to the employees. In Malaysia, only 7 percent of surveyed workers in the manufacturing sector have attained a university degree compared to 34 percent of workers in the service sector.
Table 1 – Average Years of Education by employee type
Management Professional Skilled Production
Unskilled Production
Non-Production
THA 2004 15.2 10.4 11 8 13.1THA 2006 15.7 15.8 11.9 8.9 14.5MYS 2002 M 13.2 12.9 10.6 8.8 10.6MYS 2002 S 14.8 15.1 12.4 9.6 11.3MYS 2007 M 12.71 7.95 9.49 7.89 8.39MYS 2007 S 14.4 13.04 10.72 6.93 10.7Source: Enterprise Surveys
Table 2 – Percentage of employees with some university education or higher
THA 2004 THA 2006 MYS 2007 MYS 2007 M MYS 2007 SAll Firms 23% 20% 14% 17% 52%Exporter 24% 22% 18%Non-Exporter 21% 18% 10%Non-FDI 20% 20% 13%FDI 30% 23% 18%
Source: Enterprise Surveys
Unemployment in both countries is relatively low, but is higher in Malaysia compared to Thailand—3.5 percent of the total labor force of approximately 10.3 million is unemployed in Malaysia (data from 2003) according to ILO statistics. At 36.8 million, Thailand’s labor force is approximately more than three times that of Malaysia, yet its unemployment rate in 2005 was at 1.3 percent. Nearly half of the unemployed in both countries hold secondary degrees, but those with higher education degrees have significantly different outcomes—virtually all participants of the labor force with a tertiary degree are employed in Thailand whereas workers with a higher education degree constitute 15.6 percent of the total unemployed in Malaysia (Figure 5).6
Both Malaysia and Thailand are now largely independent of foreign aid. In 2007, the official development assistance and aid equaled to only 0.11 percent of Malaysia’s GDP, 6 Enterprise surveys also support this finding—as discussed above, more workers have a university degree in Thailand compared to Malaysia.

8
whereas Thailand became a net donor with foreign assistance contributions at about 0.13 percent of its GDP. Between 2001 and 2008, Thailand became increasingly less dependent on workers’ remittances which went down from 1.08 percent of GDP to 0.68 percent. Workers’ remittances stayed relatively constant in Malaysia during the same period, hovering around 1 percent of GDP.
Total external debt in Thailand is approximately 0.27 percent of GDP in Thailand and 0.28 percent of GDP in Malaysia. Malaysia’s debt service has been stable around 5 percent of total exports between 2001 and 2007 whereas Thailand has reduced this ratio from nearly 25 percent in 2001 to 8 percent in 2007 (Figure 7). Almost all funding in Thailand in private—98 percent of all lending is funded by private entities—whereas public credit constitutes 12 percent of total funding in Malaysia.
Figure 7 – Foreign Aid and Worker’s Remittances as a percentage of GDP, 2000 through 2008
Source: World Development Indicators, April 2009Figure 8 – Debt indicators

9
Source: World Development Indicators, April 2009
Credit markets appear to be better developed in Malaysia compared to Thailand. Access to credit is more strongly supported by intermediaries in Malaysia—private credit bureaus provide information on credit worthiness of 82 percent of the adults in Malaysia compared to only 33 percent in Thailand. Additionally public agencies provide creditworthiness information for almost half the adult population in Malaysia whereas no such service is available in Thailand. Market capitalization of publicly listed companies in Malaysia is twice as high as Thailand, as a ratio of GDP—after significantly declines in 2008, market capitalization of publicly listed companies equaled about 96 percent of GDP in Malaysia vs. 40 percent in Thailand. (In 2007, in comparison, market capitalization of publicly listed companies was 175 percent of GDP in Malaysia, and 83 percent in Thailand.)
Both Malaysia and Thailand are business friendly compared to the rest of the East Asia Pacific region, but Thailand scores higher in Doing Business index compiled by the World Bank.7 Starting and closing a business, employing workers, registering property and enforcing contracts are relatively easier and cheaper in Thailand whereas Malaysia provides a friendlier environment in terms of access to credit, protecting investors, paying taxes and trading across borders. For example, it takes almost a month to start a business in Thailand—three times Malaysia—but the entry barriers are lower: the cost of starting a business is only 6.3 percent of per capita GDP compared to 12 percent in Malaysia. Similarly, cost of enforcing contracts and cost of registering property is much lower in Thailand. In return, in addition to ease of access to capital, Malaysia offers cheaper costs for international trading but not necessarily lower taxes (Table 1).
Table 3 – Doing Business- Various indicatorsMalaysia Thailand EAP OECD
Time to start a business (days) 11 32 41 13
7 On the other hand, Malaysia scores higher raking 21 out of 131 countries in the Global Competitiveness Index calculated by WEF compared to Thailand, which ranks at 28th spot [Watkins and Verma, 2007].

10
Cost of starting business (% of income per capita) 11.9 6.3 25.8 4.7Redundancy costs in employment (weeks of salary) 75 54 42.4 26.6Public registry coverage of creditworthiness (% of adults) 48.5 NA 7.2 8.8Private bureau coverage of credit worthiness (% of adults) 82 32.9 14.4 59.6Cost of registering property 2.6 1.1 3.9 4.6Total tax rate (% profit) 34.2 32.9 36.1 44.5Cost to export (US$ per container) 450 625 909.3 1,089.70Cost to import (US$ per container) 450 795 952.8 1,145.90Cost of enforcing contracts (% of claim) 27.5 12.3 48.5 19.2Cost closing a business (% of estate) 15 36 23.2 8.4Source: Doing Business 2010, the World Bank Group. Figure 9 – Internet and Mobile Telephone Users
Source: World Development Indicators, April 2009
High-technology exports account for a much higher share of manufactured exports in Malaysia—52 percent of total exports in manufacturing in 2007 compared to 27 percent in the same year in Thailand. But exports are growing at a much higher rate in Thailand, at 11.7 percent in 2006, compared to 8.6 percent in Malaysia. A much higher share of companies in Thailand have ISO certification as well – at 45 percent, compared to 32 percent in Malaysia. ICT expenditure has similar shares in both countries –at 7 percent of GDP in Malaysia vs. 6 percent in Thailand. Differences in per capita ICT expenditures track the overall differences in per capita income—with and investment of $384 in 2005 prices in Malaysia vs. $165 in Thailand.
Based on the KAM framework developed by the World Bank, Malaysia’s knowledge sectors8 are performing better than Thailand—however, the two countries perform similarly in education sector (a simple average of adult literacy, secondary enrollment and tertiary enrollment). Thailand lost some ground between 1995 and 2006 since its education sector growthstalled, and Malaysia dominates in the ITC sector, which measures telephone, computer and internet penetration (Figure 9).
8 These include four indices measuring economic incentives and institutional regime, by comparing tariff and non-tariff barriers to trade, regulatory quality and rule of law innovation, which is a combined measure of royalties, patents, and academic journals in science and technology; education, which is a simple average of adult literacy, secondary enrollment and tertiary enrollment, and finally information and communication technology which measures telephone, computer and internet penetration. A fourth index considers economic structure.

11
Figure 10 –Comparison of Economy and Knowledge indices by the World Bank’s Knowledge Assessment Methodology
Source: Knowledge Assessment Methodology, the World Bank, 2008.
Finally, macroeconomic evidence from both countries suggests that skills development and education threatens economic growth. Malaysia’s gross tertiary completion ratio, given its per capita income is much lower than what one would expect given the trends in EAP. Similarly, both Malaysia and Thailand lag in expected years of schooling for their GDP per capita, suggesting schooling is a binding factor. Figure 10 depicts an OLS regression of gross tertiary graduation ratios on the (natural logarithm of) the per capita GDP in selected EAP countries.9
Figure 11 – Gross tertiary Completion Ratios relative to per capita income, 2005, unless otherwise noted
Source: UNESCO and the World Bank.
9 The estimated coefficient for the gross tertiary graduation ratios is significant at the 0.01 level. The intercept estimate is significant at the 0.05 level. The F-Stat for the regression is 12.01.

12
Figure 12 – Expected Year of Schooling for a given level of per capita income, 2005, unless otherwise noted
Source: UNESCO and the World Bank. Average year of schooling data for Vietnam Data is from 2002 Demographic and Health Survey.
This simple model assumes that tertiary education completion rates support a certain level of per capita income in a country. In countries that lay below the estimated trend line, tertiary gross graduation ratios are below what is expected to be associated with a given level of per capita income. In Malaysia graduation ratio is fifteen percent, much lower than the predicted value of twenty-two. In Malaysia, it is fifteen percent, again much lower than the predicted value of twenty-two. In Thailand, graduation ratios are closer to their predicted value.10 A similar model that regresses expected years of schooling on per capita income finds that Malaysia must increase the average years of schooling among their adult citizens by 2 years and Thailand by 3 years (Figure 11).
Higher Education Institutions, Indicators, and Outcomes
Thailand and Malaysia’s higher education sectors have undergone massive reforms, liberalization, and restructuring accompanied by a significant increase in enrollments. The central control over higher education institutions have relaxed significantly, but the state still plays an important role in both countries. Table 4 outlines the basic characteristics of the higher education sector in the two countries. While enrollments are increasing, higher education institutions in both countries have to face the “market test” by improving the quality and relevance of their students. Equitable access to higher education, availability of public financing,
10 The data is from 2005. Please note that for China, the graduation ratios are only three percent—one fourth of what this crude model predicts them to be. But given the extremely large population size the percentage may be misleading.

13
and quality improvement and quality assurance are key issues for both countries in the coming decade.
A. Higher Education Structure and Coverage
In Malaysia, the term “higher education” refers to all post-secondary education that leads to the award of certificates, diplomas, and degrees [Wilkinson and Yussof, 2005]. After completing upper-secondary track, students can go through matriculation by attending pre-university level classes, or Sixth Form. To continue through university degrees, students would have complete their matriculation exams or take the Malaysian Higher School Certificate examination (STPM). A third option is to attend colleges or polytechnics which lead to a certification. Private colleges also offer a range of non-traditional paths towards the degree qualification, for example through Malaysian Public university Degree Franchised programs or External professional and semi-professional examinations.
Most Malaysian universities are new. In 1980 there were only five public universities as opposed to the current seventeen11. No private universities existed until 2002, and currently there are more than twenty-seven universities and university colleges12 including those set up by state-owned enterprises, by foreign universities, and even one set up and owned by a political party [Lee, 2004].13 In addition there are thirty four community colleges, twenty polytechnics, over twenty five teachers colleges, and over 530 private colleges for students pursuing diploma and certificate qualifications [National Accreditation Board, 2006]. Universities are geographically more diverse, and there is greater variety in delivery mode and multiple paths to a degree.
11 These include sixteen public universities, and International Islamic Universtiy, which has been incorporated under the Companies Act, but is normally counted among the public sector. 12 University colleges are small institutions not affiliated with any university system, and concentrate on teaching very specialized fields at the undergraduate level. 13 University of Tunku Abdul Rahman (UNITAR) is owned by the Malaysian Chinese Association.

14
Table 4 – Basic Characteristics of Higher Education Institutions in Malaysia and Thailand
Malaysia ThailandGovernment Agency Ministry of Education
Ministry of Higher Education (established 2004)Ministry of Education established in July the Commission on Higher Education under MoE.
Main Reforms 1996: The Education Act, Private Higher Educational Act (amended in 2003) National Council on Higher Education Act, National Accreditation Board Act and Universities and University Colleges (Amendment) Act .
National Education Act B.E. 2542 (1999) the related Amendments in B.E. 2545 (2002); Regulation on Civil Servants in HE Institution Act 2008 – more administrative autonomy to public universitiesAdministration of HE Institution’s Internal Act 2007 – more academic autonomy to public universitiesThe Private College Act of 1969 allowed for the establishment of
private colleges. This Act was later revised as the Private Higher Education Institution Act in 1979, 1992allowing more academic autonomy and easing up rules in establishing new academic programs.
Admissions Public Universities – Applications open to those who completed pre-university level (matriculation) or finished Form 6 and take Malaysian Higher School Certificate examination (STPM.) Matriculation exam grades and STPM scores play a role but selection criteria not necessarily transparent. Racial quotas play a role (but less since 2002). Private Universities – More open admissions with multiple paths to a degree (known as “twinning.”). Polytechnics/colleges/community colleges –open enrollment.
There are two principle ways in which students are admitted to higher education institutions: direct admission and the central university admission. Direct admission provides more opportunities for students in provinces and remote rural areas, including talented students from these areas. Central university admission places greater emphasis on the joint entrance examination and treats every applicant ingives more weight to student achievements at upper secondary school.
Public financial support
High level of support for public institutions. Private institutions are now lobbying for public funds.
Public universities are treated as goveannual budget appropriations that constitute more than 90 percent of their expenditures. Autonomous universities receive block grants, which are considered as the universities’ own income. Private universities have full control over thaffairs, and receive no public subsidies.
Financial help National Higher Education Fund in 1996 provides student loans Traditional Student Loans offered under (SLS) since 1996. Income Contingent loans called Thailand IncomContingent and Allowance Loan offered 2008.
Governance structure Public universities reorganized with a more “corporate” structure, but autonomy is not absolute. The “corporatization” was expected to bring in more business like activities and access to private funds, reducing dependence on public funds, but this did not really happen. Have greater control over procurement, etc. but must abide by government rules with respect to hiring decisions, undergraduate fees, etc. Consequently operating revenue from tuition is decreasing but income from consultancy, contract research, sale of expert services and other market-related activities has become an important source of revenue for many public universitiesPrivate universities are independent in their governance structures.
Universities run by University Councilsthrough with the government is involved in the daygovernance. Public universities have academic administration autonomy, but must abide by governmefinancial rules. Public autonomous universities have full autonomy over their academic, personnel and financial affairs (through UC approval). Private universities have full control over their internal affairs, and receive no public subs
Research and Development
Each of the 17 public universities have R&D centers that spend about $100 m annually (2004 data) combined. Private sector research institutions are many more (about 200) but on average spend much less ($2 million each).
Research funds dependent on public funds budgeted to universities. Most universities have research funding, but only a handful at meaningful sizes. Practice of seeking external funding is not well established.
International Presence
Many international universities with branches in Malaysia. Rules on hiring international staff are relaxed. Malaysia wants to become an exporter of education. Great number of students from elsewhere,
16,361 foreign students enrolling in 96 Thai higher education institutions in 2008—only 0.7 percent of total enrollment, but represents a threefold increase in student numbers

15
Malaysia Thailandespecially China and Indonesia particularly International Islamic University). Both public and private universities attract international students and staff.
Very limited international university presence.
Accreditation and QA The National Accreditation Board established 1996 oversee/regulate the private higher educational institutions. The Quality Assurance Division (QAD), currently under MoHE, was established in December 2001 and is responsible for promoting public confidence in the quality of provision and standards of awards in public universities and university colleges.
Office for National Education Standards and Quality Assessment (ONESQA) All educational institutions are subject to externalquality evaluation at least once every five years. also conduct internal evaluations, and this function is the responsibility of the University Councils.
Other Significant gains in access and availability- since 2002 total enrollment in all tertiary institutions grew by more than 200,000 students, or by 6 percent annually. Public university enrollments grew by 12 percent annually. Employability of graduates becoming a key concern.Private universities lobbying for public support.
Key issues are quality, relevance to local and global markets, equitable access, and increasing demand for higher education.

1616
Figure 13 - Structure of the Higher Education SystemAge 15 16 17 18 19 20 21 22 23 24
MYS
Matriculation/Foreign Univ.
Upper sec. Academic Sixth Form
Upper sec. TechnicalColleges/Polytechnics
Bachelors and Masters Doctorate
Upper sec. Vocational
THA
TVET Post-sec non-tertiary
Upper secondary Bachelors and Masters Doctorate
Vocational ed. diploma/Tech.BA
Source: UNESCO Institute for Statistics 2003 [2003] and [Morshidi, 2006].
In Thailand, after competing upper–secondary track (academic or TVET), students can go for a post-secondary, non-tertiary degree, or a vocational education diploma (or a technical B.A.) or go through a more traditional general education. Students can pursue higher education through a number of different routes: public universities, autonomous universities, technology universities or institutes, community colleges or private universities [Bovornsiri, 2006]. Thai students have access to 12 years of free, basic education and this has increased the demand for higher education. Transition rates from secondary to tertiary institutions (excluding Open University enrollees) increased from 75.9 percent in 1999 to above 80 percent by 2004. Enrollments in all tertiary programs grew by 47 percent (or an average annual rate of 6 percent) between 1999 add 2008 from approximately 1.6 million students to 2.4 million students.
Most new public universities in Thailand are being created by merging existing colleges, and subsequently reorganizing them as universities. There are sixty five public universities14, with limited admission policies and two open-admission universities.15 Thirteen autonomous universities serve different regions—these universities have more control over their academic, administrative, and financial affairs. They have access to public funds, but are not under the control of the Commission on Higher Education. Nineteen community colleges offer diploma (two year) programs of academic or vocational track (which can then be transferred towards degree education), vocational certificates, short courses on vocational or life skills, and basic
14 Among the public universities that serve the country, three are worth mentioning separately: Rajabhat Universities (41 different universities) that typically focus on teacher education, Rajamangala Universities of Technology (9 universties) that focus on science and technology, and Pathumwan Institute of Technology, which focus on engineering. These three institutions have been the biggest source of the recent enrollment growth among public universities in Thailand [Bovornsiri, 2006]. 15 Open universities include Ramkhamhaeng University established in 1971, and Sukhothai Thammathirat Open University, established in 1978.
1717
education courses for the unskilled and uneducated. Community colleges are more flexible in their structure and delivery and serve a large group of non-traditional students. Finally, there are two autonomous Buddhist universities. Thailand’s private education sector includes thirty four universities, five institutes, and twenty nine colleges. Private institutions accounted for 14 percent of students in 2007.
Thirty percent (or 48) of Thailand’s higher education institutions are located in Bangkok. Central and Northeast regions each have nineteen percent (31 and 32 respectively), North has fifteen percent (with 24 institutions), and South has thirteen percent (22). At 5 percent (8 institutions) East’s share is the smallest [Sumate, 2008].
B. Enrollment Indicators
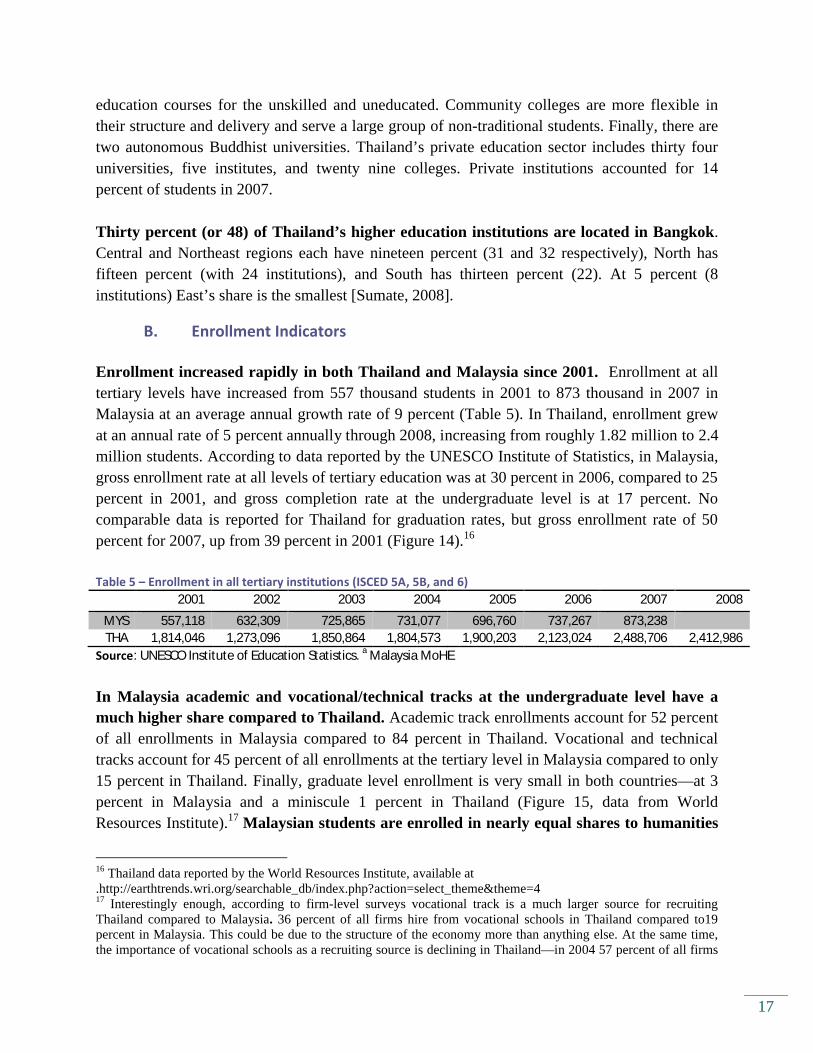
Enrollment increased rapidly in both Thailand and Malaysia since 2001. Enrollment at all tertiary levels have increased from 557 thousand students in 2001 to 873 thousand in 2007 in Malaysia at an average annual growth rate of 9 percent (Table 5). In Thailand, enrollment grew at an annual rate of 5 percent annually through 2008, increasing from roughly 1.82 million to 2.4 million students. According to data reported by the UNESCO Institute of Statistics, in Malaysia, gross enrollment rate at all levels of tertiary education was at 30 percent in 2006, compared to 25 percent in 2001, and gross completion rate at the undergraduate level is at 17 percent. No comparable data is reported for Thailand for graduation rates, but gross enrollment rate of 50 percent for 2007, up from 39 percent in 2001 (Figure 14).16
Table 5 – Enrollment in all tertiary institutions (ISCED 5A, 5B, and 6)2001 2002 2003 2004 2005 2006 2007 2008
MYS 557,118 632,309 725,865 731,077 696,760 737,267 873,238THA 1,814,046 1,273,096 1,850,864 1,804,573 1,900,203 2,123,024 2,488,706 2,412,986
Source: UNESCO Institute of Education Statistics. a Malaysia MoHE
In Malaysia academic and vocational/technical tracks at the undergraduate level have a much higher share compared to Thailand. Academic track enrollments account for 52 percent of all enrollments in Malaysia compared to 84 percent in Thailand. Vocational and technical tracks account for 45 percent of all enrollments at the tertiary level in Malaysia compared to only 15 percent in Thailand. Finally, graduate level enrollment is very small in both countries—at 3 percent in Malaysia and a miniscule 1 percent in Thailand (Figure 15, data from World Resources Institute).17 Malaysian students are enrolled in nearly equal shares to humanities
16 Thailand data reported by the World Resources Institute, available at .http://earthtrends.wri.org/searchable_db/index.php?action=select_theme&theme=4 17 Interestingly enough, according to firm-level surveys vocational track is a much larger source for recruiting Thailand compared to Malaysia. 36 percent of all firms hire from vocational schools in Thailand compared to19 percent in Malaysia. This could be due to the structure of the economy more than anything else. At the same time, the importance of vocational schools as a recruiting source is declining in Thailand—in 2004 57 percent of all firms

1818
and social sciences programs and science and technology programs at 48 percent and 46 percent of enrollments each, whereas humanities and social sciences are much more dominant in Thailand, at 73 percent of all enrollments compared to 23 percent of all enrollments for science and technology programs. Enrollments in programs in health sciences and welfare are small, at 7 percent in Malaysia and 5 percent in Thailand.
Figure 14 - Gross enrolment ratios ISCED 5 and 6
Source: UNESCO Institute of Education Statistics and World Resources Institute (Thailand)
Figure 15 – Distribution of enrollment across different types and fields of education
Source: UNESCO Institute of Education Statistics. aData for Malaysia data are from MoHE b Data for Thailand arefrom CHE18
recruited from vocational schools. In Malaysia, on the other hand, vocational schools has become a slightly more important source of recruiting over time—in 2002, only 14 percent of all firms recruited from such schools. 18 Available at http://www.unescobkk.org/fileadmin/template2/apeid/workshops/macao08/presentations/3-p-7-3-pp.ppt.Accessed on December 5, 2009.

1919
C. Main reforms
Malaysian higher education institutions are under the control of the Ministry of Higher Education (MoHE), which was split from the Ministry of Education in 2004 [Morshidi,2006].19 The MoHE is mandated to continuously improve standards so as to produce quality graduates to meet the needs for a skilled workforce, and to make Malaysia the regional and international hub of educational excellence. Main education reforms in Malaysia took place in 1996, when the government put forward the Education the Education Act 1996, Private Higher Educational Act 1996, National Council on Higher Education Act 1996, National Accreditation Board Act 1996 and Universities and University Colleges (Amendment) Act 1996.20 The main motivation in passing the regulatory reform was to create the necessary education institutions to support Malaysia’s economic growth as well as turning Malaysia into a regional education hub. The reforms were intended to bring about the necessary regulatory framework for the liberalization and privatization of higher education on a larger scale to meet the social and economic needs of the country [Lee, 2004].
Main reforms in Thailand changed the organization of universities and overhauled qualityassurance, institutional autonomy, and admission policies. In contrast to Malaysia, reforms in Thailand resulted in the unification of all entities that oversee different levels and aspects of education under a single ministry [Suwanwela, 2005]. The central higher education reform in Thailand was the passing of the National Education Act B.E. 2542 (1999) and the following amendments, which lead to the creation of the Ministry of Education (MoE) in 2003 by merging the Ministry of Education, the Office of the National Education Commission, and the Ministry of University Affairs. The Commission of Higher Education (CHE), which is one of the four main components of the MoE, is the key agency that oversees tertiary education in Thailand.21 CHE is charged with planning and policy formulation for higher education, including planning the number and type of public universities, resource mobilization, human resources and skills development for university students, and oversight of universities’ management.
Additional reforms in 2007 and 2008 increased the autonomy of both public and private universities in Thailand. Regulation on Civil Servants in HE Institution Act 2008 allowed public higher education institutions to set up a non-civil servant personnel administration under which employees could hold administrative and academic positions with status equivalent to civil servants. Administration of HE Institution’s Internal Academic Unit Act 2007 allowed public higher education institutions establish academic units with only approval from the University Council. The 2007 revision of the Private Higher Education Institution Act of 2003 19 Before the establishment of MOHE, higher education matters were under the Ministry of Education through the Department of Higher Education, which was established in 1995. 20 Through mid 1990’s, higher education institutions were strictly run by the state, and central controls were tightened through 1970s, especially after the ethnic riots of 1969 [Lee, 2004]. 21 Other three components of the MOE are the National Education Council, the Commission on Basic Education, and the Commission on Vocational Education.

2020
allowed UCs at the private universities establish study programs so long as the programs follow CHE rules. This Act also gave UCs the authority to approve investments or joint-venture agreements to operate university-related affairs [Sumate, 2008]
D. Governance
Malaysian public universities gained greater administrative and financial autonomy with the passing of the Universities and University Colleges (Amendment) Act 1996. The stated goals of the administrative liberalization for Malaysia are similar to what is observed across many countries: increased emphasis on performance and output, greater formalization of the governance structure, increased responsiveness to market factors (that is consumers and competition—in this case, private universities), decentralization of tasks that could be better done outside the central government, and less reliance on public funds [Larsen et al., 2009].Public universities went through the process of “corporatization,” which required them to be run more like private corporations. Corporatized universities were expected to be more independent financially—an outcome that has never been really achieved in Malaysia. Public universities are still very much dependent on government’s resources, and this can be partly attributed to the government’s unwillingness to assign full financial autonomy to public institution. For example, tuition rates for undergraduate students at public universities are strictly regulated by MOHE. At the same time, public universities have greater autonomy over some aspects of their management (for example procurement and contracting), and now can set up independent entities Malaysian private universities and colleges have much greater autonomy over their financial and operational matters including setting of tuition rates at any level of education. Private universities are typically run by a board of governors or directors, and often times management is very much specialized, focusing primarily on the business, and not academic, side of matters.22
Thailand’s universities, both public and private, are under the oversight of CHE, but recent reforms have significantly increased university autonomy. Universities are run by University Councils (UCs) which are responsible for policy formulation, quality and standard supervision and monitoring and evaluations. Outside of the broad oversight of CHE, the government is involved in the management of the universities only through UCs. Chairman of the UC in public universities as well as the members are appointed by the King of Thailand, selected among university managers, faculty members or other members of the Thai government, and in the case of autonomous universities, external experts. In private universities, the Licenseeproposes the Chairman of the UC and the members, and the Minister of Education appoints them. UC’s in public universities are responsible for personnel administration to the extent that is
22 However, the government has regulatory control over private universities and establishment and scope of private universities (for example, areas of study) is all subject to government approval.

2121
allowed by CHE rules. UC’s in private universities, and public autonomous universities, on the other hand, have full control over personnel and financial administration.23
Public universities in Thailand hold the status of “government units,” and while they have academic administration autonomy, they must abide by government’s personnel and financial rules. Public autonomous universities have full autonomy over their academic, personnel and financial affairs (through UC approval). As opposed to public universities, which receive annual budget appropriations24, autonomous universities receive block grants, which are considered as the universities’ own income. Private universities have full control over their internal affairs, and receive no public subsidies.
E. Admissions
In Malaysia, in order to gain admission to public universities students attending pre-university must pass matriculation exams and students attending sixth form must pass Malaysian Higher School Certificate examination but high grades in these exams do not guarantee a spot. Admission decisions are not fully transparent and oftentimes enrollment quotas can determine the admission decision.25 The role of enrolment quotas have been decreasing since 2002. Private universities have more transparent admission policies.
In Thailand, there are two ways through which students are admitted to higher education institutions: direct admission and the central university admission. Direct admissions account for 45 percent of all placements whereas central university admissions account for 55 percent [Bovornsiri 2006]. Direct admission system consists of two components: the quota system, which favors students in each region have a chance to be admitted to regional universities in competition with students from that region only, and admission based on specialstatus, which gives preference to certain groups based on socioeconomic background or gifted status, especially in creative arts, performing arts, and athletics. Direct admission provides more opportunities for students in provinces and remote rural areas, including talented students from these areas. Under the central university admission system, CHE supervises applications, organizes national entrance examinations, screens students based on their examination results, places the students based on students’ target school lists26, and their relative academic performance, entrance exam results, and interviews. Central university admission places greater
23 For more details on the size, composition, and functioning of University Councils, see [Tanom, 2008] available at http://www.rihed.seameo.org/ugseminar/PG_Tha2.pdf, accessed on December 22, 2009.24 In public universities, public funds account for 70 to 80 percent of the university budget, followed by tuition fees (10–20%) [Schiller and Liefner, 2007]. 25 Enrollment quotas have been in place since 1970, but over time they have come to favor more heavily the Bumiputera community that backs the ruling regime. For example, in 1985, the quotas required that 63 percent of the slots go to Bumiputera community as opposed to 35 percent in 1970. Chinese students were allocated about 30 percent of the slots in 1985 (compared to 52 percent in 1970) and Indian students got about 7 percent (compared to 11.5 percent in 1970) [Lee, 2004; Sato, 2005].26 The students can apply to up to four faculties or fields of study in up to four institutions of higher education.

2222
emphasis on the joint entrance examination27 and treats every applicant in the same way, andgives more weight to student achievements at upper secondary school compared to lower secondary. The CHE is planning to reduce the emphasis on examination results, and increase the weight of academic performance over time to improve classroom learning.
F. Financial Aid
Malaysia’s National Higher Education Fund Corporation was established in 1997 as semi-autonomous body under MOHE to provide student loans to higher education students attending private universities. Students at public universities were also made eligible, despite the existing subsidies to these institutions. When it was first established private university and college students constituted only 1.5 percent of total recipients of loans from the National Higher Education Fund Corporation. In 2005, the share of students from private institutions was close to 32 percent. The program started rather small, with about 12,000 students. As of 2005, the Corporation served a total of 800,000 students lending over RM15.3 billion [The World Bank,2007]. Current loan policies target students from families below certain income levels, and students whose parents have established savings accounts with the Corporation towards higher education related expenses.28
In Thailand, a Student Loan Scheme (SLS), prepared by the Ministry of Finance, was putin place in the academic year of 1996, with the objective of providing loans to needs students at the upper secondary and tertiary level with favorable repayment conditions[Ziderman, 2002]. SLS had an initial endowment of $222 million, of which $26.7 million allocated specifically to support the poor. Loans were offered at rates as low as 1% with a grace period of 2 years and a repayment term of 15 years [Kretovics and Micheal, 2005, 311]. SLS was not specifically designed with an accompanying cost recovery measure, but its introduction was accompanied by increases in tuition fees at least some public educational institutions [Ziderman,2006]. Over time, with relaxation of the eligibility criteria to include relatively better off households, the program failed its mission to reach the poor. The program started facing major problems due to false information (specifically understating household income to qualify for a loan), and default [Gamon, 2004]. According to newspaper accounts, almost one third of the borrowers did not make the required payments, and over a quarter of all borrowers failed to make a single repayment [Ziderman, 2003, 65]
27 The National Institute for Educational Testing Services, established in 2005 as a public organization, is responsible for managing the development of testing services in Thailand. This Institute is be responsible for conducting the Ordinary National Education Test (O-NET) and the Advanced National Education Test (A-NET).
28 Prior to the implementation of education reform, the upper class families, especially members of Bumiputera was far more likely to gain admission and receive state funding or financial aid—student from upper income Bumiputera families were 21 more times more likely to receive financial support than a poor one [Neville, 1998]. Also see Hwang [Hwang, 2005] for a more general discussion on the relation between income distribution, asset inequalities and public resources allocated to tertiary education.

2323
Given the failures of the SLS, the Thailand implemented a new loan scheme in 2007, called the Thailand Income Contingent and Allowance Loan scheme (TICAL). This new model, which places greater emphasis on cost recovery and cost sharing, and required the tax authority to collect repayments, which would be set as a percentage of taxable income, at progressive rates. The loan amounts were based on the “reference tuition rates” for a given discipline, and the coverage proportion depends on several factors that try to approximate the market value of the degree. In 2008, TICAL was suspended, and replaced by a new form of SLS, with a fixed repayment period of 17 years [Chapman and Kiatanantha, 2009].
G. Private tertiary education
In Malaysia, the Private Higher Education Act of 1996 allowed local private institutions to confer degrees and selected foreign universities to establish their branch campuses locally. The act established two categories of private higher education institution: private colleges and private universities.29 The Private Higher Educational Act 1996 was amended in 2003 to further reduce remove barriers to establishment and upgrading of private higher education institutions, including private universities, university colleges and branch campuses of foreign universities in Malaysia. As a result, private sector education in Malaysia has gained traction and credibility. In its earlier days, private education was merely catered for ‘‘dropouts’’ or provided language and religious education for minority groups [Wilkinson and Yussof, 2005]. Currently, students choose private universities if they cannot get into public institutions, but also if their desired area of study is not provided by public institutions, and especially if they would like to attend institutions with English language of instruction. As a result the number of private universities and enrollment at these institutions increased greatly. In 2007, private universities accounted for 60 percent of admissions, and half of overall enrolment.30
There is great variation across private higher education institutions in Malaysia. These include higher education institutions established by large corporations or organizations closely linked to the Malaysian government,31 institutions established by large publicly listed companies,
29 While private universities are allowed to confer degrees, private colleges are not. Three types of private colleges serve Malaysian higher education market: the first group prepares students to sit for external examinations leading to professional and semi-professional qualifications. The second group offers certificate and diploma level programs in a wide range of fields. Many of these programs, especially offered thourgh foreign universities have achieved high reputation leading to admissions to degree programs in foreign universities, or exemptions in external professional examination bodies, local or foreign. The third group offer bachelor degree programs through arrangements with foreign universities. For further details, see Wilkinson and Yussof [2005]. 30 Data from Ministry of Higher Education, 2007 Education Statistics. 31 These are typically established by state-owned enterprises. Three prime examples are National Oil Corporation’s Universiti Teknologi Petronas, the National Electricity Corporation’s Universiti Tenaga Nasional, Malasia Telecommunication’s Multimedia University and Public Work Deparment’s former Training institute, now called Kolej IKRAM.

2424
institutions established by political parties32 independent and self-funded private colleges, and local branches of foreign universities [Ahmad and Noran, 1999]. Private universities in Malaysia cost more than public schools, but tuition varies greatly between as low as $2,000 per annum for distance education to about $30,000 per year for medical degrees. Areas of study among private universities are becoming more similar to those offered in public universities. According to statistics compiled by MOHE, of the enrolled students in private universities, approximately 40 percent are enrolled in science and technology fields and 60 percent in social sciences and liberal arts. In comparison approximately 44 percent of students enrolled in public universities attend programs science and technology fields.
In Thailand the Private College Act of 1969 allowed for the establishment of private colleges. This Act was later revised multiple times (in 1979, 1992 and 2003, and 2007) to expand the scope of private higher education institutions, and to provide administrative autonomy to these institutions in academic, financial and personnel affairs. There are 68 private higher education institutions in Thailand, granting undergraduate and graduate degrees, or offering certificate or diploma programs in academic and vocational tracks. The establishment of a private higher education institution requires a license from the Minister of Education, based on the advice of the Higher Education Commission. Private universities also have University Councils, but the internal structure of the Council can be chosen more freely
Over the last decade, private universities have provided a rapidly increasing capacity, contributing greatly to the expansions of the Thai higher education sector. These institutions now account for 6 percent of admissions, 14 percent of enrollments, and 15 percent of graduates. Their autonomous structure, and dependence of private funding, of almost entirely from tuition collections, have increased their responsiveness to trends and demands in the labor market.
Compared to Thailand, private enrollment constitutes a much larger share of total enrollment in Malaysia across all levels of tertiary education but the most striking differences are at the diploma/certificate level. In Malaysia, private enrollments account for 55 percent of total enrollment across all diploma and certificate programs (excluding distance education) whereas this number is negligibly small in Thailand. At the undergraduate level, where private enrollments are strongest in Thailand, private enrollments account for 15 percent of total enrollments (as noted above) compared to 36 percent in Malaysia. Only 1 percent of students seeking their doctorate degrees attend private universities in Thailand compared to 9 percent in Malaysia (Figure 16).
32 In addition to the aforementioned Kolej Tunku Abdul Rahman, and Universiti Tunku Abdul Rahman owned by the Malaysian Chinese Association, Technical and Further Education College and Asian Institute of Science and Technology, established by Malaysian Indian Congress, and University Tun Abdul Razak of the United Malay National Organization can be counted among these institutions.

2525
Figure 16 – Enrollment by level and type of university
0%
20%
40%
60%
80%
100%MALAYSIA 2007
Private Public
75%
80%
85%
90%
95%
100%
Diploma Bachelor Master Doctorate Total
THAILAND 2006
Private Public
Source: MoHE for Malaysia, and CHE for Thailand
H. International Students and Staff
Following the Asian financial crises of 1997, the government have pursued making Malaysia a regional education hub [Mok, 2008].This policy was partly driven by the desire to provide relatively cheaper but still high quality education to children of Malaysian families who no longer could afford a foreign education for their children, and partly by the desire to make education a significant economic activity in Malaysia. 33 These two policy objectives had largely driven private education reforms. Additionally, Malaysian Government has allowed local public higher educational institutions to recruit international academic staff and allocate places in the non-competitive undergraduate academic programs to international students. The number of foreign students increased drastically between 1997 and 2004—at about more than 30 percent increase per year. Two thirds of foreign students are in private institutions (although share of public has been rising), and most foreign students are from China and South East Asia, primarily Indonesia. Foreign students tend to concentrate on business, information technology, arts, especially English language at the certificate and diploma level. Among public institutions, International Islamic University has the largest share of international students (31 percent) and staff (about 40 percent) mainly due to its establishment charter (which is under the companies act and no the University and University College Act). Foreign faculty constitute about 5.3 percent of total faculty, but their share is much higher in private institutions (at 8.3 percent) compared to public (4 percent). Most foreign faculty serves at the graduate, especially at the Ph.D. level.
Foreign university presence is Thailand is much more limited than Malaysia. By 2005, there were only two schools that have foreign ties: Webster University Thailand and St Therasa Inti College. Webster University is the first accredited U.S. institution in Thailand. St Theresa Inti 33 Malaysia actively promotes its higher education institutions through the Department of Private Education under the Ministry of Education (MOE), the National Association of Private Higher Education Institutions, the Malaysian Association of Private Universities and Colleges and the Malaysian Education Promotion Council. It has also established offices in neighboring countries (China, Indonesia, Vietnam, and United Arab Emirates).

2626
College is a partnership between Thailand’s St Theresa Technology of Business Administration School, Thailand and the Inti Group of Colleges, Malaysia.
A 2008 survey conducted by the CHE on the enrollment trends of international students finds that 16,361 foreign students enrolling in 96 Thai higher education institutions.34
While a rather small share (0.7 percent) of total enrollments, this number represents a three-fold increase in the presence of international students in Thailand since 2003, when only 4170 foreign students attended schools in Thailand. Fifty one percent of the international students attend private universities (down from 53 percent in 2003), and most are self funded, although a small portion (an estimated 10 percent) receive public and private sector scholarships. Chinese students make up the largest share of international students at 28 percent; other big nationalities include Myanmar, India, Vietnam, and Lao PDR constituting 5 to 8 percent each. Popular fields of study among foreign students are Thai Language, Business Administration, English Language, and International Business and Marketing .35
I. Quality Assurance
Two separate organizations in Malaysia provide quality assurance among higher education institutions: the Quality Assurance Division (QAD) of the MOHE, established in December 2001 is responsible for promoting public confidence in the quality of provision and standards of awards in public universities and university colleges. QAD overseas the Malaysian Qualification Framework (MQF), launched in 2004. The National Accreditation Board, established in 1996, is responsible from overseeing and regulating private higher educational institutions. Private institutions must obtain approval from Ministry of Education to offer a program, which is conditional on recommendation from the National Accreditation Board. Institutions must provide separate documentation for each course of study, including detailed information concerning teachers, subjects, facilities, management system, and rationale for providing the course.36 After establishment, the Board conducts audits to ensure that private universities abide by government standards and meet accreditation standards.37 In addition to QAD and the National Accreditation Board, joint technical accreditation committees made up of members of professional bodies,
34 The top five institutions having the highest number of foreign students are Assumption University (2,558 students), Mahachulalongkornrajavidyalaya University (1,329 students), Mahidol University (1,069 students), Burapha University (591 students), and Rangsit University (487 students).35 Similar to Malaysia, Thai students and academics favor overseas education, and government scholarships are the largest source of funding for these students. For one third of these students, the destination of choice is USA. See [Nattavud, 2005] for an analysis of factors that contribute to Thai student’s decision to study abroad.36 The board has about 155 staff and an annual budget of RM 14.3 million.37 This is the fourth step in establishing a private university. Private universities must first obtain an initial approval (or invitation, for branches of foreign universities) from Ministry of Education, and then form a company, that would be subject to government laws on equity participation, board structure, etc., as determined by the education. Once these two steps are complete, the institution must register with the Department of Private Education. For details see McBurnie & Ziguras [2001].

2727
practitioners, academicians, and government representatives oversee the quality of professional programs [National Accreditation Board, 2006].
In Thailand, universities are required to conduct internal and external quality evaluations.Internal quality assurance is the responsibility of the University Councils, which must assess universities on nine criteria, including various aspects of management, teaching quality, research, academic services to the community, finance and budgeting, among others. External quality assessment is under the Office for National Education Standards and Quality Assessment (ONESQA), which is responsible for developing criteria and methods of external evaluation, and evaluating educational achievements to assess the quality of institutions. ONESQA’s external assessments evaluate educational achievements (such as quality of graduates), teaching and learning, academic support and services, research and efficiency in administration and leadership. All educational institutions are subject to external quality evaluation at least once every five years [Bovornsiri, 2006]. ONESQA completed its first round of evaluations in 2005 [Somwung, 2007].
J. Research and Development
In Malaysia, 17 of the 254 research and development agencies are within universities.38
These research organizations have spent $94.8 million collectively in 2005 compared to $439 million spent by private sector entities. Public universities tend to have a larger size compared to private research institutions (spending about $5.6 million each as opposed to $2.2 million at the private sector) and they also spend a much larger share of their funds on staff (about 30 percent as opposed 15 percent at private institutions).
In Thailand, higher education institutions account for 17 percent of the total research expenditure as opposed 45 percent in government and 37 percent in the private sectors. Most research conducted at higher education institutions is applied, as opposed to the private sector which provides 89 percent of the experimental research. Universities mostly engage in research projects as a part of consulting services and technical or analytical services [Schiller andLiefner, 2007]. Public funding levels are too low to fund capital investments, dampening the number of academics committed to long-term research: only 20% of Thai academics conduct research continuously [Weesakul et al., 2004].39 Research budget accounts for 6 percent of total allocations to universities, but this number varies greatly across institutions.40 The key
38 See, for example, Ibrahim [1997] on a case study of Universiti Teknologi Malaysia. 39 Cited in Schiller and Liefner [2007].40 In 2005, 28 public higher education institutions had research allocations, and out of this group, eleven had research budgets that are greater than or equal to five percent of their entire budgets. Kasetsart University has the largest research budget in 2005—research allocations accounted for 19 percent of this university’s total budget appropriation from the government. Burapha University came second with 13 percent of its budget allocated to research.

2828
determinant of the research budget is the overall public fund allocations to universities—the practice of seeking funds from alternative sources (public, private or international) is not well established, but occasionally happens.
K. University-Industry Linkages
University-industry linkages do not appear to be strong neither in Malaysia nor in Thailand. Companies do not view universities as an important source of innovation in either country. According to firm level surveys, only 7 percent of the firms in Thailand and 3 percent of the firms in Malaysia consider universities and public institutions among the top three ways in which their establishments acquire technological innovations (Data from 2006). In both countries, the most common methods of acquiring innovations include internal development, in partnerships with clients or suppliers, or through acquisition of machinery. Even those companies that locally develop new technologies do not appear to view universities as important partners. In Thailand, more than half the firms that adopted locally developed technologies and innovations count other firms among the top three resources. Universities were mentioned as among the top three partners only 10 percent of the time.
Universities do not appear to be an important source of training for firms as well. Only 5.3percent of Thai firms that offer formal outside training to their employees collaborate with universities in 2006 (up from 3.7 percent). More than half of Thai firms turn to government institutes for formal training and about 31 percent (down from 40 in 2004) turn to private training schools. In Malaysia, the linkages are even weaker. Less than one percent of firms that offer outside training turn to universities as a training source. Private training schools, vocational schools, government institutes, and joint venture partners all offer some outside training opportunities for firms in this country.
L. Finance Indicators
In 2006, Malaysia and Thailand both spent about 4.5 percent of their GPD on public education expenditures. While expenditure shares are similar now, the two countries differ in their public funding history—in 2001, for example Malaysia allocated 7.5 percent of its GDP to public education, and since then this share has declined. Thailand’s allocation to public education has been more stable at around 4 to 4.5 percent between 2001 and 2007. Public education expenditure as a percentage of total government expenditure has also declined for Thailand—education expenditure accounted for approximately thirty percent of all government expenditure in 2001; in 2007, it accounted for one fifth. Latest data for Malaysia available for 2006s shows that public expenditure on education has stabilized at a quarter of the total government expenditure.

2929
Figure 17 – Public expenditure on education as a percentage of GDP and as a percentage of the total government expenditure
0%
5%
10%
15%
20%
25%
30%
2001 2002 2003 2004 2005 2006 2007
Public expenditure on education as % of total government expenditure
Malaysia Thailand
Source: UNESCO Institute of Education Statistics and UNESCO Education for All [2009].
Share of public education expenditure at the tertiary level is very different in two countries. Malaysia spent 36 percent of all education expenditure at the tertiary level in 2006—an amount comparable to previous years. Thailand, on the other hand spent about 17 percent of its total education expenditure on tertiary education down from 21 percent in 2001 (Figure 18). On a per capita basis, however, while Malaysia’s expenditure has decreased, suggesting that Malaysian public education expenditure did not keep up with the growth in the economy. In 2001, public funds allocated to tertiary level were at 110 percent of per capita income compared to 60 percent in 2006. However this should not be taken as a sign that overall less is being spent on tertiary education or that the educational outcomes have deteriorated—improvements in governance and school management, increased enrollments at public institutions, and the large shift towards the private education sector can collectively account for the reductions in per pupil public expenditures. Thailand’s per pupil expenditure, which has always been significantly below the Malaysian levels also declined during the same period from 38 percent in 2001 to 20 percent in 2007.
Figure 18 – Public Tertiary Expenditures
0%
10%
20%
30%
40%
2001 2002 2003 2004 2005 2006 2007
Share of tertiary education in total education expenditure
Malaysia Thailand
Source: UNESCO Institute of Education Statistics

3030
III. Labor market outcomes— demand for skills, skill shortages and mismatches, and firm level efforts to close the skills gap
In this section, we turn to the labor market outcomes, specifically focusing on the demand for skilled labor in Malaysia and Thailand, skills shortages and mismatches observed by the employers and employees in two countries, and firm level efforts undertaken to address these shortages and mismatches. This section provides firm-level evidence on skills outcomes using the Enterprise surveys conducted by the World Bank. When possible, the data is broken down by industry (manufacturing vs. service) and by type of firm (exporter status, and presence of foreign direct investment)41 to explore whether any cross-sectional variation exists across different parts of the labor market.
A. Demand for Skilled Labor
Two firm levels surveys conducted in Malaysia (2001 and 2006, published 2002 and 2007) and Thailand (2003 and 2006, published 2004 and 2006) allow us to tease out some information on the demand for professionals and skilled production workers by looking at the longer-term growth trends in their employment levels, as well as the relative compensation levels across professionals, skilled workers, and unskilled workers. Data from these surveys show that demand for skilled and professional workers remain strong as evidenced by growth in the number of hires across these two groups as well as the large salary premiums these employees receive over average salaries that prevail among all types of workers.
Figure 19 – Share of various types of employees in the workforce hired by firms
Source: WB enterprise surveys and author’s calculations
41 Enterprise surveys ask whether a firm has exported any part of its outcome in a given year or range of years. For the purposes of this study, all firms that responded “Yes” to this question were characterized as exporters. The surveys ask what percentage of the firm is owned by foreign entities (in addition to domestic private and public entities). Any firm with a foreign ownership of 5 percent or more . The surveys were published in 2002 and 2007 for Malaysia (data from 2001 and 2006) and 2004 and 2006 in Thailand (Data from 2003 and 2006).

3131
Differences in educational outcomes in Thailand and Malaysia are reflected in the composition of the workforce hired by firms in two countries. Skilled labor constituted 13 percent of the employees in Thailand in 2006, and 27 percent of the employees in Malaysia. As a result, Thai firms relied far more heavily on unskilled labor compared to Malaysian firms.Unskilled workers (or positions for unskilled workers) constituted 73 percent of the employeeshired by Thai firms 53 percent hired by manufacturing firms and 24 business services firms in Malaysia. Not surprisingly, service firms hire a larger number of clerks. Firm level data suggests that Malaysian firms may have become more professional and formal in their internal organizations: Managerial personnel accounted for two percent of the employees in Thailand in 2006 as opposed to 5 percent in Malaysia, and professionals accounted for only 3 percent of the employees in Thailand compared to 6 percent among firms in the manufacturing sector and 21 percent among firms in the service sector in Malaysia (Figure 19).
Given the relatively low share of positions filled by skilled workers, Thai firms appear to have pushed harder to hire more skilled workers in recent years. The number of skilled employees grew by 13 percent between 2001 and 2003 in Thailand and by 9 percent between 2003 and 2006, compared to an overall expansion of 8 and 7 percent of the entire employee force during the same period. In contrast, the demand for skilled workers have stabilized in Malaysia—the manufacturing firms expanded their skilled workers by 7 percent between 1999 and 2001 (this is at par with overall employee growth), yet only by 1 percent between 2004 and 2006 (overall employee growth was 9 percent in this period). Among service firms in Malaysia skilled labor growth has been below the overall rate of firm expansion since 1999: Employees did not add many more new skilled workers between 1999 and 2001, when overall employee growth was 6 percent, and skilled workers increased by 2 percent between 2004 and 2006, compared to the overall growth of 5 percent (Table 6).
Table 6 – Growth in Hiring, Various YearsManagement Professionals Skilled
Production Workers
Unskilled Production
Workers
Non-Production
Workers
Total
THA 2001 to 2003 5% 20% 13% 7% 8% 8%
THA 2003 to 2006 9% 21% 9% 5% 17% 7%
MYS M 1999 to 2001 8% 15% 7% 6% 9% 7%MYS M 2004 to 2006 11% 20% 1% 13% 9% 9%
MYS S 1999 to 2001 18% 9% 0% 1% 15% 6%MYS S 2004 to 2006 12% 8% 2% 0% 9% 5%
Source: Enterprise surveys and author’s calculations
On the other hand, Malaysian firms have expanded rapidly their managerial staff. Managerial staff grew at a rate higher than the firms’ overall expansion in both countries, but

3232
Malaysian service sector firms pushed particularly hard, increasing their managerial staff by 18 percent between 1999 and 2001 and 12 percent between 2004 and 2006, signaling an effort to achieve a more corporate-like structure.
Figure 20 – Growth in jobs filled by certain types of employees, since 1999 for MYS and since 2001 for THA
Source: Enterprise Surveys and author’s calculations
Professional employee growth has been strong in both countries. The share of professional workers is relatively small in Thailand, but firms have greatly increased their professional workers by expanding this pool of employees by more than 40 percent (or approximately by an average of 7 percent) since 2003. Malaysian manufacturing firms increased professionals by about 6 percent annually since 2001 and service firms increased by nearly 3 percent (Figure 20)
The net intake rate—the net addition of a certain type of employees as a ratio of the total number of employees—tells an interesting story. The net intake rate allows us to see the growth in a certain type of job after accounting for turnover—employee losses due to separations, resignations and retirement. Unfortunately, unlike total employment numbers, the net intake rate is only available for two years (2003 and 2006 for Thailand, and 2001 and 2006 for Malaysia). But this number still gives a sense of the types of labor in highest demand.
Focusing on the latest available data for both countries, one can see that Thai firms and manufacturing firms in Malaysia were still adding net new jobs by the end of 2006 whereas service firms in Malaysia had contracted. The contraction was greatest among the production workers, both skilled and unskilled, among the service firms in Malaysia, while the only group that expanded were the professionals. The greatest net increase was among professionals in Thailand and among manufacturing firms in Malaysia—the percentages are significantly higher than the overall net increase rates in both of these cases.

3333
Table 7 – Net intake Rate, various yearsManagement Professionals Skilled
ProductionUnskilled
ProductionClerical/Non-production
Total
THA 2006 1.7% 4.6% 1.1% 0.1% 2.9% 0.7%THA 2004 0.2% 4.8% 1.5% 1.4% 2.4% 1.6%MYS 2007 M -0.3% 7.4% -0.4% 0.6% 6.9% 1.7%MYS 2002 M 1.3% 0.6% -0.4% 0.2% -2.5% -0.2%MYS 2007 S -0.2% 1.6% -3.5% -2.0% -0.5% -1.2%MYS 2002 S -0.6% 1.7% -5.4% 0.5% 0.8% -0.8%
Source: Enterprise Surveys and author’s calculations
Education levels, experience and skills constitute the most important considerations firm use in recruiting. Close to 40 percent of all employers, both in Thailand and Malaysia citedexperience among the most important trait they look for in a prospect employee in 2006—this is up by 10 percent in Thailand since 2003 and rather stable in Malaysia since 2001. Educationlevels are valued more by service firms in Malaysia (29 percent of all firms mention education levels as a main consideration for hiring, compared to 17 percent among Thai firms and 16 percent among manufacturing firms in Malaysia), whereas technical skills are rather important across all firms—more than one fifth of all survey participants noted technical skills as a major consideration in their hiring decisions (Figure 21).
Figure 21 – Most important considerations firms use in recruiting, data from 2006
Source: Enterprise Surveys and author’s calculations
The salary premiums received by skilled and professional workers in Thailand and Malaysia suggest that demand for both types of workers continue to be very strong. Table8 depicts the compensation premium a given type of employee received in 2006 relative to

3434
unskilled production workers. In both countries skilled production workers earned about twice as much as unskilled production workers, but while compensation premiums increased in Thailand and among manufacturing firms in Malaysia, they have fallen down among service firms in Malaysia—skilled production workers earned 2.29 times the total compensation earned by unskilled workers among these firms in 2002 compared to 1.96 times in 2007. Increased premiums over time can show not only the continuing growth in demand but also difficulty in filling positions. Premiums paid to professional workers have increased in Thailand echoing the rapid expansion of these types of employees between 2004 and 2006, but decreased slightly in Malaysia. In both countries, managerial staff received a very high premium—5 times the average salary of unskilled workers in Thailand, six times among manufacturing firms and 11.5 times among service firms in Malaysia. In both countries, managerial salaries have declined in relative terms anywhere from 70 to 80 percent suggesting that the firms can fill in their managerial posts without much difficulty.
Table 8 – Compensation Premiums, Various yearsManagement Professionals Skilled
Production Workers
Unskilled Production
Workers
Non-Production
WorkersTHA 2006 7.26 3.57 2.09 1.00 1.81
THA 2004 9.35 2.88 1.43 1.00 1.33MYS 2007 M 5.96 4.31 1.95 1.00 1.70MYS 2002 M 7.35 4.61 1.78 1.00 1.04MYS 2007 S 11.52 3.16 1.96 1.00 1.09MYS 2002 S 17.07 3.48 2.29 1.00 1.07Note: Premiums are calculated as the difference between the average compensation across a certain type of employee and the average compensation among unskilled production workers. Compensation amounts include fringe benefits. Source: Enterprise Surveys and author’s calculations
Continued expansion among professional and skilled workers and the high compensation premiums received by these two groups of employees suggest that the demand for skills continues to be strong in both countries, especially in Thailand where skilled labor growth appears to be still above the average growth in jobs across all types of employees. Despite the high salary premiums, the share of skilled and professional employees appear to remain relatively constant (except for professional workers among manufacturing firms in Malaysia, which doubled their share between 2002 and 2007), suggesting that skills shortages continue to play an important role in firms’ hiring decisions.
B. Shortages in the supply of skilled and professional labor
Both in Malaysia and Thailand, lack of skilled workers in a key bottleneck in increasing firm capacity. In 2006, approximately one third of firms in both countries identified lack of skilled workers as a major capacity constraint. In Thailand lack of skilled workers was a greater constraint for firms that are domestically owned (50 percent note this as a major issue) whereas

3535
in Malaysia, firms producing for the local market had particularly difficult time in finding skilled employees (Figure 22, first panel). Since 2003, the percentage of firms that considered lack of skilled workers as a key capacity constrained increased by 10 percent in Thailand. In Malaysia, on the other hand, this constraint appears to have relaxed over time—among manufacturing firms 30 percent of firms considered lack of skilled workers as a key constraint in 2006 down from 42 percent in 2001, and among service firms, 25 percent compared to 29 percent in 2001. Lack of unskilled workers appears to be a relatively smaller problem in Thailand. In 2003, 12 percent of all firms reported lack of unskilled workers as a capacity constraint (Data does not exist for 2006). In Malaysia, however, lack of unskilled workers was a major cause of capacity constraints for 27 percent of the firms in 2007—a non-trivial amount—and demand for unskilled labor was fueled by firms in the manufacturing sector (Second panel of figure 22).
Figure 22 – Lack of skilled and unskilled workers as a capacity constraint
Source: World Bank Enterprise Surveys
One third of all firms in Thailand and more than forty percent of all firms in Malaysia report vacancies in skilled labor positions. Vacancies across all types of positions—professional, skilled and unskilled—appear to be the biggest problem for exporters and firms with foreign direct investment. This is not surprising since most times these two types of firms overlap (Figure 23). Compared to data collected in 2003, 9 percent fewer firms reported vacancies in professional positions Thailand in 2006. Percentage of firms with vacancies for skilled workers remained stable, whereas this percentage slightly increased for unskilled workers. In Malaysia fewer firms in the manufacturing sector reported vacancies for production workers where as many more service firms reported vacancies. This may be because having to rely more heavily in production workers—both skilled and unskilled—firms in manufacturing sector might have put more effort in hiring these workers (Table 9).
Table 9 –Changes in the percentage of firms reporting vacanciesTHA 2003 to 2006 MYS M 2001 to 2006 MYS S 2001 to 2006

3636
Professionals -9% 2% 2%Skilled Production 0% -8% 5%
Unskilled Production 1% -4% 5%
Source: World Bank Enterprise Surveys and author’s calculations
Figure 23 – Percentage of firms with vacancies
Source: Enterprise Surveys
Most recent survey data from Thailand and Malaysia shows that it takes five to seven weeks to fill a professional vacancy, and the difficulties are greatest in among exporters and firms with foreign direct investment. In both countries companies that export their products or with foreign ownership face the longest wait—possibly because they face tougher competitors in the labor market. Filling a vacancy for a skilled production employee takes about the same time in both countries—five weeks—yet filling a position for an unskilled production worker takes twice as long in Malaysia—four weeks compared to about two in Thailand (Figure 24). That said, at least for the business services sector in Malaysia, firms’ ability to fill positions appear to have increased over time: between 2001 and 2006, amount of time a firm spent to fill a position declined by four to five weeks, depending on the type of employee. Malaysian manufacturing firms have seen no major improvements whereas Thai firms take one less week to fill professional positions and one more to fill skilled production positions (Table 10). Of course this wait can also be explained by differences in effort, but given that these are observed across a pool of firms, at least some portion of this decline could be attributed to the labor market conditions.
Table 10 –Changes in the average weeks to fill a vacancyTHA 2003 to 2006 MYS M 2001 to 2006 MYS S 2001 to 2006

3737
Professionals -1 0 -5Skilled Production 1 0 -4Unskilled Production 0 0 -4Source: World Bank Enterprise Surveys and author’s calculationsFigure 24 – Average weeks to fill a vacancy
Source: Enterprise Surveys
While firms in Malaysia mention very high wages demanded by applicants as the top reason for vacancies more frequently than other causes, most Thai firms complain not of high wage demand but high turnover rates. 24 percent of manufacturing firms and 32 percent of service firms cite high wage demand as the top reason for vacancies in 2006—up from 7 and 1 percent respectively since 2002. This is interesting since both the relative and the absolute compensation levels for skilled and production works have actually decreased during the same period. In Thailand, the most frequently reason cited for vacancies is high turnover rates—thirty percent of all firms cite this as the top reason for vacancies, down 1 percent from 2004. This might be simply because of relatively low wages—many firms do not think of high wages demanded as a top reason for vacancies: only 8 percent of the firms mention this in Thailand, down 4 percent from 2004 (Figure 25). It may also be relatively low quality of workers with higher education degrees. As seen in Figure 21, education levels is an important factor in hiring, and in Thailand, given the higher gross enrollment rates at the tertiary level, relatively larger number of university graduates are looking for jobs in Thailand. University credentials might have allowed these employees to get jobs, but not necessarily hold them for a long time.

3838
Lack of basic and technical skills appears to be a major cause of vacancies in both countries. In Thailand 22 percent of firms cited applicants’ lack of basic skills as a cause of vacancy in 2006—up 10 percent from 2004, and 18 percent cited lack of technical skills—up 5 percent. In Malaysia, both manufacturing and service firms appear to assign similar weight to lack of skills: 19 percent cite lack of basic skills among manufacturing firms and 18 percent among service firms, both down by 1 percent since 2001. This is perhaps the biggest difference from Thailand. Neither lack of basic skills nor lack of technical skills has become a bigger influence in Malaysia—perhaps because the demand for production workers has stabilized over time.
Figure 25 – Top reason for vacancies
Source: World Bank Enterprise Surveys
Lastly, only 4 percent of firms in Thailand think that they see vacancies because universities do not supply a sufficient number of graduates; this number is down 12 percent in 2004. This is consistent with higher gross enrollment rates seen in Thailand. In Malaysia, on the other hand, this pure supply side problem seems to carry a bigger weight—14 percent of manufacturing firms and 13 percent of service firms cite this as the top reason for vacancies—a ratio that has remained pretty stable since 2001. Again, given that gross enrollment rates are relatively low (or rather was low in 2006) this outcome is not surprising.
C. Skills mismatches in the labor market
Both employers and employees in Thailand and Malaysia point out to skills shortcomings and mismatches as major problems, although skills shortages and mismatches appear to be

3939
a bigger problem in Thailand, especially among professional workers. Interviews with personnel managers reveal that in Thailand, lack of proficiency in English was top area in which performances of professional (64 percent of firms) or skilled production workers (91 percent of firms) were rated as poor or very poor (Figures 25 and 26). The differences in strength of performance across attributes important for managers is very pronounced between Thailand and Malaysia—a Thai professional is three to fifteen times more likely to be evaluated as poor or very poor compared to his Malaysian counterpart. For example, only 4 to 5 percent of professionals are rated poor or very poor in their English language proficiency in Malaysia compared to 64 percent in Thailand. In technical and professional skills, where the differences are smallest, Thai professionals are still 3 to 3.5 times more likely to be scored as poor performers. Additionally, over time Thai professionals’ performances appear to have stagnatedin these skills: in four of the twelve areas surveyed, a larger proportion of Thai managers assessed professionals’ attributes as poor or very poor in 2006 compared to 2004 (these are English language skills, team working skills, time management skills and adaptability), and we see no improvement in two areas (social skills and problem solving). All other gains are modest compared to the initial starting point. The largest gain is in IT skills where 35 percent of managers rated professionals as having poor or very poor skills in 2007 compared to 40 percent in 2004.
Gains are more widespread and relatively much larger in Malaysia (although the time lag between the two surveys is also greater). For example, percentage of manufacturing firms rating professionals’ attributes as poor or very poor have gone down from 13 to 7 percent for IT skills, 8 to 4 percent for English skills, and 8 to 5 percent for time management skills from 2001 to 2007. Similar gains across the board are also observed for ratings of professionals at the service industry.

4040
Figure 26 – Worker attributes among professionals, percentage of firms think these are very poor or poor
Source: World Bank Enterprise Surveys and author’s calculations
Skilled workers in Thailand are also more likely to be scored as poor or very poor performers compared to their Malaysian counterparts but the differences are not as pronounced as they are for professionals. In the area of technical skills, for example, 38 percent of Malaysian manufacturing firms rated skilled employees as poor or very poor compared to 24 percent in Thailand, and in this area Malaysian gains (4 percent down over 5 years) do not appear to be much greater than Thai gains (3 percent down over 2 years.) But in all other areas inquired, Malaysian skilled workers are less likely to be rated unfavorably compared to Thai firms, and the differences are more pronounced for skilled workers of the service sector. Biggest areas of gain for Malaysian skilled workers are English language proficiency (down from 68 percent in 2001 to 24 percent in 2006 for manufacturing firms, and down from 33 percent to 7 percent for service), numerical skills (down from 33 to 8 percent and 15 to 4 percent for manufacturing and service firms respectively), and problem solving skills (down from 33 to 6 percent and 24 to 6 percent respectively). In contrast, skilled workers in Thailand did not achieve significant gains in any of these areas. In fact, in two areas (English language proficiency and IT skills) skilled workers were more likely to be rated poor or very poor in 2006 compared to 2003and in four areas, no significant gains are achieved.

4141
Figure 27 – Worker attributes among professionals, percentage of firms think these are very poor or poor
Source: World Bank Enterprise Surveys and author’s calculations
A similar question asked to the workers show that even though workers and personnel managers typically agree on areas of weaknesses, workers tend to have a more favorable opinion of their own skills, but are less likely to recognize their own improvements. Only 26 percent of workers rate English proficiency skills among the top three areas where they lack skills the most whereas managers would rate 64 percent of professional workers and 95 percent of skilled workers as poor or very poor in this area. These differences hold for every trait and may simply be due to different interpretations of the survey question. For example employers or personnel managers might have been assessing the entire labor force and not only their own employees whereas workers assessed their own performances. Additionally, the great differences between Thai and Malaysian managers’ assessment of worker attributes disappear for self assessments. Except for English Language skills, workers’ self assessments in two countries, especially for manufacturing sector firms in Malaysia, appear to be very similar.

4242
Figure 28 – Worker attributes: percentage of workers rank among top three skills they think they lack the most
Source: World Bank Enterprise Surveys and author’s calculations
Another interesting difference between workers’ self assessments and managers’ assessments of workers is the change over time. Both in Thailand and Malaysia, workers self assessment has not significantly improved in most of the areas inquired about. This may be because the relative importance of skills has improved over time, and not because workers’ skills have stayed stagnant. It may also be because workers’ are asked to rank their shortcomings where managers are asked to grade workers on these shortcomings. IT skills is an interesting area—15 percent of Thai workers rank IT skills among their top three weaknesses, down from 18 in 2004, and 12 percent of Malaysian service sector workers rank IT skills among the top three weaknesses, down from 16 percent in 2002. These assessments agree with the gains recognized by the Thai managers (at least for professional workers) and Malaysian managers. However, for manufacturing firms in Malaysia, while workers are significantly less likely to be assessed as poor or very poor by their managers, their self assessment in this area does not appear to have changed.
Most employees feel fully utilized in their current positions, but still feel that expanding their skills would have improved their performance (Figure 29). In 2006, 91 percent of the employees in Thailand thought their current jobs offer sufficient scope to use their knowledge and skills (up 3.1 percent since 2003), yet 96 percent felt they could have performed better had they possessed additional knowledge and skills (up by 1 percent since 2003). Relatively fewer employees were content with their jobs in Malaysia the same year—67 percent of manufacturing

4343
sector employees and 82 percent of the service sector employees feel utilized in their jobs (up from 50 percent in the manufacturing sector, and from 75 percent in the service sector). And 80 percent of manufacturing sector employees in Malaysia and 88 percent in the service sector feel additional knowledge and skills would improve their performance (up by 7 and 9 percent respectively, since 2001). Employees’ forward looking assessments of themselves is even less favorable. Only 72 percent of the workers Thailand thought that they had the necessary skills to adapt to the changing needs of the labor market in 2006 (down from 93 percent in 2003) as opposed to 70 percent of the workers in the manufacturing sector Malaysia (up six percent since 2001) an 77 percent of the workers in the service sector (no change since 2001) (Data presented in section D)Figure 29 – Important job traits and ability to use skills and knowledge
Source: World Bank Enterprise Surveys and author’s calculations
Over half the employees in both countries feel that the degrees they hold match their own assessment of the degree appropriate for the job (Tables 11 to13) . This feeling is strongest among the service sector employees in Malaysia—66 percent of workers think the degrees they attained are a right fit for the job requirements. Of the remaining 36 percent, 22 percent feel their attained degrees fall short of the degree required for the job. In Thailand, 26 percent of the employees feel their attained degrees fall short of the degree required by the job (and 23 percent feel they are overeducated) whereas in Malaysia’s manufacturing sector, 30 percent feel overeducated, and 19 percent, undereducated. Employees with tertiary degrees usually feel that the level of education they have matches the level required for the job: 82 percent of the Thai workers, 75 percent of the Malaysian manufacturing sector workers, and 85 percent of the Malaysian service sector workers with higher education degrees think their current jobs require a higher education degree.

4444
Table 11 –Workers’ assessments of degree held vs. degree required, Thailand 2006Degree required
Degree Held↓Degree Diploma Upper
SecondaryLower Secondary
Primary Illiterate
Degree 17% 3% 1% 0% 0% 0%Diploma 3% 6% 2% 1% 0% 0%Upper Secondary 3% 4% 9% 4% 1% 2%Lower Secondary 1% 1% 4% 8% 2% 3%Primary 1% 1% 3% 6% 10% 6%Illiterate 0% 0% 0% 0% 0% 0%
Table 12 –Workers’ assessments of degree held vs. degree required, Malaysia Manufacturing 2007Degree required
Degree Held↓Degree Diploma Upper
SecondaryLower Secondary
Primary Informal Illiterate
Degree 6% 1% 1% 0% 0% 0% 0%Diploma 2% 7% 2% 0% 0% 0% 0%Upper Secondary 1% 6% 22% 6% 1% 0% 1%Lower Secondary 0% 2% 8% 12% 2% 1% 1%Primary 0% 0% 3% 4% 4% 1% 1%Informal 0% 0% 0% 1% 0% 0% 0%Illiterate 0% 0% 0% 0% 1% 0% 1%
Table 13 –Workers’ assessments of degree held vs. degree required, Malaysia Services 2007Degree required
Degree Held↓Degree Diploma Upper
SecondaryLower Secondary
Primary Informal Illiterate
Degree 30% 4% 1% 0% 0% 0% 0%Diploma 6% 15% 2% 1% 0% 0% 0%Upper Secondary 2% 7% 17% 2% 0% 0% 0%Lower Secondary 0% 1% 3% 4% 1% 0% 0%Primary 0% 0% 0% 1% 1% 0% 0%Informal 0% 0% 0% 0% 0% 0% 0%Illiterate 0% 0% 0% 0% 0% 0% 0%
Source: World Bank Enterprise Surveys and author’s calculations
In 2006, half of the workers in Thailand did not feel that a specific field of education is required for their current positions, but this sense of lack of need for specialized knowledge is diminishing. In 2003, 61 percent of the Thai workers did not think their positions required a specific knowledge (Figure 30). These proportions are smaller, yet increasing in Malaysia: 40 percent of workers in the manufacturing sector and 16 percent of workers in the service sector did not think their positions required specialized education (up by 11 percent and 2 percent respectively since 2001). Interestingly, on the other end of the spectrum, a larger proportion of workers in Thailand compared to Malaysia think their field of education is the most appropriate for their current jobs: 21 percent of Thai workers believed in this perfect, yet restrictive match

4545
(up from 13 percent in 2003) compared to 7 and 15 percent of workers in the manufacturing and service sectors in Malaysia. The largest proportion of “misplaced” workers is in the manufacturing sector of Malaysia. In 2006, 17 percent of such employees believed they held jobs completely unrelated to their field of education compared to 15 percent of service sector workers in Malaysia, and only 6 percent of Thai workers. This measure is perhaps not necessarily a measure of mismatch but a measure of worker’s adaptability skills (again, greater in Malaysia) or firms’ ability to train workers on the job, which we turn to in the next section.
Figure 30 – Important job traits and ability to use skills and knowledge
D. Firm level efforts to address skills shortages and mismatches
Firm level surveys show that a large share of firms in Thailand and Malaysia offer both formal in-house training and outside training. In Thailand 64 percent of all firms offered formal in-house training and 67 percent offered outside formal training in 2006. In Malaysia, in –house training appears to be favored—47 percent of the Malaysian firms surveyed offered in-house training compared to 42 percent in Thailand. Training, both in-house and outside, is more common among exporters and firms with foreign direct investment (Figure 31). In Thailand, over time firms appear to favor outside formal training to in-house training: percentage of firms offering in-house training declined by 1 percentage point between 2003 and 2006 in this country. Malaysian firms’ are mixed in this regard: service firms, which were heavily involved in training in 2001, have fallen behind manufacturing firms in 2007. They reduced outside training

4646
opportunities (48 percent of firms offered outside training in 2006 compared to 53 percent in 2001) but did not expand their in-house training (left constant at 39 percent). Manufacturing firms have expanded both types of training, especially in-house training: Half the firms reported such training opportunities in 2006 compared to 36 percent in 2001.
Figure 31 – Percentage of firms with in-house and outside formal training, and source of outside training
Managers and supervisors are the largest sources of internal training for Thai firms, followed by government institutions and training consultants. These two groups combined account for 35 percent of the sources of internal training in Thailand (Table 14). Dedicated internal trainers also play an important role in internal training in Thailand whereas other workers, suppliers or business partners do not play any important role and the role of NGOs and donors is negligible. In Malaysia, training appears to be more formally organized internally: specialized trainers – internal trainers and training consultants combined—account for more than half of internal training offered across both manufacturing and service firms. Supervisors and managers account for another 22 percent (service) to 28 percent (manufacturing). Unlike Thailand, the role of government institutions is negligible. External training is largely sought from government institutions in Thailand and private training schools and vocational/technical schools in Malaysia. As discussed elsewhere, the role of universities in training is almost nil in Malaysia and very little in Thailand (Table 15). Manufacturing firms also heavily rely on Human Resource Development Fund programs.
Table 14 –Sources of internal training, 2006THA 2006 MYS 2007 M MYS 2007 S
Dedicated internal Trainers 9% 21% 30%Managers 16% 9% 13%Supervisors/foreman 19% 19% 9%Experienced Workers 4% NA NA

4747
Suppliers, buyers, business partners 4% 11% 5%Training consultant 10% 31% 26%Donors, NGOs 0% 2% 1%Government institution 16% 3% 3%
others 22% 5% 12%
Source: Enterprise Surveys and author’s calculations
Table 15 –Sources of external training, 2006THA 2006 MYS 2007 M MYS 2007 S
University 4% 1% 1%Joint-venture Partners 1% 1% 8%Government institutes 42% 11% 12%
Private training schools 25% 22% 30%Vocational/technical schools 1% 21% 5%
Human Resource Development Fund (HRDF) NA 29% NAothers 27% 15% 43%
Source: Enterprise Surveys and author’s calculations
Areas in which training are offered does not seem to be sensitive to the training type. In Thailand, information technology and intellectual property are the two areas firms offer training most frequently, both through internal programs and through external programs. Despite the language skill shortcomings pointed out by both the firms and the workers, this does not seem to be an area firms focus on greatly, and perhaps not surprisingly, they are more likely to offer language training through external programs. Across manufacturing firms in Malaysia, production technologies, management and quality technologies and safety procedures appear to be the most popular areas in which training is offered. These three areas account for 66 percent of internal training and 64 percent of external training offerings. Service firms, on the other hand, most likely focus on IT training and training programs in management and quality technologies. Again, given that Malaysian personnel managers frequently cite leadership skills as an area are of shortcoming, the focus on management and quality technologies training is not surprising. These programs also help explain the improvements in worker performance in leadership skillsand IT skills, as evidenced by the data presented in Figures 26 to 28.
Table 16 – Areas of training offered by firms, 2006THA 2006 MYS 2007 M MYS 2007 S
Internal Outside Internal Outside Internal Outside
Production technologies 6% 10% 30% 24% 9% 8%
Marketing 3% 4% 4% 7% 8% 8%
Information technology 28% 34% 9% 12% 18% 21%
Management / quality technologies 5% 4% 20% 27% 18% 18%
Intellectual property 40% 26% 6% 5% 4% 2%
Safety procedures 8% 3% 16% 13% 9% 7%

4848
Language skills 8% 16% 4% 4% 5% 5%
others 2% 3% 11% 9% 29% 30%
Source: Enterprise Surveys and author’s calculations
Worker surveys, however, highlight the lack of training opportunities. Majority of workers who feel that they have the necessary skills to adapt to the changing needs of the labor market do not know where to get training (Figure 32). In Thailand, 28 percent of the workers surveyed found their skills lacking and only one quarter of these workers where to get training. In Malaysia, the numbers are comparable—30 percent of the workers in the manufacturing sector did not feel they had the necessary skills to adapt to the changing needs of the market; and one fifth in this group did not know where to turn to get training. The percentages in the service sector are not much better: of the 23 percent of workers who deemed their skills lacking, more than a quarter knew where to go to get training (Table 11). This is consistent with higher degree of availability of training among the service sector, as noted above.
Figure 32 – Need for training, and knowing where to go
Source: World Bank Enterprise Surveys and author’s calculations
Training offered by firms appears to be the only source of post-education training for skills development and enhancement. Both in Thailand and the Malaysia, after work learning programs are a novelty. Only 7 percent of workers are enrolled in such programs and seventy percent of these workers rely on non-public funds to pay for these programs (Table 17). In Malaysia, after work programs are rarer. Only 3 percent of manufacturing sector workers and only 1 4 percent of service sector workers are enrolled in such programs and two thirds to three quarters of these workers either pay for these programs themselves or rely on some other non-public funding source.

4949
Table 17 – Workers’ access to training and funding sources
Are you currently enrolled in any after work learning program?
THA 2004 MYS 2002 M MYS 2002 S
Not enrolled in After Work Learning Program 93% 97% 96%
Government Financed 2% 1% 1%
Not Government Financed 5% 2% 3%
Source: World Bank Enterprise Surveys
IV. Addressing skill mismatches and shortages - Next steps
Over the last two decades, the higher education sectors in Thailand and Malaysia succeeded on many fronts. Access and enrollment grew rapidly, largely as a result of liberalization of the education markets and rapid expansion of the private education sector. Public universities have penetrated all levels of tertiary education. Both countries have started using multiple-delivery models and have a more modular approach to education (especially in Malaysia). Access in remote areas has improved with more higher education institutions (both public and private) being established across the two countries. University governance also changed significantly, and the control of the central government is largely relaxed in both countries. Universities have more control over their personnel, financial, and academic management—certainly among the private higher education companies, but also among public universities, even if this autonomy comes at varying degrees. Thus, both of these countries have taken important steps in the right direction.
The qualitative narrative of the higher education structures in both of these countries, higher education indicators and the firm-level analyses point to the following six stylized findings:
Demand for skilled workers continues to be strong and the growing number of university graduates in both countries does not appear to satisfy this demand. A significant portion of firms report persistent vacancies with increasing durations despite high salary premiums they are willing to offer to skilled employees.
“Educated” workers do not appear to be the most skilled. Technical skills and experience emerge to be far more important in hiring decisions compared to educational achievement. In this regard, Thai universities are especially weak.
Lack of skilled employees comes at a high cost to firms. Many firms see lack of skilled employees as a key bottleneck for expanding their capacity.
Employees feel misplaced, and underqualified. Furthermore, many feel they lack the necessary skills to adapt to a changing labor market, and do not know where to turn for help.

5050
Hiring managers are also wary of skills mismatches. They think employees are missing the necessary skills for success, especially language skills, innovative thinking, technical and information technology skills.
Industry/firm linkages are very weak. Firms do not perceive universities as a major source of know-how, innovation, training, or even employees.
As they look for ways to improve the relevance and quality of their higher education institutions and the employability of their graduates, governments and higher education institutions in Thailand and Malaysia may consider the following, somewhat overlapping recommendations:
Shift academic focus to areas where the demand is greatest. While it is not unusual for higher education institutions to respond to the demands of the labor market with a lag [Bardhan et.al. 2010], in Malaysia and Thailand, this pace appears to be glacial. In Thailand for example, despite two decades of reforms, two thirds of students are still enrolled in humanities and social sciences programs whereas the needs are clearly elsewhere. In Malaysia, this share is smaller, but not necessarily small enough. Providing special subsidies or bursaries to students enrolled in areas in greatest need, providing financial incentives to universities that expand in such areas, or lowering barriers to the creation of specialized schools42 can help increase this pace.
Expand private education more, especially in Thailand. Obviously one way of lowering barriers is to allow expansion of private education. While Malaysia has made important gains in this area, private universities are still growing slowly in Thailand. Allowing the establishment of private universities with limited focus, and setting up systems where private universities could use public infrastructure, at least through their infancy can increase the pace of the expansion of private enrollment.
Rethink governance reforms. Governance reforms implemented in both countries have given universities more control over their affairs, yet these controls are appear to be mostly geared towards daily operations of universities and not academic or reputational outcomes. The main goal of these reforms were to institute more corporate-like structures at the universities, especially in Malaysia, but this outcome has proven to be elusive. Governance reforms must be revised in both countries to establish high-stake links between university governance and labor market needs. Currently university governance, including tenure and salaries of the management or the academic personnel do not at all depend on labor market outcomes. This is partly due to the lack of mobility among academicians and university management and the consequent “thin” academic markets. The government can help such stakes by linking part of public funding to labor market outcomes.
42 Op. cit. Bardhan et al [2010].

5151
Foster mechanisms that would measure the quality of the output, not just the input. While governments of both countries have increased their focus on accreditation and quality assurance mechanisms (which are designed to measure the quality of inputs), little has been done to assess the quality of outputs. In fact, universities do not appear to have a great interest in understanding how firms view them, and little information exists, outside anecdotal evidence, on how employers perceive universities, even when such preferences might be expressed over general classifications. 43 Encouraging ranking of universities or their graduates can help make focal the quality of outcomes, and bring about reputational motivations for improvements in quality and relevance.
Improve linkages with the industry. Firm level evidence reviewed in this paper has shown that universities in Thailand and Malaysia are seen important sources of neither employees or nor training. This is a startling outcome, since primary goal of attending higher education institutions is getting a job, and among the primary justification of higher education institutions are producing knowledge, and knowledgeable and skilled workforce. There also seems to be little interest among firms to establish deeper linkages with higher education institutions, specifically to foster employee quality [Brimble, 2007]. Providing channels through which universities can receive funds from the industry could quickly change this outcome.
All these recommendations are a function of funding, so look for ways to increase funding, andnot just necessarily through public sources. Data from Thailand and Malaysia show that public expenditures on education have been stagnant in both countries. This has not limited the growth of higher education, but it threatens continued expansion, equitable access, and improved quality and relevance. Data also shows that firms have a lot at stake in this equilibrium. Firms in both countries are willing to pay large premiums to skilled employees, spend additional funds to train their current workforce, and yet frequently cite lack of skilled labor as a key capacity constraint, which can potentially limit their earnings. Thus, there appears to be some willingness on the parts of the firms to financially support institutions of learning that could alleviate this bottleneck. Looking for ways to capitalize on this demand can create additional funds for public and private universities in both countries.
43 For example, one survey of Malaysian companies show that employers preferred public universities to private ones when hiring MBAs [Tay, 2001].

5252
References
Ahmad Mahzan and Faridah Noran. "Business of Higher Education in Malaysia: Development and Prospects in the New Millennium." Available at http://mahdzan.com. ASAIHL Conference on the New Millennium: Business and Higher Education in the Asia-Pacific. New Zealand: Auckland Institute of Technology, December 6-8, 1999.
Bardhan, Ashok, Hicks, Daniel, and Jaffee, Dwigh. “How Responsive is Higher Education? The Linkages between Higher Education and the Labor Market.” Paper presented at AEA 2010. Available at http://www.aeaweb.org/aea/conference/program/retrieve.php?pdfid=458
Bovornsiri Varoporn. "Thailand," in Higher Education in South-East Asia, edited by Molly N.N. Lee and Stephen Healy. Bangkok, Thailand: UNESCO, 2006, 187-218.
Brimble Peter. "Specific Approaches to University-Industry Links of Selected Companies in Thailand and Their Relative Effectiveness," in How Universities Promote Economic Growth, edited by Shahid Yusuf and Kaoru Nabeshima. Washington D.C.: The World Bank, 2007, 265-274.
Chapman Bruce and Lounkaew Kiatanantha. Income Contingent Student Loans for Thailand: Alternatives Compared, The Australian National University Centre for Economic Policy Research DISCUSSION PAPER, 595. Available at Http://Econrsss.Anu.Edu.Au/Pdf/DP595.Pdf, January 2009.
Gamon Savatsomboon. "Student Loan Financing in Thailand." International Higher Education, no. 35, Spring 2004, 8-10.
Hwang Jinyoung. "Asset distribution and tertiary education expenditure in developing countries." Economics of Education Review 24, 2005, 171-178.
Ibrahim Sallehuddin. "The Role of University in promoting and developing technology: a case study of Universiti Teknologi Malaysia." Higher Education Policy 107, no. 2, 1997, 121-126.
Kretovics Mark and Steve O. Michael. Financing Higher Education in a Global Market. New York: Algora Publishing, 2005.
Larsen, Ingvild M., Peter Maassen and Bjørn Stensaker. "Four Basic Dilemmas in University Governance Reform." Higher Education Management and Policy 21, no. 3, 2009, 1-15.
Lee Molly N.N. "Malaysian Universities: Towards Equality, Accessibility and Quality," in Asian Universities: Historical Perspectives and Contemporary Challenges, edited by Philip G Altbach and Toru Umakoshi. Baltimore, MD: The Johns Hopkins University Press, 2004, 221-247.

5353
Lee Molly N.N. Restructuring Higher Education in Malaysia, Unpublished manuscript. Universiti Sains Malaysia, 2004, http://www.cshe.nagoya-u.ac.jp/seminar/kokusai/lee.pdf.
McBurnie Grant and Christopher Ziguras. "The regulation of transnational higher education in Southeast Asia: Case studies of Hong Kong, Malaysia and Australia." Higher Education42, 2001, 85-105.
Mok Ka Ho. "Varieties of regulatory regimes in Asia: the liberalization of the higher education market and changing governance in Hong Kong, Singapore and Malaysia." The Pacific Review 21, no. 2, May 2008, 147–170.
Morshidi Sirat. "Malaysia," in Higher Education in South-East Asia, edited by Molly N.N. Lee and Stephen Healy. Thailand: UNESCO Bangkok, 2006, 101-136.
National Accreditation Board. Malaysia - Quality Assurance System in Higher Education, Available at http://siteresources.worldbank.org/EDUCATION/Resources/malaysia-qa-system.pdf. Accessed on January 2, 2010.
Nattavud Pimpa. "A family affair: The effect of family on Thai students' choices of international education." Higher Education 49, 2005, 431-448.
Neville Warwick. "Restructuring tertiary education in Malaysia: the nature and implications of policy changes." Higher Education Policy 11, 1998, 257-279.
Sato Machi. "Education, Ethnicity and Economics: Higher Education Reforms in Malaysia 1957-2003." Education, Ethnicity and Economics: Higher Education Reforms in Malaysia 1957-2003 <pdf/njlcc071/05Sato.pdf> 7, no. 1, May 2005, 73-88.
Schiller Daniel and Ingo Liefner. "Higher education funding reform and university–industry links in developing countries: The case of Thailand." Higher Education 54, 2007, 543–556.
Somwung Pitiyanuwat. "School assessment in Thailand: roles and achievement." Educational Research for Policy and Practice 6, no. 35, October 2007, 206-279.
Sumate Yamnoon. "University Governance in Thailand." Power Point Presentation. The Regional Seminar on University Governance in Southeast Asian Countries. Luang Prabang, Lao PDR: SAMEO RIHED, October 14, 2008.
Suwanwela Charas. "Higher Education Reform in Thailand." http://www.international.ac.uk/resources/Higher%20Education%20Reform%20-%20Thailand.pdf. Chulalongkorn University. Bangkok, Thailand, 2005, September 17, 2009.
Tanom Intarakumnerd. "Thai Practices in University Governance: A Survey Study Conducted by Phranakhon Rajabhat University." Power Point Presentation. He Regional Seminar on

5454
University Governance in Southeast A. Luang Prabang, Lao PDR: SAMEO RIHED, October 14, 2008.
Tay Angeline. "Management's perception of MBA graduates in Malaysia." Journal of Management Development 20, no. 3, 2001, 258-274.
The World Bank, Human Development Sector. Malaysia and the Knowledge Economy:Building a World-Class Higher Education System, Report No. 40397 - MY. Washington D.C.: The World Bank, 2007.
Udomsaph Charles C. and Albert G. Zeufack. "Skills Shortages and Mismatch in Malaysia and Thailand: Evidence from Linked Employer-Employee Data.” Washington D.C.: The World Bank, November, 2006.
UNESCO Education for All. Overcoming inequality: Why governance matters, EFA Global Monitoring Report 2009. Paris, France: UNESCO, 2009.
UNESCO Institute for Statistics. South and East Asia Regional Report, in UIS/AP/03-01. Montreal, Canada: UNESCO Institute for Statistics, 2003.
Watkins Alfred and Anubha Verma. "Higher Education, Competitiveness and Innovation Capability in South and East Asia: A benchmarking exercise." Background Discussion Paper For The World Bank Regional Conference on Higher Education Kuala Lumpur December 3-5, 2007, 2007.
Weesakul Boonserm, Paradit Charsombut and awalaksana Rachapaetayakom. A Summary of Financing of Thai Higher Education: a Leverage for Quality Improvement Reform, Office of the Education Council, Ministry of Education, 05/2004, available at http://www.onec.go.th/publication/47005/full47005.pdf. Accessed on January 2, 2010. Bangkok, Thailand: Office of the Education Council, 2004.
Wilkinson Roy and Ishak Yussof. "Public and private provision of higher education in Malaysia: A comparative Analysis." Higher Education 50, no. 3, October 2005, 361–386.
Yusuf Shahid and Kaoru Nabeshima. Can Malaysia Escape the Middle-Income Trap? Strategy for Penang, Policy Research Working Paper, 4971. Washington D.C.: The World Bank, June, 2009.
Ziderman Adrian. "Financing student loans in Thailand: revolving fund or open-endedcommitment?" Economics of Education Review 22, no. 4, August 2002, 367-380.
Ziderman Adrian. Student Loans in Thailand: are they effective, equitable. Policy Research and Dialogue: Student Loans Schemes in Asia, vol. 1. Bangkok, Thailand: UNESCO Bangkok, 2003.
Ziderman Adrian. "Student Loans in Thailand: From Social Targeting to Cost Sharing." International Higher Education 42, Winter 2006, 6-8.