Draft for Comments FINANCING PUBLIC SECTOR EXPENDITURE IN ... · PDF fileDraft for Comments...
129
Draft for Comments FINANCING PUBLIC SECTOR EXPENDITURE IN INDIA J V M SARMA M GOVINDA RAO JANUARY 1987 x'<Y .v n-......U2l3c)I v ' - I ~ -ft* V-C5t. p NATIONAL INSTITUTE OF PUBLTCFINANCE AND POLICY 18/2 Satsang Vihar Marg Special Institutional Area New Delhi 110067 NIPFP Library J L IIIIIIIII 351.72 Sa7F M7
-
Upload
truongduong -
Category
Documents
-
view
217 -
download
2
Transcript of Draft for Comments FINANCING PUBLIC SECTOR EXPENDITURE IN ... · PDF fileDraft for Comments...

Draft for Comments
FINANCING PUBLIC SECTOR EXPENDITURE IN INDIA
J V M SARMA
M GOVINDA RAO
JANUARY 1987
x '<Y.v n-......U2l3c)I v'■ - I ~ -ft * V-C5t. p
NATIONAL INSTITUTE OF PUBLTCFINANCE AND POLICY 18/2 Satsang Vihar Marg
Special Institutional Area New Delhi 110067
N IP FP Library J L
IIIIIIIII351.72 Sa7F M7

A C K N O W L E D G E M E N T S
We would like to gratefully acknowledge the help and guidance rendered by Dr. A. Bagchi, who went through successive drafts of the study with meticulous care. We are thankful also to Mr. Subhayu Bandyopadhya and Mr. J.K. Pandey for their able research assistance. Editorial help was rendered by Mr. C. Cecil and Mr. N. Natarajan supervised the production of the Report. Mr. K. R. Subramanian and Mr. Jagdish Arya did the word- processing. We are thankful to them. Nevertheless, theshortcomings in the study are the responsibility of the authors alone.
J V M SARMA M GOVINDA RAO

Page
1
135
15
1516181923
33
3336
4247
71
71717377
87
87878991
9294
105
115
C O N T E N T S
The Nature of Resource Constraints In Financing Public Expenditure in India1.1 Introduction1.2 Public Sector Savings by Major Components1.3 Plan of the Study
Trends in Tax Revenue2.1 Introduction2.2 Broad Trends in Tax Revenue2.3 Taxation of Agriculture2.4 Non-agricultural Direct Taxes2.5 Indirect Taxes
Saving Performance of Public Sector Enterprises3.1 Role of Public Enterprises in India3.2 Performance of Public Sector Enterprises -
An Evaluation3.3 Productivity Trends in Public Sector Enterprises3.4 Public Enterprises - Prospects for the Future
Trends in Current Expenditure4.1 Introduction4.2 Growth in Public Expenditure4.3 Economic Classification of Current Expenditure4.4 Functional Classification of Current Expenditure
Trends in Public Debt5.1 Introduction5.2 Trends in Public Debt5.3 Market Debt, Trends and Policies5.4 The Extent of Monetisation of Public Debt and
Implications on the Price Level5.5 Scope for Demonetisation of Public Debt5.6 Conclusion
SuomaryReferences

Page
7
8
9
10
11
12
13
14
27
28
29
30
31
32
52
L I S T O F T A B L E S
Trends in the Rates of Domestic Saving, Investment and Net Inflow of Capital from Abroad (1950-51 to 1983-84).
Gross Investment as Percentage of GDP (1970-71 to 1983-84).
Share in India's Total Plan Outlay from Second to Seventh Plans (Original Estimates) (1956 to 1990).
Share of Public Sector in GDP (1970-71, 1977-78 and 1983-84).
Gross Domestic Saving (Percentage of GDP).
Pattern of Financing of Public Sector Outlay During Five Year Plans (1950-1990).
Public Saving Rates (Percentage of GDP) (at Terminal Years of Fourth, Fifth, Sixth and Seventh Plans).
Structure of Public Sector Gross Savings (1970- 71 to 1983-84).
Current Revenue and Current Expenditure of Government Administration (1970-71 to 1983-84).
Trends in Total Tax Revenue (1970-71 to 1983-84).
Trends in the Tax Revenue Structure by Direct and Indirect Tax Components (1970-71 to 1983- 84).
Trends in Direct Taxation in India (1970-71 to1983-84).
Trends in the Growth of Corporate Sector in India (1970-71 to 1983-84).
Trends and Structure of Indirect Taxes in India (1970-71 to 1983-84).
Sector-wise Contribution of Public Enterprises in Gross Domestic Product (GDP) (Selected Years between 1960-61 and 1983-84).

Page
TABLE 3.
TABLE 3.'
TABLE 3.
TABLE 3.
TABLE 3.
TABLE 3.
TABLE 3.
TABLE 3.
TABLE 3.
TABLE 3.
TABLE 3.
TABLE 3.
TABLE 3.
TABLE 3.
TABLE 3.: Gross Domestic Capital Formation in Public 53Sector Enterprises (Selected Years from 1960-61 to 1983-84).
Growth of GDP and GDCF in Public Enterprises and 54the Economy (1971-72 to 1983-84).
Incomes generated by Public Sector Enterprises 55and their Share in National Economy (Selected Years from 1960-61 to 1983-84).
Public Sector Contribution in Industrial Produc- 56tion in Key Areas (1968-69 and 1983— 84).
Proportion of Saving and Investment to GDP in 57Private and Public Sectors (1970-71 to 1983-84).
Structure of Savings of Public Enterprises 58(1970-71 to 1983-84).
Rate of Return of Central Government Enterprises 59(Selected Years from 1972-73 to 1984-85).
Rate of Return of State Electricity Boards 60(1985-86).
Commercial Profits (+)/Losses(-) of State Elec- 61tricity Boards (1980-81 to 1985-86).
Capital Productivity - Rate of Return on Block 62Capital in State Road Transport Corporations (1980-81 to 1985-86).
Average Annual Rates of Growth of Administered 63and Non-administered Prices between 1970-71 and 1985-86.
Capital Output and Labour Output ratios in 64Public and Private Sectors (Selected Years from 1970-71 to 1983-84).
Time and Cost Over-runs of Hydel Projects 65(from Date of Project Sanction).
Time and Cost Over-runs of Thermal Power Projects 66(from Date of Project Sanction).
Pattern of Capacity Utilisation in Central 67Public Sector Enterprises (1975-76 to 1983-84).

Page
TABLE 3.;
TABLE 3.
TABLE 4.
TABLE 4.:
TABLE 4.:
TABLE 4.
TABLE 4.
TABLE 4.
TABLE 4.
TABLE 4.
TABLE 5.
TABLE 5.
TABLE 5.
TABLE 5.
TABLE 5.
TABLE 3.: Factor Income Shares in Public Sector Enter- 68prises and Private Organised Sector (SelectedYears from 1960-61 to 1983-84).
Tenure of Chief Executive in State Level Enter- 69prises - Andhra Pradesh.
Percentage of Capital Employment to Total Capi- 70tal Employed (1972-73, 1975-76 and 1979-80 to1984-85) in Central Government Enterprises.
Trends in Public Expenditure in India (Adminis- 79tration) (1970-71 to 1983-84).
Trends in Current Expenditure of Central and 80State Government and Local Authorities (1970-71 to 1983-84).
Trends in Economic Components of Current 81Expenditure as Percentage of GDP (1970-71 to1983-84).
Trends in Structure of Economic Components 82of Current Expenditure (1970-71 to 1983-84).
Composition of Subsidies by Major Commodity 83Groups (1970-71 to 1983-84).
DistT ibution of Subsidies by Major Sectors 84(1970-71 to 1983-84).
Trends in Functional Categories of Current 85Expenditure (1970-71 to 1983-84).
Structure of Functional Categories of Current 86Expenditure (1970-71 to 1983-84).
Trends in Total Outstanding Liabilities of 95Central and State Governments (1970-71 to 1983-84).
External Debt and its Burden (1970-71 to 1983-84). 96
Trends in Major Components of Internal Debt 97(Central Government) (1970-71 to 1983-84).
Market Debt-holding Pattern (1970-71 to 1982-83). 98
Ownership Pattern of Treasury Bills Outstanding 99(1970-71 to 1983-84).

TABLE 5.
TABLE 5.
TABLE 5.
TABLE 5.
TABLE 5. Holding Pattern of State Government Securities 101(1970-71 and 1975-76 to 1982-83).
Interest Rates on Selected Financial Assets 102(1974-75 to 1984-85).
Extent of Monetisation of Public Debt (1970-71 103to 1983-84).
Prices, Reserve Money and RBI Credit to Govern- 104ment (1970-71 to 1983-84).
Trends in States' Liabilities (1970-71 to 1983-84) 100

CHAPTER 1
NATURE AND EXTENT OF RESOURCE CONSTRAINTS IN FINANCINGPUBLIC EXPENDITURE IN INDIA
1.1 Introduction
1.1.1 At the time India attained Independence (i.e, 1947) income,saving and capital formation in the economy were at very low levels, creating a situation of vicious circle of low income impeding saving and investment required to raise income. In the three decades following Independence, the rate of capital formation in India has registered an impressive increase. As a proportion of gross domestic product (GDP) gross domestic capital formation (GDCF) has increased steadily from about 11.8 per cent in 1950-51 to 23.9 per cent in 1983-84 (Table 1.1). There were setbacks in the mid-seventies, following the two oil shocks. Even so, the rate of gross domestic capital formation in India is way above the rate attained by most developing countries and compares very favourably with the rate of investment in middle income countries with per capita income levels six to seven times that of India.
1.1.2 Two remarkable features of India's achievement in raising therate of investment to such a level are, (i) most of it has been financed out of domestic saving and, (ii) the public sector has played a key role in spearheading capital formation in the economy. As may be seen from Table 1.1, net capital inflow from abroad has formed only about 1-2 per cent of the GDP and accounted for no more than 7.5 per cent of the GDCF.
1.1.3 Of the GDCF again, nearly 50 per cent has taken place in thepublic sector (Table 1.2). The strategy of planning adopted by policy-makers in India envisaged a lead role for the public sector in stepping up the rate of saving and investment and also for laying a sound foundation for self-reliant growth by undertaking investment in infrastructure and areas of risk where the private sector could not be expected to move in a big way. The public sector's share in the total Plan outlay has consistently been more than 50 per cent (Table 1.3).

Nature anH Extent of Resource Constraints 2
The expansion of the public sector that has taken place as a result isreflected in the rise of the share of the public sector both in the GDP
GO C Fas also in the GDCF. As of 1983-84, the public sector^accounted for11.2 per cent of the GDP as compared to 7 per cent in 1970-71. The share of the public sector in GDP has increased from about 15 per cent in 1970-71 to 24 per cent in 1983-84 (Table 1.4). Currently, in several key areas the public sector accounts for as much as 90 per cent to 100 per cent of the GDP and as mentioned already, about 50 per cent of the GDCF takes place in the public sector (Table 3.4 and 3.5).
1.1.4 The contribution of the public sector in the gross domesticsavings has however, not been commensurate with its growth. Table 1.5 gives the structure of domestic savings. While the saving ratio has gone up from 16.8 per cent in 1970-71 to about 23 per cent of GDP in 1983-84, public sector saving as a proportion of GDP has increased from3.1 per cent to only 4.1 per cent during the same period. It had increased to more than 5 per cent in some years but has remained at around 4 per cent in most years.
1.1.5 The bulk of domestic saving in the economy (over 80 percent) comes from the private sector, particularly the household sector. Evidently, capital formation in the public sector has taken place with the help of large drafts on the saving of the household sector.
1.1.6 Several instruments have been used by the government tosecure the massive flow of resources to sustain and foster the growth of public sector in India. The pattern of financing the public sector plan outlay during the Plan periods beginning with the First Five Year Plan is shown in Table 1.6. As most of the investment in the public sector takes place under the schemes approved within the Plans, Table1.6 may be taken broadly to reflect the pattern of financing publicsector investment. It will be seen that the three main components of finance for the public sector's plan outlay are public savings, domestic borrowing and borrowings from abroad. Since the beginning ofthe seventies, the capital inflow from abroad has not contributed more than 10 to 15 per cent of the total public sector plan outlay; the rest was financed out of public savings and domestic borrowing. The contribution of public savings has, however, fluctuated and in the last completed Plan (that is, the Sixth Plan), public saving contributed only about 37 per cent of the total Plan outlay. The dependence on domestic borrowing has, consequently increased.

Nature and Extent of Resource Constraints 3
1.1.7 Indeed, shortfalls in public savings have been a major factor creating a long-term imbalance in the government budget. Table 1.7 shows the target rates of public savings (as proportion of GDP) for the terminal year of the Five Year Plans since the Fourth Plan.
1.1.8 It will be noticed that public sector savings fell short of the target in the Fourth and Sixth Plans. In the Fifth Plan, the target originally fixed for public savings was 6 per cent of GDP for the final year of the Plan but this was revised downward to 4.6 per cent, following the oil shock of 1973. Even allowing for this, it is undesirable that public sector's savings performance has fallen markedly short of expectations in almost all the three Plans which terminated during the period under review.
1.2 Public Sector Savings by Major Components
1.2.1 As in other countries with a mixed economy, public sector ismade up of three components: (i) Government administration — atCentral, and State and Local levels, (ii) Departmental undertakings, and (iii) Non-departmental enterprises. Departmental undertakings are fully owned and run by government departments, and their profits form part of the government revenue, while their operating accounts are maintained separately. The non-departmental enterprises are partly owned but fully controlled by the government. However, their operating accounts as well as savings are kept separate and only dividends accruing to government are included as a part of government revenue.
1.2.2 The disaggregated picture of public savings presented in Table 1.8 brings out clearly that it is the declining contribution of government administration (budgetary saving) which underlies the shortfalls in public savings relative to the Plan targets. The decline has been particularly sharp since the beginning of the present decade. While in the seventies the share of budgetary savings in the saving of the public sector fluctuated between 39 and 63 per cent, in 1983-84 the proportion came down to less than 20 per cent. Currently, (1984-85 onwards) the revenue budget of the government shows a deficit. The other component of public saving, viz., the savings of public enterprises, as a proportion of GDP remained steady till 1974-75 at 1.7 per cent and went upto 2.6 per cent in the following year. Thereafter, there was a decline to 1.9 per cent in 1980-81. However, from 1981-82

Nature ami Extent of Resource Constraints 4
onwards, the savings performance of public enterprises improved, touching the 3.5 per cent mark in 1982-83.
1.2.3 The improved performance of public enterprises' savings is, however, attributable largely to the non-departmental enterprises whose savings rate has gone up steadily from about 1 per cent of GDP in1970-71 to 2.6 per cent in 1983-84, while the savings rate of departmental undertakings has remained more or less at 0.7 per cent. The contribution of the non-departmental non-financial enterprises to public savings was not large upto 1980-81. Their savings rate fluctuated around 0.8 per cent of GDP. The improvement noticeable since then is, however, due mainly to the surpluses of the oil sector. On the whole, the public sector enterprises have not been able to generate the surpluses which were warranted by the huge investments that have taken place in the sector over the years.
1.2.4 The review of the experience in mobilising resources for the Sixth Plan presented in the Seventh Plan document brings out succinctly the nature of the resource problem facing the public sector in India and its roots. It shows that the surpluses of the current revenue of Government which were expected to finance 28 per cent of the Sixth Plan public sector outlay, actually contributed only 20 per cent of the financing, and this despite massive effort towards "additional resource mobilisation" . Reasons for the deterioration in the budgetary position of the government are stated to be two-fold: (a) there was a sharp rise in the non-Plan current expenditure resulting from the inflationary pressures which surfaced during the Sixth Plan period leading to a rise in maintenance cost of normal services, large additional payments towards dearness allowance, etc., to government employees to compensate for the price rise, and (b) erosion of resources in real terms because of a slower growth in revenue than the cost of goods and servicesbought by government. Moreover, certain large items of current outlay, such as defence, subsidies and interest liabilities have been growing at a rapid rate at the Central level. The size of "committed" expenditures of the States both on Plan and non-plan account also have tended to grow faster than the revenue receipts (at base year rates). The buoyancy of the revenue receipts has not been adequate to meet the additional liabilities of the government at the Centre and the States. The tax-GDP ratio which has gone up from 15.56 per cent in 1980-81 to 16.65 per cent in 1982-83 has declined to 16.25 per cent in 1983-84. The ratio of non-tax revenues to GDP which accounted for 18 per cent of

Nature and Extent of Resource Constraints 5
total government revenue also shewed a similar trend. Having increased from 3.32 per cent in 1980-81 to 3.8 per cent in 1982-83, it came down to 3.5 per cent in 1983-84. The automatic growth in revenues - "the elasticity" - was not commensurate with the growth in national income and the additional measures to secure more revenue could not fully offset this deficiency.
1.2.5 As for public sector enterprises, while their total Plan expenditure in the Sixth Plan was of the order of Rs 563.6 billion, their contribution to Plan resources was no more than Rs 186.3 billion, that is, barely 33 per cent. They relied mainly on budgetary support for meeting their development outlay. Enterprises like the State Electricity Boards and State Road Transport Corporations could finance only 3.5 per cent of their development outlay from their own internal resources. Hence, the Seventh Plan document concludes after a review of the past experience: "Thus, public enterprises becoming a vehicle of resource mobilisation for financing development expenditure in the country remains a distant goal." (Seventh Five Year Plan 1989-90, para 4.16).
1.2.6 As noted earlier, the inadequacy of budgetary saving and the inability of the public enterprises to generate the saving required for financing their investment has led to increasing reliance on domestic borrowing which in turn implied increasing burden on the budget for meeting interest payments and repayments of the principal. The fact that the government's revenue account is now in deficit shows that a part of the borrowings is being utilised to meet current expenditure. To quote the Seventh Plan again: "In short, the development financing structure which has emerged during the Sixth Plan shows serious limitations in the matter of generation of resources to cope with the increasing demand for development expenditure in the country.... In the face of the resource crunch, mobilisation of financial resources, therefore, presents a real challenge to be faced in the Seventh Plan, both by the Centre and the States".
1.3 Plan of the Study
1.3.1 The factors underlying the limitations in resource generation which have led to a 'long-term' disequilibrium in the government finances and the initiatives taken in recent years to overcome them are

Nature and Extent of Resource Constraints 6
examined in the subsequent chapters. Chapter 2 presents an analysis of the trends in government's revenue, Chapter 3 deals with the problems in resource generation by public sector enterprises, Chapter 4 with the trends in government expenditure and Chapter 5 with the issues arising from the growing dependence on public debt. Finally, Chapter 6 presents a resume of the main findings.
N O T E S
1. The discussion that follows is based largely on Chapter 4 of the Seventh Five Year Plan 1985-90, Government of India, Planning Commission.

Nature and Kirt-pnt: of Resource Constraints 7
TABLE 1.1Trends In the Rates of Domestic Saving, Investment and
Net Inflow of Capital from Abroad (1950-51 to 1983-84)
(Per cent of GDP)
Year Grosscapital
formation
Grossdomesticsaving
Net capital inflow from
abroad
1950-51 11.8 9.6 2.21960-61 17.2 13.9 3.31970-71 17.8 16.8 1.01971-72 18.4 17.3 1.11972-73 17.0 16.2 0.81973-74 20.0 19.3 0.71974-75 19.2 18.3 0.91975-76 20.0 20.1 -0.11976-77 20.8 22.5 -1.71977-78 20.6 22.2 -1.61978-79 24.7 24.6 0.11979-80 23.4 22.9 0.51980-81 24.4 22.8 1.81981-82 23.9 22.1 1.81982-83 24.4 22.8 1.61983-84 23.9 22.6 1.3
Source: National Accounts Statistics, Government of India, Central Statistical Organisation, New Delhi.

Nature and Extent of Resource Constraints 8
TABLE 1.2Gross Investment as Per cent of GDP
(1970-71 to 1983-84)
Year Total gross domestic capital
formation as % of GDP
Public sector gross invest
ment as % of GDP
Private sector gross invest
ment as % of GDP
Public sector investment as
% of GDCF
1970-71 17.8 6.9 10.9 38.81971-72 18.4 7.3 11.1 39.71972-73 17.0 7.5 9.5 44.11973-74 20.0 8.2 11.8 41.01974-75 19.2 8.1 11.1 42.21975-76 20.0 10.4 9.6 52.01976-77 20.8 10.6 10.2 51.01977-78 20.6 8.3 14.8 40.11978-79 24.7 9.9 14.8 40.11979-80 23.4 11.0 12.4 44.71980-81 24.4 10.9 13.5 44.71981-82 23.9 11.8 12.1 49.41982-83 24.4 12.2 12.2 50.01983-84 23.9 11.2 12.7 45.9
Source: As for Table 1.1

Nature and Extent of Resource Constraints 9
TABLE 1.3Share In India's Total Plan Outlay from Second to
Seventh Plans (Original Estimates)(Per cent)
SecondPlan
1956-61
ThirdPlan
1961-66
FourthPlan
1969-74
FifthPlan
1974-79
SixthPlan
1980-85
SeventhPlan
1985-90
1. Public Sector 54.07 64.66 63.92 69.57 56.62 51.70
i. Current development outlay 10.35 9.02 10.95 7.84 7.40
ii. Investment 54.07 54.31 54.90 58.62 48.78 44.30
2. Private Sector investment* 45.93 35.34 36.08 30.43 43.38 43.30
3. Total Plan Outlay
100.00 100.00 100.00 100.00 100.00 100.00
* Excludes investment Source: Acharya, S.N. (1986) India'sfinance by capital Fiscal Policy (Mimeo).transfers from the public sector on Originalplan account. Source: Five-year Plan Documents.

Nature and Extent of Resource Constraints 10
TABLE 1.4Share of Public Sector In GDP (1970-71, 1977-78 and 1983-84)
(Per cent)
1970-71 1977-78 1983-84
Administrative departments 6.5 6.9 7.8
Departmental enterprises 4.0 4.1 3.9
Non-departmentalenterprises 4.4 8.4 11.4
Total public sectors 14.9 19.4 23.6
Source: As for Table 1.1

Nature and K*i-gnt- of Resource Constraints 11
TABLE 1.5Gross Domestic Saving
( 1950-51 to 1983-84)(As percentage of GDP)
Year Private
Householdsector
sector saving
Privatecorporate^
sector
Total
Publicsectorsaving
Totalgross
domesticsaving
Average
1950-51 to n» 3. • n* ci* 7.9 1.7 9.61954-55
1960-61 to 8.7 1.9 10.6 3.3 13.91964-65
1970-71 12.1 1.6 13.7 3.1 16.81971-72 12.6 1.7 14.3 3.0 17.31972-73 11.9 1.6 13.5 2.8 16.31973-74 14.5 1.8 16.3 3.1 19.41974-75 12.4 2.1 14.5 3.8 18.31975-76 14.2 1.4 15.6 4.5 20.11976-77 15.8 1.5 17.3 5.2 22.51977-78 16.1 1.5 17.6 4.6 22.21978-79 18.0 1.7 19.7 4.9 24.61979-80 16.1 2.2 18.3 4.6 22.91980-81 17.2 2.0 19.2 3.6 22.81981-82 15.3 1.9 17.2 4.9 22.11982-83 15.9 1.9 17.8 5.0 22.81983-84 16.8 1.7 18.5 4.1 22.6
Note: * Including co-operative sector. Source: As for Table 1.1

Nature and Extent of Resource Constraints 12
TABLE 1.6Pattern of Financing of Public Sector Outlay During
Five Year Plans (1951 to 1990)
(Per cent)
Plan Periodcovered
Publicsavings
Market^borrowing
Deficitfinancing
Netcapitalinflowfrom
abroad
TotalPlan
outlay(Rs
billion)
First 1951-56 38.4 38.7 13.3 9.6 19.6Second 1956-61 26.3 26.2 25.0 22.4 46.7Third 1961-66 33.9 24.6 13.2 28.2 83.8Annual 1966-69 24.0 29.9 10.1 35.9 67.6Fourth 1969-74 32.0 42.3 12.8 12.9 161.6Fifth 1974-79 52.1 29.7 3.4 14.8 393.0
1979-80 47.9 32.8 10.8 8.6 126.0Sixth 1980-85 36.7 41.5 14.2 7.7 1108.2Seventh - 1985-90 40.4 39.4 7.6 9.7 1800.0
Notes: 1. Original estimates Source: Report on Currency2. Market borrowings, small and Finance,
savings, and others Reserve Bank of India.3. Changes in indebtedness
to Reserve Bank of India.

Nature and Extent of Resource Constraints 13
TABLE 1.7 Public Saving Rates
(Per cent of GDP)
Terminal year Plan target Actual
Fourth Plan (1973-74) 4.5 3.1
Fifth Plan (1978-79) 4.6 4.9
Sixth Plan (1984-85) 6.0 3.2
Seventh Plan (1989-90) 5.1 -
Source: As for Table 1.3

Nature and Extent of Resource Constraints 14
TABLE 1.8Structure of Public Sector Gross Savings
(1970-71 to 1983-84)(Per cent of GDP)
Year Government
Public sector enterprises Totalpublic
administration
Departmental
Non-departmental
Finan- Non- Total cial finan- non-
cial departmental
Total sector public savings enterprises
1970-71 1.4(46.0)
0.7 0.2 0.8 1.0 1.7(54.0)
3.1
1971-72 1.2(41.5)
0.8 0.2 0.8 1.0 1.7(58.5)
3.0
1972-73 1.1(38.7)
0.6 0.3 0.8 1.1 1.7(61.3)
2.8
1973-74 1.6(51.9)
0.3 0.4 0.8 1.2 1.5(48.1)
3.1
1974-75 2.1(55.1)
0.3 0.6 0.9 1.4 1.7(44.9)
3.8
1975-76 2.8(62.7)
0.5 0.5 0.7 1.2 1.7(37.3)
4.5
1976-77 2.7(50.9)
0.8 0.7 1.1 1.8 2.6(49.1)
5.3
1977-78 2.3(50.4)
0.7 0.7 0.8 1.5 2.3(49.6)
4.6
1978-79 2.6(52.7)
0.7 0.8 0.8 1.6 2.3(47.3)
4.9
1979-80 2.4(52.1)
0.7 0.7 0.8 1.5 2.2(47.9)
4.6
1980-81 1.7(47.1)
0.5 0.7 0.7 1.4 1.9(52.9)
3.6
1981-82 2.3(45.7)
0.6 0.8 1.3 2.1 2.7(54.3)
4.9
1982-83 1.6(31.0)
0.7 1.1 1.7 2.8 3.5(69.0)
5.0
1983-84 0.8(19.7)
0.7 1.1 1.5 2.6 3.3(80.3)
4.1
Notes: Figures in parentheses are Source: As for Table 1.1per cent shares in total public sector savings.

CHAPTER 2
TRENDS IN TAX REVENUE
2.1. Introduction
2.1.1 The brief analysis presented in Chapter 1 brings out that the public sector in India has not been able to generate the savings required to finance public investment. The ratio of public sector savings to GDP has been stagnant since the mid-seventies. Savings ratio of government administration in particular, has been continuously falling since 1975-76, while savings of the departmental undertakings have been more or less stagnant. The slight rise achieved in the public sector savings rate over the period 1970-71 to 1983-84, was mainly due to the marginal improvement in the financial performance of the non-departmental public enterprises.
2.1.2 The decline in the saving generation of government administration can be attributed to the slow growth of current revenue vis-a-vis current expenditures.While the total current receipts of both the Central and State governments have gone up from Rs 57 billion in1970-71 to Rs 360 billion in 1983-84, i.e. by approximately 6.5 times, current expenditures have increased almost seven fold from Rs 50 billion to Rs 340 billion (Table 2.1). As a proportion of GDP, current revenues have increased at the rate of 2.3 per cent per annum, but expenditures have grown faster at 2.8 per cent. In 1975-76, current revenues formed 120 per cent of current expenditures, but the ratio declined steadily thereafter to 104 per cent by 1983-84.
2.1.3 In this chapter, an attempt is made to examine the trends in current revenues and to identify the major factors inhibiting their growth. As about 90 per cent of the current revenues of the government administration comes from taxation, this chapter concentrates on the growth of tax revenue.

Trends in Tax Revenue 16
2.2 Broad Trends in tax Revenues
2.2.1 Total tax revenue which was about Rs 50 billion in 1970-71 had gone up to Rs 321 billion by 1983-84 at an average growth rate of15.5 per cent per annum (Table 2.2). There has been a marked improvement in the tax-income ratio also which has risen from about 13 per cent in 1970-71 to over 18 per cent in 1983-84. The current level of the tax-incoma ratio is by no means low, and compares well with the ratio prevailing in many middle-income countries. The growth of tax revenue has also been reasonably high. The over-all tax buoyancy at 1.2 is well above unity.
2.2.2 However, since current expenditure has outpaced current revenue, it is necessary to explore avenues for further increase in the tax-income ratio in order to improve budgetary savings.
a. The tax structure.
2.2.3 Table 2.3 shows the broad structure of tax revenue growth in India and highlights its main feature : declining share of the direct taxes. The proportion of direct tax revenue to GDP has remained more or less constant at about 3 per cent except during the two years 1975-76 and 1976-77 when it was 3.8 and 3.6 per cent respectively. The traditional land-based direct taxes are fast becoming insignificant. Their ratio to GDP has come down from 0.4 per cent to 0.2 per cent. In contrast, the proportion of indirect tax revenue to GDP has risen markedly from about 10 per cent in 1970-71 to over 15 per cent in 1983-84. Thus, the share of the direct taxes in total tax revenue has declined from around 20 per cent in 1970-71 to 16 per cent in 1983-84. The share of land taxes has declined from an already low level of 3 per cent to a negligible level of 1 per cent. The emergence of indirect taxes as the major revenue instrument is quite striking.
2.2.4 The change in the structure of tax revenue in India characterised by the increasing share of indirect taxes, falling share of non-agricultural direct taxes, and dwindling contribution from direct taxes on agricultural sector is not entirely in conformity with the generally observed structural shifts in taxation associated with different stages of economic development. The celibrated study by Hinrichs (1966) indicates that as the economy makes a transition from 'traditional' to 'transitional' to 'modem' phases of development, the nature of the tax revenue structure also changes from large reliance on

Trends in Tax Revenue 17
traditional direct taxes such as land taxes to indirect taxes and then to income taxes. Even in the transitional phase, it is suggested that initially, the foreign-trade-based taxes predominate and as the economy develops, internal indirect taxes assume an increasing role. Following from this is the hypothesis that upto a certain stage of development, it is not per capita income, but the degree of openness in the economy (as measured by the ratio of imports to GDP) that determines the tax ratio, but thereafter per capita income becomes important. Hinrichs' theory of tax structure implies the predominance of land taxes in the initial stages of development followed by increasing share of indirect taxes during the transitional phase and rising share of modem direct taxes as the economy becomes industrialised. Later, the empirical tests by Musgrave (1969), Chelliah (1971), and others based on cross-sections of different countries and time-series of a few developed countries have generally supported the hypothesis.
2.2.5 In the Indian context the decline in the land taxes and increasing importance of indirect taxes are in conformity with Hinrichs hypothesis, though, foreign-trade based indirect taxes have not been important. What is however striking is that, instead of income based taxes becoming more important with increasing levels of income, their share has shown a declining trend. As explained by Chelliah (1986), "The Indian experience seems to indicate that the proposition that the share of income tax or direct taxes would rise with the growth of per capita income (or economic development) will only be valid after the per capita income has reached a certain level and grown fairly faster thereafter." (p.24). Thus, in India despite considerable economic progress, government, in its efforts to raise the tax-income ratio has had to rely largely on indirect taxes.
2.2.6 The departure of the tax revenue trends from the general pattern experienced in other countries is mainly due to certain imbalances in the Indian tax structure. In an economy where 40 per centof GDP is derived from agriculture, the contribution of taxes on land and agricultural income taxes was a mere 0.2 per cent of GDP. Further,even when the non-agricultural incomes of individuals has been increasing over time, the revenue from the individual income tax has not been growing as warranted by the progressivity of the tax structure due to widespread tax evasion and avoidance. Both for equity and efficiency reasons it is necessary to bring about a better balance in the structure of Indian taxation by enhancing the share of direct

Trends in Tax Revenue 18
taxes.
2.2.7 The Long Term Fiscal Policy (LTFP, 1985) too envisages thereversal of the trend of the declining share of direct taxes. Measures to correct such imbalances in the tax structure might also improve the overall tax-income ratio. In what follows, the scope for correction of the structural imbalances in the tax revenue growth is examined in some detail.
2.3 Taxation of Agriculture
2.3.1 An important cause for the declining role of direct taxes inIndia has been the limited coverage cwing to the exclusion of the agricultural sector from the base. Almost 70 per cent of the earners derive their income from agricultural sources and therefore are excluded from the purview of the present income tax law.
2.3.2 The only notable tax touching the agricultural sector is landrevenue. Even in the case of land revenue, its revenue productivity inmany States has been low and declining over the years. The revenue settlements are made at long intervals and the tax base does not change with the increasing productivity of land over the years. Thus, while prices and incomes have increased over time, the land revenue has remained fixed in money terms and has fallen in real terms. Attempts at modifying the land revenue by superimposing cesses and surcharges too have not succeeded in improving its revenue productivity.
2.3.3 Under-taxation of agricultural incomes has received considerable attention in India. A strong case for taxing agricultural incomes has been made by Gandhi (1970), Mathews (1975) and others, on grounds of differential tax burden and inter-sectoral inequity.
2.3.4 While there exists near unanimity on the need to impose heavier taxation on the agricultural sector, the actual mode of taxing the agricultural sector has not yet been found. The Committee on Taxation of Agricultural Wealth and Income (Raj Conmlttee, 1972) examined the problem in considerable detail. The simple extension of income tax to agriculture has not been found feasible in the Indian context due to numerous administrative difficulties in assessment arising from the nature of agricultural operations, the conceptual problems involved in distinguishing current from capital costs and such

Trends in Tax Revenue 19
other problems. The alternative suggested by the Raj Committee, namely, the agricultural holdings tax, is a combination of various suggestions to improve the present system of land revenue. Essentially, the agricultural holdings tax is a tax leviable on the holdings of the agricultural families, according to the aggregate rateable value of each holding, the rateable value for each hectare being determined by its productivity, based on the soil-climatic conditions as also on the crop-mix during the preceding ten years, and subject to revision every year. The rate of tax applicable to each tax payer is determined on the average rateable value of the operational holdings.
2.3.5 The agricultural holdings tax as recommended by the Raj Committee too involved many administrative problems. The determination of the rateable value involving estimation of yield of different crops over a ten-year period in a large number of homogeneous tracts is an arduous process. Further, the revision of the rateable value every year requires collection and processing of voluminous data. Also, from the farmers' angle, the changing effective tax rate will create some uncertainty. To overcome some of the difficulties, Bagchi (1978) suggested a modified scheme of agricultural holdings tax, which simplifies many of the procedures in determining the rateable value, the tax rate as well as the assessment procedure.
2.3.6 In spite of the near unanimity on the imperative need to mobilise resources from agricultural sector for development through higher levels of taxation, and in spite of various schemes and modifications suggested, the revenue productivity of agricultural taxes has continued to be low and is declining over the years. Given the weight of expert opinion on the need to inpose heavier tax, the declining share of agricultural taxes in the Indian context has to be attributed to the compulsions of the Indian polity. Partly the problem has been compounded by the ceilings imposed on land holdings in rural areas, and fragmentation resulting in a severe erosion of the base.
2.4 Non-agricultural Direct Taxes
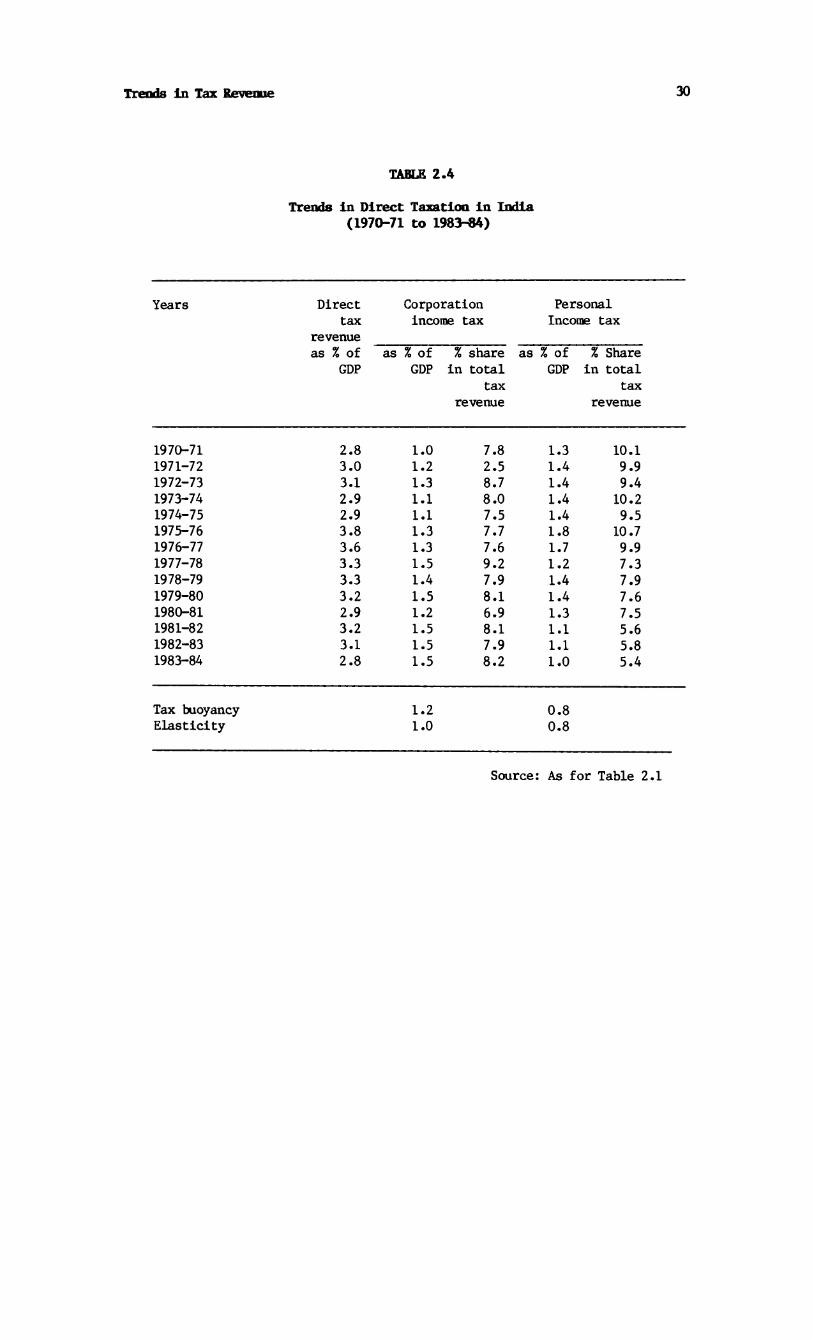
2.4.1 Another important matter of concern has been the decliningproductivity of the non-agricultural taxes, which has led to increasing reliance on indirect taxes. Table 2.4 shows the trends in the two major direct taxes, namely, the personal income tax and the corporation tax. The personal income tax revenue as per cent of GDP which was constant

Trends in Tax Revenue 20
at about 1.4 per cent upto 1974-75 briefly went up to 1.8 per cent and1.7 per cent in the next two years, but after 1976-77 steadily declined to just 1 per cent by 1983-84. The overall buoyancy has been below unity (0.8).
2.4.2 The declining trend and the lack of buoyancy in the personal income tax revenue is attributed to several factors such as narrow coverage, rising exemption limit, numerous deductions, as well as widespread evasion. Widespread evasion has been particularly attributed to the existence of very high marginal tax rates.
2.4.3 It is widely believed that the low yield from the personal income tax is primarily due to the high marginal tax rates that existed upto the early seventies. However, the lowering of the tax rates after 1974-75 could not bring about the required increases in the tax revenue though one is tempted to associate the sudden jump in the tax yield from 1.4 to 1.8 per cent of GDP in 1975-76, with the lowering of the marginal tax rates in 1974-75. The failure of the tax rate reductions in raising the overall tax compliance is brought out by Bagchi and Rao (1982). On the basis of their empirical analysis they expressed doubts about the validity of the widespread belief that tax rate reductions lead to a higher yield of income tax because of better compliance. Their empirical results showed that between 1974-75 and 1977-78, the tax yield would have been much higher but for the rate reductions.
2.4.4 The main cause for the declining yield from the personal income tax is not so much the tax rates as the incidence of widespread tax evasion. The most recent estimates of tax evasion by Shankar Acharya and associates (1985) show that the tax-evaded income as per cent of GDP has increased from about 12 per cent in 1975-76 to about 15 per cent in 1980-81, thus showing an increasing trend over the years. The trend is even more clearly seen if we analyse tax evaded income as a ratio of assessed income; the proportion showed a phenomenal rise from 186 per cent in 1975-76 to 240 per cent in 1980-81. Also, the total number of income tax payers has remained stagnant at about 4 million for many years.
2.4.5 Thus the basic problem is the ineffective enforcement of the tax law. A number of measures with regard to income tax is currently under consideration. Some major steps to increase the efficiency in tax

Trends in Tax Revenue 21
collections are being experimented with. It is stated in the LTFP that "a broader base of taxation, resulting from the healthy growth of the economy combined with moderate rates of taxes and strict enforcement can yield better revenue results." The initiatives taken in the last two years in raising the yield of personal income tax by lowering the rates combined with better enforcement seems to be productive. Collections from personal income tax are reported to have increased by 45 per cent in 1985-86 and the trend is maintained in 1986-87 also.
a. Corporation tax.
2.4.6 Among the two major direct taxes, corporation income tax has been more buoyant than the personal income tax. During the last ten years its share in the direct tax revenue has gone up markedly. Currently, it contributes over 53 per cent of direct tax revenue. Given that the corporate income tax could be shifted forward to consumers, in the long run the increasing importance of the corporation tax in the total direct taxes too lowers the progressivity of the tax system.
2.4.7 The growth of corporation tax revenue has been striking as compared with that of other direct taxes. Much of the growth has been made possible by the improved performance of the Central government public undertakings from 1975-76, especially the oil companies which currently contribute roughly 37 per cent of the revenue. The overall buoyancy of the corporation tax is 1.2 for the period 1970-71 to 1983-84. Previous studies on elasticity of the corporate income tax show that during the fifties the corporation tax was elastic with respect to national income, the elasticity coefficient being around 1.3 (Sahota, 1961). In the sixties the elasticity went down markedly to 0.8 (Lall, 1983). However, there has been an improvement during the seventies as shown by Lall's estimate of 0.93 (1970-71 to 1979-80) as well as our estimate of unity.
2.4.8 Also, the revenue from corporation tax has become less responsive to growth in non-agricultural income during the seventies. The decomposition of the buoyancy estimate into tax to income from non-agricultural sector and the latter to GDP shews that the overall income elasticity would have been higher but for the lack of growth in the tax base. The elasticity of tax to its own base is 1.3 while that of the tax base to GDP is just 0.8. A similar phenomenon was also observed by an earlier study, (Rao, 1983) which attempted the de-

Trends in Tax Revenue 22
composition for the period 1960-61 to 1979-80.
2.4.9 The sluggish growth in the base of the corporation tax can be attributed to two factors: There has been a decline in the role of non-government corporations in the economy, in terms of paid-up capital.Their share dropped from a high of 52 per cent in 1970-71 (Table 2.5), to 30 per cent by 1983-84. Such a scale of decline in the importance of non-government companies coupled with the low rates of return in the government sector companies explains the sluggish growth of value-added in the corporate sector.
2.4.10 Further, the non-corporate enterprises have expanded considerably their share in the value-added. The growth of the noncorporate enterprises relative to that of the corporate sector is evident from the fact that the number of company assessees has increased from 40,327 in 1975-76 to 48,597 in 1982-83, while the number of firms has gone up from 519,344 to 771,146. To some extent, the existing corporate tax system is responsible for the sluggish growth of number of assessable companies.
2.4.11 As regards the impact of the present corporate tax system on the economy, a number of empirical studies have established that corporate savings, investment, as well as capital structure is significantly affected by tax changes. The 'Classical' system that is currently followed in this country has been criticised on the grounds that it is heavily biased against equity financing by favouring profit retentions. As a result, companies raise roughly 70 to 80 per cent of their funds internally. Sarma (1983) shows that the double taxation of dividend incomes underlying the income tax system has kept in dividend rates low in India which is not conducive for equity financing. Lall, Srinivasa and Atri (1982) show that conqpanies depend on equity market only to the extent of 5 to 6 per cent of investment needs. It has been pointed out that this particular feature of the corporate tax system which induced companies to go for more retention is well in line with the avowed policy, namely, to enable the private sector to be self-sufficient. Also, the present system of interest deductibility favours debt-financing. This feature has proved to be detrimental to equity financing, as shown by studies such as Rao (1979) and Lall (1983). As a result, over the years, the dependence on debt has gone upl

Trends in Tax Revenue 23
2.4.12 Another major deficiency of the present tax system has been the failure to take account of inflation. The profits for the tax purpose are computed on the basis of historical costs leading to heavier tax burden. Further, depreciation allowance based on historical costs fails to meet the rising replacement costs. Even well-intentioned provisions such as investment allowance (now the investment deposit funding) and extra shift allowances are insufficient if the price rise exceeds the critical level of say 10 per cent (see Sarma and Sondhi, 1987).
2.4.13 Yet another major deficiency of the present system is that the tax system is required to pursue too many objectives. Various tax deductions and exemptions are provided to meet these objectives. Some of the important objectives pursued are, raising the revenue productivity, restructuring industrial development, restriction of monopolies, correcting regional imbalances and promoting rural development. As a result, the larger objectives of the fiscal policy regarding the corporate sector have become blurred and the related tax law has become complex.
2.5 Indirect Taxes
2.5.1 The major indirect taxes levied in India are union excises, customs at the Central level, and sales tax, state excise at the State level. Together these four taxes account for 90 per cent of the total indirect tax revenue, and over 75 per cent of the total tax revenues. Thus the design and structure of these taxes would have a significant impact on the economy.
2.5.2 The revenue profiles of these four indirect taxes are presented in Table 2.6. Between 1970-71 and 1983-84, the indirect tax revenue has grown seven times. Among the four taxes, Central excise and sales tax are the two most important, contributing roughly two-thirds of the total indirect taxes and half of the total tax revenue. As ratios of GDP, all of them have registered significant increases over the period. The buoyancy coefficients of all the four taxes are well above unity. Among the four taxes, union excise has been less buoyant as compared to the other taxes. As a result, there is notable decline in the relative importance of union excise duties, their share having come down from 37 per cent in 1970-71 to about 32 per cent in 1983-84.

Trends in Tax Revenue 24
2.5.3 However, the built-in elasticity which indicates automatic growth, is markedly lower than the buoyancy for all the four taxes. The wide gap between these two coefficients indicates that much of the growth in their yield has been due to the year-to-year discretionary measures rather than automatic responsiveness to changes in the tax base. This is particularly true of union excise duties. Although the Indirect Taxation Enquiry Committee (Jha Committee, 1978) observed that ”.... a sound tax structure should be capable of ensuring that as income increases.... the same rates of tax should result in a proportionate rise in revenues,” (p.181) a notable feature of union excise duties is its inelasticity. At 0.7, the tax has been extremely inelastic and a major reason for this has been the specific nature of the levy which makes the tax totally non-responsive to changes in prices (Nayak and Atri, 1977).
2.5.4 The growing importance of indirect taxes in the Indian tax system is a matter for concern primarily due to their adverse economic effects. Uncoordinated levy of a plethora of indirect taxes and repeated taxation of the same base by different levels of government has posed problems in assessing the cumulative impact of the levy in terms of both equity and efficiency. The predominance of taxes on inputs and capital goods is believed to have been an important factor responsible for the non-competitiveness of Indian manufactures.
2.5.5 It must be recognised that generally, indirect taxes are less effective than the direct taxes as an instrument of resource mobilisation. This is because the net resources released in real terms through the indirect taxes are likely to be less than those obtained through the direct taxes. In other words, to generate equivalent amounts of additional revenue, resource mobilisation in real terms through commodity taxes is less than that from taxes on incomes (Rakshit, 1986).
2.5.6 An important source of economic inefficiency in the Indian indirect taxes lies in the taxation of inputs and capital goods. The Jha Committee, (1978) estimated the extent of input and capital goods taxation in total indirect taxes at 40 per cent in 1977-78. In the case of excise duties, the proportion was estimated to be as high as 52 per cent and in the case of sales taxes it was 35 per cent. A more recent estimate (for 1985-86) places the proportion of revenue from inputs and
Trends in Tax Revenue 25
capital goods at over 70 per cent in the case of excise and customs duties (Bagchi, 1986).
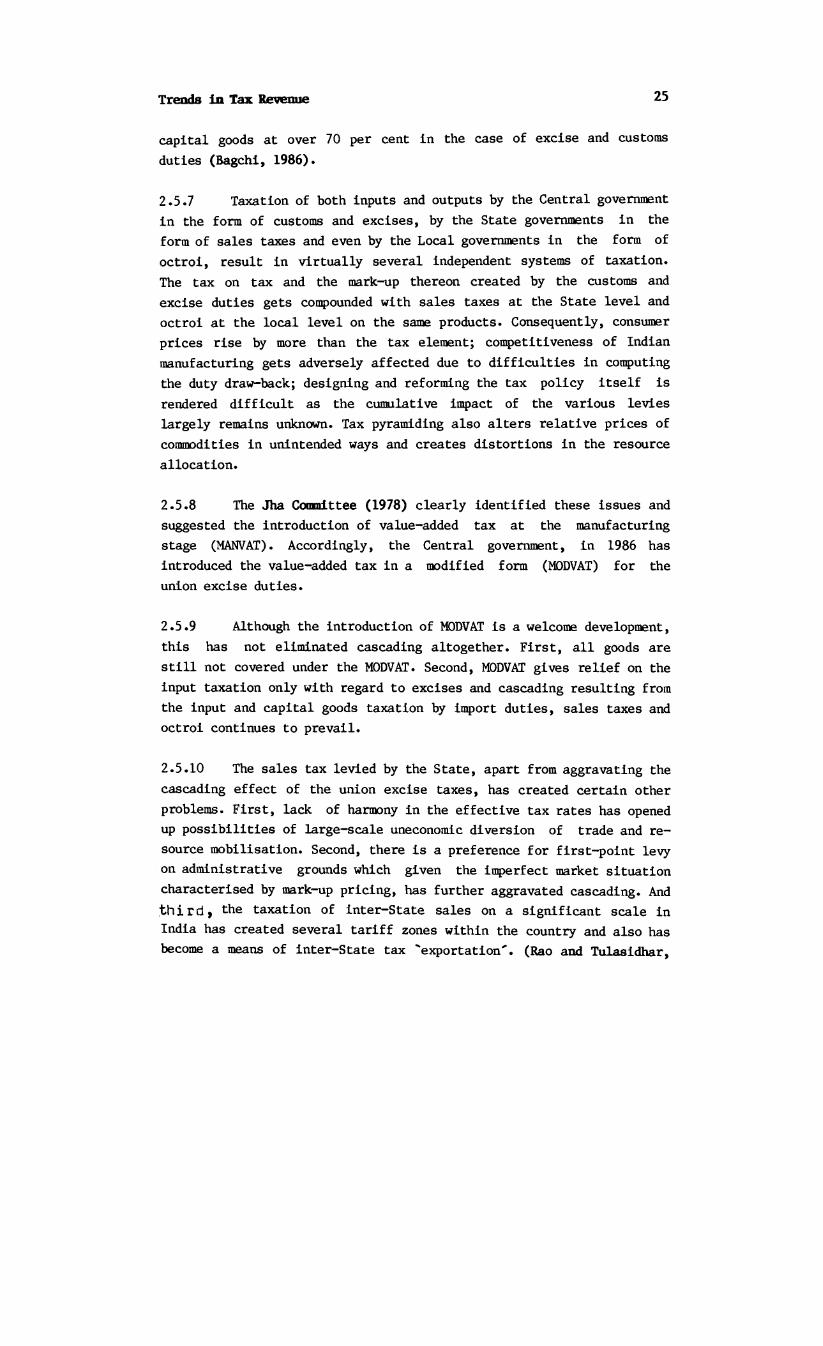
2.5.7 Taxation of both inputs and outputs by the Central government in the form of customs and excises, by the State governments in the form of sales taxes and even by the Local governments in the form of octroi, result in virtually several independent systems of taxation. The tax on tax and the mark-up thereon created by the customs and excise duties gets compounded with sales taxes at the State level and octroi at the local level on the same products. Consequently, consumer prices rise by more than the tax element; competitiveness of Indian manufacturing gets adversely affected due to difficulties in computing the duty draw-back; designing and reforming the tax policy itself is rendered difficult as the cumulative impact of the various levies largely remains unknown. Tax pyramiding also alters relative prices of commodities in unintended ways and creates distortions in the resource allocation.
2.5.8 The Jha Committee (1978) clearly identified these issues and suggested the introduction of value-added tax at the manufacturing stage (MANVAT). Accordingly, the Central government, in 1986 has introduced the value-added tax in a modified form (MODVAT) for the union excise duties.
2.5.9 Although the introduction of MODVAT is a welcome development, this has not eliminated cascading altogether. First, all goods are still not covered under the MODVAT. Second, MODVAT gives relief on the input taxation only with regard to excises and cascading resulting from the input and capital goods taxation by inport duties, sales taxes and octroi continues to prevail.
2.5.10 The sales tax levied by the State, apart from aggravating the cascading effect of the union excise taxes, has created certain other problems. First, lack of harmony in the effective tax rates has opened up possibilities of large-scale uneconomic diversion of trade and resource mobilisation. Second, there is a preference for first-point levy on administrative grounds which given the imperfect market situation characterised by mark-up pricing, has further aggravated cascading. And third, the taxation of inter-State sales on a significant scale in India has created several tariff zones within the country and also has become a means of inter-State tax 'exportation'. (Rao and Tulasidhar,

Treads in Tax Revenue 26
1986).
a. Equity and incidence#
2.5.11 Indirect taxation is generally considered to be a"second-best substitute' for bringing about desirable changes in the income distribution. This is primarily because of the uncertain pattern of the distribution of tax burden. The studies of incidence of indirect taxation made from time to time have established that indirect taxation in India is fairly progressive. In their extensive study, Chelliah and Lall (1978) confirm a progressive distribution of the tax burden in terms of expenditure: "The overall indirect tax burden increasedprogressively from about 3 per cent for households with per capita monthly expenditure not exceeding Rs 15 to nearly 22 per cent for those with expenditure Rs 100" (p.17). For individual taxes the study shows that the incidence of union excise which contributes 50 per cent of total incidence, is the most progressive. The commodity group-wise analysis shows that roughly 50 per cent of the incidence is accounted for by goods. The Report of the Indirect Taxation Enquiry Committee (Government of India, 1978) arrived at similar conclusions.
2.5.12 Subsequently, two more studies have attempted the measurement of tax incidence. The study by Divakara Rao (1984) used input-output table for computing effective tax incidence and found that indirect taxes are regressive, union excise duties being more regressive. Later a more extensive study by Ahmed and Stem (1982, 1983) attempted a measurement using the Leontief inverse of the Sixth Plan input-output table. Their results show that for the year 1979-80 most taxes are more or less progressive.
2.5.13 Thus, though the revenue productivity of the indirect taxeshas been satisfactory, the system needs radical reform to bring about the much needed integration to avoid tax overlapping and to reduce the taxation of inputs and the associated cascading effects. Steps arealready being taken in this direction. Whether the same degree ofrevenue productivity will continue after the streamlining of the indirect tax system is to be seen.
N O T E S1. This situation seems to have undergone a radical change in recent
years especially since 1984-85. The year 1985-86 has witnessed a boom in the capital market and the amount raised through new issues has jumped from about Rs 1.4 billion a year until 1984-85 to asmuch as Rs 24 billion in 1985—86. To what extent the rise incapital subscriptions have altered the capital structure of the corporate sector remains to be seen.

Trends in Tax Revenue 27
takij: 2.1
Current Revenue and Current Expenditure of Government Administration
(1970-71 to 1983-84)
Year Totalcurrentrevenue
(Rsbillion)
Totalcurrentexpendi-
(Rsbillion)
Current revenue as % of
GDP
Current expenditure as %
GDP
Current revenue as % of expendi
ture
1970-71 56.9 49.6 13.7 12.3 111.41971-72 67.1 59.7 15.0 13.8 108.71972-73 74.3 67.5 15.2 14.1 107.81973-74 82.2 72.6 13.9 12.3 113.01974-75 104.8 89.3 14.9 12.8 116.41975-76 126.7 104.0 16.8 14.0 120.01976-77 145.5 120.3 17.6 15.0 117.31977-78 156.0 129.2 16.7 14.4 116.01978-79 179.3 149.1 17.8 15.3 116.31979-80 203.6 173.2 18.5 16.2 114.21980-81 227.6 202.5 17.5 15.9 110.11981-82 273.5 237.5 18.4 16.1 114.31982-83 316.7 287.5 19.1 17.6 108.51983-84 359.6 344.0 18.4 17.6 104.5
Averagegrowthrate
15.2 15.7 2.3 2.8
Source: National Accounts Statistics, Government of India, Central Statistical Organisation, New Delhi.

Trends in Tax Revenue 28
Trends In Total Tax Revenue (1970-71 to 1983-84)
TABLE 2.2
Years Totalrevenue
(Rsbillion)
Tax revenue as % of
GDP
Tax revenue as % of total
revenue
1970-71 49.6 12.94 87.21971-72 57.9 14.20 86.31972-73 66.4 14.88 89.41973-74 75.3 13.74 91.61974-75 94.8 14.65 90.51975-76 114.8 16.94 90.61976-77 127.0 17.21 87.31977-78 135.7 16.36 87.01978-79 157.9 17.78 88.11979-80 181.0 18.52 88.91980-81 203.2 17.40 89.31981-82 245.5 18.49 89.81982-83 278.2 18.87 87.81983-84 321.2 18.35 89.3
Averageannualgrowth
15.5 2.7
Source: As for Table 2.1.

Trends in Tax Revenue 29
Trends in Tax Revenue Structure by Direct and Indirect Tax Components (1970-71 to 1983-84)
TABLE 2.3
Years Total indirect taxes
D i r e c t t a x e s
Total Non-agricultural direct taxes
Land based direct taxes
as /£ as % of GDP of
total tax
revenue
as % as % of GDP of
total tax
revenue
as % as % of GDP of
total tax
revenue
as % as % of GDP of
total tax
revenue
1970-71 10.2 78.8 2.8 21.3 2.3 17.9 0.4 3.11971-72 11.2 79.0 3.0 21.0 2.6 17.4 0.3 2.11972-73 11.8 79.1 3.1 20.9 2.7 18.1 0.3 2.01973-74 10.9 89.0 2.9 21.0 2.5 18.2 0.3 2.21974-75 11.7 80.1 2.9 19.9 2.5 17.0 0.3 2.01975-76 13.2 77.7 3.8 22.4 3.1 18.4 0.4 2.41976-77 13.6 79.0 3.6 21.0 3.0 17.5 0.3 1.71977-78 13.1 79.8 3.3 20.2 2.7 16.5 0.3 1.81978-79 14.5 81.7 3.3 18.3 2.8 15.8 0.3 1.71979-80 15.3 82.5 3.2 17.5 2.9 15.7 0.2 1.11980-81 14.5 83.5 2.9 16.4 2.5 14.4 0.2 1.21981-82 15.3 82.9 3.2 17.1 2.6 13.7 0.2 1.11982-83 15.8 83.5 3.1 16.5 2.6 13.7 0.2 1.11983-84 15.5 84.5 2.8 15.5 2.5 13.6 0.2 1.1
Source: As for Table 2.1
Trends In Tax Revenue 30
Trends in Direct Taxation in India (1970-71 to 1983-84)
TABLE 2.4
Years Direct Corporation Personaltax income tax Income tax
revenueas % of as % of % share as % of % Share
GDP GDP in total GDP in totaltax tax
revenue revenue
1970-71 2.8 1.0 7.8 1.3 10.11971-72 3.0 1.2 2.5 1.4 9.91972-73 3.1 1.3 8.7 1.4 9.41973-74 2.9 1.1 8.0 1.4 10.21974-75 2.9 1.1 7.5 1.4 9.51975-76 3.8 1.3 7.7 1.8 10.71976-77 3.6 1.3 7.6 1.7 9.91977-78 3.3 1.5 9.2 1.2 7.31978-79 3.3 1.4 7.9 1.4 7.91979-80 3.2 1.5 8.1 1.4 7.61980-81 2.9 1.2 6.9 1.3 7.51981-82 3.2 1.5 8.1 1.1 5.61982-83 3.1 1.5 7.9 1.1 5.81983-84 2.8 1.5 8.2 1.0 5.4
Tax buoyancy Elasticity
1.21.0
0.80.8
Source: As for Table 2.1

Trends in Tax Revenue 31
Trends in the Growth of Corporate Sector in India (1970-71 to 1983-84)
TABLE 2.5
Years Total No. of compa
nies
Paid-upcapital
(Rsbillion)
No. of non-Govt. companies
Theirpaid-upcapital
(Rsbillion)
No. of Govt,
companies
Theirpaid-upcapital
(Rsbillion)
1970-71 30,412 43.1 30,098 22.4 314 20.71971-72 32,563 46.5 32,211 22.8 352 23.71972-73 34,873 53.4 34,483 23.5 390 30.01973-74 38,383 71.9 37,933 25.4 450 46.51974-75 40,580 82.0 40,007 32.4 573 49.71975-76 43,265 94.4 42,614 33.2 651 61.11976-77 45,632 105.5 44,931 33.7 701 71.71977-78 47,955 120.2 47,210 34.5 745 85.31978-79 51,051 118.8 50,269 35.6 782 83.21979-80 55,780 134.1 54,955 36.6 825 97.51980-81 62,801 146.7 61,150 38.2 851 108.51981-82 72,402 178.4 71,508 49.6 894 128.81982-83 82,903 199.1 81,960 51.9 943 147.21983-84 93,124 211.4 90,278 62.7 1,026 163.6
Sources: 1. Report on Currency and Finance,Reserve Bank of India.
2. Annual Report, Ministry of Law, Justice and Company Affairs, Government of India.

T rands andTABLE 2.6
S t r u c t u r e o f I n d i r e c t Taxes( 1970-7 1 t o 198 3-04)
T o t a li n d i
Cu ~1--a s o
st on s
asCant r a l
Z x c i s aS a l e st a x
St at e E x c i s e
Ye ar r e c t o f G ")! o f as o------ -7-----as a as \ as ,1 as a as a 0 f
t a x a s t o t a l o f G JP o f o f G JF- o f o f G OP t o t a 1as % t a x t o t a l t o t a l t a x
o f G OP rav/enue t a x t a x rav/enu erev/anu e rev/anu a
( 1 ) ( 2 ) — J a H T ~Ts~l------- T 7) ( bj (9 ).. “ J a i ) ____
1970-7 1 1 C. 2 1.4 13.8 4. 3 37. 2 -1 c . i 15.3 0. 5 4 . 519 71-72 11.2 1.8 1 2. 7 5. 3 37. 3 2 .2 15.4 0 . 7 4 . 9197 2-7 3 11.3 2. 0 13.4 5 . 4 35. 2 2. 3 15.4 0 . 7 4 . 719 7 3-74 10.9 1.9 13.9 4 . 3 35.3 2. 2 15. 1 0 . 7 5 . 11974-75 11.7 2. 1 14. 3 5. 1 34. 7 2. 5 17.0 0 . 7 4 . 31975-75 1 3. 2 _. 2 1 3.0 5. 1 30. 2 3.0 17.0 0 . 7 4 . 11975-77 1 3. 5 ? 2 *-. *- 1 2. 3 5 .9 34. 3 3. 2 18. 5 O • ‘J 4 . 71977-78 1 3. 1 2 . 3 14.C q csJ . O 33. 5 3. 1 13.9 0 . 7 4 . 219 7 3-79 14. 5 2. 3 15.7 •3. 2 54. 8 3. 3 13.5 G. 3 4 . 51979-30 15. 3 3. 1 15.3 3. 3 34. 1 3. 5 13.9 0 . 8 4 . 319 30—3 1 14.5 r: 17. 2 5.7 32. S 3. 5 30. 1 0. t3 4 . 5133 1-8 2 15. 3 j* 3 17.3 5 .7 30. 8 21.1- 0 . 9 4 . 31CB 2-8 3 15.3 3. 5 19. 1 5. 5 29. 5 3. 9 20. 5 i .O 5 . 3193 3-34 1 o . 5 . -t 13.5 5. •: 31.5 3. 7 20. 1 1.0 5 . 4
3uo y an cy 1.5 1. 1 1.4 1. 3
u l a s t i c i t y 1. 2 D.7 1. 2 1. 1
S o u r c e : Same as i n T a b l e 2 . 1 .
CiJK)

CHAPTER 3
SAVING PERFORMANCE OF PUBLIC SECTOR ENTERPRISES
3.1 Role of Public Enterprises In India
a. Introduction
3.1.1 Planning for industrialisation in a mixed economy like India entails both initiating and directing the level and pattern of investments. The objective of "rapid industrialisation with particular emphasis on the development of basic and heavy industries" enunciated by the Second Five Year Plan required, ”.... large scale production and unified control and allocation of resources in certain major lines of activity" to be undertaken by the State. The Industrial Policy Resolution of 30th April, 1956, provided the basic rationale behind public sector's role in achieving 'commanding heights' of the economy, wherein, all basic and strategic industries and public utilities were placed under its exclusive domain. Public enterprise policy, thus, has become a principal instrument of planning in India in directing, controlling and sustaining the pace of economic development.
3.1.2 Over the last 30 years, public enterprises have not only grown phenomenally in terms of their investment and contribution to production but also have diversified in the scope of their activities. The Central government enterprises, for example, numbered only five in 1954-55 with a capital investment of Rs 290 million and grew to as many as 209 with capital investment of Rs 322 billion at the end of 1984-85. Similarly, the State level enterprises which were only a handful in the early fifties grew to about 400 by 1974-75 and to as many as 651 in 1980-81. Even between 1976—77 and 1980-81, the investment of State level enterprises, excluding energy and transport sectors, showed an increase of 32.5 per cent from about Rs 6 billion to Rs 13.8 billion. In the energy and transport sectors, the increase in investment was over 35 per cent from Rs 66.64 billion to Rs 90 billion during the quinquennium (Shankar and Sarma, 1986). Employment in public sector enterprises too showed a phenomenal increase from 3.1 million in

Saving Performance of Public Sector Enterprises 34
1960-61 to 8.3 million in 1983-84.1 The pace of growth of employment was faster than in the organised sector of the economy. The proportion of employment in public enterprises in total organised sector employment, increased from 25 per cent in 1960-61 to 34 per cent in 1983-84.
b. Share of public enterprises in income generation and capital formation.
3.1.3 The growing importance of public enterprises in Indianeconomy can be clearly seen from their contribution to the income generated. As a proportion of GDP, the share of public enterprises registered more than three-fold increase over the last two decades. In 1960-61, the contribution of public enterprises to total GDP was less than 5 per cent; but by 1983-84, it was close to 16 per cent (Table 3.1). This phenomenal increase in the share of public enterprises was brought about, to a large measure, by the increasing contribution of mining, manufacturing and banking sectors, both in absolute terms and relative terms, to the shares of other sectors.
3.1.2 The increasing contribution of public enterprises can be seen by comparing the trend rates of grcwth of GDP and capital formation in the economy with those contributed by public enterprises. Table 3.3, which summarises these growth rates, shows that during the period1971-72 to 1983-84, the rate of growth of GDP produced by public enterprises was higher (18.5 per cent) than the growth of GDP in the economy as a whole (12.3 per cent). This was true also of every sector of the economy excepting Transport and Communication.
3.1.3 Increasing role of public enterprises may also be seen in terms of their share in capital formation in the economy (Table 3.2). In 1983-84, almost 37 per cent of the capital formation in the economy took place in the public enterprises, forming about 9.8 per cent of the GDP. In 1960-61, the public enterprises' share in total capital formation was 32 per cent forming 5.8 per cent of GDP out of a total gross investment of about 18 per cent. Thus, during the period from1971-72 to 1983—84, while capital formation in public enterprises grew at 17.8 per cent per year, the corresponding growth of capital formation in the national economy was lower at 15.4 per cent.
3.1.4 The expanding role of public enterprises can be seen not

ratiomerely in terms of its/to GDP, but also by its control over certain key areas of economic activity. The comparison of sector-wise GDP shares of public enterprises in the national economy since I960, brings this out very clearly (Table 3.4). It may be seen from the table that in 1983-84, almost the entire 'Mining and Quarrying' sector was under the control of public enterprises whereas in 1960, they contributed only 11 per cent of the income generated in the sector. In 1983-84, public enterprises contributed over 85 per cent of the income generated in electricity, gas and water supply and in 'Banking and Insurance' it was over 75 per cent. Their contribution in 1960 was only a little over 50 per cent and 38 per cent, respectively. In the manufacturing sector too, their share of income increased from a mere 4 per cent in 1960 to about 20 per cent in 1983-84.
3.1.5 The expansion in the role of public enterprises in manufacturing activity has taken place both by intensification of the public sector in certain key areas as well as by widening their sphere to diversified activities. In certain key areas like coal, crude petroleum, copper, lead and telephones and teleprinters, public enterprises account for nearly 100 per cent of the industrial production in the economy. (Table 3.5). In basic metal industries and zinc, their contribution in the total production is over 75 per cent. Their share in the financial structure of the economy too is predominant, accounting for over 92 per cent of both deposit and credit of the commercial banks and the long-term financial institutions are almost wholly in the public sector.
c. Rationale for the increasing role of public enterprises.
3.1.6 It is instructive to recall the circumstances and the considerations which impelled the planners in India to assign a key role to public enterprises in the economy. Unlike In the western capitalist countries where public enterprises were developed in phases as and when market failure could be recognised, in India, they were developed as a result of a deliberate policy recognising the inadequacy of market mechanism itself. Given that the resource endowments were acutely uneven, market supply and demand would not represent economic needs; market forces representing individual preferences would run counter to the social preferences; and market solution would not be optimal when the infrastructural facilities are in a rudimentary state2 (Majumdar, 1977 and Sheahan, 1976). Thus, when the Second Five Year
Saving Performance of Public Sector Enterprises 35

Saving Performance of Public Sector Enterprises 36
Plan was initiated with the objective of rapid industrialisation with particular emphasis on the capital goods industries, it was obvious that public sector had to take up commanding heights in the economy. Given the inadequate development of market economy, a weak industrial base, scarcity of entrepreneurial class, lack of infrastructure - physical and human, poor state of technology and low level of savings and investments in the economy - sustained self-reliant industrial growth was possible only with government initiative. These and the considerations of providing a corrective for market imperfections coupled with the booming foreign exchange crisis in the latter half of fifties, necessitated the decision to use the public sector as an
3instrument to accelerate self-reliant growth .
3.1.7 Thus, public enterprises in the Indian context were required to provide both entrepreneurial support and entrepreneurial substitution in areas where the private sector had failed to deliver. Thus, they were required to fulfil a variety of objectives, namely, (i) producing goods having very high external economies and those having a strong complementarity with the rest of the economy. (Infrastructure industries, capital intensive heavy industries, and some essential inputs such as coal and steel are examples of this); (ii) generating surpluses to raise the level of savings and investment in the country; (iii) achieving self-reliance in technology through progressive import substitution; (iv) safeguarding the interests of labour; (v) stabilising prices of basic consumer, capital and intermediate goods; (vi) balanced regional development by locating high linkage industries in backward areas, and (vii) counteracting oligopolistic market practices and to reduce income disparities.
3.1.8 Truly, the objectives public enterprises were expected to fulfill were so ambitious that disappointments were unavoidable. Further, some of the objectives were even mutually conflicting. This could only result in the blurred sense of purpose and a lack of sense of direction. In what follows, we will evaluate the performance of public enterprises in some detail.
3.2 Performance of Public Sector Enterprises - An Evaluation
a. Graving savings — investment imbalance in public enterprises.
3.2.1 The primary reason for the disenchantment with public

Saving Performance of Public Sector Enterprises 37
enterprises has been on the grounds of poor productivity. It has beenargued that low productivity, in turn, has led to two important adverseconsequences on the economy. First, this has led to low profitability of public enterprises resulting in inadequate generation of surpluses to finance their investments. Thus, financing of additional public investments could come about only by drawing upon the savings of the household sector, and to this extent, constraining the more productive private sector investment. Second, in a situation where prices are fixed to cover long run marginal cost, low productivity couldresult in higher prices of the products of public enterprises. As manyof the intermediate and capital goods are produced in the public enterprises, their low productivity could push up the prices of products all along the chain of production. Further,the protection accorded by import restrictions and tariff policy, would result in a higih cost-non-competitive industrial economy. We will, in what follows, examine and elucidate these arguments.
3.2.2 A detailed examination of savings and investments in different sectors of the economy brings out some striking features. First, since the mid seventies, there has not been any appreciable increase in the ratio of savings to GDP in the public sector (Table 3.6). The ratio fluctuated between 4.5 per cent and about 5 per cent (except in 1980-81 when it fell to 3.6 per cent). In fact, the highest ratio of5.2 per cent reached in 1976-77 was never again achieved. Even this was made possible because of the savings of administration departments and if the savings of public enterprises alone are considered, the ratio stagnated at a little over 2 per cent since 1976-77. Though the performance Improved slightly to over 3 per cent in 1982-83 and 1983-84, it is difficult to take this as a trend yet.
3.2.3 Clearly, considering the large volume of investment in public enterprises, their savings performance has clearly been unsatisfactory. Since the mid-seventies, not only have the public enterprises' savings not shown any marked improvement, but also continued to widely fluctuate. Thus, as a proportion of GDP, savings of public enterprises stagnated around 1.7 until the mid-seventies and fluctuated between 1.9 per cent and 3.5 per cent in the period thereafter. A disaggregated analysis shows that almost 80 per cent of the savings of public sector enterprises is generated by non-departmental units (Table 3.7). Even among these, if one considers net savings (after depreciation), a bulk of savings generation - over 85 per cent (in 1983-84) - has come from
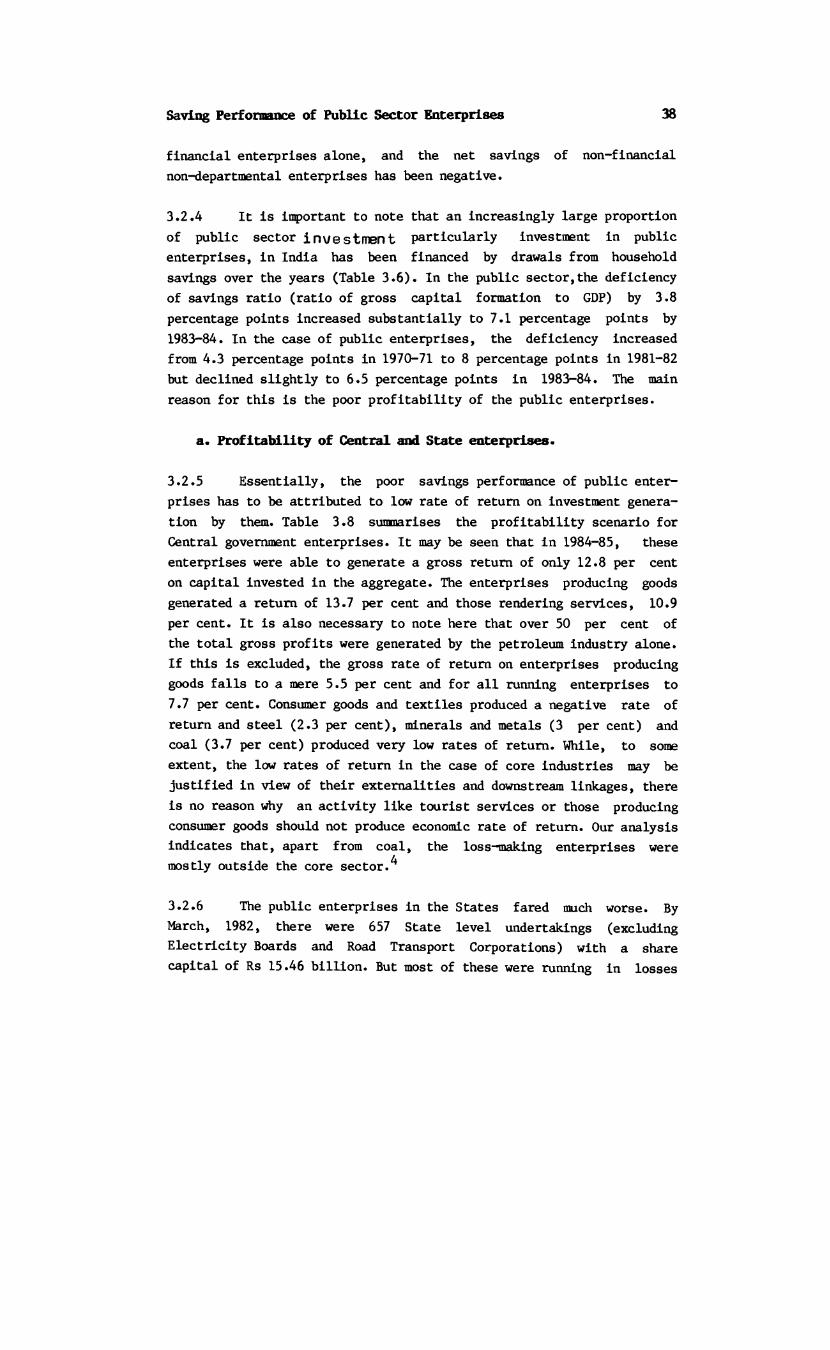
Saving Performance of Public Sector Enterprises 38
financial enterprises alone, and the net savings of non-financial non-departmental enterprises has been negative.
3.2.4 It is important to note that an increasingly large proportion of public sector investment particularly investment in public enterprises, in India has been financed by drawals from household savings over the years (Table 3.6). In the public sector,the deficiency of savings ratio (ratio of gross capital formation to GDP) by 3.8 percentage points increased substantially to 7.1 percentage points by 1983-84. In the case of public enterprises, the deficiency increased from 4.3 percentage points in 1970-71 to 8 percentage points in 1981-82 but declined slightly to 6.5 percentage points in 1983-84. The main reason for this is the poor profitability of the public enterprises.
a. Profitability of Central and State enterprises.
3.2.5 Essentially, the poor savings performance of public enterprises has to be attributed to low rate of return on investment generation by them. Table 3.8 summarises the profitability scenario for Central government enterprises. It may be seen that in 1984-85, these enterprises were able to generate a gross return of only 12.8 per cent on capital invested in the aggregate. The enterprises producing goods generated a return of 13.7 per cent and those rendering services, 10.9 per cent. It is also necessary to note here that over 50 per cent of the total gross profits were generated by the petroleum industry alone. If this is excluded, the gross rate of return on enterprises producing goods falls to a mere 5.5 per cent and for all running enterprises to7.7 per cent. Consumer goods and textiles produced a negative rate ofreturn and steel (2.3 per cent), minerals and metals (3 per cent) andcoal (3.7 per cent) produced very low rates of return. While, to some extent, the low rates of return in the case of core industries may be justified in view of their externalities and downstream linkages, there is no reason why an activity like tourist services or those producing consumer goods should not produce economic rate of return. Our analysis indicates that, apart from coal, the loss-making enterprises were mostly outside the core sector.
3.2.6 The public enterprises in the States fared much worse. ByMarch, 1982, there were 657 State level undertakings (excludingElectricity Boards and Road Transport Corporations) with a share capital of Rs 15.46 billion. But most of these were running in losses

Saving Performance of Public Sector Enterprises 39
and hardly did they provide any worthwhile return (Government of India, 1984). In fact, in some of the States, loans had to be given to meet cash losses of public enterprises.
3.2.7 The State government investments are of a much higher magnitude in power and transport sectors. Loans advanced by the State governments to the Electricity Boards upto 1985-86 amounted to Rs 153.99 billion (vide Table 3.9). While as per the norms laid down by the Rajyadhyaksha Committee (1980), the Boards were required to generate a return of at least 15 per cent including an average composite rate of interest of 7 per cent, the actual financial performance in 1985-86 (revised estimates) generated a return of less than 4 per cent. When the interest liability of the Electricity Boards was taken account of, the rate of return was substantially negative (-7.1 per cent). In fact, none of the Electricity Boards exceeded the normative rate of return except Kerala (17.2 per cent) and in the case of 6 Electricity Boards, revenue was not adequate to meet even working expenses, leave alone meeting interest liability. After meeting interest liability, only the Boards in Andhra Pradesh, Kerala, Madhya Pradesh and Tamil Nadu had positive surpluses, the highest return being generated in Andhra Pradesh (6.2 per cent). The accumulated interest arrears alone, by 31st March, 1983, amounted to a staggering Rs 15.73 billion (Government of India, 1984). What is of greater concern is that thecommercial losses of Electricity Boards almost doubled during the six years from about Rs 7.5 billion in 1980-81 to Rs 14.4 billion in 1985-86 (Table 3.10).
3.2.8 Equally worrying were the finances of State Road TransportCorporations. The net return on the estimated investments of Rs 17.9 billion in these Corporations in 1985-86 was - 0.8 per cent (vide Table 3.11) while even the norm stipulated by the Eighth FinanceCommission required them to generate a net return of 3 per cent. Although the losses of these undertakings showed a substantial decline from -20 per cent in 1980-81 to -10.8 per cent in 1985-86, the continued losses of these undertakings over the years have seriously constrained the generation of public sector savings at the State level. In fact, only the corporations in Haryana and Rajasthan could make any worthwhile profits. Only a handful of corporations could generateenough surplus to meet the interest liability. The losses of thismagnitude have occurred even when Section 22 of the Road Transport Corporations Act, 1950 specifically says that the corporations "shall

Saving Performance of Public Sector Enterprises 40
act on business principles".
3.2.9 The departmental undertakings of the State governments did not show any better financial performance either. In irrigation alone, the State governments have invested over Rs 31 billion during the period from 1951 to 1986. But in 1985-86, receipts from irrigation at only Rs2.5 billion could cover less than a fifth of the working expenses of Rs 13 billion. Thus, on working expenses alone, the loss was over Rs 10.5 billion and if the opportunity cost (in terms of the average borrowing rate)to the government is taken at 6.5 per cent, and the implicit tax arising from lower procurement prices is taken account of (Rs 4.5 billion), the net loss for 1985-86 works out to over Rs 20 billion.
d. Issues on pricing policy.
3.2.10 Closely related to the problem of raising the level and growth of public enterprises' savings is the issue of a proper pricing policy for the products of public enterprises. As mentioned earlier, in a situation where productivity of public enterprises is low (or costs are above normative price ) ,"* the price charged to cover the long-run marginal costs of basic inputs and capital goods, given the imperfections in the market, could result in all-round escalation of costs and prices. On the other hand, when an enterprise is not running efficiently, if the prices charged are below cost, implications arising from the alternatives - cost in terms of lower developmental expenditure and/or increase in budget deficit - have to be considered. Contrarily, charging prices below the normative cost in a productive enterprise, besides subsidising private sector at the cost of additional public savings and investments, would alter the relative prices in unintended ways to distort production pattern and render drawing equity implications more difficult.
3.2.11 However, in spite of its obvious significance, the pricing policy did not receive adequate attention in the Indian context until recently. Though the pricing policy announced by the government in 1968 lays down the broad guidelines, in reality, price has generally been regarded as a simple matter of accounting whereby, price adjustments were generally made in keeping with changes in accounting costs. Taking account of historical costs of plants and equipment even when normative costs are considered while fixing prices, has led to inadequate internal resource generation for the replacement of capital. Again,

Saving Performance of Public Sector Enterprises 41
considering actual costs of inputs has resulted in reduced incentive for more economical use of inputs (Government of India, 1986).
3.2.12 Increases in the level of public enterprises savings can comeabout either by increasing the productivity of public enterprises or by enhancing the prices of the products of public enterprises. In the short run, given the constraints on productivity increases, public enterprises savings can be increased only by enhancing the prices ofpublic sector products. Increase in the prices of products and services of public enterprises, particularly in the core sector, could lead to a cost-push type of inflationary situation and when the prices are above the normative long-run marginal cost (of a competitive firm), this could clearly result in a non-competitive economy. If it is construed that in the short run significant increases in tax ratio cannot beachieved, mobilising savings through internal and external borrowing is limited and non-plan expenditures cannot be reduced, the alternative to enhancing the prices of public sector products to finance increases in public investment is clearly, deficit financing. Thus, under the specified conditions, the government has to evaluate the alternative policies in terms of their inflationary impact on the economy. On this, however, the choice is not very clear for, if deficit financing creates demand pull forces and wages and prices spiral, hiking prices of public sector products could create a cost-push type of inflationary situation (Sundaram and Tendulkar, 1982).
3.2.13 How have the administered prices behaved in the past? Whilethere is no study analysing whether the administered prices were determined at optimal levels, changes in prices affected since 1970-71 clearly indicate that these prices have increased faster than the general price level (Table 3.12). Thus, while the non-administered prices increased at an annual rate of 8.5 per cent during the period, administered prices increased by 9.1 per cent, of which increase in the prices of core items was as high as 11.5 per cent per year and those of petroleum products 15.9 per cent. This order of increase is only the direct effect and if indirect effects through the input-output relations are traced and cascading effects are accounted for, the contribution of administered prices to the inflationary situation in the economy mast have been of a much larger magnitude.
3.2.14 Although in the aggregate it is suspected that prices of public enterprises are higher than optimal, we also find the reverse

Saving Performance of Public Sector Enterprises 42
situation in certain departmental enterprises. The clear case is that of irrigation rates, which as mentioned earlier do not even cover a fifth of the working expenses of irrigation works. Besides the question of inadequate surplus generation, it must be mentioned that this generates unintended subsidy which accrues mainly to the well to do farmers [Nanjundappa, 1986]. Underpricing of products of some State transport undertakings, Electricity Boards and certain categories of railway commuters (suburban) may also be mentioned.
3.3. Productivity Trends in Public Sector Enterprises
a. Evidence of falling productivity.
3.3.1 We have, in the earlier section, highlighted the failure of public enterprises in generating adequate saving and consequent drawals from household sectors' savings for public sector investment. Drawal of household savings for public investment is a feature common to many developing countries, and in itself is not undesirable. It would be undesirable if the productivity of public investment is lower than that of private sector, and public and private investments are competitive rather than complementary.
3.3.2 What has been the trend in the productivity of public sector enterprises? How does it compare with the productivity in the private sector? Unfortunately, not many studies addressing this issue are available. This is partly because of the difficulties in comparing the two sectors, for the Industrial Policy Resolution of 1956 prevents the entry of private sector into certain key areas of manufacturing altogether. There are however some studies which may be briefly discussed here.
3.3.3 Gupta's (1982) study on the productivity trends in fertiliserOindustry showed that total factor productivity (TFP) as well as the partial productivities of labour and capital in the public sector was below that of private sector. Further, total and partial productivities in both public and private sectors tended to decline and as the rate of decline was faster in the latter, the public sector showed improvement in its relative performance over time. The only comparative aggregate study is that of Dholakia [1977] which examines the productivity trends of public and private sectors in manufacturing activities as a whole. The study concludes that while the TFP in the private sector

Saving Performance of Public Sector Enterprises 43
remained static, remarkable Improvement in the public sector was experienced during the period from 1960-61 to 1975—76.
3.3.4 Dholakia's study seems to have both data and conceptual problems. The data on the capital stock employed In the study seems to have been increasingly underestimated over the time period for the public sector and overestimated for private sector as no adjustment seems to have been made for nationalisation of various industries from time to time. This tends to overestimate public sector productivity and underestimate productivity of the private sector. Conceptually, it must be noted that TFP is merely a residual catch-all and hence, even errors in estimation would affect the value of TFP (Raj, 1985). In the Indian context, where the firms, particularly those in the private sector are known to underreport their output to evade taxes (Acharya et al, 1986), downward bias in the TFP of private sector cannot be ruled out.
3.3.5 We have made some simple analysis of productivity on thebasis of the rates of growth of GDP and GDCF in the economy and inpublic enterprises. We have computed these growth rates for the periodfrom 1971-72 to 1983-84 (vide Table 333). During this period, the rateof growth of GDP generated by public enterprises (18.5 per cent) wassubstantially higher than the growth of GDP in the economy (12.2 percent) and this cannot be entirely explained by the differences in thegrowth rate of GDCF (17.8 per cent in public enterprises and 15.4 percent for the economy). The difference in the rates of growth of GDP inpublic enterprises and that of the economy was 6.4 percentage points,but the difference in the growth of GDCF in public enterprises and theeconomy was a mere 2.3 percentage points. This trend is true not onlyof the aggregate but also for some of the sectors such as agriculture,animal husbandry and mining. In the case of some of the sectors such asconstruction, trade and commerce and banking and insurance, GDP inpublic enterprises grew faster than in the country as a whole even whenGDCF growth in public enterprises grew at a much lower rate than in thecountry. Thus, a marginally higher rate of growth of GDCF has been ableto generate a much higher rate of growth of GDP in public enterprises.It seems that increases in GDP originated by public enterprises ocurrednot merely because of larger investments in these enterprises, but alsodue to their better efficiency of resource use. However, as mentionedearlier, underreporting of incomes in the private sector and upwardbias in the capital stock of private sector and downward bias due to nationalisation weakens this conclusion*

Saving Performance of Public Sector Enterprises 44
3.3.6 The increase in the efficiency of resource use in public enterprises does not, however, come out clearly in the case of the manufacturing sector, contrary to Dholakia's conclusions. The rate of growth of GDCF in public enterprises was higher than in the private sector by about 3.5 percentage points and the difference in rate of growth of GDP too between the two sectors is of a similar magnitude.
3.3.7 However, growth of income depends not only on the growth of capital formation but also on the existing stock of capital itself. In order to take this into account, we have estimated the capital stock figures for public and private sectors, taking Uma Datta Roy Choudhury's (1977) estimate as the bench mark and using the perpetualQinventory method. The industrial break-up of capital stock in public and private sectors was arrived at on the basis of the information contained in the study by Kapoor and Khera (1977). On the basis of these, output-capital ratios have been computed. These ratios computed for the total economy as well as manufacturing sectors are presented in Table 3.13.
3.3.8 The partial capital and organised labour productivity ratios for the public and private sectors reinforce our earlier observation on productivity trends. Whereas the output per rupee of capital stock in public sector showed a marginal improvement from 0.18 per cent in 1970-71 to 0.20 per cent in 1983-84, in the private sector it showed a decline from 0.48 per cent to 0.41 per cent during the period. Similarly, the partial labour productivity in the case of public sector improved from Rs 6,600 in 1970-71 to over Rs 10,000 in 1983-84, but in the private sector it showed only a marginal increase from Rs 6,639 to Rs 7,789. These suggest the faster increase in both capital and organised labour productivities in public sector as compared to the private sector.
3.3.9 To conclude from these, as in the case of Dholakia's study, that public sector productivity has shown an increasing trend may be misleading. We have already pointed out the possibility of upward bias in public sector productivity and downward bias in private sector productivity due to nationalisation and underreporting. Given that the extent of bias on both accounts is not known, it would be difficult to arrive at a firm conclusion on productivity trend in the public sector enterprises as a whole.

Saving Performance of Public Sector Enterprises 45
3.3.10 Although in the aggregate, the capital and labour productivity in public enterprises showed an increasing trend, it is relevant to note that in the manufacturing sector, in fact, the productivity of public sector has shown a declining trend. The capital productivity declined from Rs 0.12 per rupee of capital stock in 1970-71 to Rs 0.07 in 1983-84. Similarly, value-added per worker declined from Rs 6301 to Rs 5882 during the period. Given the direction of biases in the capital stock and output figures mentioned above, the declining partial productivities of both capital and labour in the manufacturing sector of public enterprises seem to be truly substantial. Again, while the labour productivity in public enterprises declined during the period, it showed increasing trend in the private sector from Rs 5,987 in 1970-71 to Rs 9837 in 1983-84.Taken in conjunction with the fact that employment in the public enterprises increased substantially during the period, this reinforces our suspicion of the existence of sizeable overemployment in public sector manufacturing enterprises.
b. Reasons for fall in productivity.
3.3.11 Several reasons have been pointed out for the low efficiency of public sector enterprises reflected either by negative rates of return or in terms of high prices of essential intermediates and capital goods provided by public enterprises. Inadequate corporate planning, inaccurate designing, lack of managerial and financial autonomy, bureaucratisation and politicisation of management with consequent constraints on decision making, absence of continuity of top management, location of plants on political considerations and overemployment under pressure from labour unions are much too familiar a story of public sector enterprises (Bhaya, 1983 and Raj. 1985).
3.3.12 An important reason for the high costs is the cost over-runs of public sector projects. In the case of projects seeking aid finance, projects are shunted around prospective donors and sometimes source-tying results in the redesigning of entire plant and technology [Bhagwati and Desai, 1970]. Underestimation of project cost initially to obtain speedy approval and stoppage of the project in mid-stream for want of funds, delays in implementation of projects due to financial constraints (particularly at the State level), starting of several projects simultaneously irrespective of financial considerations and

Saving Performance of Public Sector Enterprises 46
staggering them for want of funds later, are some of the other reasons for this. In the case of power projects, for example, the Rajyadhyaksha Committee which went into this, brings it out clearly (Table 3.14). The minimum time over-run of hydel power projects was two years and maximum nine years. The cost over-runs were usually over 100 per cent; in two cases it exceeded 400 per cent and in one case it was as high as 700 per cent. Similarly, in thermal projects, the usual cost over-run was above 80 per cent (Ahluwalia, 1985).
3.3.13 Low capacity utilisation is another factor which is said to have resulted in low productivity of public enterprises. Table 3.16 which summarises the pattern of capacity utilisation since the mid-seventies in Central public enterprises brings this out clearly. The units with less than 50 per cent capacity utilisation increased from 13.4 per cent in 1975-76 to 20.3 per cent in 1983-84. On the other hand, those utilising more than 75 per cent of their capacity declined from 61.6 per cent to 51.2 per cent during this period. * Incompatibility of the structure of capacities with the demand pattern, inaccurate design specifications (Ahluwalia, 1985 and Sengupta, 1984), besides general factors such as fall in demand condition and supply bottlenecks created by infrastructural constraints, were the other reasons cited.
3.3.14 Another important reason cited for the poor performance of public sector enterprises is the excessive wage cost and interest burden (Bagchi, 1982) arising from high proportion of borrowed capital. To examine this, we have computed the factor income shares in public enterprises and private organised sector (Table 3.17). Our analysis shows that this was true until 1980-81. Both the proportions as wage income and interest income were higher in public enterprises. Since then, the share of wage income has declined in both the sectors, but as the decline was faster in public enterprises, the share of wage income stood at a higher level in private organised sector than in public enterprises. The proportion of interest income in public enterprises, however, continues to be nuch higher than in the private organised sector. Thus, in recent years, as the share of 'profits and dividends' is more or less equal in the two sectors, the share of capital in income generation is much higher and the share of labour much lower in public enterprises than in the private organised sector, contrary to the general impression.

Saving Performance of Public Sector Enterprises 47
3.3.15 Lower productivity of public enterprises due to improper maintenance and inadequate investment is clearly visible in the transport and power sectors. The report of the Rajyadhyaksha Committee on Power (Government of India, 1982) clearly points to the fact that continued under-investment in transmission and distribution has caused a secular increase in transmission and distribution losses. Continued under-investment in railways along with a gross neglect of capital stock maintenance has only aggravated the increasingly inefficient operations of railways (Ahluwalia, 1985, Chapter 5). Inadequate reinvestment has also been cited as a reason for the inability of State Road Transport Corporations to replace overaged fleets of buses (Government of India, 1986).
3.3.16 Equally responsible are the non-professionalism anddiscontinuous management in public enterprises. A study of 140 State level public enterprises by the Institute of Public Enterprisesrevealed that only 10 per cent of the Board members consisted ofprofessional experts and the shares of public figures and officials, respectively, were 45 per cent and 32 per cent. The tenure of chief executives discussed in the study (summarised in Table 3.18) is even more revealing. Almost 42 per cent of the chief executives had a tenure less than six months and about 75 per cent less than 18 months(Shankar, and Sharma, 1986).
3.4 Public Enterprises — Prospects for the Future
3.4.1 We argued earlier that the growth of public sectorenterprises over the years has been financed by drawing on private sector, particularly the household savings for private sector investment. We have also given some evidence to the effect that productivity in public sector manufacturing enterprises has been lower and has declined at a faster rate than the private sector. The inevitable question is what should be role of public enterprises In the future?
3.4.2 To answer this question, it is necessary to know the exact relationship between public enterprises and the private sector. In other words, the issue is whether the two are complementary, or whether public sector crowds out the private sector. The literature in this area is still inconclusive. Crowding out of private investment is postulated mainly on the considerations of lower availability of savings to the private sector after meeting the investment requirements

Saving Performance of Public Sector Enterprises 48
of the public sector. Contrarily, some have argued that a slow down in public sector investment has been, in fact, the main reason for the deceleration in the industrial growth of the economy since the mid-sixties. It has been argued that fall in public sector investments reduces the demand for private sector output and on the supply side, creates bottlenecks for the growth of output of the private sector (Patnaik and Rao, 1977; and Ahluwalia, 1985).
3.4.3 The strength of the demand side and supply side complementary effect, however, depends on the strength of backward and forward linkages of the public enterprises with the private sector. Available empirical works on crowding out too have not helped to clarify the situation. While the studies of Sundararajan and Thakur (1980) and Krishnanurty (1984) confirm the crowding out effect, Rangarajan's (1982) study shows a strong complementary relationship between public and private corporate sectors' investment.
3.4.4 This brings the crucial issue of the role of public sector enterprises into proper perspective. The issue is not whether the public sectors' role should increase or diminish in the Indian economy. It is, in which sphere of activity it should increase its role and where its role should be curtained. Essentially, in areas where public investment is complementary to private investment, there still exists scope for expanding public sector activity even if productivity levels are low and declining.^ Similarly, public sector, given its inherent problems, should limit its role where private sector can deliver the goods better. Essentially, this implies that expansion activities where public sector investment has a very high degree of backward and forward linkages would be beneficial to the economy. Admittedly, this also implies that public sector should continue to invest or even expand its role in the core sector where the backward and forward linkages — direct and indirect - are high, it should desist from other manufacturing activities, and wherever possible divest itself of these activities to the private sector in view its low and declining productivity trends.
3.4.5 The pattern of investment in Central government enterprises, at least since the seventies, however, does not seem to have taken this issue into consideration, (vide Table 3.18). Investment in the core sector as a proportion of total investment in Central government enterprises steadily declined from over 60 per cent in the beginning of
Saving Performance of Public Sector Enterprises 49
the seventies to a little over 40 per cent in 1979-80, and then gradually increased to 53 per cent by 1984-85, largely due to the higher investment in the petroleum sector. The important activities where the proportion of investment showed phenomenal decline were steel (from 23.5 per cent in 1972-73 to 10 per cent in 1984-85), heavy engineering (from 10.7 per cent to 3.5 per cent), and transportation equipment (from 6.1 per cent to 3.9 per cent).
3.4.6 The future of the public sector in the country thus lies in its deeper and wider involvement in the core sector industries. Even here, particularly in activities such as energy, railway and road transport, productivity levels are low and have been falling partly because of lack of adequate resources for balancing and maintenance of existing capital and reinvestment for upgradation of technology (Ahluwalia, 1985). Along with making investment, it is necessary to improve productivity by upgrading technology, professionalising management, improving the man-machine ratio and having a realistic price policy.
3.4.7 The Sengupta Committee [Government of India, 1986] does recognise these issues and accordingly treats the core sector separately from other activities of public enterprises. The Committee has recommended that loss-making non-core enterprises should be subject to a detailed scrutiny to eliminate losses. In cases where the units have incurred continuous losses for over five years, value-added per employee is less than the emoluments drawn and equity capital has been wiped out by mounting deficits, the committee has suggested their closure. A number of measures to improve productivity both in the core and non-core sector enterprises also have been suggested such as, technology upgradation, organisational restructuring into holding companies under the overall control of concerned ministries, larger dependence on borrowing from public (through non-convertible debentures) for raising funds for investment, partial linking of wages with productivity, restructuring of capital in cases of units suffering continuous cash losses and continual monitoring of unit cost and productivity by examining capacity utilisation and raw material costs.

Saving Performance of Public Sector Enterprises 50
N O T E S
1. Employment in public enterprises has been estimated on the basis of industry-wise public sector employment estimates available with the Ministry of Labour and Employment. The share of administrative departments in construction, transport, administrative and other services have been excluded on the basis of their respective share in the public sector net domestic product. The remaining sectors fall entirely in the realm of public enterprises.
2. In such a situation, marginal cost curves show a continuous fall leading to natural monopoly.
3. It must be mentioned here that the growth of public sector in India has been as much due to the default of the private sector as it was necessitated by the need to achieve commanding heights of the economy. The profit motive would not have motivated the private sector to make large investments with long gestation lags required for the core sector. Public sector participation due to the default of the private sector is clearer in the cases where loss-making textile industries and coal mines had to be nationalised in the interest of labour.
4. Core sector is defined by the Sengupta Committee (India, 1986) to consist of coal and lignite, crude oil, petroleum and natural gas, power, primary steel products, primary production of aluminium, copper, zinc and nickel, fertilisers, petrochemical intermediates, agriculture, irrigation and railways.
5. Normative price is the long-run marginal cost under competitive conditions.
6. The broad guidelines on pricing policy were: (i) no priceregulation on products of competitive enterprises or those subject to domestic or international regulation; (ii) in the case of non-competitive industries, prices were to be fixed at the level of duty paid landed cost of the product; (iii) enterprises selling their products (basic and heavy industries) predominantly to Government of India or the State governments, prices are fixed taking into account reasonable return added to the cost per unit at 80 per cent capacity utilisation; (iv) products sold in international trade, the price was determined in the international market; (v) in the case of certain items, social priorities like distributive consideration, containment of inflation and reduction in the cost of production were to be considered in pricing the products. (Dual pricing of certain commodities facing supply shortage, charging lower than the cost in the case of bread, coal and fertilisers are cases in point); (vi) Preferential purchasing of inter-public enterprises' products upto 10 per cent above the market price.
7. H.K Paranjpe (1986) thus contends that an irrational tariff structure has permanently damaged the interests of railway users

as well as of the national economy due to inadequate allowance for depreciation, poor maintenance, larger arrears of replacement and inadequate development. See also, Ahluwalia 1985).
8. Total factor productivity is represented by ~^1^ + 2 where Yis the rate of growth of value-added at constant prices, L is the rate of growth of labour employed and K is the rate of growth of capital stock in constant prices.
9. Essentially, the perpetual inventory method involves the addition of capital formation adjusted for depreciation at base period prices to the bench mark estimate of net capital stock valued at base period prices. Thus can be shown as,
Kt “ Kt-! + NCFt
where k represents the net capital stock and NCF represents netcapital formation. The subscript t and t-1 denote the current yearand a year previous to the current year.
10. Capacity utilisation in number of units does not really give acorrect picture as the sizes of these units vary substantially. However, in the absence of any other indicator, we have taken this figure.
11. It should, however, be noted that a case for increasing investments in activities complementary to the public sector exists even if public sector productivity shows a declining trend in these areas. But, this could indeed create a high-cost non-competitive economy. In the long-run, therefore, gains to the economy can be had only when improvement in productivity is made.
Saving Performance of Public Sector Enterprises 51

TABLE 3.1
S « c t o r - U l g « C o n t r ib u t io n o f P u b l i c E n t » r p r l a « a In Groa» D o w g t t c Product (COP)___________________________ ( P « r c » n t » Q « » )
Sactora 1960-61 1965-66 1970-71 1975-76 1980-81 1981-82 1982-83 1983-84
A g r i c u l t u r e 0.21 ( 4 . 3 0 )
0 . 36( 5 . 7 6 )
0.39( 4 . 6 8 )
0. 43( 3 . 8 0 )
0 . 53( 3 . 9 8 )
0.51( 3 . 4 6 )
0. 53( 3 . 2 9 )
0.48( 3 . 0 4 )
f o r a a t r y and F l aho r l aa 0.34( 6 . 9 6 )
0.35 ( 5 . 60)
0.29( 3 . 4 8 )
0.35 ( 3 . 1 0 )
0 . 37 ( 2 . 78)
0.40( 2 . 7 1 )
0.41( 2 . 5 4 )
0 . 37(2.J34)
Hin lng and Q uar r y i ng 0.12 ( 2 . 4 6 )
0.15( 2 . 4 0 )
0.35( 4 . 2 * )
1. 12( 9 . 9 3 )
1.50( 1 1 . 2 6 )
2.35( 1 5 . 9 3 )
2. 92 ( 1 8 . 1 4 )
2.98( 1 8 . 8 8 )
Sub - To t a l - P r l ao r y Sactor 0. 67 ( 1 3 . 7 3 )
0.8fio
*. • Co ( 12 . 0 2 )
1.90 ( 1 6 . 8 4 )
2.42( 1 8 . 1 7 )
3.26( 2 2 . 1 0 )
3.86( 2 3 . 9 9 )
3.83( 2 4 . 2 7 )
ftanu f a ctux la g 0.58( 1 1 . 8 9 )
1.07( 1 7 . 1 2 )
- 1.79 ( 2 1 . 5 1 )
2.50 ( 22 . 16)
2.85( 2 1 . 4 0 )
2.87( 1 9 . 4 6 )
3.09 ( 1 9 . 20;
3112 ( 1 9 . 7 7 )
Coo a t r v c t l on 0.18 ( 3 . 6 9 )
0. 24( 3 . 8 4 )
0.22( 2 . 6 4 )
0. 30 ( 0 . 66)
0.51( 3 . 8 3 )
0.43( 2 . 9 2 )
0 . 47( 2 . 9 2 )
0.45( 2 . 85 )
E l a c t r l e l t y , gaa and watar aupply
0.32( 6 . 5 6 )
0. 47( 7 . 5 2 )
0. 93 (11 . 18)
1.05( 9 . 3 1 ) / 1- 52x( 1 1 . 4 1 )
1.53(10 . 3 7)
1. 62 ( 1 0 . 0 7 )
1.61 ( 1 0 . 2 0 )
S u b - T o t a l - Secondary Sactor 1.08( 2 . 2 1 )
1. 78 ( 2 8 . 4 8 )
2.94( 3 5 . 3 4 )
3.85 ( 34 . 1 3
4.88( 3 6 . 6 4 )
4. 83( 3 2 . 7 5 )
5. 18 ( 3 2 . 1 9 )
S. 18 ( 3 2 . 8 3 )
T r a n a p o r t , Storaga and C o n u n l c a t l o n
2.64( 5 4 . 1 0 )
2.78 ( 44 . 4 8 )
2.96 (35 . 58)
2.86( 2 5 . 3 5 )
2.77( 2 0 . 4 2 )
2.97 ( 20 . 1 4)
3.30( 2 0 . 5 1 )
3.18 (20. 1» )
T r a d a , Hotal a and ftaatatxranta
0. 04 ( 0 . 1 2 )
0.10 ( 1 . 8 0 )
0. 24( 2 . 88)
0. 64( 5 . 6 7 )
0. 70( 5 . 2 6 )
0.78( 5 . 2 9 )
0.81( 5 . 0 3 )
0. 71 ( 4 . 5 0 )
Banking and Inauranca ; o. *4( 9 . 0 2 )
0. 70 ( 1 1 . 2 0 )
1.17 ( 1 4 . 0 6 )
2. 02 ( 1 7 . 9 1 )
2.55( 1 9 . 1 4 )
2.86( 19 . 3 9 )
2. 88 ( 1 7 . 9 0 )
2.80( 1 7 . 8 4 )
Othar SarvIcaa 0.01( 0 . 2 0 )
0.01( 0 . 1 6 )
0.01( 0 . 1 2 )
0. 02 ( 0 . 1 7 )
0.05( 0 . 3 8 )
0.06( 0 . 4 1 )
0 . 07 ( 0 . 4 3 )
0.08( 0 . 5 1 )
Sub- To t a l - T r a n s po r t , T rada and Othar Sarv lcaa
3. 13( 6 4 . 1 3 )
3.59(5 7 . 44)
4.38( 5 2 . 6 4 )
5 . 54 ( 4 9 . 1 1 )
6.02( 4 5 . 2 0 )
6.67( 45 . 2 2 )
7.06( 4 3 . 8 8 )
77( 4 2 . 9 0 )
TOTAL 4. 68 6.25 8. 32 11.28 13.32 14.75 16.09 15.78(100.00) (100.00) (100.00) (100.00) (100.00) (100.00) (100.00) (100.00)N o t . : r i g u r a * I n 8 r « c k . t . r . p r . a . n t p . r c . n t . ? . . t o r i u c c a i C o . p u t . d r r o . ' o / I i S j U . " 1 '
t o t a l p u b l i c a n t a r p r l a * » ' c o n t r I b u t l o o . Stat i s t i c a l J r g a n l a * t l o ( 30)*. t i t f l r r 9 9 W T M * t *

E r a . . O o m t l c C a p i t a l F o r a a t l o n I n P u b l i c S a c t o r C n t f M r t t f l
_______ _____________________ -liiiirg
TXBLE 3.2
S a c t o r a 1960-61 d n c r I n p u b l i c a n t a r - p r l a a a
Parc a n toft o t a l
1 9 6 5 -6 6 r o c r i np u b l i ca n t a r -p r l a a a
Pa rc a n to ft o t a l
1970-71 UUL'f I n p u b l i c a n t a r - p r l a a a
Parc a n to ft o t a l
1 9 7 5 -7 6 GDCF ' I n p u b l i c a n t a r - p r l a a a
Parc a n to ft o t a l
1980-8 1 G licr I n p u b l i c e n t a r - p r l a a a
Parc a n to ft o t a l
1 9 8 1 -8 2r o r r 1 i np u b l i ca n t a r -p r l a a a
Parc a n to ft o t a l
1 9 8 2 -8 3 QJCf Tn p u b l i c e n t e r - p r l a a a
Parc a n to ft o t a l
1 9 9 ’ - 8 «a r r * T zp u b l i ca n t e r -p r l a a a
3a rcrnnti rt o t « l
A g r l c u l t u r a 126a( 1 5 . 4 4 )
4 . 9 5 2250 ( 1 2 . 76)
5 . 1 2 3290 ( I S . 0 1 )
4 . 5 8 718C( 1 1 . 1 2 )
4 .8 8 1843'J( 1 7 . 0 2 )
S . 9 T 19560( 1 3 . 9 7 )
5 . 3 6 2128 J ( 1 3 . 2 5 )
5 .3 5 22890( 1 3 . 5 2 )
S . 05
f o r e s t r y and r i a h a r l a a
70( 0 . 8 6 )
0 . 2 8 - 140( 0 . 7 9 )
0 . 3 2 190( 0 . 8 7 )
0 . 2 6 278( 0 . 4 2 )
0 . 1 8 920( 0 . 8 5 )
0 . 3 0 990( 0 . 7 1 )
0 . 2 7 0 . 3 0 1420( 0 . 8 4 )
0* 31
f U n l n g and Q u a r r y i n g
310( 3 . 8 0 )
1 .2 2 520( 2 . 9 5 )
1 .1 8 8 4 0( 3 . 8 3 )
1 . 1 7 5 1 9 0( 8 . 0 4 )
3 . S 2 11650( 1 0 . 7 6 )
3 . 7 4 167*.( 1 1 . 9 < ;
4 . 5 9 26850( 1 6 . 7 2 )
6 . 7 4 28130( 1 6 . 6 2 )
$• 70
S u b - T o t a l - P r l a a r y 1640 ( 2 0 . 1 0 )
6 .4 5 29 H ( 16 . S 0 )
6 . 6 3 4320( 1 9 . 7 1 )
6 . 0 2 1264 0 ( 1 9 . 5 8 )
8 . S 8 3100 3 ( 2 8 . 6 3 )
9 . 9 4 3 729'3 ( 2 6 . 6 4 )
1 0 .2 2 49343( 3 0 . 7 3 )
1 2 .3 9 S 24 40( 3 0 . 9 8 )
1 1 .5 6
n a n u f a c t u r l n g 2809( 3 4 . 3 1 )
1 1 .01 5030 ( 2 8 . S1)
1 1 .4 6 43 60( .■ 9 .3 ? ;
S . 07( 2 2 . 4 0 )
4 .8 1 3 1 270( 2 8 . 8 8 )
1 0 .0 3 36033( 2 5 . 7 4 )
9 .8 8 38533( 2 3 . 9 9 )
9 .6 8 40410( 2 3 . 8 9 )
8 . 91
C o n a t r u c t i o n SO( 0 . 6 1 )
0 . 1 9 120( 0 . 6 8 )
0 . 2 7 9 0( 0 . 4 1 )
0 . 1 3 430( 0 . 6 7 )
0 . 2 9 221 3 ( 2 . 0 4 )
0 . 7 1 271 8 ( 1 • 9 4 )
0 . 7 4 1443( 0 . 9 0 )
0 . 3 6 - 74 3 i ( 0 . 4 3 )
-O* 16
C l a c t r l c l t y , gaa 1140 and w a t a r s u p p ly ( 1 3 . 9 7 )
4 . 4 8 3 9 1 0( 2 2 . 1 7 )
8 . 9 0 6 0 1 0( 2 7 . 4 2 )
8 . 3 7 1348 3 ( 2 0 . 8 8 )
9 . 1S 2640 0 ( 2 4 . 3 8 )
8 . 4 6 3397 3 ( 2 4 . 2 7 )
9 .3 1 40S40( 2 S . 2 5 )
1 0 .1 8 42 363( 2 5 . 0 3 )
9 . 3 4
S u b - T i t a U S e c o n d a ry 3 9 9 9( 4 8 . 9 0 )
1 5 .6 8 906 0 ( S 1 . 3 6 )
2 0 .6 3 10463( 4 7 . 7 2 )
1 4 . S 7 28363( 4 3 . 9 3 )
1 9 .2 6 5988 0 ( S S . 3 0 )
1 9 .2 0 7271 3 ( 5 1 . 9 4 )
1 9 .9 3 80510 ( S O . 13)
2 0 . 2 2 82030( 4 8 . 4 7 )
1 8 .0 9
T r a n a p o r t and C o a a u n l c a t l o h
23 10( 2 8 . 3 1 )
9 . 0 7 4ssa( 2 5 . 7 9 )
1 0 . 3 6 498 0 ( 2 2 . 7 2 )
6 . 9 4 1121 3 ( 1 7 . 3 6 )
7 .6 1 19373( 1 7 . 8 9 )
6 .2 1 2 1 9 9 ' ) ( 1 S . 7 1 )
6 . 0 3 2581 0 ( 1 5 . 0 7 )
6 .4 8 26100( 1 5 . 4 2 )
5 . 76
T r a d e , H o t a la « a 0 . 1 6 730 1 .6 6 1990 2 . 7 7 1192 3 8 . 1 0 - 3 3 3 0 - 1 . 0 7 629 0 1 .7 2 2660 C l . 6 6 )
0 . 6 7 643 J ( 3 . 8 0 )
1. *1
and R e j t a u r e n t e ( 0 . 4 9 ) ( 4 . 1 4 ) ( 9 . 0 8 ) ( 1 8 . 4 6 ) ( - ) ( 3 . 0 8 ) ( 4 . 4 9 )0 .4 5
B a n k i n g and l n a u r a n c a
t 3( 0 . 7 3 )
0 . 2 4 7 0 ( 0 . 4 0 )
0 . 1 6 1 70( 0 . 7 8 )
0 . 24 37 3 ( 0 . 5 7 )
0 .2 S 1113( 1 . 0 3 )
0 . 3 6 130 0 ( 0 . 9 3 )
0 . 3 6 1 7 7 3( 1 . 1 0 )
0 . 4 4 (206 0 / I . 22)
O t h a r S a r v l c a a i9 nU . 3 3 )
0 . 7 6 32 0( 1 . 8 1 )
0 . 7 3 - - 6^( 0 . 0 9 )
0 . 0 4 260( 0 . 2 4 )
0 . 0 8< S t t )
0 . 11 49f)( 0 . 3 1 )
0 . »2 190* ( 0 . 11)
0 . 0 4
S u b - T o t a l - T r a n s p o r t , 254 3 9 . 9 7 567 3 12 .91 7140 9 . 9 5 2356 0 1 6 .0 0 1741 3 S . 58 2999 3 8 . 2 2 3 0 730 ( 1 9 , 1 4 )
7. *2 3478 0 ( 2 0 . 5 5 )
7. 67
T r a d i n g and ( 3 1 . 1 3 ) ( 3 2 . 1 « ) ( 3 2 . 5 7 ) ( 3 6 . 4 9 ) ( 1 6 . 0 8 ) (21 . 4 2 )o t h a r S a r v l c a a
3*. 32T o t a l GOCf i n p u b l i c 8150 3 2 . 0 9 17640 40. 17 21923 3 0 .5 4 64S6 3 4 3 . 8 4 1 0 8 2 9 ) 3 4 . 7 J 1 3 9 9 9 J 3 8 . 3 7 16058 0 4 0 .3 3 16975 J ( 1 0 0 . 0 0 )
E n t e r p r i s e s ( 1 0 0 . 0 0 ) ( 1 0 0 . 0 0 ) ( 1 0 0 . 0 0 ) ( 1 0 0 . 0 0 ) ( 1 0 0 . 0 0 ) ( 1 0 0 . 0 0 ) ( l O O . O O )
T o t a l GOCf I n th a 2S440 100.00 43913 1 0 0 .0 0 7177 3 1 0 0 .0 0 14725 3 10 0 .0 0 31185 ) 100. 00 36485 3 1 0 0 .0 0 398 11 (J 1 0 0 .0 0 453480 1 0 0 .0 0
Cconoay
N o t . : f l g u r e e I n o r a c k a t a r e p r e e e n t p e r c e n t a g e to t o t a l GOCf I n t ' u o l i c a n t e r p n eee.

Saving Performance of Public Sector Enterprises 54
TABUS 3.3Gnwth of GOT and GDCF In Public Enterprises
and the Economy (1971-72 to 1983-84)
(Per cent per annum)
Growth of GDP Growth of GDCF
Total Public Total PublicEnter Enterprises prises
I. Primary sector 9.68 24.46 17.30 21.67
1. Agriculture and animalhusbandry 9.04 14.89 15.23 17.08
2. Forestry 11.14} 17.23}3. Fisheries 13.83} 14.83 15.26} 18.634. Mining 22.39 33.04 29.26 30.71
II. Secondary sector
1. Manufacturing 13.77 17.40 14.76 18.342. Construction 12.10 19.79 13.97 -
3. Electricity, gas andwater supply 18.01 19.00 19.19 18.62
III. Tertiary sector
1. Transport andcommunication 14.36 13.31 13.85 13.48
2. Trade and commerce 15.56 22.44 13.32 -
3. Banking and insurance 18.60 20.64 25.35 18.674. Public administration
and defence 13.25 - 15.31 -
5. Total 12.26 18.52 15.44 17.77
Source: Estimated from National AccountsStatistics.

T»8l £ 3. 4
I n c o w a G e n e ra te d b y P u b l i c S e c t o r E n t a r o r l a e a and T h a l r S h are I n _ _ K « t l o n « L - Cconowg
S e c t o r s 1950 - 6 1 1965 - 66 1970 -71Co p r r o » pub 11c e n t e r p r i s e #
B i l l i o n )
Parc e n to rt o t a l
CbP from ; j- H e a . - t e r - p r 1 sas ( tmi 11 ior>
Parc a n tort o t a l
Clip fr ompub 11ca n t a r -p r i s a a(fcw i l l io n ;
Parc a n to ft o t a l
A g r l c u l t u r a 300 0 .4 4 880 0 . 8 2 1420 0 . 8 5
r o r e e t r y and F l s h e r l e e
480 1 8 .60 770 17.11 1070 1 6 . 5 6
f t ln l n g and Q u a r r y i n g
160 11. 11 3300 1 3 .75 1180 3 1 . 2 2
S u b - T o t a l - P r l a a r y 940 1.31 ,9 0 0 1.81 3 6 " I . 06
f t a n u f a c t u r In g 820 4 . 11 2360 7 . 0 7 6580 12. 60
C o n s t r u c t i o n 2S0 3 . 90 540 4 . 8 9 820 4 . 20
E l e c t r i c i t y , gas and u a t a r s u p p ly
450 5 2 . 3 2 104* 5 7 . 4 6 3390 8 0 .9 1
S u b - T o t a l - S e c o n d a ry .1520 5 . 5 9 3940 8 . 5 2 107*» 14. 21
T r a n s p o r t ,• t o r e g e and c o i M u n l c a t l o n
3720 5 4 . 15 6120 5 5 . 0 8 1089D 5 8 . 27
T r a d e , H o t a l a and f t e e t a u re n t a
90 0 . 38 220 0 . 9 6 890 2. 20
S u b - T o t e l - T r a n a p o r t and T r a d a
37T0 1 8 .7 2 634o 1 8 .6 6 11780 1 9 .9 2
B a n k i n g and In s u r a n c e
620 ■ 3 6 . 0 4 1b^> 4 4 .0 3 4290 6 5 .4 0
O t h a r S a r v l c a a 20 0 . 2 3 30 0. 22 20 0 . 12
T o t a l - ' P u b l i c S ec toi E n t e r p r i s e s
6670 4 . 8 8 13760 6. 2S 30550 8 . 3 2
1975 - 7 6 1980.-01 1 9 P 1 -8 2 19 82-8 3 1 9 0 3 -8 4C S P T t o m p u b l i c a n t a r - p r l a a a
m il l i o n *
Parc a n to ft o t a l
GUP f r o . pub 1 l c a n t a r - p r l a a a ( »m i l l i o n )
Parc a n to ft o t a l
u j v f r o . p u b l i c a n t a r - p r l s a a (*•11 l i o n )
Parc a n to ft o t a l
GDP f r o . p u b l i c a n t a r - p r l a a a ( *
m i l l i o n )
Perc a n to ft o t r l
GDP f r o n pub 11 c a n t a r - p r l s a a (%. 1 1 H o n )
r Par c a n t o ft o t a l
2880 1.0 8 6010 1 . 4 6 66 00 1 .4 9 7780 1 .6 7 8360 1 . 4 3
2310 1 9 .1 4 42 3) 2 1 . 6 9 51 90 22 .71 5920 2 2 . 5 3 6320 '2 1 .9 5
7450 B 4 . 2 8 17320 9 3 . 9 8 30690 9 9 . 1 6 42 SO0 9 9 . 5 8 5 1 210 1 0 0 .0 0
12640 4 . 3 8 275 6 0 6 . 1 4 42480 8 .5 3 s * * r a 10 .5 3 6 5 890 9 . 9 2
165 S> 1 6 . 0 2 32420 17. 11 37490 1 7 .3 2 44980 1 8 .5 0 5 3 650 1 9 . 5 9
1970 5 . 9 8 5800 1 0 .2 2 5620 9 . 0 2 .6850 9 . 0 2 7760 9 . 0 6
69tf> 8 3 .3 5 17290 8 7 . 7 7 19960 • 7.20 23 580 8 8 , 3 5 27700 8 7 . 6 0
2SS20 1 7 . 6 2 55 510 2 0 . 8 7 63070 20 .91 75410 21 .81 89 <10 2 2 . 7 8
1900 5 3 . 9 2 30840 49 . 45 3 8 6 % S i . 34 480S0 5 2 . 7 2 5 4 ^ 2 0 5 0 . 9 2
425 4 . 6 4 7950 4 . 6 8 10120 4 .8 S 1176? 5 . 2 3 1228$ 4 . 8 0
2325 1 8 .3 2 38790 1 6 .7 0 48810 1 7 .19 5981 0 1B.9 3 67000 1 8 . 4 4
1343 7 5 . 5 8 28940 8 3 . 5 0 37360 8 3 .4 1 4 1 8 6 0 7 8 .8 3 48 270 7 8 . 6 2
14 D. 46 600 1 .0 6 740 1. 12 9 9 0 1 . 2 6 1400 1.51
7498 1 1 .28 151400 1 3 .3 3 192460 14 .75 2 3 427 0 1 6 . 0 9 27 1670 1 5 .7 8
cnS o u r c e : n a t i o n a l A c c o u n t s S t e t l e t l c s * CSO, G o v e rn m e n t o f I n d i a * f o r d i f f e r e n t y e a r e . ^

Saving Performance of Public Sector Enterprises 56
Public Sector Contribution in Industrial Production in Key Areas
TABLE 3.5
Percentage of public enterprises Item contribution in production
1968-69 1983-84
Fuel
Coal 17.7 97.0Lignite 100.0 100.0Petroleum crude 51.1 100.0
Basic Metal Industries
Steel ingot 57.1 75.1Saleable steel 55.7 74.5
Non-Ferrous Metals
Aluminium _ 27.9Copper - 100.0Lead 100.0 100.0Zinc 80.6 89.3
Fertilisers
Nitrogenous 60.5 47.7Phosphatic N.A. 27.3
Electric Equipment
Telephones N.A. 100.0Teleprinters 100.0 100.0
Source: Public Enterprises Survey1983-84. Government of India, Ministry of Finance, Bureau of Public Enterprises (1985).

P r o p o r t i o n o f Savings and I n v » t ^ a n t to GJP in P r l v i t t and P u b l i c S e c t o r *
TABLE 3.6
Te er
P r i v a t e C o r p o r a t e j j c t o r
K o u s a n o ld s e c t o r P u b l i c S e c t o r P u b l i c C n t a r p r i a sS a c t o r
N e tC a o l t a iI n f l o w
fromA broad
T o t e lGroeeJ o e e e -t l e
Saw in g
T o t a l Grosa
Joaee t i c can 1 t a l f o r v e t i o r
P e r c a n - ta g a o f ■ a v in g a to GJP
P e r c e n t a g e o f i n v a s t - ean t to
GJP
J i f f e r -ance
P e r c a n - ta g a o f eev in g sto GJP
P J r c e n - t a g e o f i n v a i t -
man t toGJP
J i f f s r - eoce
P e r c e n - ta g e o f aav inga to GJP
P e r c e n - t a g e o f I n v e e t - ■ en t to
GJP
J i f f e r -ence
P e r c e n - t a g e o f aav i n g sto GOP
* arc a n - tage o f I n v e s t ment to
GJP
enee
t i i U ) I 3) ( ~... (sy
(t il " 1 1 \ ' ( 8 ) 19) ( 10 i T i T S ( 12) ( 1 3 1 " " 114) ( i S l ( 1 6 )
1970-71 1 .6 2 . 5 - 0 . 9 12. 1 8 . 4 3.7 3. 1 6 .9 - 3 . 8 1 .7 6 . 0 - 4 . 3 1.0 1 6 .8 17.8
1971-72 1 .7 3 . 0 - 1 . 3 1 2 .6 8 . 1 4.5 3.0 7 . 3 - 4 . 3 1 .7 6 .2 - 4 . 5 1.1 1 7 . 3 1 8 . 4
19 72-7 3 1 . 6 2 . 8 - 1 . 2 11 .9 6 . 7 5 .2 2 .8 7 . 5 - 4 . 7 1.7 5 .0 - 4 . 3 0 . 8 1 6 . 3 1 7 .0
19 7 3 -7 * 1 . 9 2 . 8 - 1 . 0 14.5 9 . 0 5 .5 3.1 8 . 7 - 5 . 1 1 . 5 6 . 5 - 5 . 0 0 . 7 1 9 . 1 2 0 .0
197 4 -7 5 2. 1 3 . 9 - 1 . 8 12. 4 7 . 2 S t Z.6 8 . 1 - 4 . 3 1 . 7 7 . 2 - 5 . 5 0 . 9 I B . 3 1 9 . #
19 75-7 6 1 . 4 2 . 9 - 1 . S 14 .2 6 . 7 7 . 5 4 .5 1 0 . 4 - 5 . 9 1 . 7 9 . 7 - « . o - 0 . 1 2 0 . 1 2 0 . 0
1976-77 1 .S 1 .6 - 0 . 1 15 .8 8 . 6 7 . 2 5 . 2 1 0 . 6 - 5 . 4 2 . 6 10 .0 - 7 . 4 - 1 . 7 2 2 . 5 2 0 . 8
1977-78 1 . 5 2 . 6 - 1 . 1 16.1 9 . 7 * . * 4 . 6 8 . 3 - 3 . 7 2 . 3 7 . 7 - 5 . 4 - 1 . 6 2 2 .2 2D. 6
19 78-7 9 1 . 7 2 . 3 - 0 . 6 18.0 1 2 .5 5 . 5 4 .9 9 . a - 5 . 0 2 . 3 9 . 0 - 8 . 7 0 . 1 2 4 . 6 2 4 . 7
1979-80 2 . 2 2 . 8 - 0 . 6 16. 1 9 . 6 fi .5 4 . 6 1 1 .0 - 6 . 4 2 . 2 9 . 8 - 7 . 6 0 . 5 2 2 . 0 2 3 . 41980-81 2 . 2 2 . 7 - 0 . 5 1 7 .2 10 .8 S. 4 3 . 6 1 0 .9 - 7 . 3 1 . 9 9 . 5 - 7 . 6 1 . 6 2 2 . 8 2 4 . 41981-82 1 .9 . 3 . 4 - 1 . 5 1 5 .3 8 . 7 6 . 6 4 .9 1 1 .8 - 6 . 9 2 . 7 10.7 - 8 . 0 1 .8 2 2 . 1 2 3 . 919 6 2 -8 3 1.9 3 . 6 - 1 . 7 1 5 .9 8 . 6 7 . 3 5 .0 1 2 .2 - 7 . 2 3 . 5 11.0 - 7 . 5 '1 .6 2 2 . 8 2 4 . 4198 3 - 8 4 1 . 7 3 . 4 - 1 . 7 1 6 .8 9 . 3 7 . 5 4. 1 1 1 .2 - 7 . 1 3 . 3 9 . 8 - 6 . 5 1 . 3 2 2 . 6 2 3 .9
N o t * : A l l f l ^ i r w a r e i n c u r r a n t p r i c e e S o u r c a : C e n t r a l S t a t l a t i c a l O f f i c e , N a t i o n a l A c c o i m t eS t a t i s t l e a , V a r io u s i s a u e a

TABLE 1.7
S t r u c t u r e o r S a v l n oa o f P u b l i c C n t a r p r l m
Q a p a r t n a n t a l N o n -D a n « X t « a n ta 1 crvts rp r i t»* 9 N o n - 0 e p e r t m e ntal T o t a l S a v i n g * o f,«nn - f ina ne i«*i C n t e r o r l s e s P u b l i c E n t e r o r l f M .
C r o a t N at Groaa Net Grose Nat Gro s s Nat Croaa N a t
1970-7 1 2800( 4 1 . 4 )
1580( 6 9 . 7 )
910( 1 3 . 4 )
840( 3 7 . 0 )
30Sq ( 4 5 . 1)
- 1 4 0( - 6 . 2 )
396o( 5 8 . 6 )
700( 3 0 . 8 )
6760( 100. 0 )
22 70( 100. 0 )
19 71-7 2 33 40 ( 4 4 . 65)
2120( 9 0 . 9 9 )
1020 ( 1 3. 6 *)
940 ( 4 0 . 34)
311o ( 4 1 . 5 8 )
- 7 30 ( - 3 1 . 3 3 )
4140( S S . 3 5 )
210( 9 . 0 1 )
7480( 100 . 0 )
2330( 100 . 0 )
1 9 7 2 - 7 3 3110 ( 3 8 . 07 )
1630( 7 2 . 7 7 )
1550( i a 9 7 )
1450( 6 4 . 7 3 )
3510( 4 2 . 9 6 )
- 8 40 ( - 3 7 . S)
SO 60 ( 6 1 . 9 3 ) .
610( 2 7 . 2 3 )
8170( 100. 0 )
2240( 100 . 0 )
1 9 7 1 - 7 * 1890( 2 1 . 7 3 )
240( 1 6 . 6 7 )
2170( 2 4 . 9 4 )
2040( 1 4 1 . 6 6 )
4640 ( S 3 . 33)
- 8 40 ( - 5 6 . 3 3 )
681 0 ( 7 8 . 2 8 )
1200 (8 3 . 3 3 )
8700( 100 . 0 )
1440( 100 . 0 )
197 4 -7 5 2280( 1 8 . 9 8 )
770( 1 5 . 4 9 )
3510( 2 9 . 2 2 )
3360( 6 7 . 6 1 )
6220 ( S I . 7 9 )
8 40 ( 1 6 . 9 0 )
9730( 8 1 . 0 2 )
42 00 ( 8 4 . 5 1 )
12010( T O O . O )
497o( 100 . 0 )
1 9 7 5 -7 6 3550( 2 8 . 5 )
1770( 4 4 . 4 )
343D( 2 7 . 6 )
3270( 8 2 . 0 )
5 470 ( * 3 . 9 )
- 1040 ( - 2 6 . 1 )
8900( 7 1 . 5 )
2230( 5 5 . 9 }
12450( 100 . 0 )
3990( 100 . 0 )
1 * 7 6 -7 7 6400( 3 1 . 1 4 )
4540( * 1 . 7 3 )
5210 ( 2 5 . 351
5030 ( 46. 2 3 )
8940( 4 3 . 5 0 )
1310 ( 12. 0 *)
141S0( 6 8 . 8 6 )
6340( 5 8 . 2 7 )
20550 ( 100 . 0 )
10880( 100 . 0 )
' 1 9 7 7 -7 8 7620 ( 3 6 . 8 8 )
5720( 6 3 . 6 3 )
5810( 2 8 . 1 2 >
5610( 6 2 . 4 0 )
72 X ( 3 5 . 0 0 )
- 2 3 4 0( - 2 6 . 0 3 )
1 X 4 0 ( 6 3 . 12)
3270( 3 6 . 3 7 )
20 660 ( 100 . 0 )
89901100 .3)
1 9 7 8 -7 9 7280( 3 2 . 2 0 )
5070( 5 3 . 3 7 )
7050( 3 1 . 1 8 )
6820( 7 1 . 7 9 )
8280( 3 6 . 6 2 )
- 2 390 ( - 2 5 . 16)
15440( 6 8 . 2 9 )
44X1( 4 6 . 6 3 )
22610( 100. 0 )
95 00( 1 3 0 . 0 )
1 9 7 9 - » ' - 72 6o ( 30. 49 )
4540( 5 6 . 8 9 )
7350 ( 30. 87 )
7100( 8 8 . 9 7 )
920 0 ( 3 8 . 6 4 )
-3 6 6 0( - 4 5 . 8 6 )
16550 ( 5 9 . 5 1 )
34 40( 4 3 . 11)
238 1 0 ( 100 . 0 )
79 8 0( 100. 0 )
: ***•!-« 1 683(7( 2 7 . 8 )
3180( 7 4 . 6 )
8 9 4 0( 3 6 . 4 )
8320( 1 9 5 . 3 )
8790( 3 5 . 8 )
- 7 2 3 0( 1 6 9 . 7 )
17730( 7 2 . 2 )
1080( 2 5 . 4 )
2 4560 ( 10 0 . 0 )
4 2 6 0( 10 0 . 0 )
19 81-8 2 8 66o ( 2 1 . 9 )
2690( 2 0 . 4 )
12890( 3 2 . 6 )
12300 ( 9 3. 3)
17980( * 5 . 5 )
-1 8 1 0( - 1 3 . 7 )
38870 ( 9 8 . 3)
10500( 7 9 . 6 )
39530( 100 . 0 )
13190( 100 . 0 )
1 9 8 2 -8 3 11460( 20 . 2 )
39 60 ( 1 9 . 7 )
18460 ( 3 2 . S)
144S0( 7 1 . 9 )
268 60 ( 4 7 . 3 )
1680( 8 . 4 )
45320( 7 9 . 8 )
16130 ( 8 0 . 3)
56760 ( 100 . 0 )
20090( 100 . 0 )
1 9 8 3 -6 4 13210( 20 . 6 )
3690( 1 8 . 2 )
2 1 790( 3 4 . 1 )
172 30 ( 8 5 . 2 )
20000( 3 1 . 3 )
- 7 0 0( - 3 . 5 )
50 790( 7 9 . 4 )
16560( 8 1 . 8 )
64000( 100 . 0 )
2 0 2 4 0( 100 . 0 )
No t e : f i q j r s s I n b r a c k e t s n o r e s e n t p e r c e n t a g e s to t o t a l s a v i n g * o f p u b l i c e n t e r p r i s e s *
S o u r c e : Computed f r o ■ ' N a t i o n a l a c c o u n t s S t a t i s t i c s 1 , C e n t r e l S t a t i s t i c a l O r g a n i s a t i o n , Gov er n ma nt o f I n d i a , f o r o l i f w r a n t y e a r s .
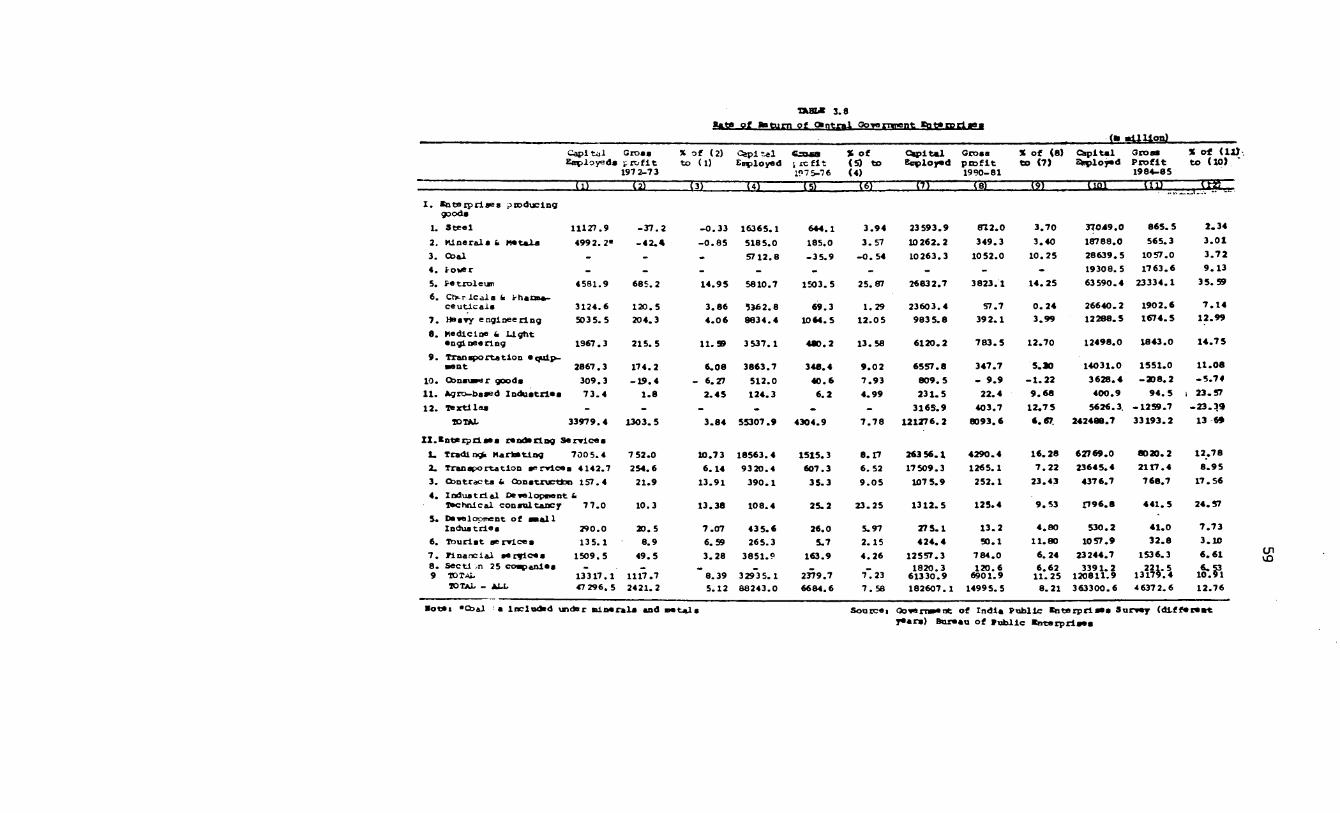
TABLM 3 .8
»+» <3t — turn of O ntral 0o?<» rnnent «at»n>rl»e»________________________ __________________________________________________________ <■ a l l H on )
Capl t a l G r o s s B o p l o y e d s p r o f i t
197 2 -7 3
X o f (2 ) t o (1 )
Ctepl r-al E o p l o y e d
t » a1 £C f i t 197 5-76
X o f ( 5 ) t o ( 4 )
C a p i t a lB s f> lo y «d
Ocoaap r o f i t1 9 9 0 -8 1
X o f ( 8 ) t o ( 7 )
C a p i t a lS ^ p l o j t d
OroaaP r o f i t1 9 8 4 -8 5
X o f ( 1 13 to ( 1 0 ) '
( i ) (25 ' ~l3\ ( 4 ) (5 ) '■(<51-------- m <8] w 1101 n i l
X . * to t © rp r ia e s p r o d u c i n g goods
1
1. 3 t * e l 11 127 .9 - 3 7 . 2 - 0 . 3 3 1 6 365 .1 6 4 4.1 3 . 9 4 23 593 . 9 8 1 2 . 0 3 . 7 0 3 7 0 4 9 .0 8 6 5 . 5 2 . 3 4
2. M i n e r a l s fc M e t a l s 499 2. 2* - 4 2 . 4 - 0 . 8 5 518 5 .0 185.0 3 . 57 10 2 6 2 . 2 3 4 9 . 3 3 .4 0 18 788 .0 5 6 5.3 3 . 0 1
3. C b a l - - . 5 7 1 2 .8 - 3 5.9 - 0 . 54 10 2 6 3 . 3 10 5 2 .0 1 0 . 2 5 2 8 6 3 9 .5 1 0 5 7 .0 3 . 7 2
4 . t o w e r - - - - - - - - - 19 308. 5 1 7 6 3 . 6 9 . 1 3
5. F e t r o l e u n 4 5 8 1 .9 6 8 5 . 2 1 4 .9 5 5810.7 1503 . 5 25. er7 2 6 8 3 2 .7 3 8 2 3 . 1 1 4 . 2 5 6 3 5 9 0 .4 233 3 4 . 1 3 5 . 5 9
6. Cht-r i c a l a b k h a o n * - c e u t l c a i s 3 1 2 4 . 6 120. 5 3 . 8 6 5 3 6 2 .8 6 9 . 3 1. 29 2 3 6 0 3 . 4 57.7 0 . 2 4 2 6 6 4 0 .2 1 9 0 2 .6 7 . 1 4
7 . H eavy e n g i n e e r i n g 50 3 5. 5 2 0 4.3 4 . 0 6 8 8 3 4 . 4 10*4. 5 1 2 . 0 5 983 5 .8 3 9 2 . 1 3 .9 9 1 2 2 8 8 .5 1 6 7 4 .5 1 2 .9 9
8. M e d ic i n e & L i g h t e n g i n e e r i n g 19 67 . 3 215. 5 11. SB 3 5 3 7 . 1 4 8 0 . 2 1 3 .5 8 6 1 2 0 . 2 783 . 5 1 2 .7 0 12 4 9 8 .0 1 8 4 3 .0 1 4 . 7 5
9 . T r a n s p o r t a t i o n e q u i p m ent 2867 . 3 1 7 4 .2 6 . 0 8 3 8 6 3 .7 3 4 8 . 4 9 . 0 2 6 5 5 7 . 8 3 4 7 .7 5 . JO 1 4 031 .0 1 5 5 1 .0 1 1 . 0 8
10* Oonsxaper goods 3 0 9 . 3 - 1 9 . 4 - 6 .2 7 5 1 2 .0 4 0 . 6 7 . 9 3 8 0 9 . 5 - 9 . 9 - 1 . 2 2 3 6 2 8 . 4 - 2 0 8 . 2 - 5 . 7 4
11 . A g r o - b a s e d I n d u s t r i e s 7 3 . 4 1 . 8 2 . 4 5 1 2 4 .3 6 . 2 4 . 99 2 3 1 . 5 2 2 . 4 9 . 6 8 4 0 0 . 9 9 4 . 5 I 2 3 .5 7
12 . T e r t l l e a - - - . - - 3 1 6 S . 9 4 0 3 .7 1 2 .7 5 56 26.3 . - 1 2 5 9 . 7 - 2 3 . 3 9
TOTAL 3 3 9 7 9 . 4 1 3 0 3 .5 3 . 8 4 55 3 0 7 .9 4 3 0 4 .9 7 . 7 8 1 2 1 7 7 6 .2 8 0 9 3 . 6 « . « 7 . 2 4 248 8.7 3 3 1 9 3 . 2 13 6*
I I . E n t e r p r i s e s r e n d e r i n g S e r v i c e s
1. T r a d i r>> M a r k e t i n g 700 5 . 4 7 52 .0 10 .7 3 1 8 5 6 3 .4 15 15.3 8 .1 7 263 5 6 . 1 4 2 9 0 . 4 1 6 .2 8 6 2 7 6 9 .0 8 0 2 0 . 2 1 2 . 7 8
2. T r a n s p o r t a t i o n s e r v i c e s 4 1 4 2 .7 2 5 4 .6 6 . 14 9 3 20 . 4 6 0 7 .3 6 . 52 1 7 5 0 9 .3 126 S. 1 7 . 2 2 2364 5 . 4 2 1 1 7 . 4 8 . 9 5
3 . C o n t r a c t s fc COnstru?t± 3n 1 5 7 .4 2 1 .9 1 3 .9 1 3 9 0 . 1 3 5 . 3 9 . 0 5 107 5 . 9 2 5 2 . 1 2 3 .4 3 4 3 7 6 .7 7 6 8 . 7 1 7 . 5 6
4 . I n d u s t r i a l D e ^ l o p s i e n t fcT e c h n i c a l c o n s u l t a n c y 7 7 . 0 10.3 1 3 .3 8 1 0 8 .4 2 5 . 2 2 3 . 25 1 3 1 2 . 5 1 2 S .4 9 . 5 3 C T 9 6 . 8 4 4 1 . 5 2 4 .5 7
5* D evelo pm en t o f s n a i l I n d u s t r i e * 2 9 0 .0 2 0 . 5 7 . 0 7 43 5 . 6 26 .0 5.9 7 27 5 . 1 1 3 . 2 4 . 8 0 5 3 0 . 2 4 1 .0 7 . 7 3
6. T o u r i s t 9 » n r l c e s 13 5. 1 8 . 9 6 .5 9 2 6 5 .3 5.7 2. 15 4 2 4 . 4 5 0 .1 1 1 .8 0 1 0 5 7 .9 3 2 . 8 3 . 1 0
7 . f i n a n c i a l s e r v i c e s 1509 . 5 4 9 . 5 3 . 2 8 3 8 5 1 .0 1 6 3.9 4 . 2 6 1 2 5 5 7 .3 7 8 4 . 0 6 . 2 4 23 244 .7 1536.3 6 . 618 . S e c t ! >n 25 c om pan ies9 TOTAL 1 3 3 1 7 .1 1117.7 * 8 . 3 9 329*3 5. 1 2379.7 7_. 23
1 8 2 0 .36 1 3 3 0 .9
1 2 0 . 66 9 0 1 .9
6 . 6 21 1 . 2 5
3 3 9 1 . 212 081 1.9 132l H - . 54 ifr.S3!
TOTAL - A LL 47 296 .5 2421. 2 5.12 8 8 2 4 3 .0 6684.6 7 .58 182607. 1 14995.5 8.21 3633 00 .6 4637 2.6 12.76
* « * * • #Q>»i » ln c lo d td undsr a l M n l i and rn ta la S on ice i 03W n » «n t o f In d ia P u b lic Bntarpriaaa S a r n y (d l f f a r a a *j « a r » ) Boraan o f lu b l i c Kntarprlaaa

Saving Performance of Public Sector Enterprises 60
TABLE 3.9
Rate of Return of State Electricity Boards (1985-86)
(Rs Millions)
SI. Board Capital Surplus Surplus Rate of Rate ofbase at (+)/defi (+)/defi return return
the begi cit (-) cit (-) before afternning before after interest interest
interest interest payment paymentpayment payment (%) (%)
(1) (2) (3) (4) (5)
1. Andhra Pradesh2. Assam3. Bihar4. Gujarat5. Haryana6. Himachal Pradesh7. Jammu and Kashmir8. Karnataka Board
11110206085708500604076019604020
9. Kerala 10. Madhya Pradesh
331015090
11. Maharashtra 18330
12. Meghalaya13. Orissa14. Punjab
500435013300
15. Rajasthan 11510
16. Tamil Nadu 13850
17. Uttar Pradesh18. West Bengal
265404190
19. Total (All Boards) 153990
1540 690 13.9 6.2(-) 320 (-)1030 (->15.5 (-)50.0(-) 260 (-)1320 (-) 3.0 (-)15.4
230 (-) 630 2.7 (-) 7.430 (-) 700 0.5 (-H1.730 (-) 230 3.9 (-)29.8
(-) 170 (-) 390 (-) 8.7 (-)19.9(-) 90 (-) 400 (-) 2.2 (-)IO.O
(-)10.3*570 110 17.2 3.32090 310 13.9 2.1
(-) 2.1*(-) 140 (-)1680# (-) 0.8 (-) 9.2
(-)11.6*50 (-) 40 10.0 (-) 7.7440 50 10.1 1.2
(-) 120 (-)1560 (-) 0.9 (->11.7 (-)12.8*
90 (-) 780 0.8 (-) 6.8 (-) 8.1*
1610 340 11.6 2.5(-)11.8*
50 (-)3110 0.2 11.7450 (-) 610 10.7 (-)14.6
(-)17.9*6080 (-)10980 3.9 (-) 7.1
(-) 9.4*
Note: * Without taking the subsidy into account
// on the basis of accrued interest to State government of Maharashtra of Rs 146.65 crore in 1985- 86.
Source: Annual Report on theWorking of State Electricity Board and Electricity Department (Power and Energy Division), Planning Commission, Government of India.

Commercial Profits ( + )/Losses C-) of State Electricity Boards (1980-81 to (1985-66)
____________________ ____________________________________(Rs. Million:*)
TABLE 3. 10
s iI\g>
•Board
1980-81 1 9 8 1 - 8 2 1 982-83 1 9 8 3 - 8^ 1 98I4—85 1 985-86 (BEL).
(1 ) (2 ) n ) (i+) («?) _ (6 ) _ (7.1 .1 . Andhra Pradesh 08 .2 78 . 1 67.2 ( - ) ^7.3 ^ 61.6 690.72. Assam ( - ) 266.7 ( - ) 2 3 7 . 6 ( - ) Mif.2 ( - ) 597.0 ( - ) 76^ 01 ( - )1029.93. Bihar ( - ) 755.3 ( - ) 809.3 ( - ) 918.^ (-01 071 «2 ( - ) 1 2 3 ^ . 2 ( - ) 1 320.8
Gujarat ( - ) 36j> .7 1 0 . 9 ( - ; 63.1 1 28.6 ( - ) 2 0 7 .7 ( - ) 633.2
5. ha ry.-j.na ( - ) 3o7.5 ( - ; *+85.7 ( - ; 539.6 ( - ) ^07 .0 ( - ) 762.3 ( - ; 70if.i6. himachal Pradesh ( - ) 1 1 8 . 9 ( - ) 1 02.8 ( - ) 96.9 ( - ; 1 1 2 . 0 ( - ) 2 2 5 . 1 ( - ) 226.17. Jaawiu & ifesinnir ( - ; 151.5 • ( - ) 190.9 ( - ; 2 U-5.8 ( - ) 311 .9 ( - ) 338.7 ( - ) 395.5a. - /k rn td kji Bp r-a 15o .5 170.1 -39.3 ( - ) 68.8 ( - ) 176.^ ( - ) i f l i f .8
9- A* 1 • C . ( - ) 1^6.7 ( - ) 52.0 ( - ; 1 3 1 . 5 ( - ) 112.if ( - ) 13 if.3 ( - ) 512.if10. ..era la r. /■.-«* C.J .0 186.7 39.5 ( - ) ^5.9 ( - ) 03.3 109.311. t-ic.dh„.a. Pr:jdesh ( - ; 5‘01 .9 ( - ) 516.9 ( - ) 398.3 ( - ) 57^.7 ( - ) 677.3 ( - ) 326.812. Maharashtra ( - ) 177.8 200.0 99.3 ( - ) 810.6 ( - A if23 .513. >ie;: hal&ya ( - ) 33.1 ( - ) 2 3 . 7 1 2.2 0 1 . 5 ( - ) 13.8 ( - ) 38.61 Orissa ( - / 57 • 0 ( - ) 112.5 ( - ) 103.3 ( - } C-7.1 ( - ) 123.9 50.0r j . Punjab ( - ) 7 8 5 . 6 ( - ) 599.3 ( - } 7 8 7 . 1 ( - ) 975.2 (- )i-305-5 (- )1 699.01 6. iia j .stlian ( - ) ^32.3 ( - ) 566.9 ( - ; i+51+.8 ( - ) 609A ( - ) 797.9 ( - ) 928.917. 'x&oiil ftadu (- ) 1 1 3 ^ . 0 ( - )1 76b.7 ( - )21 09.5 ( - )22 52 .2. ( - ; 1 if37.if ( - ) 1 717 .81 8 . uttur rr^desh ( - A 939.7 (- ) 2 000.3 ( - a '-239.3 (-;?3-63.5 ( - )2827 . 1 ( - )311 if .C19. Uest ^e^nal ( - ; 3 9 0 . 1 ( - ; 631 . 1 ( - ) 7 1 9 . 7 ( - ) 1 1 2 7 . 9 ( - ) 895.2 (-> 750o6
(- )7528.3 (-07757.7 ( - , 0663 .3 ( - » 5 I^'i (->123 53.2 ( - ^ 3 8 6 .2

t a b l e 3 . 1 16 2
Capital productivity,- rate of return, on B\o c k Canital (1980-81 and 1985-06)
(Percentage)N^jje of the State oad Transport Corpn./
: Net Profit to Profit before Block Capital interest to
Block Capitali Profit before
taxes to block capital
Profit before interest -ind taxes to block capi talUnder-taking
1980-1981Actuals
1985- 1980- 1985- 1986 1981 1986 Re- Act- Revised uals vised Est. Est.
1980-1981Actuals
1965-1985RevisedEst.
1980-1981Actuals.
1985- 1986 Re- vi sed Est.
1 2 3 4 5 6 7 8 9
TAndhra Pradesh -18.87 - 0.59 -14.28 + 3.40 -1.47 +12.49 + 3.12 +16.59\ 3 sain. -11.59 -21.40 - 0.30 - 9.02 - 9.37 -20.11 - 6.58 - 7.73Bihar -29.47 —41*77 -19.43 -27.59 -15.58 -35.43 - 5.54 -21.39Gujarat -22.56 -22.32 -17.34 -16.48 + 4.51 + 3.30 + 9.33 + 9 .65Haryana - 1 . 3 9 +13.35 + 4.25 -19.95 +60.43 +67.26 +65.07 +7 3. 36Himachal Pra -18.08 -24.99 -15.18 -15.13 +12. 39 +10.34 +15.2S +20.19deshJaxmu &Kashmir - 9.42 -14.58 - 3.00 - 3.18 - 0.32 -11.11 + 6.10 + 0.23Karnataka -12.30 - 9.40 - 8.71 - 2.91 + 6.48 + 5.53 +10.57 + 12.02Kerala -14.52 -29.73 -10.42 -22.73 -13.19 -15.56 - 9.10 - 8.5 2**5$dhya Pradash -25.14 - 5.15 -15.30 + 4.26 +11.92 + 6.74 + 21.76 +11.74Haharashtra -20.15 - 5.04 -16.36 + 1.12 + 2.29 +31.53 + 5.58 + 37 .78’■fcenipur -55.62 -26.75 -51.12 -22.39 -55.06 -26.50 -50.56 -22.65Meghalaya -25.22 - 5.20 -20.43 - 0.22 -23.04 - 4.54 -18.26 + 0.15Nagaland -20.99 -25.50 -20.99 -25.50 -17.94 -24.92 -17.94 -24.92Ori ssa -20.97 -13.50 -14.38 - 7.24 -10.04 - 7.58 - 3.45 - 1.31Punjab Road -41.39 -47.95 -33.82 -40.73 + 7.96 +21.24 +16.03 +28.47waysPEPSU r TC -29.31 -27.25 -21.79 -19.96 + 6.23 - 7.50 +14.31 + 0.59Rajasthan -21.07 +14.93 -13.03 +23.29 +10.70 +70.75 +18.75 (-79.11^Sikkim + 6.52 - 6.50 + 6.52 - 6.50 + 6.52 - 6.50 + 6.52 - 6.50Tamil Nadu -19 .35 + 0.99 - 9.52 +15.35 +15.29 +45,71 +25.12 +60 • 0 ''jT n p u ra -17.52 -13.31 -12.01 -12.05 -17 13 -13.37 -11.61 - ] 1 .57J-.tar Fradesh -11.24 - 9.01 - 4.75 + 1.00 +12.91 + 9.95 +19.39 + 19.85Calcutta 5TC -48.58 -32.35 -40.69 -25.31 -47.67 -31.96 -39.58 -24.91I^ort h Bengal STC-4.25.48-235.50 -88.06-172.97 -125.16 -•233.08 -87.74 -170.75Durgapuc STC -30.71 -68.03 -62.94 -49.46 -79.19 -66.52 -61.42 -47.94
All India -20.02 -10.77 -14.35 - 3.74 + 3.74 +11.01 + 9.42 +18.04

Saving Performance of Public Sector Enterprises 63
TABLE 3.12Average Annual Bates of Growth of Administered
and Noo-Admlnistered Prices Between 1970-71 and 1985-86
Category WPI Weight % Increase
Overall inflation 100.000 9.12
1. Non-administered prices 69.149 8.49
2. Administered prices 25.337 9.07
-A1 : Core items 8.272 11.50-A2 : Other fully administered 3.229 8.57-A3 : Partially administered 13.836 7.36
3. Petroleum and petroleum products 5.514 15.91
Note: Based on figures available Source: Administered Price Policyupto 31st March, 1986. _ A Discussion Paper,
Ministry of Finance, Government of India, p.ll.

J70-71>75-761 8 1 -8 2
>82-83'83-84
Output per rupee of Capital Stock in
ManufacturingPublicSector
PrivateSector
Output per rupee of Capital stock in the Economy 3
Public Private Total Sector Sector
0.1176 0.3115 ' 0.2579 0.1752 0.4804 0.14930.0935 0.2621 0.2102 0.1712 0.4492 0.31980.0674 0.2598 0.1912 0.1013 0.4087 0.29300.0698 0.2635 0.1933 0.1886 0.3957 0.28750.0715 0.2616 0.1920 0.1962 0.4054 0.2951
Output par worker in organised manufao-
(Rs)
60406547752782628743
f.ur in aPub lie P rivatesector Sector
6301 59876420 65805342 827157 66 91435882 98 37
Output per uorker in organised sector offcha economy (ite)_______
Public Private Total Sector Sector
6600 7262 9036 9731 10 378
6639 6991 7 370 7913 7789
te:<2£xcludes public administration1. Capital stock figures have been computed taking
Luna Datta toy Choudhury (1977) base year figures by using perpetual inventory method Manufacturing sectors figures uere worked out on the basis of tha (information contained in the study by Kapoor and Khusa (1977)
Sourc9s :1. Central Statistical Organisation -=H»ttonaAccounts Statistics, Ministry of Planning, various issues - for data on valua added (total public and private organised sectors)
2.Ministry of Labour and employment, Government of India - for data in number of workers
<n■p-

Saving Performance of Public Sector Enterprises 65
TABLE 3.14Time and Cost Over-runs of Hydel Projects
(From Date of Project Sanction)
Project Original Actual cost or
estimated expected (Rs. cost
million) (Rs.million)
Percen- Original tage time cost (months)
overrun (%)
Actualor
revised (months)
Timeover-runmonths
1. Beas Sutlej Link
(1) Dehar (4x165 MW) 967.7 3825.7 291.7 120/144 192 72/48(11) Pong (4x60 MW) 753.4 2598.0 244.8 120 192 72
2. Kalindhi State I(6x135 MW) 1256.6 2282.3 81.6 72 102 30
3. Idukki (3x130 MW) 682.0 1150.0 68.6 60 108 484. Liktak (3x35 MW) 101.0 806.2 698.2 72 144 725. Baira Suil (3x60 MW) 204.9 922.0 350.0 60 120 606. Kyredumkulai (2x30 MW) 92.4 232.8 150.0 48 96 487. Lower Jhelum (3x35 MW) 179.88. Subemrekha P.H.I.
725.3 303.4 84 108 24
(1x65 MW) 152.6 318.0 108.4 60/72 84 24/129. Giri (2x30 MW) 87.1 267.6 207.2 60 132 7210. Gumti (2x5 MW) 551.5 2221.5 302.8 96 192 9612. Srisailam 457.5 2372.5 418.6 84 182 10813. Balimala 458.2 899.4 96.3 72 96 24
Source: Report of the Committee on Power Government of India.
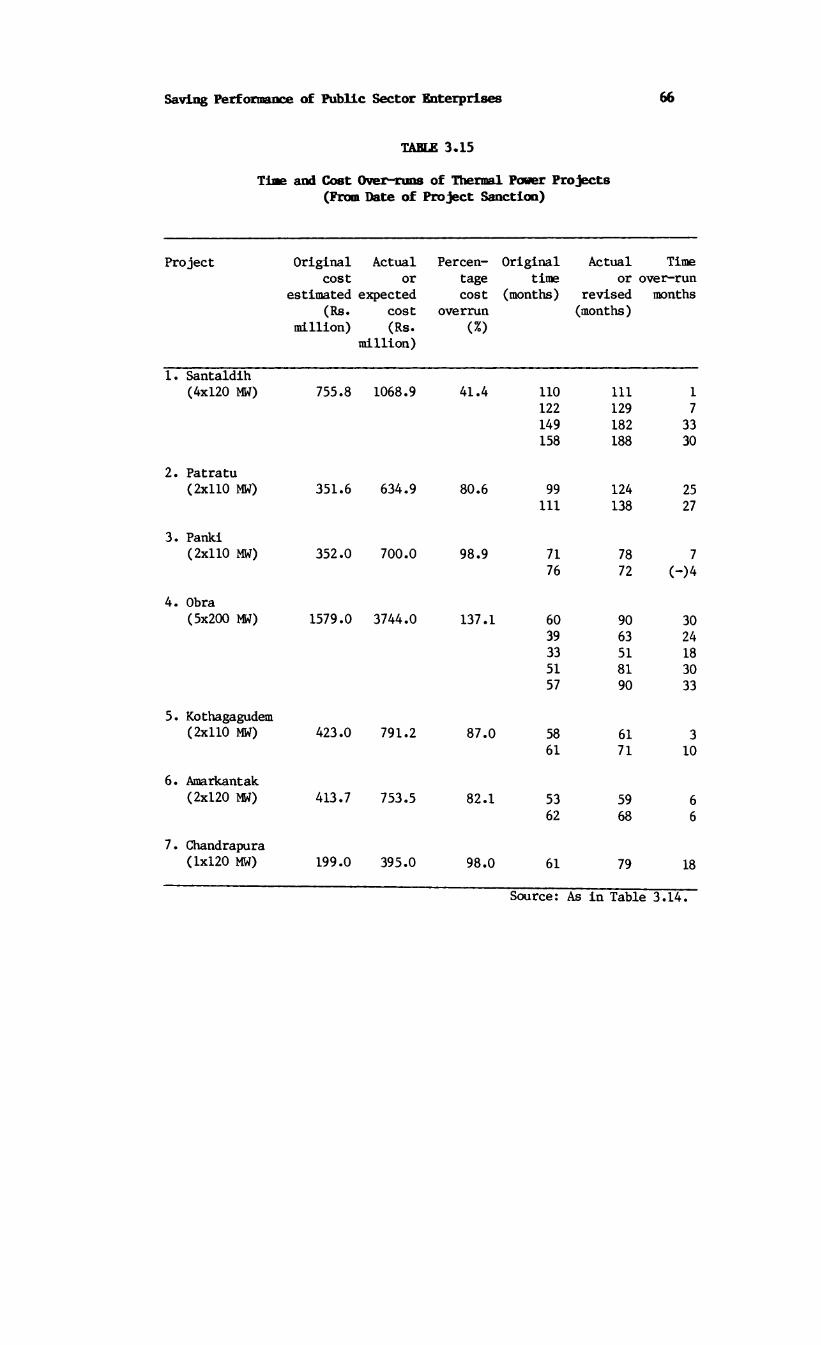
Saving Performance of Public Sector Enterprises 66
TABLE 3.15Tine and Cost Overbrims of Thermal Power Projects
(From Date of Project Sanction)
Project Original Actual Percen- Original Actual Timecost or tage time or over-run
estimated expected cost (months) revised months(Rs. cost overrun (months)
million) (Rs. (%)million)
1. Santaldih(4x120 MW) 755.8 1068.9 41.4 110 111 1
122 129 7149 182 33158 188 30
2. Patratu(2x110 MW) 351.6 634.9 80.6 99 124 25
111 138 27
3. Panki(2x110 MW) 352.0 700.0 98.9 71 78 7
76 72 (~)4
4. Obra(5x200 MW) 1579.0 3744.0 137.1 60 90 30
39 63 2433 51 1851 81 3057 90 33
5. Kothagagudem(2x110 MW) 423.0 791.2 87.0 58 61 3
61 71 10
6. Amarkantak(2x120 MW) 413.7 753.5 82.1 53 59 6
62 68 67. Chandrapura
(1x120 MW) 199.0 395.0 98.0 61 79 18
Source: As in Table 3.14.

Saving Performance of Public Sector Enterprises 67
TABLE 3.16Pattern of Capacity Utilisation in Central Public Sector Enterprises
(Percentages)
Percentage of Units with capacity utilisation of
less than 50 per More than50 per cent to 75 percent 75 per cent
cent
1975-76 13.4 25.0 61.61976-77 14.5 20.5 65.01977-78 20.9 24.0 55.11978-79 20.6 32.1 47.31979-80 21.1 32.3 46.61980-81 28.0 26.0 46.01981-82 16.9 29.1 54.11982-83 18.9 26.2 54.91983-84 20.3 28.5 51.2
Source: Public Enterprises Survey,1983-84, Vol. 1, Government of India.

Factor Inr-me Shares In Public Enterprises and Private Organised Sectors
table 3^ 1 7
(percentage)Public Sector Enterorises Private Organised Sectors
Uagas Interest Rent Profits Total Per Wages Interest Rant Profits Total Per Jorkeiand sa and worker and and wages andlaries dividend wages 4 salaries dividand salaries
salaries(fe) (fc)
1963-61 63.03 17.47 0.58 18.92 100.00 1415.03 55.61 3.88 2.11 38.40 100.00 2192.461965-66 60.54 21.73 1.31 16.42 100.00 2035.18 55.69 5.83 1.83 35.65 100.00 2768.241970-71 63.16 22.64 1.77 12.43 100.00 3480.65 62.40 9.34 2.12 26.14 130.00 4142.6919 75-76 65.22 17.03 1.56 16.19 100.00 6898.74 61.23 13.64 2.04 23.09 100.00 6898.011980-81 62.27 22.70 2.03 13.00 100.00 10697/28 60.68 13.75 2.43 23.14 100.00 11062.881981-82 57.51 22.06 2.15 18.28 100.00 12148.94 57.10 14.63 2.09 26.18 100.00 11953.091982-83 54.34 21.66 2.60 21.40 100.00 13474.45 59.60 IS.28 1.97 23.15 130.03 14653.021983784 55.32 20.39 2.81 21.48 100.00 15392.84 59.95 16.32 1.83 21.90 103.00 16748.81
Sourca: 1. Central statistical Organisation, National Accounts Statistics, Various Issues.
2. Government of India, Ministry of Labour and Caployssnt. CT*CD

Saving Performance of Public Sector Enterprises 69
TABLE 3.18
Tenure of Chief Executives In State Level Enterprises —Andhra Pradesh
ChiefExecutives tenure range (months)
Samplebase
Percentagedistribu
tion
Cumulativepercentage
1 17 12.14 12.141-3 21 15.00 27.143-6 21 15.00 42.146-9 9 6.42 48.569-12 10 7.14 55.7012-18 23 16.43 72.6318-24 15 10.71 82.8424-30 4 2.86 85.7030-36 4 3.86 88.5036-60 10 7.14 95.70
Five years 6 4.30 100.00
Total 140 100 100
Source: Shankar and Sarma (1986).

P a r c a n t a o a o f C a p i t a l Employed to T o t a l C a n l t a l Employad f o r £ach Year
t able: 3 .1 9
( P e r c e n t a g e ^
72/73 75/76 79/80 80/81 81/82 82/83 8 3/8 4 84/85
I . E n t e r p r i s e s p r o d u c i n g goods
( a ) Cora S e c t o r I n d u s t r i e s
1. S t e a l 2 3 . 5 3 1 8. 54 12.92 12.92 13.28 12.28 1 0 . 0 4 10. 182. H i n a r a l s , . l a t a l s & Coal 1 0. 56 12.35 1 1.92 11.25 14. 57 1 3.99 1 3 . 9 5 1 3 .0 33. Po ue r - - - - - 1.62 3 . 9 9 5. 314. P a t r o l sum 9 . 6 9 6.58 10.22 14.59 1 4 . 5 0 14.95 1 6.91 17. 475. Heavy E n g i n e e r i n g 10.65 10.01 5 . 9 7 5. 38 4 . 9 2 4 . 7 3 4. 16 3 . 5 46. T r a n s p o r t a t i o n E q u i p n a n t 6 . 0 6 4. 38 3. 46 3.59 3 . 6 7 3 .56 4 . 0 3 3 .8 6
Sub t o t a l ( a ) - C o r a s e c t o r 6 0. 49 51.86 44. 49 4 7 . 8 3 5 0 . 9 4* 5 1 . 1 3 5 3 . 0 8 53. 39
( b )
1.
N o n - c o r e s e c t o r
Q i a m i c a l s & P h a r m a c a u t i c a l s 6 . 6 1 6 . 0 9 1 1.79 12.92 1 0. 82 9 . 6 3 7 . 6 0 7 . 322 . Hedium & L i g h t E n g i n e e r i n g 3 .9 5 4.01 3. 40 3. 38 3. 33 3.38 3 . 5 2 3 . 4 3a. Consumer Goods 0 . 65 0 . 5 8 0 . 47 0 . 44 0 . 7 3 1 . 5 4 0 . 7 3 1.004. Agro based 0 . 16 0 . 14 0 . 12 0 . 13 0 . 13 0 . 11 0 . 12 0 . 115. T a x t i 1 es - - 2 . 0 9 1 . 7 3 1. 38 1 . 8 4 1 . 6 5 1.55
Sub t o t a l - non c o r e s e c t o r 1 1. 37 10.82 1 7. 87 18.60 16. 39 1 6.48 13. 62 13. 42
Subgood
t o t a l - E n t e r p r i s e s p r o d u c i n g1
I7 1 . 8 6 62.68 62. 36 6 6 . 4 3 6 7 . 3 3 6 7 . 6 3 6 6 . 7 0 66.81
I I . E n t e r p r i s e s p r o d u c i n g S e r v i c e s
1. T r a d i n g & M a r k e t i n g 14.81 2 1 . 0 4 1 9.77 1 4 .4 3 1 4. 7 2 1 4 .6 3 16. 13 1 7. 252 . T r a n s p o r t a t i o n s e r v i c e s 8 . 7 6 10.56 8 . 9 5 9 . 5 8 7 . 9 1 7 . 6 7 6 . 6 8 6 . 5 03. C o n t r a c t s A c o n s t r u c t i o n 0 . 3 3 0 . 4 4 0 . 8 0 0 . 5 9 0 . 9 5 1 .0S 1 . 2 3 1 .2 04. I n d . Oav. o f T e c h . C o n s u l
t a n c y 0 . 16 0 . 1 2 ' 0 . 6 4 0 . 7 2 0 . 6 9 0 . 5 5 0 . 5 2 0 . 4 9' S . Oav. o f s m a l l i n d u s t r i e s 0 . 6 1 0 . 49 0 . 16 0 . 15 0 . 15 0 . 1 3 0 . 15 0 . 14
6 . T o u r i s t s e r v i c e s 0 . 2 8 0 . 3 0 0 . 2 2 0 . 2 3 0 . 19 0 . 3 6 0 . 3 3 0 . 2 97 . f i n a n c i a l s e r v i c e s 3. 19 4.37 6 . 3 0 6 . 8 7 6 . 8 8 6 . 5 4 6 . 9 5 6. 398. S e c t i o n 25 Cos. - - 0 . 8 0 1.00 1 . 19 1 . 4 4 1. 32 0 . 9 3
Sub t o t a l E n t e r p r i s e s p r o d u c i n g S e r v i c e s 2 8 . 14 ' 37.32 3 7 . 6 4 3 3 . 5 7 3 2 . 6 8 3 2. 37 33. 31 33. 19
T o t a l 1 00.00 100.00 1 00 .0 0 1 00 .0 0 1 0 0 . 0 0 1 00.00 1 0 0 . 0 0 100.00

CHAPTER 4
TRENDS IN CURRENT EXPENDITURE
4.1 Introduction
4.1.1 The poor generation of savings in the public sector has beenas much due to a faster rise in the current expenditure as due to an inadequate growth in tax revenue. In this context, mention may be made of Please's hypothesis and its relevance to developing countries. Stanley Please (1967) hypothesised that normally when governments raise more revenue they tend to increase their expenditure on defence and consumption. While the logical deduction from Please's statement that increased taxation will only result in faster increase in government consumption is somewhat pessimistic, nevertheless, it is important to examine the growth of consumption expenditure in India in the light of Please's hypothesis. In this chapter, an attempt is made to analyse the trends in the expenditure side, and to identify items which are mainly responsible for the rise in the current expenditures.
4.2 Growth In Public Expenditure
4.2.1 The definition of public expenditure used here is the same asthat used in the economic classification, as given in the National Accounts Statistics (NAS) published by the Central Statistical Organisation, Government of India. Accordingly, the current expenditures under economic classification comprise of expenditures incurred by Central, State as well as Local levels of government. However, the expenditures under functional heads include only those of Central and State governments. Expenditures incurred by Localgovernments are not included as information on these are not available.
4.2.2 Total public expenditures in India have grown nearlyseven-fold during the last one-and-a-half decades (Table 4.1). The annual confound growth rate averaged 2.1 per cent per annum. But, the growth is hardly uniform. There was a distinct change in the rate of growth in the ratio between two sub-periods: Between 1970-71 and1975-76, the rate of growth averaged 4.1, while during the laterperiod, that is, between 1976-77 and 1980-81, the growth rate averaged

Trends in Current Expenditure 72
only 0.2 per cent and during the last three years, from 1981-82 to 1983-84, it was negative and averaged to -0.1 per cent. Thus, there was a marked decline after 1975-76 in the ratio of public expenditure to GDP. In fact, during the entire 13-year period, much of the growth at the average of 2.5 per cent can be attributed to two years: 1971-72and 1975-76 when the growth rate averaged 13.3 per cent. If the growthduring these two years is excluded, the average drops to Just 0.5 per cent per annum. Thus, during the last one-and-a-half decades, though in absolute terms public expenditure has grown seven-fold, it has been more or less constant in terms of its proportion to GDP.
4.2.3 Generally, a distinction is made between the finalexpenditure component and transfer payments, depending upon whether the economic impact is direct or indirect. The first component isconsidered as the expenditure by government itself which absorbs available resources, while the second merely represents transfer ofpurchasing power from the government sector. Since such transfers are excluded from the measurement of GDP, it is only appropriate toconsider the 'final' or 'exhaustive' type of expenditure, whilemeasuring the share of government in the economy. The transfer payments, current as well as capital,constituted about one-third of the total expenditure in 1970-71. But the share has gone up steadily upto 1977-78 and 1978-79 when transfer payments formed about 48 per cent. In the later years, the share averaged 44 per cent. As a result,the ratio of public expenditure net of transfer payments to GDP hasregistered a lower growth than that of the total expenditure. The average growth rate at 1.7 per cent, nevertheless, maintained the same growth trends.
a. Current and capital components.
4.2.4 A salient feature discernible from the trend in government expenditure in India is that increases in current expenditures rather than expenditures on capital formation have contributed to a larger proportion of increases in total expenditures. This is clearly seen by the fact that while current expenditures registered a trend rate of growth of 2.8 per cent per annum, growth of total expenditures was lower, al belt marginally, at 2.1 per cent. The increasing share of current expenditures can be particularly seen from 1975-76. The ratio of current expenditures to total expenditures has continuously increased from 69.7 per cent in 1975-76 to 76.4 per cent in 1983-84

Trends in Current Expenditure 73
(Table 4.2). The rising share of current expenditures, which constitute more than 75 per cent of total expenditures needs to be analysed in greater detail.
4.3. Economic Classification of Current Expenditure
4.3.1 The disaggregation of current expenditure by its economic components shows that much of the growth has been due to the two components, namely, interest on public debt and subsidies (Table 4.3). The average growth rates of these components are 11 and 10 per cent respectively, while those of wages and salaries and goods and services are only about 1 per cent.
4.3.2 There has been a significant structural change in the five broad economic components of current expenditure. The share of consumption expenditure has come down from 77 per cent to 61 per cent, that is by 16 percentage points (Table 4.4), of which wages and salaries account for the decline by 9.7 per cent, the remaining 6.3 per cent being due to decline in goods and services.
4.3.3 The decline in consumption expenditure is compensated mostlyby the other two components, interest on public debt and subsidies and current transfers. The share of interest has been consistently going up. From 4.4 per cent in 1970-71, it has gone up to 10.7 per cent in 1983-84, that is by 6.3 per cent points. In contrast, most of the increase in subsidies occurred in 1974-75 (3.5 per cent points) against the overall growth at 8 per cent points.
4.3.4 Thus, while the growth of expenditure due to wages and salaries as well as goods and services has been reasonably low, the rapid increase in interest payments and subsidies requires some explanation.
a. Interest payments.
4.3.5 Interest on public debt has been a fast growing component ofthe current expenditure. Over the 13 years, from 1970-71 to 1983-84, this expenditure has gone up by 17 times from Rs 2.2 billion to Rs 36.8 billion or at an average growth rate of about 24 per cent per year. The rise has been particularly sharp from 1979-80. While during theseventies the rise in the interest payments averaged 18.7 per cent per

Trends in Current Expenditure 74
annum, that from 1979-80 to 1983-84 averaged a phenomenal 38 per cent per annum. As a result, its share in total expenditure, which fluctuated from 4 to 6 per cent, had jumped to 11 per cent by 1983-84.
b. Interest on external debt.
4.3.6 One striking feature has been the falling share of external debt in the total over the reference period and the consequent decline in its share in the total interest liabilities: from about 14 per cent in 1974-75 the latter has come down consistently to 6.4 per cent by 1983-84.
4.3.7 The abnormal rise in the other component, namely, interest on internal debt can be attributed to three possible factors in general: (a) the secular rise in the internal debt, (b) the general upward revision of the relevant interest rates, and (c) a possible shift in the structure of internal debt holding pattern.
4.3.8 The total internal debt has risen from Rs 157.6 billion in 1970-71 to Rs 902.6 billion in 1983-84, or by 14.4 per cent compound rate per annum. The growth between 1970-71 and 1979-80 was at the rate of only 13 per cent per annum while the growth was about 18 per cent per annum during the later years. Also, the trends in the average rates of yield on government securities too which give some idea of the increase in the interest rate on government securities, show a marked rise. The average redemption rate has risen from 5.2 per cent in 1973-74 to 7.3 per cent per year which explains the rise in the interest liabilities to some extent. In so far as the shift in the debt-holding patterns is concerned, the Committee to Review the Working of the Monetary System (Chakravarty Committee, 1985) has observed that over the years, the debt-holding pattern shifted towards medium-term securities of 5-10 years maturity range. Further, the small savings component, whose yield in recent years has been upgraded, has also been picking up. This tendency also might have been responsible for pushing up the interest costs of public debt. However, it can be said that by and large it is the rising quantum of debt that has been responsible for the growth in interest expenditure.
c. Subsidies.
4.3.9 In India subsidies are given for various purposes and are

Trends in Current Expenditure 75
direct as well as indirect. In the budgets, only the direct subsidies are explicitly shown as expenditures, whereas indirect subsidies given in the form of tax concessions and lower rates charged than marginal costs for goods and services rendered and therefore difficult to quantify.
4.3.10 Subsidisation of food-grains in India began as far back as 1950. However, subsidies had grown in magnitude only from 1970. Fertiliser subsidies were started effectively from 1976-77 in order to maintain parity of retail prices between imported and indigenous components, as well as to keep the price uniform throughout the country. It is the increase in this component that has been primarily responsible for the general rise in the expenditure on subsidies. The other major component of subsidies has been those relating to export promotion. Export incentives in a direct form were introduced in order to encourage the export of new products, particularly of manufactured items and engineering goods,as also to offset the comparative advantage of freight rates of exports from other countries vis a_ vis India. Currently, these include facilities such as cash compensatory support given to various items of export at a percentage of the value of exports, 'import replenishment' licences in respect of imported inputs required for export production, and 'export packing credit' at a concessional rate and so on.
4.3.11 Apart from these three major subsidies, there are a number of others, some not shown explicitly as subsidies, but hidden under various other entries in the budgets: the subsidy arising from the losses of public undertakings, subsidy on power rates of State Electricity Boards, subsidy on account of provisions of irrigation, supply of milk to urban consumers, provision of transport, as well as setting up industries in backward areas, are some of the examples.
4.3.12 The total quantum of subsidies has jumped from the low level of Rs 3.3 billion in 1970-71 to as much as Rs 50.9 billion in 1983-84, that is, by 15 times or at 23.3 per cent compound growth rate per year. The share of subsidies in the current expenditure has increased from6.8 per cent to 14.8 per cent. The sudden jump from 1976-77 onwards is due to the introduction of fertiliser subsidy. Of late, fertiliser subsidy along with the two other subsidies, namely food subsidy and export subsidy, have grown in size and importance. These three components account for 80 to 85 per cent of total subsidies. Among the

Trends in Current Expenditure 76
three categories, however, the growth rate is not uniform. While the shares of food and export promotion subsidies have been declining, that of fertiliser component has been rising. Food subsidy, which accounted for over 50 per cent in 1975—76, has come down to 29 per cent, while the share of fertiliser subsidy had risen from 21 per cent in 1977-78 to 36 per cent. Emergence of new forms of subsidies has been responsible for the decline in the shares of food and export subsidies. The distribution of subsidies among different sectors also shows that, on the whole roughly 50 per cent of subsidies go to agriculture and allied sectors and subsidies given to mining and manufacturing constitute about 20 per cent. (Table 4.6)
4.3.13 It is clear that the quantum of subsidies constitutes a heavy burden on the exchequer. The question of rationalising subsidy schemes has been examined in considerable depth by the Committee on Controls and Subsidies (Dagli Committee, 1979). The Committee identified three major objectives of providing subsidies. First, to mitigate the effects of extreme inequalities in income and wealth and to raise consumption levels of the vulnerable sections of the society. Second, to protect and promote the growth of employment-oriented production in the decentralised sector, and finally, to temporarily subsidise the infant industries.
4.3.14 However, the Committee identified sane major drawbacks in the present system of subsidies. They are: First, the benefits of subsidies often do not reach the target groups for whom they are meant. Second, sometimes government imposes various kinds of levies and taxes on subsidised commodities, thus neutralising the effect of subsidies. Third, State governments, in their attempt to attract industries from other States, have tended to foster unrestrained competition in subsidisation of new investments, which is not an insignificant factor in raising the level of subsidisation. This tendency leads to unhealthy diversion of investment and thus distorts the pattern of resource allocations.
4.3.15 All this calls for a careful review of the policy on subsidies. The phenomenal rise in subsidies in the past years is expected to continue unless a drastic policy revision is effected.

Trends in Current Expenditure 77
4.4 Functional Classification of Current Expenditure
4.4.1 The functional classification indicates the main purposes for which the expenditure is incurred. The major functional categories of expenditures are administrative services, social and community services, and economic services. Administrative services include general administration and defence. Social and community services include education, wealth, housing and such other social and community services. Economic services comprise of agriculture, mining, manufacturing, power and transport.
4.4.2 A notable feature of the trends in expenditures is the faster growth of expenditures on both economic and social services in comparison with those on administrative services. During the period from 1970-71 to 1983-84 expenditures on economic services increased at6.3 per cent per annum and social services expenditures registered an annual growth rate of 2.6 per cent. In comparison, the growth of expenditure on administrative services was abysmal at only 0.7 per cent (Table 4.7). As a ratio of GDP, expenditure on economic services increased by 2.4 percentage points from about 2 per cent in 1970-71 to4.4 per cent in 1983-84. Similarly spending on social services registered an increase of 1.4 percentage points from 3.6 per cent to 5 per cent. In contrast, increase in expenditures on administrative services was only by 0.5 percentage points. Nevertheless, it is necessary to note that even the administrative services expenditures increased faster than GDP.
4.4.3 Faster growth of expenditure on economic services may also be seen in terms of their increasing share in total expenditures from17.8 per cent in 1970-71 to 28.9 per cent in 1983-84 (Table 4.8). The share of social services expenditures remained more or less constant.In contrast, during the period, phenominal decline was seen in the case of administrative services by about 10 percentage points from 47.6 per cent to 37.9 per cent. Increasing share of economic services in total expenditures was made possible primarily by the significant increases in the shares of expenditures on agricultural and allied activities (by4.6 percentage points), and mining and manufacturing (by 4 percentage points). Similarly, the fall in the proportion of administrative expenditures was made possible by the relative decline in both general administration and defence almost by equal magnitude.
Trends In Current Expenditure 78
4.5 Conclusion
4.5.1 On the whole, the emerging picture is that the current expenditure component of total public expenditure has been rising much faster than capital formation and capital transfers. Much of the growth in current expenditure has been due to the sharp increase in subsidies and interest payments. Another notable feature of the trends in expenditures is the faster growth of expenditures on economic and social services as compared to administrative services. Although increase in expenditure on administrative services was faster than that of GDP, its relative importance showed a substantial decline as expenditures on economic and social services registered faster growth rates.

Trends in Current Expenditure 79
TABLE 4.1Trends In Public Expenditure In India (Administration)
(1970-71 to 1983-84)
Year Total public
expenditure (Rs billion)
Share of transfer payments
(%)
Total expenditure
as % of GDP
Expenditure net of
transfers as % of GDP
1970-71 64.6 34.4 16.1 10.51971-72 79.1 37.4 18.2 11.41972-73 90.3 39.4 18.8 11.41973-74 97.2 37.2 16.5 10.31974-75 123.4 42.8 17.7 10.31975-76 149.1 42.1 20.1 11.61976-77 167.5 44.4 20.9 11.61977-78 186.0 48.3 20.7 10.71978-79 210.0 47.3 21.5 11.31979-80 237.1 44.9 21.5 12.21980-81 282.5 43.4 22.2 12.61981-82 331.5 44.1 22.5 12.61982-83 391.5 44.3 23.8 13.21983-84 450.2 43.6 21.1 13.1
AverageGrowth rate 16.1 2.1 1.7
Source: National AccountsStatistics. Central Statistical Organisation, Government of India.
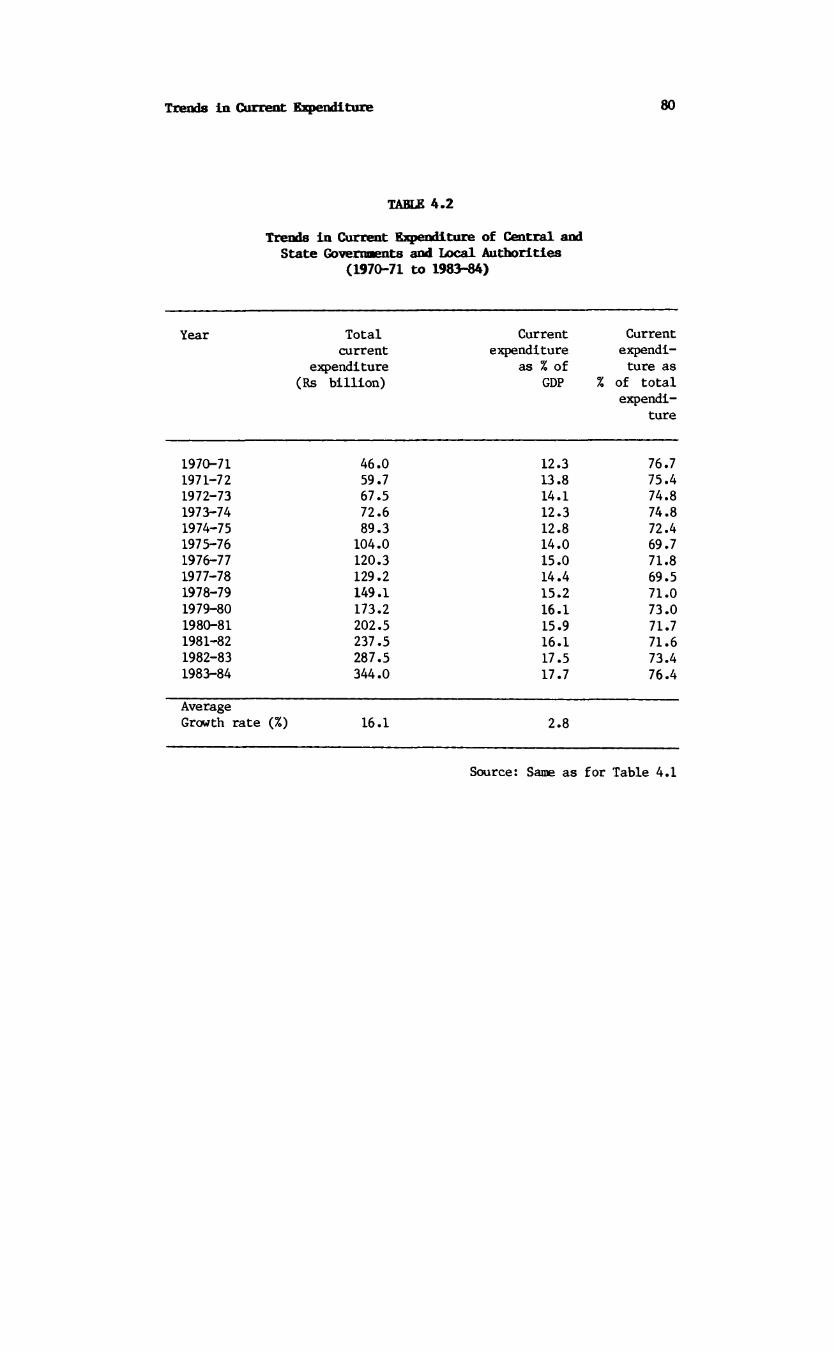
Trends in Current Expenditure 80
Trends in Current Expenditure of Central and State Governments and Local Authorities
(1970-71 to 1983-84)
TABLE 4.2
Year Total current
expenditure (Rs billion)
Current expenditure
as % of GDP
Current expenditure as
% of total expendi
ture
1970-71 46.0 12.3 76.71971-72 59.7 13.8 75.41972-73 67.5 14.1 74.81973-74 72.6 12.3 74.81974-75 89.3 12.8 72.41975-76 104.0 14.0 69.71976-77 120.3 15.0 71.81977-78 129.2 14.4 69.51978-79 149.1 15.2 71.01979-80 173.2 16.1 73.01980-81 202.5 15.9 71.71981-82 237.5 16.1 71.61982-83 287.5 17.5 73.41983-84 344.0 17.7 76.4
AverageGrowth rate (%) 16.1 2.8
Source: Same as for Table 4.1

Trends In Current Expenditure 81
Trends in Economic Components of Current Expenditure as per cent of GOT: 1970-71 to 1983-84
TABLE 4.3
(Per cent of GDP)
Year Total current
expenditure
Wagesand
salaries
Goodsand
services
Interest on public
debt
Subsidies
Currenttransfers
1970-71 12.3 5.9 3.6 0.5 0.8 1.51971-72 13.8 6.1 4.1 0.6 1.0 1.91972-73 14.1 6.0 3.9 0.7 1.1 2.31973-74 12.3 5.5 3.1 0.8 1.2 1.71974-75 12.8 5.9 2.9 0.5 1.7 1.71975-76 14.0 6.3 3.6 0.7 1.5 1.81976-77 15.0 6.4 3.8 0.7 1.7 2.01977-78 14.4 6.2 3.5 0.8 2.0 2.01978-79 15.2 6.3 3.6 1.0 2.3 2.11979-80 16.1 6.4 3.9 0.9 2.4 2.21980-81 15.9 6.4 3.8 1.1 2.2 2.21981-82 16.1 6.4 4.0 1.3 2.2 2.31982-83 17.5 6.8 4.1 1.6 2.3 2.41983-84 17.7 6.8 4.0 1.9 2.6 2.4
Averagecompound 2.8 1.1 0.8 10.8 9.5 3.7growth rate (per cent)
Source: As for Table 4.1.

Trends in Current Expenditure 82
TABLE 4.4Trends in the Structure of Economic Components
of Current Expenditure (1970-71 to 1983-84)
(Per cent to total)
Year Wagesand
salaries
Goods and services
Interest on debt
Subsidies Currenttransfers
1970-71 47.8 29.8 4.4 6.8 12.21971-72 44.6 30.1 4.5 7.1 13.71972-73 42.9 27.4 5.1 8.2 16.41973-74 45.0 25.2 6.6 9.7 13.51974-75 45.9 22.9 3.8 13.2 13.11975-76 45.0 25.7 4.7 10.8 13.11976-77 42.6 25.6 5.0 11.6 13.01977-78 42.9 24.2 5.4 13.7 13.71978-79 41.2 23.4 6.3 14.8 13.51979-80 39.6 24.1 5.8 14.6 13.91980-81 40.3 24.1 7.4 14.0 14.11981-82 39.5 24.8 7.9 13.4 14.31982-83 39.1 23.6 9.4 13.2 14.01983-84 38.1 22.6 10.7 14.8 13.4
Source: As for Table 4.1

Trends in Current Expenditure 83
TABLE 4.5Composition of Subsidies by Major Commodity Groups
(1970-71 to 1983-84)
(Per cent shares in total)
Year Foodsubsidy
Fertilisersubsidies
Exportpromotionsubsidies
Others
1975-76 53.2 34.2 12.61976-77 53.4 28.4 18.21977-78 37.3 20.7 25.4 16.61978-79 38.6 23.2 25.4 12.71979-80 32.9 33.1 19.8 14.11980-81 34.0 26.4 20.9 18.71981-82 36.0 19.3 24.5 20.21982-83 30.8 26.3 20.7 22.21983-84 28.9 36.1 16.0 18.9
Source: Indian Economic Statistics.
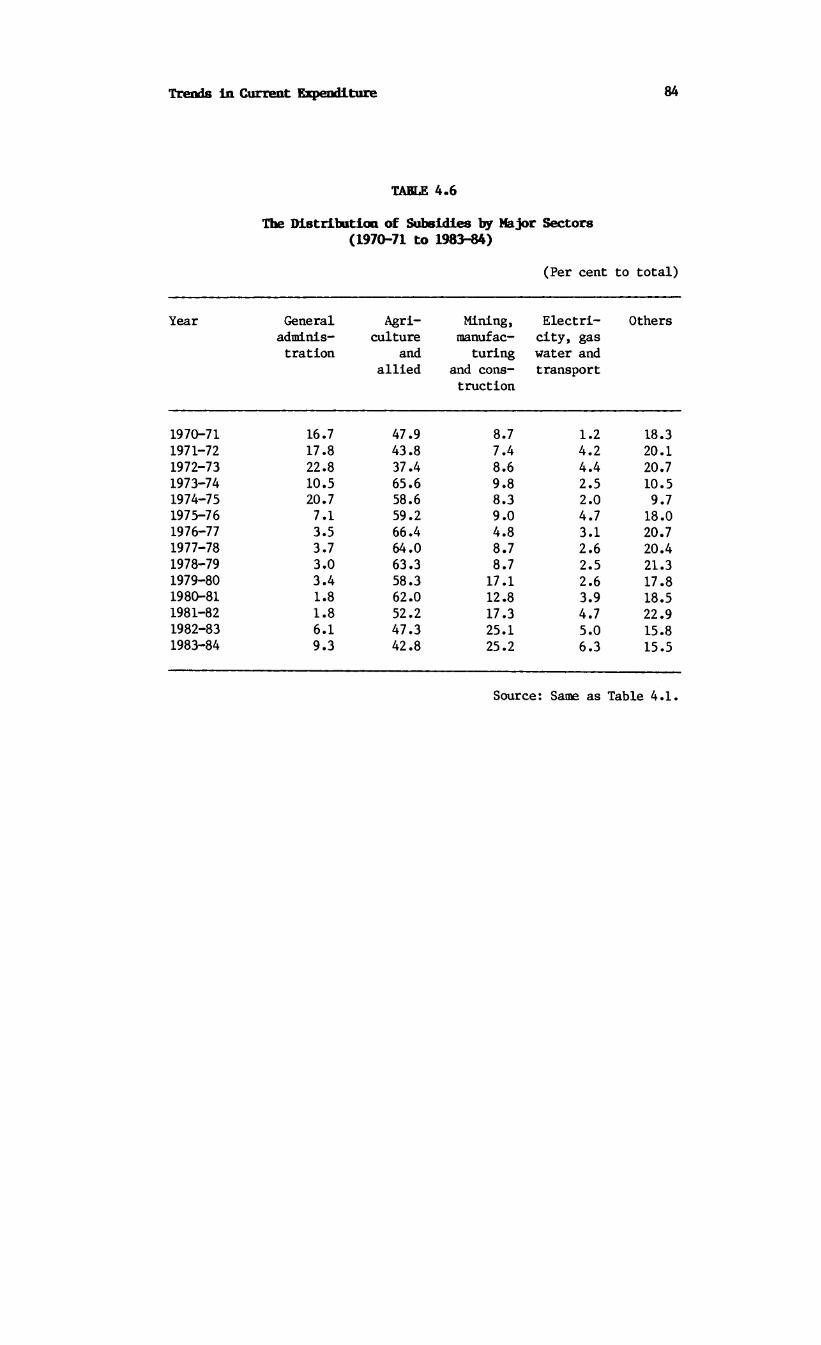
Trends In Current Expenditure 84
TABLE 4.6The Distribution of Subsidies by Major Sectors
(1970-71 to 1983-84)(Per cent to total)
Year Generaladministration
Agriculture
andallied
Mining, manufacturing
and construction
Electricity, gas water and transport
Others
1970-71 16.7 47.9 8.7 1.2 18.31971-72 17.8 43.8 7.4 4.2 20.11972-73 22.8 37.4 8.6 4.4 20.71973-74 10.5 65.6 9.8 2.5 10.51974-75 20.7 58.6 8.3 2.0 9.71975-76 7.1 59.2 9.0 4.7 18.01976-77 3.5 66.4 4.8 3.1 20.71977-78 3.7 64.0 8.7 2.6 20.41978-79 3.0 63.3 8.7 2.5 21.31979-80 3.4 58.3 17.1 2.6 17.81980-81 1.8 62.0 12.8 3.9 18.51981-82 1.8 52.2 17.3 4.7 22.91982-83 6.1 47.3 25.1 5.0 15.81983-84 9.3 42.8 25.2 6.3 15.5
Source: Same as Table 4.1.
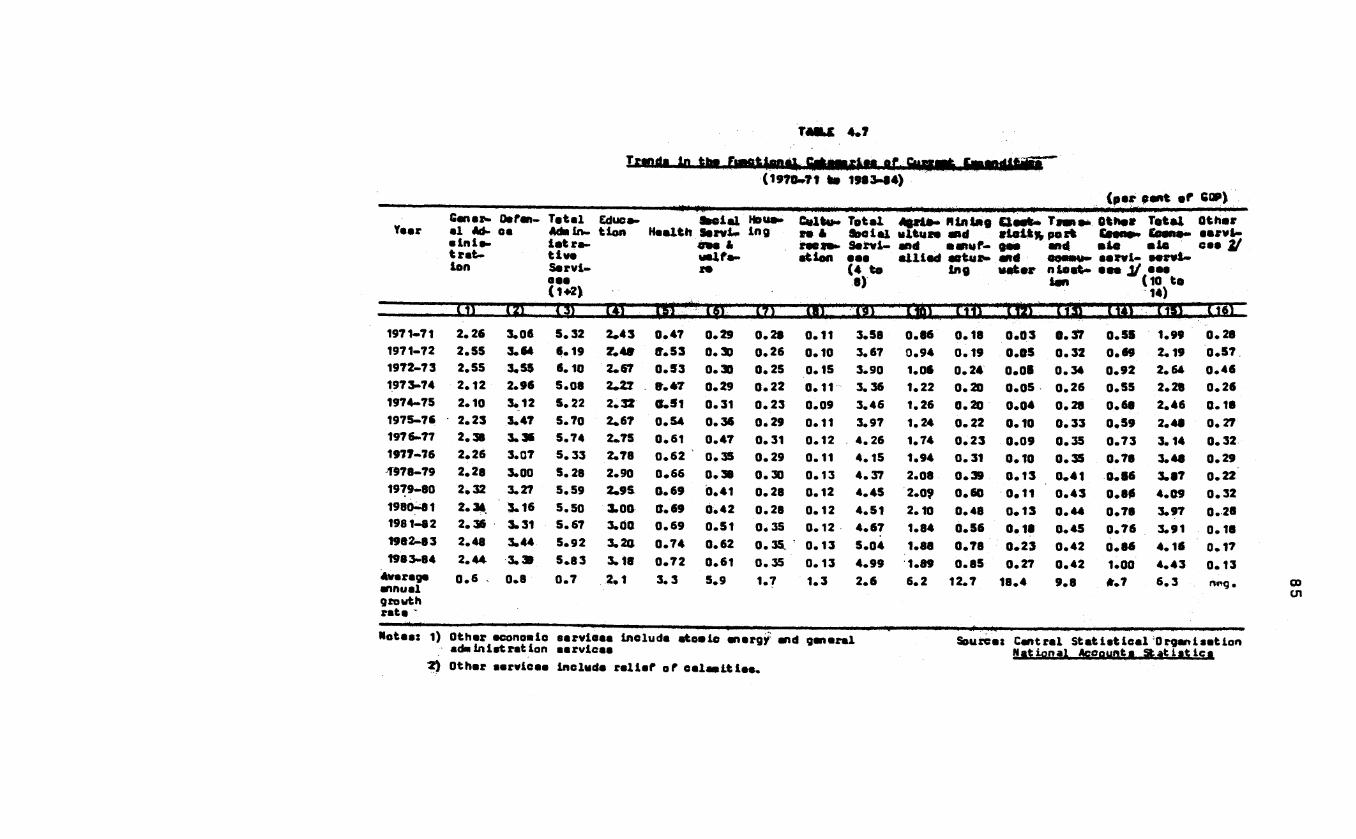
T M U 4 .7
Tam to in ta t f ia gfclan u . a f S w » b m w M t& T(1970-71 to 1983-84)
(p a r pant » f 60P)
VaarGanaiw Omfm-•1 W- eaa in i»>t r a t -ion
growth rata *
i ff ,"" m
TotalMain-lotra-tlwoS a rv i-oaa(i«a>IX5T ~
Educa-tion Haalth social Heuo» CnlW> To ta l Cloak* T m k * O tiw t To talS a m i- ing mi * i M l t l ultuco aid *tatt% port<roo * m t » > S o rv i- and • aH iN gao andwalfa» at ion ooo a llia d a c ty r- and tgam t.i* (4 to ing uatar n la t U
8)
•io aie aorvi- w » t - aoo 1/ ooo(10 to
«)
Othor owvi> eaa 2/
,ai, 1^.771771971-71 2. 26 3.06 5.32 2*43 0.47 0.29 0.28 0.11 3.58 0.86 0.18 0.03 0.37 0.58 1.99 0.281971-72 2.55 3.64 6.19 7.49 (T.53 0.30 0.26 0.10 3.67 0.94 0.19 0.05 0.32 0.69 2.19 0.571972-73 2.55 3.59 6.10 2.67 0.53 0.30 0.25 0.15 3.90 1.0* 0.24 0.08 0.34 0.92 2.64 0.461973-74 2.12 2.96 5.08 2-27 8.47 0.29 0.22 0.11 3.36 1.22 0.20 0.05 0.26 0.55 2.28 0.261974-75 2.10 3.12 5. 22 2.32 0.31 0.31 0.23 0.09 3.46 1.26 0.20 0.04 0.28 0.68 2.46 0 . 181975—78 2.23 3.47 5.70 2.67 0.54 0.36 0.29 0.11 3.97 1.24 0.22 0.10 0 . 33 0.59 2.48 0.271976-77 2.38 3.31 5.74 2.75 0.61 0.47 0.31 0.12 4.26 1.74 0 .2 3 0.09 0.35 0.73 3.14 0.321977-76 2.26 3.07 5 . 33 2.78 0.62 0.35 0.29 0.11 4.15 1.94 0.31 0.10 0.35 0.78 3.48 0.291978-79 2.28 3.00 5.28 2.90 0.66 0.38 0.30 0.13 4.37 2.08 0.39 0.1 3 0.41 0.86 3.87 0.221979-80 2.32 3.27 5.59 2.9S 0.69 0.41 0.28 0.12 4.45 2.0? 0.60 0.11 0.4 3 0.80 4.09 0.321980-41 2.34 5.16 5.50 3.00 0.69 0.42 0.28 0.12 4.51 2.10 0.48 0.13 0.44 0.78 3.97 0.261981-82 2.36 3.31 5.67 3.00 0.69 0.51 0.35 0.12 4.67 1.84 0.56 0.18 0.45 0 .76 3.91 0.181982-83 2.48 3.44 5.92 3.20 0.74 0.62 0 . 35 0 .13 5.04 1.88 0.78 0.23 0.42 0.86 4.16 0.171983-84 2.44 3. 38 5.83 3.18 0.72 0.61 0.35 0.13 4.99 1.89 0.85 0.27 0.42 1.00 4.43 0.13
Avaragaannual
0 .6 0.8 0 .7 2 .1 3.3 5.9 M 1.3 2.6 6.2 12.7 18.4 9.8 #.7 6 .3 nng. COcn
Notaa: 1) Othar aconoaie sarvioaa includa atooie anargy « id ganaral adain iatrat ion aarvieaa
2 ) Othar aarvieaa ineluda r a l ia f o f c a la a itia a .
Sourcat Cantral S ta t is t ic a l Organisation National teoounta S ta tis t lea

(percentagee)
table 4.8
Structure o f FWiot tonal Cateoortaa o f gxpandltMM
YaarGenez*- al «d- alnia- t ration
Oafan-ca
Total Adwin- iatrati va Sarvi- aaa (1+2)
Education Health
Social aarvi- caa * welfare
Houa-ing
Cultu- Total ra & aoeial recrs- earvi- ation eaa
Agric- Mining Elect- Trene- ultura and ricity, port and aanuf- gaa and allied actur- and coaau-
ing water nicat- lon
Othareconomic•ervi-caa
Total economic earvices
Othercervices
(« m'VA " ti\ W) 16) ’ T 7 V (aY m H01 Xltt 11*).. " T u T ”■ T T S T - (1511970-71 20.20 27.38 47.58 21.75 4.23 2.60 2.56 0.98 32. 12 7.72 1.65 0.27 3.29 4.89 17.82 2.491971-72 20.20 28.82 49.02 19.69 4.20 2.39 2.06 0.80 29.14 7.45 1.48 0.42 2.52 5.47 17.35 4.491972-73 19.82 27.50 47.42 20.77 4. 15 2.37 1.95 1. 18 30.42 7.56 1.73 0.34 2.42 6.61 18.80 3.361971-7* 19.28 26.65 45.93 20.65 4.32 2.65 1.97 0.92 30.51 11.08 1.86 0.49 2.39 5.05 20.88 2.421974—75 18.55 27.61 46.16 20.48 4.47 2.72 2.03 0.82 30.52 11.15 1.78 0. 38 2.44 6.02 21.76 1.561975-76 17.92 27.93 45.85 21.51/ 4.37 2.91 2.32 0.85 31.96 9.97 1.79 0.79 2.68 4.79 20.03 2. 141976-77 17.71 24.93 42.64 20.43 4.56 3.47 2.28 0.88 31.52 12.90 1.74 0.S9 2.52 5.41 23.37 2.371977-78 17.05 23.16 40.21 2t.01 4.72 2.63 2. 19 0.85 31.43 14.65 2. 32 0.74 2.63 5.88 26.23 2. 161978-79 16.56 21.78 38. 34 21.06 4.80 2.76 2.16 0.96 .31.74 15.12 2.87 0.98 3.92 6.29 28.29 1.531979-80 16.07 22.67 38.74 20.41 4.76 2.82 V 1.96 0.82 30.77 14.45 4. 14 0.77 2.95 6.01 28.32 2. 131980-81 16.43 22.18 38.61 21.05 4.85 2.92 1.99 0.84 31.65 14.74 3.34 0.93 3.09 5.7* 37.89 1.841981-82 16.37 22.92 39.29 20.76 4.81 3.55 2.41 0.84 32.37 12.72 3.89 1.27 3.12 6.08 27.09 1. 151982-83 16. 17 22.50 SB. 57 20.89 4.86 4.06 2.30 0.87 32.98 12.25 5.07 1.48 2.76 5.58 27.19 :. U1983-84 15.84 22.03 37.87 20. 52 4.58 3.97 2.26 0.86 32.39 12.31 5.55 1.76 2.72 6.51 28.85 0.92
Sourca: Ae fo r Table 4.7

CHAPTER 5
TRENDS IN PUBLIC DEBT
5.1. Introduction
5.1.1 The growing dependence on public debt as a means of financing developmental expenditure in this country has already been noted in Chapter 1. The steep rise in current expenditures coupled with low revenue buoyancy has led to heavy dependence on public borrowings. Over the last fey decades, the changes that have been brought into the monetary system have, to some extent, facilitated the transferof substantial portions of private savings to public sector through government borrowing. Yet the broad trends in the financing patterns through successing five year plans show that still, more than a half of the plan expenditure is being financed by public debt. Such dependence Oldebt financing has led to a rising interest burden which in turn has also contributed to the sharp rise in the current expenditures. Further, despite the 'broadening' and 'deepening' of the monetary system, a sizeable portion of the debt has been in the form of credit from the Reserve Bank of India (RBI) which has resulted in a marked increase in the general price level. In this chapter, a more detailed analysis of the implications of the dependence on debt is attempted.
5.2 Trends In Public Debt
5.2.1 The total outstanding liabilities of the Central and State governments together had grown nearly five times during 1970-71 to 1983-84 (Table 5.1): from Rs 222.5 billion to Rs 1055.7 billion. The yearly changes in the total liabilities, which reflect the debt raised each year has, however, fluctuated widely. An increase of about Rs 20 billion a year during 1971-72 and 1972-73 was followed by a decline to Bis 7.5 billion in 1973-74, but thereafter steadily went up to Rs 118.4 billion by 1983-84, the momentum especially noticeable in the last five years. As a ratio to GDP, the yearly change was around 5 per cent upto 1975-76, but later, it varied around 7 to 8 per cent of the GDP with two exceptions, namely, 3.5 per cent in 1978-79 and 10.4 per cent in 1982-83.

Trends In Public Debt 88
5.2.2 Depending upon the manner of borrowing and the interest and repayment obligations, the total liabilities excluding external debt are generally classified into market borrowings, small savings and other liabilities. The market borrowings of the Central government consist of treasury bills, dated securities, compensation and other bonds, as well as the special bearer bonds issued from time to time. Small savings comprise the funds mobilised by the Central government (of which two-thirds are passed on to the States) through the postal savings schemes.Other liabilities of the Centre include public and State provident funds, other accounts relating to insurance and pension funds, trusts and endowments, reserve funds and deposits and so on. Borrowings of the States comprise the loans floated in the market and other liabilities which include ways and means advances, loans from banks and other financial institutions and provident funds.
b. External debt.
5.2.3 A welcome trend has been the consistent declining trend ofthe external debt component. In 1970-71 roughly 30 per cent of total debt came from external sources. However, by 1983-84 its share had comedown to 14.4 per cent. The decrease can be attributed mainly to thegovernment policy of prudence in keeping the debt servicing burden wellwithin manageable limits.Underlying such a policy are two problemsassociated with external financing: First, the uncertainty in respect of the availability of external assistance and second, the slow growth in the debt servicing capacity. Table 5.2 shows the position of external debt and the interest burden on foreign debt as well as the indicators of debt servicing capacity. This table indicates that the average interest rate on foreign debt has come down from 11.7 per cent in 1970-71 to about 3.6 per cent in 1983-84, with minor fluctuations. The proportion of interest payments in total export earnings has remained more or less constant at 2.5 per cent.
b. Internal debt.
5.2.4 Central government liabilities constitute about 85 per centof the total internal debt. The changing pattern in the structure of internal debt is shown in Table 5.3. A major portion of theliabilities comes from market borrowings, its share having gone up from 35 per cent in 1970-71 to 46 per cent in 1983-84. The share of other liabilities has fluctuated between 19 and 24 per cent. Small savings so

Trends in Public Debt 89
far, despite the higher yield rates and tax benefits, have not been able to contribute more than 14 per cent.
5.3 Market Debt, Treads and Policies
5.3.1 The main instruments employed in raising market loans by the Central government are securities and bonds, and treasury bills.
5.3.2 The major investors in Government securities are the Reserve Bank of India, commercial banks, the Life Insurance Corporation of India and the provident funds. Direct investment by households in government securities has been negligible and has been declining. However, the financial intermediaries mobilise the household savings and these investments represent a transfer of institutionalised savings to the government sector.
5.3.3 The holding pattern of government securities is largely governed by the monetary authorities. Table 5.4 shows the trends in the debt-holding patterns. Apart from the RBI, commercial banks are the major holders of market debt in securities. These banks are under the obligation to invest a part of their deposits with the RBI in accordance under the statutory liquidity ratio (SLR) requirements. Similarly, insurance corporations have to invest not less than 50 per cent of their premium income and provident funds, 30 per cent of their accruals in government securities. The trends depicted in Table 5.4 show that while the share of RBI holdings (on its own account) has declined from 36.4 per cent in 1970-71 to 28.4 per cent in 1982-83, that of the commercial banks has gone up from 21 per cent to 38.9 per cent. This shift is partly due to the revision in the SLR requirements. The ratio which was 20 per cent in 1970-71, has been constantly revised and in 1981 it stood at 35 per cent. The share of the Life Insurance Corporation remained more or less constant at 11 to 12 per cent while that of provident funds declined from 24 per cent to 17 per cent.
5.3.4 Loans raised through treasury bills amounted to Rs 25 billion in 1970-71 which was 36 per cent of the total Central government market debt. The share went up steadily to about 48 per cent by 1977-78, the trend being attributable partly to difficulty in raising debt through securities.
5.3.5 The major purchasers of treasury bills are banks, State

Trends In Public Debt 90
governments and others. Unsold bills are taken up by the RBI. Over the years commercial banks have emerged as the major purchasers of treasury bills, their share increasing from 3 per cent to 94 per cent while the share of RBI has gone down. However, an analysis of the ownership of treasury bills outstanding shows that over 90 per cent are finally held by RBI (Table 5.5).
a. State governments' liabilities.
5.3.6 The total liabilities of the State governments in India comprise (a) market loans; (b) other liabilities, and (c) loans and advances from the Central government. The growth and structure of these components are shown in Table 5.6. The third component, being in the nature of internal transfers within the government and not adding to the total liabilities of government, is excluded from our analysis.
5.3.7 The total liabilities of the State governments have increased four-fold during 1970-71 to 1983-84. The most prominent component of States' debt has been the loans and advances from the Central government whose share fluctuated around 72 per cent. Between the other two components, the growth of market debt has been slower compared to the other liabilities. As a result the share of the former has been declining.
5.3.8 The major investors in State government securities are the banks (Table 5.7). The proportion held by banks increased from 45.3 per cent in 1970-71 to 61.3 per cent in 1982-83. The share of Life Insurance Corporation has declined from 21.4 per cent to 12.1 per cent, while that of provident funds has been rising faster. State governments themselves hold a small proportion. The other investors are Industrial Finance and State Finance Corporations, Joint Stock Companies, local authorities and trusts. Their combined share, however, is fast becoming negligible.
5.3.9 Thus, despite various changes in the monetary system over the years, the bulk of the market borrowings is raised through a captive market comprising the commercial banks, Life Insurance Corporation, and the provident funds. Commercial banks emerge as the major holders of the market debt apart from the Reserve Bank of India.
5.3.10 The generaly low voluntary subscription of market debt has
Trends in Public Debt 91
been largely due to the low yield rates of government securities and treasury bills. The yield rates on government securities have been out of alignment with other rates in the economy (Table 5.8). The coupon rates on short, medium, as well as long-term government securities have been significantly lower than the rates on company deposits and commercial bank deposits. Of particular interest is the movement of coupon rates offered on long-term government securities with maturity period of 10 years and above, since a major portion (over 80 per cent) of the market borrowings is held in such securities. There has been a steady revision of the relevant coupon rate, which has gone up from 6.25 per cent in 1974-75 to 10.5 per cent in 1984-85. However, despite this continuous upward revision, it remained at a level lower thanthose offered on company deposits.
5.4 The Extent of Monetisation of Public Debt and Implication on the Price Level
5.4.1 As may be seen from Table 5.9 RBI's share in the aggregate borrowing of the government has gone up from 19.3 per cent in 1970-71 to 28.1 per cent in 1983-84.Currently, as seen above, nearly 30 per cent of the amount raised through dated securities and over 90 per cent of the amounts raised through treasury bills are held by the Reserve Bank. Though the extent of monetisation showed a declining trend until1977-78, in later years it has been increasing.
5.4.2 The level and growth of the monetisation of public debt isbelieved to be a major factor responsible for the inflationarypressures noticed during the 1970s and the early years of the1980-81.The RBI credit to Government constitutes the bulk of the'reserve money' or 'high powered money' in the economy, with anexpansionary effect on the money supply. The share of RBI credit in thereserve money has gone up from 83 per cent to 92 per cent. As can beseen in Table 5.10, during the period under review, the wholesale price index rose from 100 to 315, the average change per year being 10 per cent. The yearly changes in the price index show that the price rise was much faster during the three years 1972-75, and again during the three years 1979-82. Inflation was seemingly under control during the four years 1975-79. Though the price rise in India is also caused by other factors such as failure of agricultural production and inported inflation, "a substantial rise in the price level in the early seventies cannot be entirely explained away by failures in agriculture

Trends in Public Debt 92
and imported inflation. The large deficits incurred by Government and financed by the Reserve Bank have led to a significant rise in money supply relative to output in successive years and have constantly fuelled inflationary pressures during seventies". (Chakravarty Committee, 1985, p.151).
5.5 Scope for Demonetisation of Public Debt
5.5.1 One way of curbing the monetisation of public debt is toraise the yield rates on Government securities in order to attract more public participation. The Chakravarty Committee (1985) appointed by the RBI to review the working of the monetary system in India made a recommendation to this effect.It observes: "There appears to beconsiderable scope for government to tap the savings of the public through an appropriate interest rate structure and offer a wider spectrum of savings instruments with attractive features. This will have the desirable consequence of lowering the rate of expansion in reserve money and money supply associated with a given level of borrowing by the government" (p.299).
5.5.2 However, an upward revision of the interest rates would inevitably increase the already acute interest burden on the government budget. The total interest liability even with the existing subscription levels of market debt, has been escalating at a rate of24.3 per cent per year. Between 1970-71 and 1983-84 the interest payments have gone up from Rs 2.2 billion to Rs 36.8 billion. In fact, interest expenditure has been one of the two fastest growing components of the expenditure on current account. Its share in the current expenditure has goneup from 4.4 per cent to 10.7 per cent. Therefore, any further major revision in the interest rates is likely to aggravate the situation.
5.5.3 However, as noted by the Chakravarty Committee, an increase of 3 per cent in the yield rate on market securities and about 4 per cent in the the treasury bill discount rate might be sufficient to achieve the required parity with the other yield rates in the economy. The resultant additional interest payments work out to be not more than Rs 2.5 billion.Assuming that the envisaged yield rate revision will induce higher public participation in the government market borrowings, the long-run benefits of an ensuing price stability as a result of gradual demonetisation of the public debt can be expected to outweigh
Trends in Public Debt 93
the additional Interest costs.
5.5.4 Also, as the Chakravarty Committee puts it, "The dampening of the rise in prices would very likely have a beneficial impact on government expenditures. Thus, a part or even the whole of the additional interest burden might be offset by saving in government expenditure. Initially, interest costs will increase as successive tranches of government borrowing carry the higher coupon rates but the net impact on the government budget need not be large in the long run to the extent that relative price stability is achieved." (Chakravarty Committee, p.156). The Committee also argues that the ensuing price stability will obviate the need for raising the yield rates on a continuing basis.
5.5.5 The favourable consequences of the revision of the yield rates on government securities predicted above, no doubt, rest on a crucial assumption, namely, that savings, especially those in the form of financial savings held in banks and other financial intermediaries, are interest-elastic. Available empirical evidence has so far been divided on the issue. While studies such as Gupta (1985), Bhattacharya (1985) show that at best savings are not affected by interest rates, the study by Madhur (1985) supports the hypothesis of high interest- elasticity of savings. The elasticity coefficient estimated by the latter study is around 0.88. While the divergent conclusions could be due to different methodologies, and data sets used, the nature of the relation between interest rates and the overall savings rate remains unknown. However, an interesting result obtained by Gupta (1985) is that though the aggregate savings are interest inelastic, changes in the real interest rate have a positive effect on the financial savings.
5.5.6 To the extent that the interest elasticity of savings is below unity, the interest rate hikes will not lead to any further increase in the overall saving rate in the economy. Instead of adding anything to the current investible surplus, the interest hikes will merely divert funds which otherwise would have been invested in the private sector, thus leading to the 'crowding out' of private investment. However, in the long run it is also likely that the infrastructure development being financed through public borrowing will result in lower required rates of return which is conducive for the growth of private investment leading to the crowding in effect. Also, the price stability achieved through the resultant demonetisation of

Trends in Public Debt 94
public debt would reinforce the favourable climate for the new investment. In such a case the long-run effect of interest rate increases should be construed as having a positive effect on the aggregate saving and investment. The high positive interest elasticity coefficient obtained by Madhur (1985) is essentially due to the long- run nature of his model, which might have contained the crowding in effect as well, while the estimates obtained by Gupta (1985) and Bhattacharya (1985) pertain to the short-run effect of interest rate on savings.
5.6 Conclusion
5.6.1 Since financial savings of the household sector appears to be fairly responsive to the interest rate changes, the rationalisation of interest rate structure is likely to succeed in demonetising the public debt to tolerable levels. Even if the interest rate revision on government bonds entails short-run costs such as higher interest burden, and 'crowding out' phenomenon, the long-run benefits of price stability and 'crowding in' effects would more than compensate for the costs.
5.6.2 However, it should be noted that demonetisation of government debt may not always ensure price stability. Credit creation by the banking sector which adds to the money supply could also be as inflationary. Patnaik (1986) contends that the "distribution of the public debt between RBI and others is of little consequence as far as the potential for inflation via liquidity creation is concerned" (p. 1545). Though Patnaik's arguments can be viewed as the other extreme, the expansionary effect of bank credit, albeit lower than the RBI credit, cannot be ruled out.
5.6.3 This points to the only remaining alternative, namely, the imperative need to generate enough savings within the public sector, and to mobilise large public savings.

Trends In Public Debt 95
Trends In Total Outstanding Liabilities of Central and State Governments
(1970-71 to 1983-84)
TABLE 5.1
(Rs billion)
Year Total liabilities of Centre and States
Yearlychange
Yearly change as per cent of
GDP
Total liabilities
of Central Government
Total liabilities of
State Governments 1/
1970-71 222.5 198.6 23.81971-72 242.6 20.1 4.7 214.2 28.41972-73 265.3 22.7 4.8 239.4 25.91973-74 272.7 7.5 1.2 242.7 30.01974-75 302.3 29.6 4.2 268.4 34.01975-76 341.9 39.5 5.3 301.5 40.41976-77 380.0 38.2 4.7 336.1 43.91977-78 451.3 71.3 7.8 401.8 49.61978-79 487.3 36.0 3.5 434.8 52.51979-80 560.5 73.2 7.0 502.2 58.41980-81 666.6 106.0 8.4 597.5 69.01981-82 767.4 100.8 6.9 681.9 85.51982-83 937.4 170.0 10.4 848.7 88.61983-84 1055.7 118.4 6.0 951.1 104.6
Note: 1/ Excluding loans and advances from Centre to States
Source: Report on Currency and Finance Reserve Bank of India

Trends in Public Debt 96
External Debt and Its Burden (1970-71 to 1983-84)
TABLE 5.2
(Rs billion)
Year External Debt outstanding
% share in total liabili
ties
Interest on foreign
debt
Interest as % of value of exports
1970-71 64.9 29.2 1.6 2.61971-72 68.3 28.2 1.8 2.41972-73 71.2 26.9 1.8 2.41973-74 58.7 21.5 1.9 3.31974-75 64.2 21.2 1.6 2.51975-76 74.9 21.9 1.9 2.51976-77 86.1 22.7 2.1 2.41977-78 89.9 19.9 2.0 2.31978-79 93.7 19.2 2.3 2.41979-80 99.6 17.7 2.4 2.41980-81 112.9 16.9 2.3 2.01981-82 123.3 16.1 2.6 2.11982-83 136.8 14.6 3.0 2.21983-84 153.1 14.5 3.6 2.4
Source: Indian Economice Statistics.

Trends In Public Debt 97
TABLE 5.3
Treads in Major Components of Internal Debt Central Government
Year Total Central Government liabilities
Marketable debt Small savings Otherliabilities
(Rs billion) (Rs. % (Rs. % (Rs. %billion) share billion) share billion) share
1970-71 198.6 69.5 35.0 22.1 11.1 42.1 21.21971-72 214.2 76.1 35.5 24.3 11.4 45.5 21.31972-73 239.4 94.7 39.6 28.0 11.7 45.4 19.01973-74 242.7 103.7 42.7 32.8 13.5 47.5 19.61974-75 268.4 116.4 43.4 35.5 13.2 52.3 19.51975-76 301.5 129.4 42.9 39.5 13.1 57.8 19.21976-77 336.1 134.4 40.0 43.6 13.0 72.0 21.41977-78 401.8 179.8 44.7 49.0 12.2 83.1 20.71978-79 434.8 186.2 42.8 57.5 13.2 97.4 22.41979-80 502.2 232.6 46.3 68.6 13.7 101.4 20.21980-81 597.5 287.4 48.1 79.8 13.3 117.4 19.61981-82 681.9 300.1 44.0 93.8 13.7 164.8 24.21982-83 848.7 410.6 48.4 110.9 13.1 190.4 22.41983-84 951.1 432.9 45.5 133.0 14.0 232.1 24.4
Source: As for Table 5.1

Trends in Public Debt 98
Market Debt-bolding Pattern (1970-71 to 1982-83
TABLE 5.4
(Per cent to total)
Year ReserveBank
CommercialBanks
StateGovernments
LifeInsuranceCorpora
tion
ProvidentFund
Others
1970-71 36.4 21.1 3.5 11.9 23.9 3.21975-76 31.8 29.1 2.9 12.9 21.2 2.71976-77 26.7 33.1 2.7 12.4 19.3 5.81978-79 20.2 41.7 2.0 12.0 17.6 6.51979-80 20.3 44.9 1.8 11.8 16.4 4.81980-81 24.6 43.7 1.5 11.4 13.5 5.31981-82 28.4 38.9 1.0 11.0 17.3 10.2
Sources: Report of the Committee toReview the Working of Monetary System,Reserve Bank of India (1985).
Report on Currency andFinance.

Trends in Public Debt 99
TABLE 5.5
Ownership Pattern of Treasury Bills Outstanding (1970-71 to 1983-84)
(Per cent)
Year Total amount raised by
treasury bills (Rs billion)
RBI'sshare
Banks'share
StateGovernments'
share
Others
1970-71 25.2 96.5 0.9 1.1 1.81974-75 50.6 95.1 1.5 2.7 0.71975-76 58.1 87.8 7.6 4.0 0.71976-77 53.7 94.2 0.9 4.3 0.61977-78 86.2 83.7 12.4 3.2 0.61978-79 76.1 88.1 1.8 9.5 0.61979-80 102.0 90.3 0.6 8.2 0.91980-81 128.5 92.2 4.1 3.4 0.41981-82 102.7 96.9 1.5 1.1 0.61982-83 176.3 91.2 6.6 1.7 0.41983-84 174.3 92.9 5.9 0.1 1.0
Source: As for Table 5.1

Trends in Public Debt 100
TABLE 5.6
Trends in States' Liabilities
Year Total liabilities (Rs billion)
Marketable debt
as % to total
Other liabilities
as % to total
Loans and advances from
Central Government
as % to total
1970-71 87.5 14.1 13.2 72.81971-72 95.7 14.9 15.7 70.31972-73 105.5 13.9 10.6 75.51973-74 115.8 14.0 11.9 74.11974-75 125.5 14.1 12.4 72.91975-76 137.2 15.4 14.1 70.61976-77 148.0 15.5 14.2 70.31977-78 164.9 15.0 15.1 69.91978-79 191.4 13.9 13.5 72.61979-80 215.8 13.2 13.9 72.91980-81 239.7 12.7 16.1 71.21981-82 276.2 12.2 18.8 69.01982-83 324.1 11.6 15.7 72.71983-84 371.8 11.6 16.5 71.9
Source: As for Table 5.1.

Trends in Public Debt 101
Holding Pattern of State Government Securities
TABLE 5.7
(Per cent to total)
Year Banks StateGovernments
LifeInsurance
Corporation
ProvidentFunds
Others
1970-71 45.3 9.8 21.4 3.7 7.31975-76 53.5 1.4 20.6 16.9 7.71976-77 53.7 1.1 19.9 9.8 15.61977-78 53.6 0.1 19.7 14.0 12.41978-79 54.8 0.4 18.9 17.7 8.21979-80 54.0 0.4 17.6 22.7 5.31980-81 55.6 0.3 15.4 25.6 3.11981-82 56.4 0.3 15.6 26.1 1.61982-83 61.3 0.2 12.1 23.7 2.7
Source: Report of the Committee to Review the Working of the MonetarySystem in India (1985),RBI, Bombay.
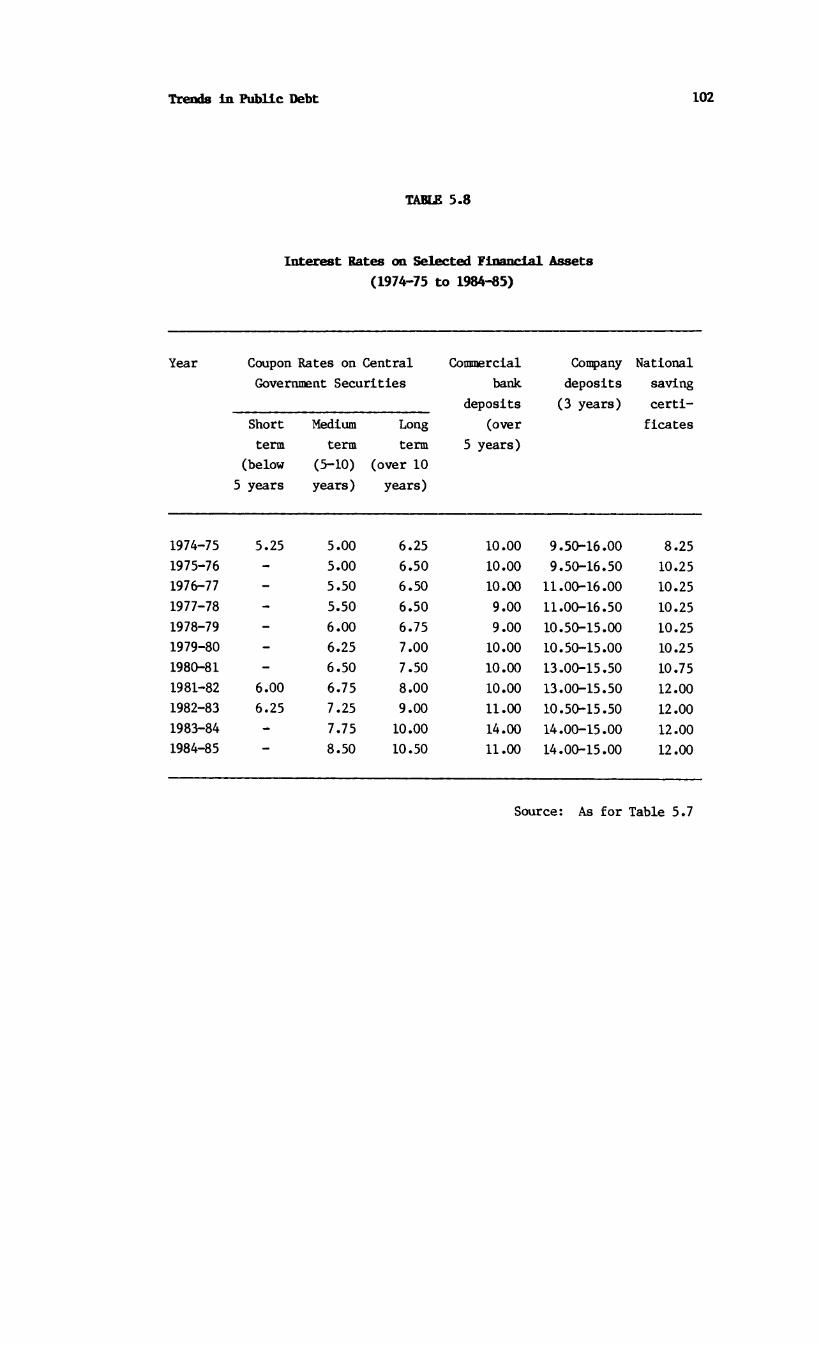
Trends in Public Debt 102
TABLE 5.8
Interest Bates on Selected Financial Assets (1974-75 to 1984-85)
Year Coupon Rates on Central Commercial Company NationalGovernment Securities bank deposits saving
deposits (3 years) certiShort Medium Long (over ficatesterm term term 5 years)
(below (5-10) (over 105 years years) years)
1974-75 5.25 5.00 6.25 10.00 9.50-16.00 8.251975-76 - 5.00 6.50 10.00 9.50-16.50 10.251976-77 - 5.50 6.50 10.00 11.00-16.00 10.251977-78 - 5.50 6.50 9.00 11.00-16.50 10.251978-79 - 6.00 6.75 9.00 10.50-15.00 10.251979-80 - 6.25 7.00 10.00 10.50-15.00 10.251980-81 - 6.50 7.50 10.00 13.00-15.50 10.751981-82 6.00 6.75 8.00 10.00 13.00-15.50 12.001982-83 6.25 7.25 9.00 11.00 10.50-15.50 12.001983-84 - 7.75 10.00 14.00 14.00-15.00 12.001984-85 8.50 10.50 11.00 14.00-15.00 12.00
Source: As for Table 5.7

Trends in Public Debt 103
Extent of Monetisation of Public Debt (1970-71 to 1983-84)
TABLE 5.9
Year RBI credit to RBI Credit to Government as % ofto Government(Rs. billion) Total Total
market publicdebt debt
1970-71 38.4 55.3 19.31971-72 48.7 64.0 22.71972-73 57.0 60.2 23.81973-74 64.6 62.3 26.61974-75 73.2 62.9 27.31975-76 69.2 53.4 22.91976-77 77.7 57.8 23.11977-78 76.4 42.5 19.01978-79 94.2 50.6 21.71979-80 118.0 50.7 23.51981-82 158.5 55.1 26.51981-82 199.9 66.1 29.31982-83 223.1 54.3 26.31983-84 267.2 61.7 28.1
Source: Report on Currency and Finance,Reserve Bank of India.

Trends in Public Debt 104
TABLE 5.10
Prices, Reserve Money and RBI Credit to Government (1970-71 to 1983-84)
Year Wholesale price index
Reserve money
(Rs. billion)
Proportion of RBI credit to Govern
ment in the reserve money (%)
1970-71 100.0 48.2 79.71971-72 105.6 53.8 90.51972-73 116.2 60.3 94.51973-74 139.7 72.7 88.91974-75 174.9 76.0 96.31975-76 173.0 78.0 88.51976-77 176.6 98.0 79.31977-78 185.8 109.4 69.81978-79 185.8 140.8 66.91979-80 217.6 165.7 71.21980-81 257.3 194.5 81.51981-82 281.3 210.0 95.21982-83 288.6 231.1 96.51983-84 315.3 290.0 92.1
Source: Report on Currency and Finance.

CHAPTER 6
SUMMARY
6.1. The Nature of Resource Constraints In Financing Public Expenditure
6.1.1 At the time India attained independence, income, saving and capital formation in the economy were at very low levels. In the following three decades, the rate of capital formation registered an impressive increase, despite the two oil shocks in the mid-seventies. (1.1.1)
6.1.2 Most of the capital formation has been financed out of domestic saving and the public sector has played a major role in spearheading the capital formation and increasing the GDP in the economy. The plan strategy in India envisaged a lead role for public sector in stepping up the savings and investment rate in the economy. (1.1.2 and 1.1.3)
6.1.3 The contribution of the public sector in the gross domestic savings has, however, not been commensurate with its growth. The bulk of the domestic saving comes from the private household sector.Evidently,capital formation in the public sector has been financed with the help of large drafts on household savings. (1.1.4 and 1.1.5)
6.1.4 The pattern of financing of public sector investment expenditure shows public savings contribution has not been encouraging. As a result the dependence on domestic borrowing has in recent years increased. (1.1.7 and 1.1.8)
6.1.5 The disaggregated picture of public savings shows that the main cause for their low levels has been the declining contribution of budgetary saving which currently has become negative, while the savings generated by the public sector enterprises have been stagnant until 1980-81. It is only from 1981-82, that the saving performance of public enterprises, particularly the non-department enterprises, shows some
Summary 106
improvement. (1.2.1. to 1.2.3)
6.1.6 The reasons stated for the deterioration in budgetary saving are: (1) the rise in current expenditure, first due to the inflation and, second due to certain large items of current expenditures such as defence subsidies and interest liabilities, (2) the inadequate buoyancy of revenue receipts, (3) the low contribution from public sector enterprises and their continued dependence on budgetary support for meeting their capital outlay.(1.2.4 and 1.2.5)
6.1.7 The inadequate saving generation in the public sector has led to an increasing reliance on domestic borrowing with implication of interest burden and inflation. (1.2.6)
6.2 Trends in Tax Revenues
6.2.1 About 80 per cent of the current revenues of the government comes from taxation. The current level of tax-income ratio at 18 per cent is by no means low and compares well with that prevailing in many middle-income countries. However, since current expenditure has been rising faster, it is necessary to explore the scope for further increase in the tax-income ratio. (2.2.1 and 2.2.2)
6.2.2 The main feature of the tax revenue growth has been the falling share of direct taxes. The traditional land-based direct taxes are fast becoming negligible. Thus the dependence on indirect taxation has been growing over the years. (2.2.4)
6.2.3 The structure of the tax revenue growth has not been entirely in conformity with the general trend observed in the context of other countries. Hinrichs theory of tax structure only partly holds in India. The continued decline in the modem direct tax revenues in India is a phenomenon that deviates from the above hypothesis. The non-appli- cability can be due to certain imbalances in the tax structure, as well as due to widespread tax evasion. (2.2.5 and 2.2.6)
6.2.4 The Long Term Fiscal Policy announced in 1986 envisages the reversal of the declining trend in direct taxes. (2.2.7)
6.2.5 An important cause for the declining role of direct taxes has been the under-taxation of the agricultural sector. The yield from

Summary 107
land revenue which is the only notable direct tax on agricultural sector, has been declining over the years. In many States the landrevenue rules have become outdated. (2.3.1. to 2.3.3.)
6.2.6 Although there exists a near unanimity on the need to imposeheavier taxation on the agricultural sector, the actual mode oftaxation has not yet been resolved. The Committee on Taxation ofAgricultural Income has designed an agricultural holdings tax which takes into account the changing structure of land productivity.However, the tax could not be implemented owing to many administrative problems involved. Bagchi (1978) suggested a modified scheme whichsimplifies many of the administrative procedures. (2.3.4 and 2.3.5)
6.2.7 In spite of various schemes and modifications, the revenue productivity of agricultural taxes has not improved. A major impediment has been the lack of political will on the part of the governments. (2.3.6)
6.2.8 Another important matter of concern has been the decliningproductivity of the non-agricultural direct taxes, particularly the personal income tax. The declining trend and lack of buoyancy inpersonal income tax is attributable to several factors such as narrowcoverage, rising exemption limit, numerous deductions as well as wide spread evasion. Lowering of the marginal tax rates after 1974-75 could not bring about the required increases in the tax revenue. Tax evasion has been increasing over the years as shown by Acharya and Associates (1985). (2.4.1 and 2.4.3)
6.2.9 Thus the basic problem with the personal income tax has been ineffective enforcement of tax law. Some major steps to increase the efficiency in tax collection are being experimented with. Also, a possible replacement of income tax by an expenditure tax is being studied. (2.4.4 and 2.4.5)
6.2.10 Corporation income tax which currently contributes over 53 per cent of the direct tax revenue has been more buoyant than personal income tax. Much of the growth has been made possible by the public sector oil companies. The automatic growth of corporation tax has also improved over the years. The elasticity would have been even higher but for the slower growth of the tax base. (2.4.6 to 2.4.8)

Suomary 108
6.2.11 The sluggish growth In the base of the corporation tax can beattributed to the declining role of non-government corporations in the economy, coupled with the low returns in the government sector companies. To some extent the existing income tax structure with an inbuilt bias has been responsible for the decline in the corporate formof business vis a vis partnership firms. (2.4.9 and 2.4.10)
6.2.12 The present corporation tax structure also suffers from certain drawbacks such as inbuilt bias towards debt-financing, failure to take account of inflation as well as low effective tax rates due to numerous deductions and exemptions. (2.4.11 to 2.4.13)
6.2.13 Over 75 per cent of the total tax revenue comes from the four major indirect taxes, namely, union excises, customs at the Central government level and sales tax and state excise at the State level. The revenue buoyancy coefficients of all the four taxes have been well above unity. (2.5.1 and 2.5.2)
6.2.14 However, the built-in elasticity coefficients have been markedly lower than the buoyancy coefficients. The wide gap between the elasticity and buoyancy coefficients indicates that much of the growth in their yield has been due to the year-to-year discretionary changes. (2.5.3)
6.2.15 The growing importance of indirect taxes in the Indian tax system is a matter for concern primarily due to their adverse economic effects. (2.5.4)
6.2.16 Indirect taxes are less effective than direct taxes as aninstrument of resource mobilisation, because the former release lessnet real resources than the latter. (2.5.5)
6.2.17 An important source of economic inefficiency of indirect taxes lies in the taxation of inputs and capital goods, which yield substantial tax revenue. (2.5.6)
6.2.18 Indirect taxes levied by the Central government in the formof customs and excises, by the State governments in the form of salestaxes and even by the Local governments in the form of octroi hasled to several virtually independent systems of taxation and consequent cascading effects. (2.5.7)

Summary 109
6.2.19 Following the recommendations of the Jha Committee the Central government has introduced in 1986 a modified form of value-added tax (MODVAT) for the union excise duties. However, the limited introduction of the MODVAT may not eliminate the cascading effect altogether. (2.5.8 and 2.5.9)
6.2.20 The State sales taxes apart from aggravating the cascading effect of union excise taxes, have created certain other problems. The non-uniformity of the rates and tax competition between different States has resulted in trade diversion and resource misallocation. (2.5.10)
6.2.21 As regards the equity of the incidence of indirect taxes, the general consensus of the different empirical studies appears to be in favour of progressivity in the indirect tax burden. (2.5.11 and 2.5.12)
6.3 Saving Performance of Public Sector Enterprises
6.3.1 The role of public enterprises has shown a phenomenal increase in India over the years in terms of their contribution to GDP, capital formation and control of key areas of economic activity. This has been occasioned not merely by the use of public enterprises as a planning instrument to achieve commanding heights of the economy but also due to the default of the private sector itself. (3.1.1 to 3.1.7)
6.3.2 However, the operation of public enterprises has led to widespread disenchantment. The prime reason is inadequate generation of savings by public enterprises and consequently, heavy drafts on household savings to finance public sector investment requirements. (3.2.1 to 3.2.4)
6.3.3 The low level of savings generation of public enterprises, in turn, has been the result of low rates of return on investments, both of the Central and State Government enterprises. The profitability of Central Government enterprises excluding the petroleum industry has been very low and many of the loss-making enterprises have been in the non-core sector. The state enterprises, with the bulk of their investments in energy and transport sectors fared even worse. Many of the undertakings failed to recover even their working expenses. (4.2.5 to 3.2.8)

Suanary 110
6.3.4 An equally important consequence of the declining efficiency of public enterprises has been the creation of a non-competitive economy. The absence of a clear-cut pricing policy combined with falling productivity, have enhanced the prices to non-competitive levels. In the core sector, this situation causes widespread price escalation by pushing up costs, creating a non-competitive economy. Even in a situation where the government is forced with the only alternative of raising administered prices or resorting to deficit financing, it is not quite obvious that the former has a distinct advantage over the latter. (3.2.9 to 3.2.14)
6.3.5 Our analysis of productivity in public enterprises reinforces the above conclusion. In the manufacturing sector of public enterprises, both capital and labour productivities have shown a declining trend in contrast to the increasing productivities in private sector over the period. The fall in labour productivity, in particular, confirms the fact of overemployment and also its increase over the period. (3.3.1 to 3.3.10)
6.3.6 Several reasons may be cited for the falling productivity ofpublic enterprises. Lack of financial stakes, severe cost overruns, low capacity utilisation, excessive wage due to overemployment, highinterest burden, improper maintenance and inadequate investments, non-professionalism and discontinuity in management are some of the important reasons.(3.3.11 to 3.3.16)
6.3.7 The substantial drawls of household savings for public sectorinvestment and consequent low savings availability to private investment, leads to the question: What should be the role of public enterprises in the future? Essentially, the answer to this depends on whether public sector crowds out the private sector. We have taken a view that this question cannot be answered in aggregate. In areas where the public sector is competitive to the private sector, there is no reason why there should be any expansion of the former, in the wake of the falling productivity. However, in areas where the two sectors are complementary, public sector has to expand its role even when the productivity has been falling. But, clearly, falling productivity will create a non-competition economy; the corollary is that gains to the economy are dependent on the gains in productivity. (3.4.1 to 3.4.4)

Sinmary 111
6.3.8 The pattern of Central government investment since 1970 hasclearly not taken this into consideration as seen by the falling proportion of core sector investments. Nevertheless, the present thinking of policy makers seems to be on similar lines. The implementation of the recommendation of the Arjun Sen Gupta Committee and the recent policy statement on administered prices should clearly set the investment priorities on the right lines. (3.4.5 to 3.4.7)
6.4 Trends in Current Expenditure
6.4.1 The low generation of savings in the public sector has been as much due to the faster rise in the current expenditure as the inadequate growth in tax revenue. (4.2.1)
6.4.2 While total public expenditure in absolute terms has grown nearly seven-fold during the last one-and-a-half decades, as a proportion to GDP it has increased only about 2.1 per cent per annum. The growth is hardly uniform. In fact, by excluding the two years 1971-72 and 1975-76, the annual grcwth rate averages to just about 0.5 per cent. Excluding transfer payments, the growth rate was around 1.7 per cent. (4.2.2 and 4.2.3)
6.4.3 Current expenditure constitutes about 70 per cent total public expenditure. Over the years the share of current expenditure in total has been going up, indicating a faster growth than the total expenditure. (4.2.4)
6.4.4 Much of the growth in current expenditure has been due to two components: interest on public debt and subsidies. The rate of growth of these components has been way ahead of the others, namely, wages and salaries and goods and services. The rise in current transfers has been modest. (4.3.1 to 4.3.4)
6.4.5 Over the study period, interest on public debt has grown a phenomenal 17-fold or by 24 per cent a year. The growth from 1980-81 onwards has been at an even higher rate of 38 per cent. Its share in current expenditure spurred from 4 to 11 per cent. (4.3.5)
6.4.6 One welcome feature has been the falling share of external debt. The abnormal rise in the interest payments on internal debt has

Sunmary 112
been largely due to the rise In the quantum of debt rather than the rise in the interest rates or the shift in the holding patterns of government securities by type of maturity period. (4.3.6 to 4.3.8)
6.4.7 In India subsidies are given for various purposes and inboth forms - direct and indirect. Data on indirect subsidies are difficult to obtain. The major direct subsidies are for food,fertiliser and export, subsidies, which account for 80 to 85 per cent.(4.3.9 to 4.3.11)
6.4.8 The phenomenal growth of the expenditure on subsidies during the last decade has been largely due to the fertiliser subsidy. The distribution pattern for different sectors also shows that over 50 per cent of the subsidies go to the agricultural sector. (4.3.12)
6.4.9 As subsidies have been imposing a heavy burden on theexchequer, a review of the related policies is called for. The Committee on Controls and Subsidies (1979) has pointed out some major drawbacks in the present system of subsidies: First, the benefits of a subsidy do not often reach the target groups.Second, taxes and leviesare imposed on subsidised commodities, thus neutralising the subsidybenefits. Third, there has been an unhealthy competitive tendency among State governments to attract industries from other States by offering subsidies. (4.3.13 to 4.3.15).
6.4.10 Among the functional categories of current expenditure, that on education, health and social services has registered a marked rise compared to that on general public services and defence. The share of defence expenditure, contrary to the general view, has been declining. In contrast, the share of agricultural and allied services has been increasing, mainly doe to subsidies.(4.4.2 to 4.4.3)
6.4.11 On the whole, the emerging pattern has been that current expenditure has been rising much faster than capital expenditure, and much of the growth in current expenditure has been due to the phenomenal rise in interest payments and subsidies. (4.5.1)
6.5 Trends in Public Debt
6.5.1 The broad trends in the financing patterns through successive Five Year Plans show that over 50 per cent of the plan expenditure
Suaaary 113
continues to be financed through public debt. (5.1.1)
6.5.2 The total outstanding liabilities of the Central and State governments together has grown nearly five-fold. (5.2.1)
6.5.3 A welcome trend has been the consistently declining trend of the external debt component. The decrease can be attributed mainly to the uncertainty in respect of the availability of external assistance, international political implications of such foreign aid, as also the slow growth in the debt-servicing capacity. (5.2.3)
6.5.4 Of the total internal debt of Central Government liabilities (which form about 85 per cent of total liabilities) a major portion is raised through market borrowings. Small savings, despite the higher yield rates and tax benefits, have not yet been able to contribute more than 14 per cent. (5.2.4)
6.5.5 Government enjoys a captive market for raising debt through dated securities and treasury bills. The holding pattern of government securities is largely governed by the monetary authorities. Commercial banks, apart from the RBI, have been the major subscribers to the market borrowing programmes. The rising share of commercial banks, however, has been effected mainly through the periodic revisions of the SLR. Over 90 per cent of the treasury bills are ultimately held by the RBI. (5.3.2 to 5.3.5)
6.5.6 Total liabilities of State Governments have increased four-fold during the study period. Unlike the Central Government liabilities, the share of market debt has not been high. The major investors in State government securities are the commercial banks (5.3.6 to 5.3.8)
6.5.7 The generally low response of voluntary subscriptions to market debt has been largely due to the low yield rates offered on government securities and treasury bills. The coupon rates have been significantly lower than the market interest rates. (5.3.10)
6.5.8 The low subscription to public debt by the commercial banks and other financial intermediaries has been forcing the RBI to hold a substantial portion of the market debt. The growth in the monetisation of debt has been much faster compared to the overall growth in public

Summary 114
debt. Currently, RBI credit accounts for roughly 30 per cent of the total debt. (5.4.1)
6.5.9 The monetisation of public debthas increased sharply from1978-79 on. The level and growth of the monetisation of public debt is stated to be the primary cause of inflation in India. (5.4.2 to 5.4.3)
6.5.10 One obvious method of curbing the monetisation of public debt is to raise yield rates on government securities in order to attract more voluntary subscriptions. The Committee to Review the Working of the Monetary System in India (1985) has also advocated an upward revision of the interest rates on government securities. Following the Committee's recommendation the LTFP also seeks to reform the interest rates. (5.5.1)
6.5.11 However, an immediate consequence of upward revision of an interest rates would be an increase in the already acute interest burden on the government budget. (5.5.2)
6.5.12 However, the long-run benefits of the ensuing price stability as a result of the gradual demonetisation of public debt can be expected to outweigh the short-run additional interest burden. Further, the price stability can be expected to obviate the need for raising the yield on a continuous basis (5.5.3 and 5.5.4)
6.5.13 The favourable consequences of the yield rate revision rest on the crucial assumption that savings are interest-elastic. Available empirical evidence in this respect in India is not conclusive.(5.5.5)
6.5.14 However, financial investments of the private sector havedemonstrated to be interest-elastic, which would mean that even if theyield rate revision entails short-run costs such as higher interestburden and 'crowding out' phenomenon, the long-run benefits of pricestability and 'crowding in' effect, in all probability, may more than compensate for the costs. (5.5.6 and 5.6.1)
6.5.15 It should be noted that demonetisation does not completelyneutralise the inflationary effects of public debt, for, creditcreation by the banking sector is also inflationary. (5.6.2)
6.5.16 This points to the imperative need to increase the internal generation of savings within the public sector. (5.6.3)

115R E F E R E N C E S
Acharya, S.N. and Associates with Contributions by R.J. Chelliah (1985) Aspects of the Black Economy in India, National Institute of Public Finance and Policy, New Delhi.
Ahluwalia, I.J. (1985), Industrial Growth in India - Stagnation since the Mid-sixties, Oxford University Press, London.
Ahmed, E. & Stem, W. (1983) 'Indirect Taxes and Prices in India: The Calculation of Effecting Tax Rates Using Input - Output Methods, University of Warwick Discussion paper No. 44 England.
Ayule, M.A., Hegstad S.D. (1986), "Public Industrial Enterprises - Determinants of Performance”, Industry & Finance, Vol.17 World Bank, Washington D.C.
Bagchi, A. (1978), 'Agricultural Holdings Tax: A Modified Scheme', Economic & Political Weekly, Vol.13, No.38, pp 1631-48.
Bagchi, A. (1982) 'Inflation and Personal Income Tax: A Note', Economic & Political Weekly, April 24 - May 1.
Bagchi, A. (1986) 'Fiscal Policy for Financing Development - The Indian Experience in Money, Banking and the Indian Economy State Bank Staff College, Hyderabad.
Bagchi, A. and Rao M.G. (1982), 'Elasticity of Non-corporate Income Tax in India' Economic and Political Weekly September 4.
Bagchi, A.K. (1982), "Public Sector Industry and Quest for Self Reliance in India”, Economic & Political Weekly, Annual Number Vol.17.
Barro, R.J. (1981), Money, Expectations, and Business Cycles, WBER Academic Press, New York.

116
Bhagavan, M.R. (1985), "Capital Goods Sector in India", Economic & Political Weekly, Vol.xx, March 9.
Bhatt, M.P. (1981) (ed.), The Role of Direct and Indirect Taxes in Underdeveloped Countries, Vishleshan: C/o Economics Dept. Trust, Gujarat University.
Bhattacharya, B.B. (1985), 'Role of Interest Rates as an Incentive for Household Saving in India, 1960-61 to 1981-82, (Mimeo) Institute of Economic Growth, Report Submitted to the Committee to Review the Working of the Monetary System in India, New Delhi.
Bhaga, H. (1983), "Public Sector: Colossus with Feet in Clay", Economic & Political Weekly, Vol.18, March 28.
Bird, R.M. and Oldman 0. (1967) (ed.), Readings on Taxation inDeveloping Countries, The Johns Hopkins Press, Baltimore (1967).
Buchanan, J.M., Principles of Public Debt Irwin R.D. (incorporated) - Illinois, USA, (1958).
Central Statistical Organisation, National Account Statistics, Government of India, New Delhi. Various Issues.
Central Statistical Organisation (1983), Transaction of the Public Sector, Government of India, New Delhi.
Chakravarty, S., Honavar, R.M., Dandekar, V.M., Bagchi, A., Brahmananda, P.R., Rangarajan, C., Adiseshiah, M., (1986), Monetary Policy, Review of the Sukhamoy Chakravarty Report, India International Centre Monograph Service, New Delhi.
Chattopadhyaya, P. (1986), 'National Subsidy Fund' Commerce May 17, pp.966-8.
Chaudhury, U.D.R. (1977), Industrial Breakdown of Capital Stock in India, The Journal of Income & Wealth, Vol.l, No.2.

117Chawla, O.P., Personal Taxation in India, Somaiya Publication: Bombay
(1972).
Chawla, O.P. (1975), Union Excise Duties as a Tool of Economic Policy, Centre for Policy Research (Mimeo), New Delhi.
Chelliah, R.J., Fiscal Policy in Underdeveloped Countries, George Allen and Unwin Ltd., London (1969).
Chelliah, R.J. (1971), Trends in Taxation in Developing Countries, IMF Staff Papers, Vol.18.
Chelliah, R.J. and Lai R.N., Incidence of Indirect Taxation in India 1973-74), National Institute of Public Finance & Policy, New Delhi.
Chelliah, R.J. (1986), 'Changes in Tax Revenue Structure - A Case Study of India', Paper presented at International Institute of Public Finance, 42 Congress at Athens.
Chona, J.M., "Expenditure of the Central Government: Some Issues" (1980) Economic and Political Weekly, Vol.xv, No.27, pp.1144-52.
Cutt, J., Taxation and Economic Development in India, New York, Frederick A. Praeger, 1969.
Dholakia, B. (1978), "Relative Performance of Public and Private Manufacturing Enterprises in India - Total Factor Productivity Approach” Economic & Political Weekly, Vol.13, Feb.25.
Due, J.F., Indirect Taxation in Developing Economies: The Role and Structure of Customs Duties, Excise, and Sales Taxes, Johns Hopkins Press, Baltimore.
Dwivedi, D.N. (ed.), Readings in Indian Public Finance, ChanakyaPublications, Delhi.
Gandhi, V.P., Some Aspects of Indian Tax Structure: An Economic Analysis, Vora 4/0. Publishers (P) Ltd., Bombay (1972).
Government of India (1972), Report of the Committee on TaxationAgricultural Wealth and Income, New Delhi.
Government of India (1979), Report of the Committee on Controls andSubsidies, (Ch. V. Dagli), Ministry of Finance, New Delhi.
Government of India (1977), Report of the Indirect Taxation EnquiryCommittee, (Ch. L.K. Jha), Ministry of Finance, New Delhi.

118
Government of India (1982), Report of the Rajadhyaksha Committee on Power, New Delhi.
Government of India (1985), Report of the Committee to Examine the Principles of a Possible Shift from Physical to Financial Controls, (Ch. Narasimhan), New Delhi.
Government of India (1984), Report of the Eighth Finance Commission, New Delhi.
Government of India (1985), Long Term Fiscal Policy, Ministry of Finance, Dept, of Economic Affairs, New Delhi.
Government of India (1986), Report of the Committee to Review Policy for Public Enterprises, (Ch. Sengupta, A.).
Govinda Rao, M. & Tulasidhar V.B. (1986), 'Economic Analysis of Sales Taxation in India', NIPFP Working Paper 17/86, New Delhi.
Govinda Rao, M. & Pradhan, G. (1986), 'Excise Duty Evasion on Cotton Textile Fabrics', NIPFP Working Paper 15/86 February, New Delhi.
Gupta, K.L. 'Household Savings in Financial Assets - A Case Study of India Indian Economic Journal, April/June 1970.
Gupta, K.L. 'Personal Saving in Developing Nations: Further Evidence' Economic Record, June 1970, 46.
Gupta, K.L. (1984), Finance & Economic Growth in Developing Countries, Groom Helm, London.
Gupta, M. (1982), "Productivity Performance of the Public & Private Sector in India. A Case of the Fertiliser Industry"Indian Economic Review, Vol.17.
Henrichs, H.H. (1966), A General Theory of Tax Structure Change During Economic Development, Massachusetts.
Jain, A.K., Taxation of Income in India: An Empirical Study Since 1939 Macmillan - Delhi.
Jain, U., 'Place of Excise Duties in Union Budget' (pp.71-81) in Subramanaya, K.N., and Sreehantaradhya, B.S. (ed.), Taxation and Centre State Financial Relations, Deep 4 Deep New Delhi.
James, L.P. (1982), Public Enterprises in Less Developed Countries, Cambridge University Press, London.

119
Kapoor, J.L. and Khera, R.N. (1977), "Estimates of Wealth in the Private Sector", The Journal of Income & Wealth, Vol.l, No.2.
Krishnamurthy, K. (1968), "Saving and Taxation in Developing Countries: An Empirical Study", IBRD Working Paper No.23, August 28.
Krishnamurthy, K. (1984), "Inflation and Growth: A Model for India 1961-1980", Indian Economic Review, Vol.19.
Lakdawala, D.T., and Nambiar, K.V. (1972), Commodity Taxation in India, Sardar Patel Institute of Economic & Social Research, Ahmedabad.
Lall, V.D., Madhur, S. and Atri K.K. (1982), Resource Mobilisation in the Private Corporate Sector, NIPFP, New Delhi.
Lewis, W.A., Theory of Economic Growth, Allen & Unwin, London (1967).
Madhur, S. (1986), 'Fiscal Policy in India: Recent Trends and Their Macro Implication', NIPFP, Working Paper, New Delhi.
Madhur, S. (1985) 'Income Taxation and Household Savings: Evidence from a Developing Economy', NIPFP Working Paper 4/85, New Delhi.
Mathew, E.T., Agricultural Taxation and Economic Development in India, Asia Publishing House, Bombay, (1968).
Majumdar, T. (1977), Public Enterprises Policy as Investment, Prices and Refunds.
Mathew, T., Tax Policy: Some Aspects of Theory and Indian Experience, Kalyani Publishers - Delhi, Ludhiana.
Musgrave, R.A., Fiscal Systems, Yale University Press, London, (1969).
Nambiar, K.V., and Rao, M.G. (1972), 'Tax Performance of States', Economic and Political Weekly, (May 20th).
Nayak, P.B., and Atri, K.K. (1977), Trends Composition and Elasticity of Union Excise and Import Duties, NIPFP (Mimeo), New Delhi.
Panchamukhi, V.R. (1983), Subsidies: Some Reflections, paper prepared for the Sub-group as Budgetary Savings, Ministry of Finance, Government of India, New Delhi.
Patnaik, P. (1986), 'Public Debt as a Mode of Financing Public Expenditures', Economic & Political Weekly, Vol.21 No.35 August, pp.1545-52.
Patnaik, P., and Rao, S.K. (1977), "1975-76: Beginning of the End of Stagnation?" Social Scientist.

120
Pendharkar, V.G. (1986), Government Indebtedness: The Growing Today, Commerce, August 23, pp.359-63.
Planning Commission (1985), The Seventh Five Year Plan Vol. I,Government of India, New Delhi.
Please, S., "Saving Through Taxation Reality or Mirage?" Fund and Bank Review: Finance and Development, (March, 1957).
Purohit, M.C. (1975), Sales Tax in India, S. Chand, New Delhi.
Purohit, M.C. (1978), 'Buoyancy and Income Elasticity of State Taxes inIndia', Artha Vijnana, September, pp.244-87.
Purohit, M.C. (1982), 'Structure of Sales Taxes in India', Economic & Political Weekly, August 21.
Raj, K.N. (1985), "New Economic Policy", V.T. Krishnamachari Memorial Lecture Delivered at the Institute of Economic Growth,November 20.
Rakshit, M. (1986), 'A Primer as Budgetary Policy or How to Get Rid Money Illusion', Economic & Political Weekly, Vol.21, No.15, April 12, pp.645-650.
Rangarajan, C. (1982), "Industrial Growth: Another Look", Economic & Political Weekly, Annual Numbers.
Rao, V.K.R.U., 'Rationalisation of Indirect Taxes: Critique of the Jha Committee Findings in Subrahmanya K.N., and Sreekantaradhya, B.S. (ed.), Taxation and Centre State Financial Relations, Deep & Deep, New Delhi, pp.63-70.
Rao, V.G. and Rao, K.S.H., 'The Income Tax and Corporate Debt Policy', Indian Economic Review, (Vol.x, April 1975).
Reddy, K.N., Sarma, J.V.M., and Sinha, N. (1984), Central Government Expenditure Growth Structure and Impact, (1950-51), NIPFP, New Delhi.
Reserve Bank of India (1985), Report of the Committee to Review the Working of the Monetary System, Bombay.
Reserve Bank of India, Report on the Currency and Finance, Various Issues.
Rubin, B.R. (1986), 'Financing Gross Capital Formation in Indian Public Sector' Economic & Political Weekly, Vol.213, 44, 45, pp.1943-50.

121
Sahofa, G.S. (1961), Indian Tax Structure and Economic Development, Asia Publishing House, New Delhi.
Sarma A. and Tulasidhar V.B., "Sectoral Impact of the Union Government Expenditure”, Vol.XII, Conf. on IARNIW, Bangalore.
Sarma, J.V.M. (1986), 'Investment Allowance and Private Corporate Investment in India', NIPFP Working Paper No.22, New Delhi.
Sarma, J.V.M, and Sondhi, H.K. (1987), Investment Allowance: A Review NIPFP, New Delhi.
Sastry, K.V.S., Public Debt and Economic Development in India, Sterling Publishers, New Delhi, (1972).
Sen, P.K., Deficit Financing and Development Planning, Criterion Publication, New Delhi.
Sen, T.K. (1983), 'Forecasting Major Subsidies of the Central Government', NIPFP, New Delhi.
Sengupta, R. (1980), "Prices and Profits in a Public Sector Steel Industry", Economic & Political Weekly, Annual Number.
Shankar, T.L., and Sarma, J.S. (1986), 'An Analysis of the State Level Public Enterprises: Performance and Perspectives”,Indo-French Seminar on the Role and Management of Public Sector, January 27-29, New Delhi.
Sheahan, J.B. (1976), "Public Enterprise in Developing Countries" in Stepherd W.G. (ed.) Public Enterprises: Economic Analysis of Theory and Practice, Lexington Books,D.C. Health and Co.
Sreekantaradhya, B.S., 'Taxation and Resource Mobilisation in India' in Subrahmanya K.N. and Sreekantaradhya B.S. (ed.), Taxation and Centre State Financial Relations, Deep and Deep Publications, New Delhi, pp. 25-38.
Sreekantaradhya, B.S., (Dr.) Public Debt and Economic Development in India, Sterling Publishers, New Delhi, (1982)
Subramanyan, G. and Rao, B.R. (1983), 'Restructuring of Direct Taxes', pp.57-62 in Subrahmanya, K.N. and Sreekantaradhya, B.S. (ed), Taxation and Centre State Financial Relations, Deep and Deep, New Delhi.
Subramanyan, G. and Rao, B.R. (1983), 'Taxation for Economic Development' in Subrahmanya, K.N., Sreekantaradhyaya, B.S. (ed.), Taxation and Centre State Financial Relations, Deep and Deep Publications, New Delhi, pp. 19-24.
122
Sundararajan, V. and Thakur, S. (1982), "Public Investment Crowding out and growth: A Dynamic Model Applied to India and Korea", IMF Staff Papers, December.
Thimmiah, G. (1978), Studies in Indian Public Finance, Kalyani Publishers, New Delhi.
Toye, J. (1981), Public Expenditure and Indian Development Policy 1960-1970, Cambridge University Press, Cambridge.