Draft Environmental Impact Statement, United States Postal ...
168
Draft Environmental Impact Statement United States Postal Service Next Generation Delivery Vehicle Acquisitions August 2021 United States Postal Service Environmental Affairs and Corporate Sustainability Environmental Compliance and Risk Management 475 L'Enfant Plaza SW Washington DC 20260-4201
Transcript of Draft Environmental Impact Statement, United States Postal ...

Draft
Environmental Impact Statement
United States Postal Service
Next Generation Delivery Vehicle
Acquisitions
August 2021
United States Postal Service
Environmental Affairs and Corporate Sustainability
Environmental Compliance and Risk Management
475 L'Enfant Plaza SW Washington DC 20260-4201

United States Postal Service Draft Environmental Impact Statement Environmental Compliance and Risk Management
i August 2021
Cover Sheet
Responsible Agency: U.S. Postal Service
Title: Draft Environmental Impact Statement for Purchase of Next Generation Delivery Vehicles
Contact: Mr. Davon Collins, Environmental Counsel, United States Postal Service, 475 L’Enfant Plaza SW, Washington, DC 20260-6201, [email protected]
Draft Environmental Impact Statement
Abstract: This Draft Environmental Impact Statement (DEIS) analyzes the environmental impacts of a range of alternatives for the proposed purchase over ten years of 50,000 to 165,000 delivery vehicles to replace the same number of existing delivery vehicles. This DEIS was prepared pursuant to the requirements of the National Environmental Policy Act of 1969 (NEPA), its implementing procedures at 39 CFR 775, and the President’s Council on Environmental Quality Regulations (40 CFR parts 1500-1508), to evaluate the environmental impacts of the proposed purpose-built Next Generation Delivery Vehicle (NGDV) alternative versus commercial-off-the-shelf (COTS) vehicle alternatives and a “No Action” alternative.
Timing of Agency Action: Comments must be received no later than 45 days from the date of publication in the Federal Register.
Summary: The U.S. Postal Service proposes to purchase over ten years 50,000 to 165,000 purpose-built, right-hand-drive (RHD) vehicles – the NGDV – to replace existing delivery vehicles nationwide that are approaching the end of their service life. While the Postal Service has not yet determined the precise mix of powertrains, under the Proposed Action, at least 10 percent of the new vehicles would have battery electric (BEV) powertrains with the remainder being internal combustion engine (ICE). In this DEIS, the Proposed Action is compared against Alternative 1.1 (100 percent RHD COTS ICE vehicles, Alternative 1.2 (100 percent left-hand-drive COTS BEVs), and the No Action Alternative.
In terms of potential environmental impacts, the Proposed Action, and Alternatives 1.1 and 1.2 would result in beneficial impacts on transportation safety, traffic noise, air pollutant and greenhouse gas emissions, community emergency services, and fuel (gasoline) consumption. The Proposed Action and Alternatives 1.1 and 1.2 would also result in no to negligible impact on economics, employment, environmental justice, traffic, accessibility, parking, public transportation, noise, community utility services, utility availability and demand capacity, energy consumption, and solid and hazardous waste treatment and disposal.
The Proposed Action is the preferred alternative because it fully meets the Purpose and Need by providing a purpose-built RHD vehicle capable of meeting performance, safety, and ergonomic requirements for efficient carrier deliveries to businesses and curb-line residential mailboxes over the entire nationwide system. Moreover, the Proposed Action is the most achievable given the Postal Service’s financial condition as the BEV NGDV has a significantly higher total cost of ownership than the ICE NGDV, which is why the Proposed Action does not commit to more than 10 percent BEVs.
The COTS Alternatives 1.1 and 1.2 would not meet the Postal Service’s Purpose and Need as neither would provide the same operational or ergonomic benefits as the purpose-built NGDV. Finally, the No-Action Alternative, in addition to having the highest potential environmental impacts of all the alternatives, would not satisfy the Purpose and Need as aged and end-of-life delivery vehicles with outdated safety features and poor performance characteristics would not be replaced leaving the Postal Service unable to fulfill its primary mission to deliver the nation’s mail.

United States Postal Service Draft Environmental Impact Statement Environmental Compliance and Risk Management
ii August 2021
EXECUTIVE SUMMARY
This Environmental Impact Statement (EIS) assesses the existing environmental conditions and potential impacts of the proposed delivery vehicle replacement of existing aged and end-of-life vehicles for the Postal Service. The Postal Service proposes to purchase and deploy over a ten-year period 50,000 to 165,000 vehicles to replace, nationwide and on a one-to-one basis, existing delivery vehicles that are approaching the end of their service life. These replacement delivery vehicles would be purpose-built, right-hand drive (RHD) Next Generation Delivery Vehicles (NGDV) or commercial-off-the-shelf (COTS) vehicles. While the Postal Service has not yet determined the precise mix of the powertrains in the new vehicles to be purchased, the Postal Service proposes that the new vehicles consist of a mix of internal combustion engine (ICE) vehicles and battery electric vehicle (BEV) powertrains, with at least 10 percent BEVs. The actual timeline and quantities of NGDV or COTS vehicles purchased, and delivery vehicle types replaced, would be contingent upon the supplier’s production and delivery capabilities and the Postal Service’s operational needs, including individual carrier route needs, and the Postal Service’s financial position.
Purpose and Need (Section 2): The purpose of the Proposed Action is to purchase and deploy purpose-built NGDV to replace the end-of-life and high-maintenance delivery long-life vehicles (LLVs) and flexible fuel vehicles (FFVs) with new vehicles that have more energy-efficient powertrains, updated technology, reduced emissions, increased cargo capacity and improved loading characteristics, improved ergonomics and carrier safety, and reduced maintenance costs. The timing, type, and number of new NGDV vehicles and their deployment are based on the best available current information for preparation of this EIS.
The current outdated delivery vehicles, many as much as 32 years in operation, are inefficient, increasingly unreliable, costly to maintain, and lack certain modern safety and operational features needed for mail carriers. The Postal Service plans to deploy a new generation of RHD vehicles that incorporates the latest advancements in automotive technologies and better serves operations, employees, and customers. Given the mail mix changes that have occurred and additional package growth expected as e-commerce sales continue to rise, new delivery vehicles would need a larger cargo area that also allows easier retrieval of packages than existing, outdated RHD vehicles. The Proposed Action is needed to replace these outdated delivery vehicles to improve safety and ergonomics for Postal Service carriers and to enable the Postal Service to meet its Congressional mandate to maintain efficient nationwide delivery of the mail and to provide prompt, reliable, and efficient services to patrons.
Alternatives Evaluated (Section 3): This EIS analyzes two NGDV Hypothetical Maximum scenarios and two COTS vehicle alternatives along with the No-Action Alternative to consider the full potential range of potential environmental impacts:
▪ Proposed Action Hypothetical Maximum scenario (Purchase and Deployment of 90 Percent ICE NGDV and 10 Percent BEV NGDV),
▪ Proposed Action Hypothetical Maximum scenario (Purchase and Deployment of 100 Percent BEV NGDV),
▪ Alternative 1.1 (Purchase and Deployment of 100 Percent RHD COTS ICE Vehicles), and ▪ Alternative 1.2 (Purchase and Deployment of 100 Percent Left-Hand Drive [LHD]
COTS BEVs).
Environmental Consequences (Section 4): The Proposed Action scenarios and Alternative 1.1 would result in beneficial impacts on transportation safety, traffic noise, air pollutant and GHG
United States Postal Service Draft Environmental Impact Statement Environmental Compliance and Risk Management
iii August 2021
emissions, community emergency services, and fuel (gasoline) consumption. Alternative 1.2 would result in beneficial impacts on transportation safety, traffic noise, air pollutant and GHG emissions, community emergency services, but result in higher fuel consumption compared to that of the replaced vehicles. The 100 percent BEV NGDV and COTS BEV scenarios would provide greater benefit on traffic noise reduction than would the ICE NGDV and COTS ICE scenarios, since BEVs are quieter than ICE vehicles at low speeds. Additionally, the 100 percent BEV NGDV and COTS BEV scenarios would require less lubricants, oils, and greases compared to existing ICE vehicles. BEVs would have operational constraints for more than 12,500 delivery routes, and spent BEV batteries would be an additional source of hazardous waste. While much of this material would be reclaimed or recycled, BEV battery recycling methods in the U.S. are currently limited and vary in recovery capabilities.
The Proposed Action scenarios and Alternatives 1.1 and 1.2 would result in no to negligible impact on economics, employment, environmental justice, traffic, accessibility, parking, public transportation, engine noise from ICE vehicle operation, community utility services, utility availability and demand capacity, energy consumption, and solid and hazardous waste treatment and disposal.
The No-Action Alternative would not satisfy the Purpose and Need for the purchase of new delivery vehicles to replace aged delivery vehicles with outdated safety features and poor performance characteristics. Impacts would remain unchanged, and the benefits from replacing end-of-life delivery vehicles with modern vehicles would not be realized.
Cumulative Impacts (Section 5): Impacts from the Proposed Action NGDV Hypothetical Maximum and Alternative 1.1 and 1.2 scenarios would not have the potential for significant adverse cumulative impacts on nationwide environmental resources when considered in combination with other actions nationwide. Because existing delivery vehicles would be replaced with newer delivery vehicles, impacts on environmental resources generally are expected to be less than current impacts, including the No-Action Alternative. Therefore, the Proposed Action and Alternatives 1.1 and 1.2 scenarios would not result in a significant adverse cumulative impact on nationwide environmental resources.
Mitigation (Section 6): Implementation of the Proposed Action NGDV Hypothetical Maximum or Alternative 1.1 and 1.2 scenarios would serve to mitigate the existing impacts on environmental resources from the No-Action Alternative (continued operation of the high-maintenance and end-of-life delivery vehicles). No further mitigation measures would be necessary.
Preferred Alternative (Section 4-11.2): Presently, the Postal Service’s preferred alternative is the Proposed Action - to purchase and deploy up to 90 percent ICE NGDV with at least 10 percent BEV NGDV. This Preferred Alternative provides a purpose-built RHD vehicle that would meet the Postal Service’s Purpose and Need by providing the performance, safety, and ergonomic requirements for efficient Postal Service carrier deliveries to businesses and curb-line residential mailboxes over the entire nationwide system. This Preferred Alternative is also the most achievable given the Postal Service’s financial condition, as the ICE NGDV is significantly less expensive than the BEV NGDV and does not have the same operational constraints the BEV vehicles have for more than 12,500 delivery routes. Finally, the 90 percent ICE NGDV Preferred Alternative would result in less fuel consumption and reduced direct and indirect greenhouse gas emissions as compared to the existing delivery vehicles being replaced.
Although the BEV NGDV alternative would result in about 200 percent fewer direct and indirect greenhouse gas emissions than the 90 percent ICE NGDV Preferred Alternative, committing to purchase more than 10 percent BEV NGDV as part of the Preferred Alternative would not meet the Postal Service’s Purpose and Need for the following reasons. Operational constraints would prec lude the BEV NGDV deployment for more than 12,500 delivery routes because of environmental conditions.
United States Postal Service Draft Environmental Impact Statement Environmental Compliance and Risk Management
iv August 2021
Alternative 1.1, to purchase and deploy 100 percent RHD COTS ICE vehicles, would also not meet the Postal Service’s Purpose and Need. While RHD COTS ICE vehicles would have some of the modern safety and customized operational features available in the NGDV, the interior layout doors, and window arrangements are not optimized or ergonomically designed for postal operations nor for delivery to curb-line mailboxes.
COTS ICE vehicles would not provide the same operational or ergonomic benefits as the purpose-built NGDV. For example, they would not have body components designed for frequent and repetitive use, leading to expected higher maintenance and repair costs than the NGDV, and would have body components that need to be replaced more frequently than those purpose-built for the NGDV. In addition, this alternative would result in higher fuel consumption compared to that of the replaced vehicles, and higher than the ICE NGDV Preferred Alternative.
Alternative 1.2, to purchase and deploy 100 percent LHD COTS BEVs, also would not meet the Postal Service’s Purpose and Need, as the COTS BEVs would have operational constraints that would not allow deployment of BEVs for more than 12,500 delivery routes. Also, being LHD, the COTS BEVs would not support curb-line deliveries. Although the COTS BEV market and technology is rapidly evolving, LHD BEVs are still in development and currently available only in small quantities. RHD COTS BEVs are not currently available or otherwise marketed by commercial manufacturers for future development.
The No-Action Alternative, or status quo, would not meet the Postal Service's Purpose and Need. It would not provide any replacement vehicles for accident-damaged, high-maintenance, and end-of-life delivery vehicles. It would not meet the Purpose and Need to provide more energy-efficient vehicles, updated technology, increased cargo capacity and improved loading characteristics, improved ergonomics and carrier safety, and reduced maintenance costs. Further, it would result in higher fuel (gasoline) usage than both the Proposed Action Hypothetical Maximum scenarios and Alternative 1.2, and greater air emissions than the Proposed Action and Alternative 1.1 and 1.2 scenarios.
Compliance Statement: This EIS has been developed in compliance with NEPA; the regulations implementing the National Environmental Policy Act (NEPA [Title 40 Code of Federal Regulations [CFR] Parts 1500–1508]); and the Postal Service’s regulations for NEPA compliance set forth at 39 CFR Part 775.

United States Postal Service Draft Environmental Impact Statement Environmental Compliance and Risk Management
v August 2021
TABLE OF CONTENTS
EXECUTIVE SUMMARY ..................................................................................................................... ii
1 INTRODUCTION ......................................................................................................................... 1-1
1-1 National Environmental Policy Act Regulatory Background ................................................ 1-1 1-2 Postal Service Delivery Fleet Management Evaluation and Decision-Making Process ....... 1-1 1-3 Overall Vehicle Acquisition Strategy ................................................................................... 1-1
1-3.1 COTS & Purpose-Built Vehicles .............................................................................. 1-1 1-3.2 NGDV Acquisition Strategy ..................................................................................... 1-2
1-3.2.1 NGDV Request for Information, Prototype Development, and Evaluation .. 1-2 1-3.2.2 Selection and Description of Production NGDV ......................................... 1-3 1-3.2.3 Production Expectations ............................................................................ 1-4
1-3.3 Limits of Environmental Impact Assessment ........................................................... 1-5 1-3.4 Actions Not Included in the Proposed Action ........................................................... 1-5
1-4 Public and Stakeholder Involvement .................................................................................. 1-5
2 Purpose of the Proposed Action ............................................................................................... 2-1
2-1 Need for the Action ............................................................................................................ 2-1
3 DESCRIPTION OF PROPOSED ACTION AND ALTERNATIVES .............................................. 3-1
3-1 Proposed Action – Purchase and Deployment of up to 165,000 NGDV .............................. 3-1 3-1.1 NGDV Powertrains Available ................................................................................... 3-1 3-1.2 NGDV Maintenance and Support ............................................................................ 3-2 3-1.3 NGDV Powertrain Mix ............................................................................................. 3-4
3-1.3.1 Purchase and Deployment of 90% ICE NGDV and 10% BEV NGDV ........ 3-4 3-1.3.2 Purchase and Deployment of 100% BEV NGDV ....................................... 3-4
3-2 Alternative 1 – Purchase and Deployment of up to 165,000 COTS Vehicles ...................... 3-4 3-2.1 COTS Vehicle Maintenance and Support ................................................................ 3-5 3-2.2 COTS Vehicle Powertrain Mix ................................................................................. 3-5
3-2.2.1 Alternative 1.1 - Purchase and Deployment of 100% RHD COTS ICE Vehicles..................................................................................................... 3-5
3-2.2.2 Alternative 1.2 - Purchase and Deployment of 100% LHD COTS BEVs .... 3-6 3-3 No-Action Alternative ......................................................................................................... 3-7 3-4 Alternatives Considered but not Analyzed in Detail ............................................................ 3-7
3-4.1 Leasing and Deployment of up to 165,000 Vehicles ................................................ 3-7 3-5 Resource Areas Affected ................................................................................................... 3-8
4 AFFECTED ENVIRONMENT AND ENVIRONMENTAL CONSEQUENCES ............................... 4-1
4-1 Introduction ........................................................................................................................ 4-1 4-1.1 Existing Vehicle Fleet .............................................................................................. 4-2
4-1.1.1 Delivery Vehicle Performance ................................................................... 4-2 4-1.1.2 Safety and Carrier Conditions .................................................................... 4-2 4-1.1.3 Vehicle Life Expectancy ............................................................................ 4-2 4-1.1.4 Maintenance .............................................................................................. 4-3 4-1.1.5 Changing Mail Characteristics ................................................................... 4-3
4-1.2 Existing Postal Service Facilities ............................................................................. 4-3 4-1.3 Existing Workforce .................................................................................................. 4-4
4-2 Resources Not Studied in Detail......................................................................................... 4-4 4-3 Socioeconomics ................................................................................................................. 4-5
4-3.1 Socioeconomics – Background and Regulatory Setting .......................................... 4-5 4-3.2 Socioeconomics – Affected Environment ................................................................ 4-5

United States Postal Service Draft Environmental Impact Statement Environmental Compliance and Risk Management
vi August 2021
4-3.2.1 Community Economics .............................................................................. 4-5 4-3.2.2 Employment .............................................................................................. 4-6 4-3.2.3 Minority and Low-Income Populations ....................................................... 4-6
4-3.3 Socioeconomics – Environmental Consequences ................................................... 4-7 4-3.3.1 Proposed Action and Alternatives 1.1 and 1.2 ........................................... 4-7 4-3.3.2 No-Action Alternative ................................................................................. 4-9
4-4 Transportation .................................................................................................................... 4-9 4-4.1 Transportation – Background and Regulatory Setting ............................................. 4-9 4-4.2 Transportation – Affected Environment ................................................................... 4-9
4-4.2.1 Overview of the Postal Service Transportation Network .......................... 4-10 4-4.2.2 Traffic ...................................................................................................... 4-10 4-4.2.3 Safety, Accessibility, and Parking ............................................................ 4-10 4-4.2.4 Public Transportation............................................................................... 4-10
4-4.3 Transportation – Environmental Consequences .................................................... 4-11 4-4.3.1 Proposed Action ...................................................................................... 4-11 4-4.3.2 Alternative 1.1 – 100% RHD COTS ICE Vehicles .................................... 4-11 4-4.3.3 Alternative 1.2 – 100% LHD COTS BEVs ................................................ 4-12 4-4.3.4 No-Action Alternative ............................................................................... 4-12
4-5 Noise................................................................................................................................ 4-13 4-5.1 Noise – Background and Regulatory Setting ......................................................... 4-13 4-5.2 Noise – Affected Environment ............................................................................... 4-13 4-5.3 Noise – Environmental Consequences .................................................................. 4-14
4-5.3.1 Proposed Action ...................................................................................... 4-14 4-5.3.2 Alternatives 1.1 and 1.2 – COTS Vehicles ............................................... 4-14 4-5.3.3 No-Action Alternative ............................................................................... 4-14
4-6 Air Quality ........................................................................................................................ 4-14 4-6.1 Air Quality – Background and Regulatory Setting .................................................. 4-14
4-6.1.1 Clean Air Act and National Ambient Air Quality Standards ...................... 4-14 4-6.1.2 General Conformity ................................................................................. 4-15 4-6.1.3 Greenhouse Gas ..................................................................................... 4-15 4-6.1.4 Social Cost of Greenhouse Gas (Carbon) ............................................... 4-15
4-6.2 Air Quality – Affected Environment ........................................................................ 4-16 4-6.2.1 Air Emissions .......................................................................................... 4-16 4-6.2.2 General Conformity ................................................................................. 4-16 4-6.2.3 Greenhouse Gas ..................................................................................... 4-16
4-6.3 Air Quality – Environmental Consequences .......................................................... 4-17 4-6.3.1 Analysis Methodology.............................................................................. 4-17 4-6.3.2 Proposed Action – 90% ICE NGDV with at least 10% BEV NGDV .......... 4-18 4-6.3.3 Proposed Action – 100% BEV NGDV ...................................................... 4-20 4-6.3.4 Alternative 1.1 – 100% RHD COTS ICE Vehicles .................................... 4-22 4-6.3.5 Alternative 1.2 – 100% LHD COTS BEVs ................................................ 4-25 4-6.3.6 No-Action Alternative ............................................................................... 4-27
4-7 Community Services ........................................................................................................ 4-28 4-7.1 Community Services – Background Information and Regulatory Setting ............... 4-28 4-7.2 Community Services – Affected Environment ........................................................ 4-28 4-7.3 Community Services – Environmental Consequences .......................................... 4-28
4-8 Utilities and Infrastructure................................................................................................. 4-29 4-8.1 Utilities and Infrastructure – Background and Regulatory Setting .......................... 4-29 4-8.2 Utilities and Infrastructure – Affected Environment ................................................ 4-29 4-8.3 Utilities and Infrastructure – Environmental Consequences ................................... 4-29
4-8.3.1 Proposed Action ICE Hypothetical Maximum and Alternative 1.1 ............ 4-29

United States Postal Service Draft Environmental Impact Statement Environmental Compliance and Risk Management
vii August 2021
4-8.3.2 Proposed Action BEV Hypothetical Maximum and Alternative 1.2 ........... 4-29 4-8.3.3 No Action Alternative ............................................................................... 4-30
4-9 Energy Requirements and Conservation .......................................................................... 4-31 4-9.1 Energy Requirements and Conservation – Background and Regulatory Setting ... 4-31 4-9.2 Energy Requirements and Conservation – Affected Environment ......................... 4-31 4-9.3 Energy Requirements and Conservation – Environmental Consequences ............ 4-31
4-9.3.1 Proposed Action – ICE NGDV Hypothetical Maximum ............................ 4-31 4-9.3.2 Proposed Action – NGDV BEV Hypothetical Maximum ........................... 4-32 4-9.3.3 Alternative 1.1 – 100% RHD COTS ICE Vehicles .................................... 4-32 4-9.3.4 Alternative 1.2 – 100% LHD COTS BEVs ................................................ 4-33 4-9.3.5 No-Action Alternative ............................................................................... 4-33
4-10 Solid and Hazardous Materials and Wastes ..................................................................... 4-34 4-10.1 Solid and Hazardous Materials and Wastes – Background and Affected Environment
……………………………………………………………………………………4-34 4-10.2 Solid and Hazardous Materials and Waste – Environmental Consequences ......... 4-35
4-10.2.1 Proposed Action and Alternatives 1.1 and 1.2 ......................................... 4-35 4-10.2.2 No-Action Alternative ............................................................................... 4-35
4-11 Summary of Potential Environmental Impacts .................................................................. 4-35 4-11.1 Comparison of Potential Impacts for Alternatives .................................................. 4-36 4-11.2 Selection of Preferred Alternative .......................................................................... 4-36
5 OTHER IMPACTS ....................................................................................................................... 5-1
5-1 Unavoidable Adverse Impacts ............................................................................................ 5-1 5-1.1 Proposed Action – ICE NGDV Hypothetical Maximum ............................................ 5-1 5-1.2 Proposed Action – NGDV BEV Hypothetical Maximum ........................................... 5-2 5-1.3 Alternative 1.1 – 100% RHD COTS ICE Vehicles .................................................... 5-2 5-1.4 Alternative 1.2 – 100% LHD COTS BEVs ................................................................ 5-3
5-2 Irreversible and Irretrievable Commitments of Resources .................................................. 5-4 5-2.1 Proposed Action ...................................................................................................... 5-4 5-2.2 Alternative 1.1 – 100% RHD COTS ICE Vehicles .................................................... 5-4 5-2.3 Alternative 1.2 - 100% LHD COTS BEVs ................................................................ 5-5
6 CUMULATIVE IMPACTS............................................................................................................. 6-1
6-1 Introduction ........................................................................................................................ 6-1 6-2 Geographic Extent and Time Frame................................................................................... 6-1 6-3 Past, Present, and Reasonably Foreseeable Projects and Actions Considered ................. 6-1 6-4 Discussion of Potential Cumulative Impacts ....................................................................... 6-2
6-4.1 Resources Not Studied in Detail .............................................................................. 6-2 6-4.2 Socioeconomics ...................................................................................................... 6-2 6-4.3 Transportation ......................................................................................................... 6-2 6-4.4 Noise Environment .................................................................................................. 6-3 6-4.5 Air Quality ............................................................................................................... 6-3 6-4.6 Community Services ............................................................................................... 6-3 6-4.7 Utilities and Infrastructure ........................................................................................ 6-4 6-4.8 Energy Requirements and Conservation ................................................................. 6-4 6-4.9 Solid and Hazardous Materials and Waste .............................................................. 6-4 6-4.10 Conclusion .............................................................................................................. 6-5
7 MITIGATION MEASURES ........................................................................................................... 7-1
7-1 Introduction ........................................................................................................................ 7-1 7-2 Overview of Impacts ........................................................................................................... 7-1 7-3 Mitigation Measures ........................................................................................................... 7-1

United States Postal Service Draft Environmental Impact Statement Environmental Compliance and Risk Management
viii August 2021
7-4 Conclusion ......................................................................................................................... 7-1
8 REFERENCES ............................................................................................................................ 8-1
9 LIST OF PREPARERS ................................................................................................................ 9-1

United States Postal Service Draft Environmental Impact Statement Environmental Compliance and Risk Management
ix August 2021
LIST OF TABLES
Table 3-1.1 20-Year Cumulative Estimated Total Costs for NGDV Powertrains ................................................... 3-1
Table 3-1.2 ICE NGDV Specifications ................................................................................................................. 3-2
Table 3-1.3 BEV NGDV Specifications ................................................................................................................ 3-2
Table 3-2.1 RHD COTS ICE Vehicle Specifications............................................................................................. 3-6
Table 3-2.2 LHD COTS BEV Specifications ........................................................................................................ 3-7
Table 4-3.1 2020 Key Postal Service Statistics .................................................................................................... 4-6
Table 4-3.2 Racial Composition and Poverty Status of the United States, 2017 - 2019 ....................................... 4-7
Table 4-6.1 Net Air Emission Changes from Nationwide Action (90% ICE NGDV and 10% BEV NGDV) Calculated Based on MOVES Model ................................................................................................................ 4-18
Table 4-6.2 Net Aggregated (Direct and Indirect) Air Emission Changes (90% ICE NGDV and 10% BEV NGDV) Calculated Based on MOVES, eGRID, and GREET Models ........................................................... 4-19
Table 4-6.3 Calculated Social Cost of Carbon (90% ICE NGDV and 10% BEV NGDV) ..................................... 4-20
Table 4-6.4 Net Air Emission Changes from Nationwide Action (100% BEV NGDV) Calculated Based on MOVES Model ............................................................................................................................................. 4-21
Table 4-6.5 Net Aggregated (Direct and Indirect) Air Emission Changes (100% BEV NGDV) Calculated Based on MOVES, eGRID, and GREET Models ............................................................................................ 4-22
Table 4-6.6 Calculated Social Cost of Carbon (100% BEV NGDV) .................................................................... 4-22
Table 4-6.7 Net Air Emission Changes from Nationwide Action (Alternative 1.1 - 100% RHD COTS ICE Vehicles) Calculated Based on MOVES Model .............................................................................................. 4-23
Table 4-6.8 Net Aggregated (Direct and Indirect) Air Emission Changes (Alternative 1.1 - 100% COTS ICE Vehicles) Calculated Based on MOVES and GREET Models ......................................................... 4-24
Table 4-6.9 Calculated Social Cost of Carbon (Alternative 1.1 - 100% COTS ICE Vehicles) ............................. 4-24
Table 4-6.10 Net Air Emission Changes from Nationwide Action (Alternative 1.2 - 100% COTS BEVs) Calculated Based on MOVES Model ................................................................................................................ 4-25

United States Postal Service Draft Environmental Impact Statement Environmental Compliance and Risk Management
x August 2021
Table 4-6.11 Net Aggregated (Direct and Indirect) Air Emission Changes (Alternative 1.2 – 100% COTS BEVs) Calculated Based on MOVES, eGRID, and GREET Models ........................................................... 4-26
Table 4-6.12 Calculated Social Cost of Carbon (Alternative 1.2 - 100% COTS BEVs)......................................... 4-26
Table 4-6.13 Air Emissions from 165,000 Existing Delivery Vehicles Over a Ten-Year Period Calculated Based on MOVES Model ................................................................................................................................ 4-27
Table 4-6.14 Direct and Indirect Air Emissions from Existing Delivery Vehicles Over a Ten-Year Period Calculated Based on MOVES and GREET Models .......................................................................................... 4-27
Table 4-11.1 Potential Environmental Impacts Summary Matrix .......................................................................... 4-38
LIST OF FIGURES
Figure 1-3.1 Production NGDV Platform and Features ......................................................................................... 1-4
Figure 2-1.1 Example of RHD LLV (on left) and RHD FFV (on right) (OIG 2020) .................................................. 2-2
Figure 3-1.1 Current COTS ICE Vehicles (Left – LHD Ram ProMaster®, Right – RHD Mercedes Metris) ............ 3-5
Figure 3-2.1 LHD COTS BEV ............................................................................................................................... 3-6
Figure 4-8.1 Electrical Loads (million kWh) Across U.S. Geographies ................................................................ 4-30
Figure 4-10.1 USPS Delivery Vehicle Life Cycle ................................................................................................... 4-34
LIST OF APPENDICES
Appendix A Acronyms and Abbreviations and Index
Appendix B Consultation and Coordination
Appendix C Cost Data Background
Appendix D Hypothetical Ten-Year Purchase/Deployment

United States Postal Service Draft Environmental Impact Statement Environmental Compliance and Risk Management
xi August 2021
Appendix E Noise Background Information
Appendix F Air Quality Background Information and Calculations
Appendix G
Fuel Consumption Calculations

United States Postal Service Draft Environmental Impact Statement Environmental Compliance and Risk Management
1-1 August 2021
1 INTRODUCTION
The United States Postal Service (USPS), an independent establishment of the executive branch of the United States Government, has prepared this Environmental Impact Statement (EIS) pursuant to the National Environmental Policy Act (NEPA) to evaluate the potential environmental impacts of the Proposed Action - the purchase and deployment of up to 165,000 Next Generation Delivery Vehicles (NGDV) over a ten-year period. The EIS analyzes the potential environmental impacts associated with the Proposed Action and Alternatives, including the No-Action Alternative. The objectives of the Proposed Action are to replace high-maintenance and end-of-life delivery vehicles and ensure continuity of service.
1-1 National Environmental Policy Act Regulatory Background
The EIS has been developed in compliance with NEPA; the regulations implementing NEPA (Title 40 Code of Federal Regulations [CFR] Parts 1500–1508); and the Postal Service’s regulations for NEPA compliance set forth at 39 CFR Part 775.
1-2 Postal Service Delivery Fleet Management Evaluation and Decision-Making
Process
The Postal Service owns and operates a delivery fleet of over 206,000 vehicles consisting of both purpose-built vehicles as well as commercial off-the-shelf (COTS) vehicles. Purpose-built vehicles were built specifically for the purpose of delivering mail. COTS vehicles are publicly available and purchased directly from the vehicle manufacturer with minor modifications.
The current delivery fleet is made up of four basic vehicle types:
▪ Purpose-built vehicle (Long-Life Vehicle [LLV] and Flexible Fuel Vehicle [FFV]) – which are Right Hand Drive (RHD) and optimally designed and built vehicles, specifically for the function of delivering mail on a curb-line route;
▪ Left Hand Drive (LHD) COTS vehicle (Ram ProMaster® and minivans) – suitable for when the route does not require mail to be delivered to a curb-line route;
▪ Mixed delivery and mail collection vehicle (2-ton) – similar in use and function to the LHD COTS ProMaster® but with approximately 150 percent more cargo capacity; and
▪ RHD COTS vehicle (Mercedes Metris) – includes cargo capacity between the two current LHD COTS vehicle models; vehicle can be used on routes to deliver to curb-line mailboxes; it does not provide the same operational or ergonomic benefits as the purpose-built vehicle.
The Postal Service determined the RHD purpose-built vehicles (LLV and FFV), which have far exceeded their planned life, need to be replaced to reduce their ever-escalating maintenance costs and to take advantage of current safety and technology advancements.
1-3 Overall Vehicle Acquisition Strategy
1-3.1 COTS & Purpose-Built Vehicles
The Postal Service is in a multi-year planning and acquisition process of replacing its aging fleet of mail delivery vehicles with a future class of delivery vehicles, and considered various options to meet the Postal Service's delivery vehicle needs. While the longer-term solution to its vehicle needs (the purpose-built NGDV) was in prototype development and testing, the Postal Service conducted a Programmatic Environmental Assessment (PEA) in 2017 (USPS 2017a), and Record of

United States Postal Service Draft Environmental Impact Statement Environmental Compliance and Risk Management
1-2 August 2021
Environmental Consideration (REC) in 2020 for the acquisition and deployment of new COTS delivery vehicles over a six-year period to stabilize its delivery fleet and in furtherance of its statutory Universal Service Obligation (39 United States Code [USC] 101). The new COTS vehicles are replacing accident-damaged, end-of-life and high-maintenance delivery vehicles and accommodate increases in delivery points and route growth.
1-3.2 NGDV Acquisition Strategy
The NGDV would incorporate new technologies to accommodate a changing and diverse mail mix, reduce maintenance costs, incorporate improved safety and ergonomic features, improve service, reduce emissions and the fleet’s carbon footprint, and produce operational savings.
The Postal Service's NGDV acquisition strategy consists of three phases. Phase 1, completed in 2015, concentrated on identifying potential sources and evaluating supplier qualifications to establish a list of prequalified suppliers eligible to participate in Phase 2, the NGDV Prototype Program.
Phase 2 provided for the competitive development, delivery and testing of curb-line delivery prototype vehicles. Suppliers delivered prototype vehicles to the Postal Service starting in 2017, and the Postal Service completed all testing by March 2019. Following testing, the Postal Service developed a comprehensive Statement of Work (SOW) for the production of NGDV that included lessons learned from the prototype phase testing.
The NGDV Production Program, Phase 3, is for the purchase of 50,000 to 165,000 purpose-built vehicles to replace the LLVs and FFVs as part of the overall USPS mixed fleet strategy under a single contract. The Production Phase includes the requirement for domestic final assembly of all NGDV in the continental United States (U.S.) and incorporation of emerging vehicle technologies for alternative fuel capability.
Each phase of the NGDV acquisition strategy is further described in the following sub-sections.
1-3.2.1 NGDV Request for Information, Prototype Development, and Evaluation
On January 20, 2015, the Postal Service issued a Request for Information (RFI) and Prequalification/Sources Sought for its NGDV Acquisition Program via the Federal Business Opportunities website. The purpose of the RFI was to inform prospective suppliers of the Postal Service’s preliminary/draft specification and plans for acquiring the fleet replacement NGDV. As part of the RFI issuance, the Postal Service included a prequalification component to narrow the field of prospective suppliers to those most qualified to meet the NGDV acquisition objectives. The Postal Service received 34 submissions in response to the RFI, and prequalified 15 suppliers. In October 2015, the Postal Service issued a Request for Proposal (RFP) to the 15 prequalified suppliers (determined from the RFI) to submit their prototype proposals. In September 2016, the Postal Service awarded contracts to six suppliers (one of the six suppliers subsequently withdrew from the prototype phase) for 44 prototype vehicles as part of the NGDV prototype phase, including internal combustion, mild hybrid, and plug-in hybrid electric vehicles.

United States Postal Service Draft Environmental Impact Statement Environmental Compliance and Risk Management
1-3 August 2021
In Fall 2017, the suppliers delivered their prototypes and the Postal Service began testing of the prototypes in various locations across the country. The testing included:
▪ Component testing of selected high-use components;
▪ Laboratory testing (for emissions and fuel economy in accordance with Environmental Protection Agency [EPA] and the Postal Service driving cycle);
▪ Field Testing (live operational testing at six Postal Service facilities across the nation with USPS carriers);
▪ 24,000-mile durability testing (durability obstacles and road course);
▪ Accelerated durability cycle (beyond that expected in a normal service environment); and
▪ Cold weather testing.
The Postal Service completed testing of the prototype vehicles in March 2019 and gained valuable information to consider regarding the composition of the future delivery vehicle fleet. Following testing, the Postal Service consulted with many stakeholders including members of Congress, federal agencies, the automotive industry, postal unions, and employees to develop a best-in-class RFP for the NGDV Production vehicles. The Postal Service issued the NGDV Production RFP on December 27, 2019 to the five NGDV prototype suppliers and notified other major vehicle suppliers in order to ensure wide notification within the vehicle industry and obtain any interest in potential participation or subcontract contribution.
1-3.2.2 Selection and Description of Production NGDV
The NGDV Production SOW provided to the five suppliers incorporated key features for NGDV design with carrier safety and ergonomics in mind, based on lessons learned from testing and continued stakeholder feedback. The features include:
▪ A walk-in cargo with large capacity designed to meet future package growth;
▪ RHD configuration to allow for curb-line delivery;
▪ Ergonomic design for ease of delivery; and
▪ Improved delivery efficiency.
Offerors provided NGDV Production proposals and pricing to the Postal Service in July 2020. The proposals included internal combustion engine (ICE) vehicles and battery electric vehicles (BEVs); the proposals did not include a hybrid production vehicle. The Postal Service then evaluated proposals to determine which offeror provided the Postal Service with the best value by weighing technical evaluation factors/risk and the Total Cost of Ownership (TCO). The evaluation team used the following criteria to evaluate the offerors’ technical ability to develop, produce, deliver, and support production quality of the NGDV for the Postal Service:
▪ Design Quality and Technical Approach - Reliability, Maintainability, Fuel Economy and Emissions, and Safety and Ergonomics;
▪ Supplier Capability - Engineering Capability, Production and Delivery, Service and Parts, and Quality; and
▪ Past Performance - Prototype Performance and Supplier’s Prior Performance.
The TCO calculation for each offeror incorporated purchase costs, maintenance costs, fuel costs and, if applicable, BEV charging infrastructure costs. Relevant cost data are presented in Appendix C.

United States Postal Service Draft Environmental Impact Statement Environmental Compliance and Risk Management
1-4 August 2021
On February 23, 2021 the Postal Service announced a contract award, contingent on the satisfactory completion of the NEPA process, to Oshkosh Defense, LLC (Oshkosh) for the future production of the NGDV. The Oshkosh production contract requires an NGDV production vehicle that can support two powertrain alternatives - a modern and efficient ICE or a more environmentally friendly BEV powertrain. At the time of awarding the contract, the Postal Service placed an order that funds the production design, assembly tooling, and factory start-up costs to support the production of both vehicle types in parallel, and either powertrain can be ordered under the contract in whatever ICE/BEV mix the Postal Service desires.
The NGDV production platform provides the latest safety systems to protect carriers, a flexible powertrain to demonstrate the Postal Service’s commitment to sustainability, increased cargo capacity for more efficient delivery of packages, and is telematics compatible for predictive maintenance and operational benefits. The NGDV can also be retrofitted to keep pace with advances in BEV technologies.
The production NGDV platform and features are illustrated in Figure 1-3.1.
Figure 1-3.1 Production NGDV Platform and Features
1-3.2.3 Production Expectations
The production contract specifies assembly of the NGDV in the U.S. and, contingent on the satisfactory completion of this NEPA process, the Postal Service anticipates placing the first order of production quantity vehicles in 2022, with the resulting first NGDV ready for delivery in 2023.
The Postal Service has committed to a minimum quantity of 10 percent BEVs and is seeking additional funding to increase this quantity. The immediate imperative is to provide Postal Service carriers with a safe, reliable, efficient, and ergonomic delivery vehicle. A phased approach is being used to achieve this goal and roll out new vehicles as quickly and efficiently as possible.

United States Postal Service Draft Environmental Impact Statement Environmental Compliance and Risk Management
1-5 August 2021
1-3.3 Limits of Environmental Impact Assessment
This EIS analysis is limited to the actions and alternatives described in Section 3. The timing, type, and number of new NGDV vehicles and their deployment are based on the best available current information for preparation of this EIS. The ultimate number and timing of the NGDV procured would depend upon the final needs of the Postal Service and the supplier’s production and delivery capabilities. Deviation from the analysis herein that is deemed to be significant by the Postal Service would be analyzed through the preparation of a Supplemental EIS as necessary and appropriate.
1-3.4 Actions Not Included in the Proposed Action
The Postal Service is continuously assessing its fleet of delivery vehicles in order to identify and replace vehicles that have reached or exceeded their scheduled life expectancy, as well as those that are too costly to maintain due to major accident repair or significant mechanical repair. As a result of this ongoing fleet management process the Postal Service has made other minor purchases for replacement of fleet vehicles. These vehicle replacements are regular, on-going activities that have continued over many years and are represented in the baseline conditions.
The Proposed Action and alternatives specifically address the purchase and deployment of the NGDV, or new COTS vehicles, needed to replace the aging fleet of RHD delivery vehicles. During the period while the production and procurement of the new NGDV and COTS vehicles is implemented, the Postal Service would continue to procure COTS vehicles as both replacements of the aging vehicles and to accommodate delivery route growth. The Postal Service previously addressed COTS vehicle procurement actions under NEPA; these purchases are separate from the Proposed Action herein and are therefore not addressed in this EIS. The EIS focuses only on Postal Service operations-related actions associated with the Proposed Action and alternatives, as defined in Section 3.
The Postal Service maintains its current fleet of delivery vehicles through Vehicle Maintenance Facilities (VMFs) located nationwide throughout its network of facilities. Replacing the aging vehicles on a one-for-one basis would not result in the need for additional VMFs to maintain the NGDV. Therefore, this EIS does not address new VMF construction. Expansions of Postal Service facilities are not currently anticipated. Interior and exterior alterations of some Postal Service facilities could be required as a result of the Proposed Action, for replacement of VMF bay doors and center-post vehicle lifts, and installation of charging stations for BEVs where needed. The Postal Service could also construct a new vehicle maintenance training facility in the future. The Postal Service would conduct appropriate environmental review at the local level per Postal Service Handbook RE-6 (2015) as needed. Postal Service environmental checklists, screening analyses, and stand-alone, project-level Environmental Assessments would be employed on a facility-specific basis to assess the extent of impacts from any facility-related actions.
1-4 Public and Stakeholder Involvement
The Postal Service’s Notice of Intent (NOI) to prepare an EIS for purchase of the NGDV was published in the Federal Register (FR) on March 4, 2021 (86 FR 12715). The public and agency scoping and comment period extended through April 5, 2021. In addition, the Postal Service mailed the NOI directly to various stakeholders, including the United States Environmental Protection Agency (EPA), the Council on Environmental Quality (CEQ) and Postal Service union representatives. During this scoping and comment period, the Postal Service timely received 1,753 letters from interested parties, including the EPA, the New York University School of Law Institute for Policy Integrity, and the Elders Climate Action group. Copies of the NOI, an example NOI letter, a list of the NOI letter recipients, and responses to comments are included in Appendix B (B1 - Notice of Intent).

United States Postal Service Draft Environmental Impact Statement Environmental Compliance and Risk Management
1-6 August 2021
A copy of the Notice of Availability (NOA) for the draft EIS, an example of the NOA letters, and a list of NOA recipients are included in Appendix B (B2 - Notice of Availability).

United States Postal Service Draft Environmental Impact Statement Environmental Compliance and Risk Management
2-1 August 2021
2 PURPOSE OF THE PROPOSED ACTION
The Postal Service has “as its basic function the obligation to provide postal services to bind the Nation together through the personal, educational, literary and business correspondence of the people. It shall provide prompt, reliable, and efficient services to patrons in all areas and render postal services to all communities.” (Universal Service Obligation [39 USC 101]).
The Postal Service has been a self-supporting Independent Establishment of the Executive Branch of the United States Government since 1971 when Congress assigned the Postal Service the “general duty” to “maintain an efficient system of collection, sorting, and delivery of the mail nationwide” (39 USC 403(b)). In order to carry out this obligation, the Postal Service has the “specific powers” to:
▪ “provide for the collection, handling, transportation, delivery, forwarding, returning, and holding of mail, and for the disposition of undeliverable mail” (39 USC 404(a)(1)); and
▪ “determine the need for post offices, postal and training facilities and equipment, and ... provide such offices, facilities, and equipment as it determines are needed” (39 USC 404(a)(13)).
The purpose of the Proposed Action is to purchase and deploy purpose-built NGDV to replace the end-of-life and high-maintenance LLVs and FFVs with more energy-efficient powertrains, and updated technology, reduced emissions, increased cargo capacity and improved loading characteristics, improved ergonomics and carrier safety, and reduced maintenance costs. Once the Proposed Action is complete, the future delivery fleet is anticipated to include approximately 230,000 vehicles, of which up to 165,000 would be purpose-built NGDV with a mix of ICE and BEV powertrains. Ultimate quantities are dependent upon the Postal Service’s operational needs, including individual carrier route needs, and financial position.
2-1 Need for the Action
The Postal Service operates one of the world’s largest civilian government fleets consisting of more than 230,000 vehicles of various classes of purpose-built and COTS vehicles. The majority of these vehicles are on the road delivering mail at least six days per week in every community. Purpose-built vehicles are RHD and built specifically for the purpose of delivering mail, while COTS vehicles are commercially available and purchased directly from the vehicle manufacturer with minor modifications to accommodate mail deliveries.
Within the current Postal Service delivery vehicle fleet, approximately 159,000 are purpose-built RHD, light-duty delivery vehicles with a payload capacity of approximately 1,000 pounds and cargo stowage capacity of approximately 108 to 121 cubic feet. They use outdated powertrain and emission vehicle technologies, and do not include some safety-related features that are standard today. They consist of approximately 138,000 purpose-built LLVs, manufactured by Grumman Allied from 1987 to 1994, and 21,000 purpose-built FFVs manufactured by Ford/Utilimaster in 2000 and 2001. The FFVs are similar to the LLVs and have the ability to operate on gasoline or an ethanol fuel blend (E85). Examples of an RHD LLV and RHD FFV are shown in Figure 2-1.1 below.

United States Postal Service Draft Environmental Impact Statement Environmental Compliance and Risk Management
2-2 August 2021
Figure 2-1.1 Example of RHD LLV (on left) and RHD FFV (on right) (OIG 2020)
The current Postal Service purpose-built LLVs and FFVs are near or at the end of their useful life. The expected service life of LLVs is 24 years and these vehicles currently average 30 years in age.
The LLV consists of a modified General Motors chassis designed for the Chevrolet S10 with a custom aluminum body. While the all-aluminum body has resisted corrosion exceptionally well over the years, the main powertrain components have been replaced multiple times and now must be acquired through aftermarket manufacturing. This has significantly increased repair costs, while reducing vehicle performance and reliability. In fact, the Postal Service was required to contract with an alternative supplier to reverse engineer and manufacture the chassis frame to ensure that the LLV could still be kept in service. This has caused the average annual maintenance cost of the LLV to exceed $5,000 annually and, for 7 percent of the LLVs, to exceed $10,000 annually. In addition, they are less fuel efficient and do not support future delivery needs given projected changes in market demand, mail mix and an increasing number of delivery points.
The LLVs do not have certain modern safety features that are standard in vehicles today, such as airbags and anti-lock brakes. They also do not have air conditioning, back-up cameras, intermittent windshield wipers, blind-spot warning systems, daytime running lights, or seatbelt reminders.
The Postal Service replaces vehicles when it determines that replacement is less expensive than continued maintenance of the existing vehicles. This determination is based on a formula that accounts for maintenance cost, acquisition cost, and efficiency benefits. The goal is to maintain a mixed fleet of delivery vehicles that incorporates new technology to accommodate a diverse mail mix, enhance safety, improve service, reduce emissions, and produce operational savings.
The RHD LLVs and FFVs are designed to deliver to curb-line residential mailboxes from the driver’s RHD seat and are used to deliver mail on city and rural routes across the country. When these vehicles were first deployed, the mail consisted primarily of letters and the cargo space was an upgrade from the prior Postal Service Jeeps. A fundamental shift has occurred over the last decade that has resulted in a large decrease in letter and flats volume and large increases in parcel volume and the total number of delivery points. Postal Service delivery vehicles now need an increased cargo capacity and better access to the parcels in the cargo area and need RHD configuration for optimal ergonomics and efficiencies for deliveries to curb-line residential mailboxes. Specific design requirements of the NGDV include RHD configuration, the ability to access the cargo area of the vehicle before exiting the vehicle, increased ceiling height, and increased cargo capacity.
In summary, current outdated delivery vehicles, many as much as 32 years in operation, are inefficient, increasingly unreliable, costly to maintain and lack certain modern safety and operational features needed for mail carriers. The Postal Service plans to deploy a new generation of RHD

United States Postal Service Draft Environmental Impact Statement Environmental Compliance and Risk Management
2-3 August 2021
vehicles that incorporates the latest advancements in automotive technologies and better serves operations, employees, and customers. Given the mail mix changes that have already occurred and additional package growth expected as e-commerce sales continue to rise, new delivery vehicles will need a larger cargo area that also allows easier retrieval of packages than existing, outdated RHD vehicles. Replacement of these outdated delivery vehicles will enable the Postal Service to meet its Congressional mandate to maintain efficient nationwide delivery of the mail and to provide prompt, reliable, and efficient services to patrons.

United States Postal Service Draft Environmental Impact Statement Environmental Compliance and Risk Management
3-1 August 2021
3 DESCRIPTION OF PROPOSED ACTION AND ALTERNATIVES
3-1 Proposed Action – Purchase and Deployment of up to 165,000 NGDV
The Postal Service's Proposed Action is the purchase over a ten-year period of 50,000 to 165,000 purpose-built, RHD NGDV to replace existing delivery vehicles nationwide that are approaching the end of their service life. While the Postal Service has not yet determined the precise mix of the powertrains in the new vehicles to be purchased, the Postal Service further proposes that the new vehicles consist of a mix of ICE and BEV powertrains, with at least 10 percent BEVs.
The planned NGDV acquisition ten-year period would begin in 2023 and would replace high-maintenance and end-of-life delivery vehicles, including LLVs and FFVs, over a ten-year period. The actual timeline and quantities of NGDV purchased and delivery vehicle types replaced would be contingent upon the Postal Service’s operational needs, including individual carrier route needs, and financial position.
The production NGDV platform is shown in Figure 1-3.1. The NGDV would have RHD configuration to allow for curb-line deliveries, ergonomic design for easy entry and improved delivery efficiency, a walk-in with larger cargo capacity than current delivery vehicles, ability to access the cargo area without exiting the vehicle, increased ceiling height, and the capability for telematics data and information to enhance vehicle monitoring and predictive maintenance. Safety features would include backup and 360-degree cameras, blind spot warning, anti-lock braking system, automatic electronic parking brake, front/rear braking, and air bags. The NGDV would also include air-conditioning, which is not available in LLVs or FFVs.
3-1.1 NGDV Powertrains Available
The flexible NGDV design platform would allow the Postal Service to replace its high-maintenance cost and aging fleet, match technology to operational needs, control costs and avoid costly delays and setbacks. Current plans are for the new vehicle purchases to consist of a mix of ICE and BEV powertrains to support the environmentally sustainable technology goal for the Postal Service’s fleet, with at least 10 percent BEVs. The Postal Service would accelerate its electric vehicle strategy by increasing the percentage of BEV powertrains if its financial condition changes or it receives additional funding for this purpose.
The 20-year estimated total costs for NGDV powertrains are presented in Table 3-1.1. The estimated cumulative total costs are based on costs for vehicle purchase, freight, training, manuals, technical data package, pre-delivery production costs, charging infrastructure, 20 years’ estimated fuel and utility costs, and maintenance. Relevant cost data are presented in Appendix C.
Table 3-1.1 20-Year Cumulative Estimated Total Costs for NGDV Powertrains
NGDV Powertrain ICE NGDV BEV NGDV
Total Estimated Cost 1 $ 9.3 Billion $ 11.6 Billion 1 Present value [rounded] based on purchase of 75,000 vehicles)
The production contract is flexible and allows the Postal Service to continue to evaluate opportunities for electrification for any order placed throughout its ten-year period. Powertrain and BEV technology will undoubtedly evolve and improve over the available 20-year life of the NGDV, so the Postal Service selected a flexible design platform that can accommodate advancements in powertrain technology, including emerging BEV and ICE powertrain alternatives. Vehicles purchased with ICE

United States Postal Service Draft Environmental Impact Statement Environmental Compliance and Risk Management
3-2 August 2021
powertrains will be capable of being retrofitted to alternative BEV powertrain technology if it is advantageous for the Postal Service to do so.
Current specifications for the ICE and BEV NGDV are provided Tables 3-1.2 and 3-1.3 below.
Table 3-1.2 ICE NGDV Specifications
Design Specification Estimated Value
Curb Weight (pounds [lbs]) 5,560
Gross Vehicle Weight Rating (GVWR) (lbs) 8,501
Payload (lbs) 2,941
Engine Size 2.0 liter, 4 cylinder (cyl)
Mileage 14.7 miles per gallon (mpg) (without air conditioning) 8.6 mpg (with air conditioning)
Table 3-1.3 BEV NGDV Specifications
Design Specification Estimated Value
Curb Weight (lbs) 6,670
GVWR (lbs) 8,877
Payload (lbs) 2,207
Battery Type / Size Nickel Manganese Cobalt Oxide / 94 kilowatt hour (kWh)
Range on Single Charge (miles) 70 (with and without air conditioning)
The Postal Service's BEV NGDV requirements also include the ability to charge to a minimum driving range of 70 miles within eight hours. The BEV NGDV would be expected to discharge around 20 percent of battery capacity under average conditions because of the low average delivery route mileage. This would limit battery degradation and may not require charging every day. The BEV NGDV could fully recharge during non-business hours.
Operational limitations and certain Postal Service delivery environments would limit the use of electric-only vehicles. These limitations include a lack of available infrastructure, and at least 12,500 delivery routes where route length, environmental conditions, or facility constraints make electric vehicles unfeasible or impractical. For example, BEV NGDV on routes that exceed 70 miles might not have sufficient power to complete the route, especially as the battery ages and has less capacity. Limitations also exist with extreme cold climates where the use of heaters could reduce the available mileage by up to 50 percent. Facility constraints include smaller and/or leased properties, such as strip mall locations, which may have limited space for charging infrastructure and/or require landlord approval for construction activities (e.g., utility drops, conduit runs, transformer installation, and updates to distribution panels/circuit breakers).
The Postal Service would evaluate ICE and BEV NGDV deployment based on existing nationwide delivery route characteristics and other established factors to prioritize potential placement of the two powertrains. Route characteristics for placement of BEV NGDV would include routes located in mild temperature ranges, routes with frequent and numerous curb-line stops as they better recapture the vehicle's motion (kinetic) energy via regenerative braking to recharge the battery, and routes in locations with compromised air quality and/or states with proactive BEV policies and regulations.
3-1.2 NGDV Maintenance and Support
The NGDV would replace existing high-maintenance and end-of-life delivery vehicles on a one-to-one basis. No new Postal Service VMFs would be required, as the Postal Service's more than 300 existing

United States Postal Service Draft Environmental Impact Statement Environmental Compliance and Risk Management
3-3 August 2021
VMFs, as well as commercial garages for unscheduled repairs throughout the country, would continue to conduct maintenance on all delivery vehicles, including the NGDV. The deployment of new NGDV would result in minimal to no changes to the total Postal Service vehicle maintenance workforce.
Depending on the overall final NGDV dimensions and weight, existing VMF bay doors could need replacement or modification to accommodate the NGDV's higher and wider dimensions as compared with existing Postal Service delivery vehicles. Most (approximately 90 percent) existing vehicle lifts in the Postal Service's VMFs would accommodate the ICE and BEV NGDV and not require modification or replacement. However, center-post lifts (approximately 10 percent) at VMFs servicing BEV NGDV would require modification or replacement because the center posts would interfere with underside access of the vehicles for access/replacement of the battery.
The Postal Service would assess VMFs, processing, delivery and retail facilities where BEV NGDV would be deployed to determine whether BEV charging or infrastructure capabilities can be accommodated. Interior and exterior alterations could be necessary to install charging stations. Interior alterations for BEV infrastructure would vary based on site size and the number of charging stations needed. Power upgrades (e.g., rewiring, the addition of an electrical distribution box with circuit breakers or multiple electrical power entrances and multiple main power distribution panels) would likely be required at these facilities. Construction of a special outbuilding could be necessary based on power requirements, as could installation of a substation with a large transformer. Power supply from the interior of a facility could be connected to an exterior wall-mounted charging station, placed in trenches for exterior ground-level charging stations, or attached to overhead structures (e.g., canopy, gantry, or telephone pole) for suspended charging stations in delivery vehicle parking lots.
Construction could include trenching and backfilling, pavement removal and replacement, relocating utilities and drains, etc. Construction equipment requirements could range from trenching equipment, concrete drills, and typical electrical installation equipment (e.g., meters, and electric and conduit-related tools) to excavators, concrete saws, heavy lifting equipment, parking lot grading and paving equipment, and landscaping- and drainage-related installation equipment, depending on Postal Service facility size and the quantity of charging stations needed. Exterior alterations are expected to be within existing facility footprints, such as delivery vehicle parking areas, which are previously disturbed areas. The timing, type, and duration of construction at each facility would be based on the number and types of NGDV to be maintained or deployed at a particular facility. Specific facility locations where new vehicles will be deployed and where alterations may be needed are not known at this time. Additionally, the extent and types of alterations necessary for each Postal Service facility location are not known at this time.
The Postal Service could also construct a new vehicle maintenance training facility in the future. As discussed in Sections 1-3.1 and 4-2, site-specific facility alterations and this potential new training facility are not included in the detailed evaluation of the action alternatives that specifically address the purchase and deployment of new Postal Service vehicles. Appropriate NEPA reviews at the local level would be conducted in the future, as needed.
The use of smart charging stations would permit options for charging to include management of individual charging station power levels, prioritization of vehicles to be charged, accommodation of demand charge periods, prioritization of charging hours, specification of hours desired for charging (late nights through early mornings), and the ability to override normal charging protocols to meet special needs. At Postal Service facilities where BEV NGDV are deployed, charging would take place and occur overnight from approximately 6:00 p.m. to 9:00 a.m.

United States Postal Service Draft Environmental Impact Statement Environmental Compliance and Risk Management
3-4 August 2021
3-1.3 NGDV Powertrain Mix
The Postal Service's Proposed Action, the purchase and deployment of up to 165,000 NGDV, would include a mix of vehicles with different powertrain systems (ICE and BEV), with at least 10 percent BEVs. The Postal Service has not yet determined the precise mix of the ICE and BEV powertrains in NGDV to be purchased. For the purposes of determining the range of environmental impacts associated with the Proposed Action, this EIS will present and analyze the two ends of the NGDV powertrain mix range. Therefore, for this EIS the Postal Service has included two Proposed Action hypothetical maximum scenarios, as described below, to consider the full potential range of environmental impacts.
3-1.3.1 Purchase and Deployment of 90% ICE NGDV and 10% BEV NGDV
The purchase and deployment of 90 percent ICE NGDV and 10 percent BEV NGDV in the total NGDV production orders over the ten-year period is one of the two hypothetical maximum scenarios evaluated in this EIS. The Postal Service is firmly committed to a future that includes electric vehicles in its delivery vehicle fleet and has committed to acquisition of at least 10 percent BEV NGDV.
3-1.3.2 Purchase and Deployment of 100% BEV NGDV
The purchase and deployment of 100 percent BEV NGDV in the total NGDV production orders over the ten-year period is the other hypothetical maximum scenario evaluated in this EIS, although, as discussed in Section 3-1.1, at this time BEVs are not feasible or practical at 100 percent of Postal Service routes.
3-2 Alternative 1 – Purchase and Deployment of up to 165,000 COTS Vehicles
Alternative 1 would involve the purchase and deployment of up to 165,000 COTS vehicles over the same ten-year period. COTS vehicles are commercially available and purchased directly from the vehicle manufacturer with minor modifications to meet Postal Service delivery requirements. In order to meet the Postal Service purpose and need, the COTS delivery vehicles would need to be RHD vehicles. The COTS vehicles would replace existing high-maintenance, and end-of-life RHD delivery vehicles on a one-to-one basis, the same as the NGDV Proposed Action.
The Postal Service currently has both LHD and RHD COTS ICE vehicles in its fleet, with RHD vehicles offering several operational and ergonomic benefits as compared with LHD vehicles. LHD vehicles do not meet the Postal Service's purpose and need because they are not configured for optimal ergonomics and efficiencies for deliveries to curb-line residential mailboxes. LHD COTS ICE or BEVs would not be as ergonomic or efficient for Postal Service delivery operations (particularly to curb-line residential mailboxes) when compared to RHD vehicles.
RHD COTS vehicles, which can be used on routes to deliver to curb-line mailboxes, do not provide the same operational or ergonomic benefits as the purpose-built NGDV. Existing RHD COTS vehicles do not provide a walk-in cargo compartment, hold fewer mail trays at the front of the vehicle, have window openings that limit ergonomic movements, and restrict internal access to cargo areas (i.e., they are accessible only from outside the vehicle). Also, existing RHD COTS vehicles do not have body components designed for frequent and repetitive use resulting in significantly higher maintenance and repair costs, and will need to be replaced more frequently than the NGDV (maximum expected life of a COTS body is 12 years compared to 20 for the NGDV). Additionally, RHD COTS vehicle models would have some, but not all, of the enhanced safety and customized operational features available in the NGDV that are optimal for Postal Service delivery operations.
Examples of current Postal Service COTS vehicles are shown in Figure 3-1.1.

United States Postal Service Draft Environmental Impact Statement Environmental Compliance and Risk Management
3-5 August 2021
Figure 3-1.1 Current COTS ICE Vehicles (Left – LHD Ram ProMaster®, Right – RHD Mercedes Metris)
3-2.1 COTS Vehicle Maintenance and Support
The new COTS vehicles would replace existing high-maintenance and end-of-life delivery vehicles on a one-to-one basis. No new Postal Service VMFs would be required. The more than 300 existing VMFs, as well as commercial garages for unscheduled repairs throughout the country, would continue to conduct maintenance on all delivery vehicles, including the new COTS vehicles. The deployment of new COTS vehicles would result in minimal to no changes to the total Postal Service vehicle maintenance workforce.
COTS vehicles would be maintained and serviced at existing Postal Service VMFs and unscheduled repairs would be done at commercial garages nationwide, the same as with NGDV. The COTS BEVs would require similar alterations to accommodate new charging infrastructure within affected existing VMFs and delivery units as for the BEV NGDV. Charging station installation and use is expected to be similar as for the BEV NGDV. Additionally, alterations (e.g., bay doors, lifts) at existing VMFs could be required, depending on the new COTS vehicle's overall dimensions and powertrains. As discussed in Sections 1-3.1 and 4-2, site-specific facility alterations are not included in the detailed evaluation of the action alternatives that specifically address the purchase and deployment of new Postal Service vehicles. Appropriate NEPA reviews at the local level would be conducted in the future, as needed.
3-2.2 COTS Vehicle Powertrain Mix
The Postal Service has not yet determined the precise mix of the ICE and BEV NGDV powertrains for the Proposed Action. Likewise, the precise mix of COTS ICE and BEV powertrains for Alternative 1 would depend on the Postal Service’s operational needs and financial position, along with the COTS vehicle capabilities.
For the purposes of determining the range of environmental impacts associated with Alternative 1, this EIS will present and analyze two ends of the COTS powertrain mix range. Therefore, the Postal Service has included two Alternative hypothetical maximum scenarios, as described below, to consider the full potential range of environmental impacts associated with this Alternative.
3-2.2.1 Alternative 1.1 - Purchase and Deployment of 100% RHD COTS ICE Vehicles
The purchase and deployment of all RHD COTS ICE vehicles in the total production orders over the ten-year period is Alternative 1.1. Specifications and performance data for an in-use Postal Service COTS ICE vehicle model (the RHD Metris) are shown in Table 3-2.1.

United States Postal Service Draft Environmental Impact Statement Environmental Compliance and Risk Management
3-6 August 2021
Table 3-2.1 RHD COTS ICE Vehicle Specifications
Specifications Metris
Curb Weight (lbs) 4,122
GVWR (lbs) 6,614
Payload (lbs) 2,425
Engine Size 2.0 liter, 4 cyl
Mileage (mpg) 6.31 1 Actual Postal Service average mileage for RHD Metris vehicles.
For the analyses, this vehicle type with the above specifications and performance data will be evaluated, since a LHD COTS ICE vehicle would not meet the purpose and need.
3-2.2.2 Alternative 1.2 - Purchase and Deployment of 100% LHD COTS BEVs
The purchase and deployment of 100 percent LHD COTS BEVs in the total production orders over the ten-year period is Alternative 1.2, although at this time BEVs are not feasible or practical at 100 percent of Postal Service routes and there is no commercially available RHD COTS BEV.
The COTS BEV market and technology is rapidly evolving. These vehicles are still in development and currently available only in small quantities. There is no RHD COTS BEV currently available or otherwise marketed by commercial manufacturers for future development. As explained in detail in Section 2-2, a LHD delivery vehicle does not meet the Postal Service’s purpose and need for curb-line delivery. However, in order to consider the full range of impacts and in response to public comments requesting such an analysis, the EIS will evaluate a 100 percent COTS BEV hypothetical maximum scenario using a LHD COTS BEV.
The COTS BEV evaluated in this EIS is a LHD delivery vehicle advertised as of the time of the draft EIS preparation and projected to be commercially available by 2023 in a comparable size configuration to the NGDV. This does not mean necessarily that a COTS BEV, whether LHD or RHD, is operationally feasible or practicable for the Postal Service. The LHD COTS BEV model selected for evaluation for environmental impacts, based on market research and manufacturer-advertised specifications as of the time of the draft EIS preparation is shown in Figure 3-2.1.
Figure 3-2.1 LHD COTS BEV
Source: Ford Media Center 2021.

United States Postal Service Draft Environmental Impact Statement Environmental Compliance and Risk Management
3-7 August 2021
Current manufacturer-advertised specifications for the LHD COTS BEV used in this analysis are shown in Table 3-2.2.
Table 3-2.2 LHD COTS BEV Specifications
Specifications Ford E Transit (Extended High Model)
Curb Weight (lbs) 6,188
GVWR (lbs) 9,428
Payload (lbs) 3,240 (maximum)
Battery Type / Size 400 Volt Lithium-ion / 67 kWh
Range on Single Charge (miles) 108 (with and without air conditioning)
The Postal Service's COTS BEV charging and range requirements will be assumed to be the same as the BEV NGDV requirements (i.e., the ability to charge to a minimum driving range of 70 miles within eight hours on a single charge with all vehicle accessories operating).
3-3 No-Action Alternative
The Postal Service’s delivery fleet would be maintained at the status quo under the No-Action Alternative; existing vehicles such as the examples shown in Figure 3-1.1 would continue to be used. The fleet would continue to operate at its current level, with no replacement vehicles for accident-damaged, high-maintenance, and end-of-life vehicles.
The Postal Service would incur increasingly higher maintenance costs by continuing to operate LLVs and FFVs and other delivery vehicles past their life expectancy and repairing, maintaining, and operating the existing vehicles. Vehicle breakdowns and increased maintenance could result in service failures that could erode the Postal Service’s customer base. Larger cargo capacity would not be available to meet expected future package growth. Improved delivery efficiency from better ergonomic design and improved information for predictive maintenance through new telematics data would not be possible. The latest safety systems, such as cameras, blind side warning, and automatic parking brakes would not be available to better protect mail delivery personnel and the public.
Postal Service facilities would require no alterations associated with continued use of the existing vehicles.
3-4 Alternatives Considered but not Analyzed in Detail
3-4.1 Leasing and Deployment of up to 165,000 Vehicles
The existing RHD LLVs and FFVs purchased from commercial suppliers are purpose-built vehicles to meet Postal Service requirements and are currently not available for lease. It is not an option to replace the RHD LLVs and FFVs with a leased RHD vehicle of the same type that would meet Postal Service requirements. A new General Services Administration (GSA) solicitation to build and deliver a new purpose-built RHD vehicle for lease would not be cost- or time-effective and was dismissed. Likewise, leasing COTS delivery vehicles would not be cost-effective and was dismissed. In past COTS delivery procurement actions, the Postal Service determined that leasing costs associated with COTS delivery vehicles exceed a COTS vehicle acquisition scenario by more than three times, with no return on investment (see Appendix C). Lastly, leasing vehicles, whether purpose-built or COTS, removes any flexibility the Postal Service might have should it elect to maintain the vehicles over a longer period of time.

United States Postal Service Draft Environmental Impact Statement Environmental Compliance and Risk Management
3-8 August 2021
3-5 Resource Areas Affected
The Proposed Action and Alternatives 1.1 and 1.2 would affect the following resources and topics related to the replacement of high maintenance and end-of-life delivery vehicles with new delivery vehicles: socioeconomics, transportation, noise, air quality, community services, utilities and infrastructure, energy, solid and hazardous materials and waste. These resource areas and related topics are addressed for the action alternatives and the No-Action Alternative in the detailed analysis herein.

United States Postal Service Draft Environmental Impact Statement Environmental Compliance and Risk Management
4-1 August 2021
4 AFFECTED ENVIRONMENT AND ENVIRONMENTAL CONSEQUENCES
4-1 Introduction
This section describes the affected (existing) environment for each resource and then describes the potential environmental consequences due to implementation of the Proposed Action or Alternatives 1.1 or 1.2, and the No-Action Alternative. It is important to note that the Proposed Action and Alternatives are national in scope, with vehicles to be distributed across the Postal Service’s national delivery network.
As discussed in Section 3, the Proposed Action would be the purchase and deployment over a ten-year period of up to 165,000 purpose-built, RHD NGDV, at least ten percent of which would be BEVs. Two hypothetical maximum scenarios for the Proposed Action are evaluated herein: (1) the purchase and deployment of up to 90 percent ICE (ICE NGDV Hypothetical Maximum) with at least (10 percent) BEV NGDV, and (2) the purchase and deployment of 100 percent BEV NGDV (BEV NGDV Hypothetical Maximum). Alternative 1.1 is the purchase and deployment of 100 percent COTS ICE vehicles, and Alternative 1.2 is the purchase and deployment of 100 percent COTS BEVs. The hypothetical distribution by year for the purchase, deployment, and replacement of delivery vehicles (for both the Proposed Action and Alternatives 1.1 and 1.2) is presented in Appendix D. The No-Action Alternative represents the baseline condition or status quo in which high-maintenance and end-of-life delivery vehicles would not be replaced with new delivery vehicles.
Discussion of potential impacts focuses on direct and indirect impacts and whether the impacts are significant. Direct Impacts are caused by the action and occur at the same time and place. Indirect Impacts are caused by the action and are later in time or removed in distance, but are still reasonably foreseeable. Potential impacts are addressed for each resource in terms of the significance of potential impacts in relation to baseline conditions or the No-Action Alternative.
The Proposed Action, being national in scale and scope, has the potential to impact resources throughout the U.S. The specific actions that the Postal Service would take as part of the initiative are located in geographically diverse areas (urban, suburban, and rural). Because of the wide variety of natural and manmade environments and the complexity of resources potentially affected, this section characterizes resource impacts in general terms.
This EIS examined potential impacts in terms of the significance of the impact. To assess the significance of an impact, the Postal Service first identified the relevant context and whether the impact would be negligible, minor, moderate, or major. The Postal Service then determined whether the impact was significant, based on the requirements in 40 CFR 1501.3(b). Four types and levels of impact were considered during the analysis:
▪ Beneficial Impact – The impact would be beneficial in nature.
▪ No or Negligible Impact – No impact is anticipated, or the impact is barely perceptible or measurable.
▪ Moderately Adverse Impact – An impact is anticipated, but the impact does not meet the context/intensity significance criteria for the specified resource.
▪ Significant Impact – An impact is anticipated that meets the context/intensity significance criteria for the specified resource.
The Postal Service also used this approach to evaluate cumulative impacts, which focus on the combined, incremental effects of actions within a particular area and within a particular time frame.

United States Postal Service Draft Environmental Impact Statement Environmental Compliance and Risk Management
4-2 August 2021
4-1.1 Existing Vehicle Fleet
The Postal Service currently has a combined delivery fleet of approximately 218,000 vehicles comprised of approximately 138,000 RHD LLVs, 21,000 RHD FFVs, 51,000 COTS delivery vehicles and 8,000 COTS mixed delivery vehicles. The majority of the current delivery fleet has been in operation for as long as 30 years; the vehicles are inefficient, increasingly unreliable, costly to maintain and do not include certain modern safety features nor operational features needed by mail carriers. The Postal Service has been replacing existing delivery vehicles as they reach their end-of-life or begin to incur excessive maintenance costs with COTS vehicles, pending the development of a longer-term solution to its vehicle needs (i.e., the NGDV).
4-1.1.1 Delivery Vehicle Performance
RHD vehicles offer several operational and ergonomic benefits as compared with LHD vehicles. LHD vehicles are not configured for optimal safety, ergonomics and efficiencies for deliveries to curb-line residential mailboxes when compared to purpose-built RHD vehicles. The existing RHD COTS vehicles hold fewer mail trays at the front of the vehicle, have window openings that limit ergonomic movements, have less cargo space, and restrict internal access to cargo areas (i.e., they are accessible only from outside the vehicle).
The Postal Service’s end-of-life purpose-built RHD delivery vehicles are inefficient, increasingly unreliable, costly to maintain, and not energy-efficient as compared to modern vehicles. Also, the Postal Service's COTS delivery vehicles do not have body components designed for frequent and repetitive use compared to the purpose-built RHD delivery vehicles, increasing vehicle downtime due to more frequent maintenance and repairs. Furthermore, the RHD COTS vehicles, which can be used on routes to deliver to curb-line mailboxes, do not provide the same operational or ergonomic benefits for the carrier as a purpose-built vehicle.
4-1.1.2 Safety and Carrier Conditions
The Postal Service’s existing purpose-built delivery vehicles do not have certain modern features such as airbags, anti-lock brakes, air conditioning, back-up cameras, intermittent windshield wipers, blind-spot warning systems, daytime running lights, or seatbelt reminders found on more modern vehicles. The Postal Service’s existing delivery vehicles also do not provide optimal conditions for carrier efficiency and comfort. Existing LLVs have a windowless cargo area, fewer mail trays at the front of the vehicle, and window openings that limit ergonomic movements, and restrict internal access to cargo areas (i.e., they are accessible only from outside the vehicle). They have circulating fans but no air conditioning, limiting carrier comfort during warmer outdoor temperatures.
RHD vehicles are safer for carriers than LHD vehicles, as LHD-configured vehicles require exiting the vehicle into the roadway when delivering to curb-line mailboxes on the right side of the vehicle.
4-1.1.3 Vehicle Life Expectancy
The RHD purpose-built vehicles (LLV and FFV) have far exceeded their planned life expectancy of 24 years. The NGDV would be designed to provide an effective minimum service life of 20 years. A COTS ICE delivery vehicle such as a well-maintained Ford Transit is expected to last from ten to 15 years before requiring extensive upgrades (Motor and Wheels 2021); however, this is expected to be far less for vehicles placed in delivery service due to frequent and repetitive delivery start/stops. For high mileage postal delivery routes, COTS vehicles have an expected life of six years, while lower mileage postal delivery routes have an eight- to ten-year expected life. COTS BEVs have a typical manufacturer’s warranty of three years or 36,000 miles. Expected battery lifetime is up to ten to twelve years under normal vehicle operations, without frequent, repetitive starts and stops.

United States Postal Service Draft Environmental Impact Statement Environmental Compliance and Risk Management
4-3 August 2021
4-1.1.4 Maintenance
The Postal Service conducts ongoing regular and as-needed maintenance of the delivery fleet to ensure the fleet is available for operational needs. The age and maintenance costs of individual vehicles are tracked to support the decision-making process for a continuous vehicle replacement program. Vehicle replacement begins when the vehicle approaches end-of-life (which for the LLV fleet is 20 years or more).
LLVs have an estimated life of 24 years, and some are more than 30 years old. The LLV all-aluminum body has resisted corrosion exceptionally well over the years, although the main powertrain components have been replaced multiple times and now must be acquired through aftermarket manufacturing. This has significantly increased repair costs, while reducing vehicle performance and reliability. In fact, the Postal Service was required to contract with an alternative supplier to reverse engineer and manufacture the chassis frame to ensure that the LLV could still be kept in service. This has caused the average annual maintenance cost of the LLV to exceed $5,000 and, for 7 percent of the LLVs, to exceed $10,000 annually. Existing delivery vehicles, including LLVs as well as FFVs and COTS vehicles, require more maintenance on body components and drivetrains, and thus have higher maintenance costs than newer delivery vehicles.
The NGDV body, frame, and associated permanently attached structures are designed to maintain design function for 20 years. All vehicle components are repairable/replaceable, including parts availability for replacement over the service life of the vehicle.
COTS ICE vehicles require maintenance similar to existing ICE delivery vehicle routine maintenance requirements. They have, however, been shown to be less reliable in the long run compared to the purpose-built vehicles. BEVs are generally more mechanically reliable than ICE vehicles and would require less scheduled maintenance since BEVs have fewer moving parts (no engine or conventional transmission) and fluids to change (USDOE 2021).
4-1.1.5 Changing Mail Characteristics
In fiscal year (FY) 2020, the Postal Service processed 129.2 billion pieces of mail, 7.3 billion packages, and 64.1 billion pieces of marketing mail and delivered them to 161.4 million delivery points, six (and sometimes seven) days a week (USPS 2021a). When the LLVs and FFVs were first purchased in 1987, the mail consisted primarily of letters and flats. Over the last decade a fundamental shift has occurred, resulting in a large decrease in letter and flats volume and large increase in parcel volume as well as an increase in the total number of delivery points. By FY 2030, total mail volume is projected at approximately 75 billion pieces, a 55 percent decrease from FY 2011; and total parcel volume is projected at approximately 6.6 billion pieces, a 100 percent increase from FY 2011 (USPS 2021a). The LLVs do not support future delivery needs given these projected changes in market demand, parcel mix and an increasing number of delivery points. Postal Service delivery vehicles now need an increased cargo capacity and better access to the parcels in the cargo area.
4-1.2 Existing Postal Service Facilities
The Postal Service’s last-mile delivery fleet operates nationwide from more than 17,000 Post Office locations, Stations and Branches. The Postal Service maintains its fleet of vehicles at Postal Service-owned or leased VMFs strategically located throughout the nation, and uses local commercial vehicle repair and maintenance shops when needed. Delivery vehicles are parked overnight at various Post Office locations. These facilities typically have designated parking lots, garages, and spaces for delivery fleet vehicles; however, some facilities must utilize street parking or shared parking with other buildings.

United States Postal Service Draft Environmental Impact Statement Environmental Compliance and Risk Management
4-4 August 2021
Existing Postal Service VMFs and commercial repair and maintenance shops responsible for maintaining the current vehicles, would continue to maintain the replacement vehicles. Due to the vehicle size difference between the existing vehicles and NGDV, incidental changes to existing facilities may be required. In the event that an existing facility cannot feasibly be modified, new facilities may need to be constructed on USPS property.
4-1.3 Existing Workforce
The Postal Service currently has approximately 240,000 delivery fleet mail carriers. Delivery vehicles include LLVs, FFVs, COTS delivery and mixed delivery vehicles. These vehicles are supported by more than 5,000 automotive technicians, mechanics, body repair personnel, and stockkeepers at more than 300 VMFs. Deployment and maintenance of new NGDV or COTS vehicles would result in minimal to no changes to the total Postal Service vehicle maintenance workforce. The workforce at the Postal Service's existing VMFs, as well as commercial garages for unscheduled repairs throughout the country, is adequate for conducting maintenance on all new delivery vehicles.
4-2 Resources Not Studied in Detail
The Proposed Action and Alternatives 1.1 and 1.2 involve the acquisition and deployment of NGDV or COTS delivery vehicles to replace end-of-life delivery vehicles. The ICE vehicles or BEVs could require interior and exterior alterations to existing VMFs such as bay doors, and/or lift replacement in a small percentage of existing facilities. Additionally, for BEVs, interior and exterior construction to accommodate charging infrastructure and charging stations would be needed. Specific Postal Service facility locations where new vehicles would be deployed and where alterations may be needed are not known at this time. The extent and types of alterations necessary for each Postal Service facility location are not known at this time.
Any alterations needed for the deployment and operation of the NGDV or COTS is expected to be made within the footprint of existing Postal Service property. As discussed in Section 1-3.1, site-specific facility alterations and a potential new training facility are not included in the detailed evaluation of the action alternatives that specifically address the purchase and deployment of new Postal Service vehicles.
Therefore, the following resources would not be affected by the nationwide action, and are not evaluated in detail herein: water, geology, soils, prime farmland, vegetation, wildlife, threatened and endangered species, wetlands and floodplains, cultural resources, land use, wild and scenic rivers and coastal zone. Facility impacts related to construction for needed alterations would comply with federal and state environmental requirements and regulations, and the Postal Service would complete appropriate NEPA reviews at the local level in the future, as needed.
▪ Prime farmland, vegetation, wildlife, threatened and endangered species, wetlands and floodplains, land use and wild and scenic rivers would not be impacted because the alterations would occur within existing facilities’ footprints that have already been developed.
▪ Lift replacements could encounter contaminated soils and groundwater during removal of existing lifts and installation of new lifts. The Postal Service would follow applicable federal, state and local regulatory requirements to address any contamination present. Contaminated soils would be disposed of offsite per regulatory requirements.
▪ Construction for installation of charging stations would incorporate appropriate erosion and stormwater runoff control measures such as silt fencing around the disturbed areas until re-vegetated or restored after construction.

United States Postal Service Draft Environmental Impact Statement Environmental Compliance and Risk Management
4-5 August 2021
▪ Charging stations could be installed at National Register of Historic Places (NRHP)-eligible facilities. A site-specific NEPA evaluation, including Section 106 consultation, would be conducted as required to minimize impacts.
▪ Construction at facilities within the coastal zone would comply with coastal zone consistency requirements.
4-3 Socioeconomics
4-3.1 Socioeconomics – Background and Regulatory Setting
Socioeconomics encompasses the basic economic and social attributes associated with the human environment, particularly economic status, employment, and demographics. NEPA directs federal agencies to identify and address as appropriate the socioeconomic impacts of proposed actions and alternatives, prior to making a decision.
Environmental justice (EJ) addresses EJ issues as directed by Executive Order (EO) 12898, Federal Actions to Address Environmental Justice in Minority Populations and Low-Income Populations and EO 14008, Tackling the Climate Crisis at Home and Abroad. EO 12898 directs agencies to address environmental and human health conditions in minority and low-income communities. The intent of EO 12898, EO 14008, and related directives and regulations is to ensure that low-income and minority populations do not bear a disproportionate burden of negative effects resulting from proposed federal actions.
As an Independent Establishment of the Executive Branch of the U.S. Government, certain EOs, including those mentioned above, do not apply to the Postal Service. However, the Postal Service endeavors to fulfill the spirit of those non-mandatory requirements and consider the impacts of its actions on EJ communities of concern. This includes locations with high concentrations of minority and low-income populations. (USPS 2017)
4-3.2 Socioeconomics – Affected Environment
The following sections describe the socioeconomic conditions within the nation with respect to Community Economics, Employment, and Minority and Low-Income Populations.
4-3.2.1 Community Economics
The Postal Service plays an essential role in commerce by providing basic, fundamental and affordable mail services to the U.S. population. American opinions of the Postal Service are very positive according to a Pew Research Center Survey released in 2020; approximately 91 percent of respondents had a favorable view of the Postal Service, higher than any other federal agency. (Pew Research Center, 2020a)
In 2020, the Postal Service had more than 34,000 Post Office locations, Stations, and Branches in the U.S., which made it the nation’s largest retail network – larger than Walmart (approximately 4,700 U.S. locations) and Starbucks (more than 15,000 U.S. locations). (USPS 2021b) (Walmart 2021) (Starbucks, 2021). The Postal Service operates an extensive transportation, delivery, and distribution network to accomplish delivery of its services. In FY 2020, the Postal Service had approximately 644,000 employees (Table 4-3.1); delivered more than 129 billion pieces of mail to more than 161 million delivery points; 207,945 mixed collection vehicles (0.5 to 2.5 tons) comprising 89.8 percent of the total Postal Service fleet (231,541 vehicles). The number of delivery points increased to 161.3 million in FY 2020, an increase of 0.92 percent as compared to FY 2019; but the number of total routes decreased 0.10 percent as compared to the prior year. (USPS 2020a)

United States Postal Service Draft Environmental Impact Statement Environmental Compliance and Risk Management
4-6 August 2021
Table 4-3.1 2020 Key Postal Service Statistics
Fiscal Year Statistics (first 3 columns); % Change from Prior Year (last 2 columns) FY 2020 FY 2019 FY 2018 FY 2020 FY 2019
Operating Revenue (in millions) $73,123 $71,136 $70,622 2.79% 0.73%
Total Mail and Package Volume (in millions of units) 129,171 142,562 146,402 -9.39% -2.62%
Total Postal Service-managed Offices, Stations and Branches 31,330 31,322 31,324 0.03% -0.01%
Total Employees (both Career and Non-Career) 644,033 633,108 634,447 1.73% -0.21%
Total Delivery Points (in millions) 161,374 159,901 158,558 0.92% 0.85%
Total Number of Delivery Routes 231,579 231,807 231,843 -0.10% -0.02%
Total Number of Delivery and Collection Vehicles (0.5 - 2.5 tons) 207,945 204,274 208,133 1.80% -1.85%
Total Postal Vehicles 231,541 228,940 232,602 1.14% -1.57%
Source: USPS, 2020a. Fiscal Year 2020 Annual Report to Congress, An Essential Public Service. Updated May 2021
The Postal Service positively and directly impacts communities by providing employment at local facilities throughout the nation and through expenditures to local service providers for utilities and supplies associated with the operations and maintenance of its vehicles and facilities. Indirect benefits to other sectors of the local economy occur as a result of direct expenditures by employees and to suppliers, such as increased purchases at retail gas stations and commercial garages.
The 165,000 delivery vehicles proposed for replacement (primarily LLVs and FFVs) consumed about 180 million gallons of fuel (gasoline) in FY 2020 for delivery operations, with the majority purchased at local retail outlets and the remainder purchased from bulk fuel suppliers.
4-3.2.2 Employment
As a major employer, the Postal Service expends approximately 2.1 billion dollars in salaries and benefits every two weeks providing employment in local communities across the nation (USPS, 2021b). U.S. total employment was approximately 203.8 million jobs in 2019; government and government enterprises represented approximately 12.1 percent of the workforce in FY 2019, less than FY 2010 (14.3 percent) and FY 2000 (13.9 percent) (Bureau of Economic Analysis 2021).
The Postal Service had 644,033 employees in FY 2020 of which 495,941 were career employees and 148,092 were non-career employees (Table 4-3.1). Approximately 0.12 percent of the total U.S. workforce, or 242,189, were career delivery carriers (USPS 2020a).
The Postal Service is a leading employer of women and minorities according to Pew Research. In May 2020, The Pew Research Center recognized USPS as “more racially and ethnically diverse than the U.S. labor force as a whole” (Pew Research Center 2020b). The overall U.S. workforce is approximately 78 percent white, while approximately 57 percent of the Postal Service workforce is white. Black Americans make up 13 percent of the national workforce; but comprise 23 percent of the Postal Service workforce (Pew Research Center, 2020b).
4-3.2.3 Minority and Low-Income Populations
The intent of EO 12898, EO 14008 and related directives and regulations is to ensure that minority and low-income populations do not bear a disproportionate burden of negative effects resulting from federal actions.

United States Postal Service Draft Environmental Impact Statement Environmental Compliance and Risk Management
4-7 August 2021
Minorities include individuals who identify themselves as members of the following population groups: American Indian or Alaskan Native, Asian, Native Hawaiian or Other Pacific Islander, Black, Hispanic, or two or more races. For the purposes of EJ analyses, the minority population for a community consists of all non-white individuals as well as all Hispanic or Latino individuals (i.e., of both white and non-white racial origin). CEQ guidance states “minority populations should be identified where either (a) the minority population of the affected area exceeds 50%, or (b) the minority population percentage of the affected area is meaningfully greater than the minority population percentage in the general population or other appropriate unit of geographic analysis” (CEQ 1997).
Low-income populations are identified where individuals have incomes below the U.S. poverty guidelines, updated yearly by the U.S Department of Health and Human Services. A low-income population is either a group of low-income individuals living in proximity to one another or a set of individuals who share common conditions of environmental exposure or effect (CEQ 1997).
The Postal Service delivery network serves delivery points in all communities across the nation, regardless of minority or income status. Minority populations in the U.S. are rising. In 2019, the U.S. had a minority population of 39.9 percent; an increase from 2018 (38.9 percent) and 2017 (38.5 percent) (Table 4-3.2) (USCB 2018a, 2019b, 2019a). The southern portion of the U.S. has a larger share of minorities than the northern portion (PRB.org 2021). As of 2019, the percentage of people with incomes below the U.S. poverty guidelines, fell to 13.4 percent of the population, from 14.1 percent (2018) and 14.6 percent (2017) (USCB 2017, 2018b, 2019c).
Table 4-3.2 Racial Composition and Poverty Status of the United States, 2017 - 2019
Racial Composition 2019 2018 2017
White 60.7% 61.1% 61.5%
Minority 39.3% 38.9% 38.5%
Black or African American 12.3% 12.3% 12.3%
American Indian and Alaska Native 0.7% 0.7% 0.7%
Asian 5.5% 5.4% 5.3%
Native Hawaiian and Other Pacific Islander 0.2% 0.2% 0.2%
Other Race 0.2% 0.2% 0.2%
Two or More Races 2.4% 2.4% 2.3%
Hispanic or Latino 18.0% 17.8% 17.6%
Percent Below Poverty Level 13.4% 14.1% 14.6% Source: (USCB, 2017, 2018a, 2018b, 2019b, 2019c, 2019a)
4-3.3 Socioeconomics – Environmental Consequences
4-3.3.1 Proposed Action and Alternatives 1.1 and 1.2
Community Economics
Under the Proposed Action ICE NGDV Hypothetical Maximum, the purchase and deployment over a ten-year period of ICE NGDV would be more fuel efficient (see Energy Requirements and Conservation, Section 4-9.3.1, below) than the existing end-of-life delivery vehicles, resulting in lower overall Postal Service fuel (gasoline) purchases and corresponding reductions in air emissions (see Air Emissions, Section 4-6.3.2). Additionally, replacing any of the current ICE vehicles with BEVs, such as under the BEV NGDV Hypothetical Maximum, would lower the Postal Service's total future

United States Postal Service Draft Environmental Impact Statement Environmental Compliance and Risk Management
4-8 August 2021
fuel purchases for its delivery fleet. Alternative 1.1 (COTS ICE vehicles) would increase fuel (gasoline) consumption due to lower average mpg than the average mpg of the existing delivery fleet (see Section 4-9.3.3), while replacement of the aged delivery vehicles would decrease air emissions (see Section 4-6.3.4). Local retail outlets and bulk fuel suppliers would experience a decrease in revenue under both Proposed Action Hypothetical Maxima and under Alternative 1.2 (COTS BEVs). Local utility providers would experience an increase in revenue due to the Postal Service's purchase of electricity to power BEVs at its facilities (see Section 4-6.3.1).
The economic impact due to a reduction in purchase of delivery vehicle replacement parts would be partially offset by the scrapping or resale for parts. (see Section 4-10.3.1). The need for commercial garage maintenance due to unscheduled repairs of vehicles is anticipated to decrease, as high-maintenance cost vehicles would be removed from the fleet, and maintenance time and money could be focused on preventive maintenance of newer vehicles.
The adverse impacts to commercial fuel retailers and bulk fuel suppliers from lower overall fuel sales; economic benefits from scrapping or resale of parts, waste management and disposal; and adverse economic impacts to commercial garages due to less need for unscheduled repairs would be insignificant compared to the nationwide economy.
Employment
Vehicle replacements would not change the number or location of delivery personnel or vehicle maintenance employees, the number of vehicles on a national basis, or the number of VMFs. Thus, employment would not be impacted.
Minority and Low-Income Populations
Since deliveries would continue to be made to the more than 161 million delivery points regardless of socioeconomic status, both the Proposed Action and Alternatives would result in no impact on minority or low-income populations in terms of mail service or disproportionately high adverse economic effect.
The Postal Service would evaluate ICE and BEV deployment based on existing nationwide delivery route characteristics and other established factors to prioritize potential placement of the two powertrains. Route characteristics for placement of BEVs would include routes located in mild temperature ranges, routes with frequent and numerous curb-line stops as electric motors are more efficient than ICE in this stop-and-do duty cycle, routes in locations with compromised air quality, and/or states with proactive BEV policies and regulations.
Both the Proposed Action and Alternatives would result in negligible beneficial impacts on air quality due to higher emission controls as compared to the high-maintenance and end-of-life delivery vehicles being replaced. Both the Proposed Action and Alternative 1.2 would result in negligible beneficial impacts on air quality due to better gas mileage of the newly purchased vehicles as compared to the high-maintenance and end-of-life delivery vehicles being replaced. Such beneficial impacts would occur regardless of race or socioeconomic status.
Both the Proposed Action and Alternatives would also result in safety and ergonomic improvements for delivery employees and the general public, and decrease the risk of accidents due to mechanical failure or fewer modern safety features associated with the existing delivery vehicles. These beneficial impacts would occur regardless of race or socioeconomic status.

United States Postal Service Draft Environmental Impact Statement Environmental Compliance and Risk Management
4-9 August 2021
4-3.3.2 No-Action Alternative
Community Economics
Revenues to local service providers for utilities and supplies associated with the operations and maintenance of the Postal Service's vehicles and facilities would not change. Indirect benefits to other sectors of the local economy occur as a result of direct expenditures by employees and to suppliers, such as increased purchases at retail gas stations and commercial garages
Delivery vehicle breakdown incidents would increase over time as the vehicles continue to age. The need for unscheduled repairs would increase, and requests for maintenance, as well as maintenance costs would increase. Commercial garages would likely experience increased revenues.
Employment
Continued use of the existing delivery vehicles would result in no changes to the total Postal Service carrier or vehicle maintenance workforce. The workforce at the Postal Service's existing VMFs, as well as commercial garages for unscheduled repairs throughout the country, would continue to perform maintenance on all delivery vehicles.
Minority and Low-Income Populations
Unlike the Proposed Solution and Alternatives 1.1 and 1.2, the No-Action Alternative would not enhance the safety of delivery personnel or the general public, as the end-of-life delivery vehicles do not have certain modern safety or operational features and breakdowns could occur on roadways at inopportune times. All customers, regardless of race or socioeconomic status, could experience delays in mail delivery as individual delivery vehicles experience maintenance issues.
4-4 Transportation
4-4.1 Transportation – Background and Regulatory Setting
State Departments of Transportation (DOTs) are generally responsible for their state highway systems and the federal highways and interstates within their boundaries. Arterials, connectors, rural roads, and local roads are typically the responsibility of county or city governments. Local governments determine whether a noise impact analysis is required for proposed actions. The threshold used to determine whether a transportation impact analysis is needed and the definition of the threshold can vary by jurisdiction. The Postal Service is not subject to local requirements, but often follows those transportation regulations and thresholds. The Institute of Transportation Engineers (ITE) publication Transportation Impact Analyses for Site Development (ITE 2010) suggests that in lieu of a locally preferred or required determinant, an appropriate threshold is the addition of 100 or more new inbound or outbound vehicle trips during the surrounding area or adjacent roadway’s peak hour of traffic.
4-4.2 Transportation – Affected Environment
Postal Service delivery routes are located in urban, suburban and rural areas. Urban areas are generally characterized by a complex and extensive system of roads, including major freeways, arterials, and surface streets. Urban roads typically support high levels of traffic, which often result in roadway segment and intersection congestion. Suburban environments can be characterized by fewer roads and a predominance of two-lane and four-lane roads. Generally, rural roads have lower traffic volumes with minimal congestion.

United States Postal Service Draft Environmental Impact Statement Environmental Compliance and Risk Management
4-10 August 2021
4-4.2.1 Overview of the Postal Service Transportation Network
The Postal Service transportation network is responsible for moving large volumes of mail and packages from a mailer or domestic point of entry to a receiver or domestic point of export. The transportation fleet is divided into two major categories: Logistics, which is responsible for moving mail and packages to and from processing facilities, and Delivery, or "Last Mile," which is responsible for moving mail and packages between Post Offices and delivery points in the community. This EIS is focused on the Delivery fleet of vehicles. This transport occurs primarily on city streets, county roads, and major highways.
4-4.2.2 Traffic
Over 122 million cars and almost 160 million trucks were registered in the U.S. in 2018 (USDOE 2021). The current Postal Service delivery fleet of more than 217,000 custom-built and COTS vehicles traveled approximately 1.2 billion miles in FY 2019. The delivery vehicles travel roads and highways in both city and rural environments with varying traffic densities and levels of congestion. Carriers typically pick up mail and leave on delivery routes in the morning primarily before 10:00 a.m., after morning rush hour. These carriers complete their routes and typically return to the facility in the mid-afternoon before evening rush hour.
4-4.2.3 Safety, Accessibility, and Parking
Site circulation, parking, and accessibility for most Postal Service facilities comply with the Postal Service Handbook RE-4, Standards for Facility Accessibility (USPS 2005). Parking areas for Postal Service vehicles are typically gated or otherwise access-controlled for authorized users. Any parking or vehicle safety-related issues identified are handled per Postal Service safety requirements. Designated public parking is available at most Post Offices, Branches, and Stations.
The Postal Service emphasizes safety for all aspects of the transportation network. Postal Service policy document Handbook EL-804, Safe Driver Program (USPS June 2013), provides driver safety guidance and policies and also addresses or references safety standards related to Postal Service vehicles. In addition, the Postal Service follows local standards for additional traffic safety at the facility level. Vehicle incidents are tracked and used to address safety issues and improve Postal Service safety performance.
The existing, end-of-life delivery fleet vehicles do not have certain modern safety features such as airbags, anti-lock brakes, air conditioning, back-up cameras, intermittent windshield wipers, blind-spot warning systems, daytime running lights, or seatbelt reminders found on more modern vehicles.
4-4.2.4 Public Transportation
The Postal Service works to minimize petroleum use by encouraging carpooling and public transportation, and expanding use of web-based technologies for meetings and training. Some Postal Service employees use public transportation to travel to and from work each day or periodically where available. This public transportation is typically located in metropolitan areas near the Postal Service’s facilities. Where available, the Postal Service encourages employees to participate in ride-share and trip-reduction programs. In addition, the Postal Service maintains a Commuter Benefits Program that offers tax-free cost benefits that promote various commuting options, including public transit and vanpooling (USPS 2020).

United States Postal Service Draft Environmental Impact Statement Environmental Compliance and Risk Management
4-11 August 2021
4-4.3 Transportation – Environmental Consequences
4-4.3.1 Proposed Action
Traffic
Under either the ICE NGDV Hypothetical Maximum or the BEV NGDV Hypothetical Maximum, the Proposed Action would have no or negligible impact on traffic. As high-maintenance and end-of-life vehicles would be replaced at various postal locations on a one-for-one basis, there would be no increase in the number of delivery vehicles or routes or Postal Service employee commuter trips.
Safety, Accessibility, and Parking
The NGDV's modern safety features such as airbags, anti-lock brakes, air conditioning, back-up cameras, intermittent windshield wipers, blind-spot warning systems, daytime running lights, or seatbelt reminders would improve operational safety as compared to use of the existing delivery vehicles. Additionally, the RHD-configuration of the custom-built NGDV would be safer that LHD options for carriers and the public during deliveries to curb-line mailboxes, as it would not require the carrier to exit the vehicle for deliveries.
Under both Hypothetical Maxima, the Proposed Action would have no or negligible impact on access to Postal Service facilities and parking. Parking areas for Postal Service delivery vehicles are dedicated, and there would be a one-for-one replacement of aged delivery vehicles. Thus, there would be no or negligible impact on access to Postal Service facilities and parking. BEV charging stations would be installed within dedicated Postal Service vehicle parking areas, and would not impact existing public parking available at Post Office locations, Branches, and Stations.
Public Transportation
The Proposed Action scenario would have no impact on Postal Service employee use of public transportation, or participation in ride-share and trip-reduction programs or the Postal Service’s Commuter Benefits Program.
4-4.3.2 Alternative 1.1 – 100% RHD COTS ICE Vehicles
Traffic
Alternative 1.1 would have no or negligible impact on traffic. There would be no increase in the number of delivery vehicles or routes, or Postal Service employee commuter trips.
Safety, Accessibility, and Parking
The new RHD COTS ICE vehicles would have modern safety features such as airbags, anti-lock brakes, air conditioning, back-up cameras, intermittent windshield wipers, blind-spot warning systems, daytime running lights, or seatbelt reminders. Modern safety features would improve operational safety as compared to use of the existing delivery vehicles. Additionally, the RHD-configuration would be safer for carriers and the public during deliveries to curb-line mailboxes, as it would not require the carrier to exit the vehicle for deliveries.
Alternative 1.1. would have no or negligible impact on access to Postal Service facilities or parking. Parking areas for Postal Service delivery vehicles are dedicated, and there would be a one-for-one replacement of aged delivery vehicles.

United States Postal Service Draft Environmental Impact Statement Environmental Compliance and Risk Management
4-12 August 2021
Public Transportation
Alternative 1.1 would have no impact on Postal Service employee use of public transportation, or participation in ride-share and trip-reduction programs or the Postal Service’s Commuter Benefits Program.
4-4.3.3 Alternative 1.2 – 100% LHD COTS BEVs
Traffic
Alternative 1.2 would have no or negligible impact on traffic. There would be no increase in the number of delivery vehicles or routes, or Postal Service employee commuter trips.
Safety, Accessibility, and Parking
The new LHD COTS BEVs would have modern safety features such as airbags, anti-lock brakes, air conditioning, back-up cameras, intermittent windshield wipers, blind-spot warning systems, daytime running lights, or seatbelt reminders. This would improve operational safety as compared to use of the existing delivery vehicles. However, LHD COTS vehicles would require carriers to exit the vehicle for curb-line deliveries. Thus, LHD COTS BEVs would not provide the operational and ergonomic benefits of RHD vehicles and therefore would not provide the same safety performance for mail carriers.
Alternative 1.2 would have no or negligible impact on access to Postal Service facilities and parking. Parking areas for Postal Service delivery vehicles are dedicated, and there would be a one-for-one replacement of delivery vehicles. BEV charging stations would be installed within dedicated Postal Service vehicle parking areas, and would not impact existing public parking available at Post Office locations, Branches, and Stations.
Public Transportation
Alternative 1.2 would have no impact on Postal Service employee use of public transportation, or participation in ride-share and trip-reduction programs or the Postal Service’s Commuter Benefits Program.
4-4.3.4 No-Action Alternative
Traffic
Existing traffic levels associated with current Postal Service operations would not change as a result of the No-Action Alternative. There would be no change in traffic levels associated with mail delivery or delivery carrier commuter trips under the No-Action Alternative. As a result of not replacing the existing end-of-life delivery vehicles, the vehicles could experience more frequent breakdowns, potentially resulting in safety concerns and traffic delays on roadways.
Safety, Accessibility, and Parking
Carriers would continue to drive the existing high-maintenance and end-of-life delivery vehicles that do not have certain modern safety features such as airbags, anti-lock brakes, air conditioning, back-up cameras, intermittent windshield wipers, blind-spot warning systems, daytime running lights, or seatbelt reminders. Improvement in operational safety would not be realized. The existing delivery vehicles could experience more frequent breakdowns, potentially resulting in safety concerns for carriers and the public. No change in existing accessibility to Postal Service facilities or parking would occur.

United States Postal Service Draft Environmental Impact Statement Environmental Compliance and Risk Management
4-13 August 2021
Public Transportation
There would be no change in use of public transportation as a result of the No-Action Alternative, nor would there be a change in Postal Service employee participation in ride-share and trip-reduction programs or the Postal Service’s Commuter Benefits Program.
4-5 Noise
4-5.1 Noise – Background and Regulatory Setting
Noise can be an unwanted sound that interferes with or disrupts normal human activities. The principal human response to noise is annoyance. Inadequately controlled noise can present a danger to health and welfare, particularly in urban areas. Major sources of noise are traffic, machinery and equipment, and commercial noise sources (EPA 2021a). The Noise Control Act of 1972 (42 USC §4901 et seq.,1972) establishes a national policy to promote a noise environment free from noise that would jeopardize health and welfare. The primary responsibility for noise control lies with state and local governments. Noise pollution also is addressed in the Clean Air Act (Subchapter IV and Title IV – Noise Pollution). Additional background information is presented in Appendix E.
Many noise sources, such as vehicle traffic and construction, generate noise and contribute to the impact on the total noise environment. This noise is generally transitory and represents a negligible contribution to the overall noise environment. Response to noise varies, depending on the type and characteristics of the noise, distance between the noise source and receptor, receptor sensitivity, and time of day. A noise-sensitive receptor is defined as a land use where people involved in indoor or outdoor activities may be subject to stress or considerable interference from noise. Noise-sensitive locations or facilities include residential dwellings, hospitals, nursing homes, educational facilities, and libraries.
Vehicle noise is comprised of three general sources: aerodynamic noise (air passing over vehicles), propulsion noise (engine, exhaust, and drivetrain), and tire-pavement noise (tires rolling on roadway surface). Primary noise from BEVs is caused by wind resistance and tire noise, while primary noise from ICE is caused by propulsion noise. Propulsion noise from a BEV is quieter than from an ICE vehicle at speeds less than 15 miles per hour because propulsion noise generated by the ICE vehicle dominates any aerodynamic and tire-pavement noise.
4-5.2 Noise – Affected Environment
Recommended noise levels in urban and suburban environments generally range from 45 dBA, (decibels [A-weighted scale]) (indoor) to 55 dBA (outdoor), depending on the time of day and location (residential or commercial land use) (King, et.al. 2012). Day-night sound levels measured at over 100 residential sites in urban and suburban areas across the U.S. ranged from approximately 50 to 75 dB (Bishop and Simpson 1977).
Postal Service facilities are located primarily in more urban or suburban settings. Noise levels in these environments vary continuously over a period of time depending on the contributing sound sources within the noise environment. Existing delivery vehicle maintenance operations contribute to ambient noise around VMFs; and traffic from delivery vehicles contributes to ambient noise around Postal Service facilities during vehicle arrivals and departures, primarily before 10:00 a.m., after morning rush hour, and return in the mid-afternoon before evening rush hour. The Postal Service follows an internal anti-idling policy that is supportive of local noise ordinances. Vehicle maintenance operations are primarily conducted inside VMFs, and each delivery event occurs at a specific destination over a very short duration. Therefore, Postal Service delivery vehicle-related operations have minimal effects

United States Postal Service Draft Environmental Impact Statement Environmental Compliance and Risk Management
4-14 August 2021
on the overall existing ambient noise conditions within affected neighborhoods, with noise levels dominated by other traffic and daily activities.
4-5.3 Noise – Environmental Consequences
4-5.3.1 Proposed Action
Under both the ICE NGDV Hypothetical Maximum and BEV NGDV Hypothetical Maximum, the Proposed Action would have no adverse impact on the noise environment. The number of delivery vehicles or routes would not increase. BEVs are expected to be 4 to 5 dB quieter than the ICE vehicles at low speed (6 to 12 miles per hour [mph]), while the difference in emitted noise from the two drivetrains would be similar at speeds above approximately 19 mph when tire/road noise would dominate (Danish Road Directorate 2015).
No change in existing noise levels from Postal Service delivery and delivery vehicle maintenance operations would occur under the Proposed Action. Nor would additional noise be emitted from charging batteries.
4-5.3.2 Alternatives 1.1 and 1.2 – COTS Vehicles
Alternatives 1.1 and 1.2 would have no adverse impact on the noise environment. There would be no increase in the number of delivery vehicles or routes. The COTS vehicles would be quieter than the aged delivery vehicles being replaced due to more modern technology, resulting in a beneficial reduction in emitted noise. The ICE vehicles are expected to be 4 to 5 dB louder than the BEVs at low speed (6 to 12 mph). However, the difference in emitted noise between the ICE and BEV powertrains would be similar at speeds above approximately 19 mph when tire/road noise would dominate (Danish Road Directorate 2015).
No change in existing noise levels from Postal Service delivery and delivery vehicle maintenance operations would occur under either Alternative 1.1 or 1.2. Nor would additional noise be emitted from charging batteries.
4-5.3.3 No-Action Alternative
Under the No-Action Alternative, new delivery vehicles would not be purchased and high-maintenance and end-of-life delivery vehicles would continue to be maintained until maintenance was no longer feasible. Emitted noise from the delivery fleet and Postal Service facilities would remain the same. The No-Action Alternative would have negligible impact on noise environment.
4-6 Air Quality
4-6.1 Air Quality – Background and Regulatory Setting
4-6.1.1 Clean Air Act and National Ambient Air Quality Standards
The Clean Air Act (CAA) directs the EPA to protect and improve air quality across the U.S. As a requirement of the CAA, EPA established National Ambient Air Quality Standards (NAAQS) for six criteria pollutants in order to protect public health and welfare nationwide. These criteria pollutants are carbon monoxide (CO), nitrogen dioxide (NO2), ozone (O3), sulfur dioxide (SO2), lead (Pb), and particulate matter [measured as less than 10 microns in diameter (PM10) and less than 2.5 microns in diameter (PM2.5)]. (see Appendix F)
Attainment areas are geographic areas that are and have historically been in compliance with the NAAQS; nonattainment areas violate a NAAQS for the applicable pollutant; and maintenance areas

United States Postal Service Draft Environmental Impact Statement Environmental Compliance and Risk Management
4-15 August 2021
have transitioned from nonattainment to attainment and are required to adhere to maintenance plans to ensure continued attainment. The CAA requires states to develop a general plan to attain and maintain the NAAQS in all areas of the country and a specific plan known as a State Implementation Plan (SIP) to attain the NAAQS for each area designated nonattainment.
4-6.1.2 General Conformity
The purpose of the General Conformity rule is to ensure that federal activities do not cause or contribute to a violation of NAAQS or otherwise delay attainment of NAAQS. Therefore, federal entities are required to demonstrate that the total direct or indirect emissions from a federal action will conform to the SIP or not otherwise interfere with a state’s ability to attain and maintain the NAAQS. The General Conformity rule applies to all federal actions that are taken in designated nonattainment or maintenance areas with some exceptions, including actions with associated emissions below specified de minimis levels.
The EPA established de minimis emission levels for each criteria pollutant to limit the need to conduct conformity determinations for federal projects with minimal emission increases. De minimis levels vary by pollutant and also depend on the severity of the nonattainment status for the areas of concern as presented in Table F-2 in Appendix F. When the total direct and indirect emissions from a proposed project are below the de minimis levels, the project would not be subject to a conformity determination.
4-6.1.3 Greenhouse Gas
Global climate change is a transformation in the average weather of the Earth, which can be measured by changes in temperature, wind patterns, and precipitation. Scientists have identified human-related greenhouse gas (GHG) emissions as a significant contributor to global climate change (NOAA 2021). GHGs effectively trap heat in the atmosphere and influence Earth’s temperature, causing the greenhouse effects. The key GHGs emitted by human activities are carbon dioxide (CO2), methane (CH4), and nitrous oxide (N2O). GHGs differ in their ability to trap heat. To account for this, a weighting factor called the Global Warming Potential (GWP) is defined for a gas relative to the heat-trapping ability of the same mass of CO2, and emissions are normally expressed in terms of CO2 equivalents (CO2e). For example, the GWP of CO2 is 1, whereas the GWP of N2O is 298.
The CEQ’s NEPA Guidance on GHG and climate change impact assessment is currently under review. In the absence of updated guidance, GHG emissions and climate change impact were assessed based on the Final Guidance for Federal Departments and Agencies on Consideration of Greenhouse Gas Emissions and the Effects of Climate Change in National Environmental Policy Act Review (CEQ 2016). The 2016 guidance explains that the analysis should consider (1) the potential effects of a proposed action on climate change as indicated by assessing GHG emissions, and (2) the effects of climate change on a proposed action and its environmental impacts.
4-6.1.4 Social Cost of Greenhouse Gas (Carbon)
The Postal Service voluntarily complies with the requirements of various EOs. EO 13990 (86 FR 14 [January 25, 2021]) re-established the Interagency Working Group and directed it to ensure that Social Cost of GHG (also referred to as the Social Cost of Carbon or SCC) estimates reflect the best available science and work towards approaches that take into account, climate risk, environmental justice, and intergenerational equity (Interagency Working Group 2021).
The SCC is an assigned marginal cost used to facilitate a policy and decision-making assessment of the costs and benefits of increased GHG emissions. The SCC represents a monetization of the damages associated with the incremental changes in GHG (e.g., increased flood risk, disruption of energy systems, environmental damage) on society. The assessed cost would provide a benchmark

United States Postal Service Draft Environmental Impact Statement Environmental Compliance and Risk Management
4-16 August 2021
for the economic evaluation of a proposed action. The SCC is used to estimate in dollars all economic damage as to how much it is worth today to avoid the damage that is projected for the future.
4-6.2 Air Quality – Affected Environment
4-6.2.1 Air Emissions
Mobile Sources
Existing Postal Service mobile source air emissions include operation of more than 218,000 delivery fleet vehicles, including the 165,000 delivery vehicles that would be replaced, as well as other vehicles used in its air and surface transportation operations.
Stationary Sources
Stationary air pollution sources at Postal Service facilities can include boilers, emergency power generators, painting operations, parts washers, and fuel storage tanks. Replacing the high-maintenance and end-of-life delivery vehicles on a one-to-one basis would not result in the need for additional facilities to maintain the new vehicles, nor in changes in existing or additional stationary sources. Current Postal Service stationary sources minimally impact air quality; operations follow applicable regulatory requirements, and the Postal Service applies for and complies with applicable environmental permits where required. No air emissions are expected to be emitted from electric battery charging stations that would be installed at Postal Service facilities to support BEVs. Since stationary source air impacts are not anticipated, stationary emissions were not assessed in this EIS
4-6.2.2 General Conformity
Air quality conditions vary widely across the geographic area in which the Postal Service operates the vehicles planned for replacement. EPA has designated nonattainment area for criteria pollutants throughout the U.S. based on historical compliance data against NAAQS.
4-6.2.3 Greenhouse Gas
The Postal Service generates GHG emissions from facility energy use, transportation fuel use, waste generation, employee commuting, contracted transportation services, and other sources. The Postal Service’s target is to reduce, by FY 2025, GHG emissions by 30 percent from its 2008 baseline, and through 2019, the USPS had achieved a 28.3 percent reduction toward its goal (USPS 2020).
Delivery fleet vehicles emit a variety of gases during their operations, some of which are GHGs, including CO2, CH4, and N2O. The nationwide total GHG emissions, or “carbon dioxide equivalent (CO2e),” currently generated by the Postal Service and calculated based on 2019 data are estimated to be 6,374,480 Metric Tons (MT) CO2e (USPS 2020), which consist of:
▪ 2,199,409 MT CO2e direct emissions including owned vehicles and building heating,
▪ 1,901,846 MT CO2e of energy indirect emissions including purchased electricity and steam, and
▪ 2,273,225 MT CO2e of other indirect emissions including transmission and distribution losses, employee air and ground business travel, employee commuting, contracted wastewater treatment, and contracted solid waste disposal.

United States Postal Service Draft Environmental Impact Statement Environmental Compliance and Risk Management
4-17 August 2021
4-6.3 Air Quality – Environmental Consequences
4-6.3.1 Analysis Methodology
Air Emissions
The estimate of nationwide air emissions from each of the Proposed Action Hypothetical Maxima and Alternatives was calculated based on the total number of vehicles, the mileage per year and the emission factors. Because of the one-to-one vehicle replacement and no planned increase in total route length, the miles associated with the new delivery vehicles would be the same as the replaced delivery vehicles on a nationwide basis. Given the ten-year timeframe, the overall net changes in combined emissions after the completion of the action were compared in lieu of year by year comparisons.
Air emission factors vary based on the type of vehicle. Emissions were estimated using the EPA MOtor Vehicle Emission Simulator (MOVES) model, a state-of-the-science emission modeling system that estimates emissions for mobile sources for criteria pollutants, GHGs, and air toxics.
The MOVES model does not account for emissions from generation of electricity for BEVs. It assumes fully electric vehicles have no tailpipe or evaporative emissions and that brake and tire wear emissions are identical to conventional vehicles. Therefore, only particulate matter emissions are associated with brake and tire wear from BEV operation, while all six criteria pollutants emissions are associated with ICE vehicle operation.
General Conformity
The applicability of the General Conformity rule was determined based on the net changes of the total emissions that could occur in any nonattainment or maintenance area as a result of the Proposed Action scenarios and Alternatives.
Greenhouse Gas
The potential effects of the Proposed Action and Alternatives on climate change were evaluated by estimating GHG emissions from several elements. The 2016 CEQ guidance does not establish any particular quantity of GHG emissions as “significantly” affecting the quality of the human environment or give greater consideration to the effects of GHG emissions and climate change over other effects on the human environment. Therefore, instead of comparing the estimated GHG emissions from each action to a certain threshold, the estimated GHG emissions from each of the Proposed Actions and Alternatives were compared. Each action’s emissions were calculated as a percentage of the total emissions generated by the Postal Service.
The indirect emissions were also quantified due to electricity consumption from the proposed BEVs and fuel (gasoline) consumption from the proposed ICE vehicles. Lastly, the aggregate direct and indirect Social Cost on the GHG emissions associated with each of the Proposed Actions and Alternatives were calculated as a combined impact analysis.
Direct Tailpipe GHG Emissions
The direct tailpipe nationwide GHG emission changes associated with each of the Proposed Action scenarios and Alternatives were calculated as emission change of CO2e.

United States Postal Service Draft Environmental Impact Statement Environmental Compliance and Risk Management
4-18 August 2021
Energy Consumption GHG Emissions
The environmental “footprint” of fuel purchases were further evaluated to better understand the environmental impacts using different tools such as the Emissions & Generation Resource Integrated Database (eGRID) (EPA 2021d) and/or Greenhouse Gases, Emissions, and Energy use in Technologies (GREET) (Argonne National Laboratory). This aggregated analysis includes energy (e.g., indirect emissions associated with electricity consumption by BEVs) and operation (e.g., direct emissions from fuel consumption by ICE vehicles), but does not include a full life cycle cost (e.g., vehicle production, etc.).
The combined direct tailpipe GHG emissions and the indirect GHG emissions associated with energy consumption by vehicle fuel associated with the Proposed Action and Alternative scenarios were used to evaluate the total aggregated GHG emissions.
Effects of Climate Change
The EIS also evaluated whether climate change would impact the Proposed Action scenarios and Alternatives.
Social Cost of Greenhouse Gas (Carbon)
Based on the social costs of CO2, CH4, and N2O provided in the U.S. Interagency Working Group (IWG) interim technical guidance (IWG 2021), the aggregate social cost on the GHG emissions was calculated in five-year increments based on a 20-year project life span after 2030. The estimates consider discount rates of 2.5 to 5 percent, with this range reflecting the current range of variability assessing the present value of future climate change damages. The higher discount rate results in a lower present value for future climate change damages.
4-6.3.2 Proposed Action – 90% ICE NGDV with at least 10% BEV NGDV
Air Emissions
Under this Hypothetical Maximum, the estimated operational emissions on an annual basis for the Proposed Action is presented in Table 4-6.1. Overall, there would be a net emissions decrease for all applicable pollutants. Therefore, under the ICE NGDV Hypothetical Maximum, the Proposed Action would have a beneficial effect on current air quality as compared to existing conditions or to the No-Action Alternative. Detailed calculations of direct air emissions using the MOVES model are presented in Appendix F.
Table 4-6.1 Net Air Emission Changes from Nationwide Action (90% ICE NGDV and 10% BEV NGDV) Calculated Based on MOVES Model
tpy = Tons per Year MT = Metric Tons
Air Emissions
VOC (tpy)
NOx
(tpy)
CO
(tpy)
PM2.5
(tpy)
PM10
(tpy) SO2
(tpy)
CO2e
(MT)
New 90% ICE NGDV
9.60 10.65 402.74 11.61 76.43 1.97 280,565
New 10% BEV NGDV
-- -- -- 1.07 8.24 -- --
Replaced Vehicles (LLVs/FFVs/Metris)
-935.99 -2,264.31 -11,496 -59.14 -136.72 -3.72 -537,415
Net (Total) -926.39 -2,253.67 -11,093 -46.47 -52.06 -1.75 -256,850

United States Postal Service Draft Environmental Impact Statement Environmental Compliance and Risk Management
4-19 August 2021
General Conformity
On a national scale, the one-to-one delivery vehicle replacement under this Hypothetical Maximum is anticipated to affect operational emissions in certain nonattainment or maintenance areas. However, because no increase in travel route and/or vehicle travel miles would occur, there would be a net reduction in emissions for all criteria pollutants within all affected nonattainment or maintenance areas nationwide due to the use of new vehicles operating with less air emissions. Instead of assessing area-level net emission changes, this analysis assumed that the area-level net emission changes would follow the same trend on the nationwide scale. Accordingly, as shown in Table 4-6.1, the calculated potential emissions decrease for all pollutants in any nonattainment or maintenance area would be below any de minimis threshold for all applicable criteria pollutants; therefore, the General Conformity rule does not apply to the Proposed Action under this Hypothetical Maximum.
Greenhouse Gas
Direct Tailpipe GHG Emissions
Under this Hypothetical Maximum, the Proposed Action would result in an emission decrease of 256,850 MT of CO2e (Table 4-6.1), thus having a beneficial effect on current GHG emissions. This action would result in less reduction in direct tailpipe GHG emissions by 280,565 MT of CO2e as compared to the 100 percent BEV scenarios, and thus have less benefit than the BEV action scenarios; but it has a greater reduction in direct tailpipe GHG emissions by 31,174 MT of CO2e as compared to Alternative 1.1.
Energy Consumption GHG Emissions
As shown in Table 4-6.2, the total net aggregated emissions for this Hypothetical Maximum indicate 290,306 MT decrease in CO2e compared to the No-Action alternative, indicating a beneficial effect on current GHG emissions. Current Postal Service generated-GHG emissions would be reduced by approximately 5 percent.
Table 4-6.2 Net Aggregated (Direct and Indirect) Air Emission Changes (90% ICE NGDV and 10% BEV NGDV) Calculated Based on MOVES, eGRID, and GREET Models
tpy = Tons per Year MT = Metric Tons Notes:
1 NA = not available, as eGRID does not provide VOC, CO, and PM10 emissions factor data for the upstream sources. Therefore, the
aggregated net emissions for VOC, CO and PM10 were not calculated. 2 The emissions increase associated with New 90% ICE NGDV is a summation of direct tailpipe emissions based on the MOVES model and indirect emissions estimated based on the GREET model. The indirect emissions represent air emissions associated with the fuel
(e.g., gasoline) cycle from well pad to fuel pump that corresponds to the fuel purchases (e.g., energy consumption) by ICE. 3 The emission increase associated with New 10% BEV NGDV is a summation of direct tailpipe emissions based on the MOVES model and indirect emissions estimated based on eGRID. The indirect emissions represent air emissions associated with electricity generation
from U.S. electric power sector that corresponds to the electricity purchases (e.g., energy consumption) by BEV. 4 The emission decrease associated with Replaced Vehicles (LLVs/FFVs/Metris) is a summation of direct tailpipe emissions based on the MOVES model and indirect emissions estimated based on the GREET model.
Air Emissions VOC (tpy)
NOx
(tpy)
CO
(tpy) PM2.5
(tpy) PM10
(tpy)
SO2
(tpy)
CO2e
(MT)
New 90% ICE NGDV 880.29 1,186.20 929.60 91.75 294.00 822.14 995,643
New 10% BEV NGDV NA1 41.27 NA1 5.59 NA1 38.10 46,748
Replaced Vehicles (LLVs/FFVs/Metris) -1,903.42 -3,570.48 -12,081.32 -148.19 -378.47 -915.03 -1,332,698
Net (Total) NA1 -2,343 NA1 -51 NA1 -55 -290,306

United States Postal Service Draft Environmental Impact Statement Environmental Compliance and Risk Management
4-20 August 2021
Effects of Climate Change
No effects of climate change are expected.
Social Cost of Greenhouse Gas (Carbon)
Table 4.6-3 provides the estimated total social costs of carbon from the Proposed Action under this Hypothetical Maximum, starting from 2030 as the Proposed Action is near completion. The social costs of carbon are based on operational emissions per year in five-year increments over the estimated 20-year project lifespan.
Table 4-6.3 Calculated Social Cost of Carbon (90% ICE NGDV and 10% BEV NGDV)
Under this Hypothetical Maximum, the Proposed Action would result in a positive investment impact in terms of social cost, as calculations indicated a decrease in cost values. Detailed itemized social cost calculations are presented in Appendix F.
4-6.3.3 Proposed Action – 100% BEV NGDV
Air Emissions
Under the 100 percent BEV NGDV Hypothetical Maximum, the estimated operational emissions on an annual basis for the Proposed Action (calculated using the MOVES model) are presented in Table 4-6.4. Overall, this action would result in a net emissions decrease for all applicable pollutants. Therefore, this action would have a beneficial effect on current air quality as compared to existing conditions or to the No-Action Alternative.
This Proposed Action would result in a greater reduction in the direct (tailpipe) operational emissions by 9.60 tpy of VOC, 10.65 tpy of NOx, 403 tpy of CO, 2.02 tpy of PM2.5, 2.28 tpy of PM10 and 1.97 tpy of SO2 as compared to the Proposed Action’s 90% ICE NGDV Hypothetical Maximum. The Proposed Action would result in a greater reduction in the direct operational emissions by 10.67 tpy of VOC, 11.83 tpy of NOx, 447 tpy of CO, 2.24 tpy of PM2.5, 2.54 tpy of PM10 and 2.19 tpy of SO2 as compared to Alternative 1.1. The Proposed Action would result in a greater reduction in the direct operational emissions by 935.99 tpy of VOC, 2,264.31 tpy of NOx, 11,496 tpy of CO, 48.49 tpy of PM2.5, 54.34 tpy of PM10 and 3.72 tpy of SO2 as compared to the No-Action Alternative. Detailed calculations of direct air emissions using the MOVES model are presented in Appendix F.
Operational Year
5% Discount Rate
($, US Dollars)
3% Discount Rate
($, US Dollars)
2.5% Discount Rate
($, US Dollars)
2030 -5,498,055 -17,618,744 -25,236,314
2035 -6,365,706 -19,055,123 -27,263,765
2040 -7,225,573 -20,828,337 -29,291,215
2045 -8,153,479 -22,533,511 -31,333,225
2050 -9,267,583 -24,306,725 -33,106,439

United States Postal Service Draft Environmental Impact Statement Environmental Compliance and Risk Management
4-21 August 2021
Table 4-6.4 Net Air Emission Changes from Nationwide Action (100% BEV NGDV) Calculated Based on MOVES Model
tpy = Tons per Year MT = Metric Tons
General Conformity
On a national scale, the one-to-one delivery vehicle replacement under this Proposed Action Hypothetical Maximum is anticipated to affect operational emissions in certain nonattainment or maintenance areas. However, because no increase in travel route and/or vehicle travel miles would occur, there would be a net reduction in emissions for all criteria pollutants within all affected nonattainment or maintenance areas nationwide due to the use of new vehicles operating with less air emissions. Instead of assessing area-level net emission changes, this analysis assumed that the area-level net emission changes would follow the same trend on the nationwide scale. Accordingly, as shown in Table 4-6.4, the calculated potential emissions decrease for all pollutants in any nonattainment or maintenance area would be below any de minimis threshold for all applicable criteria pollutants; therefore, the General Conformity rule does not apply to the Proposed Action under this Hypothetical Maximum.
Greenhouse Gas
Direct Tailpipe GHG Emissions
This would result in an emission decrease of 537,415 MT of CO2e (Table 4-6.4), thus having a beneficial effect on current GHG emissions. This action would result in more reduction in direct tailpipe GHG emissions by 280,565 MT of CO2e as compared to the 90 Percent ICE NGDV Hypothetical Maximum of the Proposed Action, by 311,739 MT of CO2e as compared to Alternative 1.1, or 537,415 MT of CO2e as compared to the No-Action Alternative, and thus be the most beneficial.
Energy Consumption GHG Emissions
As shown in Table 4-6.5, the Proposed Action's total net aggregated emissions under the 100 percent BEV NGDV Hypothetical Maximum result in 865,213 MT decrease in CO2e compared to the No-Action alternative, indicating a beneficial effect on current GHG emissions. Current Postal Service generated-GHG emissions would be reduced by approximately 14 percent under this Proposed Action, more of a reduction in aggregated GHG emissions as compared to the Proposed Action’s 90 percent ICE NGDV Hypothetical Maximum or Alternative 1.1.
Air Emissions
VOC
(tpy)
NOx
(tpy)
CO
(tpy)
PM2.5
(tpy)
PM10
(tpy)
SO2
(tpy)
CO2e
(MT)
New NGDV (100% BEV NGDV) -- -- -- 10.65 82.38 -- --
Replaced Vehicles (LLVs/FFVs/Metris) -935.99 -2,264.31 -11,496 -59.14 -136.72 -3.72 -537,415
Net (Total) -935.99 -2,264.31 -11,496 -48.49 -54.34 -3.72 -537,415

United States Postal Service Draft Environmental Impact Statement Environmental Compliance and Risk Management
4-22 August 2021
Table 4-6.5 Net Aggregated (Direct and Indirect) Air Emission Changes (100% BEV NGDV) Calculated Based on MOVES, eGRID, and GREET Models
tpy = Tons per Year
MT = Metric Tons
Notes: 1 NA = not available, as eGRID does not provide VOC, CO, and PM10 emissions factor data for the upstream sources. Therefore, the
aggregated net emissions for VOC, CO and PM10 were not calculated. 2 The emission increase associated with New 100% BEV NGDV is a summation of direct tailpipe emissions based on the MOVES model
and indirect emissions estimated based on eGRID. The indirect emissions represent air emissions associated with electricity generation from U.S. electric power sector that corresponds to the electricity purchases (e.g., energy consumption) by BEV. 3 The emission decrease associated with Replaced Vehicles (LLVs/FFVs/Metris) is a summation of direct tailpipe emissions based on the MOVES model and indirect emissions estimated based on the GREET model. The indirect emissions represent air emissions associated with fuel (e.g., gasoline) cycle from well pad to fuel pump that corresponds to the fuel purchases (e.g., energy consumption)
by ICE.
Effects of Climate Change
No effects of climate change are expected.
Social Cost of Greenhouse Gas (Carbon)
Table 4.6-6 presents the estimated total social costs of carbon from this Hypothetical Maximum of the Proposed Action, starting from 2030 as the Proposed Action is near its completion. The social costs of carbon are based on operational emissions per year in five-year increments over the estimated 20-year project lifespan.
Table 4-6.6 Calculated Social Cost of Carbon (100% BEV NGDV)
This would result in a positive investment impact in terms of social cost, as calculations indicated a decrease in cost values, and approximately three times greater social cost benefit as compared to the Proposed Action under its 90 percent ICE NGDV Hypothetical Maximum. Detailed itemized social cost calculations are presented in Appendix F.
4-6.3.4 Alternative 1.1 – 100% RHD COTS ICE Vehicles
Air Emissions
The estimated operational emissions on an annual basis for Alternative 1.1 (calculated using the MOVES model) are presented in Table 4-6.7. Overall, Alternative 1.1 would result in a net emissions
Air Emissions
VOC
(tpy)
NOx
(tpy)
CO
(tpy)
PM2.5
(tpy)
PM10
(tpy)
SO2
(tpy)
CO2e
(MT)
New 100% BEV NGDV NA1 412.71 NA1 55.94 NA1 381.01 467,485
Replaced Vehicles (LLVs/FFVs/Metris) -1,903.42 -3,570.48 -12,081.32 -148.19 -378.47 -915.03 -1,332,698
Net (Total) NA1 -3,158 NA1 -92 NA1 -534.01 -865,213
Operational Year
5% Discount Rate
($, US Dollars)
3% Discount Rate
($, US Dollars)
2.5% Discount Rate
($, US Dollars)
2030 -16,063,638 -49,867,888 -71,065,575
2035 -18,602,106 -54,006,677 -76,975,339
2040 -21,107,907 -59,319,603 -82,885,104
2045 -24,053,019 -64,193,218 -88,932,855
2050 -27,155,659 -69,506,143 -94,245,781

United States Postal Service Draft Environmental Impact Statement Environmental Compliance and Risk Management
4-23 August 2021
decrease for all applicable pollutants. Therefore, this action would have a beneficial effect on current air quality as compared to existing conditions or to the No-Action Alternative.
Alternative 1.1 would result in the least reduction in the direct (tailpipe) operational emissions for most criteria pollutants as compared to Alternative 1.2 or either Hypothetical Maximum of the Proposed Action and therefore be the least beneficial on air quality. Alternative 1.1 would result in less reduction in the direct operational emissions by 1.07 tpy of VOC, 1.18 tpy of NOx, 45 tpy of CO, 0.22 tpy of PM2.5, 0.25 tpy of PM10 and 0.22 tpy of SO2 as compared to the Proposed Action’s 90 percent ICE NGDV Hypothetical Maximum. Alternative 1.1 would result in a lesser reduction in the direct operational emissions by 10.67 tpy of VOC, 11.83 tpy of NOx, 447 tpy of CO, 2.24 tpy of PM2.5, 2.54 tpy of PM10 and 2.19 tpy of SO2 as compared to the Proposed Action’s 100 percent BEV NGDV Hypothetical Maximum and Alternative 1.2. Alternative 1.1 would result in a greater reduction in the direct operational emissions by 925.32 tpy of VOC, 2,252.48 tpy of NOx, 11,048 tpy of CO, 46.25 tpy of PM2.5, 51.80 tpy of PM10 and 1.54 tpy of SO2 as compared to the No-Action Alternative. Detailed calculations of direct air emissions using the MOVES model are presented in Appendix F.
Table 4-6.7 Net Air Emission Changes from Nationwide Action (Alternative 1.1 - 100% RHD COTS ICE Vehicles) Calculated Based on MOVES Model
tpy = Tons per Year MT = Metric Tons
General Conformity
On a national scale, the one-to-one delivery vehicle replacement under this Alternative is anticipated to affect operational emissions in certain nonattainment or maintenance areas. However, because no increase in travel route and/or vehicle travel miles would occur, this Alternative would result in a net reduction in emissions for all criteria pollutants within all affected nonattainment or maintenance areas nationwide due to the use of new vehicles operating with less air emissions. Instead of assessing area-level net emission changes, this analysis assumed that the area-level net emission changes would follow the same trend on the nationwide scale. Accordingly, as shown in Table 4-6.7, the calculated potential emissions decrease for all pollutants in any nonattainment or maintenance area would be below any de minimis threshold for all applicable criteria pollutants; therefore, the General Conformity rule does not apply to this Alternative 1.1.
Greenhouse Gas
Direct Tailpipe GHG Emissions
Alternative 1.1 would result in an emission decrease of -225,676 MT of CO2e (Table 4-6.7) as compared with the No Action Alternative, thus having a beneficial effect on current GHG emissions. Alternative 1.1 would result, however, in the least reduction in direct tailpipe GHG emissions as compared to Alternative 1.2 or the Hypothetical Maximum of the Proposed Action, and thus be the least beneficial of the action alternatives. Alternative 1.1 would result in less reduction in direct tailpipe GHG emissions by 31,174 MT of CO2e as compared to the 90 percent ICE NGDV Hypothetical
Air Emissions
VOC
(tpy)
NOx
(tpy)
CO
(tpy)
PM2.5
(tpy)
PM10
(tpy)
SO2
(tpy)
CO2e
(MT)
New 100% COTS ICE 10.67 11.83 447 12.89 84.92 2.19 311,739
Replaced Vehicles (LLVs/FFVs/Metris) -935.99 -2,264.31 -11,496 -59.14 -136.72 -3.72 -537,415
Net (Total) -925.32 -2,252.48 -11,048 -46.25 -51.80 -1.54 -225,676
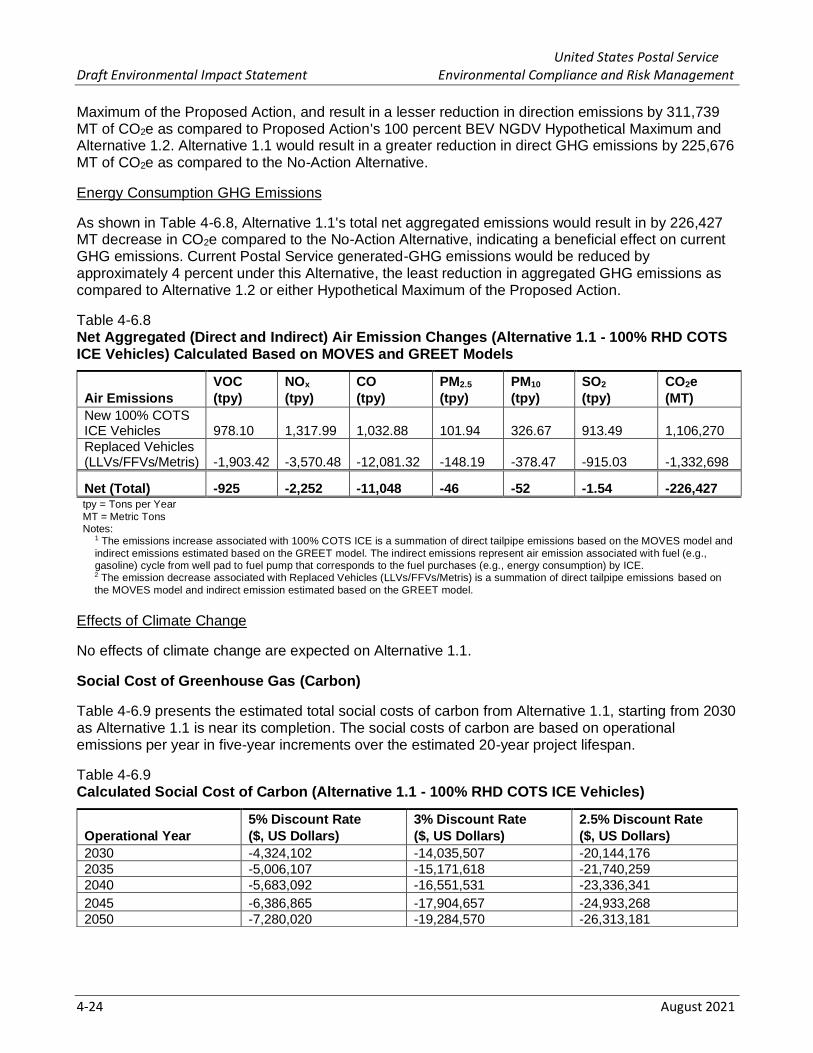
United States Postal Service Draft Environmental Impact Statement Environmental Compliance and Risk Management
4-24 August 2021
Maximum of the Proposed Action, and result in a lesser reduction in direction emissions by 311,739 MT of CO2e as compared to Proposed Action's 100 percent BEV NGDV Hypothetical Maximum and Alternative 1.2. Alternative 1.1 would result in a greater reduction in direct GHG emissions by 225,676 MT of CO2e as compared to the No-Action Alternative.
Energy Consumption GHG Emissions
As shown in Table 4-6.8, Alternative 1.1's total net aggregated emissions would result in by 226,427 MT decrease in CO2e compared to the No-Action Alternative, indicating a beneficial effect on current GHG emissions. Current Postal Service generated-GHG emissions would be reduced by approximately 4 percent under this Alternative, the least reduction in aggregated GHG emissions as compared to Alternative 1.2 or either Hypothetical Maximum of the Proposed Action.
Table 4-6.8 Net Aggregated (Direct and Indirect) Air Emission Changes (Alternative 1.1 - 100% RHD COTS ICE Vehicles) Calculated Based on MOVES and GREET Models
tpy = Tons per Year
MT = Metric Tons Notes:
1 The emissions increase associated with 100% COTS ICE is a summation of direct tailpipe emissions based on the MOVES model and
indirect emissions estimated based on the GREET model. The indirect emissions represent air emission associated with fuel (e.g., gasoline) cycle from well pad to fuel pump that corresponds to the fuel purchases (e.g., energy consumption) by ICE. 2 The emission decrease associated with Replaced Vehicles (LLVs/FFVs/Metris) is a summation of direct tailpipe emissions based on
the MOVES model and indirect emission estimated based on the GREET model.
Effects of Climate Change
No effects of climate change are expected on Alternative 1.1.
Social Cost of Greenhouse Gas (Carbon)
Table 4-6.9 presents the estimated total social costs of carbon from Alternative 1.1, starting from 2030 as Alternative 1.1 is near its completion. The social costs of carbon are based on operational emissions per year in five-year increments over the estimated 20-year project lifespan.
Table 4-6.9 Calculated Social Cost of Carbon (Alternative 1.1 - 100% RHD COTS ICE Vehicles)
Air Emissions
VOC
(tpy)
NOx
(tpy)
CO
(tpy)
PM2.5
(tpy)
PM10
(tpy)
SO2
(tpy)
CO2e
(MT)
New 100% COTS ICE Vehicles 978.10 1,317.99 1,032.88 101.94 326.67 913.49 1,106,270
Replaced Vehicles (LLVs/FFVs/Metris) -1,903.42 -3,570.48 -12,081.32 -148.19 -378.47 -915.03 -1,332,698
Net (Total) -925 -2,252 -11,048 -46 -52 -1.54 -226,427
Operational Year
5% Discount Rate
($, US Dollars)
3% Discount Rate
($, US Dollars)
2.5% Discount Rate
($, US Dollars)
2030 -4,324,102 -14,035,507 -20,144,176
2035 -5,006,107 -15,171,618 -21,740,259
2040 -5,683,092 -16,551,531 -23,336,341
2045 -6,386,865 -17,904,657 -24,933,268
2050 -7,280,020 -19,284,570 -26,313,181

United States Postal Service Draft Environmental Impact Statement Environmental Compliance and Risk Management
4-25 August 2021
Alternative 1.1 would result in the least social cost benefit as compared to Alternative 1.2 or either Hypothetical Maximum of the Proposed Action. Detailed itemized social cost calculations are presented in Appendix F.
4-6.3.5 Alternative 1.2 – 100% LHD COTS BEVs
Air Emissions
The estimated operational emissions on an annual basis for Alternative 1.2 (calculated using the MOVES model) are presented in Table 4-6.10. Overall, Alternative 1.2 would result in a net emission decrease for all applicable pollutants. Therefore, Alternative 1.2 would have a beneficial effect on current air quality as compared to existing conditions or to the No-Action Alternative.
Alternative 1.2 would have the same direct (tailpipe) air emissions as the Proposed Action’s 100 percent BEV NGDV Hypothetical Maximum, yet have a greater beneficial air quality impact as compared to the Proposed Action’s 90 percent ICE NGDV Hypothetical Maximum and Alternative 1.1. Alternative 1.2 would result in a greater reduction in the direct operational emissions by 9.60 tpy of VOC, 10.65 tpy of NOx, 403 tpy of CO, 2.02 tpy of PM2.5, 2.28 tpy of PM10 and 1.97 tpy of SO2 as compared to the Proposed Action’s 90 percent ICE NGDV Hypothetical Maximum. The Alternative 1.2 would result in a greater reduction in the direct operational emissions by 10.67 tpy of VOC, 11.83 tpy of NOx, 447 tpy of CO, 2.24 tpy of PM2.5, 2.54 tpy of PM10 and 2.19 tpy of SO2 as compared to Alternative 1.1. Alternative 1.2 would result in a greater reduction in the direct operational emissions by 935.99 tpy of VOC, 2,264.31 tpy of NOx, 11,496 tpy of CO, 48.49 tpy of PM2.5, 54.34 tpy of PM10 and 3.72 tpy of SO2 as compared to the No-Action Alternative. Detailed calculations of direct air emissions using the MOVES model are presented in Appendix F.
Table 4-6.10 Net Air Emission Changes from Nationwide Action (Alternative 1.2 - 100% LHD COTS BEVs) Calculated Based on MOVES Model
tpy = Tons per Year MT = Metric Tons
General Conformity
On a national scale, the one-to-one delivery vehicle replacement under this Alternative is anticipated to affect operational emissions in certain nonattainment or maintenance areas. However, because no increase in travel route and/or vehicle travel miles would occur, this Alternative would result in a net reduction in emissions for all criteria pollutants within all affected nonattainment or maintenance areas nationwide due to the use of new vehicles operating with less air emissions. Instead of assessing area-level net emission changes, this analysis assumed that the area-level net emission changes would follow the same trend on the nationwide scale. Accordingly, as shown in Table 4-6.10, the calculated potential emissions decrease for all pollutants in any nonattainment or maintenance area would be below any de minimis threshold for all applicable criteria pollutants; therefore, the General Conformity rule does not apply to Alternative 1.2.
Air Emissions
VOC
(tpy)
NOx
(tpy)
CO
(tpy)
PM2.5
(tpy)
PM10
(tpy)
SO2
(tpy)
CO2e
(MT)
New 100% COTS BEV -- -- -- 10.65 82.38 -- --
Replaced Vehicles (LLVs/FFVs/Metris) -935.99 -2,264.31 -11,496 -59.14 -136.72 -3.72 -537,415
Net (Total) -935.99 -2,264.31 -11,496 -48.49 -54.34 -3.72 -537,415

United States Postal Service Draft Environmental Impact Statement Environmental Compliance and Risk Management
4-26 August 2021
Greenhouse Gas
Direct Tailpipe GHG Emissions
Alternative 1.2 would result in an emission decrease of -537,415 MT of CO2e (Table 4-6.10), thus having a beneficial effect on current GHG emissions. This Alternative would result in the greatest reduction in direct tailpipe GHG emissions as compared to the Proposed Action (both Hypothetical Maxima), Alternative 1.1, or the No-Action Alternative, and thus be the most beneficial.
Energy Consumption GHG Emissions
As shown in Table 4-6.11, total net aggregated emissions from Alternative 1.2 would result in decreases of 1,116,730 MT in CO2e compared to the No-Action alternative, indicating a beneficial effect on current GHG emissions. Current Postal Service generated-GHG emissions would be reduced by approximately 18 percent under Alternative 1.2 as compared with No Action Alternative, the greatest reduction in aggregated GHG emissions as compared to the Proposed Action (both Hypothetical Maxima), Alternative 1.1, and the No-Action Alternative. The reduction as compared to Alternative 1.1 would be almost five times greater.
Table 4-6.11 Net Aggregated (Direct and Indirect) Air Emission Changes (Alternative 1.2 – 100% LHD COTS BEVs) Calculated Based on MOVES, eGRID, and GREET Models
Air Emissions
VOC
(tpy)
NOx
(tpy)
CO
(tpy)
PM2.5
(tpy)
PM10
(tpy)
SO2
(tpy)
CO2e
(MT)
100% BEV NGDV NA1 190.66 NA1 31.57 NA1 176.02 215,968
Replaced LLVs/FFVs/ Metris
-1,903.42 -3,570.48 -12,081.32 -148.19 -378.47 -915.03 -1,332,698
Net (Total) NA1 -3,380 NA1 -117 NA1 -739.01 -1,116,730 tpy = Tons per Year MT = Metric Tons
Note: 1 NA = not available, as eGRID does not provide VOC, CO, and PM10 emissions factor data for the upstream sources. Therefore, the
aggregated net emissions for VOC, CO and PM10 were not calculated.
Effects of Climate Change
No effects of climate change are expected on Alternative 1.2.
Social Cost of Greenhouse Gas (Carbon)
Table 4-6.12 presents the estimated total social costs of carbon from Alternative 1.2, starting from 2030 as Alternative 1.2 is near its completion. The social costs of carbon are based on operational emissions per year in five-year increments over the estimated 20-year project lifespan.
Table 4-6.12 Calculated Social Cost of Carbon (Alternative 1.2 - 100% LHD COTS BEVs)
Operational Year
5% Discount Rate
($, US Dollars)
3% Discount Rate
($, US Dollars)
2.5% Discount Rate
($, US Dollars)
2030 -20,859,908 -65,488,599 -93,480,934
2035 -24,155,829 -70,888,396 -101,157,155
2040 -27,419,310 -77,717,670 -108,833,377
2045 -31,125,212 -84,104,523 -116,649,707
2050 -35,235,640 -90,933,797 -123,478,982

United States Postal Service Draft Environmental Impact Statement Environmental Compliance and Risk Management
4-27 August 2021
This Alternative would result in the maximum investment benefit in terms of social cost of carbon amongst all studied Alternatives, with almost five times greater benefit compared to Alternative 1.1 and almost four times greater benefit compared to the Proposed Action under its 90 percent ICE NGDV Hypothetical Maximum.
4-6.3.6 No-Action Alternative
Air Emissions
Under No-Action Alternative, the Postal Service would operate its delivery vehicles as they are currently operated without any changes in vehicle miles and routes. Air emissions associated with the 165,000 vehicles within the existing Postal Service delivery fleet would not change. Table 4-6.13 presents estimated air emissions over a ten-year period from existing delivery vehicles that would not be replaced.
Table 4-6.13 Air Emissions from 165,000 Existing Delivery Vehicles Over a Ten-Year Period Calculated Based on MOVES Model
Air Emissions
No. of Vehicles
VOC
(tpy)
NOx
(tpy)
CO
(tpy)
PM2.5
(tpy)
PM10
(tpy)
SO2
(tpy)
CO2e
(MT)
LLVs 125,988 900.87 2,167.60 10,439 51.69 111.73 2.90 419,583
FFVs 21,070 33.90 94.21 1,004 6.09 15.79 0.54 77,454
Metris 17,942 1.23 2.50 53 1.37 9.20 0.28 40,378
Total 165,000 935.99 2,264.31 11,496 59.14 136.72 3.72 537,415 tpy = Tons per Year
MT = Metric Tons
General Conformity
The No-Action Alternative would not be subject to the General Conformity rule because no emission changes are expected.
Greenhouse Gas
GHG emissions for the No-Action Alternative would be the same as the existing condition. The No-Action Alternative would have the same impacts to GHG and climate change as the current condition as shown in Table 4-6.14.
Table 4-6.14 Direct and Indirect Air Emissions from Existing Delivery Vehicles Over a Ten-Year Period Calculated Based on MOVES and GREET Models
Air Emissions
VOC
(tpy)
NOx
(tpy)
CO
(tpy)
PM2.5
(tpy)
PM10
(tpy)
SO2
(tpy)
CO2e
(MT)
Replaced LLVs/FFVs/Metris 1,903.42 3,570.48 12,081.32 148.19 378.47 915.03 1,332,698
tpy = Tons per Year MT = Metric Tons
Social Cost of Greenhouse Gas (Carbon)
Table 4-6.15 presents the estimated total social costs of carbon from the No-Action Alternative, starting in 2020 and based on operational emissions per year in five-year increments over the estimated next ten-year period, and to 2050 for comparison with the action alternatives.

United States Postal Service Draft Environmental Impact Statement Environmental Compliance and Risk Management
4-28 August 2021
Table 4-6.15 Social Cost of Carbon (165,000 Existing Delivery Vehicles Over a Ten-Year Period)
4-7 Community Services
4-7.1 Community Services – Background Information and Regulatory Setting
Local municipalities or county governments provide emergency fire and police services to Postal Service processing facilities to treat minor injuries. The Postal Service in turn provides a community service by delivering and collecting mail to and from residential and business addresses. The Postal Service follows certain service standards related to mail delivery and maintains its fleet of delivery vehicles to meet these delivery standards.
4-7.2 Community Services – Affected Environment
Postal Service facilities are located nationwide in every state of the U.S. and in U.S. Territories. Local municipalities or county governments provide public safety and utility services to the delivery facilities. Community service providers are equipped to adequately handle community services required by current Postal Service operations.
4-7.3 Community Services – Environmental Consequences
The type of community services and demand for community services would not change under any scenario for the Proposed Action or Alternatives due to there being no increase in the number of delivery vehicles or routes. Operation of newly acquired vehicles with modern safety features, whether NGDV or COTS, would provide an increase in safety on the road resulting in less demand for emergency services.
VMFs would maintain NGDV or COTS according to Postal Service requirements and maintenance schedules. Demand for utility services for maintenance at VMFs would not be expected to increase (see Utilities and Infrastructure, Section 4-8).
Current Postal Service operations do not result in adverse impacts on emergency and utility services and delivery operations do not result in adverse impacts on community services or emergency preparedness of local municipalities, county governments, or the nation. The Proposed Action and Alternatives 1.1 and 1.2 would have no adverse impact on community services and would be expected to result in a beneficial effect due to modern vehicle safety features. Under the No-Action Alternative, the Postal Service would continue to maintain and operate aged delivery vehicles with outdated safety features and poor performance characteristics. Continuing to operate the aged delivery vehicles could lead to increased vehicle breakdowns, and increase and therefore negatively impact demand for emergency services. There would be negligible impact on community services.
Operational Year
5% Discount Rate
($, US Dollars)
3% Discount Rate
($, US Dollars)
2.5% Discount Rate
($, US Dollars)
2020 18,396,348 64,287,602 95,545,725
2025 22,211,066 71,215,269 104,596,802
2030 24,978,272 78,901,478 112,728,105
2035 28,924,588 85,384,051 121,921,112
2040 32,838,658 93,515,354 131,114,120
2045 37,197,821 101,201,563 140,449,058 2050 42,173,596 109,332,865 148,580,360

United States Postal Service Draft Environmental Impact Statement Environmental Compliance and Risk Management
4-29 August 2021
4-8 Utilities and Infrastructure
4-8.1 Utilities and Infrastructure – Background and Regulatory Setting
Postal Service delivery operations are supported by existing utility and infrastructure systems that provide power, communications, water, wastewater, stormwater, and transportation services sufficient for the facilities’ needs. Private companies normally provide power and communication services, while municipalities usually own and maintain water, wastewater and transportation systems; privately-owned well systems provide a limited number of facilities with water. Postal Service facilities are generally located within large utility networks and use a relatively small portion of the systems’ total capacity.
4-8.2 Utilities and Infrastructure – Affected Environment
Some Postal Service locations have on-site fueling operations, storage tanks, emergency generators, wastewater pretreatment systems, septic systems, and/or vehicle maintenance and washing facilities. The Postal Service monitors these facilities and their functions to manage potential pollution sources and to ensure compliance with spill prevention requirements and stormwater permit regulations. The Postal Service has removed approximately 180 aging underground storage tank (UST) systems, reducing the number of federally-regulated USTs by almost 45 percent. Replacement tank systems are installed only when necessary and centrally monitored to quickly detect and prevent leaks to avoid soil and groundwater contamination (USPS 2020).
4-8.3 Utilities and Infrastructure – Environmental Consequences
Utility service and infrastructure in place at Postal Service facilities presently are meeting service demands. The one exception would be the need for electrical charging stations at locations where BEVs would be deployed. Modifications to electrical infrastructure and construction of new infrastructure at existing facilities would depend on the number of BEVs deployed. As discussed in Section 1-3.1, the Postal Service would conduct appropriate environmental reviews at the local level per Postal Service Handbook RE-6 (2015) as needed. Postal Service environmental checklists, screening analyses, and stand-alone, project-level Environmental Assessments would be employed on a facility-specific basis to assess the extent of impacts from any facility-related actions.
Section 4-9.3 discusses the potential impact on the electrical grid.
4-8.3.1 Proposed Action ICE Hypothetical Maximum and Alternative 1.1
Under the Proposed Action ICE Hypothetical Maximum and Alternative 1.1, there would be no impact on demand for existing utilities except for electrical infrastructure for charging of the 10 percent NGDV BEVs. Modifications needed to accommodate charging stations for BEV NGDV would be evaluated on a facility-specific basis and environmental reviews would be conducted as appropriate. Sites with BEVs would impact the grid, but the impact would be less than under the 100 percent BEV scenarios. Additional discussion regarding the effect of BEVs on the electrical grid is presented in the subsections below. There would be no increased demands for infrastructure services for ICE vehicles.
4-8.3.2 Proposed Action BEV Hypothetical Maximum and Alternative 1.2
No impact on demand for existing utilities would occur under the Proposed Action BEV Hypothetical Maximum or Alternative 1.2 except for electrical infrastructure for BEV charging. Modifications needed to accommodate charging stations for BEV NGDV or COTS BEVs would be evaluated on a facility-specific basis and environmental reviews would be conducted as appropriate. Additional discussion regarding the effect of BEVs on the electrical grid is presented in the subsections below. Nationally, the electric infrastructure needs of BEVs would be minor in the context of the U.S. electric grid

United States Postal Service Draft Environmental Impact Statement Environmental Compliance and Risk Management
4-30 August 2021
systems and no significant, national investment in generation, transmission, or distribution would be required in order implement either Alternative. This is due to the relatively low total electric demand required to support each BEV NGDV or COTS BEVs and the proposed plan to charge each BEV nightly when national grid loads are at their minimum. Peak times for electric consumption generally occur between 3:00 p.m. and 9:00 p.m. local time, with some variation seasonally and geographically due to climatic patterns or availability of other energy utilities, such as natural gas (Figure 4-8.1). Late evening and early morning hours are consistently times of low load across seasons and geographies.
Figure 4-8.1 Electrical Loads (million kWh) Across U.S. Geographies
Source: USEIA 2020
kWh = kilowatt hours
Charging during off-peak periods, as intended under for all alternatives, when capacity is available nationally, would not require additional infrastructure, as the capacity between afternoon summer peak and nighttime lows is available to serve these charging needs on a national scale. The Postal Service would evaluate each individual Postal Service location for localized need for increased service on the distribution system serving a particular Postal Service charging site.
4-8.3.3 No Action Alternative
New delivery vehicles to replace high-maintenance and end-of-life delivery vehicles would not be purchased or deployed under the No-Action Alternative. Existing delivery vehicles would continue to be maintained until maintenance was no longer feasible. Utility service and infrastructure in place at Postal Service facilities currently are meeting service demands.

United States Postal Service Draft Environmental Impact Statement Environmental Compliance and Risk Management
4-31 August 2021
4-9 Energy Requirements and Conservation
4-9.1 Energy Requirements and Conservation – Background and Regulatory Setting
Federal agencies are required to meet energy management and conservation goals through EOs and legislative measures. Postal Service facility operations incorporate energy conservation measures that comply with the Energy Independence and Security Act (EISA) of 2007, the National Energy Conservation Policy Act, the Energy Policy Act (EPAct) of 1992 and 2005, National Energy Conservation Policy Act (NECPA) of 1978.
4-9.2 Energy Requirements and Conservation – Affected Environment
The Postal Service operates a combined delivery fleet of approximately 218,000 vehicles. The existing fleet is comprised of 21,000 alternative fuel-capable vehicles, most of which are equipped to use ethanol. The fleet also has electric, hybrid, compressed natural gas, liquid propane gas vehicles; and 100 hybrid 2-ton vehicles, of which 50 percent are electric hybrid and hydraulic hybrid, respectively. The Postal Service emphasizes preventive, rather than corrective, management to maximize existing vehicle performance. Aged delivery vehicles are being replaced when necessary with COTS vehicles that have improved fuel mileage, reduced maintenance costs, and lower air emissions. Postal Service career employees are offered a Commuter Benefits Program, which enables them to allocate pretax money for eligible commuter expenses. This incentivizes alternative modes of transportation (i.e., walking, cycling, public transportation) to reduce single employee vehicle commute trips to mail delivery and other facilities.
The Postal Service seeks to optimize its transportation operations, including pursuing fuel-efficiency initiatives. Energy management systems are used to evaluate, track and manage fuel usage. Further, the Postal Service works to make sure that all operating vehicles are performing at maximum possible efficiency.
Table G-1 (Appendix G) shows the current fuel efficiency and fuel consumption of the 165,000 aged and high-maintenance cost delivery vehicles to be replaced, and estimated annual fuel (gasoline) usage of about 135 million gallons, based on FY 2020 consumption for these vehicles.
4-9.3 Energy Requirements and Conservation – Environmental Consequences
Estimated annual fuel usage of the ICE NGDV and COTS ICE vehicles is shown in Table G-2 (Appendix G).
4-9.3.1 Proposed Action – ICE NGDV Hypothetical Maximum
The Proposed Action, under this Hypothetical Maximum, would have a beneficial impact on energy use through reduction in fuel consumption. Table G-2 (Appendix G) shows that the 148,000 ICE NGDV (90 percent of 165,000 total NGDV) would have an estimated annual fuel usage of about 110 million gallons. The ICE NGDV would be more fuel-efficient than the end-of-life delivery vehicles being replaced. The 10 percent BEV NGDV (16,500 vehicles) would further reduce fuel consumption associated with this Proposed Action because the BEVs are powered by batteries and do not require gasoline. This Proposed Action would therefore result in an annual reduction of over 25 million gallons of fuel use (19 percent less) (see Table G-3 in Appendix G). Additionally, the newer vehicles would require less frequent oil changes and other maintenance. The Proposed Action ICE NGDV Hypothetical Maximum would have an overall beneficial effect on energy requirements and conservation.
The impact of BEV charging is discussed in Section 4-8.3. The BEV NGDV specifications used for analysis are provided in Table 3-3 and the analysis is based on anticipated Level 2 charging that uses

United States Postal Service Draft Environmental Impact Statement Environmental Compliance and Risk Management
4-32 August 2021
a higher-output 240-volt power source that reduces charging time as compared to a Level 1, 120-volt power source. The annual electricity required to support 10 percent BEV NGDV purchased over the ten-year period would be approximately would be 140,855 megawatt hours (MWh) (see Table F-5.a in Appendix F). BEV NGDV would be expected to discharge around 20 percent of battery capacity under average conditions because of the low average delivery route mileage. This would limit battery degradation and may not require charging every day. The BEV NGDV could fully recharge during non-business hours.
Under full electrification of the 16,500 BEV NGDV, annual energy usage and load requirements would be less than one percent of the total annual energy generation for the U.S., which was 4,127 billion kWh in 2020 with a peak load of 1,118 billion kilowatt (kW) (USEIA 2020). Thus, existing bulk power systems are adequate for supplying electricity for 16,500 BEV NGDV. The Proposed Action, under this Hypothetical Maximum, would have an overall beneficial effect on energy requirements and conservation.
4-9.3.2 Proposed Action – NGDV BEV Hypothetical Maximum
The Proposed Action, under the BEV Hypothetical Maximum, would have a beneficial impact on energy use through reduction in fuel consumption as the BEV NGDV would not require gasoline, saving about 135 million gallons of fuel annually (see Table G-1 in Appendix G). The newer vehicles also would require less frequent maintenance.
Deployment of 165,000 BEV NGDV would have a minor impact on the electrical grid. The annual electricity required to support this number of BEV NGDV purchased over the ten-year period would be approximately would be 1,408,552 MWh (see Table F-5.a in Appendix F). This impact is expected to be negligible on a nationwide scale since approximately 240,000 BEVs were sold in 2020, and about 251 million vehicles (cars and light trucks) were registered nationwide as of April 2021 (USDOE 2021). Further, public charging stations would not be used to recharge BEV NGDV delivery vehicles. This Proposed Action would therefore have no significant adverse impact on energy requirements.
The impact of BEV charging is discussed in Section 4-8.3. The BEV NGDV specifications for analysis are provided in Table 3-3, and the analysis is based on anticipated Level 2 charging that uses a higher-output 240-volt power source that reduces charging time as compared to a Level 1, 120-volt power source. BEV NGDV would be expected to discharge around 20 percent of battery capacity under average conditions because of the low average delivery route mileage. This would limit battery degradation and may not require charging all vehicles every day. The BEV NGDV could fully recharge during non-business hours.
Under full electrification of the 165,000 BEV NGDV, annual energy usage and load requirements would be less than one percent of the total annual energy generation for the U.S., which was 4,127 billion kWh in 2020 with a peak load of 1,118 billion kW (USEIA 2020). Thus, existing bulk power systems are adequate for supplying electricity to 165,000 BEV NGDV. The Proposed Action, under the BEV Hypothetical Maximum, would have no significant adverse impact and an overall beneficial effect on energy requirements and conservation greater than the Proposed Action ICE NGDV Hypothetical Maximum, as well as Alternatives 1.1 and 1.2.
4-9.3.3 Alternative 1.1 – 100% RHD COTS ICE Vehicles
Alternative 1.1 would increase fuel (gasoline) consumption. Postal Service performance data shows the Metris currently in use averages only 6.3 mpg, less than the existing LLVs, which are custom-built and do not have air conditioning. Based on the 6.3 mpg, the 165,000 COTS ICE vehicles would have an estimated annual fuel usage of about 166 million gallons (see Table G-4 in Appendix G), an annual increase of about 31 million gallons of fuel use (23 percent more) as compared to the existing 165,000

United States Postal Service Draft Environmental Impact Statement Environmental Compliance and Risk Management
4-33 August 2021
delivery vehicles. The newer vehicles also would require less frequent oil changes and other maintenance.
The expected fuel efficiency of the RHD COTS ICE (6.3 mpg) would be less than the ICE NGDV (8.6 mpg with air conditioning), and Alternative 1.1 would result in more annual fuel consumption as compared to the Proposed Action under either Hypothetical Maximum. As shown in Table G-2 (Appendix G), Alternative 1.1 would result in about 56 million gallons more annual fuel usage than the ICE NGDV Hypothetical Maximum Proposed Action because of lower fuel efficiency of the COTS ICE vehicles, and the Proposed Action's 10 percent minimum of BEV NGDV. This Alternative would result in a negligible adverse impact on fuel resources on a nationwide scale.
4-9.3.4 Alternative 1.2 – 100% LHD COTS BEVs
Alternative 1.2 would have a beneficial impact on energy use through reduction in fuel (gasoline) consumption, as the COTS BEVs would not require gasoline, saving about 135 million gallons of fuel (gasoline) annually (see Table G-1 in Appendix G). The newer vehicles also would require less frequent maintenance.
Alternative 1.2 would have a minor impact on the electrical grid. The annual electricity required to support the 165,000 COTS BEVs purchased over the ten-year period would be approximately 650,720 MWh (see Table F-5.a in Appendix F). This impact would be negligible on a nationwide scale since approximately 240,000 BEVs were sold in 2020, and about 251 million vehicles (cars and light trucks) were registered nationwide as of April 2021 (USDOE 2021). Further, public charging stations would not be used to recharge USPS delivery vehicles. The manufacturer currently rates the 2020 Ford E Transit at 108 miles on a single charge. However, the actual mileage is expected to be significantly less because of the frequent and repetitive starts and stops required for business and residential delivery.
The impact of BEV charging is discussed in Section 4-8.3. For the COTS BEV analysis, this EIS uses the manufacturer’s currently advertised specifications for the Ford E Transit (see Table 3-6 for specifications). The analysis is based on anticipated Level 2 charging that uses a higher-output 240-volt power source that reduces charging time as compared to a Level 1, 120-volt power source. COTS BEVs would be expected to discharge around 20 percent of battery capacity under average conditions because of the low average delivery route mileage. This would limit battery degradation and may not require charging all vehicles every day. The COTS BEVs could fully recharge during non-business hours.
Under full electrification of the 165,000 COTS BEVs, annual energy usage and load requirements would be less than one percent of the total annual energy generation for the U.S., which was 4,127 billion kWh in 2020 with a peak load of 1,118 billion kW (USEIA 2020). Thus, existing bulk power systems are adequate for supplying electricity for the 165,000 COTS BEVs. Alternative 1.2 would have no significant adverse impact and an overall beneficial effect on energy requirements and conservation.
4-9.3.5 No-Action Alternative
Under the No-Action Alternative, the existing delivery vehicles would continue to be operated, and the benefits of newer vehicles with better fuel usage would not be realized. Continuing to operate these high-maintenance and end-of-life delivery vehicles would negatively impact energy requirements and conservation and Postal Service’s sustainability policies and goals for energy consumption and conservation. Based on the current annual delivery vehicle fuel use data (see Table G-1 in Appendix G), almost 1.35 trillion gallons of fuel (gasoline) would be used by the existing vehicles over a ten-year

United States Postal Service Draft Environmental Impact Statement Environmental Compliance and Risk Management
4-34 August 2021
period. This is far more than under the Proposed Action ICE NGDV Hypothetical Maximum but less than under Alternative 1.1.
4-10 Solid and Hazardous Materials and Wastes
4-10.1 Solid and Hazardous Materials and Wastes – Background and Affected
Environment
Solid waste includes garbage or refuse, and other discarded material as defined under the Resource Conservation and Recovery Act (RCRA) and 40 CFR 260 - 262. Materials that do not meet the RCRA definition are not solid wastes and are not subject to RCRA regulation.
The RCRA defines hazardous wastes as solid waste, or combination of solid wastes, which because of its quantity, concentration, or physical, chemical, or infectious characteristics may (a) cause, or significantly contribute to an increase in mortality or an increase in serious irreversible, or incapacitating reversible, illness; or (b) pose a substantial present or potential hazard to human health or the environment when improperly treated, stored, transported, or disposed of, or otherwise managed. Certain types of hazardous wastes are subject to special management provisions intended to ease the management burden and facilitate the recycling of such materials. These are called universal wastes and their associated regulatory requirements are specified in 40 CFR 273. Hazardous waste batteries are one of the four types of waste currently covered under the universal waste regulations.
Postal Service delivery vehicle maintenance and delivery operations generate solid waste, regulated waste and limited quantities of hazardous wastes. Recycling and disposal are managed in accordance with all applicable environmental and safety regulations. State and local environmental regulations vary from jurisdiction-to-jurisdiction nationwide. The Postal Service has programs and national contracts in place to ensure these wastes are properly recycled or, if necessary, disposed in accordance with regulatory requirements. Many waste streams generated through ongoing vehicle maintenance, including used oil and oil filters, antifreeze, tires, batteries, and scrap metal are recycled. Additionally, employees with hazardous waste management responsibilities are required to take waste management training annually in order to ensure proper procedures are followed.
With regards to vehicle disposal, the Postal Service has standard procedures in place to manage surplus vehicles and vehicle-related parts. The Postal Service’s delivery vehicle life cycle is shown in Figure 4-10.1.
Figure 4-10.1 USPS Delivery Vehicle Life Cycle
Acquisition Deployment Monitoring Maintenance Recycle/Reuse Acquisition and
initial servicing of delivery vehicle.
Deployment of delivery vehicles
to VMFs and Postal Service
facilities.
Vehicle status is monitored
throughout the service life of the delivery vehicle.
Routine and corrective maintenance conducted. Wastes generated from
ongoing maintenance are recycled, when possible,
or disposed of using national contracts.
Once vehicle is replaced, no longer needed, or no longer economical, vehicle and/or parts are auctioned, sold, or
scrapped. Scrapped materials are recycled, when
possible, or disposed.

United States Postal Service Draft Environmental Impact Statement Environmental Compliance and Risk Management
4-35 August 2021
Currently, almost 100 percent of automobiles get recycled in the U.S. The reusable parts of a vehicle, including wheels, windows, trunk lids, hoods, seats, and doors are removed. At the same time, for environmentally responsible recycling, mercury switches are removed, and cars are drained of fluids (LeBlanc 2019). The remaining hulk of the car enters the shredder to recover non-ferrous metals. Postal Service procedures, including the Postal Service’s Vehicle Disposal Strategy, support this national trend. The Postal Service manages its surplus vehicle fleet, vehicle-related parts and equipment through online auctions, live auctions, fixed-price sales and vehicle cannibalization/scrapping processes. If scrapped, vehicle components such as metal, batteries, oil, coolant, and tires are removed and reused or recycled to the extent possible. The remainder of surplus parts are disposed in accordance with environmental laws and regulations.
4-10.2 Solid and Hazardous Materials and Waste – Environmental Consequences
4-10.2.1 Proposed Action and Alternatives 1.1 and 1.2
The Proposed Action and Alternatives 1.1 and 1.2 would have a negligible adverse impact on solid and hazardous waste. Disposal of the existing delivery vehicles would take place over a ten-year period, and the Postal Service vehicle disposal strategy and contracts in place for recycling and disposal would minimize the adverse impacts to the extent possible. Recycling and disposal of the wastes and materials from the replaced vehicles would have no significant adverse impact on commercial treatment capacity and landfill capacity over the ten-year period.
Operation and maintenance of new vehicles would use less hazardous materials and generate less solid and hazardous waste (e.g., used engine oil) than the existing aged delivery vehicles. Since BEVs do not require engine oil, used engine oil would not be generated at all for BEV procurement scenarios. Minor amounts of other lubricant types, including bearing grease, coolants, and windshield wiper fluid would be required for both BEV and ICE vehicles, whether NGDV or COTS, but much of this material would be reclaimed or recycled. Spent nickel-manganese-cobalt-oxide and lithium-ion BEV batteries would be an additional source of hazardous waste for the BEV procurement scenarios. Recycling methods in the U.S. are currently limited and vary in recovery capabilities. Under normal operating conditions, not including frequent starts and stops, the BEV batteries are expected to last up to ten to twelve years, at which time they would be recycled.
4-10.2.2 No-Action Alternative
Under the No-Action Alternative, aged delivery vehicles with outdated safety features and poor performance characteristics would continue to be maintained until maintenance was no longer feasible. These vehicles would then be disposed according to the Postal Service’s Vehicle Disposal Strategy for Fleet Management. The Postal Service would not be able to carry out its mission as end-of-life delivery vehicles are disposed and not replaced. The No-Action Alternative would have no significant adverse impact on solid and hazardous waste management and disposal capacity.
4-11 Summary of Potential Environmental Impacts
Implementation of the Proposed Action, under either Hypothetical Maximum, or Alternatives 1.1 and 1.2 would result in no or negligible environmental impact to the environmental resources that were not evaluated in detailed impact analysis: topography, geology and soils, and prime farmland; historical and archaeological resources; hydrology, water resources, floodplains, and wetlands; vegetation and wildlife; land use and planning; and coastal zone.
The Proposed Action and Alternatives 1.1 and 1.2 could require interior alterations within affected existing Postal Service facilities and exterior alterations within existing delivery vehicle parking areas to accommodate construction of necessary electrical charging infrastructure for BEVs. These

United States Postal Service Draft Environmental Impact Statement Environmental Compliance and Risk Management
4-36 August 2021
alterations are expected to be inside existing facilities or within existing facility footprints that are previously disturbed areas. No expansion requiring real property leasing or acquisition, or real property disposal as part of these action alternatives would occur, and no expansion outside the footprint of existing facilities or vehicle parking areas is anticipated. As discussed in Section 1-3.1, the Postal Service would conduct appropriate environmental reviews at the local level per Postal Service Handbook RE-6 (2015) as needed. Postal Service environmental checklists, screening analyses, and stand-alone, project-level Environmental Assessments would be employed on a facility-specific basis to assess the extent of impacts from any facility-related actions.
The Proposed Action, under either Hypothetical Maximum, and Alternatives 1.1 and 1.2 would have either beneficial or no to negligible adverse impacts on the environmental resources summarized below (Table 4-11.1). This is because the actions are nationwide in scope; involve a one-to-one replacement of existing vehicles with more efficient, technologically advanced, ergonomic and safer vehicles; and purchase and deployment would occur over a ten-year period.
4-11.1 Comparison of Potential Impacts for Alternatives
The potential environmental impacts from the Proposed Action and Alternatives 1.1 and 1.2 are summarized in Table 4-11.1.
The Proposed Action, under either Hypothetical Maximum, and Alternatives 1.1 and 1.2 would result in beneficial impacts on transportation safety, traffic noise, air pollutant and GHG emissions, community emergency services, and fuel (gasoline) consumption. The Proposed Action’s BEV Hypothetical Maximum and COTS BEV Alternative (1.2) would provide greater benefit on traffic noise reduction than would the ICE NGDV Hypothetical Maximum or COTS ICE Alternative (1.1), since BEVs are quieter than ICE vehicles at low speeds. Additionally, alternatives using BEVs would generate less lubricants, oils, and greases as compared to existing ICE vehicles. BEVs do not use engine oil for operation, but spent BEV batteries would be an additional source of hazardous waste for the BEV procurement alternatives. Recycling methods in the U.S. are currently limited and vary in recovery capabilities. Under normal operating conditions, not including frequent starts and stops, the BEV batteries are expected to last up to ten to twelve years, at which time they would be recycled.
The Proposed Action, under either Hypothetical Maximum, and Alternatives 1.1 and 1.2 would result in no to negligible impact on economics, employment, environmental justice, traffic, accessibility, parking, public transportation, engine noise from ICE vehicle operation, community utility services, utility availability and demand capacity, energy consumption, and solid and hazardous waste treatment and disposal.
The No-Action Alternative would not satisfy the Purpose and Need for the purchase of new delivery vehicles to replace aged delivery vehicles with outdated safety features and poor performance characteristics. Impacts would remain unchanged, and the benefits from replacing end-of-life delivery vehicles with modern vehicles would not be realized.
4-11.2 Selection of Preferred Alternative
At this time, the Postal Service selects as its preferred alternative the Proposed Action, which is the purchase and deployment of up to 90 percent ICE NGDV with at least 10 percent BEV NGDV. This Preferred Alternative provides a purpose-built RHD vehicle that would meet the Postal Service’s Purpose and Need by providing the performance, safety, and ergonomic requirements for efficient Postal Service carrier deliveries to businesses and curb-line residential mailboxes over the entire nationwide system. This Preferred Alternative is also the most achievable given the Postal Service’s financial condition, as the ICE NGDV is significantly less expensive than the BEV NGDV (see Table 3-1.1).
United States Postal Service Draft Environmental Impact Statement Environmental Compliance and Risk Management
4-37 August 2021
Although the BEV NGDV Alternative would result in about 200 percent fewer direct and indirect GHG (CO2e) emissions than under the 90 percent ICE NGDV Preferred Alternative (see Sections 4-6.3.3 and 4-6.3.2, respectively), committing to purchase more than 10 percent BEV NGDV as part of the Preferred Alternative would not meet the Postal Service’s Purpose and Need for the following reasons. Operational constraints would preclude the BEV NGDV deployment for more than 12,500 delivery routes (see Section 3-1.1).
The BEV NGDV Alternative is significantly more expensive, $2.3 billion, than the ICE NGDV Preferred Alternative (see Table 3-1.1). The most favorable SCC calculations for the BEV NGDV (20 years, at 2.5 percent discount rate) result in an approximately $61 million SCC benefit (operational year 2050) and approximately $46 million SCC (operational year 2030) of the BEV NGDV Alternative as compared to the ICE NGDV Preferred Alternative (see Tables 4-6.3, 4-6.6, F-8.b & F-8.c).
Alternative 1.1, to purchase and deploy 100 percent RHD COTS ICE vehicles, would also not meet the Postal Service’s Purpose and Need. While RHD COTS ICE vehicles would have some, but not all, of the enhanced safety and customized operational features available in the NGDV that are optimal for postal operations and be capable of delivering to curb-line mailboxes, they would not provide the same operational or ergonomic benefits as the purpose-built NGDV (see Section 3-2). For example, they do not have body components designed for frequent and repetitive use, leading to expected higher maintenance and repair costs, and body components that need to be replaced more frequently than those purpose-built for the NGDV.
Alternative 1.2, to purchase and deploy 100 percent LHD COTS BEVs, also would not meet the Postal Service’s Purpose and Need, as the COTS BEVs would have operational constraints that would not allow deployment of BEVs for more than 12,500 delivery routes. Also, being LHD, the COTS BEVs would not support curb-line deliveries (see Section 4-4.3.3). Although the COTS BEV market and technology is rapidly evolving, LHD BEVs are still in development and currently available only in small quantities. RHD COTS BEVs are not currently available or otherwise marketed by commercial manufacturers for future development.
The No-Action Alternative, or status quo, would not meet the Postal Service's Purpose and Need. It would not involve the purchase and deployment of any replacement vehicles for accident-damaged, high-maintenance, and end-of-life vehicles. It would not meet the Purpose and Need to provide more energy-efficient vehicles, and updated technology, increased cargo capacity and improved loading characteristics, improved ergonomics and carrier safety, and reduced maintenance costs. Further, it would result in higher fuel (gasoline) usage than both Proposed Action Hypothetical Maxima and Alternative 1.2, and greater direct and indirect GHG emissions than both Hypothetical Maxima of the Proposed Action and Alternatives 1.1 and 1.2.

United States Postal Service Draft Environmental Impact Statement Environmental Compliance and Risk Management
4-38 August 2021
Table 4-11.1 Potential Environmental Impacts Summary Matrix
Key: Impact symbols: B = beneficial effect; N = no effect or negligible effect; M = moderately adverse effect; and S = significant effect Duration symbols: P = permanent effect; T = temporary effect; and N/A = not applicable Mitigation symbols: Y = can be mitigated; N = cannot be mitigated; NR = not required; and N/A = not applicable
Environmental Resource Area
NGDV Proposed Action (90% ICE/10% BEV)
Impact - Duration - Mitigation
NGDV Proposed Action (100% BEV)
Impact - Duration - Mitigation
COTS Alternative 1.1 (100% ICE)
Impact - Duration - Mitigation
COTS Alternative 1.2 (100% BEV)
Impact - Duration - Mitigation No-Action Alternative
Impact - Duration - Mitigation
Socioeconomics
Economics N - P - NR N - P - NR N - P - NR N - P - NR N - P - NR Employment N - P - NR N - P - NR N - P - NR N - P - NR N - P - NR Environmental Justice N - P - NR N - P - NR N - P - NR N - P - NR N - P - NR
Transportation
Traffic N - P - NR N - P - NR N - P - NR N - P - NR N - P - NR Safety B - P - NR B - P - NR B - P - NR B - P - NR M - P - N Accessibility N - T - NR N - T - NR N - T - NR N - T - NR N - P - NR Parking N - T - NR N - T - NR N - T - NR N - T - NR N - P - NR Public Transportation N - P - NR N - P - NR N - P - NR N - P - NR N - P - NR
Noise
Traffic N - P - NR B - P - NR N - P - NR B - P - NR N - P - NR VMF Operations & BEV Charging N - P - NR N - P - NR N - P - NR N - P - NR N - P - NR
Air Quality
Air Emissions B - P - NR B - P - NR B - P - NR B - P - NR N - P - N General Conformity N/A - N/A - N/A N/A - N/A - N/A N/A - N/A - N/A N/A - N/A - N/A N/A - N/A - N/A Greenhouse Gas B - P - NR B - P - NR B - P - NR B - P - NR N - P - NR
Community Services
Utilities N - P - NR N - P - NR N - P - NR N - P - NR N - P - N Emergency Services B - P - NR B - P - NR B - P - NR B - P - NR N - P - N
Utilities and Infrastructure
Availability N - P - NR N - P - Y N - P - NR N - P - Y N - P - NR Capacity N - P - NR N - P - Y N - P - NR N - P - Y N - P - NR
Energy Requirements and Conservation
Fuel Consumption B - P - NR B - P - Y N - P - NR B - P - Y N - P - N Electrical Grid N - P - NR N - P - Y N - P - NR N - P - Y N - P - N/A
Solid/Hazardous Materials/Waste Generation
Solid Waste N - P - NR N - P - NR N - P - NR N - P - NR N - P - NR Hazardous Waste N - P - NR B - P - NR N - P - NR B - P - NR N - P - NR
Recycling N - P - NR N - P - NR N - P - NR N - P - NR N - P - NR

United States Postal Service Draft Environmental Impact Statement Environmental Compliance and Risk Management
5-1 August 2021
5 OTHER IMPACTS
5-1 Unavoidable Adverse Impacts
The Proposed Action and Alternatives 1.1 and 1.2 would involve the purchase and deployment of up to 165,000 NGDV or COTS vehicles in total production orders over a ten-year period. High-maintenance and end-of-life delivery vehicles would be replaced at various Postal Service facility locations throughout the U.S. on a one-for-one basis, resulting in no additional delivery vehicles (Appendix D). This number of new delivery vehicles represents a negligible percentage of the over 122 million cars and almost 160 million trucks registered in the U.S. in 2018 (USDOE 2021).
5-1.1 Proposed Action – ICE NGDV Hypothetical Maximum
Under the ICE NGDV Hypothetical Maximum, the Proposed Action would generate solid and hazardous wastes from continued maintenance of delivery vehicles, but to a lesser degree than the No-Action Alternative. Less fuel would be purchased from retailers and bulk suppliers because of better gas mileage by the ICE NDGV, and up to 16,500 BEV NGDV not requiring fuel for operation. New NGDV would require less maintenance than the high-maintenance and end-of-life delivery vehicles. The need for commercial garage maintenance due to unscheduled repairs of vehicles is anticipated to decrease. This would result in adverse impacts to commercial fuel retailers from lower overall fuel sales and less maintenance needed by commercial garages for unscheduled repairs because the new vehicles would be more fuel efficient and would not need as much maintenance as the high-maintenance and end-of-life delivery vehicles being replaced.
Although there would be an increase in the number of vehicles and/or parts that would need to be sold, recycled to the extent possible, or disposed in accordance with the Postal Service’s protocols, there is adequate nationwide treatment and disposal capacity, with the exception of nickel-manganese-cobalt-oxide BEV batteries. Spent BEV batteries would be an additional source of hazardous waste. Spent batteries could be collected under streamlined universal waste collection standards to make it easier to send them for recycling or proper treatment and disposal. Recycling methods in the U.S. are limited at this time and vary in recovery capabilities for spent BEV batteries; however, it is expected that recycling capacity over the effective life of the BEV NGDV would increase with the increasing nationwide adoption of BEVs.
This Proposed Action would not impact short-term uses of environmental resources that would affect the maintenance of long-term productivity.
Delivery vehicle operation contributes to ambient noise around Postal Service facilities and along delivery routes. Vehicle noise sources include air passing over vehicles, engine, exhaust and drivetrain, and tires rolling on roadway surfaces. ICE vehicles are expected to generate less noise than the high-maintenance and end-of-life delivery vehicles being replaced, and BEVs are expected to generate even less noise than ICE vehicles at low speeds where tire noise does not predominate. There would be negligible to minimal impact on the overall ambient noise environment since each delivery event occurs over a short duration at generally low speeds and during daytime hours.
The ICE NGDV would continue to produce air emissions during operations, but to a lesser extent than vehicles being replaced, due to advances in new technologies in engine and transmission designs and in emission controls. Replacing the high-maintenance and end-of-life

United States Postal Service Draft Environmental Impact Statement Environmental Compliance and Risk Management
5-2 August 2021
delivery vehicles with ICE NGDV would result in a beneficial net reduction in air pollutant and GHG emissions. There would be a positive (beneficial) impact on social cost of carbon emissions.
5-1.2 Proposed Action – NGDV BEV Hypothetical Maximum
The Proposed Action, under this Hypothetical Maximum, would generate solid and hazardous wastes from continued maintenance of delivery vehicles, but to a lesser degree than under the No-Action Alternative. Less fuel would be purchased from retailers and bulk suppliers because the BEV NDGV would not require fuel for operation. New NGDV would require less maintenance than the high-maintenance and end-of-life delivery vehicles. The need for commercial garage maintenance due to unscheduled repairs of vehicles is anticipated to decrease. This would result in adverse impacts to commercial fuel retailers from lower overall fuel sales and less maintenance needed by commercial garages for unscheduled repairs because the new vehicles would be more fuel-efficient and would not need as much maintenance as the delivery vehicles being replaced.
Although there would be an increased demand for disposal of vehicles or parts that would need to be sold, recycled to the extent possible, or disposed in accordance with the Postal Service’s fleet disposal strategy, there is adequate nationwide treatment and disposal capacity with the exception of spent nickel-manganese-cobalt-oxide BEV batteries. Spent BEV batteries would be an additional source of hazardous waste, but the Proposed Action would generate more battery waste under this Hypothetical Maximum than the 90 percent ICE NGDV and 10 percent BEV NGDV Hypothetical Maximum. However, spent batteries could be collected under streamlined universal waste collection standards to make it easier to send them for recycling or proper treatment and disposal. Recycling methods in the U.S. are limited and vary in recovery capabilities for spent BEV batteries; however, it is expected that recycling capacity over the effective life of the BEV NGDV would increase with the increasing nationwide adoption of BEVs.
This Proposed Action therefore would not impact short-term uses of environmental resources that would affect the maintenance of long-term productivity.
Delivery vehicle operation would contribute to ambient noise around Postal Service facilities and along delivery routes. Vehicle noise sources include air passing over vehicles, engine, exhaust and drivetrain, and tires rolling on roadway surfaces. BEVs are expected to be quieter than ICE vehicles at low speeds where tire noise does not predominate. There would be negligible to minimal impact on the overall ambient noise environment since each delivery event occurs over a short duration at generally low speeds and during daytime hours.
The BEV NGDV would produce fewer air emissions than the ICE NGDV during operations. Replacing the high-maintenance and end-of-life delivery vehicles with BEV NGDV would result in a greater beneficial net reduction in air pollutant and GHG emissions, and there would be approximately 1.5 times greater social cost benefit as compared to the 90 percent ICE NGDV and 10 percent BEV NGDV Hypothetical Maximum.
5-1.3 Alternative 1.1 – 100% RHD COTS ICE Vehicles
Alternative 1.1 would generate solid and hazardous wastes from continued maintenance of delivery vehicles, but to a lesser degree than under the No-Action Alternative. More fuel for the 165,000 COTS ICE vehicles would be purchased from retailers and bulk suppliers because of their lower average fuel efficiency (mpg) than the mix of current delivery vehicles. The need for commercial garage maintenance due to unscheduled repairs of vehicles is anticipated to

United States Postal Service Draft Environmental Impact Statement Environmental Compliance and Risk Management
5-3 August 2021
decrease. New COTS vehicles would result in adverse impacts to commercial fuel retailers from lower overall fuel sales and less maintenance needed by commercial garages for unscheduled repairs because the new vehicles would be more fuel-efficient and would not need as much maintenance as the high-maintenance and end-of-life delivery vehicles being replaced. This would result in less business for commercial garages performing unscheduled repairs because the new vehicles would not need as much maintenance as the delivery vehicles being replaced. Although there would be an increased demand for disposal of vehicles or parts that would need to be sold, recycled to the extent possible, or disposed in accordance with the Postal Service’s fleet disposal strategy, there is adequate nationwide treatment and disposal capacity. Alternative 1.1 therefore would not impact short-term uses of environmental resources that would affect the maintenance of long-term productivity.
Delivery vehicle operation would contribute to ambient noise around Postal Service facilities and along delivery routes. Vehicle noise sources include air passing over vehicles, engine, exhaust and drivetrain, and tires rolling on roadway surfaces. COTS ICE vehicles are expected to be quieter than the aged delivery vehicles being replaced. There would be negligible to minimal impact on the overall ambient noise environment since each delivery event occurs over a short duration at generally low speeds and during daytime hours.
The COTS ICE vehicles would continue to produce air emissions during operations. Replacing the high-maintenance and end-of-life delivery vehicles with COTS ICE vehicles would result in a beneficial net reduction in air pollutant and GHG emissions. However, there would be less beneficial impact, including the least social cost benefit from carbon emissions, than under any other Alternative.
5-1.4 Alternative 1.2 – 100% LHD COTS BEVs
Alternative 1.2 would generate solid and hazardous wastes from continued maintenance of delivery vehicles, but to a lesser degree than under the No-Action Alternative. Less fuel would be purchased from retailers and bulk suppliers because the COTS BEVs would not require fuel for operation. New COTS vehicles would require less maintenance than the high-maintenance and end-of-life delivery vehicles. The need for commercial garage maintenance due to unscheduled repairs of vehicles is anticipated to decrease, This would result in result in adverse impacts to commercial fuel retailers from lower overall fuel sales and less maintenance needed for unscheduled repairs by commercial garages because the new vehicles would be more fuel-efficient and would not need as much maintenance as the high-maintenance and end-of-life delivery vehicles being replaced.
Although there would be an increased demand for disposal of vehicles or parts that would need to be sold, recycled to the extent possible, or disposed in accordance with the Postal Service’s fleet disposal strategy, there is adequate nationwide treatment and disposal capacity with the exception of spent lithium-ion BEV batteries. Spent BEV batteries would be an additional source of hazardous waste. However, spent batteries could be collected under streamlined universal waste collection standards to make it easier to send them for recycling or proper treatment and disposal. Recycling methods in the U.S. are limited and vary in recovery capabilities for spent BEV batteries; however, it is expected that recycling capacity over the effective life of the COTS BEV would increase with the increasing nationwide adoption of BEVs.
Alternative 1.2 therefore would not impact short-term uses of environmental resources that would affect the maintenance of long-term productivity.

United States Postal Service Draft Environmental Impact Statement Environmental Compliance and Risk Management
5-4 August 2021
Delivery vehicle operation would contribute to ambient noise around Postal Service facilities and along delivery routes. Vehicle noise sources include air passing over vehicles, engine, exhaust and drivetrain, and tires rolling on roadway surfaces. BEVs are expected to be quieter than ICE vehicles at low speeds where tire noise does not predominate. There would be negligible to minimal impact on the overall ambient noise environment since each delivery event occurs over a short duration at generally low speeds and during daytime hours.
The COTS BEVs would produce fewer direct and indirect air emissions than the COTS ICE vehicles during operations. Replacing the high-maintenance and end-of-life delivery vehicles with COTS BEVs would have the same beneficial net reduction in air pollutant and GHG emissions as the 100 percent BEV NGDV Hypothetical Maximum. Alternative 1.2 would represent greater benefit in terms of social cost of carbon emissions and there would be approximately two times greater social cost benefit as compared to the ICE NGDV Hypothetical Maximum.
5-2 Irreversible and Irretrievable Commitments of Resources
Irreversible and irretrievable commitments of resources refer to the impacts on or losses of resources that cannot be recovered or reversed such as the use of fuel or mined minerals. The Proposed Action and Alternatives 1.1 and 1.2 would involve the purchase and deployment of up to 165,000 NGDV or COTS vehicles in total production orders over a ten-year period. High-maintenance and end-of-life delivery vehicles would be replaced at various Postal Service facility locations throughout the U.S. on a one-for-one basis, resulting in no additional delivery vehicles (see Appendix D).
5-2.1 Proposed Action
Under the Proposed Action ICE NGDV Hypothetical Maximum, fuel would continue to be used for ICE NGDV. There would be a one-to-one replacement of high-maintenance and end-of-life delivery vehicles, and the NGDV would be more fuel-efficient than the delivery vehicles being replaced, so less fuel would be consumed than is currently or under the No Action Alternative. BEV NGDV would not require fuel and even considering fuel for the grid (as evaluated through eGRID), there would be a net reduction in fuel usage.
In 2020, non-renewable energy sources accounted for about 80 percent of electricity generation (USEIA 2021), and the BEV NGDV would result in irreversible commitment of the non-renewable fuel resources. Also, the BEV NGDV would use nickel-manganese-cobalt-oxide batteries that would result in irreversible commitment of the mined mineral ores needed for battery production. The minerals of primary concern for BEV battery production are cobalt, lithium, graphite and manganese, all of which are listed as critical materials by the United States Geological Survey due to the heavy reliance for economic development and high vulnerability in the supply chain (FR 2018).
5-2.2 Alternative 1.1 – 100% RHD COTS ICE Vehicles
Alternative 1.1 would continue to use fuel for COTS ICE vehicles. There would be a one-to-one replacement of high-maintenance and end-of-life delivery vehicles, and the COTS ICE vehicles would be more fuel-efficient than the delivery vehicles being replaced. Thus, there would be a net reduction in fuel usage.

United States Postal Service Draft Environmental Impact Statement Environmental Compliance and Risk Management
5-5 August 2021
5-2.3 Alternative 1.2 - 100% LHD COTS BEVs
Alternative 1.2 would not require fuel usage, and even considering fuel for the grid (as evaluated through eGRID), there would be a net reduction in fuel usage
In 2020, non-renewable energy sources accounted for about 80 percent of electricity generation (USEIA 2021), and the COTS BEVs would result in irreversible commitment of the non-renewable fuel resources. Also, the COTS BEV lithium-ion batteries would result in more irreversible commitment of the mined mineral ores needed for battery production than for the ICE or No-Action Alternatives. The minerals of primary concern for BEV battery production are cobalt, lithium, graphite and manganese, all of which are listed as critical materials by the United States Geological Survey due to the heavy reliance on for economic development and high vulnerability in the supply chain (FR 2018).

United States Postal Service Draft Environmental Impact Statement Environmental Compliance and Risk Management
6-1 August 2021
6 CUMULATIVE IMPACTS
6-1 Introduction
Cumulative impacts are the impacts on the environment that result from the incremental impact of a proposed action when added to other past, present, and reasonably foreseeable future actions. Cumulative impacts result when the effects of an action are added to or interact with other effects in a particular place and within a particular time frame. The cumulative impacts of an action can be viewed as the collective environmental effects (magnitude, extent, or duration) on an environmental resource, ecosystem, or human community from a proposed action when added to impacts from other actions affecting that resource. If an action does not have impacts on a particular resource, there would be no cumulative effects attributable to the action.
The analysis of cumulative impacts requires specific knowledge of other actions occurring or proposed to occur within or near the geographic study area. This analysis focuses on the nationwide deployment of new Postal Service delivery vehicles with one-to-one replacement of high-maintenance and end-of-life delivery vehicles over a ten-year period. The quantity of new vehicles and the site-specific locations of where they would be deployed are not known at this time. Given the nature and nationwide scope of the Proposed Action and Alternatives 1.1 and 1.2, identifying the actions of others would be very difficult if not impossible to quantify. Therefore, cumulative effects from the incremental impacts of the Proposed Action and Alternative 1.1 and 1.2 scenarios are evaluated broadly on a nationwide scale.
6-2 Geographic Extent and Time Frame
The deployment of up to 165,000 replacement delivery vehicles over a ten-year period is nationwide in scope, with vehicles to be placed at various Postal Service facilities across the U.S. depending on the locations of the high-maintenance and/or end-of-life of existing delivery vehicles to be replaced. Therefore, the geographic extent of this cumulative impact analysis is also national in scope. The temporal scope of this analysis considers nationwide trends related to past and future action impacts when the incremental impacts related to upgrading the Postal Service’s delivery fleet are added. The Proposed Action and Alternatives 1.1 and 1.2 deployments would span a time-period of ten years beginning in 2023, and the vehicles' operational time-period would continue for the life span of the vehicles.
6-3 Past, Present, and Reasonably Foreseeable Projects and Actions
Considered
The temporal scope of this analysis spans past and planned future actions related to upgrading the Postal Service’s delivery fleet vehicles. The Postal Service continually replaces high-maintenance and end-of-life delivery vehicles. The current delivery fleet of approximately 218,000 vehicles consists of approximately 159,000 LLV/FFVs, 34,000 LHD COTS vehicles, 17,000 RHD COTS vehicles, and 8,000 two-ton mixed delivery and collection vehicles (Cargo Vans). The mixed delivery and collection vans transport large volumes of mail from mailers’ plants and Postal Service processing facilities to Post Offices and airports around the country. Cargo Vans travel on highways throughout the U.S. New COTS ICE vehicles, evaluated in a 2017 PEA (USPS), and an REC in 2020, continue to be purchased as needed to replace high-maintenance and end-of-life delivery vehicles and to support delivery route growth.

United States Postal Service Draft Environmental Impact Statement Environmental Compliance and Risk Management
6-2 August 2021
6-4 Discussion of Potential Cumulative Impacts
6-4.1 Resources Not Studied in Detail
The Proposed Action and Alternatives 1.1 and 1.2 scenarios would potentially affect the environmental resources discussed in this section. There would be no potential for cumulative impact on the environmental resources not studied in detail in this EIS, as described in Section 4-2 (water, geology, soils, prime farmland, vegetation, wildlife, threatened and endangered species, wetlands and floodplains, cultural resources, land use, wild and scenic rivers and coastal zone). As discussed in Sections 1-3.1 and 4-2, site-specific facility alterations and a potential new training facility are not included in the detailed evaluation of the Proposed Action and Alternatives 1.1 and 1.2, as these specifically address the purchase and operation of new Postal Service delivery vehicles. Appropriate NEPA reviews at the local level would be conducted in the future, as needed.
6-4.2 Socioeconomics
The purchase and deployment of up to 165,000 new delivery vehicles over a ten-year period to replace the same number of high-maintenance and end-of-life delivery vehicles would result in negligible impacts on community economics, employment, and minority and low-income populations. There would be a negligible beneficial effect on the nationwide economy from the purchase and deployment of 165,000 delivery vehicles and on the local communities where the vehicles are manufactured and sold. The sale, scrapping, and/or recycling of the aged delivery vehicles being replaced would likewise have a negligible positive economic effect on income for the used auto, parts, scrapping, and recycling industries. Adding more fuel-efficient ICE vehicle drivetrains and BEVs would reduce the demand for fuel (gasoline) purchases. These impacts would be insignificant when compared to the nationwide economy.
Adding BEVs would increase the demand for electricity available to commercial and residential users. There would be no to negligible impact on electricity availability. There would be beneficial impacts on ambient air quality in cities and suburbs where new ICE vehicles and BEVs are deployed because of the higher emission controls of the newer vehicles. There would be improvements in safety for delivery personnel and the general public that would decrease the potential risk of accidents due to vehicle mechanical failures and certain modern safety features. Postal Service deliveries are made regardless of socioeconomic status, so there would be no impact to minority or low-income populations in terms of mail service or disproportionately high or adverse economic effect resulting from the vehicle replacements at a facility. There would be no perceptible adverse impact to socioeconomic resources such as community economics, employees or minority and low-income populations employment from implementation of the Proposed Action and Alternatives 1.1 and 1.2 on a nationwide scale.
6-4.3 Transportation
The purchase and deployment of up to 165,000 new delivery vehicles over a ten-year period to replace the same number of high-maintenance and end-of-life delivery vehicles would result in no impact on local community or nationwide traffic, accessibility and parking at Postal Service facilities, or public transportation. There would be no increase in delivery routes or personnel. The new delivery vehicles would not impact nationwide traffic volume. Modern safety features on the new delivery vehicles would improve operational safety and coupled with past purchases of modern COTS ICE vehicles, would have a positive cumulative impact on operational safety. There would be no cumulative effect on traffic, accessibility, or public transportation, and no

United States Postal Service Draft Environmental Impact Statement Environmental Compliance and Risk Management
6-3 August 2021
potential for adverse cumulative effects on local or nationwide transportation on a nationwide scale.
6-4.4 Noise Environment
The purchase and deployment of up to 165,000 new delivery vehicles over a ten-year period would replace the same number of high-maintenance and end-of-life delivery vehicles. New ICE vehicles are expected to generate less noise than the delivery vehicles being replaced, and BEVs would generate even less noise than the ICE vehicles at low speeds where tire noise does not predominate. There would be negligible to minimal impact on the overall ambient noise environment since each delivery event occurs over a short duration at generally low speeds and during daytime hours. There would be no significant adverse cumulative impact on noise from any of the Proposed Action or Alternatives 1.1 and 1.2 on a nationwide scale.
6-4.5 Air Quality
The purchase and deployment of up to 165,000 new delivery vehicles over a ten-year period would replace the same number of high-maintenance and end-of-life delivery vehicles. The new ICE vehicles would continue to produce air emissions during operations. However, replacing the high-maintenance and end-of-life delivery vehicles with new ICE vehicles would result in a beneficial net reduction in air pollutant and GHG emissions, and there would be a positive (beneficial) impact on the social cost of carbon emissions. Past actions in which the Postal Service replaced high-maintenance and end-of-life delivery vehicles with new ICE vehicles also produced a beneficial net reduction in air pollutant emissions. The BEV alternatives would produce even fewer air emissions than ICE vehicles during operations, and would result in an even greater beneficial net reduction in air pollutant and GHG emissions and SCC emissions. The reduction in direct and indirect GHG emissions under the ICE NGDV Proposed Action Hypothetical Maximum would be 290,306 MT CO2e, under the BEV NGDV Proposed Action Hypothetical Maximum would be 865,213 MT CO2e (almost three times greater reduction in GHG emissions than under the ICE NGDV), under Alternative 1.1 (COTS ICE vehicles) would be 226,427 MT CO2e, and under Alternative 1.2 (COTS BEVs) would be 1,116,730 MT CO2e (the greatest reduction of both the Proposed Action and Alternative 1.1). There would be no significant adverse cumulative impact on air quality from any of the Proposed Action or Alternatives 1.1 and 1.2 on a nationwide scale.
6-4.6 Community Services
The purchase and deployment of up to 165,000 delivery vehicles over a ten-year period to replace the same number of high-maintenance and end-of-life delivery vehicles would not result in a significant adverse cumulative impact on community services. Adding BEV drivetrains to the Postal Service delivery fleet would reduce the demand for fuel, as would more fuel-efficient ICE vehicle drivetrains resulting in a negligible reduction in nationwide fuel demand. Adding BEVs would increase the demand for electricity from the electrical grid resulting in a negligible, incremental adverse effect on nationwide electricity demand (see Section 6-4.9). The Postal Service would install charging stations at various nationwide Postal Service facilities and not rely on public charging stations for charging delivery vehicles. There would be a potential beneficial impact on emergency services due to the improved, modern safety features of the new vehicles. There would be no significant adverse cumulative impact on community services on a nationwide scale.

United States Postal Service Draft Environmental Impact Statement Environmental Compliance and Risk Management
6-4 August 2021
6-4.7 Utilities and Infrastructure
The purchase and deployment of up to 165,000 delivery vehicles over a ten-year period to replace the same number of high-maintenance and end-of-life delivery vehicles would not result in a significant adverse cumulative impact on utilities or infrastructure. Adding BEVs would increase the demand for electricity from the electrical grid resulting in a negligible, incremental adverse effect on nationwide electricity demand (see Section 6-4.9), though this charging will occur in off-peak hours when overall grid demand is much lower. Charging stations would be needed at some Postal Service facilities to accommodate BEVs, and public charging stations would not be used. The impact on utilities and infrastructure services as a result of the Proposed Action and Alternative 1.2 would result in no or negligible changes from the present impacts on utility and infrastructure services. There would be no significant adverse cumulative impact on utilities and infrastructure on a nationwide scale.
6-4.8 Energy Requirements and Conservation
The purchase and deployment of up to 165,000 delivery vehicles over a ten-year period would replace the same number of high-maintenance and end-of-life delivery vehicles. The new NGDV and BEV delivery vehicles would be more fuel-efficient than the delivery vehicles being replaced. ICE NGDV would require less fuel (gasoline) than the replaced delivery vehicles and it is expected that oil changes would be less frequent for newer vehicles resulting in a reduction of oil needed for servicing the new vehicles. Past replacements of high-maintenance and end-of-life ICE delivery vehicles with new more fuel-efficient and lower maintenance ICE delivery vehicles also resulted in lower fuel consumption and less maintenance. Under Alternative 1.1, the COTS ICE vehicles would require more fuel (gasoline) than the replaced delivery vehicles, resulting in about 56 million gallons more annual fuel usage than the ICE NGDV hypothetical maximum Proposed Action. This Alternative would result in a negligible adverse impact on fuel resources on a nationwide scale. The cumulative impacts on fuel (gasoline) resources would be negligible, as the new delivery vehicles would make up a negligible percentage of the approximately 251 million cars and light trucks registered nationwide in 2021 (USDOE 2020).
BEVs would not require fuel, but electricity would be needed to recharge the BEVs. The Postal Service would install charging stations at various nationwide Postal Service facilities where new BEVs are deployed and would not rely on public charging stations. The increasing adoption of BEVs nationwide will place increasing demands on electrical usage for BEV operation. However, the annual energy usage and load requirements for the Proposed Action and Alternative 1.2 are less than one percent of the total annual energy generation for the U.S. in 2020. Nationally, the electric infrastructure needs of BEV NGDV or COTS BEVs would be minor in the context of the U.S. electric grid systems and no significant, national investment in generation, transmission, or distribution would be needed. Cumulative effects on the electrical energy demand would be negligible. The cumulative impacts on energy requirements would be negligible, as the new delivery vehicles would make up a negligible percentage of the approximately 251 million cars and light trucks registered nationwide in 2021 (USDOE 2020). There would be no significant adverse cumulative impact on energy requirements or conservation on a nationwide scale.
6-4.9 Solid and Hazardous Materials and Waste
The purchase and deployment of up to 165,000 delivery vehicles over a ten-year period to replace the same number of high-maintenance and end-of-life delivery vehicles would not result in a significant adverse cumulative impact on solid and hazardous waste treatment and disposal. Approximately the same quantities of wastes as currently generated by high-

United States Postal Service Draft Environmental Impact Statement Environmental Compliance and Risk Management
6-5 August 2021
maintenance and end-of-life vehicle replacements would be generated, except for the initial generation and disposal of scrapped vehicle wastes. The Postal Service sells vehicles or parts, and recycles materials to the extent possible, and waste is disposed of at licensed facilities with adequate capacity. There would be a significant reduction in the use of lubricants, oils, and greases used in BEVs compared to ICE vehicles. Nationally, there is adequate commercial treatment and landfill disposal capacity for hazardous waste through December 31, 2044 (EPA 2017). Spent BEV batteries would be an additional source of hazardous waste. Recycling capacity for BEV batteries is expected to increase over the next ten years before the end of the effective life of the NGDV or COTS batteries. No significant adverse cumulative impacts on solid and hazardous waste treatment and disposal on a nationwide scale are expected to result from implementation of either the Proposed Action or Alternatives 1.1 and 1.2.
6-4.10 Conclusion
Impacts from the Proposed Action and Alternatives 1.1 and 1.2 would not have the potential for significant adverse cumulative impacts on nationwide environmental resources when considered in combination with other actions nationwide. Because of adding newer delivery vehicles to the fleet, impacts on environmental resources generally are expected to be less than current impacts, including the No-Action Alternative. Therefore, the Proposed Action and Alternatives 1.1 and 1.2, would not result in a significant adverse cumulative impact on nationwide environmental resources.
United States Postal Service Draft Environmental Impact Statement Environmental Compliance and Risk Management
7-1 August 2021
7 MITIGATION MEASURES
7-1 Introduction
The EIS has been developed in accordance with NEPA regulations. As specified in NEPA, mitigation was considered throughout the environmental analysis process. Mitigation measures include avoiding the impact; minimizing or reducing the severity of impact over time; rectifying the impact by repairing, rehabilitating, or restoring the adverse effect; or compensating for the impact such that the impact is no longer significant.
The Proposed Action and Alternatives 1.1 and 1.2 would involve the purchase and deployment of up to 165,000 NGDV or COTS vehicles in total production orders over a ten-year period. High-maintenance and end-of-life delivery vehicles would be replaced at various Postal Service facility locations throughout the U.S. on a one-for-one basis, resulting in no additional delivery vehicles (Appendix D). This number of new delivery vehicles represents a negligible percentage of the over 122 million cars and almost 160 million trucks registered in the U.S. in 2018 (USDOE 2021).
7-2 Overview of Impacts
The Proposed Action and Alternatives 1.1 and 1.2 would not result in significant direct, indirect, or cumulative adverse impacts. There would be no or negligible adverse impacts on noise, economics, environmental justice, transportation, community services, utilities and infrastructure, energy requirements, or solid and hazardous waste (see Table 4-11.1). The Proposed Action and Alternatives 1.1 and 1.2 would result in minor positive (beneficial) impacts on traffic and vehicle safety from modern safety features, and air quality from a net reduction in delivery vehicle air emissions. The new vehicles would also result in reduced vehicle breakdowns. Alternative 1.1 would result in a negligible adverse impact on fuel resources on a nationwide scale. The Proposed Action and Alternative 1.2 would result in positive impacts on fuel consumption from increased fuel efficiency of the new delivery vehicles.
7-3 Mitigation Measures
Because of the small degree and low severity of adverse impacts of each of the Proposed Action and Alternatives 1.1 and 1.2 on environmental resources, mitigation measures are not necessary to avoid adverse impact, reduce the severity of adverse impact, rehabilitate and restore adverse effects, or compensate for adverse impact. Implementation of the Proposed Action or Alternatives 1.1 and 1.2 would provide various degrees of beneficial effects on some environmental resources.
7-4 Conclusion
Implementation of the Proposed Action or Alternatives 1.1 and 1.2 would serve to mitigate the existing impacts on environmental resources from the No-Action Alternative (continued operation of the high-maintenance and end-of-life delivery vehicles). No further mitigation measures would be necessary.

United States Postal Service Draft Environmental Impact Statement Environmental Compliance and Risk Management
8-1 August 2021
8 REFERENCES
Argonne National Laboratory. Greenhouse Gases, Emissions, and Energy use in Technologies (GREET) model.
Bishop D. and M. Simpson. 1977. Outside and Inside Noise Exposure in Urban and Suburban Areas. Available on the internet at https://www.nrs.fs.fed.us/pubs/gtr/gtr_ne25/gtr_ne25_183.pdf. Accessed June 2021.
Bureau of Economic Analysis. 2021. SAEMP25N Total Full-Time and Part-Time Employment by NAICS Industry 1/. Available on the internet at https://apps.bea.gov/1Table/download.cfm. Accessed June 2021.
CEQ (Council on Environmental Quality).
1997. Environmental Justice, Guidance Under the National Environmental Policy Act. Available on the internet at https://www.epa.gov/environmentaljustice/ceq-environmental-justice-guidance-under-national-environmental-policy-act. Accessed June 2021.
2016. Final Guidance for Federal Departments and Agencies on Consideration of Greenhouse Gas Emissions and the Effects of Climate Change in National Environmental Policy Act Review, Report Number, issued Aug. 1, 2016; withdrawn Apr. 5, 2017; under review Feb. 19, 2021, for revision and update.
Cowan, James P. 1994. Handbook of Environmental Acoustics.
Danish Road Directorate. 2015. Noise from Electric Vehicles – Measurements. March 25, 2015. Available on the internet at https://www.vejdirektoratet.dk/api/drupal/sites/default/files/publications/noise_from_electric_vehicles_0.pdf. Accessed June 2021.
EPA (United States Environmental Protection Agency).
1974. Information on Levels of Environmental Noise Requisite to Protect Public Health
and Welfare with an Adequate Margin of Safety. March 1974.
2014. MOVES2014b. Available on the internet at: https://www.epa.gov/moves. Accessed May and June 2021.
2017. National Capacity Assessment Report Pursuant to CERCLA Section 104(c)(9). December 17, 2019.
2021a. Summary of the Noise Control Act. Available on the internet at https://www.epa.gov/laws-regulations/summary-noise-control-act. Accessed July 2021.
2021b. Online at: https://www.epa.gov/criteria-air-pollutants/naaqs-table
2021c. Online at: https://www.epa.gov/general-conformity/de-minimis-tables
2021d. Emissions & Generation Resource Integrated Database (eGRID) data (eGRID2019). Released February 2021.

United States Postal Service Draft Environmental Impact Statement Environmental Compliance and Risk Management
8-2 August 2021
Ford Media Center. 2021. Available on the internet at https://media.ford.com/content/fordmedia/fna/us/en.relatedmedia.viewmore.image.html/content/fordmedia/fna/us/en/news/2020/11/12/all-electric-ford-e-transit/jcr:content/rightRailPar/relatedmedia.html#. Accessed 5/20/21.
FR (Federal Register).
2018. Final List of Critical Minerals 2018. Vol. 83, No. 97, May 18, 2018.
Available on the internet at https://www.govinfo.gov/content/pkg/FR-2018-05-
18/pdf/2018-10667.pdf. Accessed June 2021.
Executive Order 12898, Federal Actions to Address Environmental Justice in Minority Populations and Low-Income Populations.
2021. 86 FR 14. Executive Order 13990, Protecting Public Health and the Environment and Restoring Science to Tackle the Climate Crisis. Available at federalregister.gov/d/2021-01765, January 25, 2021.
Executive Order 14008, Tackling the Climate Crisis at Home and Abroad.
ITE (The Institute of Transportation Engineers). 2010. Transportation Impact Analyses for Site Development.
Interagency Working Group on Social Cost of Greenhouse Gases, United States Government. 2021. Technical Support Document: Social Cost of Carbon, Methane, and Nitrous Oxide Interim Estimates under Executive Order 13990. February. 2021.
King G., M. Roland-Mieszkowski, T. Jason, and D.G. Rainham. 2012. Noise Levels Associated with Urban Land Use. Journal of Urban Health, Vol. 89(6). December 2012. Available on the internet at https://www.ncbi.nlm.nih.gov/pmc/articles/PMC3531357/. Accessed June 2021.
LeBlanc, R. 2019. Auto Recycling Recent Trends, Opportunities, and Challenges. the balance small business. Accessed on June 9, 2021. Available from:https://www.thebalancesmb.com/auto-recycling-recent-trends-opportunities-and-challenges-4011892.
Motor and Wheels. 2021.
NOAA (National Oceanic and Atmospheric Administration). 2021. Available on the internet at https://www.climate.gov/news-features/climate-qa/isnt-there-lot-disagreement-among-climate-scientists-about-global-warming
OIG (Office of Inspector General, United States Postal Service). 2020. Audit Report, Delivery Vehicle Acquisition Strategy, Report Number 19-002-R-20, August 12.

United States Postal Service Draft Environmental Impact Statement Environmental Compliance and Risk Management
8-3 August 2021
Pew Research Center.
2020a. Public Holds Broadly Favorable Views of Many Federal Agencies, Including CDC and HHS. Available on the internet at https://www.pewresearch.org/politics/2020/04/09/public-holds-broadly-favorable-views-of-many-federal-agencies-including-cdc-and-hhs/. Accessed June 2021.
2020b. The state of the U.S. Postal Service in 8 charts. Pew Research Center. Available on the internet at https://www.pewresearch.org/fact-tank/2020/05/14/the-state-of-the-u-s-postal-service-in-8-charts/. Accessed June 2021.
PRB.org. 2021. Percent of the Population That Are Racial_Ethnic Minorities in U.S. Counties in 2019. PRB. Available on the internet at https://www.prb.org/usdata/indicator/race-ethnicity/map/county/2019. Accessed June 2021.
Starbucks. 2021. Number of Starbucks Stores in the U.S. I Statista. Available on the internet at https://www.statista.com/statistics/218360/number-of-starbucks-stores-in-the-us/. Accessed June 2021.
USCB (U.S. Census Bureau).
2017. 2017 Poverty Status in the Past 12 Months. Table 1701. American Community Survey 5 Year Estimates. Available on the internet at https://data.census.gov/cedsci/table?q=poverty%20rate&g=0100000US&tid=ACSST5Y2017.S1701&hidePreview=true. Accessed June 2021.
2018a. 2018 Hispanic or Latino Origin by Race. Table B03002. American Community Survey 5 Year Estimates. Available on the internet at https://data.census.gov/cedsci/table?q=B03002&g=0100000US&tid=ACSDT5Y2018.B03002. Accessed June 2021.
2018b. 2018 Poverty Status in the Past 12 Months. Table 1701. American Community Survey 5 Year Estimates. Available on the internet at https://data.census.gov/cedsci/table?q=poverty%20rate&g=0100000US&tid=ACSST5Y2018.S1701&hidePreview=true. Accessed June 2021.
2019a. 2017 Hispanic or Latino Origin by Race. Table B03002. American Community Survey 5 Year Estimates. Available on the internet at https://data.census.gov/cedsci/table?q=B03002&g=0100000US&tid=ACSDT5Y2017.B03002. Accessed June 2021.
2019b. 2019 Hispanic or Latino Origin by Race. Table B03002. American Community Survey 5 Year Estimates. Available on the internet at https://data.census.gov/cedsci/table?q=B03002&g=0100000US&tid=ACSDT5Y2019.B03002. Accessed June 2021.
2019c. 2019 Poverty Status in the Past 12 Months. Table 1701. American Community Survey 5 Year Estimates. Available on the internet at https://data.census.gov/cedsci/table?q=poverty%20rate&g=0100000US&tid=ACSST5Y2019.S1701. Accessed June 2021.
United States Global Change Research Program. 2017. Fourth National Climate Assessment,
Vol. I: the Climate Science Special Report. https://science2017.globalchange.gov/

United States Postal Service Draft Environmental Impact Statement Environmental Compliance and Risk Management
8-4 August 2021
USDOE (United States Department of Energy).
2021. At A Glance: Electric-Drive Vehicles. Available on the internet at https://afdc.energy.gov/files/u/publication/electric-drive_vehicles.pdf. Accessed June 2021.
2021. Energy Vehicle Technologies Office, Oak Ridge National Laboratory, Transportation Energy Data Book, Edition 39, table 6.2, available at https://tedb.ornl.gov/data/ as of May 19, 2021.
USEIA (U.S. Energy Information Administration).
2020. Hourly Electricity Consumption Varies Throughout the Day and Across Seasons. February 21, 2020. Available on the internet at https://www.eia.gov/todayinenergy/detail.php?id=42915. Accessed June 2021.
2021. Frequently Asked Questions (FAQS), How much of U.S. energy consumption and electricity generation comes from renewable resources? https://www.eia.gov/tools/faqs/faq.php?id=92&t=4. Site visited July 2021.
USPS (United States Postal Service).
2005. Postal Service Handbook RE-4, Standards for Facility Accessibility. Available on the internet at http://www.nalcbayarea.com/USPS%20Handbook/Handbook%20RE-4%20Standards%20for%20Facility%20Accessability.pdf. Accessed June 2021.
2013. Handbook EL-804, Safe Driver Program. Available on the internet at https://www.nalc.org/workplace-issues/resources/manuals/other/EL-804-June-2013-Safe-Driver-Program.pdf. Accessed June 2021.
2015. Facilities Environmental Guide. December 1997. Effective October 1, 2015. Available on the internet at https://about.usps.com/postal-bulletin/2015/pb22425/html/updt_003.htm. Accessed June 2021.
2017a. Programmatic Environmental Assessment, United Stated Postal Service, Commercial Off-the-Shelf Vehicle Acquisitions. Unites States Postal Service Office of Sustainability, Environmental Compliance and Risk Management, Washington DC, August 2017.
2017b. Annual Sustainability Report 2016. Available on the internet at https://sdd-pdf.s3.amazonaws.com/report-pdfs/2017/9f7677ecef7402c677a279693794dd25.pdf?AWSAccessKeyId=AKIAJZQ4KYD2D35QKCDA&Expires=1624974077&Signature=FVcpjtdGWxhQlL4w3qtTlSy9T4c%3DAccessed June 2021.
2020a. Fiscal Year 2020 Annual Report to Congress, An Essential Public Service. Updated May 2021. Available on the internet at https://www.21cpw.com/wp-content/uploads/2021/01/fy2020-annual-report-to-congress.pdf. Accessed June 2021.
2020b. United States Postal Service Annual Sustainability Report. https://about.usps.com/what/corporate-social-responsibility/sustainability/report/2020/usps-annual-sustainability-report.pdf

United States Postal Service Draft Environmental Impact Statement Environmental Compliance and Risk Management
8-5 August 2021
2021a. Postal Facts. https://facts.usps.com/table-facts
2021b. Community Activities. Available on the internet at https://about.usps.com/what/corporate-social-responsibility/activities/. Accessed June 2021.
Walmart. 2021. Location Facts. Available on the internet at https://corporate.walmart.com/our-story/our-locations. Accessed June 2021.

United States Postal Service Draft Environmental Impact Statement Environmental Compliance and Risk Management
9-1 August 2021
9 LIST OF PREPARERS
U.S. Postal Service
Davon M. Collins - Environmental Counsel, Procurement and Property Law. J.D., Yale Law School; B.A., Cornell University. Over 10 years’ experience practicing environmental law in the private and public sectors.
Casey Cole Huron - M.S., Environmental Science and Policy, The Johns Hopkins University; B.S., Science-Business, the University of Notre Dame. Manager, Environmental Compliance and Risk Management, U.S. Postal Service - Environmental Affairs. Over 20 years' professional experience in environmental compliance and sustainability, with a corporate focus on program/project management, policy development, strategic planning, and communications. Has managed numerous national environmental programs and projects, is a Lean Six Sigma Greenbelt, and is a graduate of the USPS Advanced Leadership Program.
AECOM Technical Services, Inc.
Charles Allen, PE - B.C.E. Georgia Institute of Technology. More than 40 years environmental experience, including over 25 years NEPA experience, including for USPS (Network Rationalization PEA, COTS Vehicle Acquisitions PEA, and numerous Facilities Construction and Operation EAs and Records of Environmental Considerations), Federal Aviation Administration, Federal Emergency Management Agency, Department of Veterans Affairs, U.S. Department of Justice, U.S. Air Force, and U.S Army Corps of Engineers.
Anneliesa Barta - MBA, Finance, and B.S., Psychology, Fordham University. Socioeconomic, Environmental Justice, and Energy Conservation Specialist with over ten years related experience in environmental impact assessment, and environmental planning. She has worked on a variety of Third- Party Environmental Assessments associated with solar, wind, and other renewable energy projects. She has identified subsistence populations and potentially impacted minority and low-income residents (communities of concern) and assessed the potential for disproportionately high and adverse human health or environmental effects on those communities.
Sunghye Chang Yun, PE - Ph.D. in Civil, Architecture, and Environmental Engineering, and M.S. Civil Engineering, The University of Texas at Austin; B.S.E Environmental Science and Engineering, Ewha Womans University. 17 years' relevant experience as an Air Quality Specialist, including air quality impact analysis in support of operational NEPA studies for USPS, and numerous NEPA studies including for the USPS (Network Rationalization, and COTS Vehicle Acquisitions) FAA, BLM, and U.S. Army.
Brendan Connelly - M.S., Energy Systems Engineering, University of Ireland, B.S. Mechanical Engineering, Miami University. Smart energy analyst with three years' experience in the electric vehicle, renewable energy, and energy efficiency sectors. His portfolio includes piloting V2G technology, research and development of electric vehicle adoption tools, preparing electric vehicles readiness plans, and writing technical papers on the impacts of equitable electric vehicle adoption and utilizing electric vehicles as an energy asset.
Paige Humecki, EIT, LEED AP O&M - Master of Energy Engineering, University of Illinois at Chicago; B.S., Environmental Engineering, Northwestern University. Seven years related experience with a specialty in energy engineering and technical analysis for smart energy

United States Postal Service Draft Environmental Impact Statement Environmental Compliance and Risk Management
9-2 August 2021
initiatives, including transportation electrification, for government agencies, electric utilities, and private companies. Her experience also includes modeling financial and environmental benefits for capital energy efficiency projects, and reporting performance on energy, water, and greenhouse gas reduction targets.
Larry W. Neal - M.S., Oceanography. More than 45 years' relevant experience, with more than 20 years’ NEPA experience, including studies and EA preparation for USPS. Project manager, NEPA lead, subject management expert for government NEPA projects (including USPS, USAF, USACE, USMC, BLM, USFWS, USCG). Recently, served as Subject Matter Expert and technical reviewer for a BLM Planning EIS.
Priyal Pandya - M.S. in Environmental Technology, M.S. in Chemical Engineering. 12 years' related environmental and NEPA experience, including operational NEPA air quality emissions study for USPS COTS Vehicle Acquisitions. Specialized Training: USEPA/FHWA Training for MOVES Emission Modeling: 2011, 2014, 2015 and 2018; MySQL for MOVES Training, USEPA/FHWA, 2015.
Patricia W. Slade - B.S., Geology, Emory University. More than 35 years' environmental experience, including over 25 years NEPA experience, including for USPS (Network Rationalization PEA, COTS Vehicle Acquisitions PEA, and numerous Facilities Construction and Operation EAs and Records of Environmental Considerations), Federal Aviation Administration, Federal Emergency Management Agency, Department of Veterans Affairs, Department of Justice, U.S. Air Force, and U.S Army Corps of Engineers.
Roger Wayson, PE - Ph.D. in Civil Engineering, Vanderbilt University; M.S. Civil Engineering and BES, Environmental Engineering, The University of Texas at Austin. More than 40 years relevant experience addressing air pollution (criteria, greenhouse gases, hazardous air pollutants) and noise pollution. Over 200 publications including 27 Journal Articles, 70 Peer Reviewed Conference Papers, 7 Books/Book Chapters, and 71 Major Project Reports.
Fang Yang - M.S., Atmospheric Science, B.S., Physics. Over 31 years' experience in air quality, noise and vibration, and energy and GHG studies primarily by using regulatory modeling tools. Led studies for projects in the industrial, commercial, transportation, aviation, government, and military areas including NEPA air quality impact analyses for airport, highway, rail and bus transit, intermodal facility, power generation, oil and gas, waste water treatment, zoning and land development.

United States Postal Service Draft Environmental Impact Statement - Appendix A Environmental Compliance and Risk Management
A-1 August 2021
APPENDIX A
ACRONYMS AND ABBREVIATIONS
and
INDEX
Table A-1 List of Acronyms and Abbreviations
Table A-2 Index

United States Postal Service Draft Environmental Impact Statement - Appendix A Environmental Compliance and Risk Management
A-2 August 2021
Table A-1 List of Acronyms
Acronym Expansion BEV battery electric vehicle
CAA Clean Air Act
CEQ Council on Environmental Quality
CFR Code of Federal Regulations
CH4 Methane
CO carbon monoxide
CO2 carbon dioxide
CO2e CO2 equivalents
COTS commercial-off-the-shelf
Cyl Cylinder
dB Decibel
dBA decibel (A-weighted scale)
DOT Department of Transportation
eGRID Emissions & Generation Resource Integrated Database
EIS Environmental Impact Statement
EISA Energy Independence and Security Act
EJ Environmental Justice
EO Executive Order
EPA Environmental Protection Agency
EPAct Energy Policy Act
FFV Flexible Fuel Vehicle
FR Federal Register
FY fiscal year
GHG Greenhouse Gas
GREET Greenhouse Gases, Emissions, and Energy use in Technologies
GSA General Services Administration
GVWR Gross Vehicle Weight Rating
GWP Global Warming Potential
Hz Hertz
ICE internal combustion engine
ITE Institute of Transportation Engineers
IWG Interagency Working Group
kg/mi Kilogram(s) per milt
km/h Kilometer(s)/hour
kW Kilowatt
kWh kilowatt hour
lbs Pounds
lb/MWh pounds per megawatt-hour
LHD Left Hand Drive
LLV Long-Life Vehicle
µg/m3 micrograms per cubic meter
mpg miles per gallon
mph miles per hour
MOVES MOtor Vehicle Emission Simulator
MT Metric Ton
MWh Megawatt hours
N2O nitrous oxide
N/A not applicable
NAAQS National Ambient Air Quality Standards
NECPA National Energy Conservation Policy Act

United States Postal Service Draft Environmental Impact Statement - Appendix A Environmental Compliance and Risk Management
A-3 August 2021
Acronym Expansion NEPA National Environmental Policy Act
NGDV Next Generation Delivery Vehicles
NOx nitrogen oxide
NO2 nitrogen dioxide
NOA Notice of Availability
NOAA National Oceanic and Atmospheric Administration
NOI Notice of Intent
NR not required
NRHP National Register of Historic Places
O3 ozone
OIG Office of Inspector General
Pb lead
PEA Programmatic Environmental Assessment
PM2.5 particulate matter (measured as less than 2.5 microns in diameter)
PM10 particulate matter (measured as less than 10 microns in diameter)
ppm parts per million
RCRA Resource Conservation and Recovery Act
REC Record of Environmental Consideration
RFI Request for Information
RFP Request for Proposal
RHD Right Hand Drive
SCC Social Cost of Carbon
SIP State Implementation Plan
SO2 sulfur dioxide
SOW Statement of Work
TCO Total Cost of Ownership
tpy ton per year
UST underground storage tank
U.S. United States
USC United States Code
USCB United States Census Bureau
USDOE United States Department of Energy
USEIA U.S. Energy Information Administration
USPS United States Postal Service
VMF Vehicle Maintenance Facility
VOC volatile organic compound
WTP Well-to-Pump

United States Postal Service Draft Environmental Impact Statement - Appendix A Environmental Compliance and Risk Management
A-4 August 2021
Table A-2 Index
Word Found on page number(s)
air emissions iv, 4-8, 4-16, 4-17, 4-18, 4-19, 4-20, 4-21, 4-22, 4-23, 4-24, 4-26, 4-28, 4-33, 5-1, 5-2, 5-3, 5-4, 6-3, 7-1
battery, batteries i, ii, iii, 1-3, 3-2, 3-3, 4-2, 4-16, 4-34, 4-35, 5-2, 5-4, 5-5
carrier conditions v, 4-2
charging stations 1-5, 3-3, 4-4, 4-5, 4-11, 4-12, 4-16, 4-31, 4-32, 4-34, 4-35, 6-3, 6-4
community services vi, vii, 4-30, 4-41, 6-3
construction 1-5, 3-2, 3-3, 4-4, 4-5, 4-13, 4-31, 4-38
cumulative impact iii, 6-1, 6-2, 6-3, 6-4, 6-5
delivery fleet v, 1-1, 1-2, 2-1, 3-7, 4-2, 4-3, 4-4, 4-8, 4-10, 4-14, 4-16, 4-28, 4-33, 6-1, 6-3
eGRID ix, x, 4-18, 4-19, 4-20, 4-23, 4-27, 5-4, 5-5, 8-2
employment vi, 4-5, 4-6, 4-8, 4-9, 4-41, 8-1
energy consumption 4-18, 4-19, 4-22, 4-25, 4-27
environmental impact 4-38, 9-1
facility impacts 4-4
fuel efficiency 4-33, 4-35, 5-3, 7-1
general conformity vi, 4-15, 4-16, 4-17, 4-19, 4-22, 4-24, 4-26, 4-27, 4-28, 4-41
greenhouse gas vi, 4-15, 4-16, 4-17, 4-18, 4-19, 4-20, 4-22, 4-23, 4-24, 4-25, 4-27, 4-28, 4-29, 4-41, 8-1
GREET ix, x, 4-18, 4-19, 4-20, 4-23, 4-25, 4-27, 4-28, 8-1
hazardous waste i, iii, 4-36, 4-37, 4-38, 4-39, 5-1, 5-2, 5-3, 6-5, 7-1
irreversible commitment 5-4, 5-5
leasing, leased v, 3-8, 4-38
life cycle x, 4-18, 4-36
life expectancy, v, 1-5, 3-7, 4-2
limit, limitation 1-5, 3-2, 3-4, 4-2, 4-15, 4-34, 4-35
minority and low-income populations 4-5, 4-7, 6-2
minority populations 4-5, 8-2
mitigation measures vii, 7-1
negligible impact i, iii, 4-1, 4-11, 4-12, 4-14, 4-31, 4-38, 6-2
NEPA i, iv, 1-1, 1-4, 1-5, 3-3, 3-5, 4-4, 4-5, 4-15, 6-2, 7-1, 9-1, 9-2
no impact 4-1, 4-8, 4-11, 4-12, 4-31, 4-32, 6-2
noise i, iii, 3-8, 4-9, 4-13, 4-14, 4-38, 5-1, 5-2, 5-3, 5-4, 6-3, 7-1, 8-1, 9-2
parking i, iii, 3-1, 3-3, 3-7, 4-4, 4-10, 4-11, 4-12, 4-13, 4-38, 6-2
Postal Service facilities 1-3, 1-5, 3-4, 3-8, 4-10, 4-11, 4-12, 4-13, 4-14, 4-16, 4-30, 4-31, 4-33, 4-37, 4-38, 5-1, 5-2, 5-3, 5-4, 6-1, 6-2, 6-3, 6-4
Powertrain Mix v, 3-4, 3-5
Production NGDV v, x, 1-3, 1-4
prototype 1-1, 1-2, 1-3
public safety 4-30
recycle iii, 4-36, 4-37, 4-38, 5-1, 5-2, 5-3
resources not studied v, vii, 4-4, 6-2

United States Postal Service Draft Environmental Impact Statement - Appendix A Environmental Compliance and Risk Management
A-5 August 2021
Word Found on page number(s)
safety i, ii, iii, iv, 1-1, 1-2, 1-3, 1-4, 2-1, 2-2, 3-5, 3-7, 4-2, 4-9, 4-10, 4-11, 4-12, 4-13, 4-30, 4-36, 4-37, 4-38, 4-39, 4-40, 6-2, 6-3, 7-1
SCC, social cost of greenhouse gas, social cost of carbon
4-16, 4-28,4-39, 5-2, 5-4, 6-3
solid waste 4-17, 4-36, 4-41
Specifications ix, 3-2, 3-6, 3-7
Stakeholder Involvement v, 1-5
Total Cost of Ownership, TCO i, 1-3
traffic i, iii, 4-9, 4-10, 4-11, 4-12, 4-13, 4-14, 4-38, 6-2, 7-1
unavoidable adverse impacts vii, 5-1
utilities vi, vii, 4-30, 4-31, 4-41, 6-4
utility services i, iii, 4-30, 4-38
vehicle fleet 1-3, 2-1, 3-4, 4-37
vehicle maintenance v, 1-5, 3-3, 3-5, 4-4, 4-8, 4-9, 4-14, 4-31, 4-36
workforce 3-3, 3-5, 4-4, 4-6, 4-9

United States Postal Service Draft Environmental Impact Statement - Appendix B Environmental Compliance and Risk Management
B-1 August 2021
APPENDIX B
CONSULTATION AND COORDINATION
B1 Notice of Intent
NOI Federal Register Publication (March 4, 2021)
Table B1-1 Notice of Intent Stakeholder Distribution List
Example NOI Letter (with Enclosure: March 4, 2021 Federal Register Publication, Postal Service Notice of Intent To Prepare an Environmental Impact Statement for Purchase of Next Generation Delivery Vehicles)
Agency and Public Comments
▪ U.S. Environmental Protection Agency (letter, April 2, 2021) ▪ Institute for Policy Integrity (letter, April 5, 2021) ▪ Elders Climate Action (Notice) ▪ Example form letters received from Elders Climate Action
Table B1-2 Response to Agency and Public Comments on the NOI
B2 Notice of Availability
Federal Register Publication
Stakeholder Distribution List
Example NOA Letter
Agency and Public Comments (included upon conclusion of 45-day public comment period)
Responses to Agency and Public Comments (included upon conclusion of 45-day public comment period)

United States Postal Service Draft Environmental Impact Statement - Appendix B Environmental Compliance and Risk Management
B-2 August 2021

United States Postal Service Draft Environmental Impact Statement - Appendix B Environmental Compliance and Risk Management
B-3 August 2021
Table B1-1 Notice of Intent Stakeholder Distribution List
Contact Name Position Mailing Address
Cindy Barger Director, NEPA Compliance Division
U.S. Environmental Protection Agency 1200 Pennsylvania Avenue, NW Ariel Rios Building, Mail Code 2251A Washington DC 20460-0003
Mr. Mark Dimondstein President
American Postal Workers Union 1300 L Street, NW Washington, DC 20005-4128
Ronnie W. Stutts President
National Rural Letter Carriers' Association 1630 Duke Street Alexandria, VA 22314-3467
Fredric V. Rolando President
National Association of Letter Carriers 100 Indiana Avenue, NW Washington, DC 20001-2144
Paul V. Hogrogian President
National Postal Mail Handlers Union 815 16th Street NW, Suite 5100 Washington, DC 20006 1200 New Jersey Avenue, SE, W41-113 Washington, DC 20006
Brian J. Wagner President
National Association of Postal Supervisors 1727 King Street, Suite 400 Alexandria, VA 22314-2753
Daniel M. Heins President
United Postmasters and Managers of America 8 Herbert Street Alexandria, VA 22305
Tammy L. Whitcomb Acting Inspector General
Office of Inspector General, United States Postal Service 1735 North Lynn Street Arlington, VA 22209-2020
Brian Costner Acting Director
Office of NEPA Policy and Compliance (GC-54) U.S. Department of Energy 1000 Independence Avenue, SW Washington, DC 20585-0119
Russell Krupen Attorney Advisor, Office of Chief Counsel
National Highway Traffic Safety Administration Department of Transportation 1200 New Jersey Avenue, SE, W41-113 Washington, DC 20590-0001
Jayni Hein Senior Director for NEPA
Council on Environmental Quality U.S. Department of Energy 730 Jackson Place, NW Washington, DC 20503

United States Postal Service Draft Environmental Impact Statement - Appendix B Environmental Compliance and Risk Management
B-4 August 2021
Example NOI Stakeholder Letter, with NOI Federal Register Enclosure

United States Postal Service Draft Environmental Impact Statement - Appendix B Environmental Compliance and Risk Management
B-5 August 2021
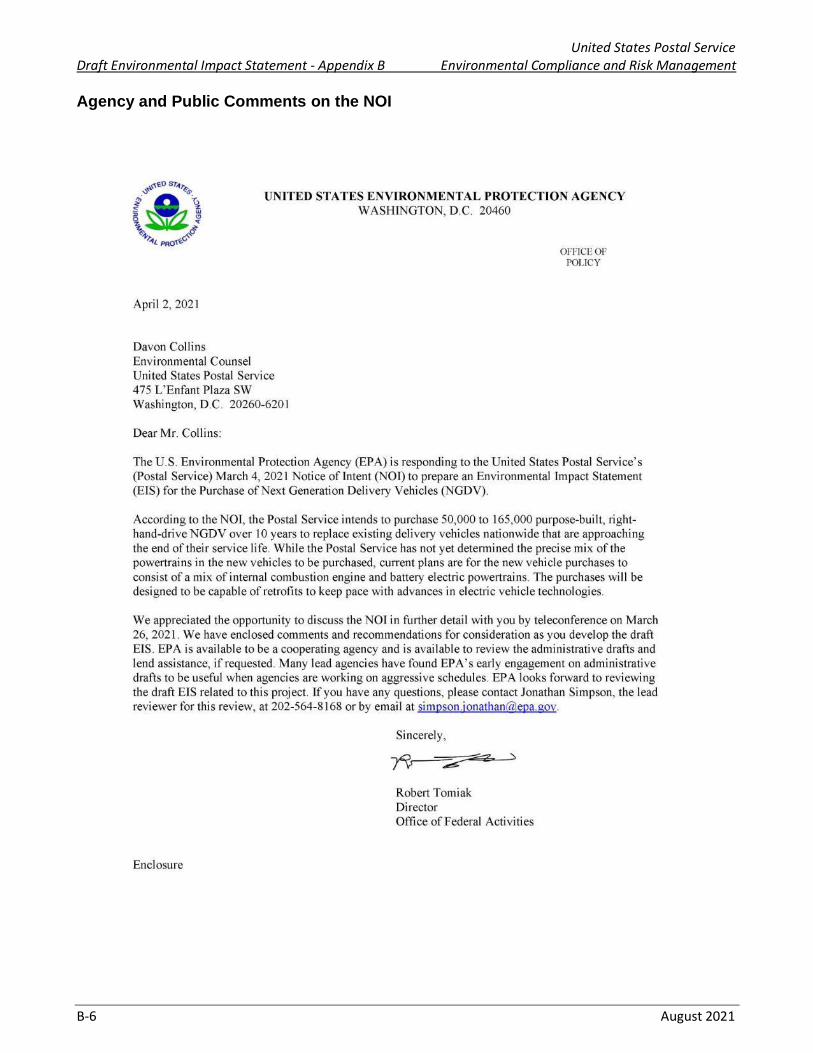
United States Postal Service Draft Environmental Impact Statement - Appendix B Environmental Compliance and Risk Management
B-6 August 2021
Agency and Public Comments on the NOI

United States Postal Service Draft Environmental Impact Statement - Appendix B Environmental Compliance and Risk Management
B-7 August 2021

United States Postal Service Draft Environmental Impact Statement - Appendix B Environmental Compliance and Risk Management
B-8 August 2021

United States Postal Service Draft Environmental Impact Statement - Appendix B Environmental Compliance and Risk Management
B-9 August 2021
Agency and Public Comments on the NOI (cont.)

United States Postal Service Draft Environmental Impact Statement - Appendix B Environmental Compliance and Risk Management
B-10 August 2021

United States Postal Service Draft Environmental Impact Statement - Appendix B Environmental Compliance and Risk Management
B-11 August 2021

United States Postal Service Draft Environmental Impact Statement - Appendix B Environmental Compliance and Risk Management
B-12 August 2021

United States Postal Service Draft Environmental Impact Statement - Appendix B Environmental Compliance and Risk Management
B-13 August 2021

United States Postal Service Draft Environmental Impact Statement - Appendix B Environmental Compliance and Risk Management
B-14 August 2021
Agency and Public Comments on the NOI (cont.)

United States Postal Service Draft Environmental Impact Statement - Appendix B Environmental Compliance and Risk Management
B-15 August 2021
Agency and Public Comments on the NOI (cont.)

United States Postal Service Draft Environmental Impact Statement - Appendix B Environmental Compliance and Risk Management
B-16 August 2021
Agency and Public Comments on the NOI (cont.)

United States Postal Service Draft Environmental Impact Statement - Appendix B Environmental Compliance and Risk Management
B-17 August 2021

United States Postal Service Draft Environmental Impact Statement - Appendix B Environmental Compliance and Risk Management
B-18 August 2021
Agency and Public Comments on the NOI (cont.)

United States Postal Service Draft Environmental Impact Statement - Appendix B Environmental Compliance and Risk Management
B-19 August 2021
Agency and Public Comments on the NOI (cont.)

United States Postal Service Draft Environmental Impact Statement - Appendix B Environmental Compliance and Risk Management
B-20 August 2021

United States Postal Service Draft Environmental Impact Statement - Appendix B Environmental Compliance and Risk Management
B-21 August 2021

United States Postal Service Draft Environmental Impact Statement - Appendix B Environmental Compliance and Risk Management
B-22 August 2021

United States Postal Service Draft Environmental Impact Statement - Appendix B Environmental Compliance and Risk Management
B-23 August 2021
Agency and Public Comments on the NOI (cont.)

United States Postal Service Draft Environmental Impact Statement - Appendix B Environmental Compliance and Risk Management
B-24 August 2021

United States Postal Service Draft Environmental Impact Statement - Appendix B Environmental Compliance and Risk Management
B-25 August 2021

United States Postal Service Draft Environmental Impact Statement - Appendix B Environmental Compliance and Risk Management
B-26 August 2021

United States Postal Service Draft Environmental Impact Statement - Appendix B Environmental Compliance and Risk Management
B-27 August 2021
Response to Agency and Public Comments on the NOI
Summary
▪ 1,753 comments were timely received in response to the NOI.
▪ The vast majority were form letter from Elders Climate Action.
▪ Several short emails urging USPS to buy electric vehicles were also submitted.
Table B1-2 Response to Agency and Public Comments on the NOI
Comment Received EPA Comment Response
1. USPS should acquire electric vehicles.
The EIS analyzes three action alternatives involving purchase of battery electric vehicles. (EIS Section 3)
2. Competitors of USPS are acquiring electric vehicles.
The commercial-off-the-shelf (COTS) BEV market and technology is rapidly advancing. The Postal Service needs a right -hand-drive (RHD) vehicle for the most efficient and safe curb-line deliveries. There is no RHD COTS BEV currently available or otherwise marketed by commercial manufacturers for future development. The Next Generation Delivery Vehicle offers a flexible powertrain that can be ordered in whatever internal combustion engine (ICE) or BEV mix the Postal Service desires. The NGDV can also be retrofitted to keep pace with advances in BEV technologies.
3. USPS should select the proposed action as the LLVs are old and falling apart.
The purpose of the Proposed Action is to replace aging and high-maintenance cost delivery vehicles (including the LLV), with the purpose-built NGDV. (EIS Section 2)
4. USPS violated NEPA by awarding Oshkosh Defense the NGDV contract prior to completion of the EIS.
The contract award contains an express NEPA clause stating that the Postal Service may modify or terminate the award as a result of the NEPA process. (EIS Section 1-3.2)
5. USPS should consider an alternative to replace part or all of the fleet with hybrid fuel-efficient or all electric vehicles.
Yes ICE, mild hybrid, and plug-in hybrid electric vehicles were among the 44 prototype vehicles offered as part of the NGDV prototype phase. NGDV Production proposals included ICE vehicles and battery electric vehicles (BEVs); the proposals did not include a hybrid production vehicle. (EIS Sections 1-3.2.1 and 1-3.2.2)
6. Purpose and need should be expanded to include the need for safer delivery vehicles, to increase cargo capacity to maximize efficiency, and to better accommodate higher package volumes stemming from the growth of e-commerce.
Yes The Purpose and Need include the need for a purpose-built vehicle with modern safety features, an increased cargo capacity and better access to the parcels in the cargo area, and RHD configuration for optimal ergonomics and efficiencies for deliveries to curb-line residential mailboxes (EIS Section 2)
7. Consider full life-cycle of PS vehicles from deployment to retirement/disposal in the project description.
Yes A Postal Service delivery vehicle life cycle is illustrated in Figure 4-10.1 (EIS Section 4-10.1), and the EIS analyzes full life cycle impacts (EIS Section 4).

United States Postal Service Draft Environmental Impact Statement - Appendix B Environmental Compliance and Risk Management
B-28 August 2021
Comment Received EPA Comment Response
8. USPS should consider best places to locate all-electric vehicles and prioritize nonattainment and maintenance NAAQS areas.
Yes The Postal Service would evaluate ICE and BEV NGDV deployment based on existing nationwide delivery route characteristics and other established factors to prioritize potential placement of the two powertrains. Route characteristics for placement of BEV NGDV would include routes located in mild temperature ranges, routes with frequent and numerous curb-line stops as they best recapture the vehicle's motion (kinetic) energy via regenerative braking to recharge the battery, and routes in locations with compromised air quality and/or states with proactive BEV policies and regulations. (EIS Section 3-1.1)
9. USPS should use the 2016 GHG guidance as a resource.
Yes The EIS analysis used the 2016 GHG guidance as a resource. (EIS Section 4-6.1.3)
10. Environmental Justice should be considered for low-income and disadvantaged communities already burdened with high levels of traffic-related pollutants or noise impacts. Also consider the equitable distribution of project benefits to minority and low-income populations in the timing of replacement of delivery vehicles and the types of vehicles replaced.
Yes The Proposed Action and Alternatives would result in no impact on minority or low-income populations in terms of mail service or disproportionately high adverse economic effect. See response to Comment 8 regarding deployment of the new delivery vehicles. Both the Proposed Action and Alternatives would result in negligible beneficial impacts on air quality due to higher emission controls and better gas mileage of the newly purchased vehicles as compared to the high-maintenance and end-of-life delivery vehicles being replaced. Such beneficial impacts would occur regardless of race or socioeconomic status. Both the Proposed Action and Alternatives would also result in safety and ergonomic improvements for delivery employees and the general public, and decrease the risk of accidents due to mechanical failure or fewer modern safety features associated with the existing delivery vehicles. These beneficial impacts would occur regardless of race or socioeconomic status. (EIS Section 4-3.3.1)
11. USPS should consider hazardous waste implications for disposal of existing fleet.
Yes The EIS considers hazardous waste implications for disposal of the existing fleet. Disposal of the existing delivery vehicles would take place over a ten-year period, and the Postal Service vehicle disposal strategy and contracts in place for recycling and disposal would minimize the adverse impacts to the extent possible. Recycling and disposal of the wastes and materials from the replaced vehicles would have no significant adverse impact on commercial treatment capacity and landfill capacity over the ten-year period. (EIS Section 4-10.2)
12. USPS should consider land use development – for example, if updates to postal facilities are needed for plug-in stations.
Yes The Postal Service would conduct appropriate environmental reviews at the local level per Postal Service Handbook RE-6 (2015) as needed for construction activities. Postal Service environmental checklists, screening analyses, and stand-alone, project-level Environmental Assessments would be

United States Postal Service Draft Environmental Impact Statement - Appendix B Environmental Compliance and Risk Management
B-29 August 2021
Comment Received EPA Comment Response
employed on a facility-specific basis to assess the extent of impacts from any facility-related actions. (EIS Section 1-3.1)
13. Institute for Policy Integrity recommends consideration of “social cost” of greenhouse gases.
The EIS considers the social cost of greenhouse gas (carbon). (EIS Sections 4.6.1-4 and 4-6.3, and Appendix F)

United States Postal Service Draft Environmental Impact Statement - Appendix B Environmental Compliance and Risk Management
B-30 August 2021
B2 Notice of Availability
Note: The Federal Register Notice of Availability publication will be inserted in the Final EIS.
Publication in Federal Register expected August 26, 2021 (refer to Federal Register for the actual publication date and comment period end-date)
U.S. POSTAL SERVICE
Notice of Availability of Draft Environmental Impact Statement for Purchase of Next Generation Delivery Vehicles
AGENCY: U.S. Postal Service
ACTION: Notice of Availability of Draft Environmental Impact Statement
SUMMARY: Pursuant to the requirements of the National Environmental Policy Act of 1969 (NEPA), its implementing procedures at 39 CFR 775, and the President’s Council on Environmental Quality Regulations (40 CFR parts 1500-1508), the U.S. Postal Service announces availability of the Draft Environmental Impact Statement (DEIS) to purchase over 10 years 50,000 to 165,000 purpose-built, right-hand-drive vehicles – the Next Generation Delivery Vehicle (NGDV) – to replace existing delivery vehicles nationwide that are approaching the end of their service life. While the Postal Service has not yet determined the precise mix of the powertrains in the new vehicles to be purchased, under the Proposed Action, at least ten percent of the NGDVs would have battery electric (BEV) powertrains, with the remainder being internal combustion (ICE). The DEIS evaluates the environmental impacts of the Proposed Action, as well as two BEV and ICE commercial off-the-shelf (COTS) vehicle alternatives and the “no action” alternative.
DATES: The Postal Service is soliciting comments on the DEIS during a 45-day public comment period. Comments should be received no later than [45 days from publication]. The Postal Service will also publish a Notice of Availability to announce the availability of the Final EIS.
ADDRESSES: Interested parties may view the DEIS at http://uspsngdveis.com/
Interested parties may mail or deliver written comments, containing the name and address of the commenter, to: Mr. Davon Collins, Environmental Counsel, United States Postal Service, 475 L'Enfant Plaza SW, Office 6606, Washington, DC 20260-6201, or at [email protected]. Note that comments sent by mail may be subject to delay due to federal security screening. Faxed comments are not accepted. All submitted comments and attachments are part of the public record and subject to disclosure. Do not enclose any material in your comments that you consider to be confidential or inappropriate for public disclosure.
You may inspect and photocopy all written comments, by appointment only, at USPS Headquarters Library, 475 L’Enfant Plaza SW, 11th Floor North, Washington, D.C. 20260 by calling 202-268-2906.

United States Postal Service Draft Environmental Impact Statement - Appendix B Environmental Compliance and Risk Management
B-31 August 2021
Table B2-1 Notice of Availability Stakeholder Distribution List
Contact Name Position Mailing Address
Robert Tomiak Director, Office of Federal Activities
U.S. Environmental Protection Agency 1200 Pennsylvania Avenue, NW WJC Building North, Mail Code 2251A Washington, DC 20460-0003
Cindy Barger Director, NEPA Compliance Division
U.S. Environmental Protection Agency 1200 Pennsylvania Avenue, NW WJC Building North, Mail Code 2251A Washington, DC 20460-0003
Mr. Mark Dimondstein President
American Postal Workers Union 1300 L Street, NW Washington, DC 20005-4128
Ronnie W. Stutts President
National Rural Letter Carriers' Association 1630 Duke Street Alexandria, VA 22314-3467
Fredric V. Rolando President
National Association of Letter Carriers 100 Indiana Avenue, NW Washington, DC 20001-2144
Paul V. Hogrogian President
National Postal Mail Handlers Union 815 16th Street NW, Suite 5100 Washington, DC 20006-4101
Brian J. Wagner President
National Association of Postal Supervisors 1727 King Street, Suite 400 Alexandria, VA 22314-2753
Daniel M. Heins President
United Postmasters and Managers of America 8 Herbert Street Alexandria, VA 22305-2628
Tammy L. Whitcomb Inspector General
Office of Inspector General, United States Postal Service 1735 North Lynn Street Arlington, VA 22209-2020
Brian Costner Director
Office of NEPA Policy and Compliance (GC-54) U.S. Department of Energy 1000 Independence Avenue, SW Washington, DC 20585-0119
Russell Krupen Attorney Advisor, Office of Chief Counsel
National Highway Traffic Safety Administration Department of Transportation 1200 New Jersey Avenue, SE, W41-113 Washington, DC 20590-0001
Jayni Hein Senior Director for NEPA
Council on Environmental Quality U.S. Department of Energy 730 Jackson Place, NW Washington, DC 20503-1659
Iliana Paul, Senior Policy Analyst, Max Sarinsky, Senior Attorney, Jason A. Schwartz, Legal Director
Institute for Policy Integrity at New York University School of Law 139 MacDougal Street, Third Floor New York, NY 10012-1076

United States Postal Service Draft Environmental Impact Statement - Appendix B Environmental Compliance and Risk Management
B-32 August 2021
Example NOA Letter
August 27, 2021
Address
Re: Notice of Availability of Draft Environmental Impact Statement for Purchase of Next Generation Delivery Vehicles
Dear Addressee:
The Postal Service has prepared a Draft Environmental Impact Statement (DEIS) for the purchase of
Next Generation Delivery Vehicles (NGDV) for delivery operations nationwide. The new vehicles would
replace existing delivery vehicles that are approaching the end of their service life. Pursuant to the
requirements of the National Environmental Policy Act (NEPA) of 1969, its implementing procedures at
39 CFR 775, and the President's Council on Environmental Quality Regulations (40 CFR parts 1500-
1508), the Postal Service prepared this DEIS to evaluate the environmental impacts of the proposed
action and alternatives. A copy of the Notice of Availability of the DEIS is enclosed.
Interested parties may view the DEIS at http://uspsngdveis.com/
Interested parties may mail or deliver written comments, containing the name and address of the
commenter, to: Mr. Davon Collins, Environmental Counsel, United States Postal Service, 475 L'Enfant
Plaza SW, Office 6606, Washington, DC 20260-6201, or at [email protected]. Note that comments sent
by mail may be subject to delay due to federal security screening. Faxed comments are not accepted.
All submitted comments and attachments are part of the public record and subject to disclosure. Do not
enclose any material in your comments that you consider to be confidential or inappropriate for public
disclosure.
Sincerely,
Jennifer Beiro-Réveillé
Enclosure

United States Postal Service Draft Environmental Impact Statement - Appendix C Environmental Compliance and Risk Management
C-1 August 2021
APPENDIX C
COST DATA BACKGROUND
LLV Maintenance Cost Background Data
NGDV Total Cost of Ownership Background Information
Estimated Costs of Purchasing Versus Leasing of Right-Hand Drive (RHD) Commercial-off-the-Shelf (COTS) Vehicles
Table C-1 Estimated Costs for RHD COTS Purchase and RHD COTS Lease
Appendix C References
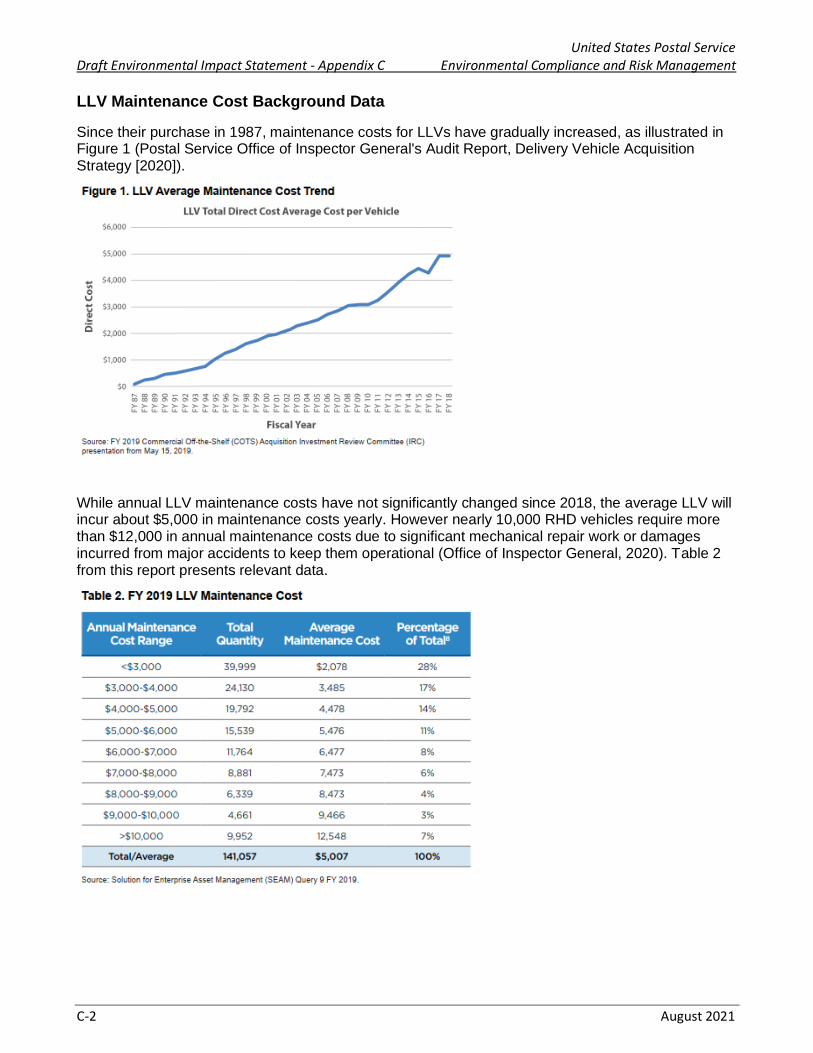
United States Postal Service Draft Environmental Impact Statement - Appendix C Environmental Compliance and Risk Management
C-2 August 2021
LLV Maintenance Cost Background Data
Since their purchase in 1987, maintenance costs for LLVs have gradually increased, as illustrated in Figure 1 (Postal Service Office of Inspector General's Audit Report, Delivery Vehicle Acquisition Strategy [2020]).
While annual LLV maintenance costs have not significantly changed since 2018, the average LLV will incur about $5,000 in maintenance costs yearly. However nearly 10,000 RHD vehicles require more than $12,000 in annual maintenance costs due to significant mechanical repair work or damages incurred from major accidents to keep them operational (Office of Inspector General, 2020). Table 2 from this report presents relevant data.

United States Postal Service Draft Environmental Impact Statement - Appendix C Environmental Compliance and Risk Management
C-3 August 2021
NGDV Total Cost of Ownership Background Information
The Postal Service considered several variables in a comparative life cycle cost analysis for future purchase and deployment of the NGDV. Analysis considered acquisition costs (vehicle pricing, freight, other contract costs [training, manuals, technical data package, milestone payments], and estimated electric vehicle charging infrastructure costs. Estimated vehicle acquisition costs were based on NGDV supplier rough order of magnitude cost, COTS procurements, and evolving market conditions. The analysis also considered recurring costs (maintenance, fuel [gasoline for ICE vehicles, electricity for BEVs]). Estimated operational savings were based on potential maintenance and fuel savings.
Offerors provided NGDV Production proposals and pricing to the Postal Service in July 2020. The proposals included internal combustion engine (ICE) vehicles and battery electric vehicles (BEVs). The Postal Service then evaluated proposals to determine which offeror provided the Postal Service with the best value by weighing technical evaluation factors/risk and the Total Cost of Ownership (TCO). Cost estimates were derived for the acquisition of each vehicle (Year 0), plus 20 years of recurring costs (fuel and maintenance, Year 1 through Year 20). The cost estimates were converted to present value, including a nominal discount rate and inflation, to allow a comparable TCO.
For illustrative purposes, an example TCO analysis approach for vehicle purchase and operation/maintenance is presented below.

United States Postal Service Draft Environmental Impact Statement - Appendix C Environmental Compliance and Risk Management
C-4 August 2021
Estimated Costs of Purchasing Versus Leasing of Right-Hand Drive (RHD) Commercial-off-the-Shelf (COTS) Vehicles
The Postal Service evaluated the estimated costs of purchasing and leasing RHD COTS vehicles as part of its decision analysis for future vehicle delivery acquisition. The estimates were based on past RHD COTS delivery vehicle acquisition data, and compared purchasing and leasing of 24,470 RHD COTS vehicles over a 13-year period.
Purchasing RHD COTS vehicles was determined to be more than three times less costly than leasing RHD COTS vehicles.
Table C-1 Estimated Costs for RHD COTS Purchase and RHD COTS Lease
Purchase vs Lease Total Estimated Cost1
RHD COTS Purchase $1,567,512
RHD COTS Lease $5,281,355
1 Based on 2019 USPS analysis comparing 24,470 RHD COTS vehicles over 13-year period
Appendix C References
Office of Inspector General. 2020. Audit Report, Delivery Vehicle Acquisition Strategy. Report Number
19-002-R20. August 12.

United States Postal Service Draft Environmental Impact Statement - Appendix D Environmental Compliance and Risk Management
D-1 August 2021
APPENDIX D
HYPOTHETICAL TEN-YEAR PURCHASE/DEPLOYMENT
Table D-1 presents the hypothetical spread of new delivery vehicle purchase and deployment, and replacement of existing delivery vehicles, developed for the purpose of the EIS analyses. The actual purchase plan and timing would be based on operational needs.
Table D-1 Hypothetical Purchase/Deployment and Replacement of High-Maintenance and End-of-Life Delivery Vehicles Over a Ten-Year Period1
Year Number of Vehicles Added1
Number of LLVs Replaced1
Number of FFVs Replaced1
Number of COTS Replaced1
Year 1 2,379 2,379 -- --
Year 2 7,250 7,250 -- --
Year 3 15,900 15,900 -- --
Year 4 20,000 20,000 -- --
Year 5 20,000 20,000 -- -- Year 6 20,000 20,000 -- --
Year 7 20,000 20,000 -- --
Year 8 20,000 20,000 -- --
Year 9 20,000 459 19,541 --
Year 10 19,471 -- 1,529 17,942
Total 165,000 125,988 21,070 17,942 1 For analytical purposes. The actual purchase plan and timing will be based on operational needs LLV – Long-Life vehicle (hypothetically, 125,988, or 76% of replaced vehicles would be LLVs) FFV – Flexible Fuel vehicle (hypothetically, 21,070, or 12.8% of replaced vehicles would be FFVs) COTS – Metris (hypothetically, 17,942, or 10.9% of replaced vehicles would be Metris)

United States Postal Service Draft Environmental Impact Statement - Appendix E Environmental Compliance and Risk Management
E-1 August 2021
APPENDIX E
NOISE BACKGROUND INFORMATION
Sound and Human Perception of Noise - Background Information
Table E-1 Subjective Responses to Changes in A-Weighted Decibels
Figure E-1 A-Weighted Sound Levels from Typical Sources
Comparison of Noise from BEVs and ICE Vehicles
Appendix E References

United States Postal Service Draft Environmental Impact Statement - Appendix E Environmental Compliance and Risk Management
E-2 August 2021
Sound and Human Perception of Noise - Background Information
Sound is a physical phenomenon consisting of vibrations that travel through a medium, such as air, and are sensed by the human ear. The perception and evaluation of sound involves three basic physical characteristics:
▪ Intensity – the acoustic energy, which is expressed in terms of sound pressure, in decibels (dB),
▪ Frequency – the number of cycles per second the air vibrates, in Hertz (Hz), and
▪ Duration – the length of time the sound presents.
The dB is a logarithmic unit used to that represents the intensity of a sound, also referred to as the sound level. All sounds have a spectral content, which means their magnitude or level changes with frequency. Environmental noise measurements are usually expressed on an “A-weighted” scale that filters out very low and very high frequencies in order to replicate human sensitivity. According to EPA (1974), changes in hearing level of less than 5 dBA generally are not considered noticeable to the human ear. There is no known evidence that a noise change of 5 dBA has any practical significance for the individual affected.
Table E-1 shows how humans perceive changes in the loudness of noise, and Figure E-1 shows A-weighted sound levels from typical noise sources. Changes in hearing level of less than 5 dBA generally are not considered noticeable (EPA 1974).
Table E-1
Subjective Responses to Changes in A-Weighted Decibels
Loudness Change
Perceived Loudness
3 dB Barely perceptible
5 dB Quite noticeable
10 dB Dramatic
20 dB Striking
Figure E-1 shows A-weighted sound levels from typical sound sources.

United States Postal Service Draft Environmental Impact Statement - Appendix E Environmental Compliance and Risk Management
E-3 August 2021
Figure E-1 A-Weighted Sound Levels from Typical Sources
Comparison of Noise from BEVs and ICE Vehicles
The Danish Road Directorate (2015) compared noise between BEVs and ICE vehicles for two comparably-equipped cargo vans and two comparably-equipped passenger cars under simulated urban driving conditions. BEVs were 4 to 5 dB less noisy than their ICE counterparts at low speed (6 to 12 miles per hour (mph [10 to 20 kilometers per hour (km/h)]) when driving steady. The difference in emitted noise from the two drivetrains was not significant at approximately 19 mph (30 km/h) when tire/road noise became dominant.

United States Postal Service Draft Environmental Impact Statement - Appendix E Environmental Compliance and Risk Management
E-4 August 2021
Appendix E References
Cowan, James P. 1994. Handbook of Environmental Acoustics.
Danish Road Directorate. 2015. Noise from Electric Vehicles – Measurements. March 25, 2015. Available on the internet at https://www.vejdirektoratet.dk/api/drupal/sites/default/files/publications/noise_from_electric_vehicles_0.pdf. Accessed June 2021.
EPA (United States Environmental Protection Agency). 1974. Information on Levels of Environmental
Noise Requisite to Protect Public Health and Welfare with an Adequate Margin of Safety. March 1974.

United States Postal Service Draft Environmental Impact Statement - Appendix F Environmental Compliance and Risk Management
F-1 August 2021
APPENDIX F
AIR QUALITY BACKGROUND INFORMATION AND CALCULATIONS
Tables and Background Information
National Ambient Air Quality Standards
General Conformity De Minimis Thresholds
Summary of Delivery Vehicle Acquisitions and Replacement of Aged Vehicles, and Annual Mileage Calculation
Vehicle Emission Factors from MOVES (gram/mile)
Indirect Emissions from Electricity Consumption by BEVs using eGRID
Indirect Emissions from Energy Consumption by ICE using GREET
Aggregated Direct and Indirect Net Emission Calculation
Social Cost of Carbon
Effects of Climate Change on Proposed Action and Alternatives 1.1 and 1.2
Appendix F References

United States Postal Service Draft Environmental Impact Statement - Appendix F Environmental Compliance and Risk Management
F-2 August 2021
National Ambient Air Quality Standards
The CAA specifies two sets of NAAQS – primary and secondary – for each of the criteria pollutants as applicable, as shown in Table F-1. Primary standards define levels of air quality necessary to protect public health, including the health of sensitive populations such as people with asthma, children, and the elderly. Secondary standards define levels of air quality necessary to protect public welfare (including protection against decreased visibility and damage to animals, crops, vegetation, and buildings). Standards have been established using average exposure times, based on the health and welfare effects of each pollutant.

United States Postal Service Draft Environmental Impact Statement - Appendix F Environmental Compliance and Risk Management
F-3 August 2021
Table F-1 National Ambient Air Quality Standards
Pollutant Average Time Federal Primary NAAQS
Federal Secondary NAAQS Violation Criteria
Carbon monoxide (CO) 8-hour average 9 ppm None If exceeded more than once per year
Carbon monoxide (CO) 1-hour average 35 ppm None If exceeded more than once per year
Lead (Pb) Rolling 3 month 0.15 µg/m3 Same as Primary
Standard If exceeded
Nitrogen dioxide (NO2) Annual average 0.053 ppm Same as Primary
Standard If exceeded 98th percentile, averaged over 3 years
Nitrogen dioxide (NO2) 1-hour average 0.10 ppm None If exceeded Annual Mean
Ozone (O3)(1)
8-hour average 0.070 ppm Same as Primary
Standard
If exceeded Annual fourth-highest daily maximum 8-hour
concentration, averaged over 3 years
Particulate matter (PM10) 24-hour average 150 µg/m3 Same as Primary
Standard
If exceeded more than once per year on average over
3 years
Particulate matter (PM2.5) Annual arithmetic
mean 12 µg/m3 15 µg/m3
If exceeded based on 3-year average on annual mean
concentration
Particulate matter (PM2.5) 24-hour 35 µg/m3 Same as Primary
Standard
If exceeded based on 3-year average of the 98th
percentile of 24-hour concentrations
Sulfur dioxide (SO2) (2)
3-hour average No standard 0.5 ppm If exceeded on 3-year average of 99th percentile of 1-hour
daily maximum concentrations
Sulfur dioxide (SO2) (2)
1-hour average 0.075 ppm No standard If exceeded more than once per year
µg/m3 = micrograms per cubic meter NAAQS = National Ambient Air Quality Standards PM10 = particulate matter less than 10 micrometers PM2.5 = particulate matter less than 2.5 micrometers ppm = parts per million Notes:
(1) Final rule signed October 1, 2015, and effective December 28, 2015. The previous (2008) O3 standards additionally remain in effect in some areas. Also,
some areas may have certain continuing implementation obligations under the prior revoked 1-hour (1979) and 8-hour (1997) O3 standards.
(2) The previous SO2 standards (0.14 ppm 24-hour and 0.03 ppm annual) will additionally remain in effect in certain areas: (1) any area for which it is not yet one
year since the effective date of designation under the current (2010) standards, and (2) any area for which an implementation plan providing for attainment of
the current (2010) standard has not been submitted and approved and which is designated nonattainment under the previous SO2 standards or is not
meeting the requirements of a SIP call under the previous SO2 standards (40 CFR 50.4(3)).
Source: EPA (2021b) online at: https://www.epa.gov/criteria-air-pollutants/naaqs-table

United States Postal Service Draft Environmental Impact Statement - Appendix F Environmental Compliance and Risk Management
F-4 August 2021
Table F-2
General Conformity De Minimis Thresholds
Criteria Pollutant Designation Classification De Minimis Threshold (tpy)
Ozone (VOC or NOx) Serious nonattainment 50
Ozone (VOC or NOx) Severe nonattainment 25
Ozone (VOC or NOx) Extreme nonattainment 10
Ozone (VOC or NOx) Other areas outside an ozone transport region 100
Ozone (NOx) Marginal and moderate nonattainment inside an ozone transport region 100
Ozone (NOx) Maintenance 100
Ozone (VOC) Marginal and moderate nonattainment inside an ozone transport region 50
Ozone (VOC) Maintenance within an ozone transport region 50
Ozone (VOC) Maintenance outside an ozone transport region 100
CO, SO2 and NO2 All nonattainment & maintenance 100
PM10 Serious nonattainment 70
PM10 Moderate nonattainment and maintenance 100
PM2.5 Direct Emissions for nonattainment and maintenance 100
PM2.5 SO2 for nonattainment and maintenance 100
PM2.5 NOx (unless determined not to be a significant precursor) for nonattainment and maintenance 100
PM2.5 VOC or ammonia (if determined to be significant precursors) for nonattainment 25
PM2.5 VOC or ammonia (if determined to be significant precursors) for maintenance 100
Lead All nonattainment area 25
tpy: tons per year CO: Carbon monoxide SO2: Sulfur dioxide NO2: Nitrogen dioxide NOx: Nitrogen oxide VOC: Volatile organic compound PM: Particulate Matter Source: EPA (2021c) online at: https://www.epa.gov/general-conformity/de-minimis-tables

United States Postal Service Draft Environmental Impact Statement - Appendix F Environmental Compliance and Risk Management
F-5 August 2021
F-3 Summary of Vehicle Acquisitions and Replacement of Aged Vehicles, and Annual Mileage Calculation
Table F-3.a New Vehicles – ICE NGDV or Alternative 1.1 COTS ICE Vehicles - Emissions (tons per year)
Model Year
Number of Vehicles
Total Annual Mileage for All Vehicles VOC NOX CO PM2.5 PM10 SO2 CO2e
▪ 2023 ▪ 2,379 ▪ 15,123,541 0.24 0.44 12.44 0.20 1.24 0.03 5,382
▪ 2024 ▪ 7,250 ▪ 46,088,975 0.60 0.91 32.30 0.60 3.77 0.10 15,690
▪ 2025 ▪ 15,900 ▪ 101,077,890 1.25 1.57 64.99 1.32 8.27 0.21 32,990
▪ 2026 ▪ 20,000 ▪ 127,142,000 1.39 1.65 70.34 1.63 10.36 0.26 41,498
▪ 2027 ▪ 20,000 ▪ 127,142,000 1.39 1.65 70.35 1.63 10.36 0.26 41,501
▪ 2028 ▪ 20,000 ▪ 127,142,000 1.14 1.08 37.57 1.51 10.24 0.26 41,525
▪ 2029 ▪ 20,000 ▪ 127,142,000 1.15 1.14 40.13 1.51 10.24 0.26 41,531
▪ 2030 ▪ 20,000 ▪ 127,142,000 1.18 1.14 40.14 1.51 10.24 0.26 41,537
▪ 2031 ▪ 20,000 ▪ 127,142,000 1.18 1.14 40.15 1.51 10.24 0.26 41,539
▪ 2032 ▪ 19,471 ▪ 123,779,094 1.15 1.11 39.08 1.47 9.97 0.26 40,440
▪ Total ▪ 165,000 ▪ 1,048,921,500 10.67 11.83 447.49 12.89 84.92 2.19 343,633
(311,739 MT)
Notes: (1) The above represents a hypothetical spread of vehicles to be replaced per year, used only for the purpose of this EIS evaluation. (2) This table shows the emissions from 165,000 ICE vehicles, consisting of 100% ICE NGDV or 100% COTS ICE vehicles.
Table F-3.b shows emissions from 165,000 BEVs (either NGDV or COTS). To calculate the emissions for the Proposed Action Hypothetical Scenario involving 90% ICE NGDV and 10% BEV NGDV, 90% of the emissions from the Table F-3.a were calculated to establish the estimated emissions from 90% ICE NGDV, and 10% of the emissions from Table F-3.b were calculated to establish the estimated emissions from 10% BEV NGDV. For the Alternative 1.1 scenario, 100% of the emissions from Table F-3.a were calculated to establish the estimated emissions from 165,000 COTS ICE vehicles.
(3) ICE NGDV: Gross Vehicle Weight Rating (GVWR) 8,501 pounds (4) Alternative 1.1 COTS Vehicle: GVWR ranges from 6,393 lbs (Metris) – 8,550 lbs (ProMaster) (5) The new NGDV model-years are 2023-2032 assuming that the vehicle years of manufacture are the same as the vehicle deployment years. Based on EPA’s
MOVES model, the 165,000 NGDV are categorized as “light commercial truck” for the emissions calculations. (6) Since both ICE NGDV and Alternative 1.1 COTS ICE vehicles are categorized as the same “light commercial truck” vehicle type in the MOVES model, the
emission rates calculated in Table F-3.a. were utilized for the emissions analyses for both vehicle types. (7) The Postal Service has estimated the average miles traveled per each new delivery vehicle to be 6,357 miles per year based on 21.05 miles per day of average
travel route per vehicle (this represents an average across all city and rural routes currently using Postal Service Vehicles) and 302 working days per year. The estimated number of miles travelled annually by 165,000 new delivery vehicles on a nationwide basis is 1,048,921,500 miles per year.
(8) The emission factors derived from the MOVES model are based on an urban unrestricted road type in Westchester County, New York, and an average vehicle speed of 25 mph. Westchester County, New York was selected to be consistent with the Postal Service's 2017 Programmatic Environmental Assessment (e.g., area with the greatest number of highest maintenance-cost LLVs replacement).

United States Postal Service Draft Environmental Impact Statement - Appendix F Environmental Compliance and Risk Management
F-6 August 2021
(9) Although EPA recently released MOVES3 in January 2021 and continues to update this new model with the most recent release of MOVES3.01 in March 2021, the states are still testing and developing inputs in adopting this new model version within the two-year grace period. Therefore, MOVES2014b, an earlier version that is still valid for use, was used to estimate vehicular emission factors for this EIS.

United States Postal Service Draft Environmental Impact Statement - Appendix F Environmental Compliance and Risk Management
F-7 August 2021
Table F-3.b New Vehicles – BEV NGDV or Alternative 1.2 COTS BEV - Emissions (tons per year)
Model Year Number of Vehicles
Total Annual Mileage for All Vehicles VOC NOX CO PM2.5 PM10 SO2 CO2e
▪ 2023 ▪ 2,379 ▪ 15,123,541 - - - 0.15 1.19 - -
▪ 2024 ▪ 7,250 ▪ 46,088,975 - - - 0.47 3.62 - -
▪ 2025 ▪ 15,900 ▪ 101,077,890 - - - 1.03 7.94 - -
▪ 2026 ▪ 20,000 ▪ 127,142,000 - - - 1.29 9.99 - -
▪ 2027 ▪ 20,000 ▪ 127,142,000 - - - 1.29 9.99 - -
▪ 2028 ▪ 20,000 ▪ 127,142,000 - - - 1.29 9.99 - -
▪ 2029 ▪ 20,000 ▪ 127,142,000 - - - 1.29 9.99 - -
▪ 2030 ▪ 20,000 ▪ 127,142,000 - - - 1.29 9.99 - -
▪ 2031 ▪ 20,000 ▪ 127,142,000 - - - 1.29 9.99 - -
▪ 2032 ▪ 19,471 ▪ 123,779,094 - - - 1.26 9.72 - -
▪ Total ▪ 165,000 ▪ 1,048,921,500 - - - 10.65 82.38 - -
Notes: (1) The above represents a hypothetical spread of vehicles to be replaced per year, used only for the purpose of this EIS evaluation. (2) The table shows the emissions from 165,000 BEVs, consisting of either BEV NGDV or COTS BEV.
Therefore, to calculate the emissions for the Proposed Action Hypothetical Maximum consisting of 90% ICE NGDV and 10% BEV NGDV, in Table F-3.c, 10% of the emissions from Table F-3.b were calculated to establish the estimated emissions from 10% of BEV NGDV. For the Proposed Action Hypothetical Maximum consisting of 100% BEV, 100% of the emissions from this table were calculated to establish the estimated emissions from 165,000 BEV NGDV. For Alternative 1.2, 100% of the emissions from this table were calculated to establish the estimated emissions from 165,000 COTS BEVs.
(3) BEVs have no tailpipe or evaporative emissions and the brake and tire wear emissions are identical to conventional vehicles. Therefore, only particulate matter emissions associated with brake and tire wear result from BEV operation.
(4) BEV NGDV: GVWR 8,877 pounds (5) Alternative 1.1 COTS BEV: GVWR 9,428 lbs (6) The new NGDV model-years used in the analysis are 2023-2032 assuming that the vehicle years of manufacture are the same as the assumed vehicle
deployment years. Based on EPA’s MOVES model, the NGDV are categorized as “light commercial truck.” (7) Since both BEV NGDV and Alternative 1.2's COTS BEV are categorized as the same “light commercial truck” vehicle type in the MOVES model, the data in
Table F-3.b. were utilized for the emissions analyses for both vehicle types. (8) The Postal Service has estimated the average miles traveled annually per each new delivery vehicle to be 6,357 miles per year based on 21.05 miles per day of
average travel route per vehicle and 302 working day per year. The estimated number of miles travelled annually by 165,000 new delivery vehicles on a nationwide basis is 1,048,921,500 miles per year.
(9) The emission factors were estimated based on an urban unrestricted road type in Westchester County, New York, and 25 mph of vehicle speed. (10) Although EPA recently released MOVES3 in January 2021 and continues to update this new model with the most recent release of MOVES3.01 in March 2021,
the states are still testing and developing inputs in adopting this new model version within the two-year grace period. Therefore, MOVES2014b, an earlier version that is still valid for use, was used to estimate vehicular emission factors for this EIS.

United States Postal Service Draft Environmental Impact Statement - Appendix F Environmental Compliance and Risk Management
F-8 August 2021
Table F-3.c Summary of Emissions from New Vehicles for All Proposed Scenarios - Emissions (tons per year)
Alternative VOC NOX CO PM2.5 PM10 SO2 CO2e
Proposed Action New vehicles: hypothetical maximum 165,000 vehicles consisting of 90% ICE NGDV + 10% BEV NGDV 9.60 10.65 402.74 12.67 84.67 1.97
309,270
(280,565 MT)
Proposed Action New vehicles: hypothetical maximum 165,000 BEV NGDV - - - 10.65 82.38 - -
Alternative 1.1 New vehicles: maximum 165,000 COTS ICE vehicles 10.67 11.83 447.49 12.89 84.92 2.19
343,633
(311,739 MT)
Alternative 1.2 New vehicles: maximum 165,000 COTS BEVs - - - 10.65 82.38 - -
MT = metric tons
Table F-3.d
Summary of Emissions from Existing Vehicles for No-Action Scenario - Emissions (tons per year)
Alternative VOC NOX CO PM2.5 PM10 SO2 CO2e
No-Action Alternative 165,000 existing LLVs/FFVs/Metris 935.99 2,264.31 11,496 59.14 136.72 3.72
592,398 (537,415 MT)
MT = metric tons Notes:
(1) The above represents emissions from existing vehicles for No Action scenario. This also represents the vehicles to be replaced when the emissions are represented as negative values (emission decrease for vehicle removal) when the net emissions are calculated for all Proposed Actions and Alternatives scenarios.
(2) The detailed emission calculation for the existing LLVs/FFVs/Metris are shown in Tables F-3.f, F-3.g, and F-3.h.

United States Postal Service Draft Environmental Impact Statement - Appendix F Environmental Compliance and Risk Management
F-9 August 2021
Table F-3.e Summary of Net Emission Changes of Direct Emissions for All Proposed Scenarios Calculated Based on MOVES Model - Emissions (tons per year)
Alternative VOC NOX CO PM2.5 PM10 SO2 CO2e
Proposed Action New vehicles: hypothetical maximum 165,000 vehicles consisting of 90% ICE NGDV + 10% BEV NGDV
Replaced vehicles: 165,000 existing LLVs/FFVs/Metris
-926.39 -2,253.67 -11,093 -46.47 -52.06 -1.75 -256,850 MT
Proposed Action New vehicles: hypothetical maximum 165,000 BEV NGDV
Replaced vehicles: 165,000 existing LLVs/FFVs/Metris
-935.99 -2,264.31 -11,496 -48.49 -54.34 -3.72 -537,415 MT
Alternative 1.1 New vehicles: maximum 165,000 COTS ICE vehicles
Replaced vehicles: 165,000 existing LLVs/FFVs/Metris
-925.32 -2,252.48 -11,048 -46.25 -51.80 -1.54 -225,676 MT
Alternative 1.2 New vehicles: maximum 165,000 COTS BEVs
Replaced vehicles: 165,000 existing LLVs/FFVs/Metris
-935.99 -2,264.31 -11,496 -48.49 -54.34 -3.72 -537,415 MT
No-Action Alternative
165,000 existing LLVs/FFVs/Metris 935.99 2,264.31 11,496 59.14 136.72 3.72 537,415 MT
MT = metric tons

United States Postal Service Draft Environmental Impact Statement - Appendix F Environmental Compliance and Risk Management
F-10 August 2021
Table F-3.f Aged LLVs (Model Years 1987 - 1994) to be Replaced
Year
Number of Vehicles Replaced
Total Annual Mileage for All Vehicles Replaced (reduction)
▪ 2023 ▪ -2,379 ▪ -15,123,541
▪ 2024 ▪ -7,250 ▪ -46,088,975
▪ 2025 ▪ -15,900 ▪ -101,077,890
▪ 2026 ▪ -20,000 ▪ -127,142,000
▪ 2027 ▪ -20,000 ▪ -127,142,000
▪ 2028 ▪ -20,000 ▪ -127,142,000
▪ 2029 ▪ -20,000 ▪ -127,142,000
▪ 2030 ▪ -20,000 ▪ -127,142,000
▪ 2031 ▪ -459 ▪ -2,917,909
▪ Total ▪ -125,988 ▪ -800,918,315
Notes: (1) The above represents a hypothetical spread of vehicles to be replaced per year, used only for the purpose of this EIS evaluation.
Aged LLVs (Model Years 1987 - 1994) to be Replaced - Emissions (tons per year)
VOC NOX CO PM2.5 PM10 SO2 CO2e
-900.87 -2,167.60 -10,439 -51.69 -111.73 -2.90 -462,511
(-419,583 MT)
Notes: (1) The table shows the emissions generated from the currently operated aged LLV vehicles to be replaced, which were considered as negative values (as emission
decreases) in the net emission calculation for all proposed scenarios. (2) Aged LLVs: GVWR 4,450 pounds (3) Based on EPA’s MOVES model, the estimated 125,988 aged LLVs were categorized as “passenger truck” using model-years of 1987-1994 (equivalent to
vehicle years of manufacture). The worst-case (minimum value) emission factors among all modeled years (as shown in Table F-4.c) were used to calculate conservatively the net emission changes, since the minimum value emission factor for the aged LLVs represents the minimum emission decrease.
(4) Since the new delivery vehicles would be deployed on a one-to-one replacement basis, the average miles traveled annually for each vehicle would be the same. The Postal Service has estimated the average miles traveled per each vehicle to be 6,357 miles per year based on 21.05 miles per day of average travel route per vehicle and 302 working days per year. The estimated number of miles travelled annually by 125,988 LLVs on a nationwide basis is 800,918,315 miles per year.
(5) The emission factors were estimated based on an urban unrestricted road type in Westchester County, New York, and 25 mph of vehicle speed.

United States Postal Service Draft Environmental Impact Statement - Appendix F Environmental Compliance and Risk Management
F-11 August 2021
Table F-3.g Aged FFVs (Model Years 2000 - 2001) to be Replaced
Year
Number of Vehicles Replaced
Total Annual Mileage for All Vehicles Replaced (reduction)
▪ 2031 ▪ -19,541 ▪ -124,224,091
▪ 2032 ▪ -1,529 ▪ -9,720,006
▪ Total ▪ -21,070 ▪ -133,944,097
Notes: (1) The above represents a hypothetical spread of vehicles to be replaced per year, used only for the purpose of this EIS evaluation.
Aged FFVs (Model Years 2000 - 2001) to be Replaced - Emissions (tons per year)
VOC NOX CO PM2.5 PM10 SO2 CO2e
-33.90 -94.21 -1,003.70 -6.09 -15.79 -0.54 -85,378
(-77,454 MT)
Notes: (1) The table shows the emissions from the currently operated aged FFV vehicles to be replaced, which were considered as negative values (as emission
decreases) in the net emission calculation for all proposed scenarios. (2) Aged FFV: GVWR 5,100 pounds (3) Based on EPA’s MOVES model, the estimated 21,070 aged FFVs were categorized as “passenger truck,” using the model-years of 2000-2001 (equivalent to
vehicle years of manufacture). The worst-case (minimum value) emission factors out of all modeled years (as shown in Table F-4.d) were used to calculate conservatively the net emission changes, since the minimum value emission factor for the aged FFVs represents the minimum emission decrease.
(4) Since the new vehicles would be deployed on a one-to-one replacement basis, the average miles traveled annually for each vehicle would be the same. The Postal Service has estimated the average miles traveled per each vehicle to be 6,357 miles per year based on 21.05 miles per day of average travel route per vehicle and 302 working days per year. The estimated number of miles traveled annually by 21,070 FFVs on a nationwide basis is 133,944,097 miles per year.
(5) The emission factors were estimated based on an urban unrestricted road type in Westchester County, New York, and 25 mph of vehicle speed.

United States Postal Service Draft Environmental Impact Statement - Appendix F Environmental Compliance and Risk Management
F-12 August 2021
Table F-3.h Aged Metris (Model Years 2020 - 2022) to be Replaced - Emissions (tons per year)
Year
Number of Vehicles Replaced
Total Annual Mileage for All Vehicles Replaced (reduction) Model Year VOC NOX CO PM2.5 PM10 SO2 CO2e
▪ 2032 ▪ -5,980 ▪ -38,019,696 2020 -0.43 -1.01 -19.73 -0.46 -3.07 -0.10 -15,613
▪ 2032 ▪ -5,980 ▪ -38,019,696 2021 -0.42 -0.83 -17.71 -0.45 -3.06 -0.09 -14,752
▪ 2032 ▪ -5,980 ▪ -38,019,696 2022 -0.38 -0.66 -15.62 -0.45 -3.06 -0.09 -14,144
▪ Total ▪ -17,942 ▪ -114,059,088 Total -1.23 -2.50 -53.06 -1.37 -9.20 -0.28 -44,509
(-40,378 MT)
Notes: (1) The above represents a hypothetical spread of vehicles to be replaced per year, used only for the purpose of this EIS evaluation. (2) The table shows the emissions from the current Metris vehicles to be replaced, which were considered as negative values (as emission decrease) in the net
emission calculation for all proposed scenarios. (3) Aged Metris: GVWR 6,614 pounds (4) Based on EPA’s MOVES model, the estimated 17,942 Metris were categorized as “light commercial truck,” using the model-years of 2020-2022 (equivalent to
vehicle years of manufacture). (5) Since the new vehicles would be deployed on a one-to-one replacement basis, the average miles traveled annually for each vehicle would be the same. The
Postal Service has estimated the average miles traveled per each vehicle to be 6,357 miles per year based on 21.05 miles per day. The estimated number of miles travelled annually by 17,942 Metris on a nationwide basis is 114,059,088 miles per year.
(6) The emission factors were estimated based on an urban unrestricted road type in Westchester County, New York, and 25 mph of vehicle speed.

United States Postal Service Draft Environmental Impact Statement - Appendix F Environmental Compliance and Risk Management
F-13 August 2021
Table F-3.i Summary of Net Aggregated (Direct and Indirect) Emission Changes (tons per year) for All Proposed Scenarios Calculated Based on MOVES, eGRID, and GREET Models
Alternative VOC NOX CO PM2.5 PM10 SO2 CO2e
Proposed Action New vehicles: hypothetical maximum 165,000 vehicles consisting of 90% ICE NGDV + 10% BEV NGDV
Replaced vehicles: 165,000 existing LLVs/FFVs/ Metris NA -2,343 NA -51 NA -55 -290,306
Proposed Action New vehicles: hypothetical maximum 165,000 BEV NGDV
Replaced vehicles: 165,000 existing LLVs/FFVs/ Metris NA -3,158 NA -92 NA -534.01 -865,213
Alternative 1.1 New vehicles: maximum 165,000 COTS ICE vehicles
Replaced vehicles: 165,000 existing LLVs/FFVs/ Metris -925 -2,252 -11,048 -46 -52 -1.54 -226,427
Alternative 1.2 New vehicles: maximum 165,000 COTS BEVs
Replaced vehicles: 165,000 existing LLVs/FFVs/ Metris NA -3,380 NA -117 NA -739.01 -1,116,730
No Action Alternative 1,903 3,570 12,081 148 378 915.03 1,332,698
MT = metric tons Notes:
(1) NA = not available, as eGRID does not provide VOC, CO, and PM10 emissions factor data for the upstream sources. Therefore, the aggregated net emissions for VOC, CO and PM10 were not calculated.

United States Postal Service Draft Environmental Impact Statement - Appendix F Environmental Compliance and Risk Management
F-14 August 2021
Vehicle Emission Factors from MOVES (gram/mile)
Table F-4.a New Vehicles – ICE NGDV or Alternative 1.1 RHD COTS ICE Vehicles – Light Commercial Truck Emission Factor (gram/mile)
Model Year VOC NOX CO PM2.5 PM10 SO2 CO2e
2023 0.014 0.027 0.746 0.012 0.074 0.002 322.835
2024 0.012 0.018 0.636 0.012 0.074 0.002 308.826
2025 0.011 0.014 0.583 0.012 0.074 0.002 296.087
2026 0.010 0.012 0.502 0.012 0.074 0.002 296.096
2027 0.010 0.012 0.502 0.012 0.074 0.002 296.122
2028 0.008 0.008 0.268 0.011 0.073 0.002 296.288
2029 0.008 0.008 0.286 0.011 0.073 0.002 296.334
2030 0.008 0.008 0.286 0.011 0.073 0.002 296.377
2031 0.008 0.008 0.286 0.011 0.073 0.002 296.390
2032 0.008 0.008 0.286 0.011 0.073 0.002 296.390
Note: Emission factors selected based on the following assumptions: (1) Fuel-Gasoline, (2) Urban Road Type - Urban Unrestricted/Arterial/Collector/Local (Westchester County, New York), (3) Vehicle Speed - 25 mph, (4) Weekday travel, (5) Winter months for CO, PM2.5 , PM10 and SO2, (6) Summer months for VOC, NOx, and CO2
Table F-4.b New Vehicles – BEV NGDV or Alternative 1.2 LHD COTS BEV – Light Commercial Truck Emission Factor (gram/mile)
Note: The emission factors were selected based on the following assumption: Winter months for PM2.5 and PM10 tire and brake wear
Model Year PM2.5 PM10
2023 0.009 0.071
2024 0.009 0.071
2025 0.009 0.071
2026 0.009 0.071
2027 0.009 0.071
2028 0.009 0.071
2029 0.009 0.071
2030 0.009 0.071
2031 0.009 0.071

United States Postal Service Draft Environmental Impact Statement - Appendix F Environmental Compliance and Risk Management
F-15 August 2021
Table F-4.c Existing 125,988 Aged LLV Vehicles – Passenger Truck Emission Factor (gram/mile)
Model Year VOC NOX CO PM2.5 PM10 SO2 CO2e
1987 1.255 2.455 17.443 0.141 0.219 0.011 594.710
1988 1.257 2.465 17.442 0.121 0.198 0.011 584.481
1989 1.264 2.489 17.445 0.122 0.198 0.010 555.241
1990 1.020 2.685 12.173 0.089 0.161 0.004 558.496
1991 1.026 2.688 12.232 0.088 0.160 0.003 523.878
1992 1.027 2.698 12.234 0.088 0.160 0.003 524.101
1993 1.035 2.707 12.315 0.089 0.161 0.003 529.892
1994 1.090 2.538 11.824 0.059 0.127 0.003 533.522
Worst-Case (minimum value) 1.020 2.455 11.824 0.059 0.127 0.003 523.878
Table F-4.d Existing 21,070 Aged FFV Vehicles – Passenger Truck Emission Factor (gram/mile)
Make Year VOC NOX CO PM2.5 PM10 SO2 CO2e
2000 0.602 1.521 8.163 0.052 0.120 0.004 578.253
2001 0.230 0.638 6.798 0.041 0.107 0.004 590.263
Worst-Case (minimum value) 0.230 0.638 6.798 0.041 0.107 0.004 578.253
Table F-4.e Existing 17,942 Metris Vehicles – Light Commercial Truck Emission Factor (gram/mile)
Make Year VOC NOX CO PM2.5 PM10 SO2 CO2e
2020 0.010 0.024 0.471 0.011 0.073 0.002 372.540
2021 0.010 0.020 0.422 0.011 0.073 0.002 352.001
2022 0.009 0.016 0.373 0.011 0.073 0.002 337.486

United States Postal Service Draft Environmental Impact Statement - Appendix F Environmental Compliance and Risk Management
F-16 August 2021
Indirect Emission from Energy Consumption by BEVs using eGRID
The electricity purchases (e.g., indirect GHG emissions and non-greenhouse gas emissions from energy consumption by BEVs) were evaluated using EPA’s Emissions & Generation Resource Integrated Database (eGRID) data (2021d). EPA’s Clean Air Markets Division published eGRID to provide the public with a comprehensive inventory of air emissions from the U.S. electric power sector. The eGRID includes operating data and a detailed emissions profile of CO2, CH4, NOx, N2O, PM2.5, SO2, and CO2e expressed as the pounds of emissions per megawatt-hour (lb/MWh) electricity generated. While the eGRID data are aggregated to calculate various geographic levels, the national-level output emission data from eGRID were used since the Proposed Action scenarios and Alternative 1.2 are nationwide. The analyses used the latest version of eGRID (eGRID2019) released in February 2021.
The indirect emissions related to electricity purchases associated with the Proposed Action and Alternative scenarios that included purchase and deployment of BEVs would depend largely on the amount of electricity purchased for the BEVs. Therefore, the potential annual electricity purchase associated with the proposed BEVs was calculated based on the following information: the number of BEVs, the number of BEV charging events per year, the electricity purchase per one fully charging event, and the emission factors per electricity consumed derived from eGRID. The analyses did not consider electricity transmission and distribution losses associated with electricity purchases.
The eGRID data represents the energy from both fuel and operation since the fuel is burned at the power plant to generate the total energy needed for vehicle operations (the stored energy is used in operation). The remaining operational emissions are brake and tire wear calculated from the MOVES model. Therefore, the Postal Service calculated the total aggregated direct and indirect emissions for BEVs by combining the emissions from MOVES and eGRID.
The following tables present detail calculations of indirect emissions using eGRID.

United States Postal Service Draft Environmental Impact Statement - Appendix F Environmental Compliance and Risk Management
F-17 August 2021
Table F-5.a Total Energy Consumption by Proposed BEV Scenarios
Proposed Scenarios
Maximum number of BEVs
Total Annual Mileage for All Vehicles (miles/year)
Max Range on Single Charge (miles)
Electricity Spent for a Single Charge (kWh)
No. of Charges per Year
Total Electricity Charged per year (MWh)
Proposed Action - Purchase and Deployment of up to 165,000 NGDV (90% ICE NGDV + 10% BEV NGDV) 16,500 104,892,150 70 94 1,498,460 140,855
Proposed Action - Purchase and Deployment of up to 165,000 NGDV (100% BEV NGDV) 165,000 1,048,921,500 70 94 14,984,593 1,408,552
Alternative 1.2 - Purchase and Deployment of up to 165,000 COTS Vehicles (100% COTS BEVs) 165,000 1,048,921,500 108 67 9,712,237 650,720
kWh = kilowatt hour MWh = megawatt hour

United States Postal Service Draft Environmental Impact Statement - Appendix F Environmental Compliance and Risk Management
F-18 August 2021
Table F-5.b Indirect Emissions from Energy Consumption by BEV using eGRID’s Nationwide Emission Profile Factors
Proposed Scenarios VOC
(tpy)
NOX
(tpy)
CO
(tpy)
PM2.5
(tpy)
PM10
(tpy)
SO2
(tpy)
CO2e
(MT)
Proposed Action -
Purchase and Deployment of up to 165,000 NGDV (90% ICE NGDV + 10% BEV NGDV)
NA 41 NA 5 NA 38 46,748
Proposed Action - Purchase and Deployment of up to 165,000 NGDV (100% BEV NGDV)
NA 413 NA 45 NA 381 467,485
Alternative 1.2 - Purchase and Deployment of up to 165,000 COTS Vehicles (100% COTS BEV)
NA 191 NA 21 NA 176 215,968
eGRID US Nationwide Emission Profile Factor VOC
(lb/MWh)
NOX
(lb/MWh)
CO
(lb/MWh)
PM2.5
(lb/MWh)
PM10
(lb/MWh)
SO2
(lb/MWh)
CO2e
(lb/MWh)
Nationwide eGRID Emission Profiles NA 0.586 NA 0.0643 NA 0.541 889.21
Notes:
(1) For Proposed Action Hypothetical Maximum, the emissions associated with the energy consumption for BEV NGDV were calculated based on the maximum mile on a single charge specific for BEV NGDV (70 miles per single charge), the battery size (94 kWh) assuming that the electricity spent for a single charge would be 100% of the battery size (as shown in Table 3-1.3), the number of charges per year (calculated based on the total miles per year divided by the maximum travel miles on a single charge), and the emission factor from eGRID.
(2) For Alternative 1.2, the emissions associated with the energy consumption for COTS BEV were calculated in the same way as for the BEV NGDV, but using a different specific basis for COTS BEV: 108 miles of travel mileage per single charge and 67 kWh of a battery size for a single charge (as shown in Table 3-2.2). The emissions associated with energy consumption for aged ICE were calculated based on the miles of travel for each year and the emission factor (kilograms per mile [kg/mi]) from the GREET model.
(3) Note: NA = not available, as eGRID does not provide VOC, CO, and PM10 emissions factor data for the upstream sources. Therefore, the aggregated net emissions for VOC, CO and PM10 were not calculated.

United States Postal Service Draft Environmental Impact Statement - Appendix F Environmental Compliance and Risk Management
F-19 August 2021
Indirect Emission from Energy Consumption by ICE using GREET
Comparably, the environmental footprint of fuel (gasoline) purchases (e.g. emissions from gasoline consumption by ICE vehicles) was evaluated using Argonne National Laboratory’s Greenhouse Gases, Emissions, and Energy use in Technologies (GREET) model. The GREET model can simulate the energy use and emissions output of various vehicle and fuel combinations. Indirect emissions associated with energy (e.g. gasoline) consumption for ICE vehicles were evaluated using GREET’s emission cycle associated with fuel, called Well-to-Pump (WTP), which represents the fuel cycle from well pad to fuel pump. The total aggregated direct and indirect emissions for ICE vehicles were calculated by combining the emissions from MOVES and GREET’s WTP.
The indirect emissions related to fuel (gasoline) purchases would depend largely on the miles traveled for the proposed ICE vehicles. Therefore, the potential annual gasoline purchase associated with the proposed ICE vehicles was calculated based on the number of ICE vehicles, the total miles traveled per vehicle per year, and the emission factors per mile traveled derived from the GREET model.
Detailed calculations of indirect emissions using the GREET model are presented on the following pages.
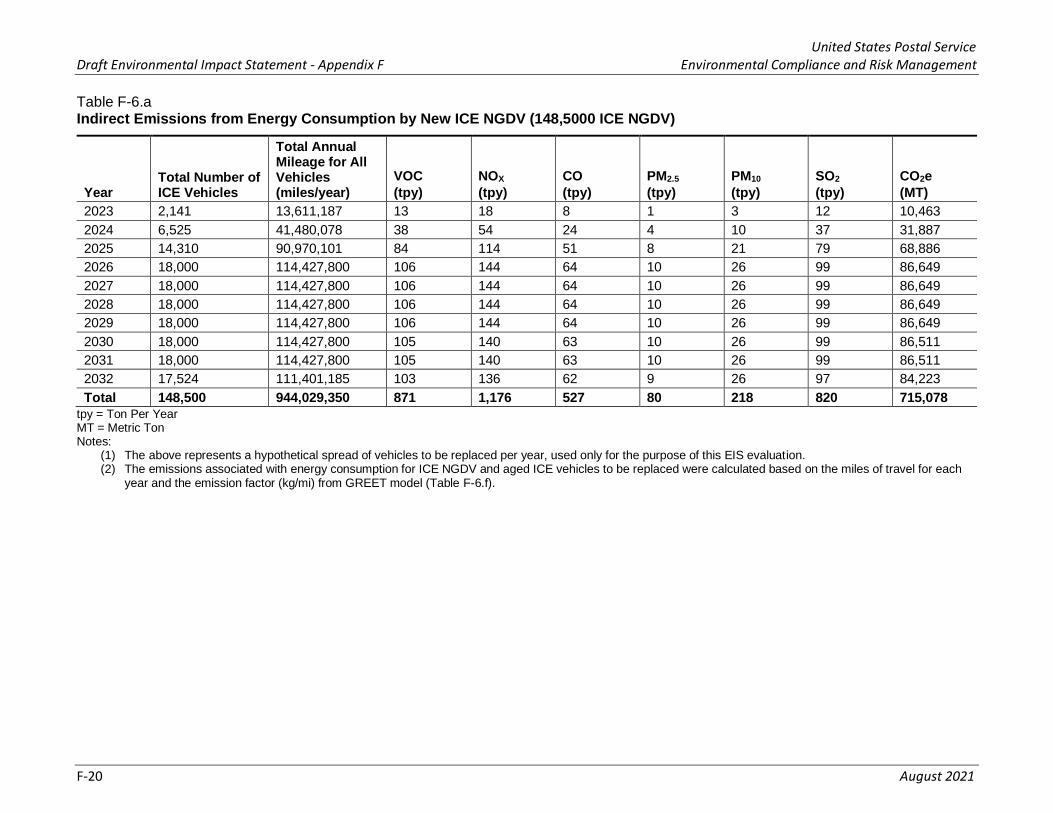
United States Postal Service Draft Environmental Impact Statement - Appendix F Environmental Compliance and Risk Management
F-20 August 2021
Table F-6.a Indirect Emissions from Energy Consumption by New ICE NGDV (148,5000 ICE NGDV)
Year Total Number of ICE Vehicles
Total Annual Mileage for All Vehicles (miles/year)
VOC
(tpy)
NOX
(tpy)
CO
(tpy)
PM2.5
(tpy)
PM10
(tpy)
SO2
(tpy)
CO2e
(MT)
2023 2,141 13,611,187 13 18 8 1 3 12 10,463
2024 6,525 41,480,078 38 54 24 4 10 37 31,887
2025 14,310 90,970,101 84 114 51 8 21 79 68,886
2026 18,000 114,427,800 106 144 64 10 26 99 86,649
2027 18,000 114,427,800 106 144 64 10 26 99 86,649
2028 18,000 114,427,800 106 144 64 10 26 99 86,649
2029 18,000 114,427,800 106 144 64 10 26 99 86,649
2030 18,000 114,427,800 105 140 63 10 26 99 86,511
2031 18,000 114,427,800 105 140 63 10 26 99 86,511
2032 17,524 111,401,185 103 136 62 9 26 97 84,223
Total 148,500 944,029,350 871 1,176 527 80 218 820 715,078
tpy = Ton Per Year MT = Metric Ton Notes:
(1) The above represents a hypothetical spread of vehicles to be replaced per year, used only for the purpose of this EIS evaluation. (2) The emissions associated with energy consumption for ICE NGDV and aged ICE vehicles to be replaced were calculated based on the miles of travel for each
year and the emission factor (kg/mi) from GREET model (Table F-6.f).
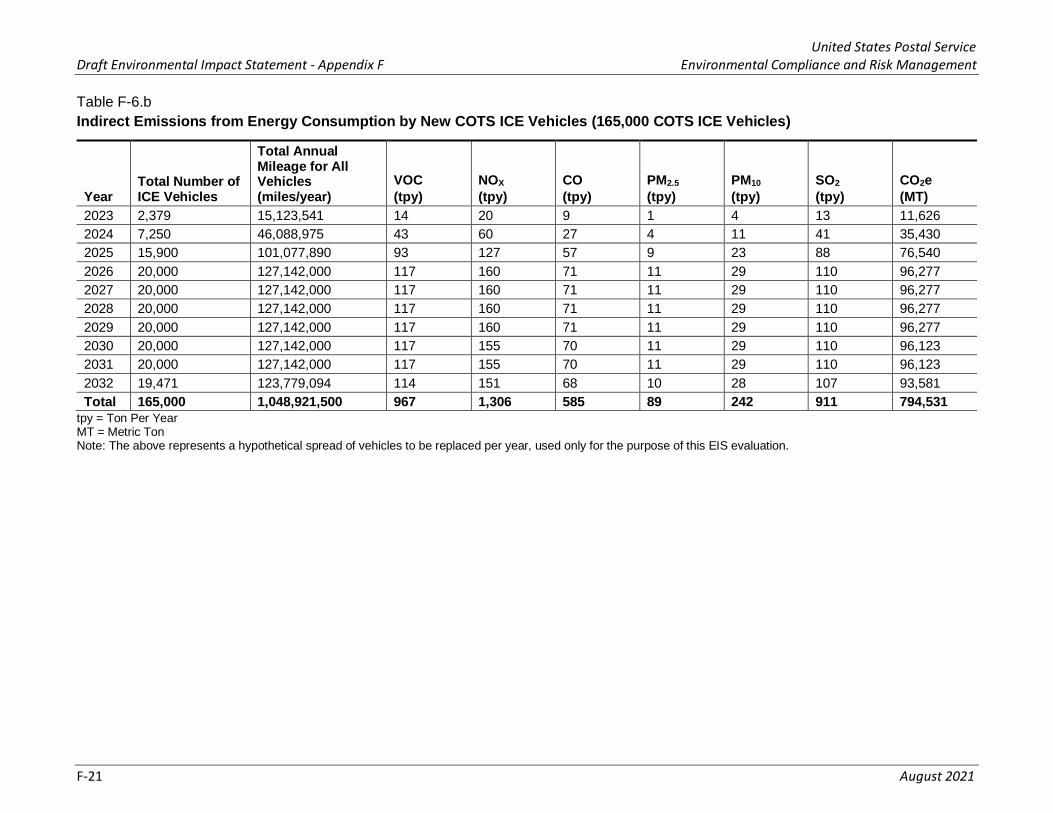
United States Postal Service Draft Environmental Impact Statement - Appendix F Environmental Compliance and Risk Management
F-21 August 2021
Table F-6.b
Indirect Emissions from Energy Consumption by New COTS ICE Vehicles (165,000 COTS ICE Vehicles)
Year Total Number of ICE Vehicles
Total Annual Mileage for All Vehicles (miles/year)
VOC
(tpy)
NOX
(tpy)
CO
(tpy)
PM2.5
(tpy)
PM10
(tpy)
SO2
(tpy)
CO2e
(MT)
2023 2,379 15,123,541 14 20 9 1 4 13 11,626
2024 7,250 46,088,975 43 60 27 4 11 41 35,430
2025 15,900 101,077,890 93 127 57 9 23 88 76,540
2026 20,000 127,142,000 117 160 71 11 29 110 96,277
2027 20,000 127,142,000 117 160 71 11 29 110 96,277
2028 20,000 127,142,000 117 160 71 11 29 110 96,277
2029 20,000 127,142,000 117 160 71 11 29 110 96,277
2030 20,000 127,142,000 117 155 70 11 29 110 96,123
2031 20,000 127,142,000 117 155 70 11 29 110 96,123
2032 19,471 123,779,094 114 151 68 10 28 107 93,581
Total 165,000 1,048,921,500 967 1,306 585 89 242 911 794,531
tpy = Ton Per Year MT = Metric Ton Note: The above represents a hypothetical spread of vehicles to be replaced per year, used only for the purpose of this EIS evaluation.

United States Postal Service Draft Environmental Impact Statement - Appendix F Environmental Compliance and Risk Management
F-22 August 2021
Table F-6.c Indirect Emissions Decreases from Energy Consumption by Existing ICE Vehicles (Aged LLV Being Replaced)
Year Total No. of ICE Vehicles
Total Annual Mileage for All Vehicles (miles/year)
VOC (tpy)
NOX (tpy)
CO (tpy)
PM2.5 (tpy)
PM10 (tpy)
SO2 (tpy)
CO2e (MT)
2023 -2,379 -15,123,541 -14 -20 -9 -1 -4 -13 -11,626
2024 -7,250 -46,088,975 -43 -60 -27 -4 -11 -41 -35,430
2025 -15,900 -101,077,890 -93 -127 -57 -9 -23 -88 -76,540
2026 -20,000 -127,142,000 -117 -160 -71 -11 -29 -110 -96,277
2027 -20,000 -127,142,000 -117 -160 -71 -11 -29 -110 -96,277
2028 -20,000 -127,142,000 -117 -160 -71 -11 -29 -110 -96,277
2029 -20,000 -127,142,000 -117 -160 -71 -11 -29 -110 -96,277
2030 -20,000 -127,142,000 -117 -155 -70 -11 -29 -110 -96,123
2031 -459 -2,917,909 -3 -4 -2 0 -1 -3 -2,206
2032 0 0 0 0 0 0 0 0 0
Total -125,988 -800,918,315 -739 -1,004 -448 -68 -185 -696 -607,033
tpy = Ton Per Year MT = Metric Ton Note: The above represents a hypothetical spread of vehicles to be replaced per year, used only for the purpose of this EIS evaluation.
Table F-6.d Indirect Emissions Decreases from Energy Consumption by Existing ICE Vehicles (Aged FFV Being Replaced)
Year
Total No. of ICE Vehicles
Total Annual Mileage for All Vehicles (miles/year)
VOC
(tpy)
NOX
(tpy)
CO
(tpy)
PM2.5
(tpy)
PM10
(tpy)
SO2
(tpy)
CO2e
(MT)
2031 -19,541 -124,224,091 -114 -152 -69 -10 -28 -108 -93,917
2032 -1,529 -9,720,006 -9 -12 -5 -1 -2 -8 -8,100
Total -21,070 -133,944,097 -123 -163 -74 -11 -31 -116 -102,018
tpy = Ton Per Year MT = Metric Ton Note: The above represents a hypothetical spread of vehicles to be replaced per year, used only for the purpose of this EIS evaluation.

United States Postal Service Draft Environmental Impact Statement - Appendix F Environmental Compliance and Risk Management
F-23 August 2021
Table F-6 Indirect Emissions Decreases from Energy Consumption by Existing ICE Vehicles (Aged Metris Being Replaced)
Year
Total No. of ICE Vehicles
Total Annual Mileage for All Vehicles (miles/year)
VOC
(tpy)
NOX
(tpy)
CO
(tpy)
PM2.5
(tpy)
PM10
(tpy)
SO2
(tpy)
CO2e
(MT)
2032 -17,942 -114,059,088 -105 -139 -63 -10 -26 -99 -86,232
Total -17,942 -114,059,088 -105 -139 -63 -10 -26 -99 -86,232
tpy = Ton Per Year MT = Metric Ton Note: The above represents a hypothetical spread of vehicles to be replaced per year, used only for the purpose of this EIS evaluation.
Table F-6.f GREET’s Nationwide Emission Profile - Emission Factors for Well-to-Pump (WTP) (kg/mi)
Pollutant / Year 2023 2024 2025 2026 2027 2028 2029 2030 2031 2032
VOC 8.40E-04 8.40E-04 8.37E-04 8.37E-04 8.37E-04 8.37E-04 8.37E-04 8.36E-04 8.36E-04 8.36E-04
CO 5.24E-04 5.24E-04 5.08E-04 5.08E-04 5.08E-04 5.08E-04 5.08E-04 5.01E-04 5.01E-04 5.01E-04
NOx 1.18E-03 1.18E-03 1.14E-03 1.14E-03 1.14E-03 1.14E-03 1.14E-03 1.11E-03 1.11E-03 1.11E-03
PM10 2.13E-04 2.13E-04 2.09E-04 2.09E-04 2.09E-04 2.09E-04 2.09E-04 2.08E-04 2.08E-04 2.08E-04
PM2.5 7.98E-05 7.98E-05 7.73E-05 7.73E-05 7.73E-05 7.73E-05 7.73E-05 7.60E-05 7.60E-05 7.60E-05
SO2 7.99E-04 7.99E-04 7.87E-04 7.87E-04 7.87E-04 7.87E-04 7.87E-04 7.87E-04 7.87E-04 7.87E-04
CO2e 7.69E-01 7.69E-01 7.57E-01 7.57E-01 7.57E-01 7.57E-01 7.57E-01 7.56E-01 7.56E-01 7.56E-01
kg/mi = kilogram per mile Note: GREET’s output emission factors (kg/mi) for the GHG and non-greenhouse gases from GREET model vary based on the model year. The GREET model was run for the years FY2023- FY2033 when the action would occur. The model assumed that all proposed vehicles are categorized as LHD vocational vehicles.

United States Postal Service Draft Environmental Impact Statement - Appendix F Environmental Compliance and Risk Management
F-24 August 2021
Aggregated Direct and Indirect Net Emission Calculation
The combined direct tailpipe GHG emissions and the indirect GHG emissions associated with energy consumption by vehicle fuel associated with the two Proposed Action scenarios and Alternatives 1.1 and 1.2 were used to evaluate the total aggregated GHG emissions.
Table F-7.a Net Aggregated (Direct and Indirect) Air Emission Changes Proposed Action - Purchase and Deployment of up to 165,000 Vehicles (90% ICE NGDV and 10% BEV NGDV)
Emission Type
Vehicle Action Vehicle Description
VOC
(tpy)
NOX
(tpy)
CO
(tpy)
PM2.5
(tpy)
PM10
(tpy)
SO2
(tpy)
CO2e
(MT)
Direct New 90% ICE NGDV 9.60 10.65 402.74 11.61 76.43 1.97 280,565
Direct New 10% BEV NGDV - - - 1.07 8.24 - -
Direct Removed Replaced Vehicles (LLVs/FFVs/Metris) -935.99 -2,264.31 -11,496 -59.14 -136.72 -3.72 -537,415
Direct Total (Emissions
Decrease) -926.39 -2,253.67 -11,093 -46.47 -52.06 -1.75 -256,850
Emission Type
Vehicle Action Vehicle Description
VOC
(tpy)
NOX
(tpy)
CO
(tpy)
PM2.5
(tpy)
PM10
(tpy)
SO2
(tpy)
CO2e
(MT)
Direct + Indirect New
90% ICE NGDV (GREET + MOVES) 880.29 1,186.20 929.60 91.75 294.00 822.14 995,643
Direct + Indirect New
10% BEV NGDV (eGRID + MOVES) NA1 41.27 NA1 5.59 NA1 38.10 46,748
Direct + Indirect Removed
Replaced Vehicles (LLVs/FFVs/Metris) (GREET + MOVES) -1,903.42 -3,570.48 -12,081.32 -148.19 -378.47 -915.03 -1,332,698
Aggregated Total
(Emissions Decrease) -1,0231
-2,343 -11,1521 -51 -84.51 -55 -290,306
tpy = Ton Per Year MT = Metric Ton Note:
1 This value does not include VOC, CO, and PM10, as eGRID does not provide VOC, CO, and PM10 emissions factor data for the upstream sources. Therefore, the aggregated net emissions for VOC, CO and PM10 are not included in this calculation.

United States Postal Service Draft Environmental Impact Statement - Appendix F Environmental Compliance and Risk Management
F-25 August 2021
Table F-7.b Net Aggregated (Direct and Indirect) Air Emission Changes Proposed Action - Purchase and Deployment of up to 165,000 NGDV (100% BEV NGDV)
Emission Type
Vehicle Action Vehicle Description
VOC
(tpy)
NOX
(tpy)
CO
(tpy)
PM2.5
(tpy)
PM10
(tpy)
SO2
(tpy)
CO2e
(MT)
Direct New 100% BEV NGDV - - - 10.65 82.38 - -
Direct Removed
Replaced Vehicles (LLVs/FFVs/Metris) -935.99 -2,264.31 -11,496 -59.14 -136.72 -3.72 -537,415
Direct Total -935.99 -2,264.31 -11,496 -48.49 -54.34 -3.72 -537,415
Direct + Indirect New
100% BEV NGDV (eGRID + MOVES) NA1 412.71 NA1 55.94 NA1 381.01 467,485
Direct + Indirect
Removed
Replaced Vehicles (LLVs/FFVs/Metris) (GREET + MOVES) -1,903.42 -3,570.48 -12,081.32 -148.19 -378.47 -915.03 -1,332,698
Aggregated Total -1,9031 -3,158 -12,0811 -92 -3781 -534 -865,213
tpy = Ton Per Year MT = Metric Ton Note: 1This value does not include VOC, CO, and PM10, as eGRID does not provide VOC, CO, and PM10 emissions factor data for the upstream sources. Therefore, the aggregated net emissions for VOC, CO and PM10 are not included in this calculation.
Table F-7.c Net Aggregated (Direct and Indirect) Air Emission Changes Alternative 1.1 - Purchase and Deployment of up to 165,000 COTS Vehicles (100% RHD COTS ICE Vehicles)
Emission Type
Vehicle Action
Vehicle Description
VOC
(tpy)
NOX
(tpy)
CO
(tpy)
PM2.5
(tpy)
PM10
(tpy)
SO2
(tpy)
CO2e
(MT)
Direct New 100% COTS ICE Vehicles 10.67 11.83 447 12.89 84.92 2.19 311,739
Direct Removed Replaced Vehicles (LLVs/FFVs/Metris) -935.99 -2,264.31 -11,496 -59.14 -136.72 -3.72 -537,415
Direct Total -925.32 -2,252.48 -11,048 -46.25 -51.80 -1.54 -225,676
Direct + Indirect New
100% COTS ICE Vehicles (GREET + MOVES) 978.10 1,317.99 1,032.88 101.94 326.67 913.49 1,106,270
Direct + Indirect Removed
Replaced Vehicles (LLVs/FFVs/Metris) (GREET + MOVES) -1,903.42 -3,570.48 -12,081.32 -148.19 -378.47 -915.03 -1,332,698
Aggregated Total -925 -2,252 -11,048 -46 -52 -1.54 -226,427

United States Postal Service Draft Environmental Impact Statement - Appendix F Environmental Compliance and Risk Management
F-26 August 2021
Table F-7.d Net Aggregated (Direct and Indirect) Air Emission Changes Alternative 2.2 - Purchase and Deployment of up to 165,000 COTS Vehicles (100% COTS BEVs)
Emission Type
Vehicle Action Vehicle Description
VOC
(tpy)
NOX
(tpy)
CO
(tpy)
PM2.5
(tpy)
PM10
(tpy)
SO2
(tpy)
CO2e
(MT)
Direct New 100% COTS BEVs - - - 10.65 82.38 - -
Direct Removed Replaced Vehicles (LLVs/FFVs/Metris) -935.99 -2,264.31 -11,496 -59.14 -136.72 -3.72 -537,415
Direct Total -935.99 -2,264.31 -11,496 -48.49 -54.34 -3.72 -537,415
Direct + Indirect New
100% COTS BEVs (eGRID + MOVES) NA1 190.66 NA1 31.57 NA1 176.02 215,968
Direct + Indirect Removed
Replaced Vehicles (LLVs/FFVs/Metris) (GREET + MOVES) -1,903.42 -3,570.48 -12,081.32 -148.19 -378.47 -915.03 -1,332,698
Aggregated Total -1,903 1 -3,380 -12,0811 -117 -3781 -739 -1,116,730
tpy = Ton Per Year MT = Metric Ton Note: 1This value does not include VOC, CO, and PM10, as eGRID does not provide VOC, CO, and PM10 emissions factor data for the upstream sources. Therefore, the aggregated net emissions for VOC, CO and PM10 are not included in this calculation.
Table F-7.e Aggregated (Direct and Indirect) Air Emissions from Existing Delivery Vehicles Over a Ten-Year Period
Emission Type
Vehicle Action Vehicle Description
VOC
(tpy)
NOX
(tpy)
CO
(tpy)
PM2.5
(tpy)
PM10
(tpy)
SO2
(tpy)
CO2e
(MT)
Direct Existing Vehicles
Existing Vehicles (LLVs/FFVs/Metris) -935.99 -2,264.31 -11,496 -59.14 -136.72 -3.72 -537,415
Direct + Indirect
Existing Vehicles
Existing Vehicles (LLVs/FFVs/Metris) (GREET + MOVES) -1,903.42 -3,570.48 -12,081.32 -148.19 -378.47 -915.03 -1,332,698
tpy = Ton Per Year MT = Metric Ton

United States Postal Service Draft Environmental Impact Statement - Appendix F Environmental Compliance and Risk Management
F-27 August 2021
F-8 Social Cost of Carbon
Table F-8.a Social Cost of CO2, CH4, and N2O, 2020-2050 (in 2020 dollars per metric ton of pollutant)
Emissions Year
CO2 Discount Rate and Statistic
(5% Average)
CO2 Discount Rate and Statistic
(3% Average)
CO2 Discount Rate and Statistic
(2.5% Average)
CH4 Discount Rate and Statistics (5% Average)
CH4 Discount Rate and Statistics (3% Average)
CH4 Discount Rate and Statistics (2.5% Average)
N2O Discount Rate and Statistics (5% Average)
N2O Discount Rate and Statistics (3% Average)
N2O Discount Rate and Statistics
(2.5% Average)
2020 14 51 76 670 1500 2000 5800 18000 27000
2025 17 56 83 800 1700 2200 6800 21000 30000
2030 19 62 89 940 2000 2500 7800 23000 33000
2035 22 67 96 1100 2200 2800 9000 25000 36000
2040 25 73 103 1300 2500 3100 10000 28000 39000
2045 28 79 110 1500 2800 3500 12000 30000 42000
2050 32 85 116 1700 3100 3800 13000 33000 45000
CO2 = carbon dioxide CH4 = methane N2O = nitrous oxide Source: Technical Support Document: Social Cost of Carbon, Methane, and Nitrous Oxide Interim Estimates under Executive Order 13990 (Interagency Working Group on Social Cost of Greenhouse Gases, United States Government, February 2021).

United States Postal Service Draft Environmental Impact Statement - Appendix F Environmental Compliance and Risk Management
F-28 August 2021
Table F-8.b Social Cost of Proposed Action - Purchase and Deployment of up to 165,000 NGDV (90% ICE NGDV and 10% BEV NGDV)
Note: Future damages are converted into present-day value by using a discount rate to determine how much weight is placed on impacts that would occur in the future. Future costs and benefits are generally less significant than present costs and benefits, and the discount rate reflects this level of relative significance. A high discount rate means that future effects are much less significant than present effects, whereas a low discount rate means that they are closer to equally significant than present effects. Higher discount rates result in a lower SCC; if future climate damages are discounted at a high rate, less value is placed on avoiding those damages today.
Operational Year Pollutant
$, 2020 dollars (5% Average)
$, 2020 dollars (3% Average)
$, 2020 dollars (2.5% Average)
2025 CO2 -4,322,018 -14,237,237 -21,101,618
2025 CH4 -116,475 -247,510 -320,307
2025 N2O -462,666 -1,428,822 -2,041,175
2025 Total -4,901,160 -15,913,569 -23,463,100
2030 CO2 -4,830,491 -15,762,655 -22,627,037
2030 CH4 -136,859 -291,188 -363,986
2030 N2O -530,705 -1,564,901 -2,245,292
2030 Total -5,498,055 -17,618,744 -25,236,314
2035 CO2 -5,593,200 -17,033,837 -24,406,691
2035 CH4 -160,154 -320,307 -407,664
2035 N2O -612,352 -1,700,979 -2,449,410
2035 Total -6,365,706 -19,055,123 -27,263,765
2040 CO2 -6,355,909 -18,559,255 -26,186,346
2040 CH4 -189,272 -363,986 -451,342
2040 N2O -680,392 -1,905,096 -2,653,527
2040 Total -7,225,573 -20,828,337 -29,291,215
2045 CO2 -7,118,618 -20,084,673 -27,966,000
2045 CH4 -218,391 -407,664 -509,580
2045 N2O -816,470 -2,041,175 -2,857,645
2045 Total -8,153,479 -22,533,511 -31,333,225
2050 CO2 -8,135,564 -21,610,091 -29,491,419
2050 CH4 -247,510 -451,342 -553,258
2050 N2O -884,509 -2,245,292 -3,061,762
2050 Total -9,267,583 -24,306,725 -33,106,439

United States Postal Service Draft Environmental Impact Statement - Appendix F Environmental Compliance and Risk Management
F-29 August 2021
Table F-8.c Social Cost of Proposed Action - Purchase and Deployment of up to 165,000 NGDV (100% BEV NGDV)
Operational Year Pollutant
$, 2020 dollars (5% Average)
$, 2020 dollars (3% Average)
$, 2020 dollars (2.5% Average)
2025 CO2 -10,146,258 -33,422,969 -49,537,614
2025 CH4 -1,103,898 -2,345,783 -3,035,719
2025 N2O -2,987,312 -9,225,522 -13,179,316
2025 Total -14,237,468 -44,994,273 -65,752,649
2030 CO2 -11,339,936 -37,004,001 -53,118,647
2030 CH4 -1,297,080 -2,759,744 -3,449,680
2030 N2O -3,426,622 -10,104,143 -14,497,248
2030 Total -16,063,638 -49,867,888 -71,065,575
2035 CO2 -13,130,452 -39,988,195 -57,296,518
2035 CH4 -1,517,859 -3,035,719 -3,863,642
2035 N2O -3,953,795 -10,982,764 -15,815,180
2035 Total -18,602,106 -54,006,677 -76,975,339
2040 CO2 -14,920,968 -43,569,227 -61,474,389
2040 CH4 -1,793,834 -3,449,680 -4,277,604
2040 N2O -4,393,105 -12,300,695 -17,133,111
2040 Total -21,107,907 -59,319,603 -82,885,104
2045 CO2 -16,711,484 -47,150,259 -65,652,260
2045 CH4 -2,069,808 -3,863,642 -4,829,553
2045 N2O -5,271,727 -13,179,316 -18,451,043
2045 Total -24,053,019 -64,193,218 -88,932,855
2050 CO2 -19,098,839 -50,731,292 -69,233,292
2050 CH4 -2,345,783 -4,277,604 -5,243,514
2050 N2O -5,711,037 -14,497,248 -19,768,975
2050 Total -27,155,659 -69,506,143 -94,245,781
Note: Future damages are converted into present-day value by using a discount rate to determine how much weight is placed on impacts that would occur in the future. Future costs and benefits are generally less significant than present costs and benefits, and the discount rate reflects this level of relative significance. A high discount rate means that future effects are much less significant than present effects, whereas a low discount rate means that they are closer to equally significant than present effects. Higher discount rates result in a lower SCC; if future climate damages are discounted at a high rate, less value is placed on avoiding those damages today.

United States Postal Service Draft Environmental Impact Statement - Appendix F Environmental Compliance and Risk Management
F-30 August 2021
Table F-8.d Social Cost of Alternative 1.1 - Purchase and Deployment of up to 165,000 COTS Vehicles (100% RHD COTS ICE Vehicles)
Operational Year Pollutant
$, 2020 dollars (5% Average)
$, 2020 dollars (3% Average)
$, 2020 dollars (2.5% Average)
2025 CO2 -3,674,881 -12,105,490 -17,942,065
2025 CH4 -6,762 -14,369 -18,595
2025 N2O -182,150 -562,522 -803,603
2025 Total -3,863,793 -12,682,381 -18,764,264
2030 CO2 -4,107,220 -13,402,507 -19,239,082
2030 CH4 -7,945 -16,904 -21,131
2030 N2O -208,937 -616,096 -883,964
2030 Total -4,324,102 -14,035,507 -20,144,176
2035 CO2 -4,755,728 -14,483,354 -20,752,268
2035 CH4 -9,297 -18,595 -23,666
2035 N2O -241,081 -669,669 -964,324
2035 Total -5,006,107 -15,171,618 -21,740,259
2040 CO2 -5,404,237 -15,780,371 -22,265,455
2040 CH4 -10,988 -21,131 -26,202
2040 N2O -267,868 -750,030 -1,044,684
2040 Total -5,683,092 -16,551,531 -23,336,341
2045 CO2 -6,052,745 -17,077,388 -23,778,641
2045 CH4 -12,678 -23,666 -29,583
2045 N2O -321,441 -803,603 -1,125,045
2045 Total -6,386,865 -17,904,657 -24,933,268
2050 CO2 -6,917,423 -18,374,404 -25,075,658
2050 CH4 -14,369 -26,202 -32,118
2050 N2O -348,228 -883,964 -1,205,405
2050 Total -7,280,020 -19,284,570 -26,313,181
Note: Future damages are converted into present-day value by using a discount rate to determine how much weight is placed on impacts that would occur in the future. Future costs and benefits are generally less significant than present costs and benefits, and the discount rate reflects this level of relative significance. A high discount rate means that future effects are much less significant than present effects, whereas a low discount rate means that they are closer to equally significant than present effects. Higher discount rates result in a lower SCC; if future climate damages are discounted at a high rate, less value is placed on avoiding those damages today.

United States Postal Service Draft Environmental Impact Statement - Appendix F Environmental Compliance and Risk Management
F-31 August 2021
Table F-8.e Social Cost of Alternative 1.2 - Purchase and Deployment of up to 165,000 COTS Vehicles (100% COTS BEVs)
Operational Year Pollutant
$, 2020 dollars (5% Average)
$, 2020 dollars (3% Average)
$, 2020 dollars (2.5% Average)
2025 CO2 -14,398,101 -47,429,039 -70,296,611
2025 CH4 -1,120,869 -2,381,847 -3,082,390
2025 N2O -3,008,469 -9,290,861 -13,272,658
2025 Total -18,527,439 -59,101,746 -86,651,659
2030 CO2 -16,091,995 -52,510,722 -75,378,294
2030 CH4 -1,317,021 -2,802,172 -3,502,716
2030 N2O -3,450,891 -10,175,705 -14,599,924
2030 Total -20,859,908 -65,488,599 -93,480,934
2035 CO2 -18,632,837 -56,745,457 -81,306,924
2035 CH4 -1,541,195 -3,082,390 -3,923,041
2035 N2O -3,981,798 -11,060,549 -15,927,190
2035 Total -24,155,829 -70,888,396 -101,157,155
2040 CO2 -21,173,678 -61,827,140 -87,235,554
2040 CH4 -1,821,412 -3,502,716 -4,343,367
2040 N2O -4,424,219 -12,387,815 -17,254,456
2040 Total -27,419,310 -77,717,670 -108,833,377
2045 CO2 -23,714,519 -66,908,823 -93,164,183
2045 CH4 -2,101,629 -3,923,041 -4,903,802
2045 N2O -5,309,063 -13,272,658 -18,581,722
2045 Total -31,125,212 -84,104,523 -116,649,707
2050 CO2 -27,102,308 -71,990,505 -98,245,866
2050 CH4 -2,381,847 -4,343,367 -5,324,128
2050 N2O -5,751,485 -14,599,924 -19,908,988
2050 Total -35,235,640 -90,933,797 -123,478,982
Note: Future damages are converted into present-day value by using a discount rate to determine how much weight is placed on impacts that would occur in the future. Future costs and benefits are generally less significant than present costs and benefits, and the discount rate reflects this level of relative significance. A high discount rate means that future effects are much less significant than present effects, whereas a low discount rate means that they are closer to equally significant than present effects. Higher discount rates result in a lower SCC; if future climate damages are discounted at a high rate, less value is placed on avoiding those damages today.

United States Postal Service Draft Environmental Impact Statement - Appendix F Environmental Compliance and Risk Management
F-32 August 2021
Table F-8.f Social Cost of No-Action Alternative - 165,000 Existing Delivery Vehicles
Operational Year Pollutant
$, 2020 dollars (5% Average)
$, 2020 dollars (3% Average)
$, 2020 dollars (2.5% Average)
2020 CO2 -14,863,873 -54,146,965 -80,689,594
2020 CH4 -950,932 -2,128,953 -2,838,604
2020 N2O -2,581,543 -8,011,684 -12,017,527
2020 Total -18,396,348 -64,287,602 -95,545,725
2025 CO2 -18,048,988 -59,455,491 -88,121,531
2025 CH4 -1,135,442 -2,412,813 -3,122,464
2025 N2O -3,026,636 -9,346,965 -13,352,807
2025 Total -22,211,066 -71,215,269 -104,596,802
2030 CO2 -20,172,399 -65,825,722 -94,491,762
2030 CH4 -1,334,144 -2,838,604 -3,548,255
2030 N2O -3,471,730 -10,237,152 -14,688,088
2030 Total -24,978,272 -78,901,478 -112,728,105
2035 CO2 -23,357,514 -71,134,248 -101,923,698
2035 CH4 -1,561,232 -3,122,464 -3,974,045
2035 N2O -4,005,842 -11,127,340 -16,023,369
2035 Total -28,924,588 -85,384,051 -121,921,112
2040 CO2 -26,542,630 -77,504,479 -109,355,634
2040 CH4 -1,845,092 -3,548,255 -4,399,836
2040 N2O -4,450,936 -12,462,620 -17,358,650
2040 Total -32,838,658 -93,515,354 -131,114,120
2045 CO2 -29,727,745 -83,874,710 -116,787,571
2045 CH4 -2,128,953 -3,974,045 -4,967,557
2045 N2O -5,341,123 -13,352,807 -18,693,930
2045 Total -37,197,821 -101,201,563 -140,449,058
2050 CO2 -33,974,566 -90,244,941 -123,157,802
2050 CH4 -2,412,813 -4,399,836 -5,393,347
2050 N2O -5,786,217 -14,688,088 -20,029,211
2050 Total -42,173,596 -109,332,865 -148,580,360
Note: Future damages are converted into present-day value by using a discount rate to determine how much weight is placed on impacts that would occur in the future. Future costs and benefits are generally less significant than present costs and benefits, and the discount rate reflects this level of relative significance. A high discount rate means that future effects are much less significant than present effects, whereas a low discount rate means that they are closer to equally significant than present effects. Higher discount rates result in a lower SCC; if future climate damages are discounted at a high rate, less value is placed on avoiding those damages today.

United States Postal Service Draft Environmental Impact Statement - Appendix F Environmental Compliance and Risk Management
F-33 August 2021
EFFECTS OF CLIMATE CHANGE ON PROPOSED ACTION AND ALTERNATIVES 1.1 AND 1.2
The climate of the United States is strongly connected to the changing global climate. Global annual
average surface air temperature has increased by 1.8°F over the last 115 years (1901-2016). Studies
conducted around the world have documented rising surface, atmospheric, and oceanic temperatures, melting glaciers, diminishing snow cover, shrinking sea ice, changing in precipitation patterns, increased frequency and/or intensity of extreme weather events, rising sea levels and associated storm surge, and ocean acidification (U.S. Global Change Research Program 2017).
The Proposed Action and Alternatives 1.1 and 1.2 involve the replacement of up to 165,000 vehicles in total production orders over a ten-year period. High-maintenance and end-of-life delivery vehicles would be replaced at various existing Postal Service facility locations throughout the U.S. on a one-for-one basis, resulting in no additional delivery vehicles. No new VMFs would be needed, and expansions of Postal Service facilities are not currently anticipated.
At facilities where BEVs would be deployed and that are subject to flooding (100-year and 500-year floodplains as established by the Federal Emergency Management Agency), or to flooding from extreme weather events or sea level rise, the Postal Service would carefully consider the placement of BEV charging stations. The Postal Service would conduct appropriate environmental review at the local level per Postal Service Handbook RE-6 (2015) as needed. Postal Service environmental checklists, screening analyses, and stand-alone, project-level Environmental Assessments would be employed on a facility-specific basis to assess the extent of impacts.
New BEV operation could be impacted by excessive ambient air temperatures that could affect BEV performance and the life of the batteries, and in extreme cases result in brown-out of the electrical grid that would hinder charging the BEVs.

United States Postal Service Draft Environmental Impact Statement - Appendix F Environmental Compliance and Risk Management
F-34 August 2021
Appendix F References
Argonne National Laboratory. Greenhouse Gases, Emissions, and Energy use in Technologies (GREET) model.
Interagency Working Group on Social Cost of Greenhouse Gases, United States Government. 2021. Technical Support Document: Social Cost of Carbon, Methane, and Nitrous Oxide Interim Estimates under Executive Order 13990. February. 2021).
United States Environmental Protection Agency (EPA).
2014. MOVES2014b.
2021b. Online at: https://www.epa.gov/criteria-air-pollutants/naaqs-table
2021c. Online at: https://www.epa.gov/general-conformity/de-minimis-tables
2021d. Emissions & Generation Resource Integrated Database (eGRID) data (eGRID2019). Released February 2021.
U.S. Global Change Research Program. 2017.
USPS. 2015. Facilities Environmental Guide.

United States Postal Service Draft Environmental Impact Statement - Appendix G Environmental Compliance and Risk Management
G-1 August 2021
APPENDIX G
FUEL CONSUMPTION CALCULATIONS
Table G-1 Current Fuel Efficiency and Estimated Fuel Consumption of Existing Delivery Vehicles
Proposed for Replacement
Table G-2 Estimated Fuel Consumption of Future ICE NGDV (Proposed Action Hypothetical
Maximum) and COTS ICE Delivery Vehicles (Alternative 1.1)
Table G-3 Estimated Fuel Consumption Comparison of Existing 165,000 Delivery Vehicles and the Proposed Action ICE Hypothetical Maximum (90% ICE NGDV and 10% BEV NDGV) Table G-4 Estimated Fuel Consumption Comparison of Existing 165,000 Delivery Vehicles and
Alternative 1.1 (165,000 COTS ICE Vehicles)

United States Postal Service Draft Environmental Impact Statement - Appendix G Environmental Compliance and Risk Management
G-2 August 2021
Table G-1 Current Fuel Efficiency and Estimated Fuel Consumption of Existing Delivery Vehicles Proposed for Replacement
Vehicle Type
Fuel Efficiency (mpg)1
Number of Vehicles Proposed for Replacement2
Average Delivery Route Length (miles)
Number of Delivery Days
Total Estimated Gasoline Usage3
(gallons)
LLVs 8.2 125,988.00 21.05 302 97,672,965
FFVs 6.9 21,070.00 21.05 302 19,412,188
COTS (Metris) 6.3 17,942.00 21.05 302 18,104,617
Annual Total2 --- 165,000.00 --- --- 135,189,770
1 Based on USPS FY 2020 fuel consumption monitoring 2 See Table D-1 in Appendix D 3 Estimated annual fuel usage calculated as [(Average Delivery Route Length/Fuel Efficiency) X # Vehicles X # Delivery Days]
Table G-2 Estimated Fuel Consumption of Future ICE NGDV (Proposed Action Hypothetical Maximum) and COTS ICE Delivery Vehicles (Alternative 1.1)
Vehicle Type
Fuel Efficiency (mpg)1, 2
Number of Vehicles Proposed for Replacement3
Average Delivery Route Length (miles)
Number of Delivery Days
Total Estimated Gasoline Usage4 (gallons)
ICE NGDV 8.6 148,500 21.05 302 109,770,855
COTS ICE Vehicles 6.3 165,000 21.05 302 166,495,476
1 ICE NGDV with air conditioning (see Table 3-1.2) 2 Actual Postal Service average mileage for RHD Metris Vehicles (see Table 3-2.1) 3 See Table D-1 in Appendix D 4 Estimated annual fuel usage calculated as [(Average Delivery Route Length/Fuel Efficiency) X # Vehicles X # Delivery Days]

United States Postal Service Draft Environmental Impact Statement - Appendix G Environmental Compliance and Risk Management
G-3 August 2021
Table G-3 Estimated Fuel Consumption Comparison of Existing 165,000 Delivery Vehicles and the Proposed Action ICE Hypothetical Maximum (90% ICE NGDV and 10% BEV NDGV)
Vehicle Type
Fuel Efficiency (mpg)1
Number of Vehicles Proposed for Replacement2
Average Delivery Route Length (miles)
Number of Delivery Days
Total Estimated Gasoline Usage3
(gallons)
Existing Delivery Vehicles being Replaced
(see Table G-1) 165,000 21.05 302 -135,189,770
ICE NGDV 8.6 148,500 21.05 302 109,770,855
BEV NGDV N/A 16,500 21.05 302 N/A
Difference4 -25,418,916
1 ICE NGDV with air conditioning (see Table 3-1.2) 2 See Table D-1 in Appendix D 3 Estimated annual fuel usage calculated as [(Average Delivery Route Length/Fuel Efficiency) X # Vehicles X # Delivery Days] 4 ICE NGDV are estimated to be more fuel-efficient than the current mix of Delivery Vehicles, thus resulting in less gasoline usage, plus this Proposed Action scenario includes at least 10% BEV NGDV
Table G-4 Estimated Fuel Consumption Comparison of Existing 165,000 Delivery Vehicles and Alternative 1.1 (165,000 COTS ICE Vehicles)
Vehicle Type
Fuel Efficiency (mpg)1
Number of Vehicles Proposed for Replacement2
Average Delivery Route Length (miles)
Number of Delivery Days
Total Estimated Gasoline Usage3
(gallons)
Existing Delivery Vehicles being Replaced
(see Table G-1) 165,000 21.05 302 -135,189,770
COTS ICE Vehicles 6.3 165,000 21.05 302 166,495,476
Difference4 31,305,706
1 Actual Postal Service average mileage for RHD Metris Vehicles (see Table 3-2.1) 2 See Table D-1 in Appendix D 3 Estimated annual fuel usage calculated as [(Average Delivery Route Length/Fuel Efficiency) X # Vehicles X # Delivery Days] 4 COTS ICE vehicles are estimated to be less fuel-efficient than the current mix of Delivery Vehicles, thus resulting in more gasoline usage for the same number of vehicles