DRAFT ENVIRONMENTAL BASELINE STUDIES PROGRESS...
38
DRAFT ENVIRONMENTAL BASELINE STUDIES 2004 PROGRESS REPORTS CHAPTER 10. WETLANDS NOVEMBER 2005
Transcript of DRAFT ENVIRONMENTAL BASELINE STUDIES PROGRESS...

DDRRAAFFTT EENNVVIIRROONNMMEENNTTAALL BBAASSEELLIINNEE SSTTUUDDIIEESS 22000044 PPRROOGGRREESSSS RREEPPOORRTTSS
CCHHAAPPTTEERR 1100.. WWEETTLLAANNDDSS
NNOOVVEEMMBBEERR 22000055

DRAFT WETLANDS
TABLE OF CONTENTS
TABLE OF CONTENTS..........................................................................................................................10-i
LIST OF TABLES...................................................................................................................................10-ii
LIST OF FIGURES .................................................................................................................................10-ii
APPENDICES .........................................................................................................................................10-ii
ACRONYMS..........................................................................................................................................10-iii
10. WETLANDS .....................................................................................................................................10-1
10.1 Mine Area ................................................................................................................................10-1 10.1.1 Introduction ................................................................................................................10-1 10.1.2 Study Objectives.........................................................................................................10-1 10.1.3 Study Area ..................................................................................................................10-1 10.1.4 Scope of Work ............................................................................................................10-1 10.1.5 Methods/Approach .....................................................................................................10-2
10.1.5.1 Literature Review .....................................................................................10-2 10.1.5.2 Alternatives Analysis................................................................................10-2 10.1.5.3 Field Data Collection................................................................................10-3 10.1.5.4 Data Entry.................................................................................................10-4 10.1.5.5 Digital Mapping........................................................................................10-5
10.1.6 Results and Discussion ...............................................................................................10-6 10.1.6.1 Literature Review .....................................................................................10-6 10.1.6.2 Alternatives Analysis................................................................................10-6 10.1.6.3 Field Results .............................................................................................10-7 10.1.6.4 Database Design and Development, and Data Entry ................................10-7 10.1.6.5 Digital Mapping........................................................................................10-8 10.1.6.6 GIS Oversight and Coordination ..............................................................10-9
10.1.7 Summary.....................................................................................................................10-9 10.2 Road/Port Areas.......................................................................................................................10-9
10.2.1 Introduction ................................................................................................................10-9 10.2.2 Study Objectives.......................................................................................................10-10 10.2.3 Study Area ................................................................................................................10-10 10.2.4 Scope of Work ..........................................................................................................10-11 10.2.5 Methods ....................................................................................................................10-11 10.2.6 Results and Discussion .............................................................................................10-12 10.2.7 Summary...................................................................................................................10-14
10.3 References .............................................................................................................................10-14
PR Ch 10 Wetlands 10-i Rev. 0, 10/21/05

DRAFT ENVIRONMENTAL BASELINE STUDIES, 2004 PROGRESS REPORT DRAFT
LIST OF TABLES
Table 10-1, Road and Port Wetlands Study, Baseline Data Collected, 2004 ........................................10-13
LIST OF FIGURES (following Section 10.3)
Figure 10-1, 2004 Wetlands Study Area, 3PP
Figure 10-2, Road/Port Study, Project Overview
Figure 10-3, 2004 Field Sample Locations
Figure 10-4, 2004 Field Sample Locations
Figure 10-5, 2004 Field Sample Locations
Figure 10-6, 2004 Field Sample Locations
Figure 10-7, 2004 Field Sample Locations
Figure 10-8, 2004 Field Sample Locations
Figure 10-9, 2004 Field Sample Locations
Figure 10-10, 2004 Field Sample Locations
Figure 10-11, 2004 Field Sample Locations
APPENDICES
Appendix 10-A, Routine Wetland Determination Data Form
Appendix 10-B, Wetland Functional Assessment Data Form
PR Ch 10 Wetlands 10-ii Rev. 0, 10/21/05

DRAFT WETLANDS
ACRONYMS
AASHTO American Association of State and Highway Transportation Officials ABA acid-base accounting ac-ft acre-feet ADEC Alaska Department of Environmental Conservation ADF&G Alaska Department of Fish and Game ADNR Alaska Department of Natural Resources agl above ground level AHRS Alaska Heritage Resource Survey ALS ALS Environmental Laboratory ANCSA Alaska Native Claims Settlement Act AP acid potential APE area of potential effect ASCI Alaska Stream Condition Index ASTM American Society for Testing and Materials ASTt Arctic Small Tool tradition BBNA Bristol Bay Native Association BEESC Bristol Environmental & Engineering Services Corporation bgs below ground surface BIA Bureau of Indian Affairs BLM Bureau of Land Management BP before present ºC degrees Celsius 14C Carbon 14 CEMI Canadian Environmental and Metallurgical Laboratory cfs cubic feet per second CIRCAC Cook Inlet Regional Citizens Advisory Council cm centimeter(s) CQ continuous flow CRM cultural resources management CUEQ% copper equivalent grade DEM digital elevation model DI deionized DOT&PF Alaska Department of Transportation and Public Facilities DRO diesel-range organics
PR Ch 10 Wetlands 10-iii Rev. 0, 10/21/05

DRAFT ENVIRONMENTAL BASELINE STUDIES, 2004 PROGRESS REPORT DRAFT
EBD environmental baseline document EIS environmental impact statement EPT Ephemeroptera, Plecoptera, or Trichoptera EPA Environmental Protection Agency FAA Federal Aviation Administration FHWA Federal Highway Administration FL fork length fps feet per second FR Federal Register ft foot (feet) ft2 square foot (feet) GIS geographic information system GLM general linear model GMU Game Management Unit gpm gallons pre minute GPS global positioning system GS gauging station HC-3 high-gradient, contained channel HDR HDR Alaska, Inc. HGM hydrogeomorphic HWM high-water mark ICP inductively coupled plasma IQ instantaneous flow KC Kaskanak Creek KP Knight Piesold KR Koktuli River Main Stem L liter(s) LC-1 low-gradient, contained channel LIDAR light detection and ranging m meter(s) m2 square meter(s) M.A. Master of Arts MC-1 moderate-gradient, narrow, shallow, contained channel MCHTWG Mulchatna Caribou Herd Technical Working Group MDC mine development concept me-Hg methyl-mercury MEND mine environment neutral drainage mg milligram(s)
PR Ch 10 Wetlands 10-iv Rev. 0, 10/21/05

DRAFT WETLANDS
mg/kg milligrams per kilogram mg/l milligrams per liter mi2 square mile(s) ml milliliter(s) ML/ARD metal leaching/acid rock drainage MLLW Mean lower low water mm millimeter(s) MM-1 moderate-gradient, mixed-control channel MMS Minerals Management Service MODIS moderate resolution imaging spectroradiometer mph miles per hour m/s meters per second μL microliter(s) NASA National Aeronautics and Space Administration ND non-detect NDM Northern Dynasty Mines Inc. NEPA National Environmental Policy Act NK North Fork Koktuli River NMFS National Marine Fisheries Service NOAA National Oceanic and Atmospheric Administration NP neutralization potential NPS National Park Service NRCS Natural Resources Conservation Service NRHP National Register of Historic Places Nv calculated variance NWR National Wildlife Refuge OCSEAP Outer Continental Shelf Environmental Assessment Program OHMP Office of Habitat Management and Permitting OHW ordinary high water PA-1 narrow, placid-flow habitat PA-3 shallow-ground, water-fed slough PA-5 palustrine beaver habitat PAG potentially acid-generating PJD preliminary jurisdictional determination PSD Prevention of Significant Deterioration PVC polyvinyl chloride Q discharge QA quality assurance
PR Ch 10 Wetlands 10-v Rev. 0, 10/21/05

DRAFT ENVIRONMENTAL BASELINE STUDIES, 2004 PROGRESS REPORT DRAFT
QAPP quality assurance project plan QC quality control RBP Rapid Bioassessment Protocols RRO residual-range organics SHPO State Historic Preservation Officer SK South Fork Koktuli River SLR SLR Alaska SRB&A Stephen R. Braund & Associates SRK SRK Consulting (Canada) Inc. SWE snow/water equivalent 3PP Three Parameters Plus TOC total organic carbon UAF University of Alaska Fairbanks USACE U.S. Army Corps of Engineers – Regulatory Branch USC United States Code USDA United States Department of Agriculture USDI United States Department of Interior USFS United States Forest Service USFWS United States Fish and Wildlife Service USGS United States Geological Survey UT Upper Talarik Creek VHF very high frequency WMC Water Management Consultants Inc. WRIR water-resources investigations report
PR Ch 10 Wetlands 10-vi Rev. 0, 10/21/05

DRAFT WETLANDS
10. WETLANDS
10.1 Mine Area
10.1.1 Introduction
Understanding the location and types of wetlands and other Waters of the United States, as defined under Section 404 of the Clean Water Act (404), is an important component of planning any development in Alaska. The regulations in 404 require an extensive analysis of development options, in order to determine the range of practicable alternatives for each project component. As such, proponents of large developments must provide mapping of areas in and around their preferred development footprint, as well as documentation to support that mapping.
Northern Dynasty Mines Inc. (NDM) selected two contractors, Three Parameters Plus (3PP) and HDR Alaska, Inc. (HDR), to perform surveys and produce the mapping and supporting documentation necessary to navigate the 404 regulatory process. Prior to starting work, NDM contractors coordinated with the U.S. Army Corps of Engineers (USACE) and implemented consistent standards for data collection across the study area.
10.1.2 Study Objectives
The stated objective of the Pebble Project wetlands program is to produce a legally defensible preliminary jurisdictional wetland determination (PJD) report for submission to the USACE with the project’s 404 permit application. The PJD report will document all methods used, provide copies of all data collected, and support the project mapping and eventual rating of wetlands according to the quantitative functional assessment methodology adopted for the project (with USACE approval). The wetlands program will also produce a comprehensive mitigation plan. However, this plan can only be prepared after NDM selects a preferred alternative, the impacts of that development are well defined, and suitable wetland and stream restoration, enhancement, and creation opportunities are identified.
10.1.3 Study Area
As noted above, wetlands work was divided by 3PP and HDR to accommodate NDM’s proposed project schedule. As shown in Figure 10-1, 3PP is evaluating and mapping wetlands along the portions of the road corridor west of the Newhalen River and in significant portions of the NDM claim block, or inner mine area. This includes the upper reaches/watershed of the South Fork of the Koktuli River, portions of the upper reaches/watershed of the North Fork of the Koktuli River, and portions of the Upper Talarik Creek watershed east to the Newhalen River. This area includes approximately 73,000 acres.
10.1.4 Scope of Work
In addition to ongoing project management responsibilities, project meetings, and HDR oversight, 3PP is contracted to provide support to NDM in several areas:
PR Ch 10 Wetlands 10-1 Rev. 0, 10/21/05

DRAFT ENVIRONMENTAL BASELINE STUDIES, 2004 PROGRESS REPORT DRAFT
• Literature Review—library search of Anchorage libraries and online sources for data related to the study area and region.
• Alternatives Analysis—analysis of both direct and indirect impacts related to specific project-component placement and overall project development.
• Field Data Collection—jurisdictional determinations and functional assessments.
• Database Design/Data Entry/Analysis—design, testing, and quality control.
• Digital Mapping—ArcView layers or themes that contain attributes which describe each polygon’s jurisdictional wetland status, vegetation type, hydrogeomorphic (HGM) classification, potential for regulatory exemption under Solid Waste Agency of Northern Cook County v. U.S. Army Corps of Engineers, and if existing disturbance was identified.
• Geographic Information System (GIS) Coordination/Oversight—assist the NDM GIS/Database Study Manager with oversight and resolution of technical issues related to images, and spatial and analysis data.
10.1.5 Methods/Approach
Of the tasks outlined above, only the literature review, alternatives analysis, field data collection, data entry, and digital mapping had well-defined steps or processes for the work conducted in 2004.
10.1.5.1 Literature Review
The literature review conducted by 3PP included the following steps.
• Key words that would trigger successful searches for applicable data were listed (Bristol Bay, Iliamna Lake, etc.).
• Library reference and/or search systems were queried with these words, generating lists of documents with data pertinent to the study area.
• Key portions of documents were copied such that an in-house library index could be constructed.
• Lists of documents that need to be scanned and produced in PDF format for the in-house library were maintained.
10.1.5.2 Alternatives Analysis
The analysis of options based on historical data sources was accomplished in the following manner:
• Historical data sources of interest were identified and processed into spatial layers, with appropriate attributes and metadata documentation.
• These data were reviewed for missing codes/attribute problems.
• Sources were contacted to try and resolve any problems identified so that the analysis layers will be as complete as possible.
• Where possible, costs related to wetland replacement or fees, in lieu of mitigation or reclamation, were associated with major data sources.
PR Ch 10 Wetlands 10-2 Rev. 0, 10/21/05

DRAFT WETLANDS
• AutoCAD drawings which show the footprints of project components were obtained from project engineers and converted into shape files suitable for use with GIS analysis tools.
• Facility-shape files were intersected with the historical data sources to quantify specific impacts that may occur if a specific option were constructed.
• Footprint impacts and related costs were summarized and compared by various options and were presented to NDM.
10.1.5.3 Field Data Collection
As defined in the Draft Environmental Baseline Studies, Proposed 2004 Study Plan (NDM, 2004), the approach to mapping wetlands and vegetation for the Pebble Study area is relatively simple, but involves several major components:
• Collection and review of data from existing sources, including construction of a GIS to analyze, track, and evaluate a variety of data sources, and to prepare high-quality map products.
• Preliminary mapping of wetlands and waterbodies or prospective sampling locations on aerial photographs (where available) or in the GIS.
• Identification in the GIS and on field maps or photos of representative sites for sampling in the field, focusing on complex wetland/upland boundary areas, areas with questionable boundary locations, and areas where multiple sample points can be easily accessed.
• Field verification of preliminary mapping and sampling of representative sites using criteria and indicators found in the 1987 Corps of Engineers Wetland Delineation Manual (USACE, 1987) and in subsequent regulatory guidance related to wetland determinations.
• Collection of data sufficient to conduct a wetland function assessment according to the method selected by the USACE.
• Photographs of any incidental observations of important habitat features, streams, cultural resources, new or existing disturbances, etc.
• Entry of data from jurisdictional wetland determinations and wetland functional assessments into a web-based/accessible relational database. This will allow the data to be analyzed and evaluated much faster, with more built-in quality control measures and options. These data will be integrated into the overall data management system for the project and will provide baseline data on conditions in the study area over the life of the project.
• Field review with regulatory and resource management agency staff prior to starting the final mapping process. The purposes of this review are to familiarize agency reviewers with the study area, discuss the mapping process in more detail, and discuss how problem areas, if encountered, will be addressed during the final mapping process.
• Final mapping of wetlands and waterbodies on digital true-color ortho-rectified photography in the GIS. Final mapping is expected to include designation of mosaics of wetland types (with respect to HGM classes and vegetation types) and wetlands and uplands.
• Polygon coding with respect to potential regulatory exemption under Solid Waste Agency of Northern Cook County v. U.S. Army Corps of Engineers will be based on the connectivity of each polygon to a navigable waterbody (or tributary thereof) in an NDM or U.S. Geological Survey
PR Ch 10 Wetlands 10-3 Rev. 0, 10/21/05

DRAFT ENVIRONMENTAL BASELINE STUDIES, 2004 PROGRESS REPORT DRAFT
GIS stream coverage or to wetlands that abut such waters as shown in the NDM-produced wetland coverage.
• Analysis of wetland functional data and creation of a “rating” layer in the GIS.
• Throughout the project, team wetland scientists are providing input to the evaluation of mine, road, and port alternatives, primarily from a wetland conservation and regulation perspective. These discussions, and follow-up memoranda, will include recommendations on avoidance and minimization measures, including measures to avoid adverse effects on wetlands perceived as having higher functional capacity than others based on the results of the functional assessment and professional judgment. The memoranda may also include professional opinions regarding tradeoffs among resource impacts that will play into developing the least environmentally damaging practicable alternative.
As part of this effort, the wetlands team is performing the following tasks:
• Determine the extent of existing soil and/or vegetation disturbance in the study area to ascertain if there are any outstanding compliance issues that need resolution (in order to expedite future permit-application processing).
• Determine the extent and types of jurisdictional wetlands found in the study area.
• Describe the predominant vegetation types found in the study area and determine the normal prevalence of hydrophytic plant species in each. Vegetation types also are being correlated with the habitat types used in the terrestrial wildlife study and, where appropriate, fish-habitat data.
• Describe the predominant soil types found in the study area and their hydric characteristics and status; contribute data to soil salvage and suitability studies.
• Determine the predominant HGM class of wetlands identified in the study area and describe the primary functions associated with each.
• Apply a quantitative method for determining the functions of wetlands identified in the study area. The methodology being used, as directed by the USACE, is the Rapid Procedure for Assessing Wetland Functional Capacity, Based on Hydrogeomorphic Classification (Magee, 1998). If necessary, this method may be modified to better address specific conditions in the study area, but only in consultation with USACE representatives.
• Develop strategies to avoid and minimize impacts to wetlands associated with potential project facilities.
• With input from other study team members, develop wetland sections of a draft compensatory mitigation plan. Later, this compensation concept will be expanded to include the information described in guidance found in the Corps of Engineers, Alaska District, Special Public Notice 04-07, Final Alaska District Compensatory Mitigation Guidelines (USACE, 2004)
10.1.5.4 Data Entry
After the database was constructed and most testing was completed, 3PP staff and subcontractors began a five-step data-entry process.
PR Ch 10 Wetlands 10-4 Rev. 0, 10/21/05

DRAFT WETLANDS
1. Initial entry of data was completed by clerical staff or field technicians. After successful entry of all data on the form, the clerks marked the “Data Entry Complete” box, moving the plot into the quality control (QC) review mode.
2. Clerks flagged any problems encountered on field forms and presented them to the principal investigator.
3. Principal investigators compared the output of the draft photo reports to make sure that the pictures in the database are correctly associated with the correct field form and that the plot location in the GIS is a reasonable representation of where these data were collected on the ground.
4. Principal investigators reviewed the results of the initial entry, resolved any problems identified by the clerks, and compared their determinations of critical numerical fields with the computer’s calculations, resolving problems as they were identified. When each principal investigator completes their QC review, they must check the “QC Complete” box, indicating that the data entered in the database accurately reflect the field observations.
5. 3PP provided Resource Data Inc. (RDI, the database and GIS managers) with a list of queries designed to identify inconsistencies between various field teams and began the process of cleaning up data fields prone to misspellings and similar errors.
10.1.5.5 Digital Mapping
The digital mapping process typically progresses in the following manner:
• Ortho-photographs are loaded into the GIS by RDI in a manner that accelerates their retrieval and speed during processing. Because of the large size of this study area, orthos were divided into blocks or tiles, and these were grouped into “mapping blocks.”
• Data sources critical to the mapping process (field plot data, existing wetlands and vegetation data, contour data, and existing hydrography data) are loaded into projects and legends are developed for each layer.
• The mapping blocks are divided into even smaller squares, which allows the person doing the mapping to “tie in” to a line rather than creating a complex series of floating polygons.
• To reduce project costs, obvious water lines and abrupt vegetation breaks are drawn by less experienced personnel. Once they complete all the work they are capable of doing in a particular block, it is turned over to one of the principal investigators, who then draw the remaining lines in the less distinct vegetation breaks.
• The files are “scrubbed” by RDI to remove any slivers or donut-hole polygons, which can easily be created during the line-creation process.
• Codes that provide the attributes of a particular polygon are applied by one of the principal investigators on the project.
• Coding is reviewed by another principal as a QC measure. Additionally, assumptions about certain data types consistently being wetlands or uplands are tested. Areas with inconsistencies or unknown attributes are flagged for additional field work.
PR Ch 10 Wetlands 10-5 Rev. 0, 10/21/05

DRAFT ENVIRONMENTAL BASELINE STUDIES, 2004 PROGRESS REPORT DRAFT
• Polygons that are determined to be wetlands are evaluated for point data that provide the attributes necessary to generate a functional assessment rating. Where found, these ratings are applied to the polygon in which the point data were collected.
• Wetland polygons without site specific functional assessment data are flagged for additional field review, but attributes from the nearest polygon with similar features are extrapolated to generate a preliminary rating. This is necessary so that work to balance the effects of project facilities on wetlands can be generated and a preliminary “debit” sheet can be prepared.
• Maps are produced for use in field evaluations and reports that show the preliminary attributes and areas in need of additional field work.
• Additional field work, as well as on-site regulatory review and QC, is completed to refine the mapping where problems are identified.
• Attributes are updated, polygon lines refined, and the final product is again reviewed before being released as final mapping.
10.1.6 Results and Discussion
The results for each major component of the wetlands study for the mine area are described below.
10.1.6.1 Literature Review
An extensive literature search of Anchorage libraries and online sources was conducted to identify reports and technical documents with information about the study area and the Bristol Bay region. Initially, 3PP planned to index these documents for the NDM library; however, NDM decided that instead 3PP should bring batches of documents to NDM for NDM staff to scan and index in-house. This work has been on hold since mid-summer of 2004, pending notification from NDM staff that they are ready to begin this process.
10.1.6.2 Alternatives Analysis
Early meetings with project engineers indicated a need to provide background materials and training on the 404 process. This training was completed in June and included key NDM staff and consultants.
While certain decisions regarding various mine development concepts had been made by project engineers at that time, work was needed to provide a more rounded perspective about the strengths and weaknesses of the various options available. Preliminary input on potential costs related to wetland mitigation and mine reclamation also was needed. To help address this need, a number of historic, but publicly available, data sources was compiled in the project GIS.
3PP next reviewed project files and consulted with other wetland scientists and reclamation specialists in Alaska to obtain known data on potential costs by vegetation or wetland type. These were then input into a large matrix (spreadsheet) that calculates the projected costs for each development option. Currently the matrix contains 104 columns and over 300 rows of data related to various options and costs. The assumptions in this matrix are constantly tested and updated as new information becomes available. Results are provided to NDM and key consultants approximately every two to three months.
PR Ch 10 Wetlands 10-6 Rev. 0, 10/21/05

DRAFT WETLANDS
10.1.6.3 Field Results
The 3PP field program included the following components:
• Establish the data-collection protocol after consultations with USACE and HDR wetland scientists.
• Design field forms.
• Revise global positioning system (GPS) camera scripts, test, and provide GPS camera training to HDR’s teams.
• Procure and organize gear for three teams of wetland scientists.
• Organize travel and field logistics for up to three teams of wetland scientists.
• Crew oversight and problem resolution each evening after field crews returned.
• Picking transect locations and determining which crews were best suited for work in particular areas within the 3PP study area.
During the 2004 field season, crews documented observations at 1,591 locations throughout the study area (Figure 10-1). These observations included 770 routine on-site jurisdictional wetland determinations, which in turn generated approximately 228 wetland functional assessments. In addition to complete determinations, 821 additional photo-documentation points of vegetation, hydrologic, and habitat conditions were recorded. These included 244 stream-crossing series pictures (upstream, downstream, and channel profile), 363 areas with representative upland characteristics (two pictures at each location), 199 areas with representative wetland or seasonal pond characteristics (two pictures at each location), and 15 areas where animal dens, beaver lodges, nests, or other wildlife use was photographed. In total, 4,085 photographs were taken using the Kodak field-imaging GPS camera system, which documents where the pictures were taken and provides a direct interface to the project GIS.
Of the 1,591 observations made, 923 were in the South Fork of the Koktuli zone, 210 were in the North Fork of the Koktuli zone, 284 were in the Upper Talarik Creek zone, and 183 were made between the Newhalen River and the eastern boundary of the Upper Talarik Creek zone. Figure 10-1 shows the boundaries of the zones as defined by NDM.
10.1.6.4 Database Design and Development, and Data Entry
Over the course of the field season, 3PP staff worked closely with database development specialists at RDI to design and test a relational database to house the wetlands data collected. This database is necessary for analyzing the large amounts of data that are necessary to fully document the predevelopment conditions of such a large area. While large areas of homogeneous vegetation certainly exist in the greater study area, the vast majority of the study area is a very complex mosaic of approximately 55 vegetation types (as described by the User’s Guide for Bristol Bay Land Cover Maps, [Wibbenmeyer et al., 1982] and The Alaska Vegetation Classification [Viereck et al, 1992]). Determining how to describe (and define for mapping purposes) these types is a critical component of a successful PJD for such a large study area.
PR Ch 10 Wetlands 10-7 Rev. 0, 10/21/05

DRAFT ENVIRONMENTAL BASELINE STUDIES, 2004 PROGRESS REPORT DRAFT
As the database structures and data entry forms were developed, 3PP staff provided testing and feedback to RDI to make sure of the following:
• The database contained space for all pertinent data.
• Lookup tables and data-entry QC measures were implemented and were working correctly.
• Security measures were in place and functioning.
• Analysis tools were under development.
• Reports to assist in QC of analysis tools were developed and tested.
Data entry into the database began in mid-September; however, as entry progressed, additional needs for QC and data-control measures were identified. These changes are ongoing, and identification continues of places where stricter control measures would result in fewer spelling errors, data misplacements, and the like. All initial data entry was completed during the 2004 calendar year; however, QC review of these data is ongoing.
Significant developments in the lookup/reference table included:
• The master project plant list—includes Latin name, common names, wetland indicator status, stratum under the USACE guidelines, stratum according to the definition in the functional assessment method, and an indication if the plant was previously identified in the Bristol Bay management plan user’s guide (Wibbenmeyer et al, 1982).
• Soil textures and structure types.
• Landforms.
Significant developments in report and analysis tools included:
• Design and reviews of the draft project photo report.
• Design and reviews of the field data-collection report.
• Design and reviews of the draft plant-communities report.
• Design and reviews of the master plant-list report.
• Functional assessment calculations and output.
10.1.6.5 Digital Mapping
No mapping products are sufficiently complete to be presented for review or discussion in this document. The digital mapping process, while underway, was delayed by a later-than-expected delivery in the aerial photography base-mapping, and database construction/data entry issues. However, during November and December of 2004, the following work was completed:
• ArcView projects were built and distributed to wetlands contractors.
• File naming conventions were established and distributed to all project contractors.
PR Ch 10 Wetlands 10-8 Rev. 0, 10/21/05

DRAFT WETLANDS
• The study area was divided into mapping blocks to facilitate sharing of interim sections of mapping data as they are completed.
• Training on digital mapping techniques was provided to select contractor personnel.
• Tools to assist in the mapping process were developed and tested.
• Refinement of the Eagle Hydrology Layer was completed for approximately 60 percent of the inner mine area.
• A process to evaluate all ponds and waterways for attributes critical to the functional assessment methodology was developed. Approximately 40 percent of this work was completed prior to the end of the calendar year.
10.1.6.6 GIS Oversight and Coordination
3PP’s scope of work also includes general coordination and oversight of the project’s GIS contractor, RDI. As such 3PP is responsible for helping to set priorities, establish file-naming conventions and related protocols across the project, direct the analysis of impacts in the GIS environment, identify problems with data output and work with RDI to find resolutions, and work with other team contractors to determine who at RDI can help them find solutions to specific problems. As team members become more familiar with the RDI team, 3PP’s role in this regard will decrease; however, during early project set-up and data distributions much coordination is required, in part to make sure that no duplication of effort is occurring across various study programs.
10.1.7 Summary
While much of the early coordination, protocols, and tools needed to complete this project are complete. The vast majority of work necessary to identify, rate, and map wetlands in the study area remains. Beyond that task the even more difficult and arduous process of trying to balance the functions and values lost through development with feasible and acceptable compensatory mitigation projects remains.
10.2 Road/Port Areas
10.2.1 Introduction
NDM is proposing to develop a gold and copper mine north of Iliamna, Alaska. The Alaska Department of Transportation and Public Facilities (DOT&PF) is in the process of examining alternatives for a road and a port as part of the Industrial Roads Program, also known as “Roads to Resources.” The proposed road and port may be integral to the mine being developed, so effects of the road and port will likely be considered along with the effects of the mine in the environmental impact statement for the project and in the environmental permitting process.
An important part of federal agencies’ evaluation of the mine and road will be the project’s effects on wetlands. This study described in this section has been designed to develop the baseline information needed to determine and document the locations and types of wetlands in the study area for the transportation components (road and port), to describe those wetlands’ ecological functions, to analyze potential impacts of the project on wetlands, and to allow development of measures to mitigate those
PR Ch 10 Wetlands 10-9 Rev. 0, 10/21/05
DRAFT ENVIRONMENTAL BASELINE STUDIES, 2004 PROGRESS REPORT DRAFT
impacts. This report describes the status of the work performed in 2004 for the baseline study of wetlands ecology in the road corridor and at the potential port site. Findings resulting from the 2004 study will be presented at a later time.
10.2.2 Study Objectives
As with the study in the vicinity of the mine site, the objective of the 2004 wetlands study for the road and port was to collect baseline data necessary to prepare and submit a legally defensible PJD report to the USACE Regulatory Branch. This document will be prepared and submitted to the USACE when project plans and alternatives have been adequately defined and evaluated. Another important objective was to collect the information needed to assess impacts to wetlands that might result from development and operation of the road and port.
10.2.3 Study Area
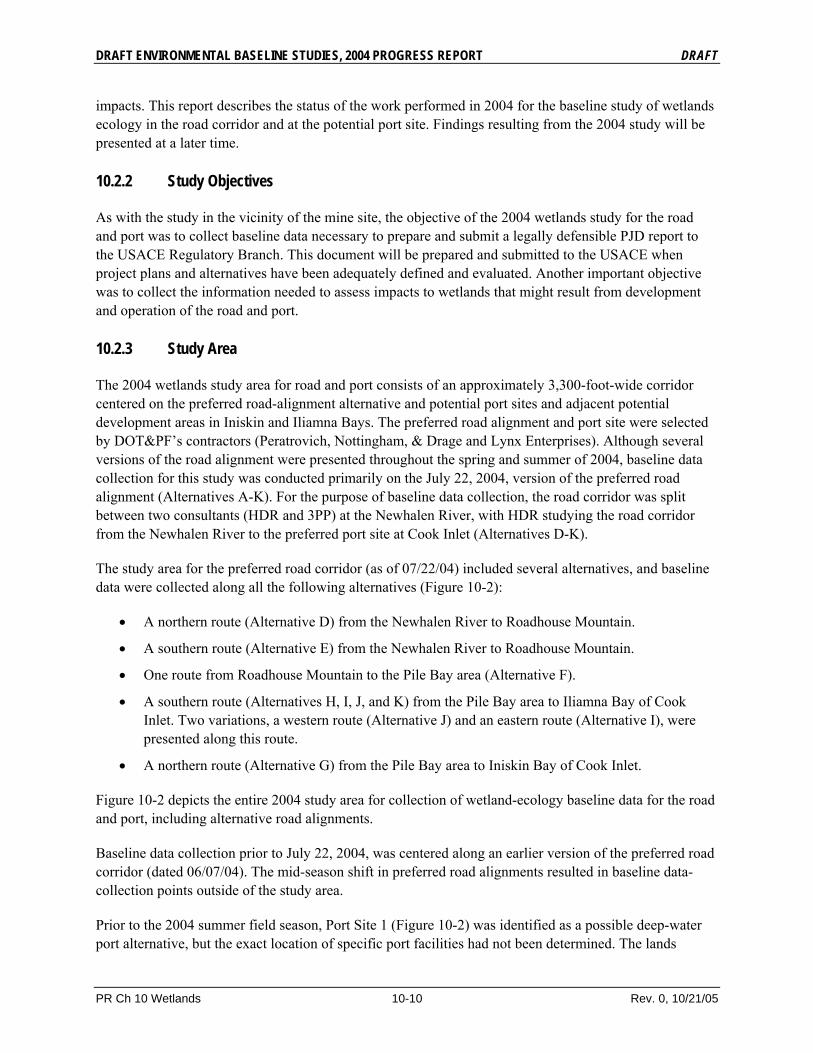
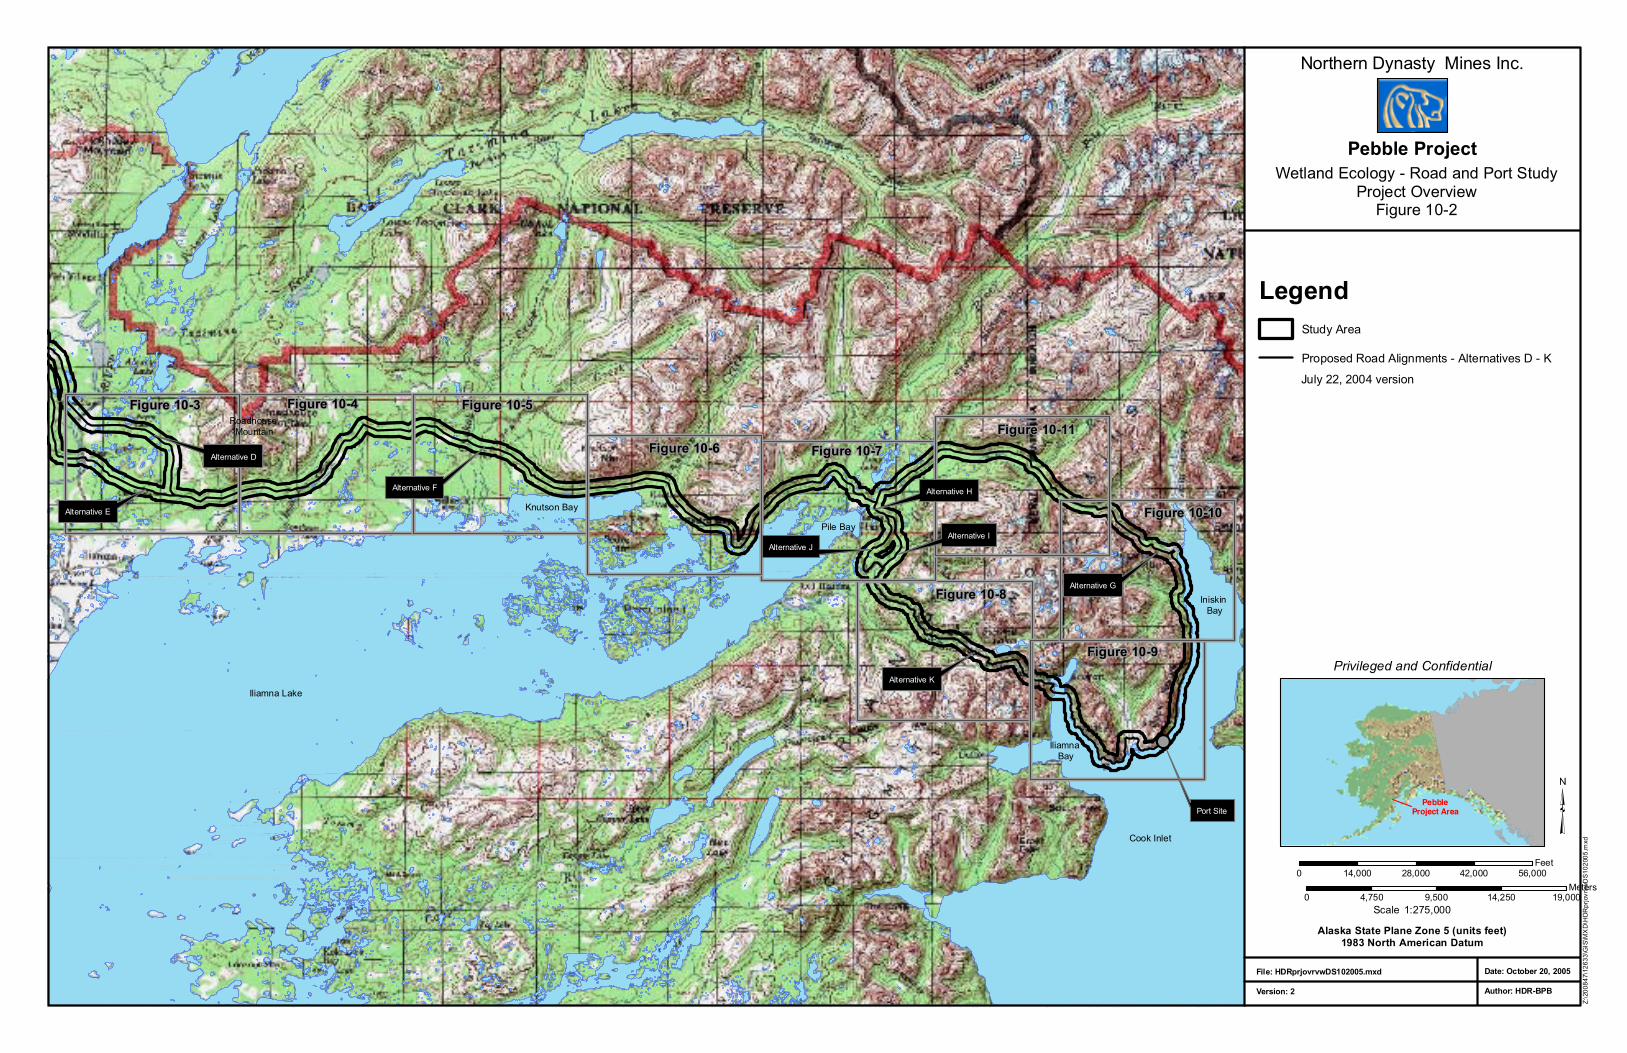
The 2004 wetlands study area for road and port consists of an approximately 3,300-foot-wide corridor centered on the preferred road-alignment alternative and potential port sites and adjacent potential development areas in Iniskin and Iliamna Bays. The preferred road alignment and port site were selected by DOT&PF’s contractors (Peratrovich, Nottingham, & Drage and Lynx Enterprises). Although several versions of the road alignment were presented throughout the spring and summer of 2004, baseline data collection for this study was conducted primarily on the July 22, 2004, version of the preferred road alignment (Alternatives A-K). For the purpose of baseline data collection, the road corridor was split between two consultants (HDR and 3PP) at the Newhalen River, with HDR studying the road corridor from the Newhalen River to the preferred port site at Cook Inlet (Alternatives D-K).
The study area for the preferred road corridor (as of 07/22/04) included several alternatives, and baseline data were collected along all the following alternatives (Figure 10-2):
• A northern route (Alternative D) from the Newhalen River to Roadhouse Mountain.
• A southern route (Alternative E) from the Newhalen River to Roadhouse Mountain.
• One route from Roadhouse Mountain to the Pile Bay area (Alternative F).
• A southern route (Alternatives H, I, J, and K) from the Pile Bay area to Iliamna Bay of Cook Inlet. Two variations, a western route (Alternative J) and an eastern route (Alternative I), were presented along this route.
• A northern route (Alternative G) from the Pile Bay area to Iniskin Bay of Cook Inlet.
Figure 10-2 depicts the entire 2004 study area for collection of wetland-ecology baseline data for the road and port, including alternative road alignments.
Baseline data collection prior to July 22, 2004, was centered along an earlier version of the preferred road corridor (dated 06/07/04). The mid-season shift in preferred road alignments resulted in baseline data-collection points outside of the study area.
Prior to the 2004 summer field season, Port Site 1 (Figure 10-2) was identified as a possible deep-water port alternative, but the exact location of specific port facilities had not been determined. The lands
PR Ch 10 Wetlands 10-10 Rev. 0, 10/21/05

DRAFT WETLANDS
adjacent to the deep-water port site are extremely steep. HDR scientists assumed that any substantial development associated with the port could occur only in a nearby valley (now known as the “Y” valley), so that area was included in the study area.
Land along the road corridor is owned by several Native corporations and the State of Alaska. Land access was granted for baseline data collection within the study area with the exception of the Native allotments. Native allotments are parcels of land owned by individual Alaska Natives for which the Bureau of Indian Affairs (BIA) has a trust responsibility. A permit from the BIA for access to Native allotments within the study area was not obtained during the 2004 season; therefore, baseline data were not collected on Native allotments during 2004.
10.2.4 Scope of Work
The research and field work for this study were conducted during 2004; analysis and mapping of the baseline data continues in 2005. The baseline data collection for the road and port was conducted by three two-person teams led by Anne Leggett (HDR senior biologist), Brandy Bland (HDR biologist), and Jen Sivils (HDR biologist). The study was conducted according to the approach described in the Draft Environmental Baseline Studies, Proposed 2004 Study Plan (NDM, 2004), as summarized below.
• Determine the extent of existing soil/vegetation disturbance in the study area in order to ascertain if there are any outstanding compliance issues that need resolution (in order to expedite future permit-application processing).
• Determine the extent and types of jurisdictional wetlands found in the study area.
• Describe the predominant vegetation types found in the study area, and determine the normal prevalence of hydrophytic vegetation species in each.
• Describe the predominant soil types found in the study area and their hydric status.
• Determine the HGM class of wetlands identified in the study area, and describe the primary functions associated with each.
• Apply a quantitative method for determining the functions of wetlands identified in the study area. The methodology being used, as directed by the USACE, is the Rapid Procedure for Assessing Wetland Functional Capacity, Based on Hydrogeomorphic Classification (Magee, 1998).
• Develop strategies to avoid and minimize impacts to wetlands associated with potential project facilities.
• With input from other study team members, develop wetland sections of a draft compensatory mitigation plan. Later, this compensation concept will be expanded to include the information described in guidance found in the Corps of Engineers, Alaska District, Special Public Notice 04-07, Final Alaska District Compensatory Mitigation Guidelines (USACE, 2004).
10.2.5 Methods
The USACE has requested that data on wetlands at the mine site, along the road corridor, and at other transportation-infrastructure sites be collected and analyzed in a similar manner, using the same degree of
PR Ch 10 Wetlands 10-11 Rev. 0, 10/21/05

DRAFT ENVIRONMENTAL BASELINE STUDIES, 2004 PROGRESS REPORT DRAFT
detail. The methods used to map wetlands and vegetation for this study were described in the 2004 study plan (NDM, 2004). This approach involved the following major steps for data collection and entry for the road/port:
• Collection and review of existing data sources, including construction of a GIS to analyze, track, and evaluate a variety of data sources and to prepare high-quality map products.
• Identification in the GIS and on field maps or photos of representative sites for sampling in the field, focusing on complex wetland/upland boundary areas, areas with questionable boundary locations, and areas where multiple sample points can be easily accessed.
• Field sampling of representative sites using criteria and indicators found in the 1987 Corps of Engineers Wetland Delineation Manual (USACE, 1987) and subsequent regulatory guidance related to wetland determinations. Field sampling was conducted using routine jurisdictional determinations and representative photo points at a rate of four sampling sites per mile of road corridor. Jurisdictional determination data were collected on a modified version of a Routine Wetland Determination Data Form found in the 1987 Corps of Engineers Wetland Delineation Manual. Jurisdictional determination data included a description of the soil type from an approximately 24-inch-deep by 18-inch-wide pit and an evaluation of the vegetation and hydrologic characteristics of the site. An example of a blank Routine Wetland Determination Data Form used to collect data in 2004 is provided in Appendix 10-A.
• Collection of data sufficient to conduct a wetland function assessment according to the method selected by the USACE. The methodology being used is the Rapid Procedure for Assessing Wetland Functional Capacity, Based on Hydrogeomorphic Classification (Magee, 1998). An example of a blank wetland function assessment form used to collect data in 2004 is provided in Appendix 10-B.
• Photographs of any incidental observations of important habitat features, streams, cultural resources, new or existing disturbances, etc.
• Entry of data from jurisdictional wetland determinations and wetland functional assessments into a web-based/accessible relational database. The data will be integrated into the overall data management system for the project and will provide baseline data on conditions in the study area over the life of the project.
Mapping and analysis will occur in 2005.
10.2.6 Results and Discussion
The final study area for the 2004 wetlands ecology study for the road and port baseline included:
• An approximately 3,300-foot-wide corridor, approximately 115 miles long, and
• A total of approximately 45,000 acres of ground-truthed area.
During the 2004 summer field season, three 2-person wetland field teams collected baseline data over a period of five weeks for a total of 13 team-weeks in the field. The teams succeeded in collecting data at the specified rate of one jurisdictional determination plot per 100 acres of study area. The weather conditions in 2004 allowed for efficient data collection and resulted in very little loss of field time. True-
PR Ch 10 Wetlands 10-12 Rev. 0, 10/21/05

DRAFT WETLANDS
color satellite imagery became available part way through the field season and supplemented the color infrared imagery provided at project start-up. The satellite imagery allowed better selection of appropriate sampling locations in certain areas. Difficulties in assembling and operating the combined camera-GPS unit led to loss of some data and the need to collect redundant information during some of the field trips.
Figures 10-3 through 10-11 depict the data-collection locations, including the type of data-collection site, i.e., jurisdictional determination, photo point, or stream crossing. The figures also depict the wetland and upland status of each jurisdictional determination and photo point site. Table 10-1 summarizes the number and wetland/upland status of data-collection areas for the 2004 road/port wetlands ecology study.
During the 2004 field season, hydrologic conditions of the sampled areas may have been influenced by the dry, warm weather in the study area. At many sites, there were dried ponds or vegetation that is typically found in only very wet conditions, but which was rooted in dry ground during the visit. Therefore, during the 2005 field season it may be necessary to conduct limited revisit of areas sampled in 2004 to observe hydrologic conditions in a wetter year.
TABLE 10-1 Road and Port Wetlands Study, Baseline Data Collected, 2004
Data Type Number
Jurisdictional Determination Plots
Wetlands 168
Uplands 247
Transitional Wetlands 15
Transitional Uplands 17
Total Jurisdictional Determination Plots 447
Photo Points
Wetlands 163
Uplands 64
Data lost due to camera failure 10
Total Photo Points 237
Total Stream Crossings 64
Total Number of Sites 748
Land-access constraints led to some inefficient data collection. These constraints included the following:
• Access to a majority of the study area was obtained incrementally. Work did not proceed in a linear manner from one end of the corridor to the other, but was done according to timing of land-use agreements. This made it more difficult to plan efficiently and, because the corridor includes a few major ecosystem types, to ultimately understand the patterns of landform and vegetation that indicate wetland or upland conditions in each ecosystem. It also resulted in more than one field team working in each ecosystem type simultaneously, making it more difficult to track and meet specific vegetation sampling goals by vegetation type.
PR Ch 10 Wetlands 10-13 Rev. 0, 10/21/05

DRAFT ENVIRONMENTAL BASELINE STUDIES, 2004 PROGRESS REPORT DRAFT
• Two corridor landowners required an observer representing them to accompany each field team. This limited teams’ flexibility for changing sampling plans to accommodate weather or helicopter logistics because of the need to request the observer in advance. Additional time and helicopter support were also required to transport the observer.
• A BIA permit to access to Native allotments was not obtained in 2004; therefore, helicopter landing areas and efficient on-the-ground travel in some areas was limited.
Because of some of the challenges described above, during the 2005 field season it may be necessary to conduct limited additional sampling within the corridors sampled in 2004 to fill in gaps in the baseline data.
10.2.7 Summary
Baseline data for the road/port wetlands ecology study were successfully collected along the July 22, 2004, version of the preferred road alignment (Alternatives D-K) and at the mouth of the Y Valley for Port Site 1. Data from a total of 447 jurisdictional determination plots were collected within approximately 45,000 acres of area, which achieved the rate of one jurisdictional determination plot per 100 acres of study area specified in the 2004 study plan (NDM, 2004). A few minor challenges, including hydrologic conditions and land ownership constraints, may require limited additional sampling of the 2004 sampling area to be conducted during the 2005 field season.
Data entry and analysis of the baseline data began late in 2004. Results of the analysis will be presented subsequently.
10.3 References Magee, D.W. 1998. A Rapid Procedure for Assessing Wetland Functional Capacity, Based on
Hydrogeomorphic (HGM) Classifications. Normandeau Associates. Bedford, NH. February 1998. 190 p.
Northern Dynasty Mines, Inc. (NDM). 2004. Draft Environmental Baseline Studies, Proposed 2004 Study Plan.
U.S. Army Corps of Engineers (USACE). 2004. Special Public Notice 04-07, Final Alaska District Compensatory Mitigation Guidelines. http://www.poa.usace.army.mil/reg/SPN_Scanned/SPN-2004-07.pdf
———. 1987. Corps of Engineers Wetlands Delineation Manual. Wetlands Research Program Technical Report Y-87-1. Department of the Army Waterways Experiment Station. January 1987.
Viereck, L.A., C.T. Dryness, A.R. Batten, and K.J. Wenzlick. 1992. The Alaska Vegetation Classification. General Technical Report PNW-GTR-286. U.S. Department of Agriculture, Forest Service, Pacific Northwest Research Station. Portland, Oregon. 278 p.
Wibbenmeyer, M., J. Grunblatt, and L. Shea. 1982. User’s Guide for Bristol Bay Land Cover Maps. Bristol Bay Cooperative Management Plan. November 1982.
PR Ch 10 Wetlands 10-14 Rev. 0, 10/21/05

DRAFT WETLANDS
FIGURES

04S36W36
04S36W36
05S37W
1
05S37W
1
03S36W
1
03S36W
1
03S36W36
03S36W36
02S36W36
02S36W36
04S36W
1
04S36W
1
05S36W
1
05S36W
1
04S35W36
04S35W36
03S35W
1
03S35W
1
03S35W36
03S35W36
02S35W36
02S35W36
04S35W
1
04S35W
1
05S35W
1
05S35W
1
03S34W
1
03S34W
1
04S34W36
04S34W36
03S34W36
03S34W36
02S34W36
02S34W36
05S34W
1
05S34W
1
04S34W
1
04S34W
1
04S35W31
04S35W31
04S34W31
04S34W31
04S33W31
04S33W31
04S35W
6
04S35W
6
04S34W
6
04S34W
6
04S33W
6
04S33W
6
03S35W31
03S35W31
03S34W31
03S34W31
03S33W31
03S33W31
03S35W
6
03S35W
6
03S34W
6
03S34W
6
03S33W
6
03S33W
6
02S35W31
02S35W31
02S34W31
02S34W31
02S33W31
02S33W31
05S36W
6
05S36W
6
05S35W
6
05S35W
6
05S34W
6
05S34W
6
05S33W
6
05S33W
6
02S33W36
02S33W36
03S33W
1
03S33W
1
03S33W36
03S33W36
04S33W
1
04S33W
1
04S33W36
04S33W36
02S36W31
02S36W31
03S36W
6
03S36W
6
03S36W31
03S36W31
04S36W
6
04S36W
6
04S36W31
04S36W31
55 44
88
88
33
99
99
22
88
55
99
44
55
33
44
22
55
33
44
88
22
88
33
99
88
22
99
55
55
99
44
44
33
55
33
44
22
22
33
88
88
22
99
55
99
88
44
55
99
55
33
44
44
22
33
33
22
88
88
22
99
99
55
88
44
99
55 44 33 22
77 77 77
77 77 77
77 77 77 77
3232 3333 3434
2424
1313
2929
1212
2020
1717
3232
2929
2020
1717
3535
3232
2828
2121
1616
3333
2828
2121
1616
3333
2020
1717
2727
2222
1515
1010
3434
2727
2222
1515
1010
3434
2121
1616
2626
2323
1414
1111
3535
2626
2323
1414
3232
1111
3535
2222
1515
1010
2525
2424
1313
1212
2525
2424
3333
1313
1212
2323
1414
1111
2424
1313
1212
2929
2020
1717
3434
3232
2929
2020
1717
2828
2121
3232
1616
3535
2020
3333
1717
2828
2121
1616
2727
2222
3333
1515
1010
3434
2121
1616
2727
2222
1515
2626
1010
2323
1414
3434
1111
3535
2222
2626
2323
1515
1414
1111
1010
3535
2525
2424
1313
1212
3232
2525
2323
2424
1414
1313
1212
1111
3333
2424
1313
1212
2929
2020
1717
3232
2929
2020
1717
3232
2828
2121
1616
3434
3333
2828
2121
1616
2020
1717
3333
2727
1515
2222
1010
3535
3434
2727
2222
1010
1515
3434
2121
1616
2626
1414
2323
1111
3535
2323
2626
1111
1414
3535
1010
1515
2222
2525
1313
2424
1212
2525
2424
1212
1313
1111
2323
1414
3232 3333
1212
2929
1717
2020
1313
2424
3232
2929
2020
1717
3232
2828
1616
2121
3434
3333
2828
2121
1616
3333
2727
1010
2222
1515
3535
3434
1717
2020
2727
2222
1515
1010
3434
2626
1111
1414
2323
3535
2323
2626
1616
1414
1111
2121
3535
30303030 3030
1919 1919 1919
1818 1818 1818
3030 3030 3030
1919 1919 1919
18181818 1818
1919 1919 1919 1919
1818 1818 1818 1818
22 33
28282929252526262727282829292525 252526262929 27272828 303028282727 29292626 2525
28282929 2727 26262525 25252626
3030
2727 2929
3030
2828 28282929 2727
3030
2626 25253030 3030 2929
77
2828 2727
77
3030 2626
1111
1414
2323
1212
1313
2424
2525
1212
1313
1010
2424
1515
2525
2222
1818
1919
3030
1818
1919
3030
2626
2525
2727
3030
Upper Talarik Creek ZoneUpper Talarik Creek Zone
South Fork Koktuli ZoneSouth Fork Koktuli Zone
North Fork Koktuli ZoneNorth Fork Koktuli Zone
Chulitna ZoneChulitna Zone
155°28'0"W
155°28'0"W
155°24'0"W
155°24'0"W
155°20'0"W
155°20'0"W
155°16'0"W
155°16'0"W
155°12'0"W
155°12'0"W
155°8'0"W
155°8'0"W
155°4'0"W
155°4'0"W
155°0'0"W
155°0'0"W
154°56'0"W
154°56'0"W59
°44'
0"N
59°4
4'0"
N
59°4
8'0"
N
59°4
8'0"
N
59°5
2'0"
N
59°5
2'0"
N
59°5
6'0"
N
59°5
6'0"
N
Legend
3PP Study Area
3PP 2004 Field PlotsNon-Wetland Field PlotNon-Wetland Transitional Field PlotRepresentative Upland Field PhotographsWetland Field PlotWetland Transitional Field PlotRepresentative Wetland Field PhotographsStream Crossing PhotosOther Photo Points
NDM Catchments Basins
Pit Outline
DOT&PF Proposed Road Routes (7/27/04)
ILIC8 ILIC7 ILIC6 ILIC5
ILID8
ILID7 ILID6ILID5
DILD1
XLCA8 XLCA7 XLCA6 XLCA5
0 1 2 3 4
Miles
1:115,000Scale
Privileged and Confidential
Alaska State Plane Zone 5 (units feet)1983 North American Datum
Date: January 31, 2005
Author: RDI-LS
File: RDI_3PP_PRFig10-1_11X17L_1of1_D01.mxd
Version: 1
2004 Wetlands Study Area, 3PP
Figure 10-1
Pebble Project
Northern Dynasty Mines Inc.
!
Alternative F
Alternative G
Figure 10-11
Figure 10-10
Figure 10-9
Figure 10-8
Figure 10-7Figure 10-6
Figure 10-5Figure 10-4Figure 10-3
Port Site
Iliamna Lake
Pile Bay
RoadhouseMountain
Knutson Bay
IniskinBay
Cook Inlet
IliamnaBay
Alternative D
Alternative E
Alternative K
Alternative H
Alternative JAlternative I
PebbleProject Area
0 4,750 9,500 14,250 19,000Meters
³0 14,000 28,000 42,000 56,000
Feet
1:275,000Scale
Privileged and Confidential
Alaska State Plane Zone 5 (units feet)1983 North American Datum
Date: October 20, 2005
Author: HDR-BPB
File: HDRprjovrvwDS102005.mxd
Version: 2
Pebble Project
Northern Dynasty Mines Inc.
Wetland Ecology - Road and Port StudyProject OverviewFigure 10-2
Z:\200847\12633\GIS\MXD\HDRprjovrvwDS102005.mxd
LegendStudy Area
Proposed Road Alignments - Alternatives D - K
July 22, 2004 version

Newhalen River
Newhalen River
Alternative F
Alternative D
Alternative E
0 600 1,200 1,800 2,400Meters
0 2,000 4,000 6,000 8,000Feet
1:40,000Scale
Privileged and Confidential
Alaska State Plane Zone 5 (units feet)1983 North American Datum
Date: February 7, 2005
Author: HDR-BPB
File: HDRwetlandpts10_2.mxd
Version: 1
Pebble Project
Northern Dynasty Mines Inc.
Wetland Ecology - Road and Port Study2004 Field Sample Locations
Figure 10-3
Z:\
200
847\
126
33\
GIS
\MX
D\H
DR
we
tland
pts
10_
2
LegendJurisdictional Determination - Wetlands
Jurisdictional Determination - Transitional Wetlands
Photo Points - Wetlands
Jurisdictional Determination - Uplands
Jurisdictional Determination - Transitional Uplands
Photo Points - Uplands
Stream Crossings
Study Area
Proposed Road Alignment Alternatives
July 22, 2004 version

Roadhouse Mountain
Roadhouse Mountain
Alternative F
0 600 1,200 1,800 2,400Meters
0 2,000 4,000 6,000 8,000Feet
1:40,000Scale
Privileged and Confidential
Alaska State Plane Zone 5 (units feet)1983 North American Datum
Date: February 7, 2005
Author: HDR-BPB
File: HDRwetlandpts10_3.mxd
Version: 1
Pebble Project
Northern Dynasty Mines Inc.
Wetland Ecology - Road and Port Study2004 Field Sample Locations
Figure 10-4
Z:\
200
847\
126
33\
GIS
\MX
D\H
DR
we
tland
pts
10_
3
LegendJurisdictional Determination - Wetlands
Jurisdictional Determination - Transitional Wetlands
Photo Points - Wetlands
Jurisdictional Determination - Uplands
Jurisdictional Determination - Transitional Uplands
Photo Points - Uplands
Stream Crossings
Study Area
Proposed Road Alignment Alternatives July 22, 2004 version

Iliamna LakeIliamna Lake
Knutson BayKnutson Bay
Canyon Creek
Canyon Creek
Alternative F
0 600 1,200 1,800 2,400Meters
0 2,000 4,000 6,000 8,000Feet
1:40,000Scale
Privileged and Confidential
Alaska State Plane Zone 5 (units feet)1983 North American Datum
Date: February 7, 2005
Author: HDR-BPB
File: HDRwetlandpts10_4.mxd
Version: 1
Pebble Project
Northern Dynasty Mines Inc.
Wetland Ecology - Road and Port Study2004 Field Sample Locations
Figure 10-5
Z:\
200
847\
126
33\
GIS
\MX
D\H
DR
we
tland
pts
10_
4
LegendJurisdictional Determination - Wetlands
Jurisdictional Determination - Transitional Wetlands
Photo Points - Wetlands
Jurisdictional Determination - Uplands
Jurisdictional Determination - Transitional Uplands
Photo Points - Uplands
Stream Crossings
Study Area
Proposed Road Alignments Alternatives
July 22, 2004 version

Knutson Mountain
Knutson Mountain
Pedro BayPedro Bay
Knutso
nCre
ek
Knutso
nCre
ek
Knutson BayKnutson Bay
Iliamna LakeIliamna Lake
Alternative F
0 600 1,200 1,800 2,400Meters
0 2,000 4,000 6,000 8,000Feet
1:40,000Scale
Privileged and Confidential
Alaska State Plane Zone 5 (units feet)1983 North American Datum
Date: February 7, 2005
Author: HDR-BPB
File: HDRwetlandpts10_5.mxd
Version: 1
Pebble Project
Northern Dynasty Mines Inc.
Wetland Ecology - Road and Port Study2004 Field Sample Locations
Figure 10-6
Z:\
200
847\
126
33\
GIS
\MX
D\H
DR
we
tland
pts
10_
5
LegendJurisdictional Determination - Wetlands
Jurisdictional Determination - Transitional Wetlands
Photo Points - Wetlands
Jurisdictional Determination - Uplands
Jurisdictional Determination - Transitional Uplands
Photo Points - Uplands
Stream Crossings
Study Area
Proposed Road Alignments Alternatives
July 22, 2004 version

Pile BayPile Bay
PileRiver
PileRiver
Alternative F
Alternative G
Alternative K
Iliamna River
Iliamna River
Iliamna LakeIliamna Lake
Alternative H
Alternative J
Alternative I
0 600 1,200 1,800 2,400Meters
0 2,000 4,000 6,000 8,000Feet
1:40,000Scale
Privileged and Confidential
Alaska State Plane Zone 5 (units feet)1983 North American Datum
Date: February 7, 2005
Author: HDR-BPB
File: HDRwetlandpts10_6.mxd
Version: 1
Pebble Project
Northern Dynasty Mines Inc.
Wetland Ecology - Road and Port Study2004 Field Sample Locations
Figure 10-7
Z:\
200
847\
126
33\
GIS
\MX
D\H
DR
we
tland
pts
10_
6
July 22, 2004 version
LegendJurisdictional Determination - Wetlands
Jurisdictional Determination - Transitional Wetlands
Photo Points - Wetlands
Jurisdictional Determination - Uplands
Jurisdictional Determination - Transitional Uplands
Photo Points - Uplands
Stream Crossings
Study Area
Proposed Road Alignment Alternatives

Alternative K
0 600 1,200 1,800 2,400Meters
0 2,000 4,000 6,000 8,000Feet
1:40,000Scale
Privileged and Confidential
Alaska State Plane Zone 5 (units feet)1983 North American Datum
Date: February 7, 2005
Author: HDR-BPB
File: HDRwetlandpts10_7.mxd
Version: 1
Pebble Project
Northern Dynasty Mines Inc.
Wetland Ecology - Road and Port Study2004 Field Sample Locations
Figure 10-8
Z:\
200
847\
126
33\
GIS
\MX
D\H
DR
we
tland
pts
10_
7
LegendJurisdictional Determination - Wetlands
Jurisdictional Determination - Transitional Wetlands
Photo Points - Wetlands
Jurisdictional Determination - Uplands
Jurisdictional Determination - Transitional Uplands
Photo Points - Uplands
Stream Crossings
Study Area
Proposed Road Alignments Alternatives July 22, 2004 version

Y ValleyY Valley
Iniskin BayIniskin Bay
Cook InletCook Inlet
Iliamna BayIliamna Bay
Alternative G
Alternative K
Port Site 1
0 600 1,200 1,800 2,400Meters
0 2,000 4,000 6,000 8,000Feet
1:40,000Scale
Privileged and Confidential
Alaska State Plane Zone 5 (units feet)1983 North American Datum
Date: February 7, 2005
Author: HDR-BPB
File: HDRwetlandpts10_8.mxd
Version: 1
Pebble Project
Northern Dynasty Mines Inc.
Wetland Ecology - Road and Port Study2004 Field Sample Locations
Figure 10-9
Z:\
200
847\
126
33\
GIS
\MX
D\H
DR
we
tland
pts
10_
8
LegendJurisdictional Determination - Wetlands
Jurisdictional Determination - Transitional Wetlands
Photo Points - Wetlands
Jurisdictional Determination - Uplands
Jurisdictional Determination - Transitional Uplands
Photo Points - Uplands
Stream Crossings
Study Area
Proposed Road Alignment Alternatives July 22, 2004 version

Iniskin BayIniskin Bay
Alternative G
0 600 1,200 1,800 2,400Meters
0 2,000 4,000 6,000 8,000Feet
1:40,000Scale
Privileged and Confidential
Alaska State Plane Zone 5 (units feet)1983 North American Datum
Date: February 7, 2005
Author: HDR-BPB
File: HDRwetlandpts10_9.mxd
Version: 1
Pebble Project
Northern Dynasty Mines Inc.
Wetland Ecology - Road and Port Study2004 Field Sample Locations
Figure 10-10
Z:\
200
847\
126
33\
GIS
\MX
D\H
DR
we
tland
pts
10_
9
LegendJurisdictional Determination - Wetlands
Jurisdictional Determination - Transitional Wetlands
Photo Points - Wetlands
Jurisdictional Determination - Uplands
Jurisdictional Determination - Transitional Uplands
Photo Points - Uplands
Stream Crossings
Study Area
Proposed Road Alignments Alternatives
July 22, 2004 version

Iliamna River
Iliamna River
Alternative G
0 600 1,200 1,800 2,400Meters
0 2,000 4,000 6,000 8,000Feet
1:40,000Scale
Privileged and Confidential
Alaska State Plane Zone 5 (units feet)1983 North American Datum
Date: February 7, 2005
Author: HDR-BPB
File: HDRwetlandpts10_10.mxd
Version: 1
Pebble Project
Northern Dynasty Mines Inc.
Wetland Ecology - Road and Port Study2004 Field Sample Locations
Figure 10-11
Z:\
200
847\
126
33\
GIS
\MX
D\H
DR
we
tland
pts
10_
10
LegendJurisdictional Determination - Wetlands
Jurisdictional Determination - Transitional Wetlands
Photo Points - Wetlands
Jurisdictional Determination - Uplands
Jurisdictional Determination - Transitional Uplands
Photo Points - Uplands
Stream Crossings
Study Area
Proposed Road Alignments Alternatives July 22, 2004 version

APPENDIX 10-A Routine Wetland Determination Data Form

HDR Alaska, Inc./Northern Dynasty Mines, Inc.
GPS Lat: Data Form Plot No: HDR _____ GPS Long: Routine Wetland Determination Wetland Status: ____ GPS Elev: &
Rapid Procedure for Assessing Wetland Functional Capacity
Project/Site: Pebble Gold Copper Project___________________ Applicant/Owner: Northern Dynasty Minerals, Inc._____________ Investigator: 1) ____________2)_____________ 3)___________ Do Normal Circumstances Exist on the Site? YES NO Is the Site Significantly Disturbed (Atypical Situation)? YES NO Is the Area a Potential Problem Area? YES NO Approx. Distance to Nearest Disturbance (ft) _______________ Type of Disturbance (if any) ___________________________
Date: _________/__________/____________ County: ________________________________ State: Alaska Watershed: ______________________________ Paper Plot/Tile No: ________of______________ Ortho No: _________ Air Photo No: _________ Township: _________ Range: _____________ Section: __________ Quad No.: ____________ General Location:_________________________________
Vegetation
Species COE Strat
Ind. Stat
% Cov
Tree Ht/
DBH
Magee Strat Species COE
Strat Ind. Stat
% Cov
Tree Ht/
DBH
Magee Strat
1. 9. 2. 10. 3. 11. 4. 12. 5. 13. 6. 14. 7. 15. 8. 16. Percent of Dominant Species that are OBL, FACW, or FAC (Excluding FAC-): Vegetation Comments: ___________________________________________________________________ % By Stratum (Magee) – Wetlands Only Tree (>5”dbh, >6m) ____ SAP = Sapling (<5”dbh,<6m) ___ TS = Tall Shrb (2-6 m) ____ SS=Shrt Shrb (0.5-2 m) ____ DS = Dwf Shrb (<0.5 m) ____ TH = Tall Herb (≥ 1m) ____ SH = Short Herb (<1 m) ____ ML = Moss-Lichen ____ F = Floating ____ SUB = Submerged ____ Number of Layers ____
Final BBMP Veg Type: ______________________________________ Field BBMP Veg Type: ___________________ Field JDWet_Code: ___________________ Field ENWI Code: ___________________ Mapped EROS Veg Type: ________________ Trace = <3 Percent Method: 50/20 Stratum (relative cover)
Hydrology ___X___ Recorded Data (Describe in Remarks): _______ Stream, Lake, or Tide Gauge ___X___ Aerial Photographs (Years: 1978, __________) _______Other _______ No Recorded Data Available Field Observations (inches): Depth of Surface Water: _____________________________ Depth to Free Water/Ice in Pit: H2O:_________ Ice:________ Depth to Saturated Soil: _____________________________
Wetland Hydrology Indicators: Primary Indicators: _______ Inundated _______ Saturated in Upper 12 Inches _______ Water Marks _______ Drift Lines _______ Sediment Deposits _______ Drainage Patterns in Wetlands (describe below) Secondary Indicators ( 2 or more required): _______ Oxidized Root Channels in Upper 12” _______ Water-Stained Leaves _______ Local Soil Survey Data _______ FAC- Neutral Test (FACW+OBL>FACU+U) _______ Other (Explain in comments)
Hydrology Comments: Comments on isolation status:
Aspect (Degrees): ____________(Direction):________ Percent Slope: ________________________________ Elevation (ft; from altimeter):______________________ Landform: ____________________________________ Topography: __________________________________ HGM Class: __________________________________

HDR Alaska, Inc./Northern Dynasty Mines, Inc.
Soils Plot No: HDR ______
Soil Survey Map Unit Name: _________________________ Field Field Taxonomy (Series and Phase): ________________________________ Drainage Class: ________ (Subgroup): ____________________________________________ Soil Profile Description: Colors Moist Unless Otherwise Noted Depth Horizon Matrix Feature ------------Mottles & Other Features----------- ------------------------Matrix------------------------ Coarse (Inches) Name Color(s) - (Percent) Type Color Abundance Size Contrast Texture Structure Roots Frags (%) pH HC# ______ _____ ________________ ____ _______ ______ ____ ______ _______ _______ _________ _____ ____ ___ ______ _____ ________________ ____ _______ ______ ____ ______ _______ _______ _________ _____ ____ ___ ______ _____ ________________ ____ _______ ______ ____ ______ _______ _______ _________ _____ ____ ___ ______ _____ ________________ ____ _______ ______ ____ ______ _______ _______ _________ _____ ____ ___ ______ _____ ________________ ____ _______ ______ ____ ______ _______ _______ _________ _____ ____ ___ ______ _____ ________________ ____ _______ ______ ____ ______ _______ _______ _________ _____ ____ ___ ______ _____ ________________ ____ _______ ______ ____ ______ _______ _______ _________ _____ ____ ___ ______ _____ ________________ ____ _______ ______ ____ ______ _______ _______ _________ _____ ____ ___ ______ _____ ________________ ____ _______ ______ ____ ______ _______ _______ _________ _____ ____ ___ Horizon Comments (HC#) 1. 4. 2. 5. 3. 6. COE 1987 Manual Hydric Soil Indicators: Other Soil Observations: __________ Histosol (16+” and saturated) _______ Gleyed or Low-Chroma Colors (explain if necessary) Depth of Organic Mat (inches) _________________ __________ Histic Epipedon (8-16” and sat’d) _______ High Organic Content Surface Layer Sandy Soils Depth to Permafrost (inches) _________________ __________ Sulfidic Odor (at depth: _____) _______ Organic Streaking in Sandy Soils Major Rooting Zone (inches) _________________ __________ Aquic Moisture Regime _______ Listed on Local Hydric Soils List Soil Temperature (12” Below Surface) ___________(ºF) __________ Reducing Conditions (based on: _______ Listed on National Hydric Soils List Cryoturbated? _______________________________ __________ Hydric Per 1987 COE Manual? (explain if necessary) Thixotropic? _________________________________ NRCS-NTCHS: AK 2003 Non-Sandy – Sandy – Problem Indicator #:_____________ Profile Comments: _____________________________________________________________ AK 2004 Indicator #:________________________ _____________________________________________________________________________ Hydric Per NRCS Field Taxonomy? ______ _____________________________________________________________________
Wetland Determination
Hydrophytic Vegetation Present? Yes No No (50) Is this Sampling Point Within a Wetland? Yes Yes – Transitional Wetland Hydrology Present? Yes No Marginal No No – Transitional Hydric Soils Present? Yes No Marginal Remarks: Plot Photographs Are: Digital ______ APS/Other ______ Both ______ APS Roll #: ____________ Site Marked on Map? ___________________________ Site Flagged? __________
Wildlife Observations: Engineering Concerns:

APPENDIX 10-B Wetland Function Assessment Data Form

Plot No: HDR _____
HDR Alaska, Inc./Northern Dynasty Mines, Inc.
Answer for the veg polygon: MISC. FACTORS □ Public ownership □ Wildlife Management Area □ Fisheries Management Area □ Historic/archaeologic area □ Designated State or Federal
Protected Wetland □ Documented habitat for listed species □ Regionally scarce wetland category □ Recreational Use Area □ Subsistence Use Area ------------------------------------------------------
LANDSCAPE VARIABLES Size: ~ _________ (acres) □ Small (<10 acres) □ Medium (10 -100 acres) □ Large (>100 acres) ------------------------------------------------------ Ratio of Wetland Area to Watershed Area □ High (>10%) □ Low (<10%) ------------------------------------------------------ Wetland Juxtaposition □ Connected up & downstream □ Only connected above □ Only connected below □ Other wetlands nearby, but not connected □ Wetland isolated ------------------------------------------------------ Watershed Land Use □>50% urbanized □25-50% urbanized □ 0-25% urbanized ------------------------------------------------------ Wetland Land Use □ High intensity (agriculture) □ Moderate intensity (forestry) □ Low intensity (open space) ------------------------------------------------------
SOIL VARIABLES □ Soil lacking □ Histosol: Fibric □ Mineral Gravelly □ Histosol: Hemic □ Mineral: Sandy □ Histosol: Sapric □ Mineral: Silty
□ Mineral: Clayey Geology: Surficial: ___________________ Bedrock: ___________________ ------------------------------------------------------
HYDROLOGIC VARIABLES Surficial Deposit Under Wetland □ Low permeability stratified □ High permeability stratified □ Glacial till ------------------------------------------------------ Microrelief of Wetland Surface □ Pronounced >45 cm (>17.7 in.) □ Well developed 15-45 cm (5.9-17.7 in.) □ Poorly developed <15cm (<5.9 in.) □ Absent
Wetland Water Regime □ Wet: Perm. flooded, Intermittently Exposed, Semiperm’y Flooded □ Drier: Seasonally Flooded, Temporarily Flooded, Saturated -------------------------------------------------- Surface Water Level Fluctuation □ High fluctuation □ Low fluctuation □ Never inundated -------------------------------------------------- Overbank Flooding Frequency Return interval: □ > 5 yrs □ 2-5 yrs □ 1-2 yrs □ No overbank flooding -------------------------------------------------- Evidence of Sedimentation □ No evidence □ Fluvaquent soils □ Sediment observed on substrate --------------------------------------------------Basin Topographic Gradient □ High gradient (>2%) □ Low gradient (<2%) -------------------------------------------------- Degree of Outlet Restriction □ Restricted outflow □ Unrestricted outflow □ No outflow -------------------------------------------------- Inlet/Outlet Class □ No inlet/No outlet □ No inlet/Intermittent outlet □ No inlet/Perennial outlet □ Intermittent inlet/No outlet □ Intermittent inlet/Intermittent outlet □ Intermittent inlet/Perennial outlet □ Perennial inlet/No outlet □ Perennial inlet/Intermittent outlet □ Perennial inlet/Perennial outlet -------------------------------------------------- Water pH □ No water □ Acid <5.5 □ Alkaline >7.4 □ Circumneutral 5.5-7.4 -------------------------------------------------- Nested Piezometer Data □ Recharge □ Discharge □ Horizontal flow □ Not available -------------------------------------------------- Relationship of Wetland’s Substrate Elev. to Regional Piezometric Surface □ Piezometric surface above or at substrate elevation □ Piezometric surface below substrate elevation □ Not available -------------------------------------------------- Evidence of Seeps & Springs □ No seeps or springs □ Seeps □ Perennial spring □ Intermittent spring
VEGETATION VARIABLES
Primary Vegetation Type □ Vegetation lacking □ Forested-evergreen-needle leaved □ Forested-deciduous-broad leaved □ Forested-deciduous-needle leaved □ Scrub shrub-evergreen-broadleaved □ Scrub shrub-evergreen-needleleaved □ Scrub shrub-deciduous-broadleaved □ Scrub shrub-deciduous-needleleaved □ Emergent – persistent □ Non-Per □ Aquatic bed ------------------------------------------------------ Number of Veg. Types: _________ □ Even distribution □ Moderately even distribution □ Highly uneven distribution ------------------------------------------------------ Veg. Density/Dominance (total cover) □ Sparse (0-20%) □ Low density (20-40%) □ Medium density (40-60%) □ High density (60-80%) □ Very high density (80-100%) ------------------------------------------------------ Vegetative Interspersion □ High (small groupings, diverse and interspersed) □ Moderate (broken irregular rings) □ Low (large patches, concentric rings) ------------------------------------------------------Plant Species Diversity □ Low (1-2 plots sampled) □ Medium (3-4 plots sampled) □ High (5 or more plots sampled) ------------------------------------------------------ Proportion of Animal Food Plants □ Low (5-25% Cover) □ Medium (25-50% Cover) □ High (>50% Cover) ------------------------------------------------------ Cover Distribution □ Continuous cover □ Small scattered patches □ 1 or more large patches, part open □ Solitary scattered stems ------------------------------------------------------ Interspersion of Cover & Open Water □ 25-75% scattered or peripheral □ >75% scattered or peripheral □ <25% scattered or peripheral □ 100% cover or open water ------------------------------------------------------ Presence of Islands □ Several to many □ One or few □ Absent ------------------------------------------------------ Dead Woody Material □ Abundant (>50 % wetland surface) □ Moderate abundance (25-50% of surface) □ Low abundance (0-25% of surface)