Draft Environmental Assessment of a Marine … Environmental Assessment of a Marine Geophysical...
153
Draft Environmental Assessment of a Marine Geophysical Survey (MATRIX) by the US Geological Survey in the Northwestern Atlantic Ocean, August 2018 Prepared by the U.S. Geological Survey, Coastal and Marine Geology Program March 2018
Transcript of Draft Environmental Assessment of a Marine … Environmental Assessment of a Marine Geophysical...

Draft Environmental Assessment of a Marine Geophysical Survey (MATRIX)
by the US Geological Survey in the Northwestern Atlantic Ocean,
August 2018
Prepared by the U.S. Geological Survey, Coastal and Marine Geology Program
March 2018

Table of Contents
Draft Environmental Assessment for USGS Northwest Atlantic, 2018 Page iii
TABLE OF CONTENTS
Page
ABSTRACT ........................................................................................................................... V
LIST OF ACRONYMS ......................................................................................................... VII
I. PURPOSE AND NEED ..................................................................................................... 10
Mission of the U.S. Geological Survey ..............................................................................10
Purpose of and Need for the Proposed Action .................................................................11
Background for USGS Marine Seismic Research ...........................................................12
Regulatory Setting ..............................................................................................................12
II. ALTERNATIVES INCLUDING PROPOSED ACTION ...................................................... 13
Proposed Action ..................................................................................................................13 (1) Project Objectives and Context ........................................................................................ 13 (2) Proposed Activities ........................................................................................................... 13 (3) Monitoring and Mitigation Measures ............................................................................... 18 (a) Planning Phase ............................................................................................................. 19 (b) Operational Phase ........................................................................................................ 28
Alternative 1: Alternative Survey Timing ......................................................................28
Alternative 2: No Action Alternative ...............................................................................28
Alternatives Considered but Eliminated from Further Analysis ..................................29 1. Alternative E1: Alternative Location ........................................................................... 29 2. Alternative E2: Use of Alternative Technologies ........................................................ 29
III. AFFECTED ENVIRONMENT ........................................................................................ 31
(1) Oceanography ..................................................................................................32
(2) Protected Areas ...............................................................................................32
(3) Marine Mammals ............................................................................................33 3. Mysticetes .................................................................................................................... 34 4. Odontocetes ................................................................................................................. 37
Sea Turtles ..........................................................................................................................46 1. Leatherback Turtle ....................................................................................................... 46 2. Loggerhead Turtle ....................................................................................................... 48 3. Green Turtle ................................................................................................................. 49 4. Hawksbill Turtle .......................................................................................................... 50 5. Kemp’s Ridley Turtle .................................................................................................. 51
Seabirds ...............................................................................................................................52 1. Bermuda Petrel ............................................................................................................ 52 2. Black Capped Petrel .................................................................................................... 52
Table of Contents
Draft Environmental Assessment for USGS Northwest Atlantic, 2018 Page iv
3. Roseate Tern ................................................................................................................ 53
Fish .......................................................................................................................................54 1. ESA-listed Species ....................................................................................................... 54 2. Fish Habitats ................................................................................................................ 55 3. Commercial Fisheries .................................................................................................. 57 4. Recreational Fisheries .................................................................................................. 58
IV. ENVIRONMENTAL CONSEQUENCES .......................................................................... 59
Proposed Action ..................................................................................................................59 1. Direct Effects on Marine Mammals and Sea Turtles and Their Significance .............. 59 2. Mitigation Measures .................................................................................................... 61 3. Potential Numbers of Marine Mammals Exposed to Various Received Sound
Levels .......................................................................................................................... 61 4. Conclusions for Marine Mammals and Sea Turtles ..................................................... 67 5. Direct Effects on Marine Invertebrates, Fish, Fisheries, and Their Significance ........ 68 6. Direct Effects on Seabirds and Their Significance ...................................................... 69 7. Indirect Effects on Marine Mammals, Sea Turtles, Seabirds, Fish, and Their
Significance ................................................................................................................. 69 8. Cumulative Effects ...................................................................................................... 69 9. Unavoidable Impacts ................................................................................................... 74 10. Coordination with Other Agencies and Processes ....................................................... 74
Alternative Action: Another Time ....................................................................................74
No Action Alternative ........................................................................................................75
V. LIST OF PREPARERS .................................................................................................... 76
VI. LITERATURE CITED ................................................................................................... 77
APPENDICES ................................................................................................................ 105
Appendix A: Backup Configuration Information and Calculations ..........................105
Appendix B: Sound Exposure Levels (SEL): Scaling Analyses and All Results .......108
Appendix C. Supporting Documentation for Level A Acoustic Modeling .................112
Appendix D: Affected Environment Text ......................................................................135
Appendix E. Impact of Ship Noise ................................................................................147
Appendix F. Direct Effects .............................................................................................149 (a) Effects of Sound on Marine Invertebrates ................................................................. 149 (b) Effects of Sound on Fish ............................................................................................ 151 (c) Effects of Sound on Fisheries .................................................................................... 152
Appendix G. Other Effects .............................................................................................154
Abstract
Draft Environmental Assessment for USGS Northwest Atlantic, 2018 Page v
ABSTRACT
The U.S. Geological Survey (USGS) plans to conduct a seismic survey aboard the oceanographic research vessel R/V Hugh R. Sharp, owned by University of Delaware, in the northwestern Atlantic offshore the Mid-Atlantic Bight in August 2018. The survey will take place in the U.S. Exclusive Economic Zone (EEZ) in water depths of 100 to 3500 m from 35 nm south of Hudson Canyon to approximately Cape Hatteras. The seismic study will be conducted soley from the R/V Hugh R. Sharp using as seismic sources two to four GI airguns, each with a discharge volume of 105 in3. The GI guns will generate a total air volume of 420 in3 in the base configuration and 840 in3 in the so-called GG configuration, which could be used at water depths greater than 1000 m during recording of seismic arrivals on sonobuoys. A backup configuration would use only 2 GI guns, each firing at 105 in3.
The purpose of this survey is to acquire up to 2400 line-kilometers of modern multichannel seismic data to constrain the distribution of gas hydrates and shallow gas, particularly in areas considered highly prospective for methane hydrate deposits. The data would also be used to support USGS mission goals related to the study of submarine hazards (e.g., slides). The survey will fill a gap in modern seismic data on the Mid-Atlantic part of the margin and yield data that are likely to be used by the research community on a multidecadal time scale.
The USGS will be requesting an Incidental Harassment Authorization (IHA) from the U.S. National Marine Fisheries Service (NMFS) to authorize the incidental, i.e., not intentional, harassment of small numbers of marine mammals (should this occur) during the seismic survey. The information in this Environmental Assessment (EA) supports the IHA application process and provides information on marine species that are not addressed by the IHA application, including seabirds and sea turtles that are listed under the U.S. Endangered Species Act (ESA) and candidate species, fish, and Essential Fish Habitat (EFH). The EA explicitly addresses the requirements of the National Environmental Policy Act (NEPA). Alternatives addressed in this EA consist of conducting the same geophysical program at a different time, along with issuance of an associated IHA; and the no action alternative, with no IHA and no seismic survey.
In accordance with priorities articulated by the Council on Environmental Quality and the Secretary of the Interior in an order of August 2017, this EA attempts to streamline to the extent possible, while also providing a document complete enough to fully represent the Proposed Action. This EA is tiered to, and incorporates by reference, material from the Final Programmatic Environmental Impact Statement/Overseas Environmental Impact Statement for Marine Seismic Research Funded by the National Science Foundation or Conducted by the U.S. Geological Survey (NSF and USGS 2011; termed the NSF-USGS PEIS) and the corresponding USGS Record of Decision (2013). To reduce repetition among EAs for similar actions, portions of this EA (including this abstract) are adopted with small modifications or taken verbatim from the Draft EA prepared for the 2017 NSF-funded program for low-energy seismics to be conducted by Scripps Institute of Oceanography (LGL, 2017) in the Northwestern Atlantic. That Draft EA (LGL, 2017) is also incorporated herein by reference, as are other EAs produced for U.S. Atlantic margin projects conducted by NSF and the USGS since 2014.
Numerous species of marine mammals could be present in the proposed project area in the Northwest Atlantic Ocean. Under the U.S. ESA, several of these species are listed as endangered, including the North Atlantic right, sei, fin, blue, and sperm whales. ESA-listed sea turtle species that could occur in the project area include the endangered leatherback, hawksbill, Kemp’s ridley, and loggerhead (Northeast Atlantic Ocean Distinct Population Segment or DPS) turtles and the threatened green (North Atlantic DPS) and loggerhead (Northwest Atlantic Ocean DPS) turtles. ESA-listed seabirds that could be encountered in the area include the endangered Bermuda petrel, black capped petrel, and
Abstract
Draft Environmental Assessment for USGS Northwest Atlantic, 2018 Page vi
roseate tern. In addition, the endangered Atlantic sturgeon and shortnose sturgeon could be present, as well as the threatened giant manta ray and oceanic whitetip shark.
Potential impacts of the seismic survey on the environment would be primarily a result of the operation of the GI airguns. A 38 kHz fisheries sonar would also be operated during the surveys at water depths shallower than ~1800 m. Impacts that could be associated with particularly the airguns are mostly due to increased underwater noise, which may result in avoidance behavior by marine mammals, sea turtles, seabirds, and fish, and other forms of disturbance. An integral part of the planned survey is a monitoring and mitigation program designed to (a) minimize impacts of the proposed activities on marine animals present during the proposed research and (b) document as much as possible the nature and extent of any effects. Injurious impacts to marine mammals, sea turtles, and seabirds have not been proven to occur near airgun arrays, including high-energy airgun arrays generating air volumes over five times as large as those planned for the Proposed Action. Nor are effects likely to be caused by the other type of sound source to be used. However, despite the relatively low levels of sound emitted the GI airguns, a precautionary approach would still be taken. The planned monitoring and mitigation measures would reduce the possibility of injurious effects.
Protection measures designed to mitigate the potential environmental impacts to marine mammals, sea turtles, and seabirds would include the following: ramp ups; typically two, but a minimum of one observer maintaining a visual watch during all daytime airgun operations; two observers 30 min before and during ramp ups during the day; no start ups during poor visibility or at night unless at least one airgun (mitigation gun) has been operating; and shut downs when marine mammals or sea turtles are detected in or about to enter designated exclusion zones. The acoustic source would also be powered or shut down in the event an ESA-listed seabird were observed diving or foraging within the designated exclusion zone. Observers would also watch for any impacts the acoustic sources may have on fish. The USGS is committed to applying these measures in order to minimize effects on marine mammals, sea turtles, seabirds, and fish, and other environmental impacts. Survey operations would be conducted in accordance with all applicable U.S. federal regulations, including IHA and Incidental Take Statement (ITS) requirements.
With the planned monitoring and mitigation measures, unavoidable impacts to each species of marine mammal and turtle that could be encountered would be expected to be limited to short-term, localized changes in behavior and distribution near the seismic vessel. At most, effects on marine mammals may be interpreted as falling within the U.S. MMPA definition of “Level B Harassment” for those species managed by NMFS; however, the USGS is required to request, and NMFS may issue, Level A take for some marine mammal species. No long-term or significant effects would be expected on individual marine mammals, sea turtles, seabirds, fish, the populations to which they belong, or their habitats.

List of Acronyms
Draft Environmental Assessment for USGS Northwest Atlantic, 2018 Page vii
LIST OF ACRONYMS
AEP Auditory evoked potential AMVER Automated Mutual-Assistance Vessel Rescue System ArcGIS Arc-Geographic Information Systems (software) BOEM Bureau of Ocean Energy Management CFR Code of Federal Regulations CITES Convention on International Trade in Endangered Species COSEWIC Committee on the Status of Endangered Wildlife in Canada COST Continental offshore stratigraphic test CPA Closest point of approach CPUE Catch per unit effort CTD Conductivity-temperature-depth sensor DAA Detailed Analysis Area (from the NSF-USGS PEIS) dB decibel DD data deficient DE Delaware DOE U.S. Department of Energy DoW Defenders of Wildlife DPS distinct population segment DSV Deep Submergence Vehicle EA Environmental Assessment EBSA Ecologically or Biologically Significant Area ECS Extended Continental Shelf EDGE NSF-funded Mid-Atlantic seismic experiment 1990 EEZ Exclusive Economic Zone EFH Essential Fish Habitat EIS Environmental Impact Statement EN Endangered ENAM Eastern North American Margin (2014 NSF-funded seismic experiment) ESA (U.S.) Endangered Species Act EZ Exclusion Zone GARFO Greater Atlantic Regional Fishery Office (NOAA) GG Generator-generator mode on a GI gun GI Generator-Injector GIS Geographic Information System GOM Gulf of Mexico GPS Global Positioning System HAPC Habitat of Particular Concern HF High Frequency IHA Incidental Harassment Authorization (under MMPA) IHAA IHA Application IMG Imagine raster file IODP Integrated Ocean Drilling Program ITS Incidental Take Statement
List of Acronyms
Draft Environmental Assessment for USGS Northwest Atlantic, 2018 Page viii
IUCN International Union for the Conservation of Nature IWC International Whaling Commission kHz kiloHertz kJ kiloJoule km kilometer kt knot LC Least Concern L-DEO Lamont-Doherty Earth Observatory LF Low Frequency LORAN long-range navigation m meter MAB Mid-Atlantic Bight MAFMC Mid-Atlantic Fishery Management Council MATRIX Proposed Action: Mid-Atlantic Resource Imaging Experiment (USGS 2018) MCS multichannel seismic MD Maryland MDAT Marine-life Data and Analysis Team MMPA (U.S.) Marine Mammal Protection Act MPA Marine Protected Area MRFSS Marine Recreational Fisheries Statistics Survey (NMFS) MRIP Marine Recretional Information Program (NFMS) NAMMCO North Atlantic Marine Mammal Commission NAMSS National Archive of Marine Seismic Surveys (walrus.wr.usgs.gov/NAMSS/) NC North Carolina NEFSC Northeast Fisheries Science Center NEPA (U.S.) National Environmental Policy Act NJ New Jersey NL not listed (for ESA) NMFS (U.S.) National Marine Fisheries Service NOAA (U.S.) National Oceanographic and Atmospheric Administration NODES (U.S.) Navy OPAREA Density Estimates NOPP National Oceanographic Partnership Program NSF National Science Foundation NY New York OBIS Ocean Biographic Information System ODP Ocean Drilling Program OEIS Overseas Environmental Impact Statement OPR Office of Protected Resources (NMFS) OW Otariids underwater p or pk peak PEIS Programmatic Environmental Impact Statement PTS Permanent Threshold Shift PSO Protected Species Observer PW Phocids underwater QAA Qualitative Analysis Area rms root-mean-square

List of Acronyms
Draft Environmental Assessment for USGS Northwest Atlantic, 2018 Page ix
ROD Record of Decision ROV Remotely-operated vehicle R/V Research vessel s second SAFMC South Atlantic Fishery Management Council SEL Sound Exposure Level SIGH Seismic Imaging of Gas Hydrate (USGS Gulf of Mexico, 2013) SIO Scripps Institute of Oceanography SL Sound level SPL Sound pressure level TED turtle excluder device TEWG Technical Expert Working Group—Greater Atlantic Regional Fisheries TTS Temporary Threshold Shift UNOLS University-National Oceanographic Laboratory System U.S. United States of America USGS U. S. Geological Survey USFWS U.S. Fish and Wildlife Service μPa microPascal VA Virginia VU vulnerable

I. Purpose and Need
Draft Environmental Assessment for USGS Northwest Atlantic, 2018 Page x
I. PURPOSE AND NEED
This Environmental Analysis (EA) provides information needed to assess the potential environmental impacts associated with the U.S. Geological Survey’s (USGS’s) Proposed Northwest Atlantic Action, which includes the use of as many as four Generator-Injector (GI) airguns operated mostly at 420 to 840 in3 during seismic surveying in August 2018. The EA was prepared under the National Environmental Policy Act (NEPA). In accordance with CFR §46.120 and §46.140, this EA tiers to the Final Programmatic Environmental Impact Statement (EIS)/Overseas Environmental Impact Statement (OEIS) for Marine Seismic Research funded by the National Science Foundation or Conducted by the U.S. Geological Survey (NSF and USGS 2011; henceforth referred to as the NSF-USGS PEIS) and USGS Record of Decision on the NSF-USGS PEIS (USGS, 2013; henceforth referred to as the USGS ROD). This draft EA incorporates by reference the “Draft Environmental Analysis of a Low-Energy Marine Geophysical Survey by R/V Atlantis in the Northwest Atlantic Ocean, June-July 2018,” (LGL Report FAO139-1, 2017) as prepared for Scripps Institute of Oceanography and the National Science Foundation and as submitted to NMFS in December 2017.” That Draft EA is henceforth referred to at the “Draft Scripps EA (LGL, 2017).” Long passages of this EA are taken verbatim from the Draft Scripps EA or used verbatim with small modifications to represent the USGS activity. Passages from other EAs prepared for research seismic programs on the U.S. Atlantic margin are also used here verbatim or with small modifications.
This Draft EA provides details of the Proposed Action at the site-specific level and addresses potential impacts of the proposed seismic surveys on marine mammals, as well as other species of concern in the area, including sea turtles, seabirds, fish, and marine invertebrates. The Draft EA will also be used in support of an application for an Incidental Harassment Authorization (IHA) from the National Marine Fisheries Service (NMFS) and Section 7 consultations under the Endangered Species Act (ESA). The requested IHA would, if issued, allow the non-intentional, non-injurious “take by harassment” of small numbers of marine mammals during the proposed seismic surveys conducted by the USGS on R/V Hugh R. Sharp in the Northwest Atlantic Ocean during August 2018. Per NMFS requirement, small numbers of Level A takes will be requested for the remote possibility of low-level physiological effects; however, because of the characteristics of the Proposed Action and proposed monitoring and mitigation measures, in addition to the general avoidance by marine mammals of loud sounds, Level A takes are considered highly unlikely.
To be eligible for an IHA under the U.S. MMPA, the proposed “taking” (with mitigation measures in place) must not cause serious physical injury or death of marine mammals, must have negligible impacts on the species and stocks, must “take” no more than small numbers of those species or stocks, and must not have an unmitigable adverse impact on the availability of the species or stocks for legitimate subsistence uses.
Mission of the U.S. Geological Survey The U.S. Geological Survey (USGS) is a science mission agency within the U.S. Department of the Interior and has no regulatory responsibility. The USGS mission is to “provide reliable scientific information to describe and understand the Earth; minimize loss of life and property from natural disasters; manage water, biological, energy, and mineral resources; and enhance and protect our quality of life.” The objectives of this proposed seismic research program also coincide with the goals articulated in the USGS Energy and Minerals Science Strategy (Ferrero et al., 2012). This strategy states that the USGS conducts research to enhance understanding of the geologic occurrence, formation, and evolution of oil, gas, coal, and uranium resources. The USGS is responsible for applying the results of this research to the assessment of the economic
I. Purpose and Need
Draft Environmental Assessment for USGS Northwest Atlantic, 2018 Page 11
and environmental impact of development of these resources and making this knowledge public. As an agency whose mission is entirely scientific, the USGS has no authority to exploit natural resources.
Purpose of and Need for the Proposed Action The USGS intends to conduct a seismic survey aboard the R/V Hugh R. Sharp, a University National
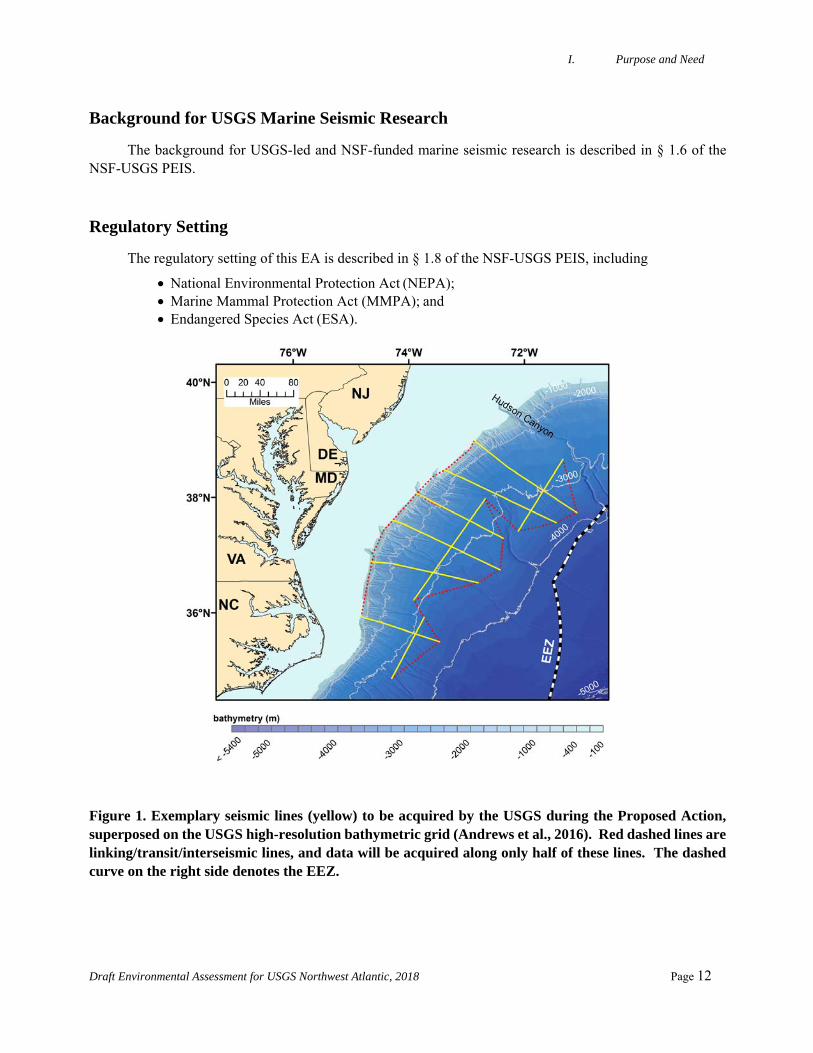
Oceanographic Laboratory (UNOLS) federal fleet vessel that is owned and operated by the University of Delaware, during a cruise up to 22 days long on the northern U.S. Atlantic margin in August 2018. The program is named MATRIX, for “Mid-Atlantic Resource Imaging Experiment.” The seismic survey will take place in water depths ranging from ~100 m to 3500 m, entirely within the U.S. Exclusive Economic Zone (EEZ), and acquire dip lines (roughly perpendicular to the orientation of the shelf-break) and strike lines (roughly parallel to the shelf-break) roughly between 35 nm south of Hudson Canyon on the north and Cape Hatteras on the south (Figure 1).
The purpose of the Proposed MATRIX Action is to collect data to constrain the lateral and vertical distribution of gas hydrates and shallow natural gas in marine sediments relative to seafloor gas seeps, slope failures, and geological and erosional features. The Proposed Action would be conducted in partial fulfillment of the scientific objectives of the USGS Gas Hydrates Project, which has contributed to the advancement of the understanding of natural gas hydrate systems at the national and international level for more than three decades. The USGS Gas Hydrates Project is jointly supported by the USGS Coastal and Marine Geology Program in the Natural Hazards Mission and by the USGS Energy Resources Program within the Energy and Minerals Mission.
The Proposed Action is primarily funded by the USGS Coastal and Marine Geology Program, and the USGS is the action agency responsible for planning the activity, conducting the work at sea, and processing the data after the cruise. Additional funding is provided by the Resource Evaluation Division of the Bureau of Ocean Energy Management (BOEM), U.S. Department of the Interior, and the U.S. Department of Energy’s National Energy Technology Laboratory, which manages the National Methane Hydrates R&D Program. BOEM has a long history of involvement in assessing gas hydrate resources (e.g., BOEM, 2012a) and participating in activities to investigate the resource potential of these deposits in the northern Gulf of Mexico and on the Atlantic, and Pacific. The U.S. DOE has been the agency charged with implementing the National Methane Hydrates Act of 2000 and its renewal in 2005.
The need for this activity is related to the inadequacy of existing seismic data to characterize geologic structures and shallow gas and gas hydrate deposits within the study area. The proposed survey fills a gap in modern multichannel seismic data (MCS) between roughly 36.2°N (surveyed by the NSF Eastern North American Margin (ENAM) project in 2014; RPS, 2014c) and 39.2°N (surveyed by the USGS Extended Continental Shelf in 2014; RPS, 2014a). In the area of the proposed survey, the most recent non-industry airgun surveys were acquired by the USGS in the 1970s and earliest 1980s with the exception of the NSF-funded EDGE survey, which was acquired in 1990. Into the early 1980s, industry acquired a dense series of airgun surveys in the proposed study area. These data, which have been released by the Bureau of Ocean Energy Management (BOEM) through the USGS National Archive of Marine Seismic Surveys (Triezenberg et al., 2016; NAMSS; walrus.er.usgs.gov/NAMSS/), extend seaward to only ~2000 m water depth in most cases, suffer from irreconciliable navigation errors for some surveys, often lack velocity control, and are typically of such poor quality that features related to gas hydrates cannot be easily delineated or traced laterally. The modern airgun data that the USGS would collect as part of the Proposed Action will be acquired using state-of-the-art source and receiver technology and modern navigation techniques and will extend the seaward reach of high-quality MCS data to 3500 m water depth. If these data are not acquired, most of the mid-Atlantic part of the U.S. Atlantic margin will remain characterized only by seismic information that is 35 to 45 years old. Thus, this Proposed Action fills a national need for better characterization of the U.S. Atlantic continental margin.
I. Purpose and Need
Draft Environmental Assessment for USGS Northwest Atlantic, 2018 Page 12
Background for USGS Marine Seismic Research
The background for USGS-led and NSF-funded marine seismic research is described in § 1.6 of the NSF-USGS PEIS.
Regulatory Setting
The regulatory setting of this EA is described in § 1.8 of the NSF-USGS PEIS, including
National Environmental Protection Act (NEPA); Marine Mammal Protection Act (MMPA); and Endangered Species Act (ESA).
Figure 1. Exemplary seismic lines (yellow) to be acquired by the USGS during the Proposed Action, superposed on the USGS high-resolution bathymetric grid (Andrews et al., 2016). Red dashed lines are linking/transit/interseismic lines, and data will be acquired along only half of these lines. The dashed curve on the right side denotes the EEZ.
II. Alternatives Including Proposed Action
Draft Environmental Assessment for USGS Northwest Atlantic, 2018 Page 13
II. ALTERNATIVES INCLUDING PROPOSED ACTION
In this Draft EA, three alternatives are evaluated: (1) the proposed seismic survey and issuance of an associated IHA; (2) a corresponding seismic survey at an alternative time, along with issuance of an associated IHA; and (3) no action alternative. Additionally, two alternatives were considered but were eliminated from further analysis. A summary table of the proposed action, alternatives, and alternatives eliminated from further analysis is provided at the end of this section.
Proposed Action
The project objectives and context, activities, and mitigation measures for USGS’s planned seismic survey are described in the following subsections.
(1) Project Objectives and Context
USGS scientists propose to conduct a seismic survey (MATRIX) in the northwest Atlantic Ocean (Fig. 1) to acquire data on ~6 exemplary dip lines (down the continental slope) and ~3 exemplary strike lines parallel to the shelf-break from the R/V Hugh R. Sharp. The goal of the proposed research is to characterize marine gas hydrates and associated shallow free gas deposits and their connection to widespread seafloor methane seepage, large-scale slope failures and erosional processes, and other geological features. To achieve the program’s goals, Drs. Carolyn Ruppel and Nathan C. Miller, both of the USGS Woods Hole Coastal and Marine Science Center, propose to collect up to 9 long (80 nm or more) high-resolution MCS profiles and linking/transit/interseismic lines constituting up to ~2400 km total of new seismic data.
(2) Proposed Activities
(a) Location of the Activities
The survey is bound within the region ~34.75ºN–40°N, ~71–75°W in the northwest Atlantic Ocean (Fig. 1), with the closest approach to the U.S. coastline 70 km (North Carolina) to 130 km (New Jersey). The survey area starts 35 nm south of Hudson Canyon on the north and is bound by Cape Hatteras on the south, the nominal shelf break (~100 m water depth) on the west, and the ~3500 m bathymetric contour on the east. The seismic survey will be conducted entirely within the U.S. EEZ, with airgun operations scheduled to occur for up to 19 days of a cruise that may be as long as 22 days, departing port on August 8, 2018. Some minor deviation from these dates is possible, depending on logistics and especially weather.
(b) Description of the Activities
The survey will involve one source vessel, the R/V Hugh R. Sharp. The source vessel will deploy two to four low-energy Generator-Injector (GI) airguns (each has discharge volume of 105 in3) as an energy source. An 120-channel, 1.2-km-long hydrophone streamer will be continuously towed to receive the seismic signals. In addition, up to 90 disposable sonobuoy receivers will be deployed only at water depths greater than 1000 m to provide velocity control and possibly wide-angle reflections along the highest priority transects.
The energy to the airguns is compressed air supplied by compressors on board the source vessel. As the airguns are towed along the survey lines, the hydrophone streamer will receive the returning acoustic signals and transfer the data to the on-board processing system. The sonobuoys, which will be deployed as frequently as every 15 km along high-priority lines, record the returning acoustic signals at larger offsets than are possible with the streamer and transmit the information at radio frequencies to receivers on the ship. A maximum of ~2400 km of data will be collected (Fig. 1). Most lines are oriented subperpendicular to the strike of the
II. Alternatives Including Proposed Action
Draft Environmental Assessment for USGS Northwest Atlantic, 2018 Page 14
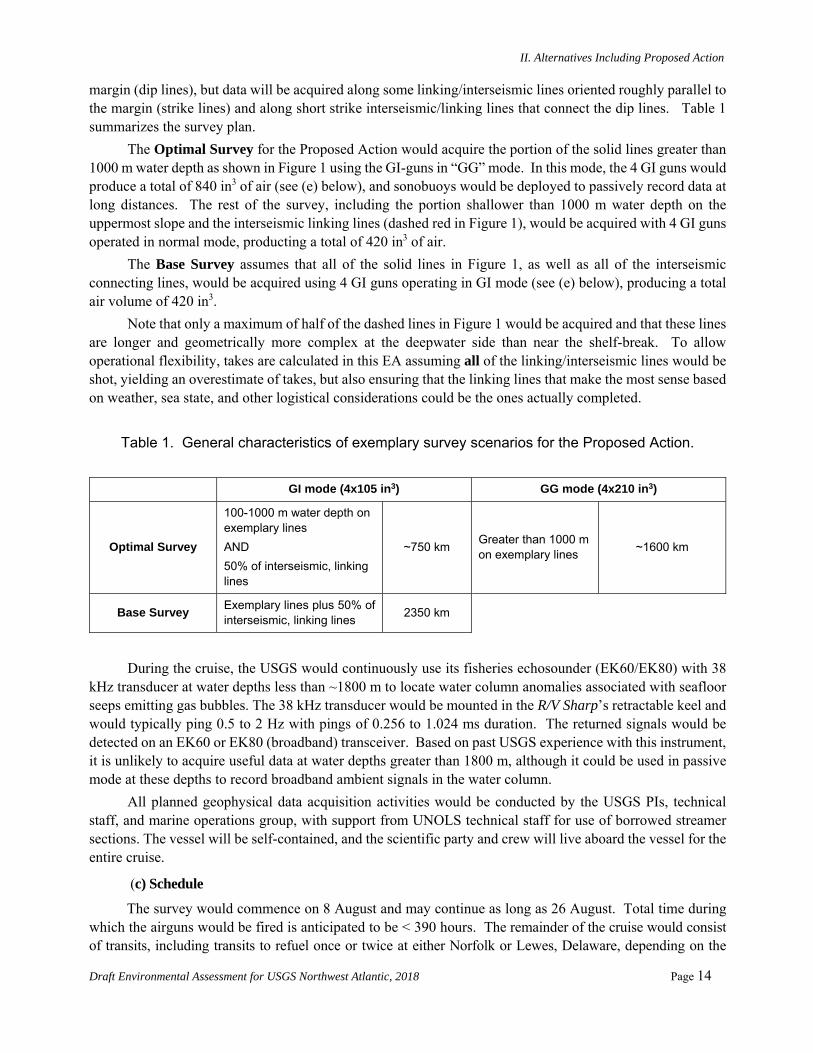
margin (dip lines), but data will be acquired along some linking/interseismic lines oriented roughly parallel to the margin (strike lines) and along short strike interseismic/linking lines that connect the dip lines. Table 1 summarizes the survey plan.
The Optimal Survey for the Proposed Action would acquire the portion of the solid lines greater than 1000 m water depth as shown in Figure 1 using the GI-guns in “GG” mode. In this mode, the 4 GI guns would produce a total of 840 in3 of air (see (e) below), and sonobuoys would be deployed to passively record data at long distances. The rest of the survey, including the portion shallower than 1000 m water depth on the uppermost slope and the interseismic linking lines (dashed red in Figure 1), would be acquired with 4 GI guns operated in normal mode, producting a total of 420 in3 of air.
The Base Survey assumes that all of the solid lines in Figure 1, as well as all of the interseismic connecting lines, would be acquired using 4 GI guns operating in GI mode (see (e) below), producing a total air volume of 420 in3.
Note that only a maximum of half of the dashed lines in Figure 1 would be acquired and that these lines are longer and geometrically more complex at the deepwater side than near the shelf-break. To allow operational flexibility, takes are calculated in this EA assuming all of the linking/interseismic lines would be shot, yielding an overestimate of takes, but also ensuring that the linking lines that make the most sense based on weather, sea state, and other logistical considerations could be the ones actually completed.
Table 1. General characteristics of exemplary survey scenarios for the Proposed Action.
GI mode (4x10⁵ in3) GG mode (4x210 in3)
Optimal Survey
100-1000 m water depth on exemplary lines
AND
50% of interseismic, linking lines
~750 km Greater than 1000 m on exemplary lines
~1600 km
Base Survey Exemplary lines plus 50% of interseismic, linking lines
2350 km
During the cruise, the USGS would continuously use its fisheries echosounder (EK60/EK80) with 38 kHz transducer at water depths less than ~1800 m to locate water column anomalies associated with seafloor seeps emitting gas bubbles. The 38 kHz transducer would be mounted in the R/V Sharp’s retractable keel and would typically ping 0.5 to 2 Hz with pings of 0.256 to 1.024 ms duration. The returned signals would be detected on an EK60 or EK80 (broadband) transceiver. Based on past USGS experience with this instrument, it is unlikely to acquire useful data at water depths greater than 1800 m, although it could be used in passive mode at these depths to record broadband ambient signals in the water column.
All planned geophysical data acquisition activities would be conducted by the USGS PIs, technical staff, and marine operations group, with support from UNOLS technical staff for use of borrowed streamer sections. The vessel will be self-contained, and the scientific party and crew will live aboard the vessel for the entire cruise.
(c) Schedule
The survey would commence on 8 August and may continue as long as 26 August. Total time during which the airguns would be fired is anticipated to be < 390 hours. The remainder of the cruise would consist of transits, including transits to refuel once or twice at either Norfolk or Lewes, Delaware, depending on the
II. Alternatives Including Proposed Action
Draft Environmental Assessment for USGS Northwest Atlantic, 2018 Page 15
combined fuel needs of the ship and the compressors. The exact dates of the activities depend on logistics and weather conditions.
(d) Source Vessel Specifications
The R/V Hugh R. Sharp would be used for this survey. The R/V Hugh R. Sharp has an overall length of 46 m, a beam of 9.8 m, and a full load draft of 2.95 m (3.9 m with retractable keel positioned at 1 m down). The vessel is equipped with four Cummins KTA-19D diesel engines. Diesel-electric power is provided by two Schottel SRP 330 Z-drives. The ship also has a Schottel tunnel bow thruster operated with the S Green dynamic positioning system. An operation speed of up to ~7.4 km/h (4 kt) will be used during seismic acquisition. When not towing seismic survey gear, the R/V Hugh R. Sharp typically cruises at 14.8 to 16.7 km/h (8-9 kt). It has a normal operating range of ~6500 km (~3500 nm).
The R/V Hugh R. Sharp will also serve as the platform from which vessel-based protected species observers (PSOs) will watch for marine mammals and sea turtles before and during airgun operations. The PSO platform is an area covered by an awning and equipped with chairs and Big Eye binocular stands, located on the flying bridge of the R/V Hugh R. Sharp, 10.6 m above the water’s surface. This area has previously been used by NMFS scientists for beaked whale observations during research cruises (e.g., Cholewiak, September 2017). The vantage point provides a 360° view of the water’s surface. During inclement weather too challenging to remain on the flying bridge, the PSOs have access to the bridge of the vessel for their activities. In addition, crew members on the bridge and on other parts of the vessel will be instructed to keep a watch for protected species.
Other details of the R/V Hugh R. Sharp include the following:
Owner: University of Delaware Operator: University of Delaware Flag: United States of America Launch Date: 2006 Domestic Tonnage: 256 T Accommodation Capacity: 22, including 14 scientists
(e) Airgun Description
The R/V Hugh R. Sharp will tow two or four 105-in3 Sercel generator-injector (GI) airguns at a time as the primary energy source following exemplary survey lines and transit/linking/interseismic lines between the primary exemplary lines. Seismic pulses for the GI guns will be emitted at intervals of ~12 s. At speeds of ~7.4 km/h (4 kt), the shot intervals correspond to a spacing of ~25 m.
In standard GI mode, the generator chamber of each GI airgun is the primary source, the one responsible for introducing the sound pulse into the ocean, is 105 in3. The 105 in3 injector chamber injects air into the previously-generated bubble to reduce bubble reverberations and does not introduce more sound into the water. When shooting to sonobuoys during the Proposed Action, the GI guns will also sometimes be operated with both chambers releasing air simultaneously (i.e., “generator-generator” or “GG” mode). In GG mode, each gun simultaneously releases an air volume of 105 in3 + 105 in3= 210 in3. On this cruise, four GI guns will be operated either in base mode (4x10⁵ in3) or GG mode (4x210 in3) as long as compressors are functioning correctly. If compressors are not functioning properly, a backup mode consisting of two GI guns will be used. The backup mode is described in Appendix A. The text below describes the two preferred modes for operations.

II. Alternatives Including Proposed Action
Draft Environmental Assessment for USGS Northwest Atlantic, 2018 Page 16
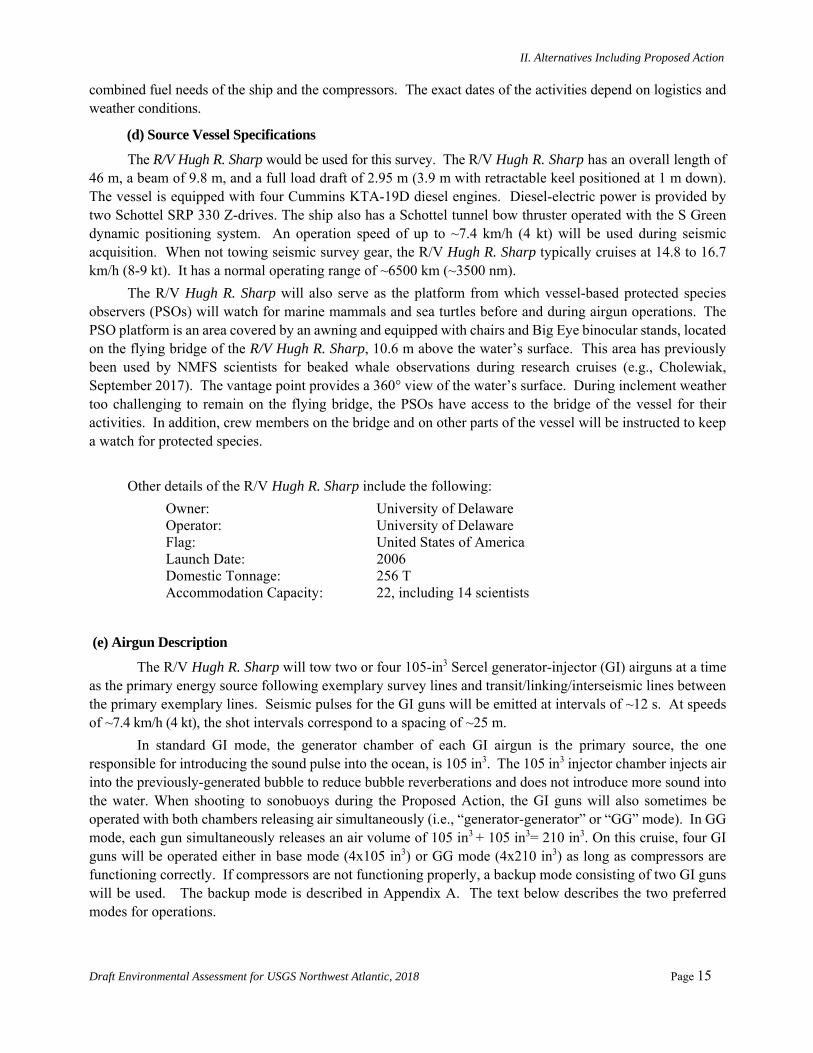
The Base Configuration, Configuration 1, will use 4 GI guns and generate 420 in3 total volume, as shown in Figure 2. Guns will be towed at 3 m water depth, two on each side of the stern, with 8.6 m lateral (athwartships) separation between the pairs of guns and 2 m front-to-back separation between the guns on each stern tow line.
Figure 2. Base configuration (Source configuration 1): 420 in3 total volume consisting of 4x10⁵/105in3 GI guns (S#G*, where # is the side and * is the gun number) firing in standard GI mode.
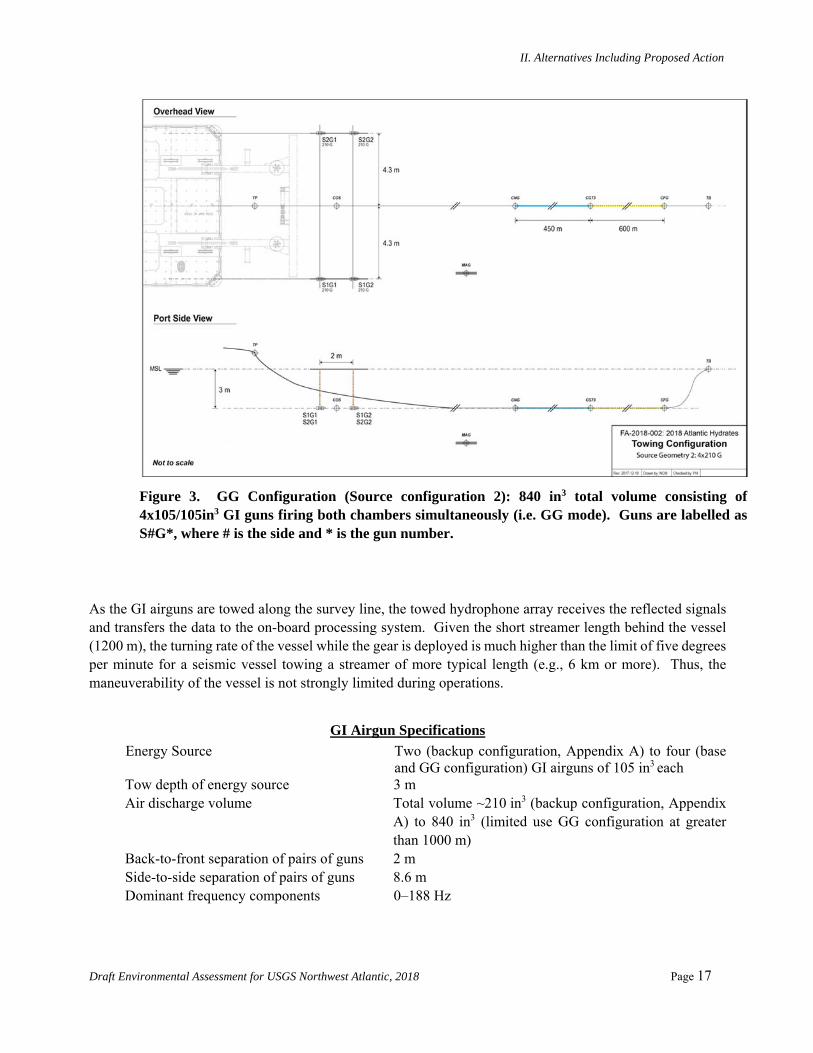
The GG Configuration, Configuration 2, will use 4 GI guns and generate 840 in3 total volume, as shown in Figure 3. In this configuration, the guns will be fired in GG mode, as described above. Guns will be towed at 3 m water depth, two on each side of the stern, with 8.6 m lateral (athwartships) separation between the pairs of guns and 2 m front-to-back separation between the guns on each stern tow line. The GG configuration would be used only at greater than 1000 m water depth and on specific exemplary lines on which sonobuoy data are being collected.
II. Alternatives Including Proposed Action
Draft Environmental Assessment for USGS Northwest Atlantic, 2018 Page 17
As the GI airguns are towed along the survey line, the towed hydrophone array receives the reflected signals and transfers the data to the on-board processing system. Given the short streamer length behind the vessel (1200 m), the turning rate of the vessel while the gear is deployed is much higher than the limit of five degrees per minute for a seismic vessel towing a streamer of more typical length (e.g., 6 km or more). Thus, the maneuverability of the vessel is not strongly limited during operations.
GI Airgun Specifications
Energy Source Two (backup configuration, Appendix A) to four (base and GG configuration) GI airguns of 105 in3 each
Tow depth of energy source 3 m Air discharge volume Total volume ~210 in3 (backup configuration, Appendix
A) to 840 in3 (limited use GG configuration at greater than 1000 m)
Back-to-front separation of pairs of guns 2 m Side-to-side separation of pairs of guns 8.6 m Dominant frequency components 0–188 Hz
Figure 3. GG Configuration (Source configuration 2): 840 in3 total volume consisting of 4x10⁵/105in3 GI guns firing both chambers simultaneously (i.e. GG mode). Guns are labelled as S#G*, where # is the side and * is the gun number.

II. Alternatives Including Proposed Action
Draft Environmental Assessment for USGS Northwest Atlantic, 2018 Page 18
The source levels for the GI gun configurations can be derived from the modeled farfield source signature, which was determined for the USGS by L-DEO using the PGS Nucleus software. Modeling information is provided below, with more complete details in Appendices B and C.
(f) Sonobuoy Description and Deployment
The Proposed Action would deploy up to 72 disposable sonobuoys from the R/V Hugh R. Sharp during surveys along higher priority seismic lines at water depths greater than 1000 m (Fig. 1). These sonobuoys consist of hydrophones suspended ~30-90 m below the surface from a free-floating buoy. Data are transmitted to the ship via radio frequency.
(g) EK60/80 Fisheries Split-Beam Echosounder (38 kHz)
During the cruise, the USGS would continuously monitor the water column at water depths less than 1800 m using its EK80 broadband transceiver or an EK60 transceiver. The active acoustic component is a 38 kHz split-beam transducer mounted in the retractable keel of the R/V Hugh R. Sharp. These sources have been extensively used in fisheries science for estimating biomass and are routinely used by NOAA, the USGS, and other research agencies for detecting fish, whales, and water column anomalies, such as bubbles emitted from the seafloor at seeps. The sound source level for the EK60/80 transducers is nominally 228 dB/1 µPa. Modeling of the 38 kHz signal yields the sound pressure levels (SPL) shown in Figure 4. The area ensonified at >160 dB is 0.0407 km2, corresponding to a maximum of ~72 m athwartship and ~650 m below the ship.
Figure 4. 160 dB SEL modeled for the 38 kHz transducer for the EK60/EK80 system.
(3) Monitoring and Mitigation Measures
Section § 2.4.4.1 of the NSF-USGS PEIS describes standard monitoring and mitigation measures for seismic surveys and the two phases: pre-cruise planning and during operations. The sections below describe the measures taken in each phase for the 2018 USGS Proposed Action. Some of the text below is adapted or taken verbatim from the Draft Scripps EA (LGL, 2017).

II. Alternatives Including Proposed Action
Draft Environmental Assessment for USGS Northwest Atlantic, 2018 Page 19
(a) Planning Phase
The initial mitigation of the impacts of the Proposed Action occurred during planning.
Energy Source.—The energy source was chosen to be the lowest practical to meet the scientific objectives. Since the dataset to be acquired during MATRIX (Proposed Action) is expected to be used for 30 years or more, the USGS also assessed how to minimize the source size while ensuring maximum penetration, highest resolution, and appropriate imaging of the hydrate stability zone and shallow natural gas distributions and to produce data of high enough quality for the results to still be considered useful in the multidecadal timeframe. The USGS settled on a range of sources and potential configurations, with the base configuration of four airguns operated at 105 in3. The largest source that could be used is four airguns operated at 210 in3 and towed at 3 m depth, which would be used only at water depths > 1000 m when recording data on sonobuoys. The total air volume associated with these sources is ~6 to 17% of those used for most modern 2D and 3D seismic programs (usually > 6000 in3).
Survey Timing.—When choosing the timing of the survey, the USGS took into consideration environmental conditions (e.g., the seasonal presence of marine mammals), weather, vessel availability, and optimal timing for this and other proposed research cruises on the R/V Hugh R. Sharp . Some marine mammal species are expected to occur in the area year-round, so altering the timing of the proposed project likely would result in no net benefits for those species.
Mitigation Zones.
During the planning phase, mitigation zones for the proposed marine seismic surveys were calculated based on modeling by L-DEO for both the exclusion and safety zones. Received sound levels have been predicted by L-DEO’s model (Diebold et al. 2010, provided as Appendix H in the NSF-USGS PEIS), as a function of distance from the airguns, for the three potential airgun configurations: (1) Base configuration: 4 GI guns producing a total of 420 in3 of air; (2) GG configuration: 4 GI guns producing a total of 840 in3 of air, which will be used only to shoot to sonobuoys along certain lines at water depths greater than 1000 m; and (3) Backup configuration: 2 GI guns producing a total of 210 in3 of air. To streamline this Draft EA, all information about the backup configuration has been moved to Appendix A.
The L-DEO modeling approach uses ray tracing for the direct wave traveling from the array to the receiver and its associated source ghost (reflection at the air-water interface in the vicinity of the array), in a constant-velocity half-space (infinite homogeneous ocean layer, unbounded by a seafloor). In addition, propagation measurements of pulses from the 36-airgun array at a tow depth of 6 m have been reported in deep water (~1600 m), intermediate water depth on the slope (~600–1100 m), and shallow water (~50 m) in the Gulf of Mexico (GoM) in 2007–2008 (Tolstoy et al. 2009; Diebold et al. 2010).
For deep and intermediate-water cases, the field measurements in the Gulf of Mexico cannot be easily used to derive mitigation radii. This is due to the fact that, at those sites, the calibration hydrophone for the 36-gun study was located at a roughly constant depth of 350–500 m, which may not intersect all the sound pressure level (SPL) isopleths at their widest point from the sea surface down to the maximum relevant water depth for marine mammals of ~2000 m. Figures 2 and 3 in Appendix H of the NSF-USGS PEIS show how the values along the maximum SPL line that connects the points where the isopleths attain their maximum width (providing the maximum distance associated with each sound level) may differ from values obtained along a constant depth line. At short ranges, where the direct arrivals dominate and the effects of seafloor interactions are minimal, the data recorded at the deep and slope sites are suitable for comparison with modeled levels at the depth of the calibration hydrophone. At longer ranges, the comparison with the mitigation model—constructed from the maximum SPL through the entire water column at varying distances from the airgun array—is the most relevant. The results are summarized below.
II. Alternatives Including Proposed Action
Draft Environmental Assessment for USGS Northwest Atlantic, 2018 Page 20
In deep and intermediate water depths, comparisons at short ranges between sound levels for direct arrivals recorded by the calibration hydrophone and model results for the same array tow depth are in good agreement (Fig. 12 and 14 in Appendix H of the NSF-USGS PEIS). Consequently, isopleths falling within this domain can be predicted reliably by the L-DEO model, although they may be imperfectly sampled by measurements recorded at a single depth. At greater distances, the calibration data show that seafloor-reflected and sub-seafloor-refracted arrivals dominate, whereas the direct arrivals become weak and/or incoherent (Fig. 11, 12, and 16 in Appendix H of the NSF-USGS PEIS). Aside from local topography effects, the region around the critical distance (~5 km in Fig. 11 and 12, and ~4 km in Fig. 16 in Appendix H of the NSF-USGS PEIS) is where the observed levels rise closest to the mitigation model curve. However, the observed sound levels are found to fall almost entirely below the mitigation model curve (Fig. 11, 12, and 16 in Appendix H of the NSF-USGS PEIS). Thus, analysis of the GoM calibration measurements demonstrates that although simple, the L-DEO model is a robust tool for conservatively estimating mitigation radii. In shallow water (<100 m), the depth of the calibration hydrophone (18 m) used during the GoM calibration survey was appropriate to sample the maximum sound level in the water column, and the field measurements reported in Table 1 of Tolstoy et al. (2009) for the 36-airgun array at a tow depth of 6 m can be used to derive mitigation radii. (Note, however, that none of the Proposed Action would be carried out at less than 100 m water depth.)
The proposed survey would acquire data with up to four airguns, each with 210 in3 of air, operated at a tow depth of 3 m. For deep water (>1000 m), we use the deep-water radii obtained from L-DEO model results down to a maximum water depth of 2000 m (Figures 5 through 7). The radii for intermediate water depths (100–1000 m) are derived from the deep-water ones by applying a correction factor (multiplication) of 1.5, such that observed levels at very near offsets fall below the corrected mitigation curve (Fig. 16 in Appendix H of the NSF-USGS PEIS).
Although the USGS does not intend to operate the source at less than 100 m water depth, shallow-water radii were still calculated by scaling the empirically derived measurements from the GoM calibration survey (Appendix B) to account for the differences in volume and tow depth between the calibration survey (6600 cu.in at 6 m tow depth) and the proposed surveys (three different configurations; backup configuration information is Appendix A); whereas the shallow water GOM may not exactly replicate the shallow water environment at the proposed survey sites, it has been shown to serve as a good and very conservative proxy (Crone et al. 2014). A simple scaling factor is calculated from the ratios of the isopleths derived from the deep-water L-DEO model. These isopleths are essentially a measure of the energy radiated by the source array
For the Base Configuration (Configuration 1):
- the 150-decibel (dB) Sound Exposure Level (SEL)1 corresponds to deep-water maximum radii of 1090.6 m for the four 105 in3 airguns at 3 m tow depth (Fig. 5), and 7,244 m for the 6600 in3 airgun array at 6-m tow depth (Appendix B), yielding scaling factors of 0.151 to be applied to the shallow-water 6-m tow depth results.
- the 165-decibel (dB) Sound Exposure Level (SEL) corresponds to deep-water maximum radii of 193.94 m for the four 105 in3 airguns at 3 m tow depth, and 1,284 m for a 6-m tow depth, yielding a scaling factor of 0.151 to be applied to the shallow-water 6-m tow depth results.
____________________________________ 1 SEL (measured in dB re 1 μPa2 · s) is a measure of the received energy in the pulse and represents the SPL that would
be measured if the pulse energy were spread evenly across a 1-s period. Because actual seismic pulses are less than 1 s in duration in most situations, this means that the SEL value for a given pulse is usually lower than the SPL calculated for the actual duration of the pulse. In this EA, we assume that rms pressure levels of received seismic pulses would be 10 dB higher than the SEL values predicted by L-DEO’s model.
II. Alternatives Including Proposed Action
Draft Environmental Assessment for USGS Northwest Atlantic, 2018 Page 21
- Similarly, the 170 dB SEL corresponds to deep-water maximum radii of 109.72 for the four 105 in3 airguns at 3 m tow depth (Fig. 2) and 719 m for the 6600 in3 at 6-m tow depth (Fig. 4), yielding the same 0.152 scaling factor. - the 185-decibel (dB) Sound Exposure Level (SEL) corresponds to deep-water maximum radii of 19.89 m for the four 105 in3 at 3-m tow depth, and 126.3 m for a 6-m tow depth, yielding a scaling factor of 0.157 to be applied to the shallow-water 6-m tow depth results.
Measured 160-, 175-, 180-, 190- and 195-dB re 1µParms distances in shallow water for the 36-airgun R/V
Langseth array towed at 6 m depth were 17.5 km, 2.84 km, 1.6 km, 458 m and 240 m, respectively, based on a 95th percentile fit (Tolstoy et al. 2009). Multiplying by the scaling factors to account for the tow depth and discharge volume differences between the 6600 cu.in airgun array at 6 m tow depth and the USGS Proposed Action Base Configuration, the 420 cu.in airgun array at 3 m tow depth yields distances of 2.642 km, 429 m, 243 m, 71 m and 38 m, respectively.
For the GG Configuration (Configuration 2):
- the 150-decibel (dB) Sound Exposure Level (SEL) corresponds to deep-water maximum radii of 1,244 m for the four 210 in3 airguns at 3 m tow depth (Fig. 6), and 7,244 m for the L-DEO 6600 in3 airgun array at 6-m tow depth (Fig. 8), yielding scaling factors of 0.172 to be applied to the shallow-water 6-m tow depth results.
- the 165-decibel (dB) Sound Exposure Level (SEL) corresponds to deep-water maximum radii of 219.54 m for the four 210 in3 airguns at 3 m tow depth, and 1,284 m for a 6-m tow depth, yielding a scaling factor of 0.171 to be applied to the shallow-water 6-m tow depth results.
- Similarly, the 170 dB SEL corresponds to deep-water maximum radii of 124.72 for the four 210 in3 airguns at 3 m tow depth (Fig. 2) and 719 m for the 6600 in3 at 6-m tow depth (Fig. 4), yielding the same 0.173 scaling factor. - the 185-decibel (dB) Sound Exposure Level (SEL) corresponds to deep-water maximum radii of 22.69 m for the four 210 in3 at 3-m tow depth, and 126.3 m for a 6-m tow depth, yielding a scaling factor of 0.179 to be applied to the shallow-water 6-m tow depth results.
Measured 160-, 175-, 180-, 190- and 195-dB re 1µParms distances in shallow water for the 36-airgun R/V
Langseth array towed at 6 m depth were 17.5 km, 2.84 km, 1.6 km, 458 m and 240 m, respectively, based on a 95th percentile fit (Tolstoy et al. 2009). Multiplying by the scaling factors to account for the tow depth and discharge volume differences between the 6600 cu.in airgun array at 6 m tow depth and the 840 cu.in airgun array at 3 m tow depth yields distances of 3.01 km, 485 m, 277 m, 80 m and 43 m, respectively.
Information for the Backup Configuration is given in Appendix A.
II. Alternatives Including Proposed Action
Draft Environmental Assessment for USGS Northwest Atlantic, 2018 Page 22
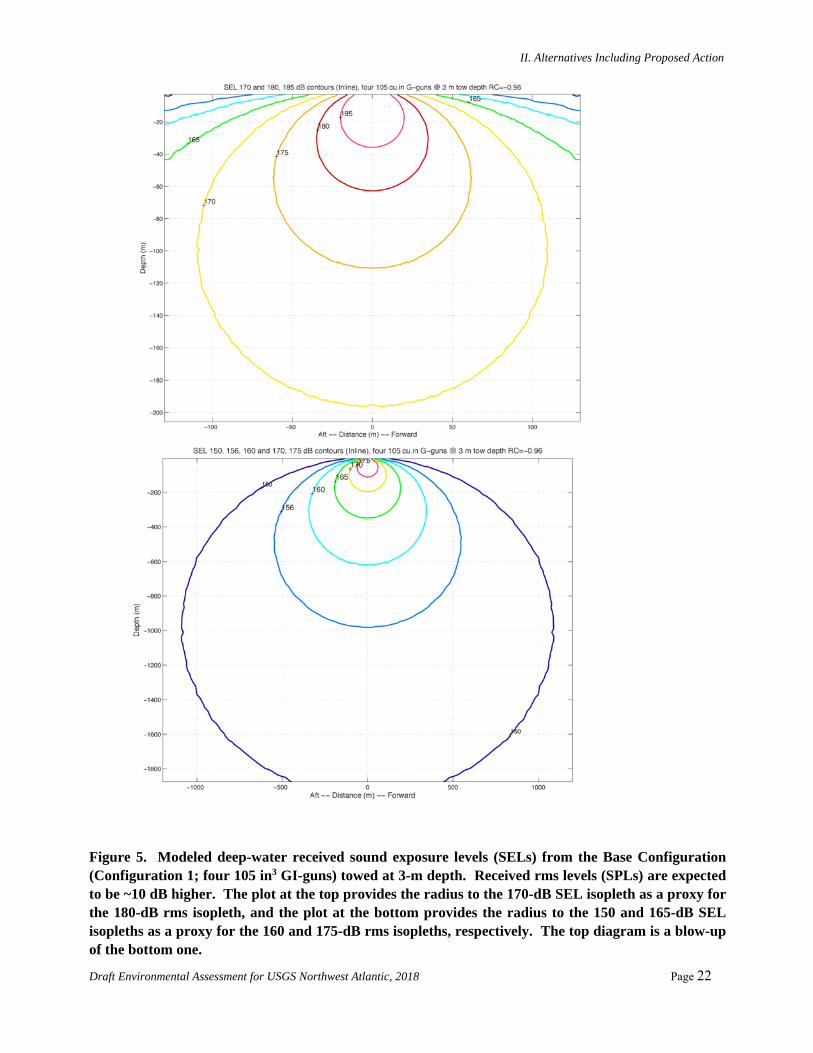
Figure 5. Modeled deep-water received sound exposure levels (SELs) from the Base Configuration (Configuration 1; four 105 in3 GI-guns) towed at 3-m depth. Received rms levels (SPLs) are expected to be ~10 dB higher. The plot at the top provides the radius to the 170-dB SEL isopleth as a proxy for the 180-dB rms isopleth, and the plot at the bottom provides the radius to the 150 and 165-dB SEL isopleths as a proxy for the 160 and 175-dB rms isopleths, respectively. The top diagram is a blow-up of the bottom one.
II. Alternatives Including Proposed Action
Draft Environmental Assessment for USGS Northwest Atlantic, 2018 Page 23
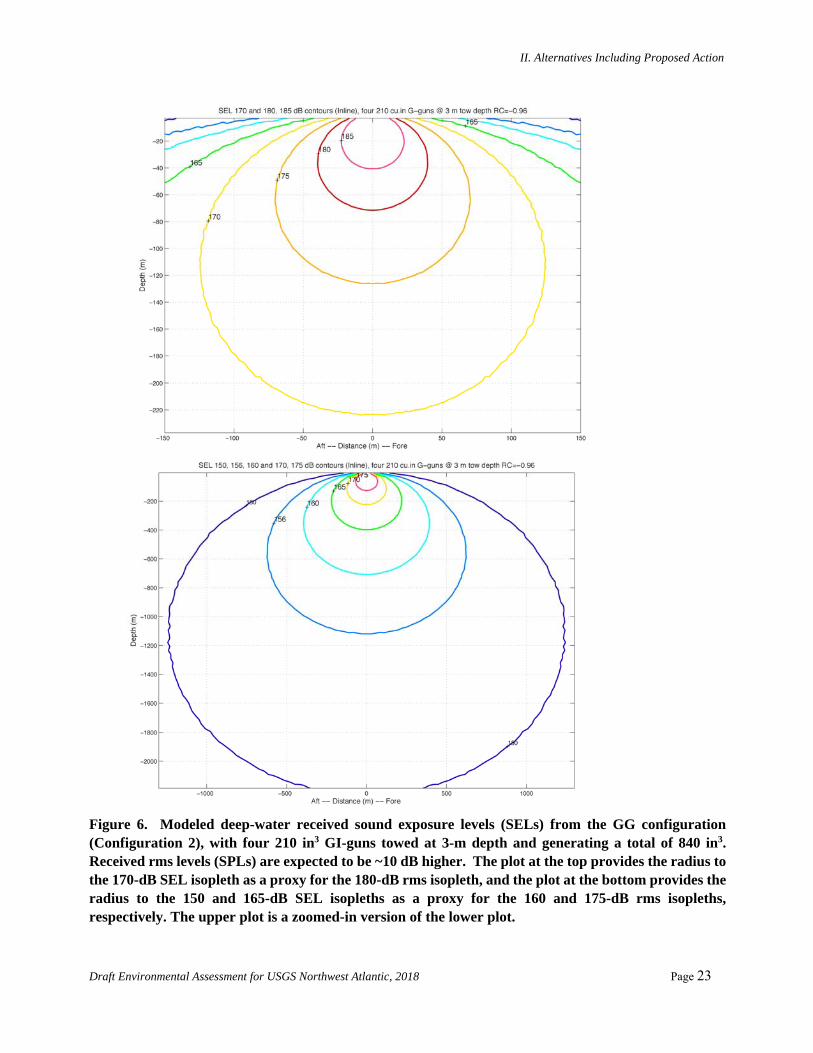
Figure 6. Modeled deep-water received sound exposure levels (SELs) from the GG configuration (Configuration 2), with four 210 in3 GI-guns towed at 3-m depth and generating a total of 840 in3. Received rms levels (SPLs) are expected to be ~10 dB higher. The plot at the top provides the radius to the 170-dB SEL isopleth as a proxy for the 180-dB rms isopleth, and the plot at the bottom provides the radius to the 150 and 165-dB SEL isopleths as a proxy for the 160 and 175-dB rms isopleths, respectively. The upper plot is a zoomed-in version of the lower plot.
II. Alternatives Including Proposed Action
Draft Environmental Assessment for USGS Northwest Atlantic, 2018 Page 24
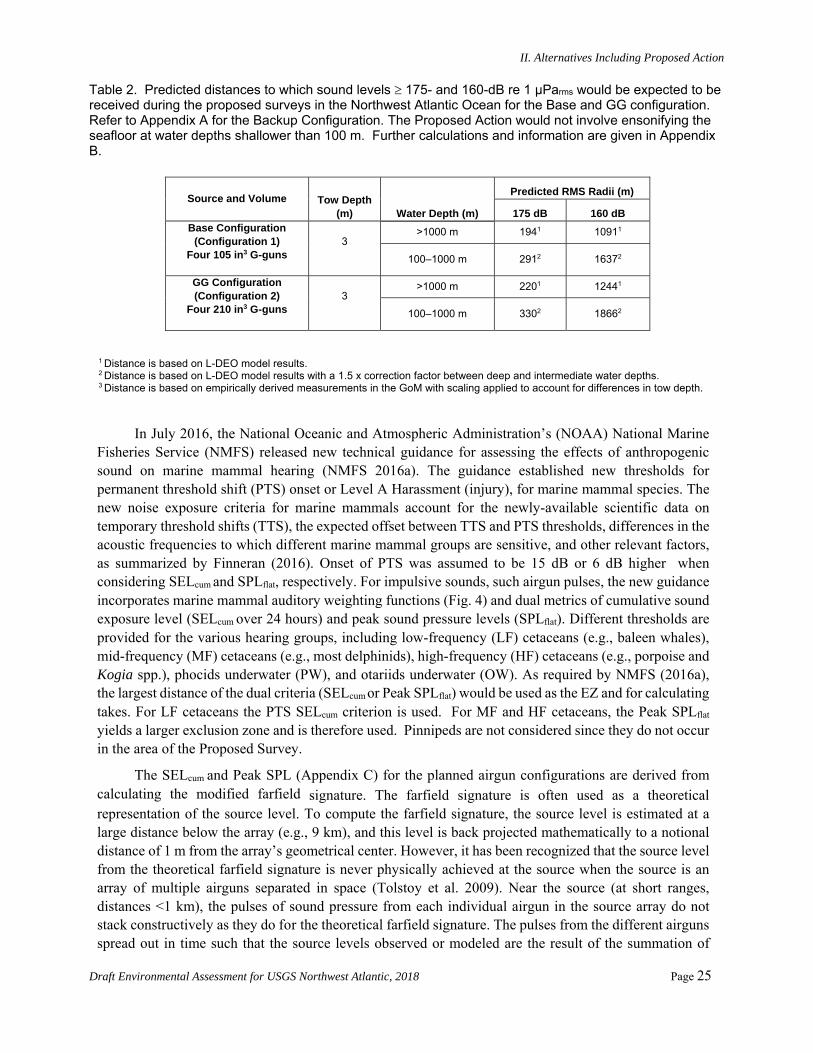
Table 2 shows the distances at which the 160- and 175-dB re 1µParms sound levels are expected to be received for the Base and GG source configurations. The 160-dB level is the behavioral disturbance criterion (Level B) that is used by NMFS to estimate anticipated takes for marine mammals; a 175-dB level is used by the National Marine Fisheries Service (NMFS) to determine behavioral disturbance for sea turtles.
It should be noted that the RMS (root mean square; average pressure over a pulse duration) received levels that are used as impact criteria for marine mammals are not directly comparable to the peak (p or 0–p) or peak to peak (p–p) values normally used to characterize source levels of airgun arrays. The measurement units used to describe airgun sources, peak or peak-to-peak decibels, are always higher than the rms decibels referred to in biological literature. A measured received sound pressure level (SPL) of 160
dB re 1 µParms in the far field would typically correspond to ~170 dB re 1 Pap or 176–178 dB re 1 μPap-p, as measured for the same pulse received at the same location (Greene 1997; McCauley et al. 1998, 2000). The precise difference between rms and peak or peak-to-peak values depends on the frequency content and duration of the pulse, among other factors. However, the rms level is always lower than the peak or peak-to-peak level for an airgun-type source.
A recent retrospective analysis of acoustic propagation of R/V Langseth sources in a coastal/shelf environment from the Cascadia Margin off Washington suggests that predicted (modeled) radii (using an approach similar to that used here) for Langseth sources were 2–3 times larger than measured in shallow water, so in fact, as expected, were very conservative (Crone et al. 2014). Similarly, analysis (Crone et al., 2017) of data collected during a survey off New Jersey in 2014 and 2015 confirmed that in situ measurements and estimates of the 160- and 180-dB distances collected by the Langseth hydrophone streamer were similarly 2–3 times smaller than the predicted operational mitigation radii. In fact, five separate comparisons conducted of the L-DEO model with in situ received levels2 have confirmed that the L-DEO model generated conservative exclusion zones, resulting in significantly larger EZs than necessary.
Southall et al. (2007) made detailed recommendations for new science-based noise exposure criteria. In July 2015, NOAA published a revised version of its 2013 draft guidance for assessing the effects of anthropogenic sound on marine mammals (NOAA 2015). At the time of preparation of this Draft EA, the content of the final guidelines and how they would be implemented are uncertain. As such, this Draft EA has been prepared in accordance with the current NOAA acoustic practices, and the procedures are based on best practices noted by Pierson et al. (1998), Weir and Dolman (2007), Nowacek et al. (2013), Wright (2014), and Wright and Cosentino (2015).
Enforcement of mitigation zones via power ramp-up procedures and shut downs would be implemented in the Operational Phase.
____________________________________ 2 L-DEO surveys off the Yucatán Peninsula in 2004 (Barton et al. 2006; Diebold et al. 2006), in the Gulf of Mexico in
2008 (Tolstoy et al. 2009; Diebold et al. 2010), off Washington and Oregon in 2012 (Crone et al. 2014), and off New Jersey in 2014 and 2015 (Crone 2015, L-DEO, pers. comm.)
II. Alternatives Including Proposed Action
Draft Environmental Assessment for USGS Northwest Atlantic, 2018 Page 25
Table 2. Predicted distances to which sound levels 175- and 160-dB re 1 μParms would be expected to be received during the proposed surveys in the Northwest Atlantic Ocean for the Base and GG configuration. Refer to Appendix A for the Backup Configuration. The Proposed Action would not involve ensonifying the seafloor at water depths shallower than 100 m. Further calculations and information are given in Appendix B.
Source and Volume Tow Depth (m) Water Depth (m)
Predicted RMS Radii (m)
175 dB 160 dB Base Configuration
(Configuration 1) Four 105 in3 G-guns
3
>1000 m 1941 10911
100–1000 m 2912 16372
GG Configuration (Configuration 2)
Four 210 in3 G-guns
3
>1000 m 2201 12441
100–1000 m 3302 18662
1 Distance is based on L-DEO model results. 2 Distance is based on L-DEO model results with a 1.5 x correction factor between deep and intermediate water depths. 3 Distance is based on empirically derived measurements in the GoM with scaling applied to account for differences in tow depth.
In July 2016, the National Oceanic and Atmospheric Administration’s (NOAA) National Marine
Fisheries Service (NMFS) released new technical guidance for assessing the effects of anthropogenic sound on marine mammal hearing (NMFS 2016a). The guidance established new thresholds for permanent threshold shift (PTS) onset or Level A Harassment (injury), for marine mammal species. The new noise exposure criteria for marine mammals account for the newly-available scientific data on temporary threshold shifts (TTS), the expected offset between TTS and PTS thresholds, differences in the acoustic frequencies to which different marine mammal groups are sensitive, and other relevant factors, as summarized by Finneran (2016). Onset of PTS was assumed to be 15 dB or 6 dB higher when considering SELcum and SPLflat, respectively. For impulsive sounds, such airgun pulses, the new guidance incorporates marine mammal auditory weighting functions (Fig. 4) and dual metrics of cumulative sound exposure level (SELcum over 24 hours) and peak sound pressure levels (SPLflat). Different thresholds are provided for the various hearing groups, including low-frequency (LF) cetaceans (e.g., baleen whales), mid-frequency (MF) cetaceans (e.g., most delphinids), high-frequency (HF) cetaceans (e.g., porpoise and Kogia spp.), phocids underwater (PW), and otariids underwater (OW). As required by NMFS (2016a), the largest distance of the dual criteria (SELcum or Peak SPLflat) would be used as the EZ and for calculating takes. For LF cetaceans the PTS SELcum criterion is used. For MF and HF cetaceans, the Peak SPLflat yields a larger exclusion zone and is therefore used. Pinnipeds are not considered since they do not occur in the area of the Proposed Survey.
The SELcum and Peak SPL (Appendix C) for the planned airgun configurations are derived from calculating the modified farfield signature. The farfield signature is often used as a theoretical representation of the source level. To compute the farfield signature, the source level is estimated at a large distance below the array (e.g., 9 km), and this level is back projected mathematically to a notional distance of 1 m from the array’s geometrical center. However, it has been recognized that the source level from the theoretical farfield signature is never physically achieved at the source when the source is an array of multiple airguns separated in space (Tolstoy et al. 2009). Near the source (at short ranges, distances <1 km), the pulses of sound pressure from each individual airgun in the source array do not stack constructively as they do for the theoretical farfield signature. The pulses from the different airguns spread out in time such that the source levels observed or modeled are the result of the summation of
II. Alternatives Including Proposed Action
Draft Environmental Assessment for USGS Northwest Atlantic, 2018 Page 26
pulses from a few airguns, not the full array (Tolstoy et al. 2009). At larger distances, away from the source array center, sound pressure of all the airguns in the array stack coherently only in the vertical direction. In the horizontal direction, the sound pressure does not always constructively interfere and stack coherently, resulting in smaller source levels (a few dB) than the source level derived from the farfield signature. Because the farfield signature does not take into account the interactions of the two airguns that occur near the source center and is calculated as a point source (single airgun), the modified farfield signature is a more appropriate measure of the sound source level for large arrays. For this smaller array, the modified farfield changes will be correspondingly smaller as well, but we use this method for consistency across all array sizes.
To estimate SELcum and Peak SPL, we used the acoustic modeling developed at L-DEO (same as used for Level B takes) with a small grid step to provide better resolution in both the inline and depth directions, with results shown in Appendix C. The propagation modeling takes into account all airgun interactions at short distances from the source including interactions between subarrays. This is done by using the NUCLEUS software to estimate the notional signature and the MATLAB software to calculate the pressure signal at each mesh point of a grid.
PTS onset acoustic thresholds estimated in the NMFS User Spreadsheet rely on overriding default values and calculating individual adjustment factors (dB) and by using the difference between levels with and without weighting functions for each of the five categories of hearing groups. The new adjustment factors in the spreadsheet allow for the calculation of SELcum isopleths in the spreadsheet and account for the accumulation (Safe Distance Methodology) using the source characteristics (duty cycle and speed) after Sivle et al. (2014). The methodology (input) for calculating the distances to the SELcum PTS thresholds (Level A) for the airgun array is shown in Table 2.
Appendix C provides detailed information about the acoustic modeling used for Level A takes, including NMFS spreadsheet-based calculations. Appendix C also gives a summary of all of the SEL SL modeling with and without applying the weighting function for the 5 hearing groups and the full calculations for the PTS SELcum and the Peak SPLflat.
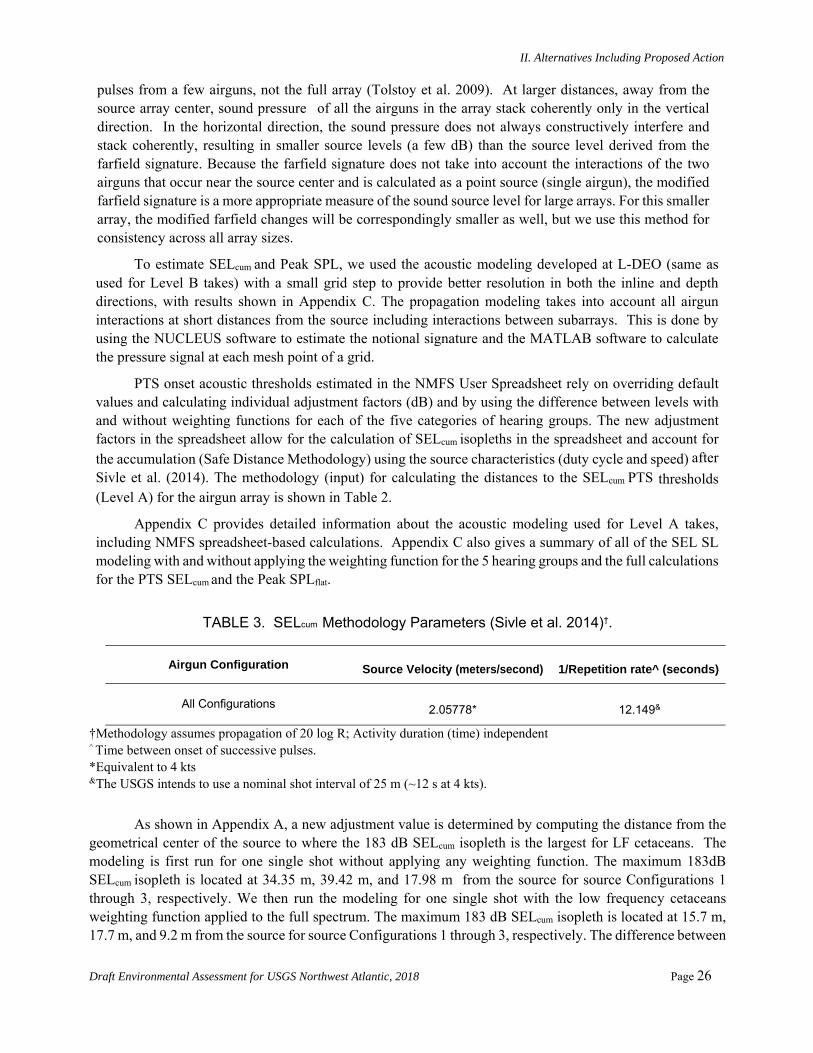
TABLE 3. SELcum Methodology Parameters (Sivle et al. 2014)†.
Airgun Configuration Source Velocity (meters/second) 1/Repetition rate^ (seconds)
All Configurations 2.05778* 12.149&
†Methodology assumes propagation of 20 log R; Activity duration (time) independent ^ Time between onset of successive pulses. *Equivalent to 4 kts &The USGS intends to use a nominal shot interval of 25 m (~12 s at 4 kts).
As shown in Appendix A, a new adjustment value is determined by computing the distance from the geometrical center of the source to where the 183 dB SELcum isopleth is the largest for LF cetaceans. The modeling is first run for one single shot without applying any weighting function. The maximum 183dB SELcum isopleth is located at 34.35 m, 39.42 m, and 17.98 m from the source for source Configurations 1 through 3, respectively. We then run the modeling for one single shot with the low frequency cetaceans weighting function applied to the full spectrum. The maximum 183 dB SELcum isopleth is located at 15.7 m, 17.7 m, and 9.2 m from the source for source Configurations 1 through 3, respectively. The difference between
II. Alternatives Including Proposed Action
Draft Environmental Assessment for USGS Northwest Atlantic, 2018 Page 27
these values for each of the source configurations yields adjustment factors of -6.8 dB, -6.9 dB, and -5.8 dB, respectively, assuming a propagation of 20log10R.
For MF and HF cetaceans, the modeling for a single shot with the weighted function applied leads to 0-m isopleths; the adjustment factors thus cannot be derived the same way as for LF cetaceans. Hence, for MF and HF cetaceans, and OW and PW pinnipeds, the difference between weighted and unweighted spectral source levels at each frequency up to 3 kHz was integrated to actually calculate these adjustment factors in dB. These calculations also account for the accumulation (Safe Distance Methodology) using the source characteristics (duty cycle and speed) after Sivle et al. (2014).
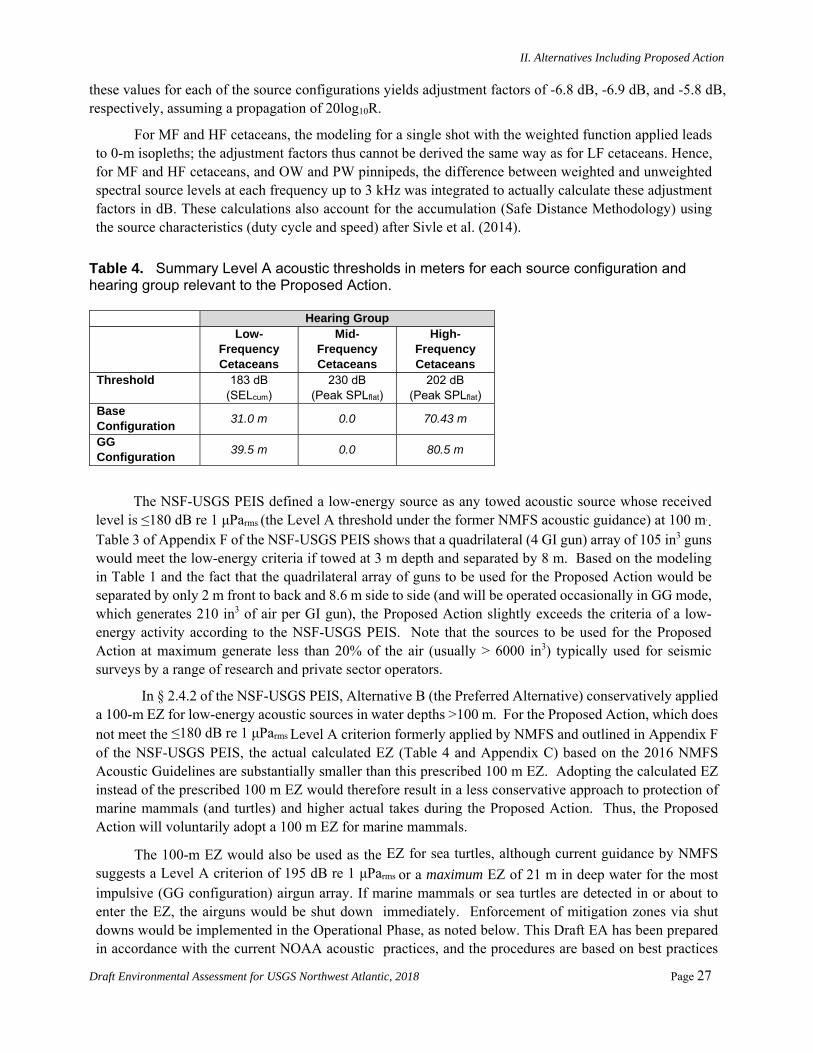
Table 4. Summary Level A acoustic thresholds in meters for each source configuration and hearing group relevant to the Proposed Action.
Hearing Group Low-
Frequency Cetaceans
Mid-Frequency Cetaceans
High-Frequency Cetaceans
Threshold 183 dB (SELcum)
230 dB (Peak SPLflat)
202 dB (Peak SPLflat)
Base Configuration
31.0 m 0.0 70.43 m
GG Configuration
39.5 m 0.0 80.5 m
The NSF-USGS PEIS defined a low-energy source as any towed acoustic source whose received level is ≤180 dB re 1 μParms (the Level A threshold under the former NMFS acoustic guidance) at 100 m.. Table 3 of Appendix F of the NSF-USGS PEIS shows that a quadrilateral (4 GI gun) array of 105 in3 guns would meet the low-energy criteria if towed at 3 m depth and separated by 8 m. Based on the modeling in Table 1 and the fact that the quadrilateral array of guns to be used for the Proposed Action would be separated by only 2 m front to back and 8.6 m side to side (and will be operated occasionally in GG mode, which generates 210 in3 of air per GI gun), the Proposed Action slightly exceeds the criteria of a low-energy activity according to the NSF-USGS PEIS. Note that the sources to be used for the Proposed Action at maximum generate less than 20% of the air (usually > 6000 in3) typically used for seismic surveys by a range of research and private sector operators.
In § 2.4.2 of the NSF-USGS PEIS, Alternative B (the Preferred Alternative) conservatively applied a 100-m EZ for low-energy acoustic sources in water depths >100 m. For the Proposed Action, which does not meet the ≤180 dB re 1 μParms Level A criterion formerly applied by NMFS and outlined in Appendix F of the NSF-USGS PEIS, the actual calculated EZ (Table 4 and Appendix C) based on the 2016 NMFS Acoustic Guidelines are substantially smaller than this prescribed 100 m EZ. Adopting the calculated EZ instead of the prescribed 100 m EZ would therefore result in a less conservative approach to protection of marine mammals (and turtles) and higher actual takes during the Proposed Action. Thus, the Proposed Action will voluntarily adopt a 100 m EZ for marine mammals.
The 100-m EZ would also be used as the EZ for sea turtles, although current guidance by NMFS suggests a Level A criterion of 195 dB re 1 μParms or a maximum EZ of 21 m in deep water for the most impulsive (GG configuration) airgun array. If marine mammals or sea turtles are detected in or about to enter the EZ, the airguns would be shut down immediately. Enforcement of mitigation zones via shut downs would be implemented in the Operational Phase, as noted below. This Draft EA has been prepared in accordance with the current NOAA acoustic practices, and the procedures are based on best practices

II. Alternatives Including Proposed Action
Draft Environmental Assessment for USGS Northwest Atlantic, 2018 Page 28
noted by Pierson et al. (1998), Weir and Dolman (2007), Nowacek et al. (2013a), Wright (2014), and Wright and Cosentino (2015). For the 160-dB “Safety Zone,” L-DEO model results for the GI gun configurations are used here to determine the 160-dB radius (Table 1).
(b) Operational Phase
The operational mitigation measures to be implemented by the USGS are described in § 2.4.1.1 of the NSF-USGS PEIS and include:
monitoring by PSOs for marine species (including marine mammals, sea turtles, and ESA-listed seabirds diving near the vessel and also observing for potential impacts of acoustic sources on fish);
PSVO data and documentation; and
mitigation during operations (speed or course alteration; shut-down and ramp-up procedures, including for threatened/endangered seabirds; avoidance of concentrations of large whales; directional shooting to maximize protection of mammals in certain habitats).
The proposed operational mitigation measures are standard for all seismic cruises, per the NSF-USGS PEIS, and therefore are not discussed further here. Special mitigation measures were considered for this cruise. It is unlikely that concentrations of large whales would be encountered, but if so, they would be avoided.
Marine mammals and sea turtles are known to occur in the proposed project area. However, the number of individual animals expected to be approached closely during the proposed activities would be relatively small in relation to regional population sizes, as shown in §IV. With the proposed monitoring and mitigation provisions, potential effects on most if not all individuals would be expected to be limited to minor behavioral disturbance. Those potential effects would be expected to have negligible impacts both on individual marine mammals and on the associated species and stocks. Survey operations would be conducted in accordance with all applicable U.S. federal regulations, including IHA and ITS requirements.
Alternative 1: Alternative Survey Timing
An alternative to issuing the IHA for the period requested and to conducting the project then would be to conduct the project at an alternative time, implementing the same monitoring and mitigation measures as under the Proposed Action, and requesting an IHA to be issued for that alternative time (Table 5). The proposed August 2018 timing for the cruise is the most suitable time logistically for R/V Hugh R. Sharp and the participating scientists. If the IHA is issued for another period, it could result in significant delay and disruption not only of this cruise, but also of additional studies that are planned using the equipment or the vessel in 2018 and beyond. An evaluation of the effects of this Alternative Action is given in § IV.
Alternative 2: No Action Alternative An alternative to conducting the proposed activities is the “No Action” alternative, i.e., do not conduct the research operations; an IHA and ITS would not be necessary (Table 5). From NMFS’ perspective, pursuant to its obligation to grant or deny permit applications under the MMPA, the “No Action” alternative entails NMFS denying the application for an IHA. If NMFS were to deny the application, action proponents would not be authorized to incidentally take marine mammals. If the research was not conducted, the “No Action” alternative would result in no disturbance to marine mammals from the proposed activities. The “No Action” alternative does not address the national need for new data about the distribution of gas hydrates on the Mid-Atlantic margin. The U.S. would continue to rely on data more than 30 years old to delineate
II. Alternatives Including Proposed Action
Draft Environmental Assessment for USGS Northwest Atlantic, 2018 Page 29
these gas hydrate resources and associated shallow gas. The U.S. would not acquire data that could also be used for analysis of submarine slide hazards in this area.
The “No Action” alternative could also potentially affect other research community studies that would be carried out on the R/V Hugh R. Sharp in 2018 and later, depending on the timing of the decision. Not conducting this cruise (no action) would result in the U.S. continuing to lack modern multichannel seismic data for a significant portion of the mid-Atlantic margin and not having access to suitable information to constrain the distribution of methane hydrates and shallow gas. Data collection would be an essential first step for a much greater effort to analyze and report information related to the geological structure and distribution of gas/gas hydrate on the mid-Atlantic part of the U.S. Atlantic margin. The dataset that the USGS proposes to collect will likely be used for at least three decades into the future based on past experience. Effects of this Alternative Action are evaluated in § IV.
Alternatives Considered but Eliminated from Further Analysis
1. Alternative E1: Alternative Location
The survey area has been chosen based on an analysis of the locations of existing high-resolution modern multichannel seismic data, older “legacy” data, known gas hydrate features identified by BOEM (2012a) and the USGS (Ruppel et al., 2015), and the published locations of known methane seeps (Skarke et al., 2014). The U.S. Mid-Atlantic margin is the highest priority area for surveys delineating the locations of gas hydrate and free gas in sediments, studying the links between gas hydrate systems and widespread methane seeps, and acquiring modern MCS data. While there are other areas on the margin where surveys could be carried out, they have lower priority at present due either to the availability of more recently acquired MCS data, the highly-eroded nature of the sediments, and/or the absence of known methane hydrates/methane seeps.
2. Alternative E2: Use of Alternative Technologies
As described in § 2.6 of the NSF-USGS PEIS, alternative technologies to the use of airguns are typically investigated to conduct marine geophysical research. At the present time, these technologies are still not feasible, widely available, or appropriate to meet the Purpose and Need. Additional details about these technologies are given in the Final USGS EA (RPS 2013) for the 2013 Gulf of Mexico Gas Hydrates Project (SIGH). Table 5 provides a summary of the proposed action, alternatives, and alternatives eliminated from further analysis

II. Alternatives Including Proposed Action
Draft Environmental Assessment for USGS Northwest Atlantic, 2018 Page 30
TABLE 5. Summary of Proposed Action, Alternatives Considered, and Alternatives Eliminated.
Proposed Action Description/Analysis
Proposed Action: Conduct marine geophysical surveys and associated activities in the Northwest Atlantic Ocean
Under this action, the use of GI gun seismic sources is proposed. When considering mobilization, demobilization, equipment maintenance, weather, marine mammal activity, and other contingencies, the proposed activities would be expected to be completed in a maximum of 22 days. The affected environment, environmental consequences, and cumulative impacts of the proposed activities are described in Sections III, IV, and V, respectively. The standard monitoring and mitigation measures identified in the NSF-USGS PEIS would apply, along with any additional requirements identified by regulating agencies. All necessary permits and authorizations, including an IHA, would be requested from regulatory bodies.
Alternatives Description/Analysis
Alternative 1: Alternative Survey Timing
Under this Alternative, the USGS would conduct survey operations at a different time of the year to reduce potential impacts on marine resources and users, and improve monitoring capabilities. However, except for some migratory species, most marine mammal species occur in the project area year-round, so altering the timing of the proposed project likely would result in no net benefits for those species and could make it more likely that survey time is lost due to weather, meaning that surveys would have to be repeated in the future (greater sound exposure for mammals). Further, consideration would be needed for constraints for vessel operations and availability of equipment (including the vessel) and personnel. Limitations on scheduling the vessel include the additional research studies planned on the vessel for 2018 and beyond and the lack of equipment availability within the U.S. research fleet at other times. The standard monitoring and mitigation measures identified in the NSF-USGS PEIS would apply and are described in further detail in this document (Section II [3]) along with any additional requirements identified by regulating agencies. All necessary permits and authorizations, including an IHA, would be requested from regulatory bodies.
Alternative 2: No Action
Under this Alternative, no proposed activities would be conducted and seismic data would not be collected. Whereas this alternative would avoid impacts to marine resources, it would not meet the purpose and need for the proposed action. The collection of new data, interpretation of these data, and introduction of new results into the greater scientific community would not be achieved. No permits and authorizations, including an IHA, would be necessary from regulatory bodies as the proposed action would not be conducted.
Alternatives Eliminated from Further Analysis
Description/Analysis
Alternative E1: Alternative Location
The Survey Areas in the Northwest Atlantic Ocean are those in which modern MCS data on the distribution of gas hydrates and shallow natural gas are lacking, yet studies by BOEM and the USGS have identified areas likely to host widespread gas hydrate deposits. Since this is the part of the margin with the most active methane seepage, but lacking modern seismic data, a different site does not serve the goal of acquiring new data in the mid-Atlantic data gap.
Alternative E2: Alternative Survey Techniques
Under this alternative, the USGS would use alternative survey techniques, e.g., marine vibroseis, that could potentially reduce impacts on the marine environment. Alternative technologies were evaluated in the NSF-USGS PEIS, § 2.6. At the present time, these technologies are still in the testing phase. They are still not feasible, viable for routine seismic data acquisition, or appropriate to meet the Purpose and Need.

III. Affected Environment
Draft Environmental Assessment for USGS Northwest Atlantic, 2018 Page 31
III. AFFECTED ENVIRONMENT Parts of this section are adopted verbatim from the Draft Scripps EA (LGL, 2017). Based on the NSF-
USGS PEIS, Chapter 3, the description of the affected environment focuses only on those resources potentially subject to impacts. Accordingly, the discussion of the affected environment (and associated analyses) focuses mainly on marine biological resources because the short-term seismic activities proposed by the USGS for the Northwest Atlantic in 2018 have the potential to affect marine biological resources within the project area. These resources are identified below in the following parts of § III, and the potential impacts on these resources are discussed in § IV. Initial review and analysis of the proposed project activities determined that the following resource issues did not require further analysis in this EA:
Transportation—Only the R/V Hugh R. Sharp will be used during the seismic survey. This single ship represents a neglible amount of additional ship traffic in the analysis area, which is heavily used for commercial and military vessels;
Air Quality/Greenhouse Gases—Vessel emissions would result from the proposed activities; however, these short-term emissions would not result in any exceedance of Federal Clean Air standards. Emissions would be expected to have a negligible impact on the air quality within the survey area. Per EPA requirements, the R/V Hugh R. Sharp is a low emissions vessel.
Land Use—All activities are proposed to occur in the marine environment. Therefore, no changes to current land uses or activities within the survey area would result from the proposed activities;
Safety and Hazardous Materials and Management—With the exception of lithium-ion batteries needed to power components of “birds” that stabilize the streamer and marine diesel fuel used to power the compressors, no hazardous materials would used during the Proposed Action. All Project-related wastes would be disposed of in accordance with applicable laws.
Geological Resources (Topography, Geology and Soil)—The Proposed Action would not result in the displacement or disruption of seafloor sediment. Proposed activities would not adversely affect geologic resources as only minor impacts would occur;
Water Resources—There are no proposed discharges to the marine environment that would adversely affect marine water quality. Therefore, there would be no impacts to water resources resulting from the proposed Project activities;
Terrestrial Biological Resources—All proposed Project activities would occur in the marine environment and would not affect terrestrial biological resources;
Socioeconomic and Environmental Justice—Implementation of the proposed Project would not affect, beneficially or adversely, socioeconomic resources, environmental justice, or the protection of children. No changes in the population or additional need for housing or schools would occur. Human activities in the area around the survey vessel are expected to be limited to commercial and recreational fishing, shipping, and military traffic;
Visual Resources—No visual resources should be negatively affected because the area of operation is significantly outside of the land and coastal view shed; and
Cultural Resources—While the surveys may cross shipwrecks, no impacts are expected, nor will the sensing technology used even be able to locate these shipwrecks. For example, the ship will not be conducting bathymetric or backscatter surveys of the seafloor. The proposed activities will not disturb shipwrecks.
III. Affected Environment
Draft Environmental Assessment for USGS Northwest Atlantic, 2018 Page 32
(1) Oceanography
The Study Area lies offshore the Mid-Atlantic Bight (MAB), a 621 mi (1,000 km) coastal region stretching from Massachusetts to North Carolina. The Proposed Action is within the southern half of the MAB, with the northern edge located 35 nm south of Hudson Canyon and Cape Hatteras representing the southern extent. The western edge of the Study Area lies at the shelf-break and includes the heads of large shelf-breaking canyons, including Baltimore Canyon, Washington Canyon, and Norfolk Canyon. The eastern edge is wholly within the US EEZ.
Much of the information below has been taken verbatim or adapted from the “Final Environmental Assessment for Seismic Reflection Scientific Research Surveys During 2014 and 2015 in Support of Mapping the U.S. Atlantic Seaboard Extended Continental Margin and Investigating Tsunami Hazards,” prepared for the U.S. Geological Survey in 2014 (RPS, 2014a) or from the Draft ENAM EA (RPS, 2014c).
The area of the Proposed Action is greatly influenced by the Gulf Stream, although the core of the Gulf Stream heads northeast and lies farther offshore with increasing distance north of Cape Hatteras. The Gulf Stream is a powerful, warm, and swiftly flowing Western Boundary Current current that carries warm equatorial waters into the North Atlantic (Pickard and Emery, 1990; Verity et al., 1993). Eddies often spin off the Gulf Stream and carry warm-cored water masses toward and sometimes onto the shelf. Between the Gulf Stream’s main flow and the location of the shelf break, counterclockwise gyres often develop, entraining warm water from the Gulf Stream and colder waters from near the shelf-break. Landward of these systems, currents can be complicated. The shelf-break current (primarily the Scotian current) flows southward in much of the study area, but near-surface waters sometimes locally reverse direction. Upwelling along the Atlantic coast is both wind-driven and a result of dynamic uplift (Shen et al., 2000; Lentz et al., 2003).
In addition to these currents, currents originating from the outflow of both the Chesapeake and Delaware Bays influence the surface circulation in the MAB. The Chesapeake Bay plume flows seaward from the mouth of the Bay and then turns south to form a coastal jet that can extend as far as Cape Hatteras. Similarly, the Delaware Coastal Current begins in Delaware Bay and flows southward along the Delmarva Peninsula before being entrained into the Chesapeake Bay plume.
The climate for the Study Area is that of a typical marine environment. It is influenced to varying degrees year–round by passing systems, prevailing winds, and warm Gulf Stream waters. Three atmospheric pressure systems control the wind patterns and climate for this region: The Bermuda-Azores High, the Icelandic Low, and the Ohio Valley High (Blanton et al., 1985). The Bermuda-Azores High dominates the climate in the region from approximately May through August, and produces south-easterly winds of <6 m/s (<20 ft/s) (BOEM, 2012b). Persistent high levels of humidity and moisture during this time can increase precipitation levels and increase fog.
The proposed Study Area is susceptible to tropical and sub-tropical cyclones, which can greatly influence the weather and sea state. During the summer and fall, tropical cyclones are severe, but infrequent (BOEM 2012b). In contrast, during the winter and spring, extra-tropical cyclones occur frequently. Most storms, including hurricanes, occur during the North Atlantic hurricane season from June through November. Between 1815 and 2015, Atlantic tropical storms and hurricanes were most frequent in September, followed by August then October according to data from the National Hurricane Center cited by NOAA’s Atlantic Oceanographic and Meteorological Laboratory (http://www.aoml.noaa.gov/hrd/tcfaq/E17.html).
(2) Protected Areas
The Proposed Action, contained as it is within th EEZ, does not overlap with any international Ecologically or Biologically Significant Marine Areas (EBSAs). The action lies close to the region of the North Atlantic called the Sargasso Sea, which is considered an EBSA, and intersects a U.S. Marine Protected Area (MPA) on the western side of the Sargasso Sea. More information about the Sargasso Sea is provided in the MPA section below.
III. Affected Environment
Draft Environmental Assessment for USGS Northwest Atlantic, 2018 Page 33
The Proposed Action overlaps with several U.S. MPAs, although most of these are so designated based on restrictions in fishing activities, which are not the focus of the seismic surveys. The MPAs within the Proposed Action area include: Frank R. Lautenberg Deep Sea Coral Protection Area, Mid-Atlantic Coastal Waters Area, the Norfolk Canyon Gear Restricted Ara, Offshore Trap/Pot Waters, the “Other” Northeast Gillnet Waters Area, the Pelagic Sargassum Habitat Restricted Area, the Southern Mid-Atlantic Waters Closure Area, the New Jersey offshore closure area, and the Southern Nearshore Pot-Trap Pot Waters. All of these are considered fishery management areas except the Norfolk Canyon area (gear restriction) and the Lautenberg Deep Sea Coral area, which protects corals. All areas are subject to non-MPA Programmatic Species Management Plans. Commercial fishing is restricted in all areas, while both commercial and recreational fishing are restricted in the Lautenberg Deep Sea Coral Protection Area. Some of these MPA have seasonal restrictions, while others have year-round restrictions. The surveys are not located in de facto MPAs, although the ship will transit through these without seismic gear active on the way to and from ports in Norfolk and Lewes.
Frank R. Lautenberg Deep Sea Coral Protection Area
The northernmost 75% of the Proposed Action lies almost completely within the boundaries of the Frank R. Lautenberg Deep Sea Coral Protection Area. The area was designated by NOAA Fisheries and the Mid-Atlantic Fishery Management Council in 2016 to protect very slow-growing deep corals that live on the outer continental shelf and in some canyon areas. Within the protected area, fishing activities that interfere with the seabed are restricted, but recreational fishing and other activities may continue. The Proposed Action does not disrupt the seabed and is not expected to have an impact on deep sea corals within the Protection Area.
The Sargasso Sea
The Sargasso Sea occupies the area within the Northern Atlantic Subtropic Gyre, mostly on the high seas, outside the EEZs of most countries. The area is dynamically bound on the west by the Gulf Stream and on the north by the North Atlantic Current. The northwest corner of the Sargasso Sea therefore often lies within the US EEZ, depending on the course of the Gulf Stream. Sargassum is a floating algae that occurs only in the open ocean, and the Sargasso Sea is the only place in the world this ecosystem is found. Sargassum is particularly important for turtles, particularly loggerheads, but also plays a role in the life cycles of some crustaceans, fish, and marine mammals (e.g., humpbacks). The U.S. has designated the Pelagic Sargassum Habitat Restricted Area to regulate fishing in this area. The southernmost exemplary survey lines for the Proposed Action, as well as the deepwater portions of some of the exemplary lines in the Mid-Atlantic region, intersect the designated loggerhead sea turtle (Caretta caretta) critical habitat for the Northwest Atlantic Ocean Distinct Population (see below).
(3) Marine Mammals
Much of the following section is taken verbatim from the Draft Scripps EA (LGL, 2017). Thirty-four marine mammal species could occur in the general survey area, including 7 mysticetes (baleen whales) and 27 odontocetes (toothed whales, such as dolphins) (Table 6). To avoid redundancy, we have included the required information about the species and (insofar as it is known) numbers of these species in § IV, below. Five of the species that could occur in the proposed project area are listed under the ESA as endangered, including the sperm, sei, fin, blue, and North Atlantic right whales. General information on the taxonomy, ecology, distribution and movements, and acoustic capabilities of marine mammals are given in § 3.6.1, § 3.7.1, and § 3.8.1 of the NSF-USGS PEIS.

III. Affected Environment
Draft Environmental Assessment for USGS Northwest Atlantic, 2018 Page 34
One of the detailed analysis areas (DAAs) defined in the NSF-USGS PEIS §2.3.1.1 is in the Northwest (NW) Atlantic and lies at the northernmost end of the Survey Area for this Proposed Action, encompassing the area out to 1500 m water depth. The distributions of mysticetes, odontocetes, and pinnipeds in the NW Atlantic DAA are discussed in §3.6.2.1, §3.7.2.1, and §3.8.2.1 of the NSF-USGS PEIS, respectively. The rest of this section deals specifically with species distribution in the area of the Proposed Action.
Three cetacean species occur in Atlantic arctic waters, and their ranges do not extend as far south as the proposed project area: the narwhal, Monodon Monoceros; the beluga, Delphinapterus leucas; and the bowhead, Balaena mysticetus. Two additional Atlantic cetacean species, the Atlantic humpback dolphin (Souza teuszii) found in coastal waters of western Africa, and the long-beaked common dolphin (Delphinus capensis) found in coastal waters of South America and western Africa, do not occur in the study area.
Pinniped species that are known to occur in North Atlantic waters, but that will not occur in the area of the Proposed Action, include the gray seal (Halichoerus grypus), harbor seal (Phoca vitulina), and bearded seal (Erignathus barbatus). Pinniped species are not discussed further in this EA, nor are takes calculated for these species given that they would not be encountered.
3. Mysticetes
The following information has mostly been copied verbatim from the Draft Scripps EA (LGL, 2017) and then modified for the specific circumstances of the USGS Proposed Action, when appropriate. Table 6 summarizes the conservation status, estimated population, habitat, and survey specific information for each species.
North Atlantic Right Whale (Eubalaena glacialis)
The North Atlantic right whale occurs primarily in the continental shelf waters of the eastern U.S. and Canada, from Florida to Nova Scotia (Winn et al. 1986; Jefferson et al. 2015). Survey data have identified seven major habitats or congregation areas for North Atlantic right whales: coastal waters of the southeastern United States; Great South Channel; Jordan Basin; Georges Basin along the northern edge of Georges Bank; Cape Cod and Massachusetts Bays; Bay of Fundy; and Roseway Basin on the Scotian Shelf (Hayes et al. 2017). There is a general seasonal north-south migration between feeding and calving areas (Gaskin 1982). The migration route between the Cape Cod spring/summer feeding grounds and the Georgia/Florida winter calving grounds is known as the mid-Atlantic corridor, and whales move through these waters regularly in all seasons (Reeves and Mitchell 1986; Winn et al. 1986; Kenney et al. 2001; Reeves 2001; Knowlton et al. 2002; Whitt et al. 2013). The majority of sightings (94%) along the migration corridor are within 56 km of shore (Knowlton et al. 2002).
During the summer and into fall (June–November), right whales are most commonly seen on feeding grounds in Canadian waters off Nova Scotia, with peak abundance during August, September, and early October (Gaskin 1987). Some right whales, including mothers and calves, remain on the feeding grounds through the fall and winter. However, the majority of the right whale population leaves the feeding grounds for unknown wintering habitats and returns when the cow-calf pairs return. The majority of the right whale population is unaccounted for on the southeastern U.S. winter calving ground, and not all reproductively-active females return to the area each year (Kraus et al. 1986; Winn et al. 1986; Kenney et al. 2001). Other wintering areas have been suggested, based on sparse data or historical whaling logbooks; these include the Gulf of St. Lawrence, Newfoundland and Labrador, coastal waters of New York and between New Jersey and North Carolina, Bermuda, and Mexico (Payne and McVay 1971; Aguilar 1986; Mead 1986; Lien et al. 1989; Knowlton et al. 1992; Cole et al. 2009; Patrician et al. 2009).

III. Affected Environment
Draft Environmental Assessment for USGS Northwest Atlantic, 2018 Page 35
In more than 5000 recorded global sightings of North Atlantic right whales, there have been 11 within the polygon that bounds the exemplary surveys (OBIS, 2017). No sightings have been reported in July, August or September within the survey area (Figure 7). Given the small size of the population and their typical summer range, North Atlantic right whales should not be encountered during the USGS surveys.
Humpback Whale (Megaptera novaeangliae)
The humpback whale is found throughout all of the oceans of the world (Clapham 2009). Although considered to be mainly a coastal species, humpbacks often traverse deep pelagic areas while migrating (Clapham and Mattila 1990; Norris et al. 1999; Calambokidis et al. 2001). Humpback whales migrate between summer feeding grounds in high latitudes and winter calving and breeding grounds in tropical waters (Winn and Reichley 1985; Clapham and Mead 1999; Smith et al. 1999). The summer feeding grounds in the North Atlantic range from the northeast coast of the U.S. to the Barents Sea (Katona and Beard 1990; Smith et al. 1999). Humpbacks in the North Atlantic primarily migrate to wintering areas in the West Indies (Jann et al. 2003), but some also migrate to Cape Verde (Carrillo et al. 1999; Wenzel et al. 2009). A small proportion of the Atlantic humpback whale population remains in high latitudes in the eastern North Atlantic during winter (e.g., Christensen et al. 1992).
Based on density modeling by Mannocci et al. (2017) for the western North Atlantic, higher densities are expected to occur north of 40N during the summer; very low densities are expected south of 40N, and the USGS proposed survey is entirely south of this latitude.
Of the more than 43,000 global sightings of humpback whale individuals or groups dating back more than 50 years in the OBIS database (2017), only 79 occurred within a rectangular block containing the exemplary proposed USGS seismic survey lines. Of these, fourteen sightings occurred during July, August, or September, primarily on the continental shelf between north of Washington Canyon and the mouth of Delaware Bay (Figure 7). Three of these sitings have been at or seaward of the shelf break, near the landward ends of the two northernmost exemplay USGS seismic lines.
Humpback whales could be encountered in the proposed project area during an August survey, but this would be an extremely rare occurrence.
Minke Whale (Balaenoptera acutorostrata)
The minke whale has a cosmopolitan distribution that spans from tropical to polar regions in both hemispheres (Jefferson et al. 2015). Some populations migrate from high latitude summering grounds to lower latitude wintering grounds (Jefferson et al. 2015). In the Northern Hemisphere, the minke whale is usually seen in coastal areas, but can also occur in pelagic waters during northward migrations in spring and summer, and southward migration in autumn (Stewart and Leatherwood 1985; Perrin and Brownell 2009). There are four recognized minke whale populations in the North Atlantic: Canadian east coast, west Greenland, central North Atlantic, and northeast Atlantic (Donovan 1991). Based on density modeling by Mannocci et al. (2017) for the western North Atlantic, higher densities are expected to occur north of 40N; very low densities are expected south of 40N.
Most minke whale sitings south of 40N have been on the continental shelf, at water depths shallower than the proposed USGS seismic lines. Minke whales may occasionally be encountered seaward of the shelf-break during the proposed USGS surveys. Of the more than 15,000 sightings of minke whale individuals or groups dating back more than 50 years in the OBIS database, 51 occurred within a rectangular block containing the exemplary proposed USGS seismic survey lines. Of these, twelve sightings comprising 21 individuals occurred during July, August, or September (Figure 7). Only two of the sightings were seaward of the shelf break, including one near Washington Canyon and another beyond the distal, deepwater termini of the three central USGS exemplary seismic transects.
III. Affected Environment
Draft Environmental Assessment for USGS Northwest Atlantic, 2018 Page 36
Minke whales could be encountered near the survey lines in August, but this would be a rare occurrence.
Bryde’s Whale (Balaenoptera edeni/brydei)
Bryde’s whale is found in tropical and subtropical waters throughout the world between 40ºN and 40ºS, generally in waters warmer than 20ºC, but at minimum 15ºC (Reeves et al. 1999; Kanda et al. 2007; Kato and Perrin 2009). It can be pelagic as well as coastal (Jefferson et al. 2015). It does not undertake long north/south migrations, although local seasonal movements toward the Equator in winter and to higher latitudes in summer take place in some areas (Evans 1987; Jefferson et al. 2015). Of 914 usable sightings in the iOBIS database, none occurred within the larger box enclosing the proposed survey in any season (Figure 7). Still, Bryde’s whales could possibly be encountered in the proposed project area.
Sei Whale (Balaenoptera borealis)
The distribution of the sei whale is not well known, but it is found in all oceans and appears to prefer mid-latitude temperate waters (Gambell 1985a). The sei whale is pelagic and generally not found in coastal waters (Harwood and Wilson 2001; Jefferson et al. 2015). It is found in deeper waters characteristic of the continental shelf edge region (Hain et al. 1985) and in other regions of steep bathymetric relief such as seamounts and canyons (Kenney and Winn 1987; Gregr and Trites 2001). On feeding grounds, sei whales associate with oceanic frontal systems (Horwood 1987). Sei whales migrate from temperate zones occupied in winter to higher latitudes in the summer, where most feeding takes place (Gambell 1985a). A small number of individuals have been sighted in the eastern North Atlantic between October and December, indicating that some animals may remain at higher latitudes during winter (Evans 1992). Sei whales have been seen from South Carolina south into the Gulf of Mexico and the Caribbean during winter (Rice 1998); however, the location of sei whale wintering grounds in the North Atlantic is unknown (Víkingsson et al. 2010).
There are three sei whale stocks in the North Atlantic: Nova Scotia, Iceland-Denmark Strait, and Eastern (Donovan 1991). Based on density modeling by Mannocci et al. (2017) for the western North Atlantic, higher densities are expected to occur north of 40N during the summer; very low densities are expected south of 40N, where the USGS surveys are entirely located.
Of the more than 11,000 sightings of sei whale individuals or groups dating back more than 50 years in the OBIS database, only 7 occurred within a rectangular block containing the exemplary proposed USGS seismic survey lines. Of these, only two sightings, comprising three individuals in total, occurred between in July, August, or September (Figure 7). Sei whales could be encountered in the proposed project area during an August survey, but this would be an extremely rare occurrence.
Fin Whale (Balaenoptera physalus)
Fin whales are widely distributed in all the world’s oceans in coastal, shelf, and oceanic waters, and typically occur in temperate and polar regions (Gambell 1985b; Perry et al. 1999; Gregr and Trites 2001; Jefferson et al. 2015). Fin whales tend to follow steep slope contours, either because they detect them readily or because biological productivity is high along steep contours because of tidal mixing and perhaps current mixing (Sergeant 1977). Fin whales appear to have complex seasonal movements and are seasonal migrants; they mate and calve in temperate waters during the winter and migrate to feed at northern latitudes during the summer (Gambell 1985b). They are known to use the shelf edge as a migration route (Evans 1987).
In the North Atlantic, fin whales are found in summer from Baffin Bay, Spitsbergen, and the Barents Sea, south to North Carolina and the coast of Portugal (Rice 1998). In winter, they have been sighted from Newfoundland to the Gulf of Mexico and the Caribbean, and from the Faroes and Norway south to the
III. Affected Environment
Draft Environmental Assessment for USGS Northwest Atlantic, 2018 Page 37
Canary Islands (Rice 1998). Based on geographic differences in fin whale calls, Delarue et al. (2014) suggested that there are four distinct stocks in the Northwest Atlantic, including a central North Atlantic stock that and extends south along the Mid-Atlantic Ridge. Similarly, the four stocks in the Northwest Atlantic currently recognized by NAMMCO (2016) are located off West Iceland (in the Central Atlantic), Eastern Greenland, Western Greenland, and Eastern Canada.
Based on density modeling by Mannocci et al. (2017) for the western North Atlantic, higher densities are expected to occur north of 40N; very low densities are expected south of 40N, where the USGS surveys are entirely located. Of the more than 68,000 sightings of fin whale individuals or groups dating back more than 50 years in the OBIS database, 131 occurred within a rectangular block containing the exemplary proposed USGS seismic survey lines. Of these, 29 sightings, comprising 60 individuals in total, occurred during July, August, or September (Figure 7). Fin whales could be encountered during the proposed August surveys, particularly closer to the shelf edge and near the uppermost continental slope.
Blue Whale (Balaenoptera musculus)
The blue whale has a cosmopolitan distribution and tends to be pelagic, only coming nearshore to feed and possibly to breed (Jefferson et al. 2015). It is most often found in cool, productive waters where upwelling occurs (Reilly and Thayer 1990). The distribution of the species, at least during times of the year when feeding is a major activity, occurs in areas that provide large seasonal concentrations of euphausiids (Yochem and Leatherwood 1985). Seamounts and other deep ocean structures may be important habitat for blue whales (Lesage et al. 2016). Generally, blue whales are seasonal migrants between high latitudes in summer, where they feed, and low latitudes in winter, where they mate and give birth (Lockyer and Brown 1981). Their summer range in the North Atlantic extends from Davis Strait, Denmark Strait, and the waters north of Svalbard and the Barents Sea, south to the Gulf of St. Lawrence and the Bay of Biscay (Rice 1998). Although the winter range is mostly unknown, some occur near Cape Verde at that time of year (Rice 1998).
Of the more than 16,000 sightings of blue whale individuals or groups dating back more than 50 years in the OBIS database, only 2 occurred within a rectangular block containing the exemplary proposed USGS seismic survey lines. One of these, comprising a single individual, occurred during July, August, or September and was located ~85 nautical miles offshore New Jersey, on the upper continental slope between the two northernmost exemplary USGS seismic lines to be acquired down the continental slope (dip lines) and may either be an extralimital animal or a misidentification (Figure 7). While it would be a very rare occurrence, it is possible that a blue whale could be encountered in the proposed project area during an August seismic survey.
4. Odontocetes
Sperm Whale (Physeter macrocephalus)
The sperm whale is the largest of the toothed whales, with an extensive worldwide distribution (Rice 1989). Sperm whale distribution is linked to social structure: mixed groups of adult females and juvenile animals of both sexes generally occur in tropical and subtropical waters, whereas adult males are commonly found alone or in same-sex aggregations, often occurring in higher latitudes outside the breeding season (Best 1979; Watkins and Moore 1982; Arnbom and Whitehead 1989; Whitehead and Waters 1990). Sperm whales generally are distributed over large areas that have high secondary productivity and steep underwater topography, in waters at least 1000 m deep (Jaquet and Whitehead 1996; Whitehead 2009). They are often found far from shore, but can occur closer to oceanic islands that rise steeply from deep ocean waters (Whitehead 2009).
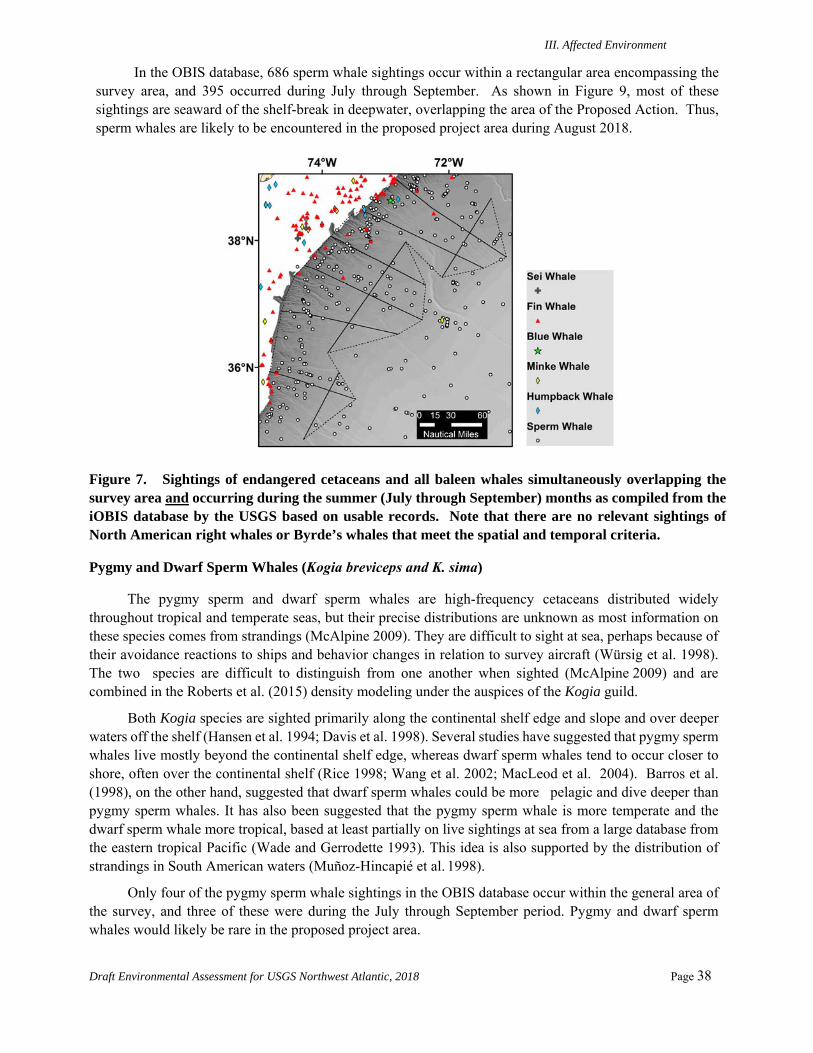
III. Affected Environment
Draft Environmental Assessment for USGS Northwest Atlantic, 2018 Page 38
In the OBIS database, 686 sperm whale sightings occur within a rectangular area encompassing the survey area, and 395 occurred during July through September. As shown in Figure 9, most of these sightings are seaward of the shelf-break in deepwater, overlapping the area of the Proposed Action. Thus, sperm whales are likely to be encountered in the proposed project area during August 2018.
Figure 7. Sightings of endangered cetaceans and all baleen whales simultaneously overlapping the survey area and occurring during the summer (July through September) months as compiled from the iOBIS database by the USGS based on usable records. Note that there are no relevant sightings of North American right whales or Byrde’s whales that meet the spatial and temporal criteria.
Pygmy and Dwarf Sperm Whales (Kogia breviceps and K. sima)
The pygmy sperm and dwarf sperm whales are high-frequency cetaceans distributed widely throughout tropical and temperate seas, but their precise distributions are unknown as most information on these species comes from strandings (McAlpine 2009). They are difficult to sight at sea, perhaps because of their avoidance reactions to ships and behavior changes in relation to survey aircraft (Würsig et al. 1998). The two species are difficult to distinguish from one another when sighted (McAlpine 2009) and are combined in the Roberts et al. (2015) density modeling under the auspices of the Kogia guild.
Both Kogia species are sighted primarily along the continental shelf edge and slope and over deeper waters off the shelf (Hansen et al. 1994; Davis et al. 1998). Several studies have suggested that pygmy sperm whales live mostly beyond the continental shelf edge, whereas dwarf sperm whales tend to occur closer to shore, often over the continental shelf (Rice 1998; Wang et al. 2002; MacLeod et al. 2004). Barros et al. (1998), on the other hand, suggested that dwarf sperm whales could be more pelagic and dive deeper than pygmy sperm whales. It has also been suggested that the pygmy sperm whale is more temperate and the dwarf sperm whale more tropical, based at least partially on live sightings at sea from a large database from the eastern tropical Pacific (Wade and Gerrodette 1993). This idea is also supported by the distribution of strandings in South American waters (Muñoz-Hincapié et al. 1998).
Only four of the pygmy sperm whale sightings in the OBIS database occur within the general area of the survey, and three of these were during the July through September period. Pygmy and dwarf sperm whales would likely be rare in the proposed project area.
III. Affected Environment
Draft Environmental Assessment for USGS Northwest Atlantic, 2018 Page 39
Cuvier’s Beaked Whale (Ziphius cavirostris)
Cuvier’s beaked whale is probably the most widespread of the beaked whales. Cuvier’s beaked whale appears to prefer steep continental slope waters (Jefferson et al. 2015) and is most common in water depths >1000 m (Heyning 1989). It is mostly known from strandings and strands more commonly than any other beaked whale (Heyning 1989). Its inconspicuous blows, deep-diving behavior, and tendency to avoid vessels all help to explain the infrequent sightings (Barlow and Gisiner 2006).
Of the usable records in the OBIS database, 155 sightings of Cuvier’s beaked whales overlap with the survey area, and 76 of these were during the July to September period. Cuvier’s beaked whales could be encountered in the proposed project area.
Northern Bottlenose Whale (Hyperoodon ampullatus)
The northern bottlenose whale is found only in the North Atlantic, from the subarctic to ~30°N (Jefferson et al. 2015). Northern bottlenose whales are most common in deep waters beyond the continental shelf or over submarine canyons, usually near or beyond the 1000-m isobath (Jefferson et al. 2015). Of the sightings in the OBIS database, one occurred within the survey area and none during July through September. Nonetheless, northern bottlenose whales could be encountered in the proposed project area.
True’s Beaked Whale (Mesoplodon mirus)
True’s beaked whale is mainly oceanic and occurs in warm temperate waters of the North Atlantic and southern Indian oceans (Pitman 2009). In the western North Atlantic, strandings have been recorded from Nova Scotia (~26°N) to Florida (46°N; MacLeod et al. 2006). Two sightings in the OBIS database occur in the general survey area, but only one of these was during the summer season that overlaps the Proposed Action. True’s beaked whale likely would be rare in the proposed project area.
Gervais’ Beaked Whale (Mesoplodon europaeus)
Gervais’ beaked whale is mainly oceanic and occurs in tropical and warmer temperate waters of the Atlantic Ocean (Jefferson et al. 2015). It occurs in the Atlantic from ~54ºN to ~18ºS (MacLeod et al. 2006). Gervais’ beaked whale is more common in the western than the eastern part of the Atlantic (Mead 1989). No OBIS sightings of the Gervais’ beaked whale have occurred in the survey area. Given the geographic and depth range of the species, though, Gervais’ beaked whale could be encountered in the proposed project area.
Sowerby’s Beaked Whale (Mesoplodon bidens)
Sowerby’s beaked whale occurs in cold temperate waters of the Atlantic from the Labrador Sea to the Norwegian Sea, and south to New England, the Azores, and Madeira (Mead 1989). Sowerby’s beaked whale is known primarily from strandings, which are more common in the eastern than the western North Atlantic (MacLeod et al. 2006). It is mainly a pelagic species and is found in deeper waters of the shelf edge and slope (Mead 1989). Eleven OBIS database sightings are in the polygon enclosing the larger area of the proposed surveys, and nine of these were during the summer months. Sowerby’s beaked whale could be encountered in the proposed project area.
Blainville’s Beaked Whale (Mesoplodon densirostris)
Blainville’s beaked whale is found in tropical and warm temperate waters of all oceans; it has the widest distribution throughout the world of all mesoplodont species and appears to be relatively common
III. Affected Environment
Draft Environmental Assessment for USGS Northwest Atlantic, 2018 Page 40
(Pitman 2009). Like other beaked whales, Blainville’s beaked whales are generally found in deep water, 200–1400 m deep (Gannier 2000; Jefferson et al. 2015). In the OBIS database, one sighting occurred in the survey area, and it was during the summer months. Blainville’s beaked whale could be encountered in the proposed project area.
Rough-toothed Dolphin (Steno bredanensis)
The rough-toothed dolphin occurs in tropical and subtropical waters, rarely ranging farther north than 40N (Jefferson et al. 2015). It is considered a pelagic species, but it can also occur in shallow coastal waters (Jefferson et al. 2015). Nine sightings in the OBIS database occur within the survey area, and seven of these were doing the summer. Rough-toothed dolphins could occur in the proposed project area.
Common Bottlenose Dolphin (Tursiops truncatus)
The bottlenose dolphin is distributed worldwide in coastal and shelf waters of tropical and temperate oceans (Jefferson et al. 2015). There are two distinct bottlenose dolphin types in the Northwest Atlantic: a shallow water type, mainly found in coastal waters, and a deep water type, mainly found in oceanic waters (Duffield et al. 1983; Hoelzel et al. 1998; Walker et al. 1999). In the OBIS database, 1873 sightings of bottlenose dolphins occurred within a polygon enclosing the general survey area, and 776 are within the summer months. Common bottlenose dolphins are very likely to be encountered in the proposed project area.
Pantropical Spotted Dolphin (Stenella attenuata)
The pantropical spotted dolphin can be found throughout tropical oceans of the world (Jefferson et al. 2015). In the Atlantic, it can occur from ~40°N to 40°S but is much more abundant in the lower latitudes (Jefferson et al. 2015). Pantropical spotted dolphins are usually pelagic, although they occur close to shore where water near the coast is deep (Jefferson et al. 2015). Of over 4200 usable sightings in the OBIS database, 48 were in the polygon encompassing the entire survey area, and 29 of these were during the summer months. Pantropical spotted dolphins could be encountered in the proposed project area.
Atlantic Spotted Dolphin (Stenella frontalis)
The Atlantic spotted dolphin is distributed in tropical and warm temperate waters of the North Atlantic from Brazil to New England and to the coast of Africa (Jefferson et al. 2015). There are two forms of Atlantic spotted dolphin – a large, heavily spotted coastal form that is usually found in shelf waters, and a smaller and less-spotted offshore form that occurs in pelagic offshore waters and around oceanic islands (Jefferson et al. 2015). In the OBIS database, 125 sightings are in the general area of the surveys, and 58 were during the summer. Atlantic spotted dolphins would likely be encountered in the proposed project area.
Striped Dolphin (Stenella coeruleoalba)
The striped dolphin has a cosmopolitan distribution in tropical to warm temperate waters (Perrin et al. 1994); however, it also occurs in temperate waters as far north as 50N (Jefferson et al. 2015). The striped dolphin is typically found in waters outside the continental shelf and is often associated with convergence zones and areas of upwelling (Archer 2009). However, it has also been observed approaching shore where there is deep water close to the coast (Jefferson et al. 2015). Of over 15600 sightings in the OBIS database, 183 were in the area of the survey, and 95 of these were during the summer. Striped dolphins would likely be encountered in the proposed project area.

III. Affected Environment
Draft Environmental Assessment for USGS Northwest Atlantic, 2018 Page 41
Atlantic White-sided Dolphin (Lagenorhynchus acutus)
The Atlantic white-sided dolphin occurs in cold temperate and subpolar waters in the North Atlantic; in the western Atlantic, its range is from ~38N to southern Greenland (Jefferson et al. 2015). It appears to prefer deep waters of the outer shelf and slope, but can also occur in shallow and pelagic waters (Jefferson et al. 2015). In the OBIS database, 28 sightings of the Atlantic white-sided dolphin occur in the general area of the survey, and 9 of these are during the summer months. Atlantic white-sided dolphins could be encountered in the proposed project area.
White-beaked Dolphin (Lagenorhynchus albirostris)
The white-beaked dolphin occurs in cold temperate and subpolar regions of the North Atlantic; its range extends from Cape Cod to southern Greenland in the west and Portugal to Svalbard in the east (Kinze 2009; Jefferson et al. 2015). It appears to prefer deep waters along the outer shelf and slope, but can also occur in shallow areas and far offshore (Jefferson et al. 2015). There are four main high-density centers in the North Atlantic, including (1) the Labrador Shelf, (2) Icelandic waters, (3) waters around Scotland, and (4) the shelf along the coast of Norway (Kinze 2009). One sighting in the OBIS database of over 2700 records is of a white-beaked dolphin in the general survey area, and none occurred during the summer. White-beaked dolphins are unlikely to be encountered in the proposed project area.
Short-beaked Common Dolphin (Delphinus delphis)
The short-beaked common dolphin is distributed in tropical to cool temperate waters of the Atlantic and the Pacific oceans from 60ºN to ~50ºS (Jefferson et al. 2015). It is common in coastal waters 200–300 m deep (Evans 1994), but it can also occur thousands of kilometers offshore; the pelagic range in the North Atlantic extends south to ~35ºN (Jefferson et al. 2015). It appears to have a preference for areas with upwelling and steep sea-floor relief (Doksæter et al. 2008; Jefferson et al. 2015). Fewer than 0.1% of the nearly 43,000 of short-beaked common dolphins in the OBIS database occur in the general area of the survey, and only three were during the summer months. Short-beaked common dolphins could be encountered in the proposed project area.
Risso’s Dolphin (Grampus griseus)
Risso’s dolphin is distributed worldwide in temperate and tropical oceans (Baird 2009), although it shows a preference for mid-temperate waters between 30 and 45 (Jefferson et al. 2014). Although it is known to occur in coastal and oceanic habitats (Jefferson et al. 2014), it appears to prefer steep sections of the continental shelf, 400–1000 m deep (Baird 2009), and is known to frequent seamounts and escarpments (Kruse et al. 1999; Baird 2009). There were 471 sightings of Risso’s dolphins in the general area of the project in the OBIS database, and 238 of these were during the summer. Risso’s dolphin is likely to be encountered in the proposed project area during August.
Pygmy Killer Whale (Feresa attenuata)
The pygmy killer whale is pantropical, inhabiting waters generally between 40°N and 35°S (Jefferson et al. 2015). Pygmy killer whales are usually found in deep water and rarely are found close to shore except where deepwater approaches the shore (Jefferson et al. 2015). Three sightings of pygmy killer whales are found in the OBIS database for the general area of the survey, and all of these occurred during the summer. Pygmy killer whales could occur in the survey area.
False Killer Whale (Pseudorca crassidens)
The false killer whale is found in all tropical and warmer temperate oceans, especially in deep, offshore waters (Jefferson et al. 2015). However, it is also known to occur in nearshore areas (e.g.,

III. Affected Environment
Draft Environmental Assessment for USGS Northwest Atlantic, 2018 Page 42
Stacey and Baird 1991). The pelagic range in the North Atlantic is usually southward of ~30°N but extralimit individuals have been recorded as far north as Norway (Jefferson et al. 2015). Of more than 1100 usable sightings recorded in the OBIS database, two occurred within the rectangle enclosing the survey area, and one of those was during the summer months. False killer whales could be encountered in the proposed project area.
Killer Whale (Orcinus orca)
The killer whale is globally fairly abundant, and it has been observed in all oceans of the world (Ford 2009). It is very common in temperate waters and also frequents tropical waters, at least seasonally (Heyning and Dahlheim 1988). Killer whales are large and conspicuous, often traveling in close-knit matrilineal groups of a few to tens of individuals (Dahlheim and Heyning 1999). Killer whales appear to prefer coastal areas, but are also known to occur in deep water (Dahlheim and Heyning 1999). In over 3000 usable killer whale sightings in the OBIS database, only 0.1% were within the larger rectangular area enclosing the survey, and none was during the summer months. Killer whales could be encountered within the proposed project area.
Short-finned Pilot Whale (Globicephala macrorhynchus)
The short-finned pilot whale is found in tropical, subtropical, and warm temperate waters (Olson 2009); it is seen as far south as ~40ºS and as far north as ~50ºN (Jefferson et al. 2015). Pilot whales are generally nomadic, but may be resident in certain locations (Olson 2009). There is some overlap of range with G. melas in temperate waters (Jefferson et al. 2015). Water temperature appears to be the primary factor determining the relative distribution of these two species (Fullard et al. 2000). The short-finned pilot whale inhabits pelagic as well as nearshore waters (Olson 2009). Of over 2500 usable sightings in the OBIS database, 414 were within the rectangular area encompassing the survey lines, and 105 of these were during the summer months. Thus, short-finned pilot whales would likely be encountered in the proposed project area. Note that pilot whales are dealt with as an entire guild by Roberts et al. (2015), meaning that there are no specific model density grids applicable to short-finned pilot whales.
Long-finned Pilot Whale (Globicephala melas)
The long-finned pilot whale occurs in temperate and sub-polar zones (Jefferson et al. 2015). It can be found in inshore or offshore waters of the North Atlantic (Olson 2009). In the western North Atlantic, high densities of long-finned pilot whales occurred over the continental slope in winter and spring, and they move to the shelf during summer and autumn (Jefferson et al. 2015). Despite this range, which would appear to overlap with that of the Proposed Action, over 9000 records in the OBIS database yielded 51 that occurred in the rectangular box enclosing the larger survey area. Sixteen of these occurred during the summer months, mostly on the upper continental slope. The long-finned pilot whale could be encountered in the proposed study area. Note that pilot whales are dealt with as an entire guild by Roberts et al. (2015), meaning that there are no specific model density grids applicable to short-finned pilot whales.
Melon-headed Whale (Peponocephala electra)
The melon-headed whale is a pantropical species usually occurring between 40ºN and 35ºS (Jefferson et al. 2008). Occasional occurrences in temperate waters are extralimital, likely associated with warm currents (Perryman et al. 1994; Jefferson et al. 2008). Melon-headed whales are oceanic and occur in offshore areas (Perryman et al. 1994), as well as around oceanic islands. Off the east coast of the U.S., sightings have been made of two groups (20 and 80) of melon-headed whales off Cape Hatteras in waters 2500 m deep during
III. Affected Environment
Draft Environmental Assessment for USGS Northwest Atlantic, 2018 Page 43
vessel surveys in 1999 and 2002 (NMFS 1999, 2002 in Waring et al. 2010). The OBIS database contains more than 300 sightings records for the melon-headed whale, and none of these are within the survey area.
The Roberts et al. (2015) model density grid for the melon-headed whale has only two values for abundance: zero in most of the U.S. EEZ and 0.240833 animals per 100 km2 in the rest of the modeled area. There are no melon-headed whales in waters shallower than 1000 m in the model in the area of the Proposed Action, meaning that take calculations only capture potential animals in deeper waters. Melon-headed whales may be encountered during the seismic surveys, but they would likely be almost exclusively in deeper water and are more likely near the southern survey transects than the northern ones.
Harbor Porpoise (Phocoena phocoena)
The harbor porpoise inhabits temperate, subarctic, and arctic waters. It is typically found in shallow water (<100 m) nearshore, but it is occasionally sighted in deeper offshore water (Jefferson et al. 2015). The subspecies P.p. phocoena inhabits the Atlantic Ocean. In the western North Atlantic, it occurs from the southeastern U.S. to Baffin Island; in the eastern North Atlantic (Jefferson et al. 2015). Despite their abundance and the over 49,000 usable sightings of harbor porpoises in the OBIS database, only 7 occurred within the larger rectangular area encompassing the Proposed Action, and only 1 of these was during the summer months. Given their preference for coastal waters, harbor porpoises are expected to be seen during transits across the shelf, but are not expected to be encountered in the survey area during seismic operations.
Fraser’s Dolphin (Lagenodelphis hosei)
This information is compiled from the NOAA OPR website: http://www.nmfs.noaa.gov/pr/species/mammals/dolphins/frasers-dolphin.html. Fraser’s dolphin is a deepwater (> 1000 m) species that occurs in subtropical to tropical waters, nominally as far north as 30°N. This species can dive to substantial water depths in search of prey. The Western North Atlantic stock of Fraser’s dolphins, which is a population division recognized by NOAA, was unknown as of 2007 (http://www.nmfs.noaa.gov/pr/pdfs/sars/ao2007dofr-wn.pdf). The dolphins often occur in large groups (100 or more). The OBIS database has fewer than 200 sightings of Fraser dolphins. Only 3 sightings were within the larger project area, and only 2 of those were during the summer months. Fraser’s dolphins could be encountered within the survey area during the Proposed Action.
Spinner Dolphin (Stenella longirostis)
The following is taken verbatim from the Final EA for the ENAM project (LGL, 2014): The spinner dolphin is pantropical in distribution, with a range nearly identical to that of the pantropical spotted dolphin, including oceanic tropical and sub-tropical waters between 40ºN and 40ºS (Jefferson et al. 2008). The distribution of spinner dolphins in the Atlantic is poorly known, but they are thought to occur in deep waters along most of the U.S. coast; sightings off the northeast U.S. coast have occurred exclusively in offshore waters >2000 m (Waring et al. 2010). Within the OBIS database of over 2000 usable sightings, the USGS found that none occurred in the survey area in any season. However, based on the abundance grids from Roberts et al. (2016), spinner dolphins could be encountered in the survey area in August 2018. Note that spinner and Clymene dolphins are often considered together in analyses, but were separated here due to the availability of density grids for each species.
Clymene’s Dolphin (Stenella clymene)
The following is taken verbatim from the Final EA for the ENAM project (LGL, 2014). The Clymene dolphin only occurs in tropical and subtropical waters of the Atlantic Ocean (Jefferson et al. 2008).
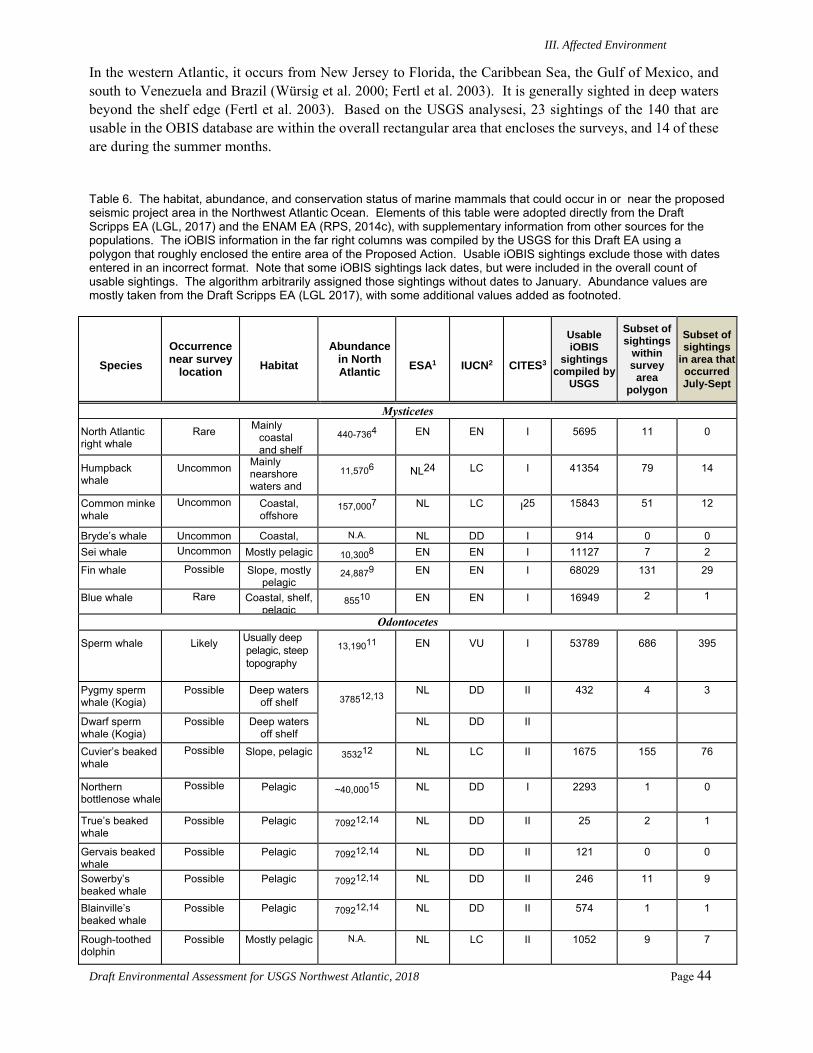
III. Affected Environment
Draft Environmental Assessment for USGS Northwest Atlantic, 2018 Page 44
In the western Atlantic, it occurs from New Jersey to Florida, the Caribbean Sea, the Gulf of Mexico, and south to Venezuela and Brazil (Würsig et al. 2000; Fertl et al. 2003). It is generally sighted in deep waters beyond the shelf edge (Fertl et al. 2003). Based on the USGS analysesi, 23 sightings of the 140 that are usable in the OBIS database are within the overall rectangular area that encloses the surveys, and 14 of these are during the summer months.
Table 6. The habitat, abundance, and conservation status of marine mammals that could occur in or near the proposed seismic project area in the Northwest Atlantic Ocean. Elements of this table were adopted directly from the Draft Scripps EA (LGL, 2017) and the ENAM EA (RPS, 2014c), with supplementary information from other sources for the populations. The iOBIS information in the far right columns was compiled by the USGS for this Draft EA using a polygon that roughly enclosed the entire area of the Proposed Action. Usable iOBIS sightings exclude those with dates entered in an incorrect format. Note that some iOBIS sightings lack dates, but were included in the overall count of usable sightings. The algorithm arbitrarily assigned those sightings without dates to January. Abundance values are mostly taken from the Draft Scripps EA (LGL 2017), with some additional values added as footnoted.
Species
Occurrence near survey
location
Habitat
Abundance in North Atlantic
ESA1
IUCN2
CITES3
Usable iOBIS
sightings compiled by
USGS
Subset of sightings
within survey
area polygon
Subset of sightings
in area that occurred July-Sept
Mysticetes
North Atlantic right whale
Rare Mainly
coastal and shelf
440-7364 EN EN I 5695 11 0
Humpback whale
Uncommon Mainly nearshore waters and b k l
11,5706 NL24 LC I 41354 79 14
Common minke whale
Uncommon Coastal, offshore
157,0007 NL LC I25 15843 51 12
Bryde’s whale Uncommon Coastal, N.A. NL DD I 914 0 0
Sei whale Uncommon Mostly pelagic 10,3008 EN EN I 11127 7 2
Fin whale Possible Slope, mostly pelagic
24,8879 EN EN I 68029 131 29
Blue whale Rare Coastal, shelf, pelagic
85510 EN EN I 16949 2
1
Odontocetes
Sperm whale Likely Usually deep pelagic, steep topography
13,19011 EN VU I 53789 686 395
Pygmy sperm whale (Kogia)
Possible Deep waters off shelf 378512,13
NL DD II 432 4 3
Dwarf sperm whale (Kogia)
Possible Deep waters off shelf
NL DD II
Cuvier’s beaked whale
Possible Slope, pelagic 353212 NL LC II 1675 155 76
Northern bottlenose whale
Possible Pelagic ~40,00015 NL DD I 2293 1 0
True’s beaked whale
Possible Pelagic 709212,14 NL DD II 25 2 1
Gervais beaked whale
Possible Pelagic 709212,14 NL DD II 121 0 0
Sowerby’s beaked whale
Possible Pelagic 709212,14 NL DD II 246 11 9
Blainville’s beaked whale
Possible Pelagic 709212,14 NL DD II 574 1 1
Rough-toothed dolphin
Possible Mostly pelagic N.A. NL LC II 1052 9 7
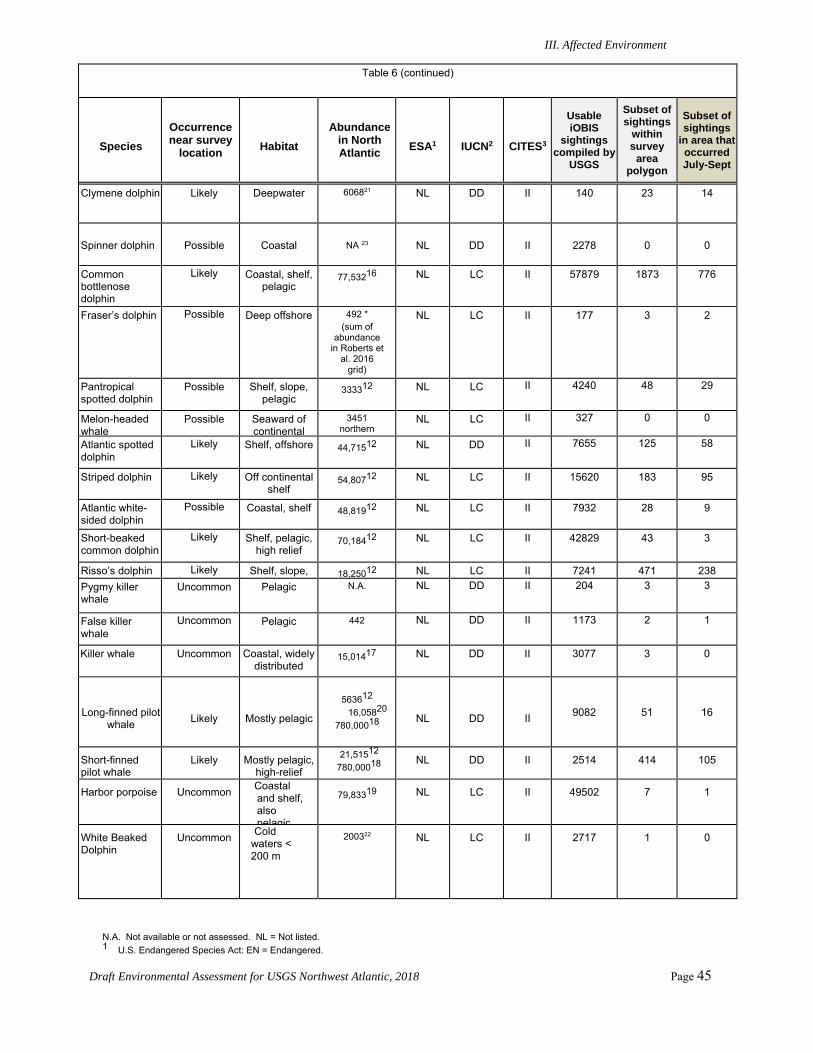
III. Affected Environment
Draft Environmental Assessment for USGS Northwest Atlantic, 2018 Page 45
Table 6 (continued)
Species
Occurrence near survey
location
Habitat
Abundance in North Atlantic
ESA1
IUCN2
CITES3
Usable iOBIS
sightings compiled by
USGS
Subset of sightings
within survey
area polygon
Subset of sightings
in area that occurred July-Sept
Clymene dolphin Likely Deepwater 606821
NL DD II 140 23 14
Spinner dolphin Possible Coastal NA 23 NL DD II 2278 0 0
Common bottlenose dolphin
Likely Coastal, shelf, pelagic
77,53216 NL LC II 57879 1873 776
Fraser’s dolphin Possible Deep offshore 492 * (sum of
abundance in Roberts et
al. 2016 grid)
NL LC II 177 3 2
Pantropical spotted dolphin
Possible Shelf, slope, pelagic
333312 NL LC II 4240 48 29
Melon-headed whale
Possible Seaward of continental
3451 northern
NL LC II 327 0 0
Atlantic spotted dolphin
Likely Shelf, offshore 44,71512 NL DD II 7655 125 58
Striped dolphin Likely Off continental shelf
54,80712 NL LC II 15620 183 95
Atlantic white-sided dolphin
Possible Coastal, shelf 48,81912 NL LC II 7932 28 9
Short-beaked common dolphin
Likely Shelf, pelagic, high relief
70,18412 NL LC II 42829 43 3
Risso’s dolphin Likely Shelf, slope, 18,25012 NL LC II 7241 471 238
Pygmy killer whale
Uncommon Pelagic N.A. NL DD II 204 3 3
False killer whale
Uncommon Pelagic 442 NL DD II 1173 2 1
Killer whale Uncommon Coastal, widely distributed
15,01417 NL DD II 3077 3 0
Long-finned pilot
whale
Likely
Mostly pelagic
563612 16,05820
780,00018
NL
DD
II
9082 51 16
Short-finned pilot whale
Likely Mostly pelagic, high-relief
21,51512 780,00018
NL DD II 2514 414 105
Harbor porpoise Uncommon Coastal and shelf, also pelagic
79,83319 NL LC II 49502 7 1
White Beaked Dolphin
Uncommon Cold
waters < 200 m
200322
NL LC II 2717 1 0
N.A. Not available or not assessed. NL = Not listed. 1 U.S. Endangered Species Act: EN = Endangered.
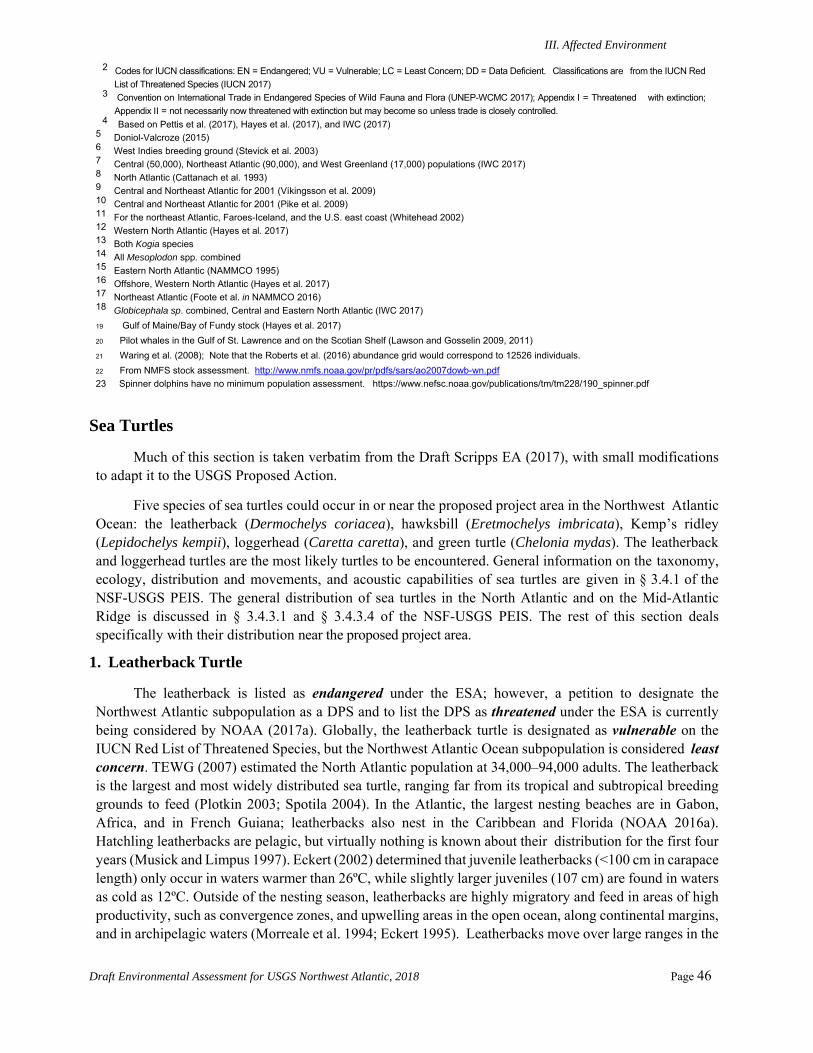
III. Affected Environment
Draft Environmental Assessment for USGS Northwest Atlantic, 2018 Page 46
2 Codes for IUCN classifications: EN = Endangered; VU = Vulnerable; LC = Least Concern; DD = Data Deficient. Classifications are from the IUCN Red
List of Threatened Species (IUCN 2017) 3 Convention on International Trade in Endangered Species of Wild Fauna and Flora (UNEP-WCMC 2017); Appendix I = Threatened with extinction;
Appendix II = not necessarily now threatened with extinction but may become so unless trade is closely controlled. 4 Based on Pettis et al. (2017), Hayes et al. (2017), and IWC (2017)
5 Doniol-Valcroze (2015) 6 West Indies breeding ground (Stevick et al. 2003) 7 Central (50,000), Northeast Atlantic (90,000), and West Greenland (17,000) populations (IWC 2017) 8 North Atlantic (Cattanach et al. 1993) 9 Central and Northeast Atlantic for 2001 (Víkingsson et al. 2009) 10 Central and Northeast Atlantic for 2001 (Pike et al. 2009) 11 For the northeast Atlantic, Faroes-Iceland, and the U.S. east coast (Whitehead 2002) 12 Western North Atlantic (Hayes et al. 2017) 13 Both Kogia species 14 All Mesoplodon spp. combined 15 Eastern North Atlantic (NAMMCO 1995) 16 Offshore, Western North Atlantic (Hayes et al. 2017) 17 Northeast Atlantic (Foote et al. in NAMMCO 2016) 18 Globicephala sp. combined, Central and Eastern North Atlantic (IWC 2017)
19 Gulf of Maine/Bay of Fundy stock (Hayes et al. 2017)
20 Pilot whales in the Gulf of St. Lawrence and on the Scotian Shelf (Lawson and Gosselin 2009, 2011)
21 Waring et al. (2008); Note that the Roberts et al. (2016) abundance grid would correspond to 12526 individuals.
22 From NMFS stock assessment. http://www.nmfs.noaa.gov/pr/pdfs/sars/ao2007dowb-wn.pdf
23 Spinner dolphins have no minimum population assessment. https://www.nefsc.noaa.gov/publications/tm/tm228/190_spinner.pdf
Sea Turtles
Much of this section is taken verbatim from the Draft Scripps EA (2017), with small modifications to adapt it to the USGS Proposed Action.
Five species of sea turtles could occur in or near the proposed project area in the Northwest Atlantic Ocean: the leatherback (Dermochelys coriacea), hawksbill (Eretmochelys imbricata), Kemp’s ridley (Lepidochelys kempii), loggerhead (Caretta caretta), and green turtle (Chelonia mydas). The leatherback and loggerhead turtles are the most likely turtles to be encountered. General information on the taxonomy, ecology, distribution and movements, and acoustic capabilities of sea turtles are given in § 3.4.1 of the NSF-USGS PEIS. The general distribution of sea turtles in the North Atlantic and on the Mid-Atlantic Ridge is discussed in § 3.4.3.1 and § 3.4.3.4 of the NSF-USGS PEIS. The rest of this section deals specifically with their distribution near the proposed project area.
1. Leatherback Turtle
The leatherback is listed as endangered under the ESA; however, a petition to designate the Northwest Atlantic subpopulation as a DPS and to list the DPS as threatened under the ESA is currently being considered by NOAA (2017a). Globally, the leatherback turtle is designated as vulnerable on the IUCN Red List of Threatened Species, but the Northwest Atlantic Ocean subpopulation is considered least concern. TEWG (2007) estimated the North Atlantic population at 34,000–94,000 adults. The leatherback is the largest and most widely distributed sea turtle, ranging far from its tropical and subtropical breeding grounds to feed (Plotkin 2003; Spotila 2004). In the Atlantic, the largest nesting beaches are in Gabon, Africa, and in French Guiana; leatherbacks also nest in the Caribbean and Florida (NOAA 2016a). Hatchling leatherbacks are pelagic, but virtually nothing is known about their distribution for the first four years (Musick and Limpus 1997). Eckert (2002) determined that juvenile leatherbacks (<100 cm in carapace length) only occur in waters warmer than 26ºC, while slightly larger juveniles (107 cm) are found in waters as cold as 12ºC. Outside of the nesting season, leatherbacks are highly migratory and feed in areas of high productivity, such as convergence zones, and upwelling areas in the open ocean, along continental margins, and in archipelagic waters (Morreale et al. 1994; Eckert 1995). Leatherbacks move over large ranges in the

III. Affected Environment
Draft Environmental Assessment for USGS Northwest Atlantic, 2018 Page 47
ocean and occur in pelagic regions of the North Atlantic where they forage between April and December on gelatinous zooplankton (Hays et al. 2006; COSEWIC 2012).
Figure 8. Compilation of the usable turtle sightings in the iOBIS database within a large polygon bounding all of the proposed seismic survey lines during the months of July, August, and September. No sightings of the hawksbill turtle met these criteria, so this species is missing. Also shown is the sargassum habitat for loggerhead turtles, which is described in more detail in §III.4.2.
Leatherback turtles are sometimes taken as bycatch by net and longline fishing in the MAB (Wallace et al., 2013). USGS analysis of the ~13,500 usable global sitings in the OBIS database showed that 316 individuals were identified in the survey area of the Proposed Action during any month and 76 during the July through September period. The locations of these sitings relative to the survey area are shown in Fig. 8. Fig. 9 shows the density map for leatherbacks from DiMatteo et al. (2017). Leatherback turtles are expected to be encountered in the area of the Proposed Action, particularly between the shelf-break and 1500 m water depth.

III. Affected Environment
Draft Environmental Assessment for USGS Northwest Atlantic, 2018 Page 48
Figure 9. Summer NODES density spatial model for the leatherback turtle from DiMatteo et al. (2017). Note that the diagram’s caption is mislabeled in the original, and that this figure should be for summer. It is bound in the original publication by distribution figures for spring and fall.
2. Loggerhead Turtle
Under the ESA, the Northeast Atlantic Ocean DPS (east of 40W) of the loggerhead turtle is listed as endangered, and the Northwest Atlantic Ocean DPS (west of 40W) is listed as threatened. Globally, the loggerhead turtle is listed as vulnerable on the IUCN Red List of Threatened Species, but the North East Atlantic subpopulation is listed as endangered, and the North West Atlantic subpopulation is listed as least concern. The loggerhead distribution is largely constrained by water temperature; it does not generally occur in waters with temperatures below 15°C (O’Boyle 2001; Brazner and McMillan 2008).
The major nesting areas in the North Atlantic occur along the U.S. coast (NOAA 2017b). The loggerhead turtle is the most common sea turtle in North American waters (Spotila 2004; NOAA 2017b). The adult female population in the western North Atlantic is estimated at 38,334 individuals (Richards et al. 2011). Post-hatchlings may reside for months in waters off the nesting beach or be transported by ocean currents within the Gulf of Mexico and North Atlantic (Witherington 2002; COSEWIC 2010). Between 7–12 years of age, juvenile loggerheads migrate from offshore regions to nearshore coastal areas until reaching adulthood (Bjorndal et al. 2000, 2003). Loggerheads migrate considerable distances between near-equatorial nesting areas and temperate foraging areas, and some move with the Gulf Stream into eastern Canadian waters during the summer (Hawkes et al. 2007). Loggerheads may be seen in the open seas during migration and foraging (e.g., Mansfield et al. 2009). According to the analysis by Wallace et al. (2013), loggerheads are the turtle species most frequently encountered as bycatch within the MAB. Bycatch occurs through all fishing methods (nets, longlines, and trawls.
The Sargasso Sea is considered critical habitat for loggerhead turtles. §3.2 describes this area and its importance. Of ~38,200 usable records in the OBIS database, 2859 were within the polygon enclosing the survey area, and 1618 of those were in July through September. These sightings are plotted in Fig. 8, along with the location of the Sargasso Sea critical habitat. Note that by far the highest density of sightings is on
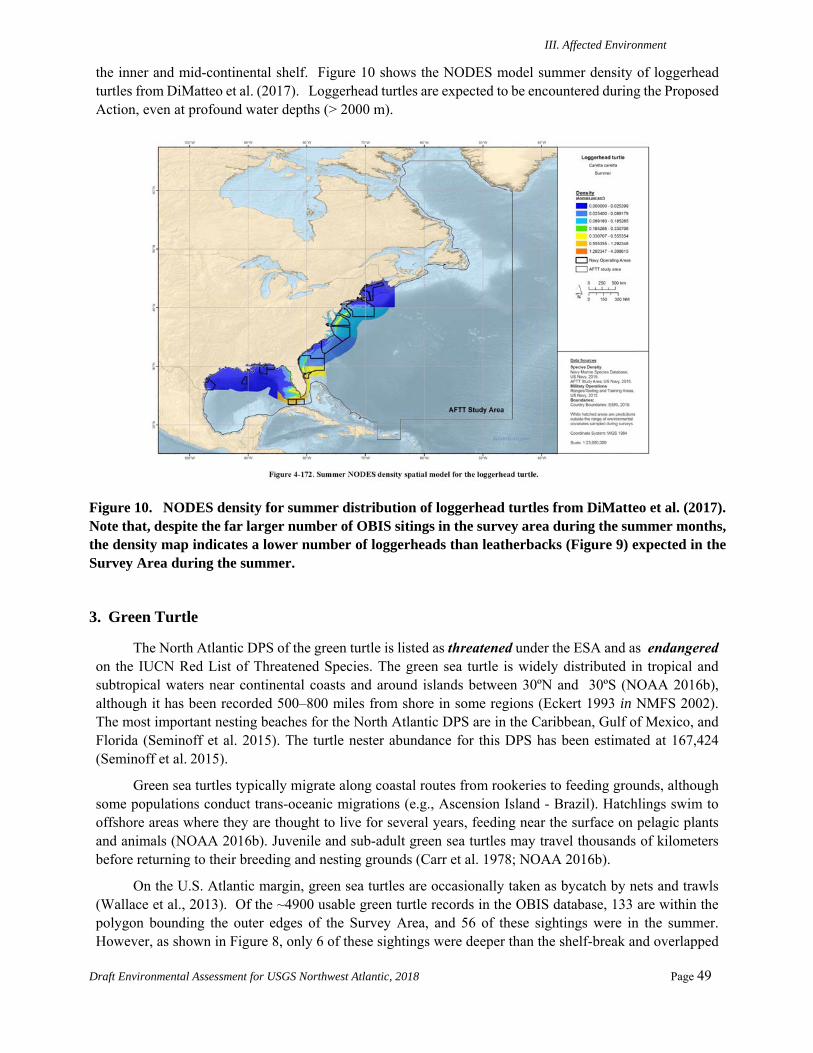
III. Affected Environment
Draft Environmental Assessment for USGS Northwest Atlantic, 2018 Page 49
the inner and mid-continental shelf. Figure 10 shows the NODES model summer density of loggerhead turtles from DiMatteo et al. (2017). Loggerhead turtles are expected to be encountered during the Proposed Action, even at profound water depths (> 2000 m).
Figure 10. NODES density for summer distribution of loggerhead turtles from DiMatteo et al. (2017). Note that, despite the far larger number of OBIS sitings in the survey area during the summer months, the density map indicates a lower number of loggerheads than leatherbacks (Figure 9) expected in the Survey Area during the summer.
3. Green Turtle
The North Atlantic DPS of the green turtle is listed as threatened under the ESA and as endangered on the IUCN Red List of Threatened Species. The green sea turtle is widely distributed in tropical and subtropical waters near continental coasts and around islands between 30ºN and 30ºS (NOAA 2016b), although it has been recorded 500–800 miles from shore in some regions (Eckert 1993 in NMFS 2002). The most important nesting beaches for the North Atlantic DPS are in the Caribbean, Gulf of Mexico, and Florida (Seminoff et al. 2015). The turtle nester abundance for this DPS has been estimated at 167,424 (Seminoff et al. 2015).
Green sea turtles typically migrate along coastal routes from rookeries to feeding grounds, although some populations conduct trans-oceanic migrations (e.g., Ascension Island - Brazil). Hatchlings swim to offshore areas where they are thought to live for several years, feeding near the surface on pelagic plants and animals (NOAA 2016b). Juvenile and sub-adult green sea turtles may travel thousands of kilometers before returning to their breeding and nesting grounds (Carr et al. 1978; NOAA 2016b).
On the U.S. Atlantic margin, green sea turtles are occasionally taken as bycatch by nets and trawls (Wallace et al., 2013). Of the ~4900 usable green turtle records in the OBIS database, 133 are within the polygon bounding the outer edges of the Survey Area, and 56 of these sightings were in the summer. However, as shown in Figure 8, only 6 of these sightings were deeper than the shelf-break and overlapped
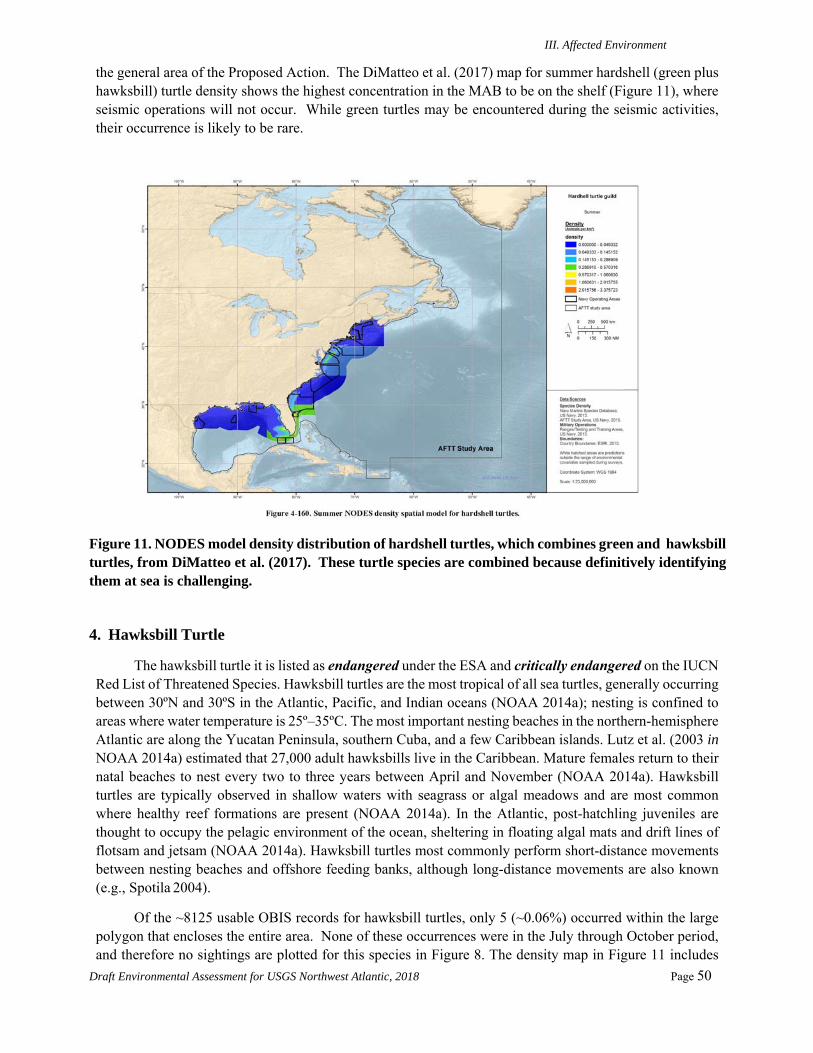
III. Affected Environment
Draft Environmental Assessment for USGS Northwest Atlantic, 2018 Page 50
the general area of the Proposed Action. The DiMatteo et al. (2017) map for summer hardshell (green plus hawksbill) turtle density shows the highest concentration in the MAB to be on the shelf (Figure 11), where seismic operations will not occur. While green turtles may be encountered during the seismic activities, their occurrence is likely to be rare.
Figure 11. NODES model density distribution of hardshell turtles, which combines green and hawksbill turtles, from DiMatteo et al. (2017). These turtle species are combined because definitively identifying them at sea is challenging.
4. Hawksbill Turtle
The hawksbill turtle it is listed as endangered under the ESA and critically endangered on the IUCN Red List of Threatened Species. Hawksbill turtles are the most tropical of all sea turtles, generally occurring between 30ºN and 30ºS in the Atlantic, Pacific, and Indian oceans (NOAA 2014a); nesting is confined to areas where water temperature is 25º–35ºC. The most important nesting beaches in the northern-hemisphere Atlantic are along the Yucatan Peninsula, southern Cuba, and a few Caribbean islands. Lutz et al. (2003 in NOAA 2014a) estimated that 27,000 adult hawksbills live in the Caribbean. Mature females return to their natal beaches to nest every two to three years between April and November (NOAA 2014a). Hawksbill turtles are typically observed in shallow waters with seagrass or algal meadows and are most common where healthy reef formations are present (NOAA 2014a). In the Atlantic, post-hatchling juveniles are thought to occupy the pelagic environment of the ocean, sheltering in floating algal mats and drift lines of flotsam and jetsam (NOAA 2014a). Hawksbill turtles most commonly perform short-distance movements between nesting beaches and offshore feeding banks, although long-distance movements are also known (e.g., Spotila 2004).
Of the ~8125 usable OBIS records for hawksbill turtles, only 5 (~0.06%) occurred within the large polygon that encloses the entire area. None of these occurrences were in the July through October period, and therefore no sightings are plotted for this species in Figure 8. The density map in Figure 11 includes
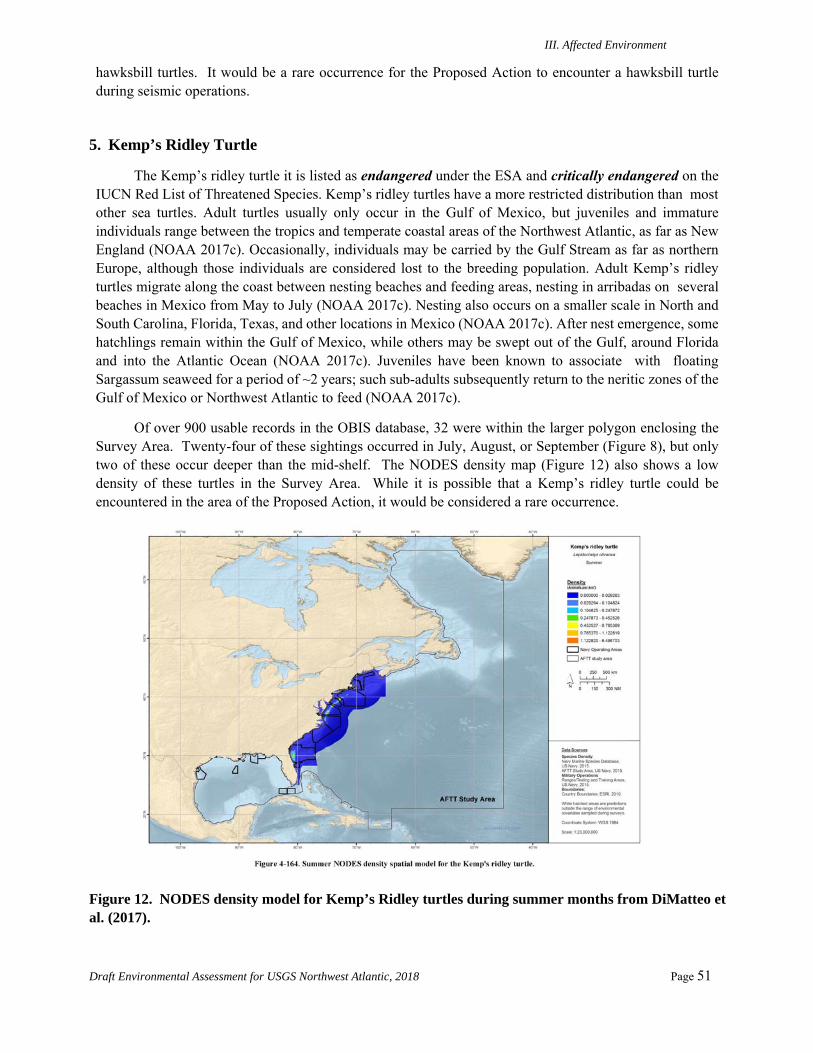
III. Affected Environment
Draft Environmental Assessment for USGS Northwest Atlantic, 2018 Page 51
hawksbill turtles. It would be a rare occurrence for the Proposed Action to encounter a hawksbill turtle during seismic operations.
5. Kemp’s Ridley Turtle
The Kemp’s ridley turtle it is listed as endangered under the ESA and critically endangered on the IUCN Red List of Threatened Species. Kemp’s ridley turtles have a more restricted distribution than most other sea turtles. Adult turtles usually only occur in the Gulf of Mexico, but juveniles and immature individuals range between the tropics and temperate coastal areas of the Northwest Atlantic, as far as New England (NOAA 2017c). Occasionally, individuals may be carried by the Gulf Stream as far as northern Europe, although those individuals are considered lost to the breeding population. Adult Kemp’s ridley turtles migrate along the coast between nesting beaches and feeding areas, nesting in arribadas on several beaches in Mexico from May to July (NOAA 2017c). Nesting also occurs on a smaller scale in North and South Carolina, Florida, Texas, and other locations in Mexico (NOAA 2017c). After nest emergence, some hatchlings remain within the Gulf of Mexico, while others may be swept out of the Gulf, around Florida and into the Atlantic Ocean (NOAA 2017c). Juveniles have been known to associate with floating Sargassum seaweed for a period of ~2 years; such sub-adults subsequently return to the neritic zones of the Gulf of Mexico or Northwest Atlantic to feed (NOAA 2017c).
Of over 900 usable records in the OBIS database, 32 were within the larger polygon enclosing the Survey Area. Twenty-four of these sightings occurred in July, August, or September (Figure 8), but only two of these occur deeper than the mid-shelf. The NODES density map (Figure 12) also shows a low density of these turtles in the Survey Area. While it is possible that a Kemp’s ridley turtle could be encountered in the area of the Proposed Action, it would be considered a rare occurrence.
Figure 12. NODES density model for Kemp’s Ridley turtles during summer months from DiMatteo et al. (2017).

III. Affected Environment
Draft Environmental Assessment for USGS Northwest Atlantic, 2018 Page 52
Seabirds
Three seabird species that are listed under the ESA or under consideration for listing have ranges that overlap the area of the Proposed Action: the Bermuda petrel (Pterodroma cahow), the black capped petrel, and the roseate tern. General information on the taxonomy, ecology, distribution and movements, and acoustic capabilities of seabird families is given in § 3.5.1 of the NSF-USGS PEIS.
1. Bermuda Petrel
The following is adopted verbatim from the Draft Scripps EA (LGL, 2017). The Bermuda petrel is listed as endangered under the ESA (USFWS 2007) and endangered on the 2017 IUCN Red List of Threatened Species (IUCN 2017). The Bermuda petrel was exploited for food and was thought to be extinct by the 17th century. It was only rediscovered in 1951, at which time the population consisted of 18 pairs (del Hoyo et al. 1992). The population has been the subject of an ongoing recovery effort, and by 2008 it was up to 85 breeding pairs (Madeiros et al. 2012). This population is now increasing slowly, but remains vulnerable to storm damage, erosion, and predation (BirdLife International 2017a; Madeiros et al. 2012).
Currently, all known breeding occurs on islets in Castle Harbour, Bermuda (Madeiros et al. 2012). Petrels return to the colony in mid-October and remain until June. During the non-breeding season (mid June–mid October), Bermuda petrels are strictly pelagic and likely follow the Gulf Stream. From 2009 to 2012, several birds were fitted with data-loggers to determine their pelagic range. These studies found that many Bermuda petrels spent the non-breeding season in the central North Atlantic, in the vicinity of the Azores, with some travelling as far as Ireland or Spain (Madeiros et al. 2014).
Based on the IUCN (2017) range map accessed by the USGS in March 2018, the entire Proposed Action occurs within the range of the Bermuda petrel. Thus, Bermuda petrels could be encountered in very small numbers during Proposed Action. As noted by the Draft Scripps EA (LGL, 2017), “based on satellite tracked birds, Bermuda petrels would be more likely to occur between 36.5º and 47.5ºN (Madeiros et al. 2014).” This confirms the possibility of encountering these birds within the area of the Proposed Action.
2. Black Capped Petrel
The black capped petrel (Pterodroma hasitata) is listed as endangered by the IUCN (2017) and is
being considered for listing under ESA by the U.S. Fish and Wildlife Service. The following information is compiled from the IUCN (2017): The bird is primarily threatened by habitat loss in breeding areas in the Caribbean and has been entirely eliminated on some Caribbean islands. Currently, it is known to breed only on Hispanola, although it was thought to breed on Guadeloupe and Martinique (prior to 1900) and possibly Cuba in the past. The bird lays eggs and raises its young between mid-January and early July. Young birds depart for the feeding range after that time. Black capped petrels forage in the Gulf Stream and the Florida Current and their range as delineated by IUCN (2017) spatial data extends offshore North Carolina and far out to sea in the Mid-Atlantic region. The birds feed in flocks and mostly at dusk and nocturnally, targeting squid, fish, crustaceans, and Sargassum. Curtice et al. (2016) show very small abundance of these birds in the study area (Figure 13). Based on the range of these birds, it is possible that they could be encountered during the Proposed Action while acquiring data along the southernmost exemplary lines. If the Gulf Stream were to shift west during the Proposed Action, black capped petrels might also follow the current westward, thereby intersecting other parts of the survey area.
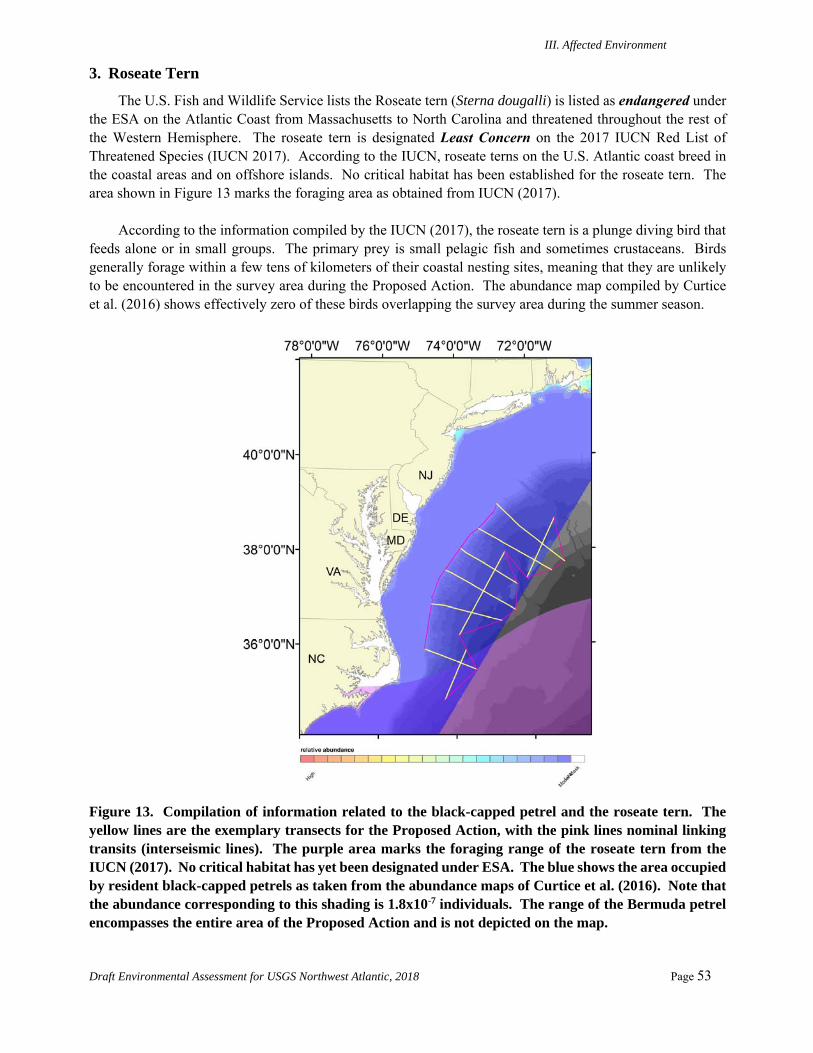
III. Affected Environment
Draft Environmental Assessment for USGS Northwest Atlantic, 2018 Page 53
3. Roseate Tern
The U.S. Fish and Wildlife Service lists the Roseate tern (Sterna dougalli) is listed as endangered under the ESA on the Atlantic Coast from Massachusetts to North Carolina and threatened throughout the rest of the Western Hemisphere. The roseate tern is designated Least Concern on the 2017 IUCN Red List of Threatened Species (IUCN 2017). According to the IUCN, roseate terns on the U.S. Atlantic coast breed in the coastal areas and on offshore islands. No critical habitat has been established for the roseate tern. The area shown in Figure 13 marks the foraging area as obtained from IUCN (2017).
According to the information compiled by the IUCN (2017), the roseate tern is a plunge diving bird that
feeds alone or in small groups. The primary prey is small pelagic fish and sometimes crustaceans. Birds generally forage within a few tens of kilometers of their coastal nesting sites, meaning that they are unlikely to be encountered in the survey area during the Proposed Action. The abundance map compiled by Curtice et al. (2016) shows effectively zero of these birds overlapping the survey area during the summer season.
Figure 13. Compilation of information related to the black-capped petrel and the roseate tern. The yellow lines are the exemplary transects for the Proposed Action, with the pink lines nominal linking transits (interseismic lines). The purple area marks the foraging range of the roseate tern from the IUCN (2017). No critical habitat has yet been designated under ESA. The blue shows the area occupied by resident black-capped petrels as taken from the abundance maps of Curtice et al. (2016). Note that the abundance corresponding to this shading is 1.8x10⁻⁷ individuals. The range of the Bermuda petrel encompasses the entire area of the Proposed Action and is not depicted on the map.

III. Affected Environment
Draft Environmental Assessment for USGS Northwest Atlantic, 2018 Page 54
Fish
The area of the Proposed Action overlaps Essential Fish Habitat for numerous species listed in Table 4. These include species within the Mid-Atlantic and the northern part of the Southeast fisheries areas, as well as Atlantic highly-mobile species. This section describes in detail the ESA-listed species, essential fish habitat and habitats of particular concern, and commercial and recreational fisheries. Parts of the following sections are adopted verbatim from the Draft Scripps EA (LGL, 2017), with minor modifications to fit the circumstances of the Proposed Action.
1. ESA-listed Species
The term “species” under the ESA includes species, subspecies, and, for vertebrates only, Distinct Population Segments (DPSs) or “evolutionarily significant units (ESUs)”. ESA-listed species designated as endangered (NOAA 2017e) that could occur in the proposed project area include the Carolina, Chesapeake Bay, New York Bight DPSs of Atlantic sturgeon (Acipenser oxyrinchus oxyrinchus) and the shortnose sturgeon (Acipenser brevirostrum). (The Gulf of Maine DPS of Atlantic sturgeon is an ESA-listed species designated as threatened and is not considered relevant to the Proposed Action). Species proposed for listing under the ESA as threatened and that may occur within the proposed project area include the giant manta ray (Manta birostris) and oceanic whitetip shark (Carcharhinus longimanus) (NOAA 2017f).
Atlantic Sturgeon
The Atlantic sturgeon is an anadromous, estuarine fish species that inhabits freshwater and brackish waters, as well as marine coastal waters. It is not believed to take extensive migrations beyond the coastal zone to the open ocean (NOAA 2017g). Sturgeon generally occur solitary or in small groups and are long-lived and late maturing (St. Pierre and Parauka 2006). This species is separated into four separate “Endangered” DPSs: New York Bight, Chesapeake Bay, Carolina, and South Atlantic; as well as one “Threatened” DPS in the Gulf of Maine (NOAA 2017g). All DPSs have designated several river systems that sturgeon are known to inhabit as critical habitat. The Atlantic sturgeon is not expected to occur in the offshore proposed project area.
Shortnose Sturgeon
The shortnose sturgeon is the smallest sturgeon species that is found in North America. Similar to the Atlantic sturgeon, it is both an anadromous and estuarine species that undertakes migrations in coastal waters throughout its adult life and is not known to make long offshore migrations (NOAA 2015b). The shortnose sturgeon occurs in many riverine systems along the east coast of North America, from the St. John River, New Brunswick to Florida (NOAA 2015b). It is not expected to occur in the area of the Proposed Action.
Giant Manta Ray
Giant manta rays are migratory and cold-water tolerant, with highly fragmented populations sparsely distributed in the tropical, subtropical, and temperate waters of the world (NOAA 2017h). Giant manta rays are the largest living ray in the world (NOAA 2017h) and tend to be solitary (DoW 2015a). This species filter-feeds virtually exclusively on plankton (DoW 2015a). Regional population sizes are small and have generally declined in known areas except where specifically protected (NOAA 2017h). It could occur within or near the proposed project area.
Oceanic Whitetip Shark
The oceanic white tip shark is an offshore pelagic species inhabiting surficial waters in the open ocean, occurring worldwide typically between 20ºN and 20ºS but also at higher latitudes during the

III. Affected Environment
Draft Environmental Assessment for USGS Northwest Atlantic, 2018 Page 55
summer months (NOAA 2016e). Oceanic whitetip sharks are aggressive and persistent, and prey on bony fishes such as tunas, barracuda, white marlin, dolphinfish, lancetfish, oarfish, threadfish and swordfish), along with threadfins, stingrays, sea turtles, seabirds, gastropods, squid, crustaceans, mammalian carrion and garbage (NOAA 2016e). Oceanic whitetip shark populations have shown severe declines in the Atlantic Ocean (DoW 2015b). It could occur within or near the proposed project area.
2. Fish Habitats
Maps provided by the Marine-Life Data and Analysis Team (MDAT) at Duke University (Curtice et al., 2016) based on data from the Northeast Fisheries Science Center give compilations of biomass, diversity, and species richness based primarily on tow data acquired on the continental shelf. The maps do not extend beyond the shelf-break and thus do not overlap the area of the Proposed Action.
Essential Fish Habitat (EFH)
The following is taken verbatim or with slight modifications from the Final Environmental Assessment for the 2014 ENAM Project (RPS, 2014c). Two fishery management councils, created by the 1976 Magnuson Fisheries Conservation and Management Act (renamed Magnuson Stevens Fisheries Conservation and Management Act in 1996) are responsible for the management of fishery resources, including designation of EFH, in federal waters of the survey area: the Mid-Atlantic Fishery Management Council (MAFMC) covers nearly the entire survey area and the South Atlantic Fishery Management Council (SAFMC) has jurisdiction over the very southernmost parts of the surveys. The Highly Migratory Division of the National Marine Fisheries Service in Silver Spring, MD, manages highly migratory species (sharks, swordfish, billfish, and tunas).
Using ArcGIS, the exemplary seismic transects and tie-lines for the Proposed Action were intersected with the the polygons provided by NMFS for the Mid-Atlantic, South Atlantic, and Highly Mobile Species EFH. The result is a list of species EFH and species’ life stages that overlap with the USGS seismic surveys. Table 7 summarizes the results for the 41 species and the life stage that overlaps with the general area of the Proposed Action.
Several EFH areas in or near the proposed survey area have prohibitions in place for various gear types and/or possession of specific species/species groups: (1) Restricted areas designated to minimize impacts on juvenile and adult tilefish EFH from bottom trawling activity (see further under next section); (2) Prohibitions on the use of several gear types to fish for and retain snapper-grouper species from state waters to the limit of the EEZ, including roller rig trawls, bottom longlines, and fish traps; and on the harvesting of Sargassum (an abundant brown algae that occurs on the surface in the warm waters of the western North Atlantic), soft corals, and gorgonians (SAFMC 2013), and (3) Prohibitions on the possession of coral species and the use of bottom-damaging gear (including bottom longline, bottom and mid-water trawl, dredge, pot/trap, and anchor/anchor and chain/grapple and chain) by all fishing vessels.
Habitats of Particular Concern
As taken from the Final EA for the ENAM project (LGL, 2014), Habitat Areas of Particular Concern (HAPC) are subsets of EFH that provide important ecological functions and/or are especially vulnerable to degradation and that are designated by Fishery Management Councils. The exemplary survey lines for the Proposed Action do not directly intersect any HAPC in the Mid-Atlantic or South Atlantic region, nor HAPC or Atlantic highly mobile species.
One of the tie-lines (interseismic, linking lines) between primary exemplary survey lines may approach the seaward side of HAPC for juvenile and adult tilefish near the head of Norfolk Canyon. Tilefish inhabit
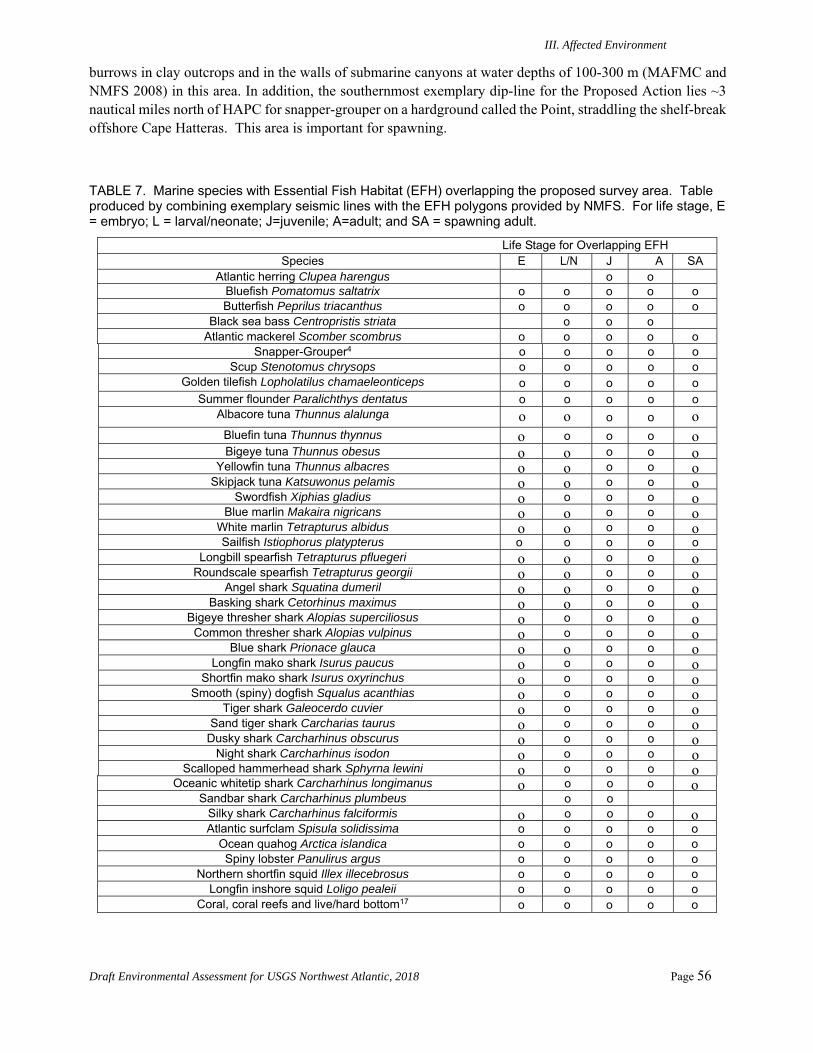
III. Affected Environment
Draft Environmental Assessment for USGS Northwest Atlantic, 2018 Page 56
burrows in clay outcrops and in the walls of submarine canyons at water depths of 100-300 m (MAFMC and NMFS 2008) in this area. In addition, the southernmost exemplary dip-line for the Proposed Action lies ~3 nautical miles north of HAPC for snapper-grouper on a hardground called the Point, straddling the shelf-break offshore Cape Hatteras. This area is important for spawning.
TABLE 7. Marine species with Essential Fish Habitat (EFH) overlapping the proposed survey area. Table produced by combining exemplary seismic lines with the EFH polygons provided by NMFS. For life stage, E = embryo; L = larval/neonate; J=juvenile; A=adult; and SA = spawning adult.
Life Stage for Overlapping EFH
Species E L/N J A SA Atlantic herring Clupea harengus o o
Bluefish Pomatomus saltatrix o o o o o Butterfish Peprilus triacanthus o o o o o
Black sea bass Centropristis striata o o o Atlantic mackerel Scomber scombrus o o o o o
Snapper-Grouper4 o o o o o Scup Stenotomus chrysops o o o o o
Golden tilefish Lopholatilus chamaeleonticeps o o o o o Summer flounder Paralichthys dentatus o o o o o
Albacore tuna Thunnus alalunga o o o o o Bluefin tuna Thunnus thynnus o o o o o Bigeye tuna Thunnus obesus o o o o o
Yellowfin tuna Thunnus albacres o o o o o Skipjack tuna Katsuwonus pelamis o o o o o
Swordfish Xiphias gladius o o o o o Blue marlin Makaira nigricans o o o o o
White marlin Tetrapturus albidus o o o o o Sailfish Istiophorus platypterus o o o o o
Longbill spearfish Tetrapturus pfluegeri o o o o o Roundscale spearfish Tetrapturus georgii o o o o o
Angel shark Squatina dumeril o o o o o Basking shark Cetorhinus maximus o o o o o
Bigeye thresher shark Alopias superciliosus o o o o o Common thresher shark Alopias vulpinus o o o o o
Blue shark Prionace glauca o o o o o Longfin mako shark Isurus paucus o o o o o
Shortfin mako shark Isurus oxyrinchus o o o o o Smooth (spiny) dogfish Squalus acanthias o o o o o
Tiger shark Galeocerdo cuvier o o o o o Sand tiger shark Carcharias taurus o o o o o
Dusky shark Carcharhinus obscurus o o o o o Night shark Carcharhinus isodon o o o o o
Scalloped hammerhead shark Sphyrna lewini o o o o o Oceanic whitetip shark Carcharhinus longimanus o o o o o
Sandbar shark Carcharhinus plumbeus o o Silky shark Carcharhinus falciformis o o o o o Atlantic surfclam Spisula solidissima o o o o o
Ocean quahog Arctica islandica o o o o o Spiny lobster Panulirus argus o o o o o
Northern shortfin squid Illex illecebrosus o o o o o Longfin inshore squid Loligo pealeii o o o o o
Coral, coral reefs and live/hard bottom17 o o o o o

III. Affected Environment
Draft Environmental Assessment for USGS Northwest Atlantic, 2018 Page 57
3. Commercial Fisheries
Table 8 summarizes the catch data for commercial fisheries in the coastal states landward of the Proposed Survey area: New Jersey, Delaware, Maryland, Virginia, and North Carolina. Although the Proposed Action would not occur offshore New York or Pennsylvania, these states are also included. In 2015 and 2016, the value of commercial fishing in these states was over $1.25 billion for more than 1.37 billion pounds of fish landed. As noted in Table 8, most of the revenue was generated by estuarine and inner shelf species whose depth ranges do not overlap with that of the Proposed Action, which would only take place at greater than 100 m water depth. These high-value estuarine/inner shelf species include blue crab, various shellfish (oysters, clams, sea scallops), and menhaden. The following paragraphs touch only on the species that contribute the most to the overall revenue in the coastal states and that live at water depths beyond those characteristic of estuaries, the coastal zone, and the inner shelf.
Summer flounder, which is currently under fishing restrictions in the mid-Atlantic states for 2018 (with no landings permitted in Delaware), does occur on the uppermost continental slope (to 160 m water depth) according to the IUCN (accessed March 2018), which lists the species as “least threatened.” The Proposed Action occurs entirely within the Summer Flounder Management Area and occupies most of the Scup and Black Sea Bass Management areas (all extend eastward to the EEZ boundary) as defined by NOAA in 2014. The Proposed Action also overlaps the area where summer flounder trawl fisherman must use a turtle excluder device (TED).
Longfin squid occur at greater water depths (up to 400 m) from November through February than during the period of the Proposed Action (August), when they are expected only to ~180 m on the uppermost slope (NEFSC, 2005). The endangered golden tilefish, which occurs to 540 m water depth according to the IUCN (2018), was a high-value commercial species only in New York. The Norfolk Canyon HAPC for this species is discussed above.
On a per pound basis, the most economically-valuable fish for landings in the coastal states in 2015 and 2016 were nearly all estuarine/coastal shellfish. The major exceptions were bluefin and bigeye tuna, swordfish, golden tilefish (2016), and some sharks. None of these species constituted a large component of the commercial landings in the associated states. Table 8. Compilation of commercial fish landings in the Mid-Atlantic Bight in 2015 and 2016.
State 2015/2016 Catch Value ($, millions)
2015/2016 Catch (lbs. landed, millions)
Common name of primary species landed (% total value)
Depth range of primary species landed
Proposed Action (exclusively > 100 m water depth) closest approach
New York 99.3 56.3
Northern quahog, longfin squid, sea
scallop (2016), golden tilefish, scup, summer flounder (56%)
Golden tilefish 80 to 540 m^; summer flounder to 160 m^; longfin squid adults up to 180 m March to October*; scup 10 to 200 m^; other species shelfal/estuarine
No lines offshore NY; >100 nm (~185 km) to
closest line
New Jersey 359.2 272.0
Scallops, clams, menhaden, blue
crab, longfin squid, summer flounder
(91%)
Summer flounder to 160 m^; Menhaden to 50 m^; longfin squid to 180 m March to October; other species shelfal/estuarine
~70 nm (~130 km)
Pennsylvania 0.24 0.14 Carp, minnows
(77%) N/A
Delaware 16.9 8.5 Blue crab (73%) Estuarine/coastal ~65 nm (120 km) Maryland 183.6 110.6 Blue crab (61%) Estuarine/coastal 50 nm (~93 km)

III. Affected Environment
Draft Environmental Assessment for USGS Northwest Atlantic, 2018 Page 58
Virginia 405.4 801.0
Sea scallop, blue crab, menhaden, northern quahog, eastern oyster,
summer flounder (87%)
Summer flounder up to 160 m^; menhaden to 50 m^; other species shefal/estuarine
55 nm (102 km)
North Carolina
188.8 125.9
Blue crab, white & brown shrimp,
summer flounder (60%)
Summer flounder up to 160 m^; other species on shelf/estuarine
38 nm (70 km)
* https://www.nefsc.noaa.gov/publications/tm/tm193/tm193.pdf ^ IUCN red list
4. Recreational Fisheries
The Mid-Atlantic area hosts several recreational fisheries that are managed by NOAA Fisheries. NOAA Fisheries collaborates with the Mid-Atlantic Regional Fishery Council, the coastal states, and the Atlantic States Marine Fisheries Commission to manage recreational fisheries in state and federal waters. As of March 2018, recreational fishing vessels operating in federal waters within the Greater Atlantic Regional fishing area must report on harvesting of Atlantic mackeral, squid, butterfish, summer flounder, scup, black sea bass, bluefish, and tilefish. In addition, these recreational activities come under the same management plan as that applied to commercial fisheries for summer flounder and black sea bass. Recreational fishers must already report bluefin tuna landings to NOAA. Maryland and North Carolina additionally require reporting on white and blue marlin, roundscale spearfish, and sailfish.
Some of the information in this section is taken from the MRIP/MRFSS catch estimates maintained by NOAA. About 9,000 individual saltwater fishing permits were held by recreational anglers in the coastal states landward of the Proposed Action in 2014 (NOAA, 2016f). All activities associated with recreational saltwater fishing in these states added value of approximately $3.1 billion to the economy. Highly migratory species (big game fish) are among those species whose habitats overlap with the Proposed Action, which occurs in deepwater areas. Pursuit of highly migratory species such as tuna, billfish, and sharks generated $17.7 million of added value to the economies the coastal states of Maine through North Carolina during a study period in 2011 (NOAA, 2014b). Maryland, Virginia, and North Carolina dominated the billfish recreational fishery, while New York and New Jersey constitute over 50% of the May through December 2011 trips focused on shark fishing. In the coastal states landward of the Proposed Action area, New Jersey recreational anglers conducted 45% of the tuna fishing trips during the reporting period.

IV. Environmental Consequences
Draft Environmental Assessment for USGS Northwest Atlantic, 2018 Page 59
IV. ENVIRONMENTAL CONSEQUENCES
Proposed Action
1. Direct Effects on Marine Mammals and Sea Turtles and Their Significance
The material in this section includes a brief summary of the anticipated potential effects (or lack thereof) of airgun sounds on marine mammals and sea turtles as provided in the NSF-USGS PEIS. It also includes updates from recent literature that has become available since the NSF-USGS PEIS was released in 2011. A more comprehensive review of the relevant background information appears in § 3.4.4.3, § 3.6.4.3, § 3.7.4.3, and § 3.8.4.3, and Appendix E of the NSF-USGS PEIS. Relevant background information on the hearing abilities of marine mammals and sea turtles can also be found in the NSF-USGS PEIS.
This section also includes estimates of the numbers of marine mammals that could be affected by the proposed seismic surveys scheduled to occur during August 2018, along with a description of the rationale for USGS’s estimates of the numbers of individuals exposed to received sound levels 160 dB re 1 µParms. Acoustic modeling for the proposed action was conducted by L-DEO, consistent with past EAs submitted for USGS and NSF seismic surveys and as previously determined to be acceptable by NMFS for use in the calculation of estimated Level B takes under the MMPA. Take calculations were carried out by the USGS using methodology described below and in a teleconference/webinar with NMFS personnel on 8 March, 2018.
(a) Summary of Potential Effects of Airgun Sounds
The Draft Scripps EA (LGL, 2017) is hereby incorporated by reference. The section is taken verbatim from that document. Therefore, all material has simply been reproduced in Appendix D for convenience.
(b) Possible Effects of Other Acoustic Sources
The Simrad fisheries EK60/80 transceiver with a single (38 kHz) split-beam transducer would be operated from the source vessel at water depths less than ~1800 m. Such equipment was not commonly used when the NSF-USGS PEIS was completed, but is now installed and run routinely on many global class research ships (e.g., Okeanos Explorer) and NOAA fisheries vessels. The EK80 is the newer, broadband transceiver that is starting to replace the widely used EK60 transceiver on some federal fleet vessels.
The following is copied nearly verbatim from the NOAA Northeast Fisheries Science Center application for a Letter of Authorization (NEFSC, 2014) for small takes associated with their research operations. Minor modifications have been made to focus the text on the type of EK60/80 system the USGS will use during the Proposed Action. NMFS granted NEFSC a 5-year LOA in 2015.
“Category 2 active acoustic sources (as defined by NEFSC) have moderate to very high output frequencies (10 to 180 kHz), generally short ping durations, and are typically focused (highly directional) to serve their intended purpose of mapping specific objects, depths, or environmental features. A number of these sources, particularly those with relatively lower sound frequencies coupled with higher output levels can be operated in different output modes (e.g., energy can be distributed among multiple output beams) that may lessen the likelihood of perception by and potential impact on marine life.” The USGS Proposed Action would use only the 38 kHz transducer.
IV. Environmental Consequences
Draft Environmental Assessment for USGS Northwest Atlantic, 2018 Page 60
“Category 2 active acoustic sources are likely to be audible to some marine mammal species. Among the marine mammals, most of these sources are unlikely to be audible to whales and most pinnipeds, whereas they may be detected by odontocete cetaceans (and particularly high frequency specialists such as harbor porpoise). There is relatively little direct information about behavioral responses of marine mammals, including the odontocete cetaceans, but the responses that have been measured in a variety of species to audible sounds (see Nowacek et al. 2007; Southall et al. 2007 for reviews) suggest that the most likely behavioral responses (if any) would be short-term avoidance behavior of the active acoustic sources.
The potential for direct physical injury from these types of active sources is low, but there is a low probability of temporary changes in hearing (masking and even temporary threshold shift) from some of the more intense sources in this category. Recent measurements by Finneran and Schlundt (2010) of TTS in mid-frequency cetaceans from high frequency sound stimuli indicate a higher probability of TTS in marine mammals for sounds within their region of best sensitivity; the TTS onset values estimated by Southall et al. (2007) were calculated with values available at that time and were from lower frequency sources. Thus, there is a potential for TTS from some of the Category 2 active sources, particularly for mid- and high-frequency cetaceans. However, even given the more recent data, animals would have to be either very close (few hundreds of meters) and remain near sources for many repeated pings to receive overall exposures sufficient to cause TTS onset (Lucke et al. 2009; Finneran and Schlundt 2010). If behavioral responses typically include the temporary avoidance that might be expected (see above), the potential for auditory effects considered physiological damage (injury) is considered extremely low so as to be negligible in relation to realistic operations of these devices.” It should be noted that in 2015 the USGS experienced at least once instance of a large group of unidentified odontocetes (greater than 20) approaching the vessel and engaging with the vessel’s wake while the EK60 was running in active mode using the 38 kHz transducer in relatively low power mode at < 200 m water depth.
Additional information added by the USGS in formulating this EA: A recent study by Cholewiak et al. (2017) describes beaked whale detections and sightings on the shelf and upper slope while operating the EK60 in passive (listening for sounds) and active (transmitting a pulse from the transducer) mode off New England. The reduced number of sightings and vocalizations during EK60 surveys led the authors to conclude that beaked whales exhibit a behavioral response to EK60 surveys and that the whales may detect the signals at some distance. Cholewiak et al. (2017) also cite unpublished data showing that bottom recorders 1.3 km from the R/V Henry Bigelow could detect her EK60 transmissions at depths of 800 m. The results of a 2016 farfield sound source verification experiment conducted at ~100 m water depth with the USGS 38 kHz EK60 transducer are not yet available.
Clear data about the impact of EK60/80 fisheries sonars are still lacking. There is a possibility of a behavioral response to the EK60 transmissions from some odontocetes, despite the fact that the modeled radii to the 160 dB isopleths is small.
(c ) Other Possible Effects of Seismic Surveys
The possible effects of seismic surveys are incorporated by reference to the Draft Scripps EA (2017). For convenience, this section is reproduced in Appendix E. Additional text related to the specifics of the Proposed Action is provided below.
Vessel noise from R/V Hugh R. Sharp could affect marine animals in the proposed project area. It should be noted that the ship was Navy-designed as a “quiet vessel” and produces underwater radiated noise at levels below the International Council on Exploration of the Seas (ICES) noise curve at 8 knots (cruising speed).
Note that the USGS Proposed Surveys will be carried out at ~4 knots, which requires the use of only one generator on the R/V Hugh R. Sharp. According to the ship’s radiated noise measurement report
IV. Environmental Consequences
Draft Environmental Assessment for USGS Northwest Atlantic, 2018 Page 61
(2009), this mode of operation produces two primary signals at less than 200 kHz: 83 kHz with SEL of 146 dB re 1 µPa at 1 yard and 163 kHz with SEL of 151 dB re 1 µPa at 1 yard.
2. Mitigation Measures
This section copies verbatim from the Draft Scripps EA (LGL, 2017), with modifications keyed to the USGS Proposed Action.
Several mitigation measures are built into the proposed seismic surveys as an integral part of the planned activities. These measures include the following: power ramp ups of the airgun array during a 30 minute period, adding one gun at a time until the full array strength is reached; a minimum of one dedicated observer maintaining a visual watch during all daytime airgun operations, with two observers for 30 min before and during ramp ups during the day; use of mitigation gun to maintain sound input to the ocean during periods when a compressor is being refueled or a gun is being fixed; and shut downs when mammals or turtles are detected in or about to enter the designated EZ. The acoustic source would also be powered or shut down in the event an ESA-listed seabird were observed diving or foraging within the designated exclusion zone. Observers would also watch for any impacts the acoustic sources may have on fish. No airgun array start ups would occur during poor visibility or at night unless at least one airgun (mitigation gun) had been operating.
These mitigation measures are described in § 2.4.4.1 of the NSF-USGS PEIS and summarized earlier in this document, in § II(3). The fact that the GI airgun arrays, as a result of their design, direct the majority of the energy downward, and less energy laterally, is also an inherent mitigation measure.
Previous and subsequent analysis of the potential impacts takes account of these planned mitigation measures. It would not be meaningful to analyze the effects of the planned activities without mitigation, as the mitigation (and associated monitoring) measures are a basic part of the activities, and would be implemented under the Proposed Action or Alternative Action.
3. Potential Numbers of Marine Mammals Exposed to Various Received Sound Levels
All takes would be anticipated to be Level B “takes by harassment.” As described in § I, such takes involve temporary changes in behavior. As required by NMFS in past actions for research seismic surveys conducted by the USGS or NSF, Level A takes are being requested; given the small calculated EZs (0 to 40 m for LF and MF cetaceans and less than 81 m for HF cetaceans) and the proposed mitigation measures to be applied, injurious takes would not be expected. (However, as noted earlier and in the NSF-USGS PEIS, there is no specific information demonstrating that injurious Level A “takes” would occur even in the absence of the planned mitigation measures.)
In the sections below, we describe methods to estimate the number of potential exposures to Level A and Level B sound levels and present estimates of the numbers of marine mammals that could be affected during the proposed seismic surveys. The estimates are based on consideration of the number of marine mammals that could be disturbed appreciably by the USGS Proposed Action.
(a) Basis for Estimating Exposure
Parts of this section are taken verbatim from the Draft Scripps EA (LGL, 2017), while other components originate entirely with the USGS based on the circumstances of the Proposed Action.
IV. Environmental Consequences
Draft Environmental Assessment for USGS Northwest Atlantic, 2018 Page 62
The Level B estimates are based on a consideration of the number of marine mammals that could be within the area around the operating airgun array where received levels of sound ≥160 dB re 1 µParms are predicted to occur (see Table 1). The estimated numbers are based on abundances (numbers) of marine mammals expected to occur in the area of the Proposed Action in the absence of a seismic survey. To the extent that marine mammals tend to move away from seismic sources before the sound level reaches the criterion level and tend not to approach an operating airgun array, these estimates likely overestimate the numbers actually exposed to the specified level of sound. The overestimation is expected to be particularly large when dealing with the higher sound level criteria, i.e., the PTS thresholds (Level A), as animals are more likely to move away when received levels are higher. Likewise, animals are less likely to approach within the PTS threshold radii than they are to approach within the considerably larger ≥160 dB (Level B) radius.
To estimate marine mammal exposures, the USGS used published, quantitative density models by Roberts et al. (2016) for the Survey Area, which is entirely within the U.S. EEZ. These models are provided at 10 km x 10 km resolution in ArcGIS compatible IMG grids on the Duke University cetacean density website (http://seamap.env.duke.edu/models/Duke-EC-GOM-2015/). When available, the cetacean density models for Month 8 (August) were used. Otherwise, the generic annual density model was employed. Only a single density model is provided for the Kogia guild (dwarf and sperm pygmy whales) and for the beaked whale guild (Blainville’s, Cuvier’s, Gervais’, Sowerby’s, and True’s beaked whales). There are no data for the pygmy killer whale, and results for the false killer whale were adopted.
Due to the heterogeneous species’ densities in the Survey Area and the USGS’s direct use of quantitative species density grids from Roberts et al. (2016) in estimating the impact of the surveys on cetaceans, it would be inappropriate to report the type of generic species density values commonly given in some Environmental Assessments produced for research seismic surveys. Instead, Table 9 gives calculated species density and standard deviation in the area containing the entire Proposed Action as calculated from the Roberts et al. (2016) density grid and summarizes group size, as taken primarily from the Draft Scripps EA (LGL, 2017).
To determine takes, the USGS combined the Duke density grids with buffer zones arrayed on either side of each exemplary seismic line and linking/interseismic line, with the buffer zone sizes determined based on the Level A EZ and Level B mitigation zones calculated from the acoustic modeling. The Level A and Level B takes for each species in each 10 km x 10 km block of the IMG density grids are calculated based on the fractional area of each block intersected by the buffer zones (EZ and MZ) for LF, MF, and HF cetaceans. Summing takes along all of the lines yields the total take for each species for the Proposed Action for the Base and Optimal (§ 1) surveys. The method also yields take for each survey line individually, allowing examination of those exemplary lines that will yield the largest or smallest take.
The estimated numbers of individuals potentially exposed are based on the 160-dB re 1 μParms
criterion for all cetaceans. It is assumed that marine mammals exposed to airgun sounds that strong could change their behavior sufficiently to be considered “taken by harassment”. Table 10 shows the estimates of the number of cetaceans that potentially could be exposed to ≥160 dB re 1 μParms during the Proposed Action for the Base Survey and the Optimal Survey if no animals moved away from the survey vessel. The Requested Take Authorization is given in the far right column of Table 10 and represents 25% more than the number of takes calculated using the ArcGIS-based quantitative method devised by the USGS. The requested takes are sometimes increased to account for the size of animal groups (Table 9), to capture the possibility that a rare species could be encountered and taken during the surveys, or to account for the fact that the species is particularly abundant and take up to 1% of population size should be considered.

IV. Environmental Consequences
Draft Environmental Assessment for USGS Northwest Atlantic, 2018 Page 63
Figure 14. The Base Survey would acquire data along the exemplary lines (solid) and 50% of the interseismic linking lines using the base configuration of the GI guns (4 guns at 105 in3 each). The Optimal Survey would acquire data on the exemplary lines using the GG gun configuration (4 guns at 210 in3 each for the portions of these lines at greater than 1000 m water depth). For the Optimal Survey, the portion of the exemplary lines between 100 and 1000 m (yellow shading; bathymetry from Andrews et al., 2016) plus 50% of the linking interseismic lines with the base configuration. Takes are calculated for the entire survey pattern shown here even though only 50% of the linking, interseismic lines would be acquired.
The calculated takes in Table 10 also assume that the proposed surveys would be completed. In fact, it is unlikely that the entire survey pattern (exemplary lines plus 50% of the interseismic, linking lines) would be completed given the limitations on ship time, likely logistical challenges (compressor and GI gun repairs), time spent on transits and refueling, and the historical problems with weather during August in the Northwest Atlantic. In fact, USGS calculated timelines indicate that 25 days, including contingency, could be required to complete the full survey pattern. In fact, 22 days or fewer would be scheduled for this survey with the ship operator. The lines that are actually acquired would be dependent on weather, strength of the Gulf Stream (affects ability to tow the streamer in the appropriate geometry), and other considerations. Thus, fewer takes would be expected than have been calculated or requested. Nonetheless, as is common practice, the requested takes have been increased by 25% (see below). Thus, the estimates estimates of the numbers of marine mammals potentially exposed to Level B sounds≥160 dB re 1 μParms are precautionary (conservative) and probably overestimate the actual numbers of marine mammals that could be involved.
In addition, it is possible that delphinids are less responsive to airgun sounds than are mysticetes, as referenced in both the NSF-USGS PEIS and in this document. The 160-dB (rms) criterion currently applied by NMFS, on which the Level B estimates are based, was developed primarily using data from gray and bowhead whales. The estimates of “takes by harassment” of delphinids are thus considered precautionary. Available data suggest that the current use of a 160-dB criterion could be improved upon, as behavioral response might not occur for some percentage of marine mammals exposed to received levels >160 dB, whereas other individuals or groups might respond in a manner considered as “taken” to sound levels <160
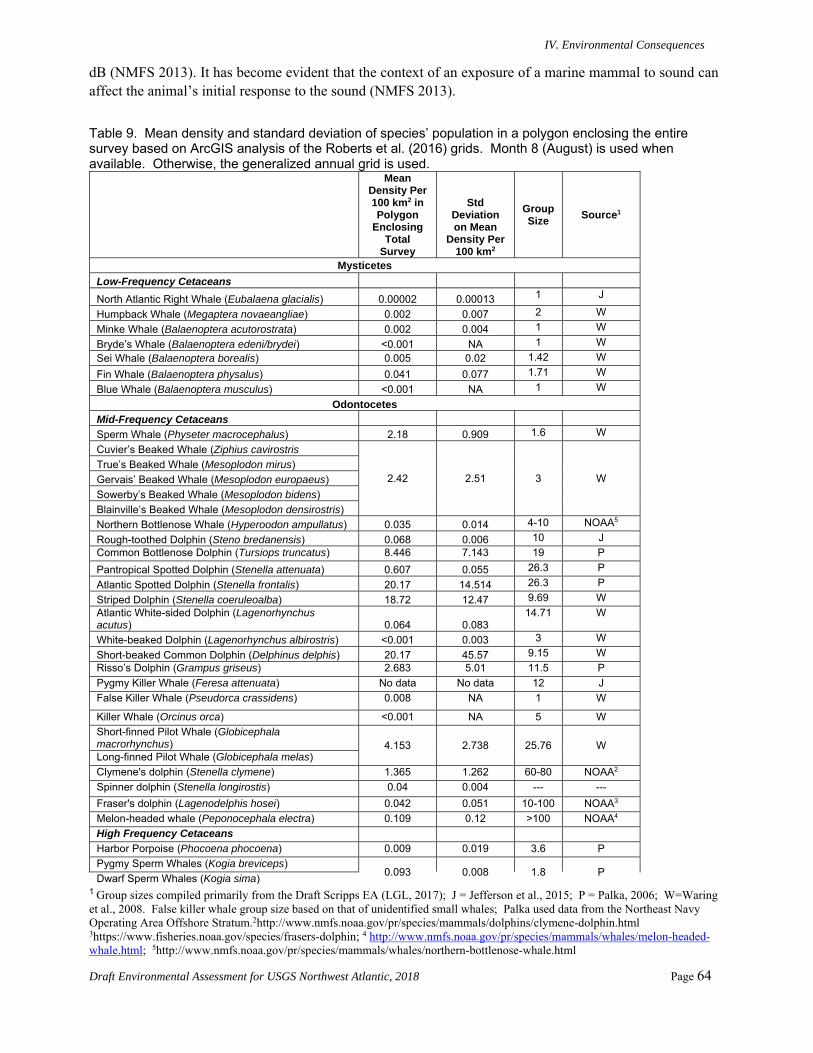
IV. Environmental Consequences
Draft Environmental Assessment for USGS Northwest Atlantic, 2018 Page 64
dB (NMFS 2013). It has become evident that the context of an exposure of a marine mammal to sound can affect the animal’s initial response to the sound (NMFS 2013).
Table 9. Mean density and standard deviation of species’ population in a polygon enclosing the entire survey based on ArcGIS analysis of the Roberts et al. (2016) grids. Month 8 (August) is used when available. Otherwise, the generalized annual grid is used.
Mean Density Per 100 km2 in Polygon
Enclosing Total
Survey
Std Deviation on Mean
Density Per 100 km2
Group Size
Source1
Mysticetes
Low-Frequency Cetaceans
North Atlantic Right Whale (Eubalaena glacialis) 0.00002 0.00013 1 J
Humpback Whale (Megaptera novaeangliae) 0.002 0.007 2 W
Minke Whale (Balaenoptera acutorostrata) 0.002 0.004 1 W
Bryde’s Whale (Balaenoptera edeni/brydei) <0.001 NA 1 W
Sei Whale (Balaenoptera borealis) 0.005 0.02 1.42 W
Fin Whale (Balaenoptera physalus) 0.041 0.077 1.71 W
Blue Whale (Balaenoptera musculus) <0.001 NA 1 W
Odontocetes
Mid-Frequency Cetaceans
Sperm Whale (Physeter macrocephalus) 2.18 0.909 1.6 W
Cuvier’s Beaked Whale (Ziphius cavirostris
2.42 2.51 3 W True’s Beaked Whale (Mesoplodon mirus)
Gervais’ Beaked Whale (Mesoplodon europaeus)
Sowerby’s Beaked Whale (Mesoplodon bidens)
Blainville’s Beaked Whale (Mesoplodon densirostris)
Northern Bottlenose Whale (Hyperoodon ampullatus) 0.035 0.014 4-10 NOAA5
Rough-toothed Dolphin (Steno bredanensis) 0.068 0.006 10 J
Common Bottlenose Dolphin (Tursiops truncatus) 8.446 7.143 19 P
Pantropical Spotted Dolphin (Stenella attenuata) 0.607 0.055 26.3 P
Atlantic Spotted Dolphin (Stenella frontalis) 20.17 14.514 26.3 P
Striped Dolphin (Stenella coeruleoalba) 18.72 12.47 9.69 W
Atlantic White-sided Dolphin (Lagenorhynchus acutus) 0.064 0.083
14.71 W
White-beaked Dolphin (Lagenorhynchus albirostris) <0.001 0.003 3 W
Short-beaked Common Dolphin (Delphinus delphis) 20.17 45.57 9.15 W
Risso’s Dolphin (Grampus griseus) 2.683 5.01 11.5 P
Pygmy Killer Whale (Feresa attenuata) No data No data 12 J
False Killer Whale (Pseudorca crassidens) 0.008 NA 1 W
Killer Whale (Orcinus orca) <0.001 NA 5 W
Short-finned Pilot Whale (Globicephala macrorhynchus) 4.153 2.738 25.76 W Long-finned Pilot Whale (Globicephala melas)
Clymene's dolphin (Stenella clymene) 1.365 1.262 60-80 NOAA2
Spinner dolphin (Stenella longirostis) 0.04 0.004 --- ---
Fraser's dolphin (Lagenodelphis hosei) 0.042 0.051 10-100 NOAA3
Melon-headed whale (Peponocephala electra) 0.109 0.12 >100 NOAA4
High Frequency Cetaceans
Harbor Porpoise (Phocoena phocoena) 0.009 0.019 3.6 P
Pygmy Sperm Whales (Kogia breviceps) 0.093 0.008 1.8 P
Dwarf Sperm Whales (Kogia sima) 1 Group sizes compiled primarily from the Draft Scripps EA (LGL, 2017); J = Jefferson et al., 2015; P = Palka, 2006; W=Waring et al., 2008. False killer whale group size based on that of unidentified small whales; Palka used data from the Northeast Navy Operating Area Offshore Stratum.2http://www.nmfs.noaa.gov/pr/species/mammals/dolphins/clymene-dolphin.html 3https://www.fisheries.noaa.gov/species/frasers-dolphin; 4 http://www.nmfs.noaa.gov/pr/species/mammals/whales/melon-headed-whale.html; 5http://www.nmfs.noaa.gov/pr/species/mammals/whales/northern-bottlenose-whale.html
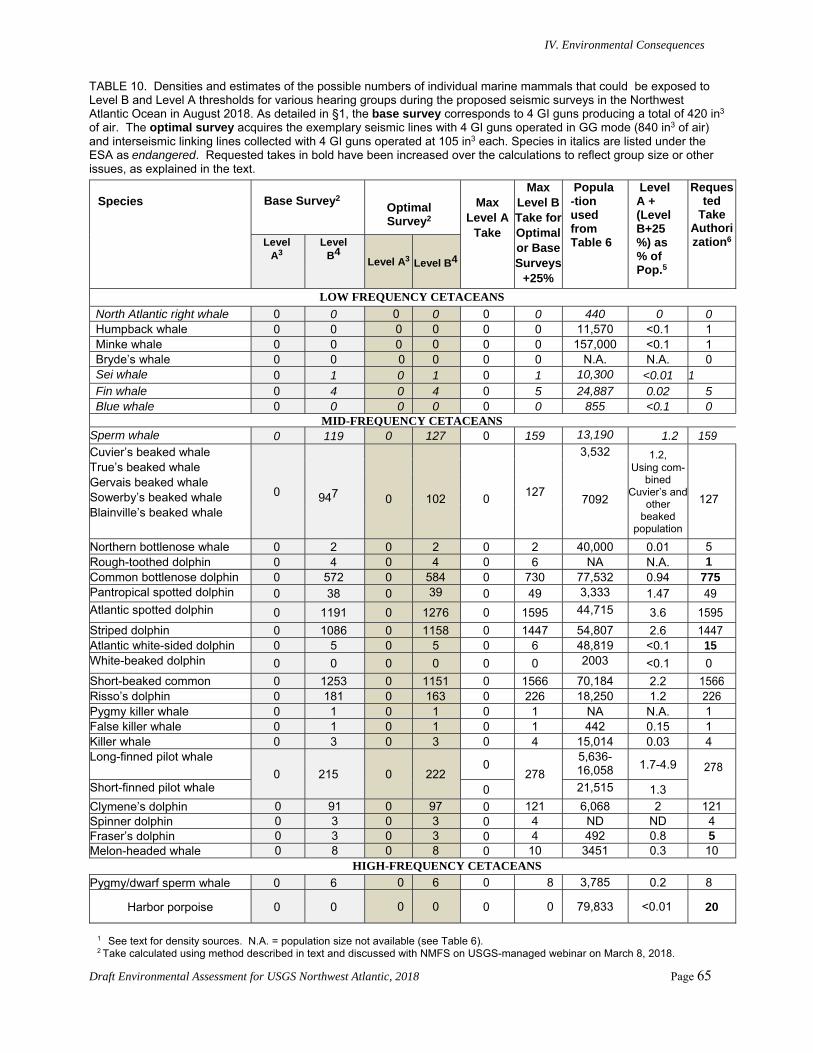
IV. Environmental Consequences
Draft Environmental Assessment for USGS Northwest Atlantic, 2018 Page 65
TABLE 10. Densities and estimates of the possible numbers of individual marine mammals that could be exposed to Level B and Level A thresholds for various hearing groups during the proposed seismic surveys in the Northwest Atlantic Ocean in August 2018. As detailed in §1, the base survey corresponds to 4 GI guns producing a total of 420 in3 of air. The optimal survey acquires the exemplary seismic lines with 4 GI guns operated in GG mode (840 in3 of air) and interseismic linking lines collected with 4 GI guns operated at 105 in3 each. Species in italics are listed under the ESA as endangered. Requested takes in bold have been increased over the calculations to reflect group size or other issues, as explained in the text.
1 See text for density sources. N.A. = population size not available (see Table 6). 2 Take calculated using method described in text and discussed with NMFS on USGS-managed webinar on March 8, 2018.
Species
Base Survey2
Optimal Survey2
Max
Level A Take
Max Level B Take for Optimal or Base Surveys
+25%
Popula-tion used from Table 6
Level A + (Level B+25%) as % of Pop.5
Requested
Take Authorization6 Level
A3 Level
B4 Level A3 Level B4
LOW FREQUENCY CETACEANS North Atlantic right whale 0 0 0 0 0 0 440 0 0 Humpback whale 0 0 0 0 0 0 11,570 <0.1 1 Minke whale 0 0 0 0 0 0 157,000 <0.1 1 Bryde’s whale 0 0 0 0 0 0 N.A. N.A. 0 Sei whale 0 1 0 1 0 1 10,300 <0.01 1 Fin whale 0 4 0 4 0 5 24,887 0.02 5 Blue whale 0 0 0 0 0 0 855 <0.1 0
MID-FREQUENCY CETACEANS Sperm whale 0 119 0 127 0 159 13,190 1.2 159 Cuvier’s beaked whale
0 947
0
102
0
127
3,532 1.2, Using com-
bined Cuvier’s and
other beaked
population
127
True’s beaked whale
7092
Gervais beaked whale Sowerby’s beaked whale Blainville’s beaked whale
Northern bottlenose whale 0 2 0 2 0 2 40,000 0.01 5 Rough-toothed dolphin 0 4 0 4 0 6 NA N.A. 1Common bottlenose dolphin 0 572 0 584 0 730 77,532 0.94 775 Pantropical spotted dolphin 0 38 0 39 0 49 3,333 1.47 49 Atlantic spotted dolphin 0 1191 0 1276 0 1595 44,715 3.6 1595
Striped dolphin 0 1086 0 1158 0 1447 54,807 2.6 1447 Atlantic white-sided dolphin 0 5 0 5 0 6 48,819 <0.1 15 White-beaked dolphin 0 0 0 0 0 0 2003 <0.1 0
Short-beaked common 0 1253 0 1151 0 1566 70,184 2.2 1566 Risso’s dolphin 0 181 0 163 0 226 18,250 1.2 226 Pygmy killer whale 0 1 0 1 0 1 NA N.A. 1 False killer whale 0 1 0 1 0 1 442 0.15 1 Killer whale 0 3 0 3 0 4 15,014 0.03 4 Long-finned pilot whale
0 215 0 222 0
278
5,636-16,058 1.7-4.9 278
Short-finned pilot whale 0 21,515 1.3
Clymene’s dolphin 0 91 0 97 0 121 6,068 2 121 Spinner dolphin 0 3 0 3 0 4 ND ND 4 Fraser’s dolphin 0 3 0 3 0 4 492 0.8 5 Melon-headed whale 0 8 0 8 0 10 3451 0.3 10
HIGH-FREQUENCY CETACEANS
Pygmy/dwarf sperm whale 0 6 0 6 0 8 3,785 0.2 8
Harbor porpoise 0 0 0 0 0 0 79,833 <0.01 20
IV. Environmental Consequences
Draft Environmental Assessment for USGS Northwest Atlantic, 2018 Page 66
3 Level A takes if there were no mitigation measures. Ensonified areas are based on PTS thresholds. 4 Level B takes, based on the 160-dB criterion, excluding exposures to sound levels equivalent to PTS thresholds. 5 Level A and B takes (used by NMFS as proxy for number of individuals exposed), expressed as % of population. 6 Requested takes (Level A+Level B); increased to mean group size in some instances (see Table 9 for sources).
(b) Potential Number of Marine Mammals Exposed to 160 dB
As noted above, The number of cetaceans that could be exposed to airgun sounds with received levels 160 dB re 1 µParms (Level B) for marine mammals on one or more occasions has been estimated by combining the gridded animal abundances available from the Duke University cetacean density website (http://seamap.env.duke.edu/models/Duke-EC-GOM-2015/) with the exemplary track lines/linking lines and Level B PTS threshold buffers calculated by LDEO. The method intersects the ensonified area along each track line for the appropriate Level B threshold buffer with the gridded animal abundances. For each block of the underlying abundance grid intersected by the trackline and associated ensonified area, the take is calculated as the percentage of that block that is ensonified multipled by the abundance of animals in the block. The takes are summed along each trackline and linking line and added to determine the total take for the surveys. The approach assumes that no marine mammals would move away or toward the trackline in response to increasing sound levels before the levels reach the specific thresholds as R/V Sharp approaches. The amount of overlap of the ensonified area is minimal and confined to areas of turns at the ends of exemplary survey lines or where linking lines join exemplary lines. The small amount of overlap reflects in part the fact that most exemplary dip lines are spaced at more than 20 km.
Total estimated takes for the entire survey are reported in Table 10 for the Optimal and Base surveys. The table also reports the maximum take of each species for the two survey configurations (see below) with 25% added as a buffer and the requested take authorization. The Optimal Survey includes most dip lines and one strike line acquired with the GG configuration (840 in3 of air), with the remaining lines and linking lines acquired using the base (4x10⁵ in3 or 420 in3 of air) configuration (Figure 14). Note that this is an overestimate since it assumes that all of the interseismic linking lines would have data acquisition, even though at most only half of the lines will be acquired. Some of the linking lines would not even be surveyed with seismic methods since transit between exemplary lines is faster with no streamer in the water, and such transits provide an opportunity to fix gear, refuel compressors, and address other issues. The take calculations for the Base Survey assume all of the exemplary lines and linking lines are acquired with the base (420 in3 of air) configuration and, again, that all of the interseismic linking lines are acquired.
The maximum estimate of the number of cetaceans that could be exposed to seismic sounds with received levels ≥160 dB re 1 µParms in the survey area is 4965 (Table 10). This number was calculated assuming that seismic data would be acquired along all the shelf-break and deepwater interseismic connecting lines shown in the red dashed pattern in Figure 1 and assuming the maximum source levels are used for the major exemplary seismic lines (Optimal Survey). At most, only about half of the interseismic connecting lines will be acquired at either the shelf-break or deepwater. The maximum Level B take estimate of 4965 cetaceans includes ~131 cetacean individuals listed under the ESA: 1 sei whale, 4 fin whales, 127 sperm whales, and no blue or North Atlantic right whales. Adding the nominal 25% extra take to these values, the sperm whale figure represents 1.21% of the estimated population, fin whale take is ~0.02%, and sei whale take is 0.01%. In addition, 102 beaked whales could be exposed. Most Level B exposures would accrue to mid-frequency cetaceans. The largest potential takes would be for species that are plentiful and widespread, such as Atlantic spotted dolphin, striped dolphin, short-beaked common dolphin, and common bottlenose dolphin.
The take authorizations requested in the last column of Table 10 are precautionary and assume that certain extralimital mysticetes could be encountered during the Proposed Survey. Note also that the basis of the Take Authorization Request is the maximum A + B takes +25% for the Base and Optimal surveys,
IV. Environmental Consequences
Draft Environmental Assessment for USGS Northwest Atlantic, 2018 Page 67
so the requested takes are very conservative. Were an equipment failure to force the Proposed Action to be carried out with the Base Configuration, takes would be far smaller based on the much smaller MZ given in Appendix A.
All of the calculated takes fall well within the typical definition of “small takes” as implemented under the MMPA. Some of the requested takes, but not all, have been increased to account for the average group size (Table 9). In other cases, group size was not taken into consideration. For example, melon-headed whales often occur in very large groups, but the requested take has been kept at the calculated value of 10 individuals. Harbor porpoise take is requested due to the sheer abundance of these animals and the remote possibility that they could occur extralimitally in the Proposed Survey Area. In some cases, the take request was increased to 1% of the population for particularly abundant species that are likely to be encountered in the Survey Area (e.g., common bottlenose dolphin).
(c) Level A Takes
Level A takes were determined to be zero for all species and both survey configurations. The highest Level A take calculated was 0.375 individuals for the Kogia guild (not separated into pygmy and dwarf sperm whales in the Roberts et al., 2016 data) for the entire Optimal survey. Even increasing this by 25% still yields a take less than 1 for Level A for this guild.
4. Conclusions for Marine Mammals and Sea Turtles
The Proposed Action would involve towing an array of two to four GI airguns that introduce pulsed sounds into the ocean. Routine vessel operations, other than the proposed seismic operations, are conventionally assumed not to affect marine mammals sufficiently to constitute “taking”.
(a) Cetaceans
This section incorporates by reference and adopts nearly verbatim the Draft Scripps EA (2017), with minor changes to reflect the particular circumstances applicable to the Proposed Action.
In § 3.6.2, 3.7.2, and 3.8.2, the NSF-USGS PEIS concluded that airgun operations with implementation of the proposed monitoring and mitigation measures could result in a small number of Level B behavioral effects in some cetaceans in the Northwest Atlantic DAA, that Level A effects were highly unlikely, and that operations were unlikely to adversely affect ESA-listed species. Nonetheless, NMFS requires the calculation and request of potential Level A takes for the Proposed Action. For five past NSF-funded seismic surveys and the 2014/15 USGS ECS survey (RPS, 2014a), NMFS issued small numbers of Level A take for some marine mammal species for the remote possibility of low-level physiological effects; however, NMFS expected neither mortality nor serious injury of marine mammals to result from the surveys (NMFS 2015b, 2016b,c, NMFS 2017a,b).
In this Draft EA, estimates of the numbers of marine mammals that could be exposed to airgun sounds during the proposed program have been presented, together with the requested “take authorization”. The estimated numbers of animals potentially exposed to sound levels sufficient to cause appreciable disturbance are very low percentages of the regional population sizes (Table 10).
The take calculations are likely to yield significant overestimates of the actual number of animals that would be exposed to and would react to the seismic sounds, particularly because most mammals, except some delphinids, tend to move away from sound sources. The relatively short-term exposures are unlikely to result in any long-term negative consequences for the individuals or their populations. Therefore, no significant impacts on marine mammals would be anticipated from the proposed activities.

IV. Environmental Consequences
Draft Environmental Assessment for USGS Northwest Atlantic, 2018 Page 68
In decades of seismic surveys carried out by the U.S. academic research fleet, PSOs and other crew members have not observed any seismic sound-related marine mammal injuries or mortality. Also, actual numbers of animals potentially exposed to sound levels sufficient to cause disturbance (i.e., to be considered takes) have almost always been much lower than predicted and authorized takes. For example, during an NSF-funded, ~5000-km, 2-D seismic survey conducted by the Langseth off the coast of North Carolina in September–October 2014, only 296 cetaceans were observed within the predicted 160-dB zone and potentially taken, representing <2% of the 15,498 takes authorized by NMFS (RPS 2015). During an USGS-funded, ~2700 km, 2-D seismic survey conducted by the Langseth along the U.S. east coast in August–September 2014, only 3 unidentified dolphins were observed within the predicted 160-dB zone and potentially taken, representing <0.03% of the 11,367 authorized takes (RPS 2014b). Furthermore, as defined, all animals exposed to sound levels >160 dB are Level B ‘takes’ whether or not a behavioral response occurred. The 160-dB zone, which is based on predicted sound levels, is thought to be conservative given the type of acoustic modeling used to calculate the distance from the source to this isopleth; thus, not all animals detected within this zone would be expected to have been exposed to actual sound levels >160 dB.
(b) Sea Turtles
In § 3.4.7, the NSF-USGS PEIS concluded that with implementation of the proposed monitoring and mitigation measures, no significant impacts of airgun operations are likely to sea turtle populations in any of the analysis areas, and that any effects are likely to be limited to short-term behavioral disturbance and short-term localized avoidance of an area of unknown size near the active airguns. Only foraging or migrating individuals are likely to occur in the area of the Proposed Action. Given the proposed activities, no significant impacts on sea turtles would be anticipated. In decades of seismic surveys carried out by the U.S. academic research fleet, PSOs and other crew members have not observed any seismic sound-related turtle injuries or mortality.
5. Direct Effects on Marine Invertebrates, Fish, Fisheries, and Their Significance
§ IV.4 of the Draft Scripps EA (2017) is hereby incorporated by reference. This information is provided nearly verbatim, with small changes to reflect the particular Proposed Action, in Appendix F, as part of an effort to comply with streamlining directives for NEPA documentation.
(a) Effects of Sound on Marine Invertebrates
(b) Effects of Sound on Fish
(c) Effects of Sound on Fisheries
(d) Conclusions for Invertebrates, Fish, and Fisheries
This section is mostly verbatim from the Draft Scripps EA (LGL, 2017), with changes to reflect the specifics of the USGS’s Proposed Action.
The newly available information does not affect the outcome of the effects assessment as presented in the NSF-USGS PEIS. The NSF-USGS PEIS concluded that there could be changes in behavior and other non-lethal, short-term, temporary impacts, and injurious or mortal impacts on a small number of individuals within a few meters of a high-energy acoustic source, but that there would be no significant impacts of NSF-funded marine seismic research on populations. The NSF-USGS PEIS also concluded that seismic surveys could cause temporary, localized reduced fish catch to some species, but that effects on commercial and recreation fisheries would not be significant.

IV. Environmental Consequences
Draft Environmental Assessment for USGS Northwest Atlantic, 2018 Page 69
Interactions between the proposed survey and fishing operations in the proposed project area are expected to be limited. Two possible conflicts in general are streamer entangling with fishing gear and the temporary displacement of fishers from the proposed project area. Fishing activities could occur within the proposed project area; however, a safe distance would need to be kept from R/V Sharp and the towed seismic equipment. During the survey, the towed seismic streamer is relatively short, so this distance would be relatively small. Conflicts would be avoided through communication with the fishing community during the surveys. In particular, USGS experience on the R/V Sharp in 2015, 2016, and 2017 (including during times that partially overlap the month of the Proposed Action for 2018) indicates that the vessel’s crew has good relationships with fishers and a good understanding of how they arrange their gear, where fishing is most likely, and how to negotiate in real-time to ensure that both the scientific and fishing operations can continue. Based on past experience by the USGS investigators participating in six cruises in the Survey Area since 2014, the most likely overlap between fishing activities and the Proposed Action would be on the uppermost continental slope, between the shallowest extent of the surveys (100 m water depth) and ~500 m water depth, particularly near canyons. Particular diligence will be exercised to communicate with fishers in these areas 6 to 12 hours before commencing acquisition of data on these parts of the exemplary survey lines.
Given the proposed activity, no significant impacts on marine invertebrates, marine fish, and their fisheries would be expected. In decades of seismic surveys carried out by vessels in the U.S. academic research fleet, PSOs and other crew members have not observed any seismic sound-related fish or invertebrate injuries or mortality.
6. Direct Effects on Seabirds and Their Significance
§ IV.5 of the Draft Scripps EA (2017) is hereby incorporated by reference. The section is reproduced in Appendix G for the sake of convenience.
7. Indirect Effects on Marine Mammals, Sea Turtles, Seabirds, Fish, and Their Significance
§ IV.6 of the Draft Scripps EA (LGL, 2017) is hereby incorporated by reference. The section is reproduced in Appendix G for the sake of convenience.
8. Cumulative Effects
Taking text verbatim from the Draft Scripps EA (LGL, 2017) and making small changes to reflect the particulars of the Proposed USGS Action for this leading paragraph: The results of the cumulative impacts analysis in the NSF-USGS PEIS indicated that there would not be any significant cumulative effects to marine resources from the proposed USGS marine seismic research. However, the NSF-USGS PEIS also stated that, “A more detailed, cruise-specific cumulative effects analysis would be conducted at the time of the preparation of the cruise-specific EAs, allowing for the identification of other potential activities in the area of the proposed seismic surveys that may result in cumulative impacts to environmental resources. Here we focus on activities that could impact animals specifically in the proposed project area (academic and industry research activities, vessel traffic, and fisheries).”
(a) Past and future research activities in the area
Industry has not acquired any airgun seismic data on the U.S Atlantic margin between Cape Hatteras and Hudson Canyon for at least 30 years (Figure 15), except for work under contract to the academic community for acquisition of the EDGE line in 1990 (see below). The legacy industry data released by BOEM through the USGS NAMSS portal over the past few years show that the industry lines acquired between ~1975 and 1985 do not extend beyond 1500 m or occasionally 2000 m water depth in most cases.

IV. Environmental Consequences
Draft Environmental Assessment for USGS Northwest Atlantic, 2018 Page 70
Several IHAA for industry seismic activities have been considered by BOEM and NMFS over the past few years, and more could be anticipated with implementation of Executive Order 13795 of April 28, 2017.
Figure 15. Industry seismic lines acquired primarily from 1975 to 1982 (some as late as 1985) are shown in black relative to the MATRIX seismic survey (Proposed Action). The industry data were released by BOEM through the USGS NAMSS portal over the past few years. The blue polygons were identified by BOEM as moderately to highly prospective for gas hydrates (BOEM, 2012a). White circles indicate research boreholes (e.g., Ocean Drilling Program and other), and blue wells were drilled by industry, including some COST wells.
In 2015, NSF funded a 540 km2 airgun survey (700 in3 air volume) that was carried out by the R/V Langseth on the New Jersey shelf between 27 and 64 m water depth (Crone et al., 2017), about 25 nm landward of the shelf-break end of the northernmost exemplary dip line (Figure 16). This survey covered an area where IODP Expedition 313 had drilled to investigate a long-term sea level rise record in 2009 (Expedition 313 Scientists, 2010).
In 2014, the USGS acquired seismic data with the 36-gun R/V Langseth seismic array between the northernmost exemplary line for this Proposed Action and Hudson Canyon as part of the Extended Continental Shelf (ECS) project (RPS, 2014a) in support of the U.S. Law of the Sea effort (Figure 16). The ECS line is 30 nm NNW of the landward side of the northernmost dip line for the Proposed Action and 15 nm NNW at the distal end of that dip line. The ECS cruise traveled far seaward of the EEZ and went much farther out to sea than data will be acquired in the Proposed Action.
The last extensive airgun seismic research program on the Mid-Atlantic part of the margin was carried out by the USGS in 1979 (gray lines; Figure 16). Working with partner organizations such as the BGR (Bundesanstalt fur Geowissenschaften und Rohstaffe; Hannover, Germany), the USGS acquired a grid of seismic lines within the Proposed Action area. These data have been used, and in some cases, reprocessed by BOEM to delineate some aspects of deepwater areas where gas hydrates may be present (blue polygons in Figure 16), but the data are considered too incomplete to be definitive. Navigation on these lines was before the Global Positioning System and did not even use the LORAN standard.
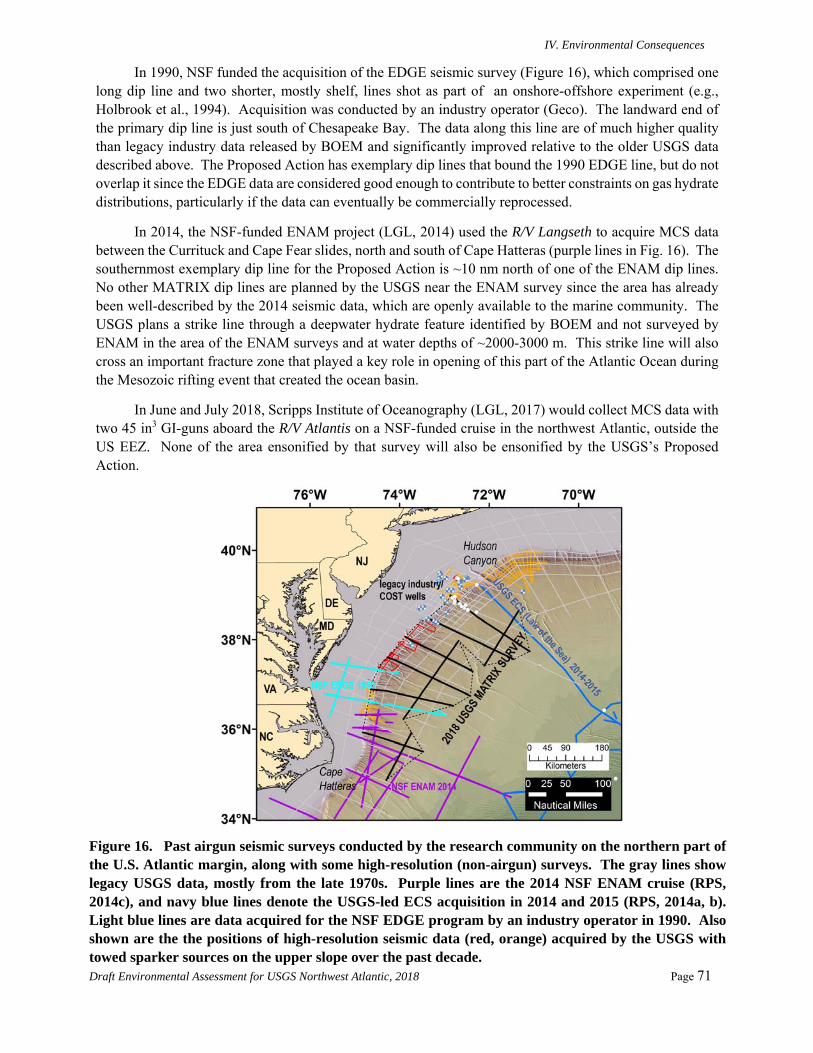
IV. Environmental Consequences
Draft Environmental Assessment for USGS Northwest Atlantic, 2018 Page 71
In 1990, NSF funded the acquisition of the EDGE seismic survey (Figure 16), which comprised one long dip line and two shorter, mostly shelf, lines shot as part of an onshore-offshore experiment (e.g., Holbrook et al., 1994). Acquisition was conducted by an industry operator (Geco). The landward end of the primary dip line is just south of Chesapeake Bay. The data along this line are of much higher quality than legacy industry data released by BOEM and significantly improved relative to the older USGS data described above. The Proposed Action has exemplary dip lines that bound the 1990 EDGE line, but do not overlap it since the EDGE data are considered good enough to contribute to better constraints on gas hydrate distributions, particularly if the data can eventually be commercially reprocessed.
In 2014, the NSF-funded ENAM project (LGL, 2014) used the R/V Langseth to acquire MCS data between the Currituck and Cape Fear slides, north and south of Cape Hatteras (purple lines in Fig. 16). The southernmost exemplary dip line for the Proposed Action is ~10 nm north of one of the ENAM dip lines. No other MATRIX dip lines are planned by the USGS near the ENAM survey since the area has already been well-described by the 2014 seismic data, which are openly available to the marine community. The USGS plans a strike line through a deepwater hydrate feature identified by BOEM and not surveyed by ENAM in the area of the ENAM surveys and at water depths of ~2000-3000 m. This strike line will also cross an important fracture zone that played a key role in opening of this part of the Atlantic Ocean during the Mesozoic rifting event that created the ocean basin.
In June and July 2018, Scripps Institute of Oceanography (LGL, 2017) would collect MCS data with two 45 in3 GI-guns aboard the R/V Atlantis on a NSF-funded cruise in the northwest Atlantic, outside the US EEZ. None of the area ensonified by that survey will also be ensonified by the USGS’s Proposed Action.
Figure 16. Past airgun seismic surveys conducted by the research community on the northern part of the U.S. Atlantic margin, along with some high-resolution (non-airgun) surveys. The gray lines show legacy USGS data, mostly from the late 1970s. Purple lines are the 2014 NSF ENAM cruise (RPS, 2014c), and navy blue lines denote the USGS-led ECS acquisition in 2014 and 2015 (RPS, 2014a, b). Light blue lines are data acquired for the NSF EDGE program by an industry operator in 1990. Also shown are the the positions of high-resolution seismic data (red, orange) acquired by the USGS with towed sparker sources on the upper slope over the past decade.

IV. Environmental Consequences
Draft Environmental Assessment for USGS Northwest Atlantic, 2018 Page 72
In April 2015, the USGS Gas Hydrates Project used a mini-sparker operated at less than 2.9 kJ and a ~500 m streamer to collect ~550 line-km of high-resolution seismic data in the Proposed Action Area between Wilmington and Washington Canyons, from the shelf-break to ~1500 m water depth, using the R/V Endeavor as the platform (Ruppel et al., 2015; red lines Figure 16). These data cannot directly image the base of the gas hydrate stability zone without analysis of the seismic attributes, nor do they penetrate the sediments deeply enough to capture all the relevant shallow gas features. They provide a good complement to the lines to be acquired during the Proposed Action in some places, but cover less than a third of the along-margin sector and only a fraction of the water depth range to be imaged during the Proposed Action. Since the late 2000s, the USGS has also acquired other low-energy (e.g., mini-sparker source), high-resolution (not very deep penetration) MCS data from the R/V Oceanus and the contract vessel Tiki. These lines (orange on Figure 16) are on the upper slope or at the shelf-break near the Currituck slide and just to the south and across the outer shelf in the area near the landward end of the northernmost exemplary dip line, just seaward of the 2015 New Jersey shelf MCS survey. None of these USGS data are useful for constraining the distribution of continuous deepwater gas hydrates.
Because the cruise tracks for academic surveys are not always public knowledge, this subsection details only those activities about which the USGS has direct knowledge over the past few years. Activities whose primary focus was the shelf (e.g., NSF-funded project on the New Jersey margin in 2015), and thus landward of the Proposed Action, are not considered. Between 2011 and 2013, the NOAA vessel Okeanos Explorer mapped large swaths of the Proposed Area from the shelf-break to 1500 or 2000 m water depth using hull-mounted instrumentation. Most of the data were acquired with a Kongsberg EM302 hull-mounted multibeam (30 kHz), with additional information sometimes acquired using a Knudsen hull-mounted Chirp. An EK60 system with multiple transducers was operational during many of the activities, but did not yield useful data for most of them due to a calibration problem (T. Weber, pers. comm.). NOAA’s Deep Discoverer ROV also conducted a few dives in the Survey Area during this period. The Okeanos Explorer will conduct expeditions that include MBES, EK60, and Knudsen mapping and D2 dives on the U.S. Atlantic margin starting in mid-2018, with some activities focused on the mid-Atlantic part of the margin, particularly if dives or additional MBES mapping are requested there by the larger marine community. The USGS participates in planning activities for the Okeanos Explorer program, and the only potential overlap in time is for the northernmost dip line in the Survey Area during August 2018. The USGS has already provided NOAA’s Ocean Exploration and Research Program with the GIS file containing survey lines for the Proposed Action.
A pre-2015 NOPP activity that involved BOEM, NOAA, and the USGS conducted other ROV dives and AUV operations in localized areas to study corals, canyon habitats, and chemosynthetic communities at seep sites. The NOPP cruises typically used NOAA vessels (e.g., R/V Nancy Foster) or other available vessels. The full range of activities carried out by NMFS itself is unknown, but is believed to be often confined to the shelf and uppermost continental slope, with the exception of some specialized surveys (e.g., beaked whale surveys out of NEFSC; Cholewiak, 2017). A newly funded NOPP collaboration commenced in 2017 and conducted brief mapping offshore Cape Hatteras in 2017. The 2018 program will include DSV Alvin dives and more multibeam mapping in the southern part of the Survey Area during the summer. The Alvin expedition is co-led by a USGS investigator, with whom the lead MATRIX lead PI often collaborates and with whom the MATRIX program is coordinating.
Due to its involvement in the discovery of more than 570 seep sites on the US Atlantic margin as published in a 2014 paper and database (Skarke et al., 2014), the USGS has led or been a part of 6 cruises in the landward side of the Proposed Action area (shelf-break to upper slope depths of ~1500 m) since 2014. In July 2014, a NSF-sponsored cruise conducted CTDs, EK60 water column imaging, and Knudsen imaging in Hudson Canyon and at an adjacent control site on the upper continental slope as part of a methane flux and oxidation rate study aboard the R/V Endeavor. In April 2015, the USGS collected high-resolution

IV. Environmental Consequences
Draft Environmental Assessment for USGS Northwest Atlantic, 2018 Page 73
(mini-sparker source) MCS data between Wilmington and Washington Canyons, as mentioned above. In September 2015, the USGS led a piston coring, multicoring, and EK60 survey that sampled sites from Washington Canyon to the New England margin. In March 2016, the USGS participated in a R/V Neil Armstrong science verification cruise that acquired multibeam and EK60 data along isolated tracklines from Cape Hatteras to Baltimore Canyon. In May 2017, the USGS conducted a ROV cruise sponsored primarily by NOAA OER, diving on sites from between just south of Norfolk Canyon to Baltimore Canyon and collecting authigenic carbonates, benthic community samples, water, and sediments. In August/September 2017, the USGS co-led a CTD, large volume water sampling, and EK60 cruise from Cape Hatteras to Baltimore Canyon. We are also aware of a DSV Alvin cruise led by Cindy Van Dover in 2015. In the area from north of Cape Hatteras and stretching nearly to Georges Bank, this cruise conducted about a dozen dives on seep sites originally described by Skarke et al. (2014).
The northernmost exemplary dip lines for MATRIX purposely intersect or come close to industry/research wells (e.g., COST B-3, completed in 1979) and some ODP upper continental slope boreholes (e.g., for ODP Leg 150 in 1993, ODP Leg 174A in 1997). Acquiring modern MCS data along these lines will enhance the utility of stratigraphic and timing data from these wells and advance the interpretation of the existing borehole logs.
(b) Vessel traffic
Several major ports are located between Cape Hatteras and Hudson Canyon, and traffic to Norfolk, Baltimore, and New York City and into Delaware Bay all crosses parts of the Proposed Action area. Vessel traffic in the project area would consist mainly of cargo vessels, commercial fishing vessels, and tankers, as well as U.S. Navy vessels (near Norfolk especially), and an occasional cruise ship and long-distance sailboat. As of 22 February, the Automated Mutual-Assistance Vessel Rescue (AMVER) site was unavailable (last attempted access on 3 March, 2018). This system, managed by the U.S. Coast Guard (USCG), provides information about all identified ship traffic. Live vessel traffic information is available from MarineTraffic, including vessel names, types, flags, positions, and destinations, but legacy information requires payment. Various types of vessels were within the total area of the Proposed Action when marinetraffic.com was accessed on March 3, 2018, including cargo vessels (16), tankers (4), and a passenger vessel. In August 2018, commercial fishing vessels are also expected to be in the area, and the USGS has frequently encountered Navy vessels and operations in the part of the Survey Area between Delaware Bay and Cape Hatteras on previous cruises. The R/V Sharp expects to spend 1-2 days acquiring data on each of the exemplary seismic lines, meaning that it will add only negligible additional traffic. Analysis of the 2012 USCG Automatic Identification System (AIS) shipping density grid for the area north of the Maryland-Virginia border as provided by the Mid-Atlantic Ocean Data Portal from MARCO shows that the exemplary seismic lines for the Proposed Action intersect locations with up to 6 shiptracks per year on an annualized basis. Thus, the combination of the USGS operations with the existing shipping operations is expected to produce only a negligible increase in overall ship disturbance effects on marine mammals.
(c) Fisheries
This section is partially excerpted from the Draft Scripps EA (LGL, 2017). The commercial fisheries in the general area of the proposed survey are described in § III. The primary contributions of fishing to potential cumulative impacts on marine mammals and sea turtles involve direct and indirect removal of prey items, sound produced during fishing activities, and potential entanglement (Reeves et al. 2003). There may be some localized avoidance or attraction by marine mammals of fishing vessels near the

IV. Environmental Consequences
Draft Environmental Assessment for USGS Northwest Atlantic, 2018 Page 74
proposed project area. Fishing operations in the proposed project area are likely to be limited to the upper continental slope and locations near canyons.
The USGS operations in the Proposed Action are of limited duration (< 1 month), with only 1-2 days operating on a specific line. The combination of the USGS operations with the existing commercial fishing operations is expected to produce only a negligible increase in overall disturbance effects on marine mammals and sea turtles. Proposed survey operations should not impede fishing operations, and R/V Sharp would avoid fishing vessels when towing seismic equipment. Operation of R/V Sharp, therefore, would not be expected to significantly impact commercial fishing operations in the area.
(d) Summary of Cumulative Impacts to Marine Mammals, Sea Turtles, Seabirds, and Fish
This section is taken verbatim from the Draft Scripps EA (LGL, 2017), with changes to reflect the specifics of USGS activities. The impacts of the USGS’s proposed seismic surveys are expected to be no more than a minor (and short-term) increment when viewed in light of other human activities within the proposed project area. Unlike some other ongoing and routine activities in the area (e.g., commercial fishing), the USGS activities are not expected to result in injuries or deaths of sea turtles or marine mammals. Although the airgun sounds from the seismic surveys will have higher source levels than do the sounds from most other human activities in the area, airgun operations during the surveys would last only 1-3 days at each location, in contrast to those from many other sources that have lower peak pressures but occur continuously over extended periods. Thus, the combination of the USGS operations with the existing shipping and fishing activities would be expected to produce only a negligible increase in overall disturbance effects on marine mammals and turtles.
9. Unavoidable Impacts
This section is taken verbatim from the Draft Scripps EA (LGL, 2017). Unavoidable impacts to the species of marine mammals and turtles occurring in the proposed project area would be limited to short-term, localized changes in behavior of individuals. For cetaceans, some of the changes in behavior may be sufficient to fall within the MMPA definition of “Level B Harassment” (behavioral disturbance; no serious injury or mortality). TTS, if it occurs, would be limited to a few individuals, is a temporary phenomenon that does not involve injury, and is unlikely to have long term consequences for the few individuals involved. No long-term or significant impacts would be expected on any of these individual marine mammals or turtles, or on the populations to which they belong. Effects on recruitment or survival would be expected to be (at most) negligible.
10. Coordination with Other Agencies and Processes
This Draft EA incorporates by reference large components of the Scripps EA (2017), recently prepared by LGL on behalf of SIO, NSF, OSU, and Rutgers. Potential impacts to endangered species and critical habitat have also been assessed in the document; it will be used to support the ESA Section 7 consultation process with NMFS and USFWS. This document will also be used as supporting documentation for an IHA application submitted to NMFS, under the U.S. MMPA, for “taking by harassment” (disturbance) of small numbers of marine mammals, for this proposed seismic project. The USGS will comply with any additional applicable federal regulations and will continue to coordinate with federal regulatory agencies and their requirements.
Alternative Action: Another Time
Adopting the language of the Draft Scripps EA (LGL, 2017) for usage here: An alternative to issuing the IHA for the period requested, and to conducting the Project then, is to issue the IHA for another time, and to conduct the project at that alternative time. The proposed dates for the cruise (August 2018) are the dates when the personnel and equipment essential to meet the overall project objectives are available.
IV. Environmental Consequences
Draft Environmental Assessment for USGS Northwest Atlantic, 2018 Page 75
Marine mammals and sea turtles are expected to be found throughout the proposed project area and throughout the time period during which the project would occur. Except for some baleen whales, most marine mammal species probably occur in the project area year-round, so altering the timing of the proposed project likely would result in no net benefits for most species (see § III, above).
No Action Alternative
This section is taken verbatim from the Draft Scripps EA (LGL, 2017): “An alternative to conducting the proposed activities is the “No Action” alternative, i.e., do not issue an IHA and do not conduct the operations. If the research were not conducted, the “No Action” alternative would result in no disturbance to marine mammals or sea turtles attributable to the proposed activities; however, valuable data about the marine environment would be lost.” Data collection to provide information about the distribution of marine gas hydrates and shallow methane offshore the US and within its EEZ would not be acquired. The No Action Alternative would not meet the purpose and need for the proposed activities.
DISCLAIMER: Any use of trade, firm, or product names is for descriptive purposes only and does not imply endorsement by the U.S. Government.

Draft Environmental Assessment for USGS Northwest Atlantic, 2018 Page 76
V. LIST OF PREPARERS
Carolyn Ruppel, Ph.D.: Project Chief, USGS Gas Hydrates Project, and Research Geophysicist, Woods Hole Coastal and Marine Science Center, Woods Hole, MA. Patrick Hart, Seismologist, U.S. Geological Survey, Pacific Coastal and Marine Science Center, Santa Cruz, CA Brian Andrews, Geographer, U.S. Geological Survey, Woods Hole, MA. Anne Bécel, Ph.D., Lamont Assistant Research Professor, Lamont-Doherty Earth Observatory, Columbia University, Palisades, NY. Nathan Miller, Ph.D., Research Geophysicist, U.S. Geological Survey, Woods Hole, MA.

Literature Cited
Draft Environmental Assessment for USGS Northwest Atlantic, 2018 Page 77
VI. LITERATURE CITED
Many of the biological references are taken directly from the Draft Scripps EA (LGL, 2017), as incorporated in this Draft EA by reference. Updates have been made where necessary to reflect additional or alternate information used by or accessed by the U.S. Geological Survey. All access dates for online information refer to LGL’s activities in preparation of the Draft Scripps EA (LGL, 2017) when these dates are in 2017.
Aarts, G., A.M. von Benda-Beckmann, K. Lucke, H.Ö Sertlek, R. Van Bemmelen, S.C. Geelhoed, S. Brasseur, M. Scheidat, F.P.A. Lam, H. Slabbekoorn, and R. Kirkwood. 2016. Harbour porpoise movement strategy affects cumulative number of animals acoustically exposed to underwater explosions. Mar. Ecol. Prog. Ser. 557:261–275.
Aguilar, A. 1986. A review of old Basque whaling and its effect on the right whales of the North Atlantic. Rep. Int. Whal. Comm. Spec. Iss. 10:191–199.
Aguilar de Soto, N. 2016. Peer-reviewed studies on the effects of anthropogenic noise on marine invertebrates: from scallop larvae to giant squid. p. 17–26 In: The effects of noise on aquatic life II, Springer, New York, NY. 1292 p.
Aguilar-Soto, N., M. Johnson, P.T. Madsen, P.L. Tyack, A. Bocconcelli, and J.F. Borsani. 2006. Does intense ship noise disrupt foraging in deep-diving Cuvier’s beaked whales (Ziphius cavirostris)? Mar. Mamm. Sci. 22(3):690–699.
Aguilar de Soto, N., N. Delorme, J. Atkins, S. Howard, J. Williams, and M. Johnson. 2013. Anthropogenic noise causes body malformations and delays development in marine larvae. Sci. Rep. 3:2831. http://dx.doi.org/doi:10.1038/srep02831.
Anderwald, P., A. Brandecker, M. Coleman, C. Collins, H. Denniston, M.D. Haberlin, M. O'Donovan, R. Pinfield, F. Visser, and L. Walsh. 2013. Displacement responses of a mysticete, an odontocete, and a phocid seal to construction-related vessel traffic. Endang. Species Res. 21(3):231–240.
Andrews, B.D., Chaytor, J.D., ten Brink, U.S., Brothers, D.S., Gardner, J.V., Lobecker, E.A., and Calder, B.R., 2016, Bathymetric terrain model of the Atlantic margin for marine geological investigations (ver. 2.0, May 2016): U.S. Geological Survey Open-File Report 2012–1266, 19 p., 1 pl., http://dx.doi.org/10.3133/ofr20121266.
Andrews, C.D., J.F. Payne, and M.L. Rise. 2014. Identification of a gene set to evaluate the potential effects of loud sounds from seismic surveys on the ears of fishes: A study with Salmo salar. J. Fish Biol. 84(6):1793–1819.
Archer, F.I. 2009. Striped dolphin: Stenella coeruleoalba. p. 1127–1129 In: W.F. Perrin, B. Würsig, and J.G.M. Thewissen (eds.), Encyclopedia of marine mammals, 2nd edit. Academic Press, San Diego, CA. 1316 p.
Atkinson, S., D. Crocker, D. Houser, and K. Mashburn. 2015. Stress physiology in marine mammals: How well do they fit the terrestrial model? J. Comp. Physiol. B 185(5):463–486. http://dx.doi.org/doi:10.1007/s00360- 015-0901-0.
Azzara, A.J., W.M. von Zharen, and J.J. Newcomb. 2013. Mixed-methods analytic approach for determining potential impacts of vessel noise on sperm whale click behavior. J. Acoust. Soc. Am. 134(6):4566–4574.
Bain, D.E. and R. Williams. 2006. Long-range effects of airgun noise on marine mammals: responses as a function of received sound level and distance. Working Pap. SC/58/E35. Int. Whal. Comm., Cambridge, U.K. 13 p.
Baird, R.W. 2009. Risso’s dolphin. p. 975–976 In: W.F. Perrin, B. Würsig, and J.G.M. Thewissen (eds.), Encyclopedia of marine mammals, 2nd edit. Academic Press, San Diego, CA. 1316 p.
Baker, C.S. and L.M. Herman. 1989. Behavioral responses of summering humpback whales to vessel traffic: experimental and opportunistic observations. NPS-NR-TRS-89-01. Rep. from Kewalo Basin Mar. Mamm. Lab., Univ. Hawaii, Honolulu, HI, for U.S. Natl. Park Serv., Anchorage, AK. 50 p. NTIS PB90-198409.
Baker, C.S., L.M. Herman, B.G. Bays, and W.F. Stifel. 1982. The impact of vessel traffic on the behavior of humpback whales in southeast Alaska. Rep. from Kewalo Basin Mar. Mamm. Lab., Honolulu, HI, for U.S. Natl. Mar. Fish. Serv., Seattle, WA. 78 p.
Baker, C.S., L.M. Herman, B.G. Bays, and G.B. Bauer. 1983. The impact of vessel traffic on the behavior of humpback

Literature Cited
Draft Environmental Assessment for USGS Northwest Atlantic, 2018 Page 78
whales in southeast Alaska: 1982 season. Rep. from Kewalo Basin Mar. Mamm. Lab., Honolulu, HI, for U.S. Nat. Mar. Mamm. Lab., Seattle, WA. 30 p. + fig., tables.
Barlow, J. and R. Gisiner. 2006. Mitigating, monitoring and assessing the effects of anthropogenic sound on beaked whales. J. Cetac. Res. Manage. 7(3):239–249.
Barry, S.B., A.C. Cucknell, and N. Clark. 2012. A direct comparison of bottlenose dolphin and common dolphin behaviour during seismic surveys when airguns are and are not being utilised. p. 273–276 In: A.N. Popper and A. Hawkins (eds.), The effects of noise on aquatic life. Springer, New York, NY. 695 p. Best, P.B. 1979. Social organization in sperm whales, Physeter macrocephalus. p. 227–289 In: H.E. Winn and B.L. Olla (eds.), Behavior of marine animals, Vol. 3. Plenum, New York, NY.
BirdLife International. 2017a. Species factsheet: Pterodroma cahow. Accessed by LGL for the Draft Scripps EA in October 2017 at http://www.birdlife.org.
Bittencourt, L., I.M.S. Lima, L.G. Andrade, R.R. Carvalho, T.L. Bisi, J. Lailson-Brito, Jr., and A.F. Azevedo. 2016. Underwater noise in an impacted environment can affect Guiana dolphin communication. Mar. Poll. Bull. http://dx.doi.org/doi: 10.1016/j.marpolbul.2016.10.037.
Bjorndal, K.A., A.B. Bolten, and H.R. Martins. 2000. Somatic growth model of juvenile loggerhead sea turtles Caretta caretta: duration of pelagic state. Mar. Ecol. Prog. Ser. 202:265–272.
Bjorndal, K.A., A.B. Boltlen, T. Dellinger, C. Delgado, and H.R. Martins. 2003. Compensatory growth in oceanic loggerhead sea turtles: response to a stochastic environment. Ecology 84(5):1237–1249.
Blackwell, S.B., C.S. Nations, T.L. McDonald, C.R. Greene, Jr., A.M. Thode, M. Guerra, and A.M. Macrander. 2013. Effects of airgun sounds on bowhead whale calling rates in the Alaskan Beaufort Sea. Mar. Mamm. Sci. http://dx.doi.org/doi:10.1111/mms.12001.
Blackwell, S.B., C.S. Nations, T.L. McDonald, A.M. Thode, D. Mathias, K.H. Kim, C.R. Greene, Jr., and A.M. Macrander. 2015. Effects of airgun sounds on bowhead whale calling rates: Evidence for two behavioral thresholds. PLoS ONE 10(6):e0125720. http://dx.doi.org/doi:10.1371/journal.pone.0125720.
Blair, H.B., N.D. Merchant, A.S. Friedlaender, D.N. Wiley, and S.E. Parks. 2016. Evidence for ship noise impacts on humpback whale foraging behaviour. Biol. Lett. 12:20160005. http://dx.doi.org/ doi:10.1098/rsbl.2016.0005.
Blanton, J.O., F.B. Schwing, A.H. Weber, L.J. Pietrafesa, and D.W. Hayes. 2013. Wind Stress Climatology in the South Atlantic Bight, in Oceanography of the Southeastern U.S. Continental Shelf (eds. Atkinson, L.P., D.W. Menzel, and K.A. Bush), American Geophysical Union, Washington, D. C.. doi: 10.1029/CO002p0010 BOEM (Bureau of Ocean Energy Management), 2012a. Assessment of In-Place Gas Hydrate Resources of the Lower 48 United States Outer Continental Shelf, BOEM Fact Sheet RED-2012-01, accessible at: https://www.boem.gov/uploadedFiles/BOEM/Oil_and_Gas_Energy_Program/Resource_Evaluation/Gas_Hydrates/BOEM-FactSheetRED_2012-01.pdf BOEM (Bureau of Ocean Energy Management Gulf of Mexico OCS Region). 2012b. OCS EIS/EA BOEM 2012-005 - Atlantic OCS Proposed Geological and Geophysical Activities Mid-Atlantic and South Atlantic Planning Areas Final Programmatic Environmental Impact Statement Volume I: Chapters 1-8; Volume II: Figures, Tables, Appendices, and Keyword Index. US Department of Interior Bureau of Ocean Energy Management Gulf of Mexico OCS Region. New Orleans.
Branstetter, B.K., J.S. Trickey, and H. Aihara. J.J. Finneran, and T.R. Liberman. 2013. Time and frequency metrics related to auditory masking of a 10 kHz tone in bottlenose dolphins (Tursiops truncatus). J. Acoust. Soc. Am. 134(6):4556–4565.
Branstetter, B.K., K.L. Bakhtiari, J.S. Trickey, and J.J. Finneran. 2016. Hearing mechanisms and noise metrics related to auditory masking in bottlenose dolphins (Tursiops truncatus). p. 109–116 In: A.N. Popper and A. Hawkins (eds.), The Effects of Noise on Aquatic Life II. Springer, New York, NY. 1292 p.

Literature Cited
Draft Environmental Assessment for USGS Northwest Atlantic, 2018 Page 79
Brazner, J.C. and J. McMillan. 2008. Loggerhead turtle (Caretta caretta) bycatch in Canadian pelagic longline fisheries: Relative important in the western North Atlantic and opportunities for mitigation. Fish. Res. 91:310–324.
Breitzke, M. and T. Bohlen. 2010. Modelling sound propagation in the Southern Ocean to estimate the acoustic impact of seismic research surveys on marine mammals. Geophys. J. Int. 181(2):818–846.
Bui, S., F. Oppedal, Ø.J. Korsøen, D. Sonny, and T. Dempster. 2013. Group behavioural responses of Atlantic salmon (Salmo salar L.) to light, infrasound and sound stimuli. PLoS ONE 8(5):e63696. http://dx.doi.org/doi:10.1371/journal.pone.0063696.
Calambokidis, J., G.H. Steiger, J.M. Straley, L.M. Herman, S. Cerchio, D.R. Salden, J. Urbán R., J.K. Jacobsen, O. von Ziegesar, K.C. Balcomb, C.M. Gabrielle, M.E. Dahlheim, S. Uchida, G. Ellis, Y. Miyamura, P.L. de Guevara, M. Yamaguchi, F. Sato, S.A. Mizroch, L. Schlender, K. Rasmussen, J. Barlow, and T.J. Quinn II. 2001. Movements and population structure of humpback whales in the North Pacific. Mar. Mamm. Sci. 17(4):769–794.
Campana, I., R. Crosti, D. Angeletti, L. Carosso, L. Davis, N. Di-Méglio, A. Moulins, M. Rosso, P. Tepsich, and A. Arcangeli. 2015. Cetacean response to summer maritime traffic in the western Mediterranean Sea. Mar. Environ. Res. 109:1–8.
Carr, A., M.H. Carr, and A.B. Meylan. 1978. The ecology and migrations of sea turtles. The west Caribbean green turtle colony. Bull. Am. Mus. Nat. Hist. 162(1):1–46.
Carroll, A.G., R. Przeslawski, A. Duncan, M. Gunning, and B. Bruce. 2016. A review of the potential impacts of marine seismic surveys on fish & invertebrates. Mar. Poll. Bull. 114(1):9–24.
Castellote, M. and C. Llorens. 2016. Review of the effects of offshore seismic surveys in cetaceans: Are mass strandings a possibility? p. 133–143 In: A.N. Popper and A. Hawkins (eds.), The effects of noise on aquatic life II. Springer, New York, NY. 1292 p.
Castellote, M., C.W. Clark, and M.O. Lammers. 2012. Acoustic and behavioural changes by fin whales (Balaenoptera physalus) in response to shipping and airgun noise. Biol. Conserv. 147(1):115–122.
Cato, D.H., M.J. Noad, R.A. Dunlop, R.D. McCauley, C.P. Salgado Kent, N.J. Gales, H. Kniest, J. Noad, and D. Paton. 2011. Behavioral response of Australian humpback whales to seismic surveys. J. Acoust. Soc. Am. 129(4):2396.
Cato, D.H., M.J. Noad, R.A. Dunlop, R.D. McCauley, N.J. Gales, C.P. Salgado Kent, H. Kniest, D. Paton, K.C.S. Jenner, J. Noad, A.L. Maggi, I.M. Parnum, and A.J. Duncan. 2012. Project BRAHSS: Behavioural response of Australian humpback whales to seismic surveys. Proc. Austral. Acoust. Soc., 21–23 Nov. 2012, Fremantle, Australia. 7 p. Cato, D.H., M. Noad, R. Dunlop, R.D. McCauley, H. Kniest, D. Paton, C.P. Salgado Kent, and C.S. Jenner. 2013. Behavioral responses of humpback whales to seismic air guns. Proc. Meet. Acoust. 19(010052).
Cato, D.H., R.A. Dunlop, M.J. Noad, R.D. McCauley, E. Kniest, D. Paton, and A.S. Kavanagh. 2016. Addressing challenges in studies of behavioral responses of whales to noise. p. 145–152 In: A.N. Popper and A. Hawkins (eds.), The Effects of Noise on Aquatic Life II. Springer, New York, NY. 1292 p.
Cattanach, K.L., J. Sigurjónsson, S.T. Buckland, and T. Gunnlaugsson. 1993. Sei whale abundance in the North Atlantic, estimated from NASS-87 and NASS-89 data. Rep. Int. Whal. Comm. 43:315–321.
Celi, M., F. Filiciotto, D. Parrinello, G. Buscaino, M.A. Damiano, A. Cuttitta, S. D’Angelo, S. Mazzola, and M. Vazzana. 2013. Physiological and agonistic behavioural response of Procambarus clarkii to an acoustic stimulus. J. Exp. Biol. 216(4):709–718.
Cerchio, S., S. Strindberg, T. Collins, C. Bennett, and H. Rosenbaum. 2014. Seismic surveys negatively affect humpback whale singing activity off northern Angola. PLoS ONE 9(3):e86464. http://dx.doi.org/doi:10.1371/journal.pone.0086464.
Cholewiak, D., A. Izzi, D. Palka, P. Corkeron, and S. Van Parijs. 2017. Beaked whales demonstrate a marked acoustic response to the use of shipboard echosounders. Royal Soc. Open Science. DOI: 10.1098/rsos.170940.
Christensen, I., T. Haug, and N. Øien. 1992. Seasonal distribution, exploitation and present abundance of stocks of
Literature Cited
Draft Environmental Assessment for USGS Northwest Atlantic, 2018 Page 80
large baleen whales (Mysticeti) and sperm whales (Physeter macrocephalus) in Norwegian and adjacent waters. ICES J. Mar. Sci. 49:341–355.
Christensen-Dalsgaard, J., C. Brandt, K.L. Willis, C. Bech Christensen, D. Ketten, P. Edds-Walton, R.R. Fay, P.T. Madsen, and C.E. Carr. 2012. Specialization for underwater hearing by the tympanic middle ear of the turtle, Trachemys scripta elegans. Proc. R. Soc. B 279(1739):2816–2824.
Clapham, P.J. 2009. Humpback whale. p. 582–595 In: W.F. Perrin, B. Würsig, and J.G.M. Thewissen (eds.), Encyclopedia of marine mammals, 2nd edit. Academic Press, San Diego, CA. 1316 p.
Clapham, P.J. and D.K. Mattila. 1990. Humpback whale songs as indicators of migration routes. Mar. Mamm. Sci. 6(2):155–160.
Clapham P.J. and J.G. Mead. 1999. Megaptera novaeangliae. Mamm. Spec. 604:1–9.
Clark, C.W. and G.C. Gagnon. 2006. Considering the temporal and spatial scales of noise exposures from seismic surveys on baleen whales. Working Pap. SC/58/E9. Int. Whal. Comm., Cambridge, U.K. 9 p.
Clark, C.W., W.T. Ellison, B.L. Southall, L. Hatch, S.M. Van Parijs, A. Frankel, and D. Ponirakis. 2009. Acoustic masking in marine ecosystems: Intuitions, analysis, and implication. Mar. Ecol. Prog. Ser. 395:201–222.
Cole, T., A. Glass, P.K. Hamilton, P. Duley, M. Niemeyer, C. Christman, R.M. Pace III, and T. Fraiser. 2009. Potential mating ground for North Atlantic right whales off the Northeast USA. Abstr. 18th Bienn. Conf. Biol. Mar. Mamm., Québec City, 12–16 Oct. 2009. 58 p. COSEWIC. 2010. COSEWIC assessment and status report on the loggerhead sea turtle Caretta caretta in Canada. Committee on the Status of Endangered Wildlife in Canada. Ottawa. viii + 75 p.
COSEWIC. 2012. COSEWIC assessment and status report on the leatherback sea turtle Dermochelys coriacea in Canada. Committee on the Status of Endangered Wildlife in Canada, Ottawa, ON. xv + 58 p.
Costa, D.P., L. Schwarz, P. Robinson, R. Schick, P.A. Morris, R. Condit, D.E. Crocker, and A.M. Kilpatrick. 2016a. A bioenergetics approach to understanding the population consequences of disturbance: elephant seals as a model system. p. 161–169 In: A.N. Popper and A. Hawkins (eds.), The Effects of Noise on Aquatic Life II. Springer, New York, NY. 1292 p.
Costa, D.P., L.A. Huckstadt, L,K. Schwarz, A.S. Friedlaender, B.R. Mate, A.N. Zerbini, A. Kennedy, and N.J. Gales. 2016b. Assessing the exposure of animals to acoustic disturbance: towards an understanding of the population consequences of disturbance. Proceedings of Meetings on Acoustics 4ENAL 27(1):010027. http://dx.doi.org/doi:10.1121/2.0000298.
Crone TJ, Tolstoy M, Carton H. Estimating shallow water sound power levels and mitigation radii for the R/V Marcus G. Langseth using an 8 km long MCS streamer. Geochem Geophys Geosyst. 2014;15:3793–3807.
Crone TJ, Tolstoy M, Gibson JC, Mountain G (2017) Utilizing the R/V Marcus G. Langseth’s streamer to measure the acoustic radiation of its seismic source in the shallow waters of New Jersey’s continental shelf. PLoS ONE 12(8): e0183096. https://doi.org/10.1371/journal.pone.0183096
Crowell, S.C. 2016. Measuring in-air and underwater hearing in seabirds. p. 1155–1160 In: A.N. Popper and A. Hawkins (eds.), The Effects of Noise on Aquatic Life II. Springer, New York, NY. 1292 p.
Culloch, R.M., P. Anderwald, A. Brandecker, D. Haberlin, B. McGovern, R. Pinfield, F. Visser, M. Jessopp, and M. Cronin. 2016. Effect of construction-related activities and vessel traffic on marine mammals. Mar. Ecol. Prog. Ser. 549:231–242.
Curtice, C., Cleary J., Shumchenia E., Halpin P.N. 2016. Marine-life Data and Analysis Team (MDAT) technical report on the methods and development of marine-life data to support regional ocean planning and management. Prepared on behalf of the Marine-life Data and Analysis Team (MDAT). Accessed at: http://seamap.env.duke.edu/models/MDAT/MDAT-Technical-Report-v1_1.pdf
Dahlheim, M. and M. Castellote. 2016. Changes in the acoustic behavior of gray whales Eschrichtius robustus in response to noise. Endang. Species Res. 31:227–242.

Literature Cited
Draft Environmental Assessment for USGS Northwest Atlantic, 2018 Page 81
Dahlheim, M.E. and J.E. Heyning. 1999. Killer whale Orcinus orca (Linnaeus, 1758). p. 281–322 In: S.H. Ridgway and R. Harrison (eds.), Handbook of marine mammals, Vol. 6: The second book of dolphins and the porpoises. Academic Press, San Diego, CA. 486 p.
Davis, R.W., G.S. Fargion, N. May, T.D. Leming, M. Baumgartner, W.E. Evans, L.J. Hansen, and K. Mullin. 1998. Physical habitat of cetaceans along the continental slope in the north-central and western Gulf of Mexico. Mar. Mamm. Sci. 14(3):490–507.
Day, R.D., R.D. McCauley, Q.P. Fitzgibbon, and J.M. Semmens. 2016a. Seismic air gun exposure during early-stage embryonic development does not negatively affect spiny lobster Jasus edwardsii larvae (Decapoda: Palinuridae). Sci. Rep. 6:22723.
Day, R.D., R.D. McCauley, Q.P. Fitzgibbon, K. Hartmann and J.M. Semmens. 2016b. Assessing the impact of marine seismic surveys on southeast Australian scallop and lobster fisheries. Fisheries Research & Development Corporation (FRDC). FRDC Project No 2012/008. 144 p.
Day, R.D., R.D. McCauley, Q.P. Fitzgibbon, K. Hartmann and J.M. Semmens. 2017. Exposure to seismic air gun signals causes physiological harm and alters behavior in the scallop Pecten fumatus. P. NATL. ACAD. SCI. USA. 114(40) 8537–8546. Delarue, J., R. Dziak, D. Mellinger, J. Lawson, H. Moors-Murphy, Y. Simard, and K. Stafford. 2014. Western and central North Atlantic fin whale (Balaenoptera physalus) stock structure assessed using geographic song variations. J. Acoust. Soc. Am. 135(4):2240.
del Hoyo, J., A. Elliot, and J. Sargatal (eds.). 1996. Handbook of the birds of the world, Vol. 3: Hoatzin to auks. Lynx Edicions, Barcelona, Spain. 821 p.
DeRuiter, S.L. and K.L. Doukara. 2012. Loggerhead turtles dive in response to airgun sound exposure. Endang. Species Res. 16(1):55–63.
DFO (Fisheries and Oceans Canada). 2004. Potential impacts of seismic energy on snow crab. DFO Can. Sci. Advis. Sec. Habitat Status Rep. 2004/003.
Diebold, J.B., M. Tolstoy, L. Doermann, S.L. Nooner, S.C. Webb, and T.J. Crone. 2010. R/V Marcus G. Langseth seismic source: Modeling and calibration. Geochem. Geophys. Geosyst. 11(12):Q12012. http://dx.doi.org/ doi:10.1029/GC003126. 20 p.
Di Iorio, L. and C.W. Clark. 2010. Exposure to seismic survey alters blue whale acoustic communication. Biol. Lett. 6(1):51–54.
DiMatteo, A., D. Jones, and B. Bartlett, 2017, U.S. Navy Marine Species Density Database Phase III for Atlantic Fleet Training and Testing Area, Final Technical Report, 281 pp.
Doksæter, L., E. Olsen, L. Nøttestad, and A. Fernö. 2008. Distribution and feeding ecology of dolphins along the Mid-Atlantic Ridge between Iceland and the Azores. Deep-Sea Res. II 55:243–253.
Doniol-Valcroze, T., J.-F. Gosselin, D. Pike, J. Lawson, N. Asselin, K. Hedges, and S. Ferguson. 2015. Abundance estimate of the Eastern Canada – West Greenland bowhead whale population based on the 2013 High Arctic Cetacean Survey. DFO Can. Sci. Advis. Sec. Res. Doc. 2015/058. v + 27 p.
Donovan, G.P. 1991. A review of IWC stock boundaries. Rep. Int. Whal. Comm. Spec. Iss. 13:39–63.
DoW (Defenders of Wildlife). 2015a. A petition to list the giant manta ray (Manta birostris), reef manta ray (Manta afredi), and Caribbean manta ray (Manta c.f. birostris) as endangered, or alternatively as threatened, species pursuant to the Endangered Species Act and for the concurrent designation of critical habitat. Defenders of Wildlife, Denver, CO. Submitted to the U.S. Secretary of Commerce acting through the National Oceanic and Atmospheric Administration and the National Marine Fisheries Service. 143 p. Accessed by LGL as preparation for the Draft Scripps EA in November 2017 at http://www.nmfs.noaa.gov/pr/species/fish/manta-ray.html.
DoW. 2015b. A petition to list the oceanic whitetip shark (Carcharhinus longimanus) as an endangered, or alternatively as a threatened, species pursuant to the Endangered Species Act and for the concurrent designation of critical habitat. Defenders of Wildlife, Denver, CO. Submitted to the U.S. Secretary of Commerce and
Literature Cited
Draft Environmental Assessment for USGS Northwest Atlantic, 2018 Page 82
acting through the National Oceanic and Atmospheric Administration and the National Marine Fisheries Service. 111 p. Accessed by LGL as preparation for the Draft Scripps EA in November 2017 at http://www.nmfs.noaa.gov/pr/species/fish/oceanic-whitetip-shark.html.
Duffield, D.A., S.H. Ridgway, and L.H. Cornell. 1983. Hematology distinguishes coastal and offshore forms of dolphins (Tursiops). Can. J. Zool. 61(4):930–933.
Dunlop, R.A. 2015. The effect of vessel noise on humpback whale, Megaptera novaeangliae, communication behaviour. Animal Behav. 111:13–21.
Dunlop, R.A., M.J. Noad, R.D. McCauley, E. Kniest, D. Paton, and D.H. Cato. 2015. The behavioural response of humpback whales (Megaptera novaeangliae) to a 20 cubic inch air gun. Aquatic Mamm. 41(4):412–433.
Dunlop, R.A., M.J. Noad, R.D. McCauley, E. Kniest, R. Slade, D. Paton, and D.H. Cato. 2016a. Response of humpback whales (Megaptera novaeangliae) to ramp-up of a small experimental air gun array. Mar. Poll. Bull. 103:72–83.
Dunlop, R., M.J. Noad, R. McCauley, and D. Cato. 2016c. The behavioral response of humpback whales to seismic air gun noise. J. Acoust. Soc. Am. 140(4):3412.
Dunlop, R.A., M.J. Noad, R.D. McCauley, L. Scott-Hayward, E. Kniest, R. Slade, D. Paton, and D.H. Cato. 2017. Determining the behavioural dose–response relationship of marine mammals to air gun noise and source proximity. J. Exp. Biol. 220:2878–2886.
Dyndo, M., D.M. Wisniewska, L. Rojano-Doñate, and P.T. Madsen. 2015. Harbour porpoises react to low levels of high frequency vessel noise. Sci. Rep. 5:11083. http://dx.doi.org/doi:10.1038/srep11083.
Eckert, K.L. 1995. Leatherback sea turtle, Dermochelys coriacea. p. 37–75 In: P.T. Plotkin (ed.), National Marine Fisheries Service and U.S. Fish and Wildlife Service status reviews of sea turtles listed under the Endangered Species Act of 1973. Nat. Mar. Fish. Service, Silver Spring, MD. 139 p.
Eckert, S.A. 2002. Distribution of juvenile leatherback sea turtle Dermochelys coriacea sightings. Mar. Ecol. Prog. Ser. 230:289–293.
Edmonds, N.J., C.J. Firmin, D. Goldsmith, R.C. Faulkner, and D.T. Wood. 2016. A review of crustacean sensitivity to high amplitude underwater noise: Data needs for effective risk assessment in relation to UK commercial species. Mar. Poll. Bull. 108:5–11.
Ellison, W.T., B.L. Southall, C.W. Clark, and A.S. Frankel. 2012. A new context-based approach to assess marine mammal behavioral responses to anthropogenic sounds. Conserv. Biol. 26(1):21–28.
Ellison, W.T., R. Racca, C.W. Clark, B. Streever, A.S. Frankel, E. Fleishman, R. Angliss, J. Berger, D. Ketten, M. Guerra, M. Leu, M. McKenna, T. Sformo, B. Southall, R. Suydam, and L. Thomas. 2016. Modeling the aggregated exposure and responses of bowhead whales Balaena mysticetus to multiple sources of anthropogenic underwater sound. Endang. Species Res. 30:95–108.
Engel, M.H., M.C.C. Marcondes, C.C.A. Martins, F.O. Luna, R.P. Lima, and A. Campos. 2004. Are seismic surveys responsible for cetacean strandings? An unusual mortality of adult humpback whales in Abrolhos Bank, northeastern coast of Brazil. Working Paper SC/56/E28. Int. Whal. Comm., Cambridge, U.K. 8 p.
Erbe, C. 2012. The effects of underwater noise on marine mammals. p. 17–22 In: A.N. Popper and A. Hawkins (eds.), The effects of noise on aquatic life. Springer, New York, NY. 695 p.
Erbe, C., C. Reichmuth, K. Cunningham, K. Lucke, and R. Dooling. 2016. Communication masking in marine mammals: a review and research strategy. Mar. Poll. Bull. 103(1–2):15–38. Evans, P.G.H. 1987. The natural history of whales and dolphins. Christopher Helm, Bromley, Kent. 343 p.
Evans, P.G.H. 1992. Status review of cetaceans in British and Irish waters. U.K. Mammal Society Cetacean Group Report, University of Oxford. 100 p.
Evans, W.E. 1994. Common dolphin, white-bellied porpoise Delphinus delphis Linnaeus, 1758. p. 191–224 In: S.H. Ridgway and R. Harrison (eds.), Handbook of marine mammals, Vol. 5: The first book of dolphins. Academic Press, San Diego, CA. 416 p.

Literature Cited
Draft Environmental Assessment for USGS Northwest Atlantic, 2018 Page 83
Expedition 313 Scientists, 2010. Expedition 313 summary. In Mountain, G., Proust, J.-N., McInroy, D., Cotterill, C., and the Expedition 313 Scientists, Proc. IODP, 313: Tokyo (Integrated Ocean Drilling Program Management International, Inc.). doi:10.2204/iodp.proc.313.101.2010
Farmer, N., K. Baker, D. Zeddies, M. Zykov, D. Noren, L. Garrison, E. Fougeres, and A. Machernis. 2017. Population consequences of disturbance for endangered sperm whales (Physeter macrocephalus) exposed to seismic surveys in the Gulf of Mexico, USA. Abstract and presentation at the Society for Marine Mammalogy’s 22nd Biennial Conference on the Biology of Marine Mammals, 22–27 October, Halifax, Nova Scotia, Canada.
Fay, R.R. and A.N. Popper. 2012. Fish hearing: new perspectives from two senior bioacousticians. Brain Behav. Evol. 79(4):215–217.
Fewtrell, J.L. and R.D. McCauley. 2012. Impact of air gun noise on the behaviour of marine fish and squid. Mar. Poll. Bull. 64(5):984–993.
Finneran, J.J. 2012. Auditory effects of underwater noise in odontocetes. p. 197–202 In: A.N. Popper and A. Hawkins (eds.), The effects of noise on aquatic life. Springer, New York, NY. 695 p.
Finneran, J.J. 2015. Noise-induced hearing loss in marine mammals: A review of temporary threshold shift studies from 1996 to 2015. J. Acoust. Soc. Am. 138(3):1702–1726.
Finneran, J.J. 2016. Auditory weighting functions and TTS/PTS exposure functions for marine mammals exposed to underwater noise. Technical Report 3026. SSC Pacific, San Diego, CA.
Finneran, J.J. and B.K. Branstetter. 2013. Effects of noise on sound perception in marine mammals. p. 273–308 In: H. Brumm (ed.), Animal communication and noise. Springer Berlin, Heidelberg, Germany. 453 p.
Finneran, J.J. and C.E. Schlundt. 2010. Frequency-dependent and longitudinal changes in noise-induced hearing loss in a bottlenose dolphin (Tursiops truncatus) (L). J. Acoust. Soc. Am. 128(2):567–570.
Finneran, J.J. and C.E. Schlundt. 2011. Noise-induced temporary threshold shift in marine mammals. J. Acoust. Soc. Am. 129(4):2432. [Supplemented by oral presentation at the ASA meeting, Seattle, WA, May 2011].
Finneran, J.J. and C.E. Schlundt. 2013. Effects of fatiguing tone frequency on temporary threshold shift in bottlenose dolphins (Tursiops truncatus). J. Acoust. Soc. Am. 133(3):1819–1826. Finneran, J.J., C.E. Schlundt, D.A. Carder, J.A. Clark, J.A. Young, J.B. Gaspin, and S.H. Ridgway. 2000. Auditory and behavioral responses of bottlenose dolphins (Tursiops truncatus) and beluga whales (Delphinapterus leucas) to impulsive sounds resembling distant signatures of underwater explosions. J. Acoust. Soc. Am. 108(1):417–431.
Finneran, J.J., C.E. Schlundt, R. Dear, D.A. Carder, and S.H. Ridgway. 2002. Temporary shift in masked hearing thresholds in odontocetes after exposure to single underwater impulses from a seismic watergun. J. Acoust. Soc. Am. 111(6):2929–2940.
Finneran, J.J., D.A. Carder, C.E. Schlundt, and S.H. Ridgway. 2005. Temporary threshold shift in bottlenose dolphins (Tursiops truncatus) exposed to mid-frequency tones. J. Acoust. Soc. Am. 118(4):2696–2705.
Finneran, J.J., D.A. Carder, C.E. Schlundt, and R.L. Dear. 2010a. Growth and recovery of temporary threshold shift (TTS) at 3 kHz in bottlenose dolphins (Tursiops truncatus). J. Acoust. Soc. Am. 127(5):3256–3266.
Finneran, J.J., D.A. Carder, C.E. Schlundt, and R.L. Dear. 2010b. Temporary threshold shift in a bottlenose dolphin (Tursiops truncatus) exposed to intermittent tones. J. Acoust. Soc. Am. 127(5):3267–3272.
Finneran, J.J., C.E. Schlundt, B.K. Branstetter, J.S. Trickey, V. Bowman, and K. Jenkins. 2015. Effects of multiple impulses from a seismic air gun on bottlenose dolphin hearing and behavior. J. Acoust. Soc. Am. 137(4):1634–1646.
Fitzgibbon, Q.P., R.D. Day, R.D. McCauley, C.J. Simon, and J.M. Semmens. 2017. The impact of seismic air gun exposure on the haemolymph physiology and nutritional condition of spiny lobster, Jasus edwardsii. Mar. Poll. Bull. http://dx.doi.org/10.1016/j.marpolbul. 2017.08.004.
Foote, A.D., G. Víkingsson, N. Øien, D. Bloch, C.G. Davis, T.E. Dunn, P.V. Harvey, L. Mandleberg, P. Whooley, and P.M. Thompson. 2007. Distribution and abundance of killer whales in the North East Atlantic. Document SC/59/SM5
Literature Cited
Draft Environmental Assessment for USGS Northwest Atlantic, 2018 Page 84
submitted to the Scientific Committee of the International Whaling Commission, Anchorage, AK.
Ford, J.K.B. 2009. Killer whale. p. 650–657 In: W.F. Perrin, B. Würsig, and J.G.M. Thewissen (eds.), Encyclopedia of marine mammals, 2nd edit. Academic Press, San Diego, CA. 1316 p.
Forney, K.A., B.L. Southall, E. Slooten, S. Dawson, A.J. Read, R.W. Baird, and R.L. Brownell, Jr. 2017. Nowhere to go: noise impact assessments for marine mammal populations with high site fidelity. Endang. Species Res. 32:391–413.
Frasier, T.R., S.D. Petersen, L. Postma, L. Johnson, M.P. Heide-Jørgensen, and S.H. Ferguson. 2015. Abundance estimates of the Eastern Canada-West Greenland bowhead whale (Balaena mysticetus) population based on genetic capture-mark-recapture analyses. DFO Can. Sci. Advis. Sec. Res. Doc. 2015/008. iv + 21 p.
Gailey, G., B. Würsig, and T.L. McDonald. 2007. Abundance, behavior, and movement patterns of western gray whales in relation to a 3-D seismic survey, northeast Sakhalin Island, Russia. Environ. Monit. Assess. 134(1-3):75–91.
Gailey, G., O. Sychenko, T. McDonald, R. Racca, A. Rutenko, and K. Bröker. 2016. Behavioural responses of western gray whales to a 4-D seismic survey off northeastern Sakhalin Island, Russia. Endang. Species Res. 30:53–71.
Gailey, G., O. Sychenko, A. Rutenko, and R. Racca. 2017. Western gray whale behavioral response to extensive seismic surveys conducted near their feeding grounds. Abstract and presentation at the Society for Marine Mammalogy’s 22nd
Biennial Conference on the Biology of Marine Mammals, 22–27 October, Halifax, Nova Scotia, Canada.
Gambell, R. 1985a. Sei whale Balaenoptera borealis Lesson, 1828. p. 155–170 In: S.H. Ridgway and R. Harrison (eds.), Handbook of marine mammals, Vol. 3: The sirenians and baleen whales. Academic Press, London, U.K. 362 p.
Gambell, R. 1985b. Fin whale Balaenoptera physalus (Linnaeus, 1758). p. 171–192 In: S.H. Ridgway and R. Harrison (eds.), Handbook of marine mammals, Vol. 3: The sirenians and baleen whales. Academic Press, London, U.K. 362 p.
Gannier, A. 2000. Distribution of cetaceans off the Society Islands (French Polynesia) as obtained from dedicated surveys. Aquat. Mamm. 26(2):111–126.
Gaskin, D.E. 1982. The ecology of whales and dolphins. Heineman Educational Books Ltd., London, U.K. 459 p.
Gaskin, D.E. 1987. Updated status of the right whale, Eubalaena glacialis, in Canada. Can Field-Nat 101:295–309.
Gedamke, J. 2011. Ocean basin scale loss of whale communication space: Potential impacts of a distant seismic survey. p. 105–106 In: Abstr. 19th Bienn. Conf. Biol. Mar. Mamm., 27 Nov.–2 Dec. 2011, Tampa, FL. 344 p.
Gedamke, J., N. Gales, and S. Frydman. 2011. Assessing risk of baleen whale hearing loss from seismic surveys: The effects of uncertainty and individual variation. J. Acoust. Soc. Am. 129(1):496–506.
Gervaise, C., N. Roy, Y. Simard, B. Kinda, and N. Menard. 2012. Shipping noise in whale habitat: Characteristics, sources, budget, and impact on belugas in Saguenay-St. Lawrence Marine Park hub. J. Acoust. Soc. Am. 132(1):76–89.
Gomez, C., J.W. Lawson, A.J. Wright, A.D. Buren, D. Tollit, and V. Lesage. 2016. A systematic review on the behavioural responses of wild marine mammals to noise: the disparity between science and policy. Can. J. Zool. 94(12):801–819.
Gordon, J., D. Gillespie, J. Potter, A. Frantzis, M.P. Simmonds, R. Swift, and D. Thompson. 2004. A review of the effects of seismic surveys on marine mammals. Mar. Technol. Soc. J. 37(4):16–34.
Gospić, N.R. and M. Picciulin. 2016. Changes in whistle structure of resident bottlenose dolphins in relation to underwater noise and boat traffic. Mar. Poll. Bull. 105:193–198.
Gray, H. and K. Van Waerebeek. 2011. Postural instability and akinesia in a pantropical spotted dolphin, Stenella attenuata, in proximity to operating airguns of a geophysical seismic vessel. J. Nature Conserv. 19(6):363–367.
Greene, C.R., Jr. 1997. Physical acoustics measurements. p. 3-1 to 3-63 In: W.J. Richardson (ed.), Northstar marine mammal monitoring program, 1996: marine mammal and acoustical monitoring of a seismic program in the Alaskan
Literature Cited
Draft Environmental Assessment for USGS Northwest Atlantic, 2018 Page 85
Beaufort Sea. LGL Rep. 2121-2. Rep. from LGL Ltd., King City, Ont., and Greeneridge Sciences Inc., Santa Barbara, CA, for BP Explor. (Alaska) Inc., Anchorage, AK, and Nat. Mar. Fish. Serv., Anchorage, AK, and Silver Spring, MD. 245 p.
Gregr, E.J. and A.W. Trites. 2001. Predictions of critical habitat of five whale species in the waters of coastal British Columbia. Can. J. Fish. Aquat. Sci. 58(7):1265–1285.
Gridley, T., S.H. Elwen, G. Rashley, A.B. Krakauer, and J. Heiler. 2016. Bottlenose dolphins change their whistling characteristics in relation to vessel presence, surface behavior and group composition. Proceedings of Meetings on Acoustics 4ENAL 27(1):010030. http://dx.doi.org/doi:10.1121/2.0000312.
Guan, S., J.F. Vignola, J.A. Judge, D. Turo, and T.J. Ryan. 2015. Inter-pulse noise field during an arctic shallow-water seismic survey. J. Acoust. Soc. Am. 137(4):2212.
Guerra, M., A.M. Thode, S.B. Blackwell, and M. Macrander. 2011. Quantifying seismic survey reverberation off the Alaskan North Slope. J. Acoust. Soc. Am. 130(5):3046-3058.
Guerra, M., P.J. Dugan, D.W. Ponirakis, M. Popescu, Y. Shiu, and C.W. Clark. 2016. High-resolution analysis of seismic airgun impulses and their reverberant field as contributors to an acoustic environment. p. 371–379 In: A.N. Popper and A. Hawkins (eds.), The Effects of Noise on Aquatic Life II. Springer, New York, NY. 1292 p.
Hain, J.H.W., W.A.M. Hyman, R.D. Kenney, and H.E. Winn. 1985. The role of cetaceans in the shelf-edge region of the U.S. Mar. Fish. Rev. 47(1):13–17.
Halliday, W.D., S.J. Insley, R.C. Hilliard, T. de Jong, and M.K. Pine. 2017. Potential impacts of shipping noise on marine mammals in the western Canadian Arctic. Mar. Poll. Bull. 123:73–82.
Hammill, M.O., G.B. Stenson, A. Mosnier A., and T. Doniol-Valcroze. 2014. Abundance estimates of Northwest Atlantic harp seals and management advice for 2014. DFO Can. Sci. Advis. Sec. Res. Doc. 2014/022. v + 33 p.
Handegard, N.O., T.V. Tronstad, and J.M. Hovem. 2013. Evaluating the effect of seismic surveys on fish—The efficacy of different exposure metrics to explain disturbance. Can. J. Fish. Aquat. Sci. 70(9):1271–1277.
Hansen, L.J., K.D. Mullin, and C.L. Roden. 1994. Preliminary estimates of cetacean abundance in the northern Gulf of Mexico, and selected species in the U.S. Atlantic exclusive economic zone from vessel surveys. Miami Lab Contrib. No. MIA-93/94-58. Nat. Mar. Fish. Serv., Southeast Fish. Sci. Center, Miami, FL. 14 p.
Hansen, K.A., O.N. Larsen, M. Wahlberg, and U. Siebert. 2016. Underwater hearing in great cormorant (Phalacrocorax carbo sinensis): methodological considerations. Proceedings of Meetings on Acoustics 4ENAL 27(1):010015. http://dx.doi.org/doi:10.1121/2.0000267.
Harris, C.M., L. Thomas, E.A. Falcone, J. Hildebrand, D. Houser, P.H. Kvadsheim, F.-P.A. Lam, P.J.O. Miller, D.J. Moretti, A.J. Read, H. Slabbekoorn, B.L. Southall, P.L. Tyack, D. Wartzok, and V.M. Janik. 2017. Marine mammals and sonar: dose–response studies, the risk-disturbance hypothesis and the role of exposure context. J. Appl. Ecol. http://dx.doi.org/doi:10.1111/1365-25664.12955.
Harwood, J. and B. Wilson. 2001. The implications of developments on the Atlantic Frontier for marine mammals. Cont. Shelf Res. 21:1073–1093.
Harwood, J., S. King, C. Booth, C. Donovan, R.S. Schick, L. Thomas, and L. New. 2016. Understanding the population consequences of acoustic disturbance for marine mammals. Adv. Exp. Med. Biol. 875:417–243.
Hastings, M.C. and J. Miksis-Olds. 2012. Shipboard assessment of hearing sensitivity of tropical fishes immediately after exposure to seismic air gun emissions at Scott Reef. p. 239–243 In: A.N. Popper and A. Hawkins (eds.), The effects of noise on aquatic life. Springer, New York, NY. 695 p.
Hatch, L.T., C.W. Clark, S.M. Van Parijs, A.S. Frankel, and D.W. Ponirakis. 2012. Quantifying loss of acoustic communication space for right whales in and around a U.S. National Marine Sanctuary. Conserv. Biol. 26(6):983–994.
Hawkes, L.A., A.C. Broderick, M.S. Coyne, M.H. Godfrey, and B.J. Godley. 2007. Only some like it hot -- quantifying the environmental niche of the loggerhead sea turtle. Diversity Distrib. 13:447–457.
Literature Cited
Draft Environmental Assessment for USGS Northwest Atlantic, 2018 Page 86
Hawkins, A.D. and A.N. Popper. 2017. A sound approach to assessing the impact of underwater noise on marine fishes and invertebrates. ICES. J. Mar. Sci. 74(3):635–651.
Hawkins, A.D., A.E. Pembroke, and A.N. Popper. 2015. Information gaps in understanding the effects of noise on fishes and invertebrates. Rev. Fish Biol. Fisher. 25(1):39–64. http://dx.doi.org/doi:10.1007/s11160-014- 9369-3.
Hayes, S.A., E. Josephson, K. Maze-Foley, and P.E. Rosel (eds.). 2017. U.S. Atlantic and Gulf of Mexico marine mammal stock assessments - 2016. NOAA Tech. Memo. NMFS-NE-241. Nat. Mar. Fish. Serv., Northeast Fish. Sci. Center, Woods Hole, MA. 274 p. Hays, G.C., V.J. Hobson, J.D. Metcalfe, D. Righton, and D.W. Sims. 2006. Flexible foraging movements of leatherback turtles across the North Atlantic Ocean. Ecology 87(10):2647–2656.
Heide-Jørgensen, M.P., R.G. Hansen, S. Fossette, N.J. Nielsen, M.V. Jensen, and P. Hegelund. 2013a. Monitoring abundance and hunting of narwhals in Melville Bay during seismic surveys. September 2013. Greenland Institute of Natural Resources. 56 p.
Heide-Jørgensen, M.P., R.G. Hansen, K. Westdal, R.R. Reeves, and A. Mosbech. 2013b. Narwhals and seismic exploration: Is seismic noise increasing the risk of ice entrapments? Biol. Conserv. 158:50–54.
Heiler, J., S.H. Elwen, H.J. Kriesell, and T. Gridley. 2016 Changes in bottlenose dolphin whistle parameters related to vessel presence, surface behaviour and group composition. Anim. Behav. 117:167–177.
Hermannsen, L., J. Tougaard, K. Beedholm, J. Nabe-Nielsen, and P.T. Madsen. 2014. High frequency components of ship noise in shallow water with a discussion of implications for harbor porpoises (Phocoena phocoena). J. Acoust. Soc. Am. 136(4):1640–1653.
Hermannsen, L., K. Beedholm, J. Tougaard, and P.T. Madsen. 2015. Characteristics and propagation of airgun pulses in shallow water with implications for effects on small marine mammals. PLoS ONE 10(7):e0133436. http://dx.doi.org/doi:10.1371/journal.pone.0133436.
Heyning, J.E. 1989. Cuvier’s beaked whale Ziphius cavirostris G. Cuvier, 1823. p. 289–308 In: S.H. Ridgway and R. Harrison (eds.), Handbook of marine mammals, Vol. 4: River dolphins and the larger toothed whales. Academic Press, San Diego, CA. 444 p.
Heyning, J.E. and M.E. Dahlheim. 1988. Orcinus orca. Mammal. Spec. 304:1–9.
Hoelzel, A.R., C.W. Potter, and P.B. Best. 1998. Genetic differentiation between parapatric ‘nearshore’ and ‘offshore’ populations of the bottlenose dolphin. Proc. Roy. Soc. Lond. B 265:1177–1183.
Holbrook, W. S., G. M. Purdy, R. E. Sheridan, L. Glover III, M. Talwani, J. Ewing, and D. Hutchinson (1994), Seismic structure of the U.S. Mid-Atlantic continental margin, J. Geophys. Res., 99(B9), 17871–17891,
doi:10.1029/94JB00729.
Holt, M.M., D.P. Noren, R.C. Dunkin, and T.M. Williams. 2015. Vocal performance affects metabolic rate in dolphins: Implications for animals communicating in noisy environments. J. Exp. Biol. 218(11):1647–1654. http://dx.doi.org/doi:10.1242/jeb.122424.
Horwood, J. 1987. The sei whale: population biology, ecology, and management. Croom Helm, Beckenham, Kent, U.K. 375 p.
Houghton, J., M.M. Holt, D.A. Giles, M.B. Hanson, C.K. Emmons, J.T. Hogan, T.A. Branch, and G.R. VanBlaricom. 2015. The relationship between vessel traffic and noise levels received by killer whales (Orcinus orca). PLoS ONE 10(12):e0140119. http://dx.doi.org/doi:10.1371/journal.pone.0140119.
Houser, D.S., C.D. Champagne, D.E. Crocker. N.M. Kellar, J. Cockrem, T. Romano, R.K. Booth, and S.K. Wasser. 2016. Natural variation in stress hormones, comparisons across matrices, and impacts resulting from induced stress in the bottlenose dolphin. p. 467–471 In: A.N. Popper and A. Hawkins (eds.), The Effects of Noise on Aquatic Life II. Springer, New York, NY. 1292 p.
Houser, D.S., W. Yost, R. Burkhard, J.J. Finneran, C. Reichmuth, and J. Mulsow. 2017. A review of the history, development and application of auditory weighting functions in humans and marine mammals. J. Acoust. Soc. Am.

Literature Cited
Draft Environmental Assessment for USGS Northwest Atlantic, 2018 Page 87
141(1371). http://dx.doi.org/doi:10.1121/1.4976086.
Hovem, J.M., T.V. Tronstad, H.E. Karlsen, and S. Løkkeborg. 2012. Modeling propagation of seismic airgun sounds and the effects on fish behaviour. IEEE J. Ocean. Eng. 37(4):576–588.
IUCN (The World Conservation Union). 2017. IUCN Red List of Threatened Species, Version 2017-3. Accessed December 2017 by LGL in preparation of the Draft Scripps EA and by USGS in February and March 2018 in preparation of this EA at http://www.iucnredlist.org.
IWC (International Whaling Commission). 2007. Report of the standing working group on environmental concerns. Annex K to Report of the Scientific Committee. J. Cetac. Res. Manage. 9(Suppl.):227–260.
IWC. 2017. Whale population estimates. Accessed on 5 October 2017 at https://iwc.int/estimate#table.
Jann, B., J. Allen, M. Carrillo, S. Hanquet, S.K. Katona, A.R. Martin, R.R. Reeves, R. Seton, P.T. Stevick, and F.W. Wenzel. 2003. Migration of a humpback whale (Megaptera novaeangliae) between the Cape Verde Islands and Iceland. J. Cetac. Res. Manage. 5:125–129.
Jaquet, N. and H. Whitehead. 1996. Scale-dependent correlation of sperm whale distribution with environmental features and productivity in the South Pacific. Mar. Ecol. Prog. Ser. 135(1–3):1–9.
Jefferson, T.A., M.A. Webber, and R.L. Pitman. 2015. Marine mammals of the world: a comprehensive guide to their identification, 2nd edit. Academic Press, London, U.K. 608 p.
Jefferson, T.A., C.R. Weir, R.C. Anderson, L.T. Ballance, R.D. Kenney, and J.J. Kiszka. 2014. Global distribution of Risso’s dolphin Grampus griseus: a review and critical evaluation. Mamm. Rev. 44(1):56–68.
Jensen, F.H., L. Bejder, M. Wahlberg, N. Aguilar Soto, M. Johnson, and P.T. Madsen. 2009. Vessel noise effects on delphinid communication. Mar. Ecol. Prog. Ser. 395:161–175.
Johansen, S., O.N. Larsen, J. Christensen-Dalsgaard, L. Seidelin, T. Huulvej, K. Jensen, S.-G. Linneryrd, M. Boström, and M. Wahlberg. 2016. In-air and underwater hearing in the great cormorant (Phalacrocorax carbo sinensis). p. 505–512 In: A.N. Popper and A. Hawkins (eds.), The effects of noise on aquatic life II. Springer, New York, NY. 1292 p.
Johnson, S.R., W.J. Richardson, S.B. Yazvenko, S.A. Blokhin, G. Gailey, M.R. Jenkerson, S.K. Meier, H.R. Melton, M.W. Newcomer, A.S. Perlov, S.A. Rutenko, B. Würsig, C.R. Martin, and D.E. Egging. 2007. A western gray whale mitigation and monitoring program for a 3-D seismic survey, Sakhalin Island, Russia. Environ. Monit. Assess. 134(1–3):1–19.
Jones, E.L., G.D. Hastie, S. Smout, J. Onoufriou, N.D. Merchant, K.L. Brookes, and D. Thompson. 2017. Seals and shipping: quantifying population risk and individual exposure to vessel noise. J. Appl. Ecol. dx.doi.org/doi:10.1111/1365-2664.12911.
Kanda, N., M. Goto, H. Kato, M.V. McPhee, and L.A. Pastene. 2007. Population genetic structure of Bryde’s whales (Balaenoptera brydei) at the inter-oceanic and trans-equatorial levels. Conserv. Genet. 8:853–864.
Kastak, D. and C. Reichmuth. 2007. Onset, growth, and recovery of in-air temporary threshold shift in a California sea lion (Zalophus californianus). J. Acoust. Soc. Am. 122(5):2916–2924.
Kastak, D., R.L. Schusterman, B.L. Southall, and C.J. Reichmuth. 1999. Underwater temporary threshold shift induced by octave-band noise in three species of pinnipeds. J. Acoust. Soc. Am. 106(2):1142–1148.
Kastak, D., B.L. Southall, R.J. Schusterman, and C. Reichmuth. 2005. Underwater temporary threshold shift in pinnipeds: effects of noise level and duration. J. Acoust. Soc. Am. 118(5):3154–3163.
Kastak, D., J. Mulsow, A. Ghoul, and C. Reichmuth. 2008. Noise-induced permanent threshold shift in a harbor seal. J. Acoust. Soc. Am. 123(5):2986.
Kastelein, R., R. Gransier, L. Hoek, and J. Olthuis. 2012a. The hearing threshold of a harbor porpoise (Phocoena phocoena) for impulsive sounds (L). J. Acoust. Soc. Am. 132(2):607-610.
Kastelein, R.A., R. Gransier, L. Hoek, A. Macleod, and J.M. Terhune. 2012b. Hearing threshold shifts and recovery
Literature Cited
Draft Environmental Assessment for USGS Northwest Atlantic, 2018 Page 88
in harbor seals (Phoca vitulina) after octave-band noise exposure at 4 kHz. J. Acoust. Soc. Am. 132(4):2745–2761.
Kastelein, R., R. Gransier, L. Hoek, and J. Olthuis. 2012c. Temporary threshold shifts and recovery in a harbor porpoise (Phocoena phocoena) after octave-band noise at 4 kHz. J. Acoust. Soc. Am. 132(5):3525–3537.
Kastelein, R.A., N. Steel, R. Gransier, P.J. Wensveen, and C.A.F de Jong. 2012d. Threshold received sound pressure levels of single 1–2 kHz and 6–7 kHz up-sweeps and down-sweeps causing startle responses in a harbor porpoise (Phocoena phocoena). J. Acoust. Soc. Am. 131(3):2325–2533.
Kastelein, R.A., N. Steen, R. Gransier, and C.A.F. de Jong. 2013a. Brief behavioral response threshold level of a harbor porpoise (Phocoean phocoena) to an impulsive sound. Aquatic Mamm. 39(4):315–323.
Kastelein, R.A., R. Gransier, and L. Hoek, and M. Rambags. 2013b. Hearing frequency thresholds of a harbour porpoise (Phocoena phocoena) temporarily affected by a continuous 1.5-kHz tone. J. Acoust. Soc. Am. 134(3):2286–2292.
Kastelein, R., R. Gransier, and L. Hoek. 2013c. Comparative temporary threshold shifts in a harbour porpoise and harbour seal, and severe shift in a seal. J. Acoust. Soc. Am. 134(1):13–16.
Kastelein, R.A., L. Hoek, R. Gransier, M. Rambags, and N. Clayes. 2014. Effect of level, duration, and inter-pulse interval of 1–2 kHz sonar signal exposures on harbor porpoise hearing. J. Acoust. Soc. Am. 136:412–422.
Kastelein, R.A., R. Gransier, J. Schop, and L. Hoek. 2015a. Effects of exposure to intermittent and continuous 6-7 kHz sonar sweeps on harbor porpoise (Phocoena phocoena) hearing. J. Acoust. Soc. Am. 137(4):1623–1633. Kastelein, R.A., R. Gransier, M.A.T. Marijt, and L. Hoek. 2015b. Hearing frequency thresholds of harbor porpoises (Phocoena phocoena) temporarily affected by played back offshore pile driving sounds. J. Acoust. Soc. Am. 137(2):556–564.
Kastelein, R.A., I. van den Belt, R. Gransier, and T. Johansson. 2015c. Behavioral responses of a harbor porpoise (Phocoena phocoena) to 25.5- to 24.5-kHz sonar down-swe eps with and without side bands. Aquatic Mamm. 41(4):400–411.
Kastelein, R.A., L. Helder-Hoek, G. Janssens, R. Gransier, and T. Johansson. 2015d. Behavioral responses of harbor seals (Phoca vitulina) to sonar signals in the 25-kHz range. Aquatic Mamm. 41(4):388–399.
Kastelein, R.A., R. Gransier, and L. Hoek. 2016a. Cumulative effects of exposure to continuous and intermittent sounds on temporary hearing threshold shifts induced in a harbor porpoise (Phocoena phocoena). p. 523–528 In: A.N. Popper and A. Hawkins (eds.), The effects of noise on aquatic life II. Springer, New York, NY. 1292 p.
Kastelein, R.A., L. Helder-Hoek, J. Covi, and R. Gransier. 2016b. Pile driving playback sounds and temporary threshold shift in harbor porpoises (Phocoena phocoena): effect of exposure duration. J. Acoust. Soc. Am. 139(5):2842–2851.
Kasuya, T. 1986. Distribution and behavior of Baird’s beaked whales off the Pacific coast of Japan. Sci. Rep. Whales Res. Inst. 37:61–83.
Kato, H. and W.F. Perrin. 2009. Bryde’s whales Balaenoptera edeni/brydei. p. 158–162 In: W.F. Perrin, B. Würsig and J.G.M. Thewissen (eds.), Encyclopedia of marine mammals, 2nd edit. Academic Press, San Diego, CA. 1316 p.
Katona, S.K. and J.A. Beard. 1990. Population size, migrations and feeding aggregations of the humpback whale (Megaptera novaeangliae) in the western North Atlantic Ocean. Rep. Int. Whal. Comm. Spec. Iss. 12:295–305.
Kenney, R.D. and H.E. Winn. 1987. Cetacean biomass densities near submarine canyons compared to adjacent shelf/slope areas. Continent. Shelf Res. 7:107–114.
Kenney, R.D., C.A. Mayo, and H.E. Winn. 2001. Migration and foraging strategies at varying spatial scales in western North Atlantic right whales: a review of hypotheses. J. Cetac. Res. Manage. Spec. Iss. 2:251–260.
Ketten, D.R. 2012. Marine mammal auditory system noise impacts: evidence and incidence. p. 207–212 In: A.N. Popper and A. Hawkins (eds.), The effects of noise on aquatic life. Springer, New York, NY. 695 p.
Ketten, D.R., J. O’Malley, P.W.B. Moore, S. Ridgway, and C. Merigo. 2001. Aging, injury, disease, and noise in marine mammal ears. J. Acoust. Soc. Am. 110(5, Pt. 2):2721.

Literature Cited
Draft Environmental Assessment for USGS Northwest Atlantic, 2018 Page 89
King, S.L., R.S. Schick, C. Donovan, C.G. Booth, M. Burgman, L. Thomas, and J. Harwood. 2015. An interim framework for assessing the population consequences of disturbance. Meth. Ecol. Evol. 6(1):1150–1158.
Kinze, C.C. 2009. White-beaked dolphin Lagenorhynchus albirostris. p. 1255–1258 In: W.F. Perrin, B. Würsig, and J.G.M. Thewissen (eds.), Encyclopedia of marine mammals, 2nd edit. Academic Press, San Diego, CA. 1316 p. Klinck, H., S.L. Nieukirk, D.K. Mellinger, K. Klinck, H. Matsumoto, and R.P. Dziak. 2012. Seasonal presence of cetaceans and ambient noise levels in polar waters of the North Atlantic. J. Acoust. Soc. Am. 132(3):EL176–EL181.
Knowlton, A.R., J. Sigurjonsson, J.N. Ciano, and S.D. Kraus. 1992. Long-distance movements of North Atlantic right whales (Eubalaena glacialis). Mar. Mammal Sci. 8(4):397–405.
Knowlton, A.R., J.B. Ring, and B. Russell. 2002. Right whale sightings and survey effort in the mid Atlantic region: migratory corridor, time frame, and proximity to port entrances. Final Rep. to National Marine Fisheries Ship Strike Working Group. 25 p.
Kraus, S.D., J.H. Prescott, A.R. Knowlton, and G.S. Stone. 1986. Migration and calving of right whales (Eubalaena glacialis) in the western North Atlantic. Rep. Int. Whal. Comm. Spec. Iss. 10:139–144.
Krieger, K.J. and B.L. Wing. 1984. Hydroacoustic surveys and identification of humpback whale forage in Glacier Bay, Stephens Passage, and Frederick Sound, southeastern Alaska, summer 1983. NOAA Tech. Memo. NMFS F/NWC-66. U.S. Natl. Mar. Fish. Serv., Auke Bay, AK. 60 p. NTIS PB85-183887.
Krieger, K.J. and B.L. Wing. 1986. Hydroacoustic monitoring of prey to determine humpback whale movements. NOAA Tech. Memo. NMFS F/NWC-98. U.S. Natl. Mar. Fish. Serv., Auke Bay, AK. 63 p. NTIS PB86-204054.
Kruse, S., D.K. Caldwell, and M.C. Caldwell. 1999. Risso’s dolphin Grampus griseus (G. Cuvier, 1812). p.183–212 In: S.H. Ridgway and R. Harrison (eds.), Handbook of marine mammals, Vol. 6: The second book of dolphins and the porpoises. Academic Press, San Diego, CA. 486 p.
Kujawa, S.G. and M.C. Liberman. 2009. Adding insult to injury: cochlear nerve degeneration after “temporary” noise-induced hearing loss. J. Neurosci. 29(45):14077–14085.
Kunc, H.P., K.E. McLaughlin, and R. Schmidt. 2016. Aquatic noise pollution: implications for individuals, populations, and ecosystems. Proc. R. Soc. B. 283:20160839. http://dx.doi.org/doi:10.1098/rspb.2016.0839.
Lavender, A.L., S.M. Bartol, and I.K. Bartol. 2014. Ontogenetic investigation of underwater hearing capabilities in loggerhead sea turtles (Caretta caretta) using a dual testing approach. J. Exp. Biol. 217(14):2580–2589.
Laws, R. 2012. Cetacean hearing-damage zones around a seismic source. p. 473–476 In: A.N. Popper and A. Hawkins (eds.), The effects of noise on aquatic life. Springer, New York, NY. 695 p.
Le Prell, C.G. 2012. Noise-induced hearing loss: From animal models to human trials. p. 191–195 In: A.N. Popper and A. Hawkins (eds.), The effects of noise on aquatic life. Springer, New York, NY. 695 p. Leite, L., D. Campbell, L. Versiani, J. Anchieta, C.C. Nunes, and T. Thiele. 2016. First report of a dead giant squid (Architeuthis dux) from an operating seismic vessel. Mar. Biodivers. Rec. 9:26.
Lenhardt, M. 2002. Sea turtle auditory behavior. J. Acoust. Soc. Amer. 112(5, Pt. 2):2314 (Abstr.).
Lentz, S. J., S. Elgar, and R. T. Guza. 2003. Observations of the flow field near the nose of a buoyant coastal current. Journal of Physical Oceanography 33:933-943.
Lesage, V., K. Gavrilchuk, R.D. Andrews, and R. Sears. 2016. Wintering areas, fall movements and foraging sites of blue whales satellite-tracked in the Western North Atlantic. DFO Can. Sci. Advis. Sec. Res. Doc. 2016/078. v + 38 p.
Lesage, V., A. Omrane, T. Doniol-Valccroze, and A. Mosnier. 2017. Increased proximity of vessels reduces feeding opportunities of blue whales in St. Lawrence Estuary, Canada. Endang. Species Res. 32:351–361.
LGL, Ltd., 2017, Draft Environmental Analysis of a Low-Energy Marine Geophysical Survey by R/V Atlantis in the Northwest Atlantic Ocean, June-July 2018, 144 pp.
Liberman, M.C., M.J. Epstein, S.S. Cleveland, H. Wang, and S.F. Maison. 2016. Toward a differential diagnosis of hidden hearing loss in humans. PLoS ONE http://dx.doi.org/doi:10.1371/journal/pone.0162726. 15 p.
Literature Cited
Draft Environmental Assessment for USGS Northwest Atlantic, 2018 Page 90
Lien J., R. Sears, G.B. Stenson, P.W. Jones, and I-Hsun Ni. 1989. Right whale, (Eubalaena glacialis), sightings in waters off Newfoundland and Labrador and the Gulf of St. Lawrence, 1978–1987. Can. Field-Nat. 103:91–93.
Lockyer, C.H. and S.G. Brown. 1981. The migration of whales. p. 105–137 In: D.J. Aidley (ed.), Animal migration. Soc. Exp. Biol. Sem. Ser. 13, Cambridge University Press, London, U.K.
Løkkeborg, S., E. Ona, A. Vold, and A. Salthaug. 2012. Sounds from seismic air guns: Gear- and species-specific effects on catch rates and fish distribution. Can. J. Fish. Aquat. Sci. 69(8):1278–1291.
Lucke, K., U. Siebert, P.A. Lepper, and M.-A. Blanchet. 2009. Temporary shift in masked hearing thresholds in a harbor porpoise (Phocoena phocoena) after exposure to seismic airgun stimuli. J. Acoust. Soc. Am. 125(6):4060–4070.
Luís, A.R., M.N. Couchinho, and M.E. Dos Santos. 2014. Changes in the acoustic behavior of resident bottlenose dolphins near operating vessels. Mar. Mamm. Sci. 30(4):1417–1426.
Lusseau, D. and L. Bejder. 2007. The long-term consequences of short-term responses to disturbance experience from whalewatching impact assessment. Int. J. Comp. Psych. 20(2–3):228–236.
Lyamin, O.I., S.M. Korneva, V.V. Rozhnov, and L.M. Mukhametov. 2016. Cardiorespiratory responses to acoustic noise in belugas. p. 665–672 In: A.N. Popper and A. Hawkins (eds.), The Effects of Noise on Aquatic Life II. Springer, New York, NY. 1292 p.
MacGillivray, A.O., R. Racca, and Z. Li. 2014. Marine mammal audibility of selected shallow-water survey sources. J. Acoust. Soc. Am. 135(1):EL35–EL40.
MacLeod, C.D., N. Hauser, and H. Peckham. 2004. Diversity, relative density and structure of the cetacean community in summer months east of Great Abaco, Bahamas. J. Mar. Biol. Assoc. U.K. 84:469–474. MacLeod, C.D., W.F. Perrin, R. Pitman, J. Barlow, L. Ballance, A. D’Amico, T. Gerrodette, G. Joyce, K.D. Mullin, D.L. Palka, and G.T. Warring. 2006. Known and inferred distributions of beaked whale species (Cetacea: Ziphiidae). J. Cetac. Res. Manage. 7(3):271–286.
Madeiros, J., N. Carlile, and D. Priddel. 2012. Breeding biology and population increase of the endangered Bermuda petrel Pterodroma cahow. Bird Conserv. Int. 22(1):35–45.
Madeiros, J., B. Flood, and K. Zufelt. 2014. Conservation and at-sea range of Bermuda Petrel (Pterodroma cahow). North American Birds 67(4):546–557.
Malme, C.I. and P.R. Miles. 1985. Behavioral responses of marine mammals (gray whales) to seismic discharges. p. 253-280 In: G.D. Greene, F.R. Engelhardt, and R.J. Paterson (eds.), Proc. Worksh. Effects Explos. Mar. Envir., Jan. 1985, Halifax, N.S. Tech. Rep. 5. Can. Oil & Gas Lands Admin., Environ. Prot. Br., Ottawa, Ont. 398 p.
Malme, C.I., P.R. Miles, C.W. Clark, P. Tyack, and J.E. Bird. 1984. Investigations of the potential effects of underwater noise from petroleum industry activities on migrating gray whale behavior/Phase II: January 1984 migration. BBN Rep. 5586. Rep. from Bolt Beranek & Newman Inc., Cambridge, MA, for U.S. Minerals Manage. Serv., Anchorage, AK. NTIS PB86-218377.
Malme, C.I., P.R. Miles, P. Tyack, C.W. Clark, and J.E. Bird. 1985. Investigation of the potential effects of underwater noise from petroleum industry activities on feeding humpback whale behavior. BBN Rep. 5851; OCS Study MMS 85-0019. Rep. from BBN Labs Inc., Cambridge, MA, for MMS, Anchorage, AK. NTIS PB86-218385.
Mannocci, L., J.J. Roberts, D.L. Miller, and P.N. Halpin. 2017. Extrapolating cetacean densities to quantitatively assess human impacts on populations in the high seas. Conserv. Biol. 31(3):601–614. Models for all species available at: http://seamap.env.duke.edu/models/AFTT-2015/.
Mansfield, K.L., V.S. Saba, J.A. Keinatch, and J.A. Musick. 2009. Satellite tracking reveals a dichotomy in migration strategies among juvenile loggerhead turtles in the Northwest Atlantic. Mar. Biol. 156:2555–2570.
Martin, K.J., S.C. Alessi, J.C. Gaspard, A.D. Tucker, G.B. Bauer, and D.A. Mann. 2012. Underwater hearing in the loggerhead turtle (Caretta caretta): A comparison of behavorial and auditory evoked potential audiograms. J. Exp. Biol. 215(17):3001–3009.
Martins, D.T.L., M.R. Rossi-Santos, and F.J. De Lima Silva. 2016. Effects of anthropogenic noise on the acoustic

Literature Cited
Draft Environmental Assessment for USGS Northwest Atlantic, 2018 Page 91
behaviour of Sotalia guianensis (Van Bénéden, 1864) in Pipa, North-eastern Brazil. J. Mar. Biol. Assoc. U.K. 2016:1–8. http://dx.doi.org/doi:10.1017/S0025315416001338.
Matthews, L. 2017. Harbor seal (Phoca vitulina) reproductive advertisement behavior and the effects of vessel noise. Ph.D. Thesis, Syracuse University. 139 p.
Matos, F. 2015. Distribution of cetaceans in Vestfjorden, Norway, and possible impacts of seismic surveys. MSc. Thesis, University of Nordland, Norway. 45 p. McAlpine, D.F. 2009. Pygmy and dwarf sperm whales. p. 936–938 In: W.F. Perrin, B. Würsig, and J.G.M. Thewissen (eds.), Encyclopedia of marine mammals, 2nd edit. Academic Press, San Diego, CA. 1316 p.
McCauley, R.D., M.-N. Jenner, C. Jenner, K.A. McCabe, and J. Murdoch. 1998. The response of humpback whales (Megaptera novaeangliae) to offshore seismic survey noise: preliminary results of observations about a working seismic vessel and experimental exposures. APPEA (Austral. Petrol. Product. Explor. Assoc.) J. 38:692–707.
McCauley, R.D., J. Fewtrell, A.J. Duncan, C. Jenner, M.-N. Jenner, J.D. Penrose, R.I.T. Prince, A. Adhitya, J. Murdoch, and K. McCabe. 2000. Marine seismic surveys: Analysis of airgun signals; and effects of air gun exposure on humpback whales, sea turtles, fishes and squid. Rep. from Centre for Marine Science and Technology, Curtin Univ., Perth, Western Australia, for Australian Petrol. Produc. & Explor. Assoc., Sydney, NSW. 188 p.
McCauley, R.D., R.D. Day, K.M. Swadling, Q.P. Fitzgibbon, R.A. Watson, and J.M. Semmens. 2017. Widely used marine seismic survey air gun operations negatively impact zooplankton. Nature Ecology & Evolution 1, 0195. doi:10.1038/s41559-017-0195
McDonald, T.L., W.J. Richardson, K.H. Kim, and S.B. Blackwell. 2010. Distribution of calling bowhead whales exposed to underwater sounds from Northstar and distant seismic surveys, 2009. p. 6-1 to 6-38 In: W.J. Richardson (ed.), Monitoring of industrial sounds, seals, and bowhead whales near BP’s Northstar oil development, Alaskan Beaufort Sea: Comprehensive report for 2005–2009. LGL Rep. P1133-6. Rep. by LGL Alaska Res. Assoc. Inc., Anchorage, AK, Greeneridge Sciences Inc., Santa Barbara, CA, WEST Inc., Cheyenne, WY, and Applied Sociocult. Res., Anchorage, AK, for BP Explor. (Alaska) Inc., Anchorage, AK. 265 p.
McDonald, T.L., W.J. Richardson, K.H. Kim, S.B. Blackwell, and B. Streever. 2011. Distribution of calling bowhead whales exposed to multiple anthropogenic sound sources and comments on analytical methods. p. 199 In: Abstr. 19th Bienn. Conf. Biol. Mar. Mamm., 27 Nov.–2 Dec. 2011, Tampa, FL. 344 p.
McGeady, R., B.J. McMahon, and S. Berrow. 2016. The effects of surveying and environmental variables on deep diving odontocete stranding rates along Ireland’s coast. Proceedings of Meetings on Acoustics 4ENAL 27(1):040006. http://dx.doi.org/doi:10.1121/2.0000281.
McKenna, M.F., J. Calambokidis, E.M. Oleson, D.W. Laist, J.A. Goldbogen. 2015. Simultaneous tracking of blue whales and large ships demonstrate limited behavioral responses for avoiding collision. Endang. Species. Res. 27:219–232.
Mead, J.G. 1986. Twentieth-century records of right whales (Eubalaena glacialis) in the northwest Atlantic Ocean. Rep. Int. Whal. Comm. Spec. Iss. 10:109–120.
Mead, J.G. 1989. Beaked whales of the genus Mesoplodon. p. 349-430 In: S.H. Ridgway and R.J. Harrison (eds.), Handbook of marine mammals, Vol. 4: River dolphins and the larger toothed whales. Academic Press, San Diego, CA. 444 p.
Meier, S.K., S.B. Yazvenko, S.A. Blokhin, P. Wainwright, M.K. Maminov, Y.M. Yakovlev, and M.W. Newcomer. 2007. Distribution and abundance of western gray whales off northeastern Sakhalin Island, Russia, 2001- 2003. Environ. Monit. Assess. 134(1–3):107–136.
Melcón, M.L., A.J. Cummins, S.M. Kerosky, L.K. Roche, S.M. Wiggins, and J.A. Hildebrand. 2012. Blue whales respond to anthropogenic noise. PLoS ONE 7(2):e32681. http://dx.doi.org/doi:10.1371/ journal.pone.0032681. Miller, I. and E. Cripps. 2013. Three dimensional marine seismic survey has no measureable effect on species richness or abundance of a coral reef associated fish community. Mar. Poll. Bull. 77(1–2):63–70.
Miller, G.W., R.E. Elliott, W.R. Koski, V.D. Moulton, and W.J. Richardson. 1999. Whales. p. 5-1 to 5-109 In: W.J. Richardson (ed.), Marine mammal and acoustical monitoring of Western Geophysical’s open-water seismic

Literature Cited
Draft Environmental Assessment for USGS Northwest Atlantic, 2018 Page 92
program in the Alaskan Beaufort Sea, 1998. LGL Rep. TA2230-3. Rep. from LGL Ltd., King City, Ont., and Greeneridge Sciences Inc., Santa Barbara, CA, for Western Geophysical, Houston, TX, and U.S. Nat. Mar. Fish. Serv., Anchorage, AK, and Silver Spring, MD. 390 p.
Miller, G.W., V.D. Moulton, R.A. Davis, M. Holst, P. Millman, A. MacGillivray, and D. Hannay. 2005. Monitoring seismic effects on marine mammals—southeastern Beaufort Sea, 2001–2002. p. 511-542 In: S.L. Armsworthy, P.J. Cranford, and K. Lee (eds.), Offshore oil and gas environmental effects monitoring: approaches and technologies. Battelle Press, Columbus, OH. 631 p.
Miller, P.J.O., M.P. Johnson, P.T. Madsen, N. Biassoni, M. Quero, and P.L. Tyack. 2009. Using at-sea experiments to study the effects of airguns on the foraging behavior of sperm whales in the Gulf of Mexico. Deep-Sea Res. I 56(7):1168–1181.
Moein, S.E., J.A. Musick, J.A. Keinath, D.E. Barnard, M. Lenhardt, and R. George. 1994. Evaluation of seismic sources for repelling sea turtles from hopper dredges. Rep. from Virginia Inst. Mar. Sci., Gloucester Point, VA, for U.S. Army Corps of Engineers. 33 p.
Monaco, C., J.M. Ibáñez, F. Carrión, and L.M. Tringali. 2016. Cetacean behavioural responses to noise exposure generated by seismic surveys: how to mitigate better? Ann. Geophys. 59(4):S0436. http://dx.doi.org/doi: 10.4401/ag-7089.
Morato, T., D.A. Varkey, C. Damaso, M. Machete, M. Santos, R. Prieto, R.S. Santos, and T.J. Pitcher. 2008. Evidence of a seamount effect on aggregating visitors. Mar. Ecol. Progr. Ser. 357:23–32.
Morreale, S., E. Standora, F. Paladino, and J. Spotila. 1994. Leatherback migrations along deepwater bathymetric contours. p.109 In: Schroeder, B.A. and B.E. Witherington (compilers), Proc. 13th Ann. Symp. Sea Turtle Biol. Conserv. NOAA Tech. Memo. NMFS-SEFSC-341. 281 p.
Morell, M., A. Brownlow, B. McGovern, S.A. Raverty, R.E. Shadwick, and M. André. 2017. Implementation of a method to visualize noise-induced hearing loss in mass stranded cetaceans. Sci. Rep. 7:41848 doi:10.1038./srep41848.
Morris, C.J., D. Cote, B. Martin, and D. Kehler. 2017. Effects of 2D seismic on the snow crab fishery. Fish. Res. http://dx.doi.org/10.1016/j.fishres. 2017.09.012.
Moulton, V.D. and M. Holst. 2010. Effects of seismic survey sound on cetaceans in the Northwest Atlantic. Environ. Stud. Res. Funds Rep. No. 182. St. John’s, Nfld. 28 p.
Muir, J.E., L. Ainsworth, R. Joy, R. Racca, Y. Bychkov, G. Gailey, V. Vladimirov, S. Starodymov, and K. Bröker. 2015. Distance from shore as an indicator of disturbance of gray whales during a seismic survey off Sakhalin Island, Russia. Endang. Species. Res. 29:161–178.
Muir, J.E., L. Ainsworth, R. Racca, Y. Bychkov, G. Gailey, V. Vladimirov, S. Starodymov, and K. Broker. 2016. Gray whale densities during a seismic survey off Sakhalin Island, Russia. Endang. Species Res. 29(2):211–227. Mulsow, J., C.E. Schlundt, L. Brandt, and J.J. Finneran. 2015. Equal latency contours for bottlenose dolphins (Tursiops truncatus) and California sea lions (Zalophus californianus). J. Acoust. Soc. Am. 138(5):2678–2691.
Muñoz-Hincapié, M.F., D.M. Mora-Pinto, D.M. Palacios, E.R. Secchi, and A.A. Mignucci-Giannoni. 1998. First osteological record of the dwarf sperm whale in Colombia, with notes on the zoogeography of Kogia in South America. Revista Acad. Colomb. Cien. 22(84):433–444.
Musick, J.A. and C.J. Limpus. 1997. Habitat utilization and migration in juvenile sea turtles. p. 137-163 In: P.L. Lutz and J.A. Musick (eds.), The biology of sea turtles. CRC Press, Boca Raton, FL. 432 p.
Nachtigall, P.E. and A.Y. Supin. 2013. A false killer whale reduces its hearing sensitivity when a loud sound is preceded by a warning. J. Exp. Biol. 216:3062–3070.
Nachtigall, P.E. and A.Y. Supin. 2014. Conditioned hearing sensitivity reduction in the bottlenose dolphin (Tursiops truncatus). J. Exp. Biol. 217(15): 2806–2813.
Nachtigall, P.E. and A.Y. Supin. 2015. Conditioned frequency-dependent hearing sensitivity reduction in the bottlenose dolphin (Tursiops truncatus). J. Exp. Biol. 218(7): 999–1005.
Literature Cited
Draft Environmental Assessment for USGS Northwest Atlantic, 2018 Page 93
Nachtigall, P.E. and A.Y. Supin. 2016. Hearing sensation changes when a warning predict a loud sound in the false killer whale (Pseurorca crassidens). p. 743–746 In: A.N. Popper and A. Hawkins (eds.), The Effects of Noise on Aquatic Life II. Springer, New York, NY. 1292 p.
NAMMCO (North Atlantic Marine Mammal Commission). 1995. Report of the joint meeting of the Scientific Committee working groups on northern bottlenose and killer whales and management procedures. p. 89–99 In: NAMMCO Annual Report 1995, NAMMCO, Tromsø, Norway.
NAMMCO. 2016. Marine mammals. Accessed in November 2017 at https://nammco.no/marinemammals/.
National Academies of Sciences, Engineering, and Medicine, 2017. Approaches to understanding the cumulative effects of stressors on marine mammals. The National Academies Press. Washington, DC. 134 p.
Nelms, S.E., W.E.D. Piniak, C.R. Weir, and B.J. Godley. 2016. Seismic surveys and marine turtles: an underestimated global threat? Biol. Conserv. 193:49–65.
New, L.F., J. Harwood, L. Thomas, C. Donovan, J.S. Clark, G. Hastie, P.M. Thompson, B. Cheney, L. Scott-Hayward, and D. Lusseau. 2013a. Modelling the biological significance of behavioural change in coastal bottlenose dolphins in response to disturbance. Funct. Ecol. 27(2):314–322.
New, L.F., D. Moretti, S.K. Hooker, D.P. Costa, and S.E. Simmons. 2013b. Using energetic models to investigate the survival and reproduction of beaked whales (family Ziphiidae). PLoS ONE 8(7):e68725.
Nieukirk, S.L., D.K. Mellinger, S.E. Moore, K. Klinck, R.P. Dziak, and J. Goslin. 2012. Sounds from airguns and fin whales recorded in the mid Atlantic Ocean, 1999–2009. J. Acoust. Soc. Am. 131(2):1102–1112. NMFS (National Marine Fisheries Service). 2001. Small takes of marine mammals incidental to specified activities: oil and gas exploration drilling activities in the Beaufort Sea/Notice of issuance of an incidental harassment authorization. Fed. Regist. 66(26, 7 Feb.):9291–9298.
NMFS. 2002. Endangered Species Act Section 7 Consultation Biological Opinion: Authorization of pelagic fisheries under the Fishery Management Plan for pelagic fisheries of the western Pacific Region. National Marine Fisheries Service, Southwest Region, Pacific Islands Area Office. 365 p.
NMFS. 2013. Effects of oil and gas activities in the Arctic Ocean: Supplemental draft environmental impact statement. U.S. Depart. Commerce, NOAA, NMFS, Office of Protected Resources. Accessed on 11 March 2017 at http://www.nmfs.noaa.gov/pr/permits/eis/arctic.htm.
NMFS. 2015a. Marine mammal unusual mortality events. Accessed on 11 March 2017 at http://www.nmfs.noaa.gov/pr/health/mmume/events.html.
NMFS. 2015b. Environmental assessment: proposed issuance of an incidental authorization to Lamont-Doherty Earth Observatory to take marine mammals by harassment incidental to a marine geophysical survey in the eastern Mediterranean Sea, Mid-November–December 2015. U.S. Department of Commerce, 38 p.
NMFS. 2016a. Technical Guidance for Assessing the Effects of Anthropogenic Sound on Marine Mammal Hearing: Underwater Acoustic Thresholds for Onset of Permanent and Temporary Threshold Shifts. U.S. Dept. of Commer., NOAA. 178 p.
NMFS. 2016b. Environmental assessment: proposed issuance of an incidental authorization to Lamont-Doherty Earth Observatory to take marine mammals by harassment incidental to a marine geophysical survey over the Mid-Atlantic Ridge in the South Atlantic Ocean, January–March, 2016. U.S. Department of Commerce, 39 p.
NMFS. 2016c. Environmental assessment: proposed issuance of an incidental authorization to Lamont-Doherty Earth Observatory to take marine mammals by harassment incidental to a marine geophysical survey in the Southeast Pacific Ocean, 2016–2017. U.S. Department of Commerce, 38 p.
NMFS. 2017a. Environmental assessment: proposed issuance of an incidental authorization to Lamont-Doherty Earth Observatory to take marine mammals by harassment incidental to a marine geophysical survey in the Southwest Pacific Ocean, 2017/2018. U.S. Department of Commerce, 83 p.
NMFS. 2017b. Environmental assessment: proposed issuance of an incidental authorization to the Scripps Institution
Literature Cited
Draft Environmental Assessment for USGS Northwest Atlantic, 2018 Page 94
of Oceanography to take marine mammals by harassment incidental to a low-energy geophysical survey in the northeastern Pacific Ocean, fall 2017. U.S. Department of Commerce, 73 p.
NOAA (National Oceanic and Atmospheric Administration). 2014a. Hawksbill turtle (Eretmochelys imbricate). U.S. Department of Commerce, National Oceanic and Atmospheric Administration, and National Marine Fisheries Service. Accessed in November 2017 at http://www.nmfs.noaa.gov/pr/species/turtles/hawksbill.html. NOAA, 2014b. The Economic Contribution of Atlantic Highly Migratory Species Angling Permit Holders in New England and the Mid-Atlantic, 2011, NMFS-F/SPO-147, Accessed in February 2018, https://www.st.nmfs.noaa.gov/Assets/economics/fisheries/recreational/pdf/2011%20HMS%20Recreational%20Angling%20Expenditure%20Report%20FINAL%2011.19.14.pdf.
NOAA. 2015a. Scalloped hammerhead shark (Sphyrna lewini). U.S. Department of Commerce, National Oceanic and Atmospheric Administration, and National Marine Fisheries Service. Accessed in November 2017 at http://www.nmfs.noaa.gov/pr/species/fish/scalloped-hammerhead-shark.html.
NOAA. 2015b. Shortnose Sturgeon (Acipenser brevirostrum). U.S. Department of Commerce, National Oceanic and Atmospheric Administration, and National Marine Fisheries Service. Accessed in December 2017 at http://www.nmfs.noaa.gov/pr/species/fish/shortnose-sturgeon.html.
NOAA. 2015c. Smalltooth Sawfish (Pristis pectinata). U.S. Department of Commerce, National Oceanic and Atmospheric Administration, and National Marine Fisheries Service. Accessed in December 2017 at http://www.nmfs.noaa.gov/pr/species/fish/smalltooth-sawfish.html. NOAA. 2016a. Leatherback turtle (Dermochelys coriacea). Accessed 7 November 2017 at www.fisheries.noaa.gov/pr/ species/turtles/leatherback.html.
NOAA. 2016b. Green turtle (Chelonia mydas). U.S. Department of Commerce, National Oceanic and Atmospheric Administration, and National Marine Fisheries Service. Accessed in November 2017 at http://www.nmfs.noaa.gov/pr/species/turtles/green.html.
NOAA. 2016c. Atlantic salmon (Salmo salar). U.S. Department of Commerce, National Oceanic and Atmospheric Administration, and National Marine Fisheries Service. Accessed in December 2017 at http://www.nmfs.noaa.gov/pr/species/fish/atlantic-salmon.html.
NOAA. 2016d. Species in the Spotlight Priority Actions: 2016-2020 Atlantic Salmon Salmo salar. U.S. Department of Commerce, National Oceanic and Atmospheric Administration, and National Marine Fisheries Service. 15 p.
NOAA. 2016e. Oceanic whitetip shark (Carcharhinus longimanus). U.S. Department of Commerce, National Oceanic and Atmospheric Administration, and National Marine Fisheries Service. Accessed in November 2017 at http://www.nmfs.noaa.gov/pr/species/fish/oceanic-whitetip-shark.html.
NOAA. 2016f. The Economic Contribution of Marine Angler Expenditures on Durable Goods in the United States, 2014, NMFS-F/SPO-165. Accessed February 2018 at https://www.st.nmfs.noaa.gov/Assets/economics/durable-expenditures/documents/TM165_Durable_Goods_2014.pdf
NOAA. 2017a. Endangered and threatened wildlife: 90-day finding on a petition to identify the Northwest Atlantic leatherback turtle as a distinct population segment and list it as threatened under the Endangered Species Act. Fed. Regist. 82 (233, 6 Dec.):57565–57568.
NOAA. 2017b. Loggerhead turtle (Caretta caretta). U.S. Department of Commerce, National Oceanic and Atmospheric Administration, and National Marine Fisheries Service. Accessed in November 2017 at http://www.nmfs.noaa.gov/pr/species/turtles/loggerhead.html.
NOAA. 2017c. Kemp’s ridley turtle (Lepidochelys kempii). U.S. Department of Commerce, National Oceanic and Atmospheric Administration, and National Marine Fisheries Service. Accessed in November 2017 at http://www.nmfs.noaa.gov/pr/species/turtles/kempsridley.html.
NOAA. 2017d. Critical habitat. U.S. Department of Commerce, National Oceanic and Atmospheric Administration, and National Marine Fisheries Service. Accessed in October 2017 at
Literature Cited
Draft Environmental Assessment for USGS Northwest Atlantic, 2018 Page 95
http://www.nmfs.noaa.gov/pr/species/criticalhabitat.htm.
NOAA. 2017e. Endangered and threatened marine species under NMFS’ jurisdiction. U.S. Department of Commerce, National Oceanic and Atmospheric Administration, and National Marine Fisheries Service. Accessed in October 2017 at http://www.nmfs.noaa.gov/pr/species/esa/listed.htm#invertebrates.
NOAA. 2017f. Candidate and proposed species under the Endangered Species Act (ESA). U.S. Department of Commerce, National Oceanic and Atmospheric Administration, and National Marine Fisheries Service. Accessed in October 2017 at http://www.nmfs.noaa.gov/pr/species/esa/candidate.htm#proposed.
NOAA. 2017g. Atlantic sturgeon (Acipenser oxyrinchus oxyrinchus). U.S. Department of Commerce, National Oceanic and Atmospheric Administration, and National Marine Fisheries Service. Accessed in December 2017 at http://www.nmfs.noaa.gov/pr/species/fish/atlantic-sturgeon.html.
NOAA. 2017h. Manta rays (Manta spp.). U.S. Department of Commerce, National Oceanic and Atmospheric Administration, and National Marine Fisheries Service. Accessed in November 2017 at http://www.nmfs.noaa.gov/pr/species/fish/manta-ray.html.
Norris, T.F., M. Mc Donald, and J. Barlow. 1999. Acoustic detections of singing humpback whales (Megaptera novaeangliae) in the eastern North Pacific during their northbound migration. J. Acoust. Soc. Am. 106(1):506–514.
Nowacek, D.P., L.H. Thorne, D.W. Johnston, and P.L. Tyack. 2007. Responses of cetaceans to anthropogenic noise. Mamm. Rev. 37(2):81–115. Nowacek, D.P., A.I. Vedenev, B.L. Southall, and R. Racca. 2012. Development and implementation of criteria for exposure of western gray whales to oil and gas industry noise. p. 523–528 In: A.N. Popper and A. Hawkins (eds.), The effects of noise on aquatic life. Springer, New York, NY. 695 p.
Nowacek, D.P., K. Bröker, G. Donovan, G. Gailey, R. Racca, R.R. Reeves, A.I. Vedenev, D.W. Weller, and B.L. Southall. 2013a. Responsible practices for minimizing and monitoring environmental impacts of marine seismic surveys with an emphasis on marine mammals. Aquatic Mamm. 39(4):356–377.
Nowacek, D.P., K. Bröker, G. Donovan, G. Gailey, R. Racca, R.R. Reeves, A.I. Vedenev, D.W. Weller, and B.L. Southall. 2013b. Environmental impacts of marine seismic surveys with an emphasis on marine mammals. Aquatic Mamm. 39(4):356–377.
Nowacek, D.P., C.W. Clark, P. Mann, P.J.O. Miller, H.C. Rosenbaum, J.S. Golden, M. Jasny, J. Kraska, and B.L. Southall. 2015. Marine seismic surveys and ocean noise: time for coordinated and prudent planning. Front. Ecol. Environ. 13(7):378–386.
Nowacek, D.P., F. Christiansen, L. Bejder, J.A. Goldbogen, and A.S. Friedlaender. 2016. Studying cetacean behaviour: new technological approaches and conservation applications. Animal Behav. http://dx.doi.org/doi:10.1016/j.anbehav.2016.07.019.
NRC (National Research Council). 2005. Marine mammal populations and ocean noise/Determining when noise causes biologically significant effects. U.S. Nat. Res. Counc., Ocean Studies Board, Committee on characterizing biologically significant marine mammal behavior (Wartzok, D.W., J. Altmann, W. Au, K. Ralls, A. Starfield, and P.L. Tyack). Nat. Acad. Press, Washington, DC. 126 p.
NSF (National Science Foundation). 2012. Record of Decision for marine seismic research funded by the National Science Foundation. June 2012. 41 p.
NSF and USGS (NSF and U.S. Geological Survey). 2011. Final programmatic environmental impact statement/Overseas environmental impact statement for marine seismic research funded by the National Science Foundation or conducted by the U.S. Geological Survey.
Oakley, J.A., A.T. Williams, and T. Thomas. 2017. Reactions of harbour porpoise (Phocoena phocoena) to vessel traffic in the coastal waters of South Wales, UK. Ocean & Coastal Manage. 138:158–169.
O’Boyle, R. 2001. Meeting on turtle bycatch in Canadian Atlantic fisheries. CSAS Proceedings Series. 2001/17.
O’Brien, J.M., S. Beck, S.D. Berrow, M. André, M. van der Schaar, I. O’Connor, and E.P. McKeown. 2016. The use
Literature Cited
Draft Environmental Assessment for USGS Northwest Atlantic, 2018 Page 96
of deep water berths and the effect of noise on bottlenose dolphins in the Shannon Estuary cSAC. p. 775–783 In: The effects of noise on aquatic life II, Springer, New York, NY. 1292 p.
OBIS (Ocean Biogeographic Information System). 2017. Data from the Ocean Biogeographic Information System. Intergovernmental Oceanographic Commission of UNESCO. Accessed in February and March 2018 at http://www.iobis.org, in addition to information derived by LGL in preparation of the Draft Scripps EA, November 2017.
Olson, P.A. 2009. Pilot whales Globicephala melas and G. macrorhynchus. p. 847–852 In: W.F. Perrin, B. Würsig, and J.G.M. Thewissen (eds.), Encyclopedia of marine mammals, 2nd edit. Academic Press, San Diego, CA. 1316 p.
Palka, D.L. 2006. Summer abundance estimates of cetaceans in US North Atlantic navy operating areas. Accessed 9 December at http://www.nefsc.noaa.gov/publications/crd/crd0603/crd0603.pdf.
Papale, E., M. Gamba, M. Perez-Gil, V.M. Martin, and C. Giacoma. 2015. Dolphins adjust species-specific frequency parameters to compensate for increasing background noise. PLoS ONE 10(4):e0121711. http://dx.doi.org/doi:10.1371/journal.pone.0121711.
Parks, S.E. M. Johnson, D. Nowacek, and P.L. Tyack. 2011. Individual right whales call louder in increased environmental noise. Biol. Lett. 7(1):33–35.
Parks, S.E., M.P. Johnson, D.P. Nowacek, and P.L. Tyack. 2012. Changes in vocal behaviour of North Atlantic right whales in increased noise. p. 317–320 In: A.N. Popper and A. Hawkins (eds.), The effects of noise on aquatic life. Springer, New York, NY. 695 p.
Parks, S.E., K. Groch, P. Flores, R. Sousa-Lima, and I.R. Urazghildiiev. 2016a. Humans, fish, and whales: How right whales modify calling behavior in response to shifting background noise conditions. p. 809–813 In: A.N. Popper and A. Hawkins (eds.), The effects of noise on aquatic life II. Springer, New York, NY. 1292 p.
Parks, S.E., D.A. Cusano, A. Bocconcelli, and A.S. Friedlaender. 2016b. Noise impacts on social sound production by foraging humpback whales. Abstr. 4th Int. Conf. Effects of Noise on Aquatic Life, July 2016, Dublin, Ireland.
Patrician, M.R., I.S. Biedron, H.C. Esch, F.W. Wenzel, L.A. Cooper, P.K. Hamilton, A.H. Glass, and M.F. Baumgartner. 2009. Evidence of a North Atlantic right whale calf (Eubalaena glacialis) born in northeastern U.S. waters. Mar. Mamm. Sci. 25(2):462–477.
Paxton, A.B., J.C. Taylor, D.P. Nowacek, J. Dale, E. Cole, C.M. Voss, and C.H. Peterson. 2017. Seismic survey noise disrupted fish use of a temperate reef. Mar. Policy 78:68–73.
Payne, R. 1978. Behavior and vocalizations of humpback whales (Megaptera sp.). In: K.S Norris and R.R. Reeves (eds.), Report on a workshop on problems related to humpback whales (Megaptera novaeangliae) in Hawaii. MCC-77/03. Rep. from Sea Life Inc., Makapuu Pt., HI, for U.S. Mar. Mamm. Comm., Washington, DC.
Payne, R.S. and S. McVay. 1971. Songs of humpback whales. Science 173(3997):585–597.
Payne, J.F., C.D. Andrews, J. Hanlon, and J. Lawson. 2015. Effects of seismic air-gun sounds on lobster (Homarus americanus): pilot laboratory studies with (i) a recorded track from a seismic survey and (ii) air-gun pulse exposures over 5 days. ESRF-NRC 197. 38 p.
Pearson, W., J. Skalski, S. Sulkin, and C. Malme. 1994. Effects of seismic energy releases on the survival and development of zoeal larvae of Dungeness crab (Cancer magister). Mar. Envir. Res. 38:93–113.
Peña, H., N.O. Handegard, and E. Ona. 2013. Feeding herring schools do not react to seismic air gun surveys. ICES J. Mar. Sci. 70(6):1174–1180. http://dx.doi.org/doi:10.1093/icesjms/fst079.
Pendoley, K. 1997. Sea turtles and management of marine seismic programs in Western Australia. Petrol. Expl. Soc. Austral. J. 25:8–16. Peng, C., X. Zhao, and G. Liu. 2015. Noise in the sea and its impacts on marine organisms. Int. J. Environ. Res. Public Health (12):12304–12323.
Perrin, W.F. and R.L. Brownell, Jr. 2009. Minke whales Balaenoptera acutorostrata and B. bonaerensis. p. 733–735 In: W.F. Perrin, B. Würsig, and J.G.M. Thewissen (eds.), Encyclopedia of marine mammals, 2nd edit.

Literature Cited
Draft Environmental Assessment for USGS Northwest Atlantic, 2018 Page 97
Academic Press, San Diego, CA. 1316 p.
Perry, S.L., D.P. DeMaster, and G.K. Silber. 1999. The fin whale. Mar. Fish. Rev. 61(1):44–51.
Pettis, H.M., R.M. Pace III, R.S. Schick, and P.K. Hamilton. 2017. North Atlantic Right Whale Consortium Annual Report Card. Report to the North Atlantic Right Whale Consortium, October 2017. Accessed on 16 November 2017 at http://www.narwc.org/pdf/2017%20Report%20CardFinal.pdf.
Pickard, G. L., and W. J. Emery. 1990. Descriptive Physical Oceanography: An Introduction, 5th edition. Pergamon Press, Oxford.
Pierson, M.O., J.P. Wagner, V. Langford, P. Birnie, and M.L. Tasker. 1998. Protection from, and mitigation of, the potential effects of seismic exploration on marine mammals. Chapter 7 In: M.L. Tasker and C. Weir (eds.), Proc. Seismic Mar. Mamm. Worksh., London, U.K., 23–25 June 1998.
Pike, D.G., G.A. Víkingsson, T. Gunnlaugsson, and N. Øien. 2009. A note on the distribution and abundance of blue whales (Balaenoptera musculus) in the central and northeast North Atlantic. NAMMCO Sci. Publ. 7:19–29.
Piniak, W.E.D., D.A. Mann, S.A. Eckert, and C.A. Harms. 2012a. Amphibious hearing in sea turtles. p. 83–88. In: A.N. Popper and A. Hawkins (eds.), The effects of noise on aquatic life. Springer, New York. 695 p.
Piniak, W.E.D., S.A. Eckert, C.A. Harms, and E.M. Stringer. 2012b. Underwater hearing sensitivity of the leatherback sea turtle (Dermochelys coriacea): Assessing the potential effect of anthropogenic noise. U.S. Dept. of the Interior, Bureau of Ocean Energy Management, Headquarters, Herndon, VA. OCS Study BOEM 2012-01156. 35 p.
Pirotta, E., R. Milor, N. Quick, D. Moretti, N. Di Marzio, P. Tyack, I. Boyd, and G. Hastie. 2012. Vessel noise affects beaked whale behavior: Results of a dedicated acoustic response study. PLoS ONE 7(8):e42535. http://dx.doi.org/doi:10.1371/journal.pone.0042535.
Pirotta, E., K.L. Brookdes, I.M. Graham, and P.M. Thompson. 2014. Variation in harbour porpoise activity in response to seismic survey noise. Biol. Lett. 10:20131090. http://dx.doi.org/doi:10.1098/rsbl.2013.1090.
Pirotta, E., N.D. Merchant, P.M. Thompson, T.R. Barton, and D. Lusseau. 2015. Quantifying the effect of boat disturbance on bottlenose dolphin foraging activity. Biol. Conserv. 181:82–98.
Pitman, R.L. 2009. Mesoplodont whales (Mesoplodon spp.) p. 721–726 In: W.F. Perrin, B. Würsig, and J.G.M. Thewissen (eds.), Encyclopedia of marine mammals, 2nd edit. Academic Press, San Diego, CA. 1316 p.
Plotkin, P.T. 2003. Adult migrations and habitat use. p. 225–241 In: P.L. Lutz, J.A. Musick, and J. Wyneken (eds.), The biology of sea turtles. CRC Press, Boca Raton, FL. 455 p.
Popov, V.V., A.Y. Supin, D. Wang, K. Wang, L. Dong, and S. Wang. 2011. Noise-induced temporary threshold shift and recovery in Yangtze finless porpoises Neophocaena phocaenoides asiaeorientalis. J. Acoust. Soc. Am. 130(1):574–584.
Popov, V.V., A.Y. Supin, V.V. Rozhnov, D.I. Nechaev, E.V. Sysuyeva, V.O. Klishin, M.G. Pletenko, and M.B. Tarakanov. 2013. Hearing threshold shifts and recovery after noise exposure in beluga whales, Delphinapterus leucas. J. Exp. Biol. 216:1587–1596. Popov, V.V., D.I. Nechaev, E.V. Sysueva, V.V. Rozhnov, and A.Y. Supin. 2015. Spectrum pattern resolution after noise exposure in a beluga whale, Delphinapterus leucas: Evoked potential study. J. Acoust. Soc. Am. 138(1):377–388.
Popov, V., A. Supin, D. Nechaev, E.V. Sysueva, and V. Rozhnov. 2016. Temporary threshold shifts in naïve and experienced belugas: Can dampening of the effects of fatiguing sounds be learned? p. 853–859 In: A.N. Popper and A. Hawkins (eds.), The effects of noise on aquatic life II. Springer, New York, NY. 1292 p.
Popper, A.N. 2009. Are we drowning out fish in a sea of noise? Mar. Scientist 27:18–20.
Popper, A.N. and M.C. Hastings. 2009a. The effects of human-generated sound on fish. Integr. Zool. 4:43–52.
Popper, A.N. and M.C. Hastings. 2009b. The effects of anthropogenic sources of sound on fishes. J. Fish Biol. 75:455–489.

Literature Cited
Draft Environmental Assessment for USGS Northwest Atlantic, 2018 Page 98
Popper, A.N., A.D. Hawkins, R.R. Fay, D.A. Mann, S, Bartol, T.J. Carlson, S. Coombs, W.T. Ellison, R.L. Gentry, M.B. Halvorsen, S. Løkkeborg, P.H. Rogers, B.L. Southall, D.G. Zeddies, and W.N. Tavolga. 2014. Sound exposure guidelines for fishes and sea turtles: A technical report prepared by ANSI-Accredited Standards Committee S3/SC1 and registered with ANSI. Springer Briefs in Oceanography. ASA Press—ASA S3/SC1.4 TR-2014. 75 p.
Popper, A.N., T.J. Carlson, J.A. Gross, A.D. Hawkins, D.G. Zeddies, L. Powell, and J. Young. 2016. Effects of seismic air guns on pallid sturgeon and paddlefish. p. 871–878 In: A.N. Popper and A. Hawkins (eds.), The effects of noise on aquatic life II. Springer, New York, NY. 1292 p.
Radford, A.N., E. Kerridge, and S.D. Simpson. 2014. Acoustic communication in a noisy world: Can fish compete with anthropogenic noise? Behav. Ecol. 25(5):1022–1030.
Radford A.N., L. Lèbre, G. Lecaillon, S.L. Nedelec, and S.D. Simpson. 2016. Repeated exposure reduces the response to impulsive noise in European seabass. Glob. Chang. Biol. 22(10):3349–3360.
Redfern, J.V., M.F. McKenna, T.J. Moore, J. Calambokidis, M.L. Deangelis, E.A. Becker, J. Barlow, K.A. Forney, P.C. Fiedler, and S.J. Chivers. 2013. Assessing the risk of ships striking large whales in marine spatial planning. Conserv. Biol. 27(2):292–302.
Reeves, R.R. 2001. Overview of catch history, historic abundance and distribution of right whales in the western North Atlantic and in Cintra Bay, West Africa. J. Cetac. Res. Manage. Spec. Iss. 2:187–192.
Reeves, R.R. and E. Mitchell. 1986. American pelagic whaling for right whales in the North Atlantic. Rep. Int. Whal. Comm. Spec. Iss. 10:221–254.
Reeves, R.R., S. Leatherwood, G.S. Stone, and L.G. Eldredge. 1999. Marine mammals in the area served by the South Pacific Regional Environment Programme (SPREP). SPREP, Apia, Samoa. 55 p.
Reeves, R.R., B.D. Smith, E.A. Crespo, and G. Notarbartolo di Sciara. 2003. Dolphins, whales, and porpoises: 2002–2010 Conservation Action Plan for the World’s Cetaceans. IUCN/SSC Cetacean Specialist Group, Gland, Switzerland, and Cambridge, U.K. Reichmuth, C., A. Ghoul, A. Rouse, J. Sills, and B. Southall. 2016. Temporary threshold shift not measured in spotted or ringed seals exposed to single airgun impulses. J. Acoust. Soc. Am. (in review).
Reilly, S.B. and V.G. Thayer. 1990. Blue whale (Balaenoptera musculus) distribution in the eastern tropical Pacific. Mar. Mamm. Sci. 6(4):265–277.
Rice, A.N., J.T. Tielens, B.J. Estabrook, C.A. Muirhead, A. Rahaman, M. Guerra, and C.W. Clark. 2014. Variation of ocean acoustic environments along the western North Atlantic coast: a case study in context of the right whale migration route. Ecol. Inform. 21:89–99.
Rice, D.W. 1989. Sperm whale Physeter macrocephalus Linnaeus, 1758. p. 177–233 In: S.H. Ridgway and R. Harrison (eds.), Handbook of marine mammals, Vol. 4: River dolphins and the larger toothed whales. Academic Press, San Diego, CA. 444 p.
Rice, D.W. 1998. Marine mammals of the world, systematics and distribution. Spec. Publ. 4. Soc. Mar. Mammal., Allen Press, Lawrence, KS. 231 p.
Rice, A.N., J.T. Tielens, B.J. Estabrook, C.A. Muirhead, A. Rahaman, M. Guerra, and C.W. Clark. 2014. Variation of ocean acoustic environments along the western North Atlantic coast: A case study in context of the right whale migration route. Ecol. Inform. 21:89–99.
Richards, P.M., S.P. Epperly, S.S. Heppell, R.T. King, C.R. Sasso, F. Moncada, Gonzalo Nodarse, D.J. Shaver, Y. Medina, and J. Zurita. 2011. Sea turtle population estimates incorporating uncertainty: A new approach applied to western North Atlantic loggerheads Caretta caretta. Endang. Species Res. 15:151–158.
Richardson, A.J., R.J. Matear, and A. Lenton. 2017. Potential impacts on zooplankton of seismic surveys. CSIRO, Australia. 34 p.
Richardson, W.J., C.R. Greene, Jr., C.I. Malme, and D.H. Thomson. 1995. Marine mammals and noise. Academic Press, San Diego. 576 p.
Literature Cited
Draft Environmental Assessment for USGS Northwest Atlantic, 2018 Page 99
Richardson, W.J., G.W. Miller, and C.R. Greene, Jr. 1999. Displacement of migrating bowhead whales by sounds from seismic surveys in shallow waters of the Beaufort Sea. J. Acoust. Soc. Am. 106(4, Pt. 2):2281 (Abstr.).
Risch, D., P.J. Corkeron, W.T. Ellison, and S.M. Van Parijs. 2012. Changes in humpback whale song occurrence in response to an acoustic source 200 km away. PLoS One 7:e29741. http://dx.doi.org/doi:10.1371/ journal.pone.0029741.
Risch, D., P.J. Corkeron, W.T. Ellison, and S.M. Van Parijs. 2014. Formal comment to Gong et al.: Ecosystem scale acoustic sensing reveals humpback whale behavior synchronous with herring spawning processes and re-evaluation finds no effect of sonar on humpback song occurrence in the Gulf of Maine in fall 2006. PLoS One 9(10):e109225. http://dx.doi.org/doi:10.1371/journal.pone.0109225.
Roberts, J.J., B.D. Best, L. Mannocci, E. Fujioka, P.N. Halpin, D.L. Palka, L.P. Garrison, K.D. Mullin, T.V.N. Cole, C.B. Khan, W.A. McLellan, D.A. Pabst, and G.G. Lockhart. 2016. Habitat-based cetacean density models for the U.S. Atlantic and Gulf of Mexico. Sci. Rep. 6:22615.
Robertson, F.C., W.R. Koski, T.A. Thomas, W.J. Richardson, B. Würsig, and A.W. Trites. 2013. Seismic operations have variable effects on dive-cycle behavior of bowhead whales in the Beaufort Sea. Endang. Species Res. 21:143–160.
Rolland, R.M., S.E. Parks, K.E. Hunt, M. Castellote, P.J. Corkeron, D.P. Nowacek, S.K. Water, and S.D. Kraus. 2012. Evidence that ship noise increases stress in right whales. Proc. R. Soc. B 279:2363–2368.
RPS, 2013. Final Environmental Assessment of a Low-Energy Marine Geophysical Survey by the US Geological Survey in the Northwestern Gulf of Mexico, April–May 2013.
RPS. 2014a. Final environmental assessment for seismic reflection scientific research surveys during 2014 and 2015 in support of mapping the U.S. Atlantic seaboard extended continental margin and investigating tsunami hazards. Rep. from RPS for United States Geological Survey, August 2014. Accessed in March 2017 at http://www.nsf.gov/geo/oce/envcomp/usgssurveyfinalea2014.pdf. RPS. 2014b. Draft protected species mitigation and monitoring report: U.S. Geological Survey 2-D seismic reflection scientific research survey program: mapping the U.S. Atlantic seaboard extended continental margin and investigating tsunami hazards, in the northwest Atlantic Ocean, Phase 1, 20 August 2014–13 September 2014, R/V Marcus G. Langseth. Rep. from RPS, Houston, TX, for Lamont-Doherty Earth Observatory of Columbia University, Palisades, NY.
RPS. 2014c. Protected species mitigation and monitoring report: East North American Margin (ENAM) 2-D seismic survey in the Atlantic Ocean off the coast of Cape Hatteras, North Carolina, 16 September–18 October 2014, R/V Marcus G. Langseth. Rep. from RPS, Houston, TX, for Lamont-Doherty Earth Observatory of Columbia University, Palisades, NY.
Ruppel, C., Kluesner, J., Pohlman, J., Brothers, D., Colwell, F., Krause, S., and Treude, T., 2015, Methane hydrate dynamics on the Northern US Atlantic margin, DOE NETL Fire in the Ice newsletter, pp 10-13.
Sairanen, E.E. 2014. Weather and ship induced sounds and the effect of shipping on harbor porpoise (Phocoena phocoena) activity. M.Sc. Thesis, University of Helsinki. 67 p.
Salden, D.R. 1993. Effects of research boat approaches on humpback whale behavior off Maui, Hawaii, 1989–1993. p. 94 In: Abstr. 10th Bienn. Conf. Biol. Mar. Mamm., Galveston, TX, Nov. 1993. 130 p.
Schlundt, C.E., J.J. Finneran, D.A. Carder, and S.H. Ridgway. 2016. Auditory effects of multiple impulses from a seismic air gun on bottlenose dolphins (Tursiops truncatus). p. 987–991 In: A.N. Popper and A. Hawkins (eds.), The Effects of Noise on Aquatic Life II. Springer, New York, NY. 1292 p.
Scholik-Schlomer, A. 2015. Where the decibels hit the water: perspectives on the application of science to real-world underwater noise and marine protected species issues. Acoustics Today 11(3):36–44.
Sciacca, V., S. Viola, S. Pulvirenti, G. Riccobene, F. Caruso, E. De Domenico, and G. Pavan. 2016. Shipping noise and seismic airgun surveys in the Ionian Sea: potential impact on Mediterranean fin whale. Proceedings of Meetings on Acoustics 4ENAL 27(1):040010. http://dx.doi.org/doi:10.1121/2.0000311.
Seminoff, J.A., C.D. Allen, G.H. Balazs, P.H. Dutton, T. Eguchi, H.L. Haas, S.A. Hargrove, M.P. Jensen, D.L. Klemm,

Literature Cited
Draft Environmental Assessment for USGS Northwest Atlantic, 2018 Page 100
A.M. Lauritsen, S.L. MacPherson, P. Opay, E.E. Possardt, S.L. Pultz, E.E. Seney, K.S. Van Houtan, and R.S. Waples. 2015. Status Review of the Green Turtle (Chelonia mydas) Under the U.S. Endangered Species Act. NOAA Technical Memorandum, NOAANMFS-SWFSC-539. 571 p.
Sergeant, D.E. 1977. Stocks of fin whales Balaenoptera physalus L. in the North Atlantic Ocean. Rep. Int. Whal. Comm. 27:460–473.
Shen, C. Y., R. A. Fusina, and L. K. Shay. 2000. An assessment of local coastal dynamics observed with high-frequency radar. Journal of Geophysical Research 105(C3):6517- 6530. Skarke, A., C. Ruppel, M. Kodis, D. Brothers, and E. Lobecker, 2014, Widespread methane leakage from the seafloor on the northern US Atlantic margin, Nature Geoscience, doi:10.1038/ngeo2232.
Sidorovskaia, N., B. Ma, A.S. Ackleh, C. Tiemann, G.E. Ioup, and J.W. Ioup. 2014. Acoustic studies of the effects of environmental stresses on marine mammals in large ocean basins. p. 1155 In: AGU Fall Meeting Abstracts, Vol. 1 Sierra-Flores R., T. Atack, H. Migaud, and A. Davie. 2015. Stress response to anthropogenic noise in Atlantic cod Gadus morhua L. Aquacult. Eng. 67:67–76.
Sills, J.M., B.L. Southall, and C. Reichmuth. 2017. The influence of temporally varying noise from seismic air guns on the detection of underwater sounds by seals. J. Acoust. Soc. Am. 141(2):996–1008.
Silva, M.A., R. Prieto, I. Cascão, M.I. Seabra, M. Machete, M.F. Baumgartner, and R.S. Santos. 2014. Spatial and temporal distribution of cetaceans in the mid-Atlantic waters around the Azores. Mar. Biol. Res. 10(2):123–137.
Simard, Y., F. Samaran, and N. Roy. 2005. Measurement of whale and seismic sounds in the Scotian Gully and adjacent canyons in July 2003. p. 97–115 In: K. Lee, H. Bain, and C.V. Hurley (eds.), Acoustic monitoring and marine mammal surveys in The Gully and outer Scotian Shelf before and during active seismic surveys. Environ. Stud. Res. Funds Rep. 151. 154 p. (Published 2007).
Sivle, L.D., P.H. Kvadsheim, and M.A. Ainslie. 2014. Potential for population-level disturbance by active sonar in herring. ICES J. Mar. Sci. 72:558–567.
Smith, T.D., J. Allen, P.J. Clapham, P.S. Hammond, S. Katona, F. Larsen, J. Lien, D. Mattila, P. Palsbøll, J. Sigurjónsson, P.T. Stevick, and N. Øien. 1999. An ocean-basin-wide mark-recapture study of the North Atlantic humpback whale (Megaptera novaeangliae). Mar. Mamm. Sci. 15(1):1–32.
Solé, M., M. Lenoir, M. Durfort, M. López-Bejar, A. Lombarte, M. van der Schaaer, and M. André. 2013. Does exposure to noise from human activities compromise sensory information from cephalopod statocysts? Deep-Sea Res. II 95:160–181.
Southall, B.L., A.E. Bowles, W.T. Ellison, J.J. Finneran, R.L. Gentry, C.R. Greene Jr., D. Kastak, D.R. Ketten, J.H. Miller, P.E. Nachtigall, W.J. Richardson, J.A. Thomas, and P.L. Tyack. 2007. Marine mammal noise exposure criteria: initial scientific recommendations. Aquat. Mamm. 33(4):411–522.
Southall, B.L., T. Rowles, F. Gulland, R.W. Baird, and P.D. Jepson. 2013. Final report of the Independent Scientific Review Panel investigating potential contributing factors to a 2008 mass stranding of melon- headed whales (Peponocephala electra) in Antsohihy, Madagascar. Accessed in March 2017 at http://www.agriculturedefensecoalition.org/sites/default/files/file/us_navy_new/271S_8_2013_Independent_ Scientific_Review_Panel_Contributing_Factors_Mass_Whale_Stranding_Madagascar_September_25_2013_ Final_Report.pdf.
Southall, B.L., D.P. Nowacek, P.J.O. Miller, and P.L. Tyack. 2016. Experimental field studies to measure behavioral responses of cetaceans to sonar. Endang. Species Res. 31:293–315.
Spotila, J.R. 2004. Sea turtles: A complete guide to their biology, behavior, and conservation. Johns Hopkins Univ. Press, Baltimore, MD. 227 p. St. Pierre, R. and F.M. Parauka (U.S. Fish & Wildlife Service). 2006. Acipenser oxyrinchus. (errata version published in 2016) The IUCN Red List of Threatened Species 2006:e.T245A107249015. Accessed in December 2017 at http://www.iucnredlist.org/details/245/0.
Stacey, P.J. and R.W. Baird. 1991. Status of the false killer whale, Pseudorca crassidens, in Canada.

Literature Cited
Draft Environmental Assessment for USGS Northwest Atlantic, 2018 Page 101
Can. Field-Nat. 105(2):189–197.
Stevick, P.T., J. Allen, P.J. Clapham, N. Friday, S.K. Katona, F. Larsen, J. Lien, D.K. Mattila, P.J. Palsbøll, J. Sigurjónsson, T.D. Smith, N. Øien, and P.S. Hammond. 2003. North Atlantic humpback whale abundance and rate of increase four decades after protection from whaling. Mar. Ecol. Prog. Ser. 258:263–273.
Stewart, B.S. and S. Leatherwood. 1985. Minke whale Balaenoptera acutorostrata Lacépède, 1804. p. 91–136 In: S.H. Ridgway and R. Harrison (eds.), Handbook of marine mammals, Vol. 3: The sirenians and baleen whales. Academic Press, London, U.K. 362 p.
Stewart, K.R., M.C. James, S. Roden, and P.H. Dutton. 2013. Assignment tests, telemetry and tag-recapture data converge to identify natal origins of leatherback turtles foraging in Atlantic Canadian waters. J. Animal Ecol. 82:791–803.
Stone, C.J. 2015. Marine mammal observations during seismic surveys from 1994–2010. JNCC Rep. No. 463a. 64 p.
Streever, B., S.W. Raborn, K.H. Kim, A.D. Hawkins, and A.N. Popper. 2016. Changes in fish catch rates in the presence of air gun sounds in Prudhoe Bay, Alaska. Arctic [Suppl. l] 69(4):346–358.
Supin, A., V. Popov, D. Nechaev, E.V. Sysueva, and V. Rozhnov. 2016. Is sound exposure level a convenient metric to characterize fatiguing sounds? A study in beluga whales. p. 1123–1129 In: A.N. Popper and A. Hawkins (eds.), The effects of noise on aquatic life II. Springer, New York, NY. 1292 p.
Sychenko, O., G. Gailey, R. Racca, A. Rutenko, L. Aerts, and R. Melton. 2017. Gray whale abundance and distribution relative to three seismic surveys near their feeding habitat in 2015. Abstract and presentation at the Society for Marine Mammalogy’s 22nd Biennial Conference on the Biology of Marine Mammals, 22–27 October, Halifax, Nova Scotia, Canada.
Teilmann, J., D.M. Wisniewska, M. Johnson, L.A. Miller, U. Siebert, R. Dietz, S. Sveegaard, A. Galatius, and P.T. Madsen. 2015. Acoustic tags on wild harbour porpoises reveal context-specific reactions to ship noise. In 18. Danske Havforskermøde.
Tenessen, J.B. and S.E. Parks. 2016. Acoustic propagation modeling indicates vocal compensation in noise improves communication range for North Atlantic right whales. Endang. Species Res. 30:225–237. Terhune, J.M. and T. Bosker. 2016. Harp seals do not increase their call frequencies when it gets noisier. p. 1149–1153 In: A.N. Popper and A. Hawkins (eds.), The effects of noise on aquatic life II. Springer, New York, NY. 1292 p.
TEWG (Turtle Expert Working Group). 2007. An assessment of the leatherback turtle population in the Atlantic Ocean. NOAA Technical Memorandum NMFS-SEFSC-555. 116 p.
Thode, A.M., K.H. Kim, S.B. Blackwell, C.R. Greene, Jr., C.S. Nations, T.L. McDonald, and A.M. Macrander. 2012. Automated detection and localization of bowhead whale sounds in the presence of seismic airgun surveys. J. Acoust. Soc. Am. 131(5):3726–3747.
Thompson, D., M. Sjöberg, E.B. Bryant, P. Lovell, and A. Bjørge. 1998. Behavioural and physiological responses of harbour (Phoca vitulina) and grey (Halichoerus grypus) seals to seismic surveys. Abstr. World Mar. Mamm. Sci. Conf., Monaco.
Thompson, P.M., K.L. Brookes, I.M. Graham, T.R. Barton, K. Needham, G. Bradbury, and N.D. Merchant. 2013. Short-term disturbance by a commercial two-dimensional seismic survey does not lead to long-term displacement of harbour porpoises. Proc. Royal Soc. B 280:20132001.
Tolstoy, M., J. Diebold, L. Doermann, S. Nooner, S.C. Webb, D.R. Bohenstiehl, T.J. Crone, and R.C. Holmes. 2009. Broadband calibration of R/V Marcus G. Langseth four-string seismic sources. Geochem. Geophys. Geosyst. 10, Q08011, doi:10.1029/2009GC002451.
Tougaard, J., A.J. Wright, and P.T. Madsen. 2015. Cetacean noise criteria revisited in light of proposed exposure limits for harbour porpoises. Mar. Poll. Bull. 90(1–2):196–208.

Literature Cited
Draft Environmental Assessment for USGS Northwest Atlantic, 2018 Page 102
Tougaard, J., A.J. Wright, and P.T. Madsen. 2016. Noise exposure criteria for harbor porpoises. p. 1167–1173 In: A.N. Popper and A. Hawkins (eds.), The effects of noise on aquatic life II. Springer, New York, NY. 1292 p.
Triezenberg, P. J., Hart, P. E., and Childs, J. R., 2016, National Archive of Marine Seismic Surveys (NAMSS): A USGS data website of marine seismic reflection data within the U.S. Exclusive Economic Zone (EEZ): U.S. Geological Survey Data Release, doi: 10.5066/F7930R7P.
Tyack, P.L. and V.M. Janik. 2013. Effects of noise on acoustic signal production in marine mammals. p. 251–271 In: H. Brumm (ed.), Animal communication and noise. Springer, Berlin, Heidelberg, Germany. 453 p.
Tyson, R.B., W.E.D. Piniak, C. Domit, D. Mann, M. Hall, D.P. Nowacek, and M.M.P.B. Fuentes. 2017. Novel bio-logging tool for studying fine-scale behaviors of marine turtles in response to sound. Front. Mar. Sci. 4:219. http://dx.doi.org/doi:10.3389/fmars.2017.00219.
UNEP-WCMC (United Nations Environment Programme-World Conservation Monitoring Centre). 2017. Convention on International Trade in Endangered Species of Wild Flora and Fauna. Appendices I, II, and II. Valid from 4 October 2017. Accessed in December 2017 at http://www.cites.org/eng/app/appendices.php.
USCG (United States Coast Guard). 2016. AMVER density plots. Accessed in March 2018 http://www.amver.com/.
USFWS (United States Fish and Wildlife Service). 1995. Endangered and threatened wildlife and plants; Addition of 30 African Species to List of Endangered and Threatened Wildlife. Final Rule. Fed. Reg. 60(8, 12 Jan.):2899–2905.
USFWS. 2007. Endangered and Threatened Wildlife and Plants; 5-Year Status Review of 16 Southeastern Species. Fed. Reg. 72(183 Sep.):54057–54059.
USFWS. 2010. Endangered and Threatened Wildlife and Plants; 5-Year Status Review of Roseate Tern. Fed. Reg. 75(64 Apr.):17153–17154. USGS, 2013. Record of Decision on the NSF-USGS PEIS. Accessible at: https://woodshole.er.usgs.gov/project-pages/environmental_compliance/reports/FINAL_USGSROD_textonly_signed27Feb2013.pdf USN (U.S. Navy). 2017. Criteria and thresholds for U.S. Navy Acoustic and Explosive Effects Analysis (Phase III). Technical Report prepared by the U.S. Navy Van der Wal, S., S.A. Eckert, J.O. Lopez-Plana, W. Hernandez, and K.L. Eckert. 2016. Innovative measures for mitigating potential impacts on sea turtles during seismic surveys. Paper SPE-179215-MS presented at the SPE International Conference and Exhibition on Health, Safety, Security, Environment, and Social Responsibility. 11–13 April 2016, Stavanger, Norway. 11 p. Verity, P. G., and coauthors. 1993. Outer shelf processes. Pages 45-74 in D. W. Menzel, editor. Ocean Processes: U. S. Southeast Continental Shelf: A Summary of Research Conducted in the South Atlantic Bight under the Auspices of the U.S. Department of Energy from 1977 to 1991, volume DOE/OSTI-11674. U.S. Department of Energy, Washington, D.C.
Vilela, R., U. Pena, R. Esteban, and R. Koemans. 2016. Bayesian spatial modeling of cetacean sightings during a seismic acquisition survey. Mar. Poll. Bull. 109(1):512–520.
Wade, P.R. and T. Gerrodette. 1993. Estimates of cetacean abundance and distribution in the eastern tropical Pacific. Rep. Int. Whal. Comm. 43:477–493.
Wale, M.A., S.D. Simpson, and A.N. Radford. 2013a. Size-dependent physiological responses of shore crabs to single and repeated playback of ship noise. Biol. Lett. 9:20121194.
Wale, M.A., S.D. Simpson, and A.N. Radford. 2013b. Noise negatively affects foraging and antipredator behaviour in shore crabs. Anim. Behav. 86:111–118.
Wallace, B.P., C.Y. Kot, A.D. DiMatteo, T. Lee, L.B. Crowder, and R.L. Lewison. 2013. Impacts of fisheries bycatch on marine turtle populations worldwide: Toward conservation and research priorities. Ecosphere 4(3): http://dx.doi.org/10.1890/ES12-00388.1.

Literature Cited
Draft Environmental Assessment for USGS Northwest Atlantic, 2018 Page 103
Walker, J.L., C.W. Potter, and S.A. Macko. 1999. The diets of modern and historic bottlenose dolphin populations reflected through stable isotopes. Mar. Mamm. Sci. 15(2):335–350.
Wang, M.C., W.A. Walker, K.T. Shao, and L.S. Chou. 2002. Comparative analysis of the diets of pygmy sperm whales and dwarf sperm whales in Taiwanese waters. Acta Zool. Taiwan 13(2):53–62.
Waring G.T., L. Nøttestad, E. Olsen, H. Skov, and G. Víkingsson. 2008. Distribution and density estimates of cetaceans along the mid-Atlantic Ridge during summer 2004. J. Cetac. Res. Manage. 10:137–146.
Wartzok, D., A.N. Popper, J. Gordon, and J. Merrill. 2004. Factors affecting the responses of marine mammals to acoustic disturbance. Mar. Technol. Soc. J. 37(4):6–15.
Watkins, W.A. and K.E. Moore. 1982. An underwater acoustic survey for sperm whales (Physeter catodon) and other cetaceans in the southeast Caribbean. Cetology 46:1–7.
Weilgart, L.S. 2007. A brief review of known effects of noise on marine mammals. Int. J. Comp. Psychol. 20:159–168.
Weilgart, L.S. 2014. Are we mitigating underwater noise-producing activities adequately? A comparison of Level A and Level B cetacean takes. Working pap. SC/65b/E07. Int. Whal. Comm., Cambridge, U.K. 17 p. Weir, C.R. 2007. Observations of marine turtles in relation to seismic airgun sound off Angola. Mar. Turtle Newsl. 116:17–20.
Weir, C.R. and S.J. Dolman. 2007. Comparative review of the regional marine mammal mitigation guidelines implemented during industrial seismic surveys, and guidance towards a worldwide standard. J. Int. Wildl. Law Policy 10(1):1–27.
Weller, D.W., Y.V. Ivashchenko, G.A. Tsidulko, A.M. Burdin, and R.L. Brownell, Jr. 2002. Influence of seismic surveys on western gray whales off Sakhalin Island, Russia in 2001. Paper SC/54/BRG14, IWC, Western Gray Whale Working Group Meet., 22–25 Oct., Ulsan, South Korea. 12 p.
Weller, D.W., S.H. Rickards, A.L. Bradford, A.M. Burdin, and R.L. Brownell, Jr. 2006a. The influence of 1997 seismic surveys on the behavior of western gray whales off Sakhalin Island, Russia. Paper SC/58/E4 presented to the IWC Scient. Commit., IWC Annu. Meet., 1–13 June, St. Kitts.
Weller, D.W., G.A. Tsidulko, Y.V. Ivashchenko, A.M. Burdin and R.L. Brownell, Jr. 2006b. A re-evaluation of the influence of 2001 seismic surveys on western gray whales off Sakhalin Island, Russia. Paper SC/58/E5 presented to the IWC Sci. Commit., IWC Annu. Meet., 1–13 June, St. Kitts.
Weller, D.W., A. Klimek, A.L. Bradford, J. Calambokidis, A.R. Lang, B. Gisborne, A.M. Burdin, W. Szaniszlo, J. Urbán, A.G.G. Unzueta, and S. Swartz. 2012. Movements of gray whales between the western and eastern North Pacific. Endang. Species Res. 18(3):193–199.
Wensveen, P.J., L.A.E. Huijser, L. Hoek, and R.A. Kastelein. 2014. Equal latency contours and auditory weighting functions for the harbour porpoise (Phocoena phocoena). J. Exp. Biol. 217(3):359–369.
Wensveen, P.J., A.M. von Benda-Beckmann, M.A. Ainslie, F.P.A. Lam, P.H. Kvadsheim, P.L. Tyack, and P.J.O. Miller. 2015. How effectively do horizontal and vertical response strategies of long-finned pilot whales reduce sound exposure from naval sonar? Mar. Environ. Res. 106:68–81.
Wenzel, F.W., J. Allen, S. Berrow, C.J. Hazevoet, B. Jann, R. E. Seton, L. Steiner, P. Stevick, P. López Suárez, and P. Whooley. 2009. Current knowledge on the distribution and relative abundance of humpback whales (Megaptera novaeangliae) off the Cape Verde Islands, eastern North Atlantic. Aquatic Mamm. 35(4):502–510.
Whitehead, H. 2002. Estimates of the current global population size and historical trajectory for sperm whales. Mar. Ecol. Prog. Ser. 242:295–304.
Whitehead, H. 2009. Sperm whale Physeter macrocephalus. p. 1091–1097 In: W.F. Perrin, B. Würsig, and J.G.M. Thewissen (eds.), Encyclopedia of marine mammals, 2nd edit. Academic Press, San Diego, CA. 1316 p.
Whitehead, H. and S. Waters. 1990. Social organization and population structure of sperm whales off the Galápagos Islands, Ecuador (1985–1987). Rep. Int. Whal. Comm. Spec. Iss. 12:249–257.

Literature Cited
Draft Environmental Assessment for USGS Northwest Atlantic, 2018 Page 104
Whitt, A.D., K. Dudzinski, and J.R. Laliberté. 2013. North Atlantic right whale distribution and seasonal occurrence in nearshore waters off New Jersey, U.S.A., and implications for management. Endang. Species Res. 20:59–69.
Wiley, D.N., C.A. Mayo, E.M. Maloney, and M.J. Moore. 2016. Vessel strike mitigation lessons from direct observations involving two collisions between noncommercial vessels and North Atlantic right whales (Eubalaena glacialis). Mar. Mamm. Sci. 32(4):1501–1509.
Williams, T.M, W.A. Friedl, M.L. Fong, R.M. Yamada, P. Sideivy, and J.E. Haun. 1992. Travel at low energetic cost by swimming and wave-riding bottlenose dolphins. Nature 355(6363):821–823.
Willis, K.L., J. Christensen-Dalsgaard, D.R. Ketten, and C.E. Carr. 2013. Middle ear cavity morphology is consistent with an aquatic origin for testudines. PLoS One 8(1):e54086. http://dx.doi.org/doi:10.1371/ journal.pone.0054086.
Winn, H.E. and N.E. Reichley. 1985. Humpback whale Megaptera novaeangliae (Borowski, 1781). p. 241–273 In: S.H. Ridgway and R. Harrison (eds.), Handbook of marine mammals, Vol. 3: The sirenians and baleen whales. Academic Press, London, U.K. 362 p.
Winn, H.E., C.A. Price, and P.W. Sorensen. 1986. The distributional biology of the right whale (Eubalaena glacialis) in the western North Atlantic. Rep. Int. Whal. Comm. Spec. Iss. 10:129–138.
Witherington, B.E. 2002. Ecology of neonate loggerhead turtles inhabiting lines of downwelling near a Gulf Stream front. Mar. Biol. 140:843–853.
Wittekind, D., J. Tougaard, P. Stilz, M. Dähne, K. Lucke, C.W. Clark, S. von Benda-Beckmann, M. Ainslie, and U. Siebert. 2016. Development of a model to assess masking potential for marine mammals by the use of airguns in Antarctic waters. p. 1243–1249 In: A.N. Popper and A. Hawkins (eds.), The effects of noise on aquatic life II. Springer, New York, NY. 1292 p.
Wright, A.J. 2014. Reducing impacts of human ocean noise on cetaceans: Knowledge gap analysis and recommendations. 98 p. World Wildlife Fund Global Arctic Programme, Ottawa, ON.
Wright, A.J. and A.M. Consentino. 2015. JNCC guidelines for minimizing the risk of injury and disturbance to marine mammals from seismic surveys: we can do better. Mar. Poll. Bull. 100(1):231–239. http://dx.doi.org/doi:10.1016/j.marpolbul.2015.08.045.
Wright, A.J., T. Deak, and E.C.M. Parsons. 2011. Size matters: Management of stress responses and chronic stress in beaked whales and other marine mammals may require larger exclusion zones. Mar. Poll. Bull. 63(1–4):5–9.
Wole, O.G. and E.F. Myade. 2014. Effect of seismic operations on cetacean sightings off-shore Akwa Ibom State, south-south, Nigeria. Int. J. Biol. Chem. Sci. 8(4):1570–1580.
Würsig, B., S.K. Lynn, T.A. Jefferson, and K.D. Mullin. 1998. Behaviour of cetaceans in the northern Gulf of Mexico relative to survey ships and aircraft. Aquat. Mamm. 24(1):41–50.
Würsig, B.G., D.W. Weller, A.M. Burdin, S.H. Reeve, A.L Bradford, S.A. Blokhin, and R.L Brownell, Jr. 1999. Gray whales summering off Sakhalin Island, Far East Russia: July–October 1997. A joint U.S.-Russian scientific investigation. Final Report. Rep. from Texas A&M Univ., College Station, TX, and Kamchatka Inst. Ecol. & Nature Manage., Russian Acad. Sci., Kamchatka, Russia, for Sakhalin Energy Investment Co. Ltd. and Exxon Neftegaz Ltd., Yuzhno-Sakhalinsk, Russia. 101 p.
Yazvenko, S.B., T.L. McDonald, S.A. Blokhin, S.R. Johnson, S.K. Meier, H.R. Melton, M.W. Newcomer, R.M. Nielson, V.L. Vladimirov, and P.W. Wainwright. 2007a. Distribution and abundance of western gray whales during a seismic survey near Sakhalin Island, Russia. Environ. Monit. Assess. 134(1–3):45–73. http://dx.doi.org/doi:10.1007/s10661-007-9809-9. Yazvenko, S.B., T.L. McDonald, S.A. Blokhin, S.R. Johnson, H.R. Melton, and M.W. Newcomer. 2007b. Feeding activity of western gray whales during a seismic survey near Sakhalin Island, Russia. Environ. Monit. Assess. 134(1–3): 93–106. http://dx.doi.org/doi:10.1007/s10661-007-9810-3.
Yochem, P.K. and S. Leatherwood. 1985. Blue whale. p. 193–240 In: S.H. Ridgway and R Harrison (eds.), Handbook of marine mammals, Vol. 3: The sirenians and baleen whales. Academic Press, New York, NY. 362 p.
Appendices
Draft Environmental Assessment for USGS Northwest Atlantic, 2018 Page 105
APPENDICES
In accordance with deliberations underway at the Council on Environmental Quality and the order of the Secretary of the Interior dated August 31, 2017 (Secretary’s Order 3355) on “Streamlining National Environmental Policy Reviews and Implementation of Executive Order 13807, “Establishing Discipline and Accountability in the Environmental Review and Permitting Process for Infrastructure Projects,” this Draft EA has incorporated by reference and taken verbatim from existing Draft EAs (particularly the Draft Scripps EA (LGL, 2017)) whenever possible. In addition, material not necessary in the core of this Draft EA document has been shifted to the appendices. In some cases, these appendices provide material nearly verbatim from the Draft Scripps EA (LGL, 2017). This text is provided here for the convenience of reviewers, even though it is considered fully incorporated by reference within this Draft EA.
Appendix A: Backup Configuration Information and Calculations
In the case of compressor failure or other equipment problems, the airguns could be operated in the backup, 2 GI gun, configuration. The exclusion/mitigation zones for this configuration are significantly smaller than those for the configurations (Base and GG) targeted for the Optimal and Base Surveys. Thus, takes calculated for the other configurations are larger and therefore more conservative than applicable to the Backup Configuration. For the sake of completeness, information about the backup configuration is provided here and calculations of the sound source levels are given in Appendix C.
Backup Configuration (Configuration 3) is 2 GI guns producing 210 in3 total volume, as shown in Figure 4. If a compressor were offline, this lowest-energy configuration would be used to sustain data acquisition. Guns will be towed at 3 m water depth of the port towpoint on the stern, with 2 m front-to-back separation between the guns.

Appendices
Draft Environmental Assessment for USGS Northwest Atlantic, 2018 Page 106
Figure A1. Backup configuration (Source configuration 3): 210 in3 total volume consisting of 2x10⁵/105in3 GI guns firing in standard GI mode. Guns are labelled as S#G*, where # is the side and * is the gun number.

Appendices
Draft Environmental Assessment for USGS Northwest Atlantic, 2018 Page 107
FIGURE 8. Modeled deep-water received sound exposure levels (SELs) from the backup configuration (Configuration 3; two 105 in3 GI-guns) at a 3-m tow depth. Received rms levels (SPLs) are expected to be ~10 dB higher. The plot at the top provides the radius to the 170-dB SEL isopleth as a proxy for the 180-dB rms isopleth, and the plot at the bottom provides the radius to the 150 and 165-dB SEL isopleths as a proxy for the 160 and 175-dB rms isopleths, respectively. The upper plot is a blow-up of the lower plot.

Appendices
Draft Environmental Assessment for USGS Northwest Atlantic, 2018 Page 108
Appendix B: Sound Exposure Levels (SEL): Scaling Analyses and All Results SEL (dB) associated with airgun arrays tested in the Gulf of Mexico as part of Tolstoy et al. (2009). These values are used to scale calculations conducted by L-DEO for the Proposed Action.
FIGURE B1. Modeled deep-water received sound exposure levels (SELs) from the 36-airgun array at a 6-m tow depth used during the GoM calibration survey. These values are used along with a scaling factor to determine SELs for shallow-water deployments with the three proposed configurations. Received rms levels (SPLs) are expected to be ~10 dB higher. The plot at the top provides the radius to the 170 dB SEL isopleth as a proxy for the 180-dB rms isopleth, and the plot at the bottom provides the radius to the 150-dB SEL isopleth as a proxy for the 160-dB rms isopleth.
For the Base Configuration (Configuration 1):

Appendices
Draft Environmental Assessment for USGS Northwest Atlantic, 2018 Page 109
- the 150-decibel (dB) Sound Exposure Level (SEL)3 corresponds to deep-water maximum radii of 1090.6 m for the four 105 in3 airguns at 3 m tow depth (Fig. 5), and 7,244 m for the 6600 in3 at 6-m tow depth, yielding scaling factors of 0.151 to be applied to the shallow-water 6-m tow depth results.
- the 165-decibel (dB) Sound Exposure Level (SEL) corresponds to deep-water maximum radii of 193.94 m for the four 105 in3 airguns at 3 m tow depth, and 1,284 m for a 6-m tow depth, yielding a scaling factor of 0.151 to be applied to the shallow-water 6-m tow depth results.
- Similarly, the 170 dB SEL corresponds to deep-water maximum radii of 109.72 for the four 105 in3 airguns at 3 m tow depth (Fig. 2) and 719 m for the 6600 in3 at 6-m tow depth (Fig. 4), yielding the same 0.152 scaling factor. - the 185-decibel (dB) Sound Exposure Level (SEL) corresponds to deep-water maximum radii of 19.89 m for the four 105 in3 at 3-m tow depth, and 126.3 m for a 6-m tow depth, yielding a scaling factor of 0.157 to be applied to the shallow-water 6-m tow depth results.
Measured 160-, 175-, 180-, 190- and 195-dB re 1µParms distances in shallow water for the 36-airgun R/V
Langseth array towed at 6 m depth were 17.5 km, 2.84 km, 1.6 km, 458 m and 240 m, respectively, based on a 95th percentile fit (Tolstoy et al. 2009). Multiplying by the scaling factors to account for the tow depth and discharge volume differences between the 6600 cu.in airgun array at 6 m tow depth and the USGS Proposed Action Base Configuration, the 420 cu.in airgun array at 3 m tow depth yields distances of 2.642 km, 429 m, 243 m, 71 m and 38 m, respectively.
For the GG Configuration (Configuration 2):
- the 150-decibel (dB) Sound Exposure Level (SEL) corresponds to deep-water maximum radii of 1,244 m for the four 210 in3 airguns at 3 m tow depth (Fig. 6), and 7,244 m for the L-DEO 6600 in3 at 6-m tow depth (Fig. 8), yielding scaling factors of 0.172 to be applied to the shallow-water 6-m tow depth results.
- the 165-decibel (dB) Sound Exposure Level (SEL) corresponds to deep-water maximum radii of 219.54 m for the four 210 in3 airguns at 3 m tow depth, and 1,284 m for a 6-m tow depth, yielding a scaling factor of 0.171 to be applied to the shallow-water 6-m tow depth results.
- Similarly, the 170 dB SEL corresponds to deep-water maximum radii of 124.72 for the four 210 in3 airguns at 3 m tow depth (Fig. 2) and 719 m for the 6600 in3 at 6-m tow depth (Fig. 4), yielding the same 0.173 scaling factor. - the 185-decibel (dB) Sound Exposure Level (SEL) corresponds to deep-water maximum radii of 22.69 m for the four 210 in3 at 3-m tow depth, and 126.3 m for a 6-m tow depth, yielding a scaling factor of 0.179 to be applied to the shallow-water 6-m tow depth results.
Measured 160-, 175-, 180-, 190- and 195-dB re 1µParms distances in shallow water for the 36-airgun R/V
Langseth array towed at 6 m depth were 17.5 km, 2.84 km, 1.6 km, 458 m and 240 m, respectively, based on a 95th percentile fit (Tolstoy et al. 2009). Multiplying by the scaling factors to account for the tow depth and discharge volume differences between the 6600 cu.in airgun array at 6 m tow depth and the 840 cu.in airgun array at 3 m tow depth yields distances of 3.01 km, 485 m, 277 m, 80 m and 43 m, respectively.
For the Backup Configuration (Configuration 3):
____________________________________ 3 SEL (measured in dB re 1 μPa2 · s) is a measure of the received energy in the pulse and represents the SPL that would
be measured if the pulse energy were spread evenly across a 1-s period. Because actual seismic pulses are less than 1 s in duration in most situations, this means that the SEL value for a given pulse is usually lower than the SPL calculated for the actual duration of the pulse. In this EA, we assume that rms pressure levels of received seismic pulses would be 10 dB higher than the SEL values predicted by L-DEO’s model.

Appendices
Draft Environmental Assessment for USGS Northwest Atlantic, 2018 Page 110
- the 150-decibel (dB) Sound Exposure Level (SEL) corresponds to deep-water maximum radii of 578.152 m for the two 105 in3 airguns at 3 m tow depth (Fig. 7), and 7,244 m for the 6600 in3 at 6-m tow depth (Fig. 8), yielding scaling factors of 0.080 to be applied to the shallow-water 6-m tow depth results.
- the 165-decibel (dB) Sound Exposure Level (SEL) corresponds to deep-water maximum radii of 102.37 m for the two 105 in3 airguns at 3 m tow depth, and 1,284 m for a 6-m tow depth, yielding a scaling factor of 0.080 to be applied to the shallow-water 6-m tow depth results.
- Similarly, the 170 dB SEL corresponds to deep-water maximum radii of 58.395 for the two 105 in3 airguns at 3 m tow depth (Fig. 2) and 719 m for the 6600 in3 at 6-m tow depth (Fig. 4), yielding the same 0.081 scaling factor. - the 185-decibel (dB) Sound Exposure Level (SEL) corresponds to deep-water maximum radii of 11.343 m for the two 105 in3 at 3-m tow depth, and 126.3 m for a 6-m tow depth, yielding a scaling factor of 0.089 to be applied to the shallow-water 6-m tow depth results.
Measured 160-, 175-, 180-, 190- and 195-dB re 1µParms distances in shallow water for the 36-airgun R/V
Langseth array towed at 6 m depth were 17.5 km, 2.84 km, 1.6 km, 458 m and 240 m, respectively, based on a 95th percentile fit (Tolstoy et al. 2009). Multiplying by the scaling factors to account for the tow depth and discharge volume differences between the 6600 cu.in airgun array at 6 m tow depth and the 110 cu.in airgun array at 3 m tow depth yields distances of 1.4 km, 227 m, 130 m, 38 m and 21 m, respectively.
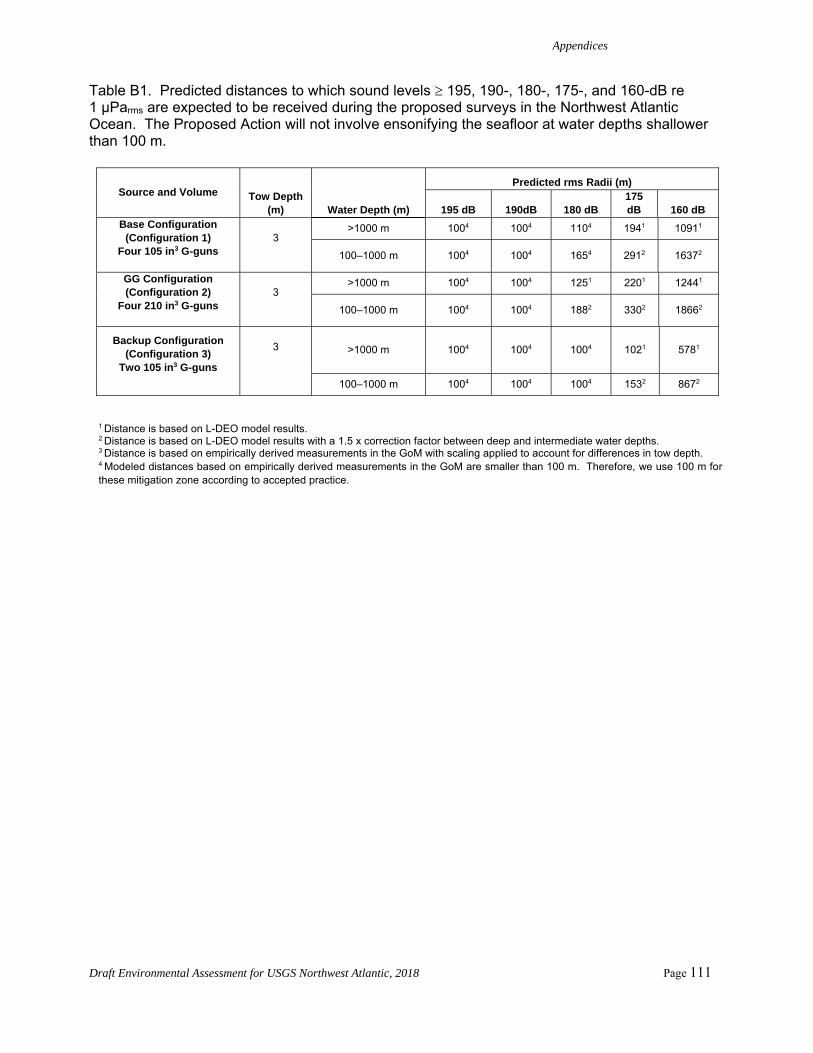
Appendices
Draft Environmental Assessment for USGS Northwest Atlantic, 2018 Page 111
Table B1. Predicted distances to which sound levels 195, 190-, 180-, 175-, and 160-dB re 1 μParms are expected to be received during the proposed surveys in the Northwest Atlantic Ocean. The Proposed Action will not involve ensonifying the seafloor at water depths shallower than 100 m.
Source and Volume Tow Depth (m) Water Depth (m)
Predicted rms Radii (m)
195 dB 190dB 180 dB 175 dB 160 dB
Base Configuration (Configuration 1)
Four 105 in3 G-guns
3
>1000 m 1004 1004 1104 1941 10911
100–1000 m 1004 1004 1654 2912 16372
GG Configuration (Configuration 2)
Four 210 in3 G-guns
3
>1000 m 1004 1004 1251 2201 12441
100–1000 m 1004 1004 1882 3302 18662
Backup Configuration (Configuration 3)
Two 105 in3 G-guns
3
>1000 m 1004 1004 1004 1021 5781
100–1000 m 1004 1004 1004 1532 8672
1 Distance is based on L-DEO model results. 2 Distance is based on L-DEO model results with a 1.5 x correction factor between deep and intermediate water depths. 3 Distance is based on empirically derived measurements in the GoM with scaling applied to account for differences in tow depth. 4 Modeled distances based on empirically derived measurements in the GoM are smaller than 100 m. Therefore, we use 100 m for these mitigation zone according to accepted practice.

Appendices
Draft Environmental Assessment for USGS Northwest Atlantic, 2018 Page 112
Appendix C. Supporting Documentation for Level A Acoustic Modeling The following information was provided by Dr. Anne Bécel at Lamont-Doherty Earth Observatory based on modeling methodology previously applied in EAs for NSF-funded programs. The documentation is provided verbatim, with modifications only to eliminate redundancies, to clarify how the different components relate to the Proposed Action, and to ensure consistency in terminology across this Draft EA. BASE CONFIGURATION: 4 x 10⁵ cu.in – 2 m separation aft-fore direction and 8.6 m separation in the port-starboard direction @ a 3 m tow depth SELcum methodology (spreadsheet – Sivle et al., 2014)
Source Velocity (meters/second) 2.05778* 1/Repetition rate^ (seconds) 12.149**
† Methodology assumes propagation of 20 log R; Activity duration (time) independent ^ Time between onset of successive pulses. * 4 kts Table C1: Table showing the results for one single SEL SL modeling without and with applying weighting function to the 5 hearing groups. The modified farfield signature is estimated using the distance from the source array geometrical center to where the SELcum threshold is the largest. A propagation is of 20 log10 (Radial distance) is used to estimate the modified farfield SEL.
SELcum Threshold 183 dB 185 dB 155 dB 185 dB 203 dB Distance(m) (no weighting function)
34.3541 28.0537 907.6353 28.0537 N/A (<1m)
Modified Farfield SEL*
213.7196 213.9598 214.1582 213.9598 203
Distance (m) (with weighting function)
15.6980 N/A N/A N/A N/A
Adjustment (dB) -6.80 N/A N/A
N/A N/A
* Propagation of 20 log R
For the Low Frequency Cetaceans, we estimated a new adjustment value by computing the distance from the geometrical center of the source to where the 183dB SEL cum isopleth is the largest. We first run the modeling for one single shot without applying any weighting function. The maximum 183dB SEL cum isopleth is located at 34.35 m from the source. We then run the modeling for one single shot with the low frequency Cetaceans weighting function applied to the full spectrum. The maximum 183 dB SEL cum isopleth is located at 15.69 m from the source. Difference between 34.35 m and 15.69 m gives an adjustment factor of -6.80 dB assuming a propagation of 20log10(R).

Appendices
Draft Environmental Assessment for USGS Northwest Atlantic, 2018 Page 113
TABLE C2. Results for single shot SEL source level modeling for the four 105 in3 airguns with weighting function calculations for SELcum criteria.
Hearing Group Low-Frequency Cetaceans
Mid-Frequency Cetaceans
High-Frequency Cetaceans
Phocid Pinnipeds
Otariid Pinnipeds
SELcum Threshold
183 185 155 185 203
PTS SELcum Isopleth to threshold (meters)
31.0 0.0 0.0 0.4 0.0
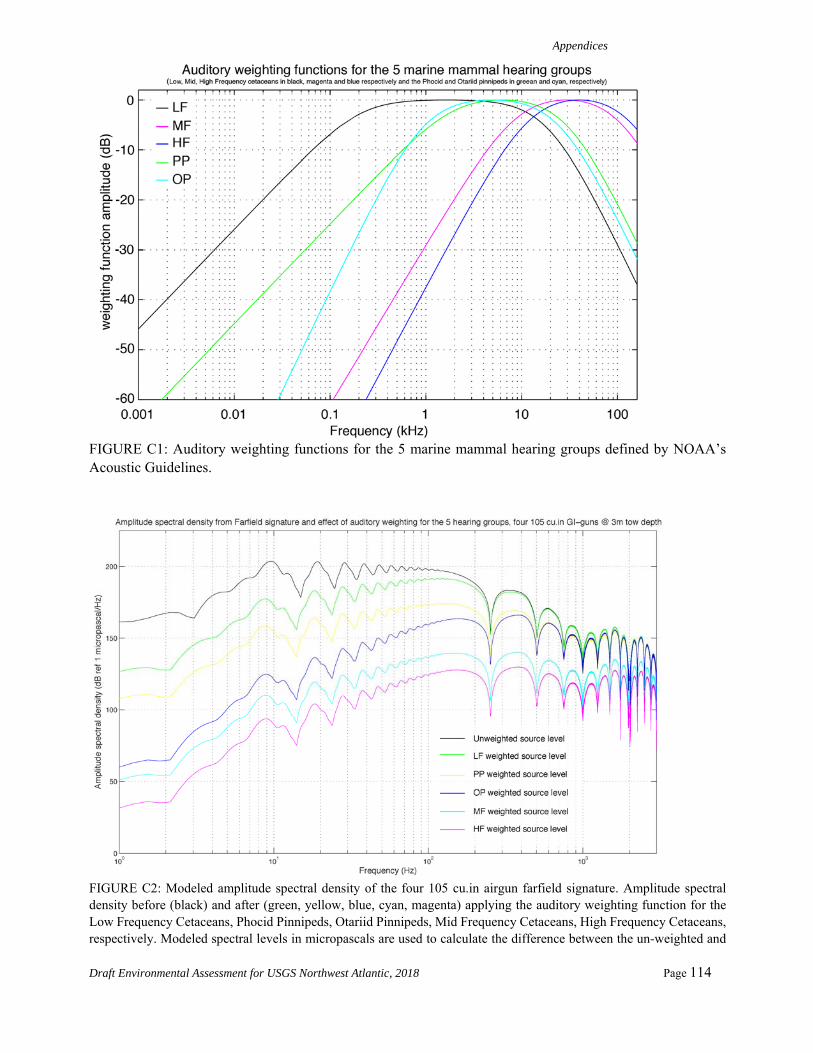
Appendices
Draft Environmental Assessment for USGS Northwest Atlantic, 2018 Page 114
FIGURE C1: Auditory weighting functions for the 5 marine mammal hearing groups defined by NOAA’s Acoustic Guidelines.
FIGURE C2: Modeled amplitude spectral density of the four 105 cu.in airgun farfield signature. Amplitude spectral density before (black) and after (green, yellow, blue, cyan, magenta) applying the auditory weighting function for the Low Frequency Cetaceans, Phocid Pinnipeds, Otariid Pinnipeds, Mid Frequency Cetaceans, High Frequency Cetaceans, respectively. Modeled spectral levels in micropascals are used to calculate the difference between the un-weighted and

Appendices
Draft Environmental Assessment for USGS Northwest Atlantic, 2018 Page 115
weighted source level at each frequency and to derive the adjustment factors for the Phocid Pinnipeds, Otariid Pinnipeds, Mid Frequency Cetaceans, and High Frequency Cetaceans as inputs into the NMFS user spreadhseet.
FIGURE C3: Modeled received sound levels (SELs) in deep water from the four 105 cu.in GI-guns at a 3-m tow depth. The plot provides the distance from the geometrical center of the source array to the 155-dB SEL isopleth (907.6 m).
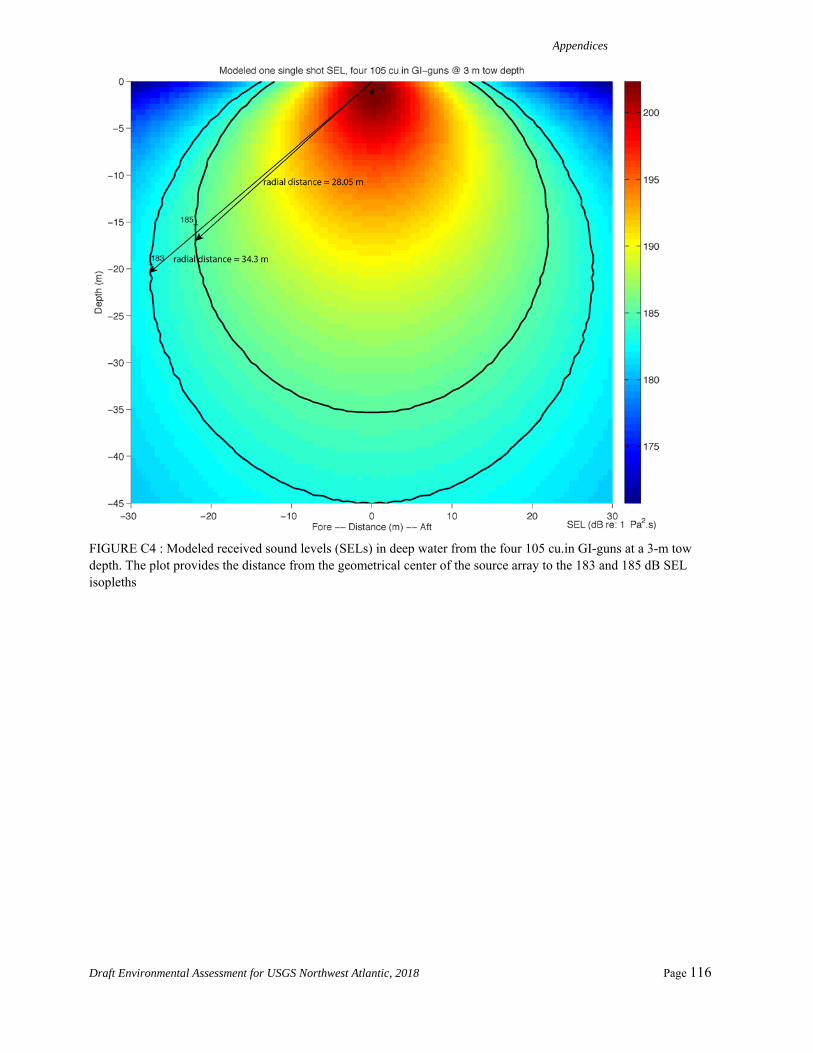
Appendices
Draft Environmental Assessment for USGS Northwest Atlantic, 2018 Page 116
FIGURE C4 : Modeled received sound levels (SELs) in deep water from the four 105 cu.in GI-guns at a 3-m tow depth. The plot provides the distance from the geometrical center of the source array to the 183 and 185 dB SEL isopleths
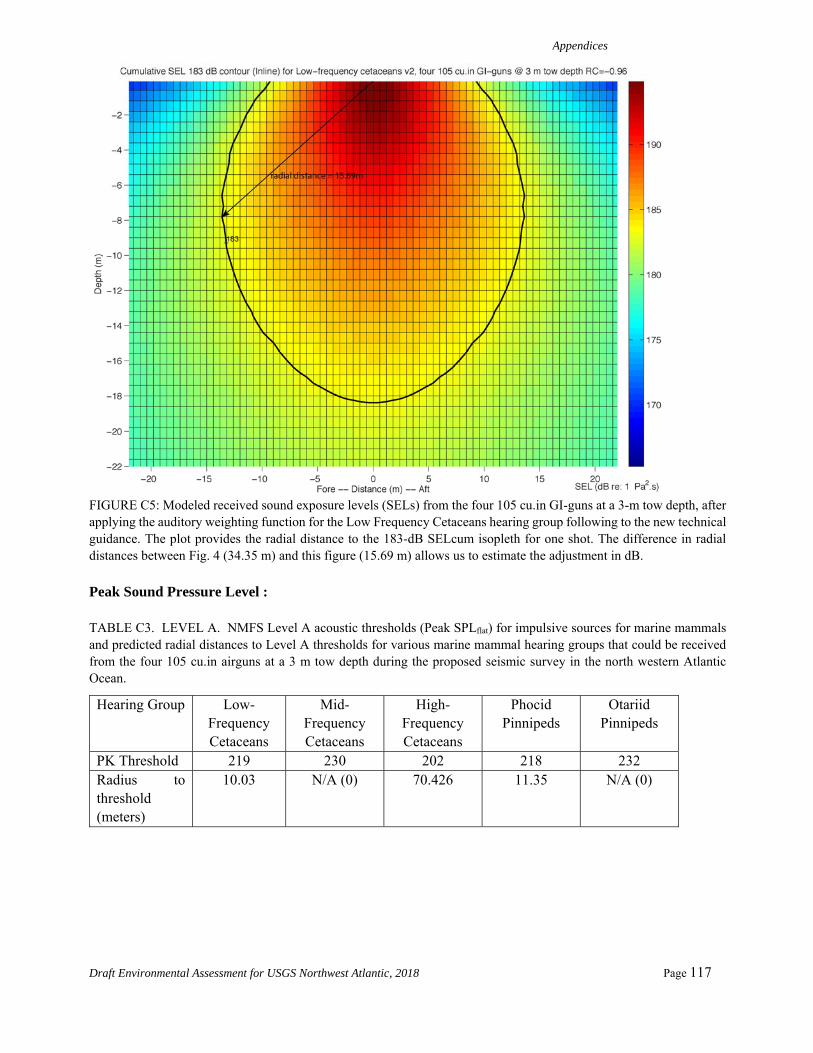
Appendices
Draft Environmental Assessment for USGS Northwest Atlantic, 2018 Page 117
FIGURE C5: Modeled received sound exposure levels (SELs) from the four 105 cu.in GI-guns at a 3-m tow depth, after applying the auditory weighting function for the Low Frequency Cetaceans hearing group following to the new technical guidance. The plot provides the radial distance to the 183-dB SELcum isopleth for one shot. The difference in radial distances between Fig. 4 (34.35 m) and this figure (15.69 m) allows us to estimate the adjustment in dB. Peak Sound Pressure Level : TABLE C3. LEVEL A. NMFS Level A acoustic thresholds (Peak SPLflat) for impulsive sources for marine mammals and predicted radial distances to Level A thresholds for various marine mammal hearing groups that could be received from the four 105 cu.in airguns at a 3 m tow depth during the proposed seismic survey in the north western Atlantic Ocean.
Hearing Group Low-Frequency Cetaceans
Mid-Frequency Cetaceans
High-Frequency Cetaceans
Phocid Pinnipeds
Otariid Pinnipeds
PK Threshold 219 230 202 218 232 Radius to threshold (meters)
10.03 N/A (0) 70.426 11.35 N/A (0)

Appendices
Draft Environmental Assessment for USGS Northwest Atlantic, 2018 Page 118
FIGURE C6: Modeled deep-water received Peak SPL from the four 105 cu.in GI-guns at a 3-m tow depth. The plot provides the radius of the 202-dB peak isopleth (70.43 m).
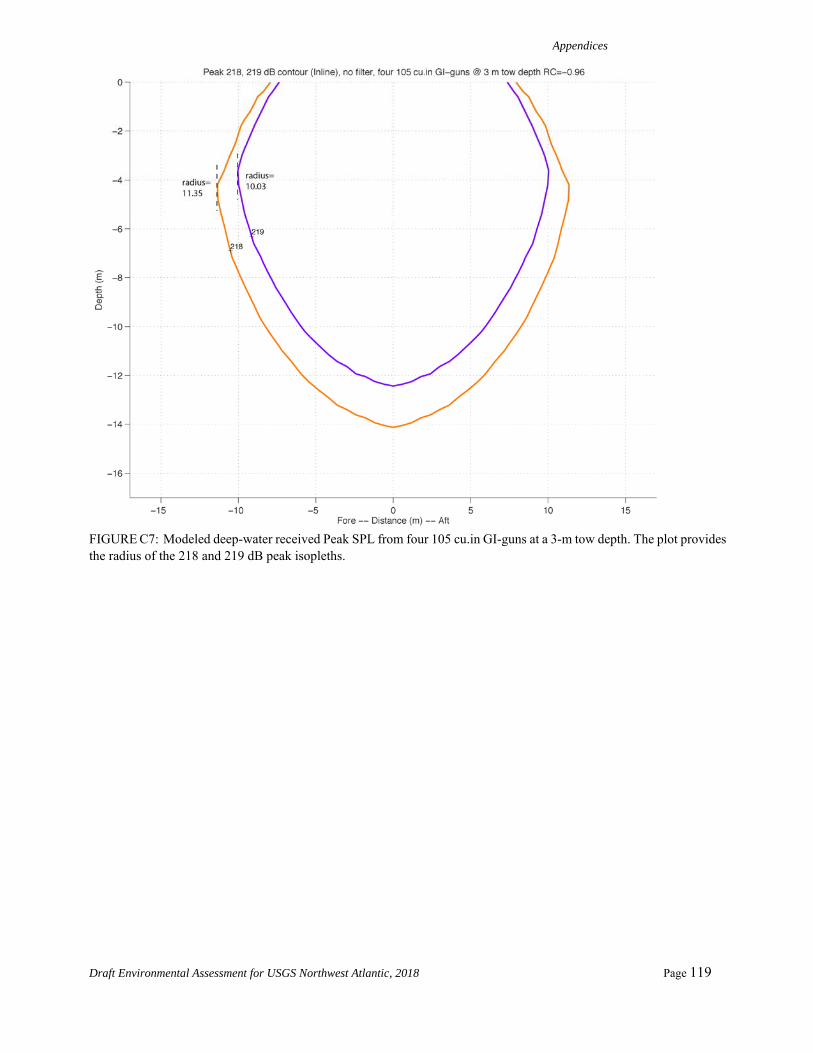
Appendices
Draft Environmental Assessment for USGS Northwest Atlantic, 2018 Page 119
FIGURE C7: Modeled deep-water received Peak SPL from four 105 cu.in GI-guns at a 3-m tow depth. The plot provides the radius of the 218 and 219 dB peak isopleths.

Appendices
Draft Environmental Assessment for USGS Northwest Atlantic, 2018 Page 120
GG CONFIGURATION
4 x 210 cu.in – 2 m separation aft-fore direction and 8.6 m separation in the port-starboard direction @ a 3 m tow depth Table C4: Table showing the results for one single SEL SL modeling without and with applying weighting function to the 5 hearing groups. The modified farfield signature is estimated using the distance from the source array geometrical center to where the SELcum threshold is the largest. A propagation is of 20 log10 (Radial distance) is used to estimate the modified farfield SEL.
SELcum Threshold 183 185 155 185 203 Distance(m) (no weighting function)
39.4216 30.8975 1029.1 30.8975 1.8439
Modified Farfield SEL*
214.9147 214.7985 215.2492 214.7985 208.3147
Distance (m) (with weighting function)
17.7149 N/A N/A N/A N/A
Adjustment (dB) -6.9479 N/A N/A
N/A N/A
* Propagation of 20 log R
For the Low Frequency Cetaceans, we estimated a new adjustment value by computing the distance from the geometrical center of the source to where the 183dB SEL cum isopleth is the largest. We first run the modeling for one single shot without applying any weighting function. The maximum 183dB SEL cum isopleth is located at 39.42 m from the source. We then run the modeling for one single shot with the low frequency Cetaceans weighting function applied to the full spectrum. The maximum 183 dB SEL cum isopleth is located at 17.71 m from the source. Difference between 17.71 m and 39.42 m gives an adjustment factor of -6.95 dB assuming a propagation of 20log10(R). TABLE C5. Results for single shot SEL source level modeling for the four 210 in3 airguns with weighting function calculations for SELcum criteria.
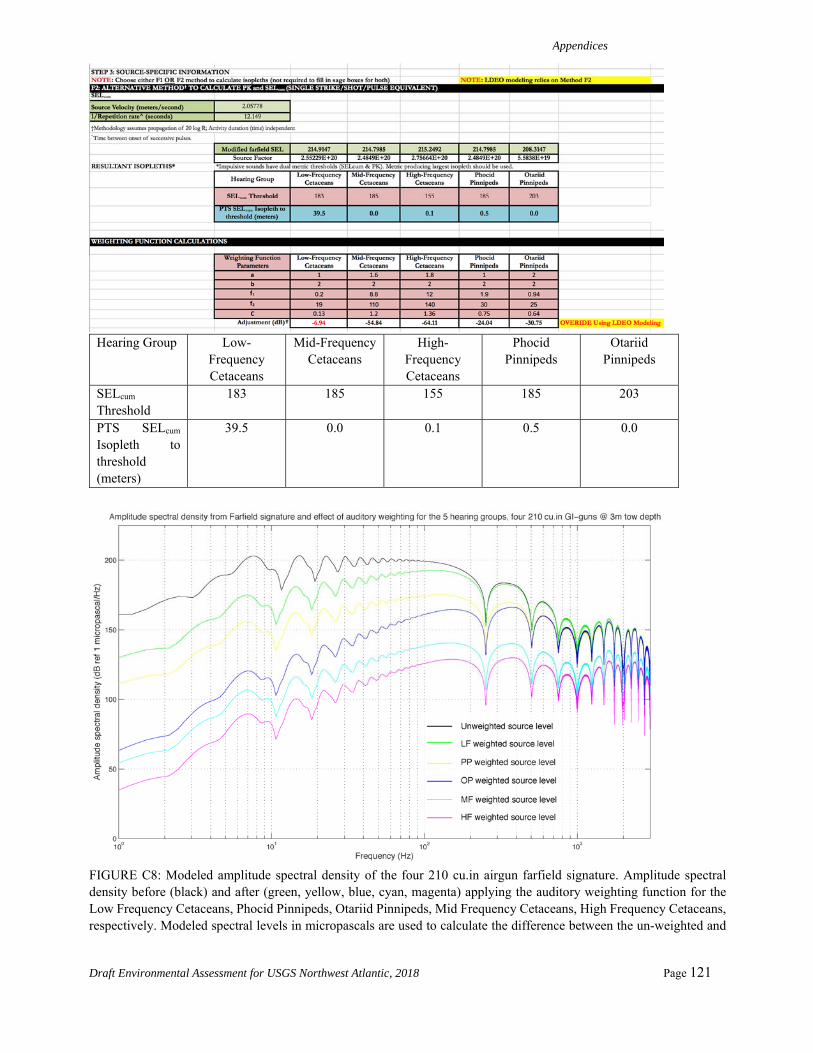
Appendices
Draft Environmental Assessment for USGS Northwest Atlantic, 2018 Page 121
Hearing Group Low-
Frequency Cetaceans
Mid-Frequency Cetaceans
High-Frequency Cetaceans
Phocid Pinnipeds
Otariid Pinnipeds
SELcum Threshold
183 185 155 185 203
PTS SELcum Isopleth to threshold (meters)
39.5 0.0 0.1 0.5 0.0
FIGURE C8: Modeled amplitude spectral density of the four 210 cu.in airgun farfield signature. Amplitude spectral density before (black) and after (green, yellow, blue, cyan, magenta) applying the auditory weighting function for the Low Frequency Cetaceans, Phocid Pinnipeds, Otariid Pinnipeds, Mid Frequency Cetaceans, High Frequency Cetaceans, respectively. Modeled spectral levels in micropascals are used to calculate the difference between the un-weighted and
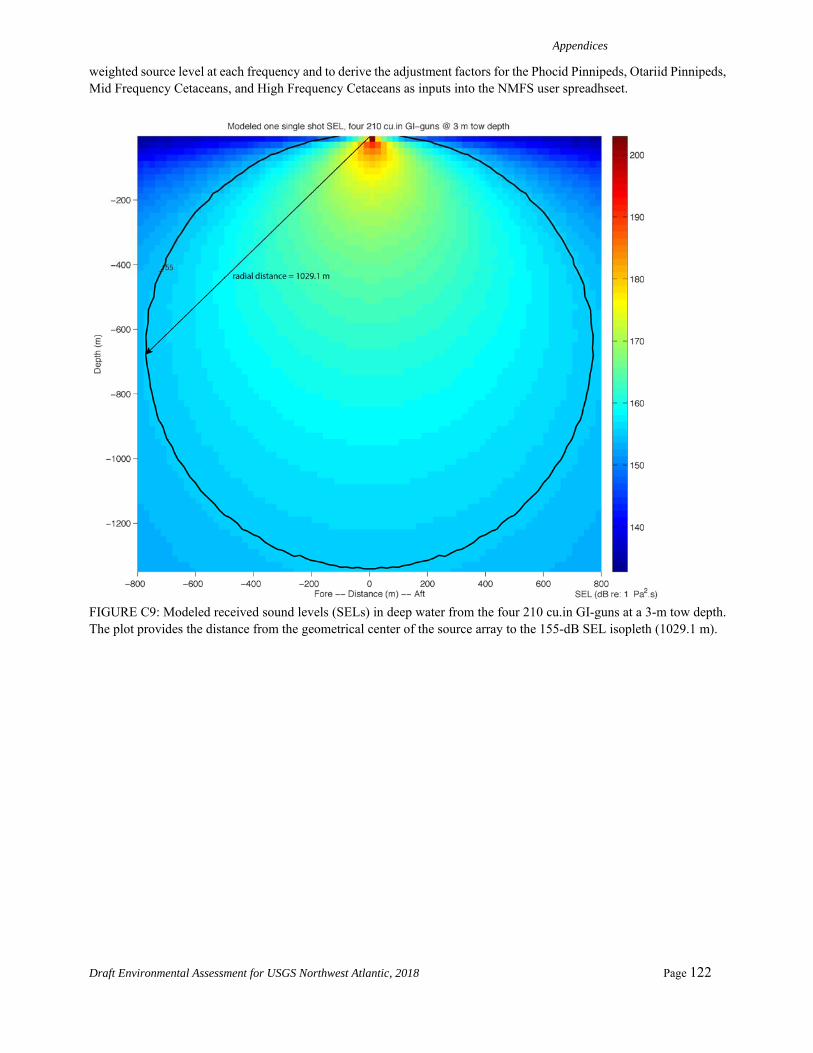
Appendices
Draft Environmental Assessment for USGS Northwest Atlantic, 2018 Page 122
weighted source level at each frequency and to derive the adjustment factors for the Phocid Pinnipeds, Otariid Pinnipeds, Mid Frequency Cetaceans, and High Frequency Cetaceans as inputs into the NMFS user spreadhseet.
FIGURE C9: Modeled received sound levels (SELs) in deep water from the four 210 cu.in GI-guns at a 3-m tow depth. The plot provides the distance from the geometrical center of the source array to the 155-dB SEL isopleth (1029.1 m).
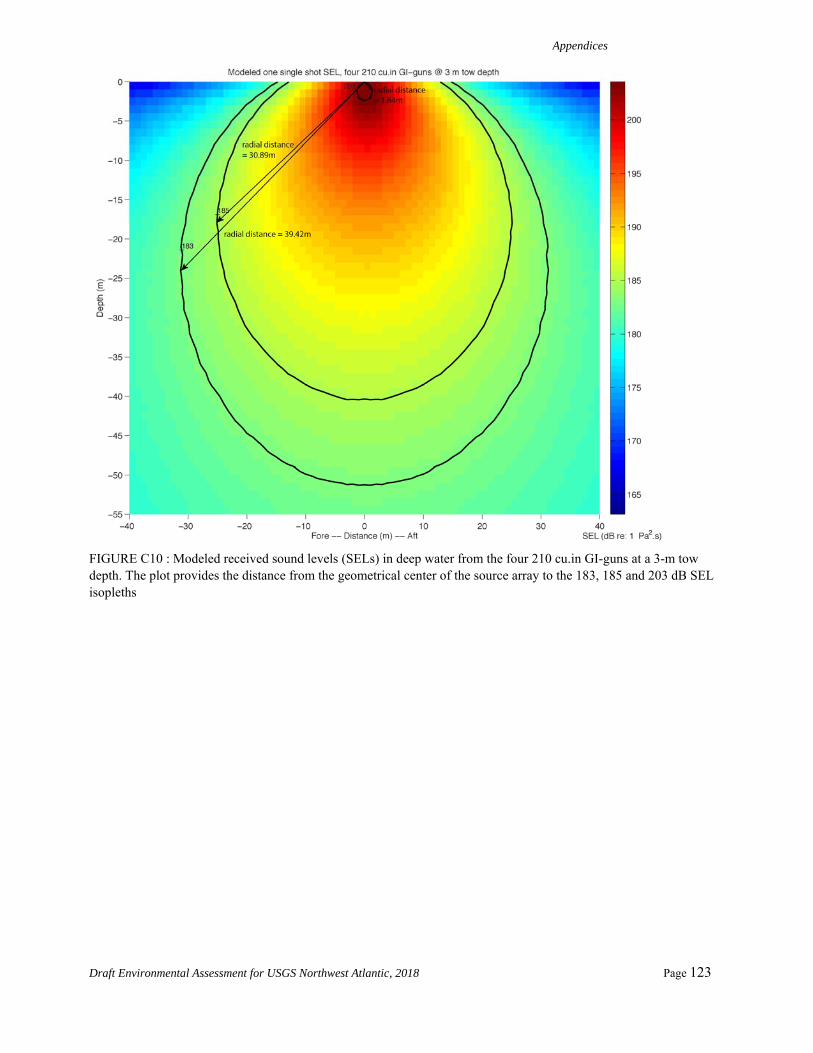
Appendices
Draft Environmental Assessment for USGS Northwest Atlantic, 2018 Page 123
FIGURE C10 : Modeled received sound levels (SELs) in deep water from the four 210 cu.in GI-guns at a 3-m tow depth. The plot provides the distance from the geometrical center of the source array to the 183, 185 and 203 dB SEL isopleths

Appendices
Draft Environmental Assessment for USGS Northwest Atlantic, 2018 Page 124
FIGURE C11: Modeled received sound exposure levels (SELs) from the four 210 cu.in GI-guns at a 3-m tow depth, after applying the auditory weighting function for the Low Frequency Cetaceans hearing group following to the new technical guidance. The plot provides the radial distance to the 183-dB SELcum isopleth for one shot. The difference in radial distances between Fig. 4 (39.42 m) and this figure (17.71 m) allows us to estimate the adjustment in dB. Peak Sound Pressure Level : TABLE C6. LEVEL A. NMFS Level A acoustic thresholds (Peak SPLflat) for impulsive sources for marine mammals and predicted radial distances to Level A thresholds for various marine mammal hearing groups that could be received from the four 210 cu.in airguns at a 3 m tow depth during the proposed seismic survey in the north western Atlantic Ocean.
Hearing Group Low-Frequency Cetaceans
Mid-Frequency Cetaceans
High-Frequency Cetaceans
Phocid Pinnipeds
Otariid Pinnipeds
PK Threshold 219 230 202 218 232 Radius to threshold (meters)
11.56 N/A (0) 80.50 13.04 N/A (0)

Appendices
Draft Environmental Assessment for USGS Northwest Atlantic, 2018 Page 125
FIGURE C12: Modeled deep-water received Peak SPL from four 210 cu.in airguns at a 3-m tow depth. The plot provides the radius of the 202-dB peak isopleth (80.50 m).

Appendices
Draft Environmental Assessment for USGS Northwest Atlantic, 2018 Page 126
FIGURE C13: Modeled deep-water received Peak SPL from two 210 cu.in airguns at a 3-m tow depth. The plot provides the radius of the 218 and 219 dB peak isopleths. BACKUP CONFIGURATION 2 x 10⁵ cu.in – 2 m separation aft-fore direction @ 3 m depth SELcum methodology (spreadsheet – Sivle et al., 2014) Table C7: Table showing the results for one single SEL SL modeling without and with applying weighting function to the 5 hearing groups. The modified farfield signature is estimated using the distance from the source array geometrical center to where the SELcum threshold is the largest. A propagation of 20 log10 (Radial distance) is used to estimate the modified farfield SEL.
SELcum Threshold 183 185 155 185 203 Distance(m) (no weighting function)
17.9821 14.5253 459.5354 14.5352 2.2227
Modified Farfield SEL*
208.0968 208.2425
208.2464 208.2425 209.9376
Distance (m) (with weighting function)
9.1754 N/A N/A N/A N/A
Adjustment (dB) - 5.84 N/A N/A
N/A N/A

Appendices
Draft Environmental Assessment for USGS Northwest Atlantic, 2018 Page 127
* Propagation of 20 log R
For the Low Frequency Cetaceans, we estimated a new adjustment value by computing the distance from the geometrical center of the source to where the 183dB SEL cum isopleth is the largest. We first run the modeling for one single shot without applying any weighting function. The maximum 183dB SEL cum isopleth is located at 17.98 m from the source. We then run the modeling for one single shot with the low frequency Cetaceans weighting function applied to the full spectrum. The maximum 183 dB SEL cum isopleth is located at 9.17 m from the source. Difference between 17.98 m and 9.17 m gives an adjustment factor of -5.84 dB assuming a propagation of 20log10(R). TABLE C8. Results for single shot SEL source level modeling for the two 105 in3 airguns with weighting function calculations for SELcum criteria.

Appendices
Draft Environmental Assessment for USGS Northwest Atlantic, 2018 Page 128
Hearing Group Low-Frequency Cetaceans
Mid-Frequency Cetaceans
High-Frequency Cetaceans
Phocid Pinnipeds
Otariid Pinnipeds
SELcum Threshold
183 185 155 185 203
PTS SELcum Isopleth to threshold (meters)
10.6 0.0 0.0 0.1 0.0
FIGURE C14: Modeled amplitude spectral density of the two 105 cu.in airgun farfield signature. Amplitude spectral density before (black) and after (green, yellow, blue, cyan, magenta) applying the auditory weighting function for the Low Frequency Cetaceans, Phocid Pinnipeds, Otariid Pinnipeds, Mid Frequency Cetaceans, High Frequency Cetaceans, respectively. Modeled spectral levels in micropascals are used to calculate the difference between the un-weighted and weighted source level at each frequency and to derive the adjustment factors for the Phocid Pinnipeds, Otariid Pinnipeds, Mid Frequency Cetaceans, and High Frequency Cetaceans as inputs into the NMFS user spreadhseet.

Appendices
Draft Environmental Assessment for USGS Northwest Atlantic, 2018 Page 129
FIGURE C15: Modeled received sound levels (SELs) in deep water from the two 105 cu.in GI-guns at a 3-m tow depth. The plot provides the distance from the geometrical center of the source array to the 155-dB SEL isopleth (459.5 m).
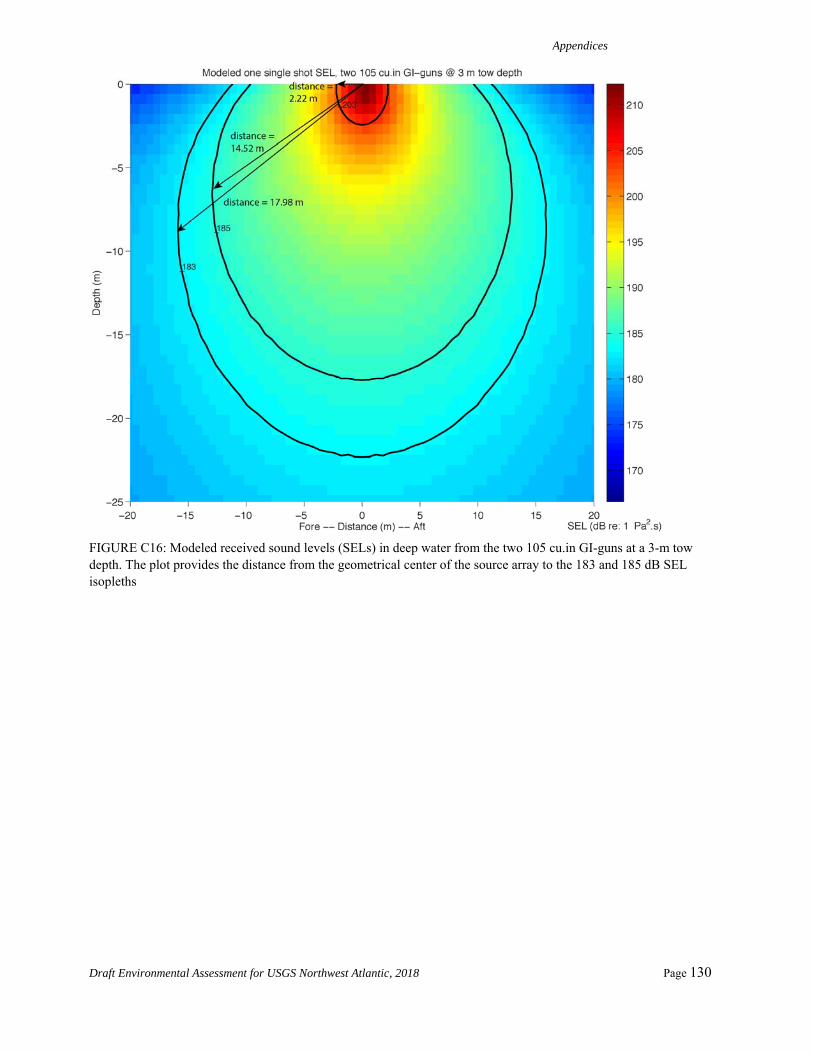
Appendices
Draft Environmental Assessment for USGS Northwest Atlantic, 2018 Page 130
FIGURE C16: Modeled received sound levels (SELs) in deep water from the two 105 cu.in GI-guns at a 3-m tow depth. The plot provides the distance from the geometrical center of the source array to the 183 and 185 dB SEL isopleths

Appendices
Draft Environmental Assessment for USGS Northwest Atlantic, 2018 Page 131
FIGURE C17: Modeled received sound exposure levels (SELs) from the two 105 cu.in GI-guns at a 3-m tow depth, after applying the auditory weighting function for the Low Frequency Cetaceans hearing group following to the new technical guidance. The plot provides the radial distance to the 183-dB SELcum isopleth for one shot. The difference in radial distances between Fig. 4 (17.98 m) and this figure (9.17 m) allows us to estimate the adjustment in dB. Peak Sound Pressure Level : TABLE C9. LEVEL A. NMFS Level A acoustic thresholds (Peak SPLflat) for impulsive sources for marine mammals and predicted radial distances to Level A thresholds for various marine mammal hearing groups that could be received from the two 105 cu.in airguns at a 3 m tow depth during the proposed seismic survey in the north western Atlantic Ocean.
Hearing Group Low-Frequency Cetaceans
Mid-Frequency Cetaceans
High-Frequency Cetaceans
Phocid Pinnipeds
Otariid Pinnipeds
PK Threshold 219 230 202 218 232 Radius to threshold (meters)
6.52 1.58 42.32 7.31 1.08

Appendices
Draft Environmental Assessment for USGS Northwest Atlantic, 2018 Page 132
FIGURE C18: Modeled deep-water received Peak SPL from two 105 cu.in airguns at a 3-m tow depth. The plot provides the radius of the 202-dB peak isopleth (44.14 m).

Appendices
Draft Environmental Assessment for USGS Northwest Atlantic, 2018 Page 133
FIGURE C19: Modeled deep-water received Peak SPL from two 105 cu.in airguns at a 3-m tow depth. The plot provides the radius of the 218-219-230 and 232 dB peak isopleths.
Summary Tables for PTS SELcum and Peak SPLflat.
Table C10. PTS SELcum isopleth to threshold in meters (italics) for each source configuration and hearing group, as calculated using the NMFS spreadsheet.
Hearing Group Low-
Frequency Cetaceans
Mid-Frequency Cetaceans
High-Frequency Cetaceans
SELcum Threshold
183 dB 185 dB 155 dB
Base Configuration
31.0 m 0.0 0.0
GG Configuration
39.5 m 0.0 0.1 m
Backup Configuration
10.6 m 0.0 0.0
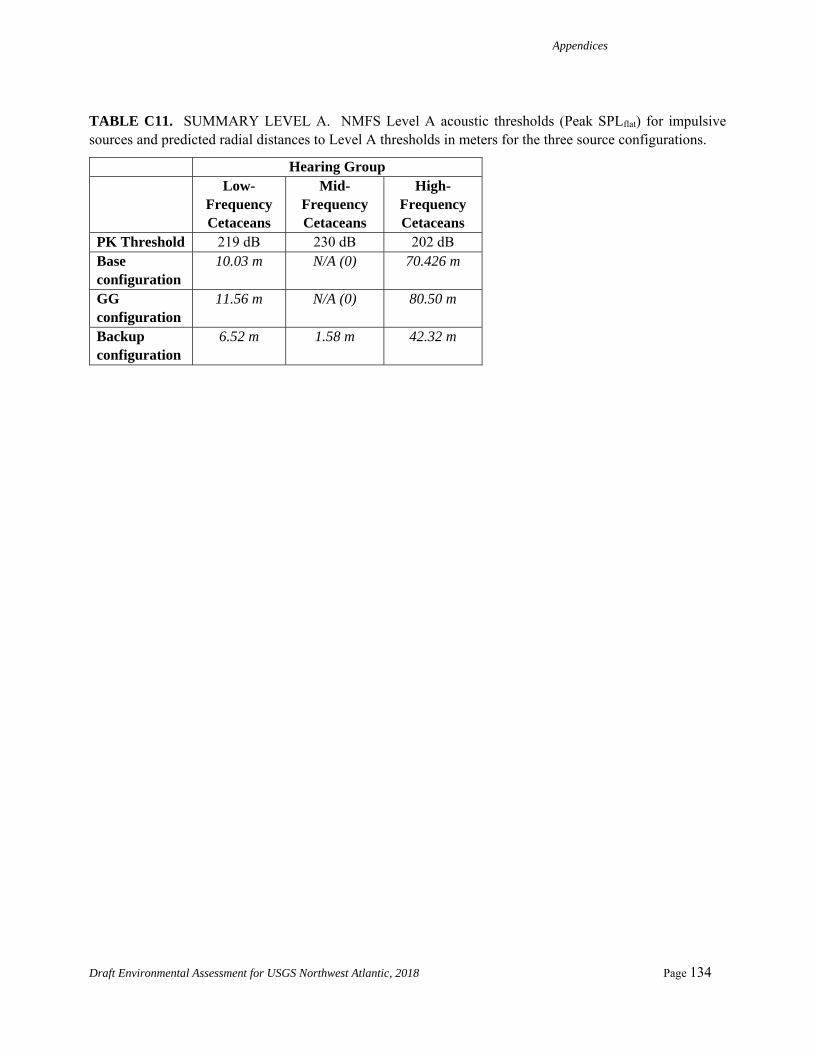
Appendices
Draft Environmental Assessment for USGS Northwest Atlantic, 2018 Page 134
TABLE C11. SUMMARY LEVEL A. NMFS Level A acoustic thresholds (Peak SPLflat) for impulsive sources and predicted radial distances to Level A thresholds in meters for the three source configurations.
Hearing Group Low-
Frequency Cetaceans
Mid-Frequency Cetaceans
High-Frequency Cetaceans
PK Threshold 219 dB 230 dB 202 dB Base configuration
10.03 m N/A (0) 70.426 m
GG configuration
11.56 m N/A (0) 80.50 m
Backup configuration
6.52 m 1.58 m 42.32 m

Appendices
Draft Environmental Assessment for USGS Northwest Atlantic, 2018 Page 135
Appendix D: Affected Environment Text
As noted above, this section is taken verbatim from the Draft Scripps EA (2017) and has been incorporated by reference. It is reproduced here only for the sake of completeness.
Summary Effects of Airguns on Marine Mammals and Turtles (Section IV.1.a)
As noted in the NSF-USGS PEIS (§ 3.4.4.3, § 3.6.4.3, § 3.7.4.3, § 3.8.4.3), the effects of sounds from airguns could include one or more of the following: tolerance, masking of natural sounds, behavioral disturbance, and at least in theory, temporary or permanent hearing impairment, or non-auditory physical or physiological effects (e.g., Richardson et al. 1995; Gordon et al. 2004; Nowacek et al. 2007; Southall et al. 2007; Erbe 2012; Peng et al. 2015; Erbe et al. 2016; Kunc et al. 2016; National Academies of Sciences, Engineering, and Medicine 2017). In some cases, a behavioral response to a sound can reduce the overall exposure to that sound (e.g., Finneran et al. 2015; Wensveen et al. 2015).
Permanent hearing impairment (PTS), in the unlikely event that it occurred, would constitute injury, but temporary threshold shift (TTS) is not considered an injury (Southall et al. 2007; Le Prell 2012). Rather, the onset of TTS has been considered an indicator that, if the animal is exposed to higher levels of that sound, physical damage is ultimately a possibility. Nonetheless, research has shown that sound exposure can cause cochlear neural degeneration, even when threshold shifts and hair cell damage are reversible (Kujawa and Liberman 2009; Liberman 2016). These findings have raised some doubts as to whether TTS should continue to be considered a non-injurious effect (Weilgart 2014; Tougaard et al. 2015, 2016). Although the possibility cannot be entirely excluded, it is unlikely that the proposed surveys would result in any cases of temporary or permanent hearing impairment, or any significant non-auditory physical or physiological effects. If marine mammals encounter a survey while it is underway, some behavioral disturbance could result, but this would be localized and short-term.
Tolerance.―Numerous studies have shown that pulsed sounds from airguns are often readily detectable in the water at distances of many kilometers (e.g., Nieukirk et al. 2012). Several studies have shown that marine mammals at distances more than a few kilometers from operating seismic vessels often show no apparent response. That is often true even in cases when the pulsed sounds must be readily audible to the animals based on measured received levels and the hearing sensitivity of that mammal group. Although various baleen and toothed whales, and (less frequently) pinnipeds have been shown to react behaviorally to airgun pulses under some conditions, at other times mammals of all three types have shown no overt reactions. The relative responsiveness of baleen and toothed whales are quite variable.
Masking.―Masking effects of pulsed sounds (even from large arrays of airguns) on marine mammal calls and other natural sounds are expected to be limited, although there are few specific data on this. Because of the intermittent nature and low duty cycle of seismic pulses, animals can emit and receive sounds in the relatively quiet intervals between pulses. However, in exceptional situations, reverberation occurs for much or all of the interval between pulses (e.g., Simard et al. 2005; Clark and Gagnon 2006), which could mask calls. Situations with prolonged strong reverberation are infrequent. However, it is common for reverberation to cause some lesser degree of elevation of the background level between airgun pulses (e.g., Gedamke 2011; Guerra et al. 2011, 2016; Klinck et al. 2012; Guan et al. 2015), and this weaker reverberation presumably reduces the detection range of calls and other natural sounds to some degree. Guerra et al. (2016) reported that ambient noise levels between seismic pulses were elevated as a result of reverberation at ranges of 50 km from the seismic source. Based on measurements in deep water of the Southern Ocean, Gedamke (2011) estimated that the slight elevation of background levels during intervals
Appendices
Draft Environmental Assessment for USGS Northwest Atlantic, 2018 Page 136
between pulses reduced blue and fin whale communication space by as much as 36–51% when a seismic survey was operating 450–2800 km away. Based on preliminary modeling, Wittekind et al. (2016) reported that airgun sounds could reduce the communication range of blue and fin whales at a distance of 2000 km from the seismic source. Nieukirk et al. (2012) and Blackwell et al. (2013) noted the potential for masking effects from seismic surveys on large whales.
Some baleen and toothed whales are known to continue calling in the presence of seismic pulses, and their calls usually can be heard between the pulses (e.g., Nieukirk et al. 2012; Thode et al. 2012; Bröker et al. 2013; Sciacca et al. 2016). Cerchio et al. (2014) suggested that the breeding display of humpback whales off Angola could be disrupted by seismic sounds, as singing activity declined with increasing received levels. In addition, some cetaceans are known to change their calling rates, shift their peak frequencies, or otherwise modify their vocal behavior in response to airgun sounds (e.g., Di Iorio and Clark 2010; Castellote et al. 2012; Blackwell et al. 2013, 2015). The hearing systems of baleen whales are undoubtedly more sensitive to low-frequency sounds than are the ears of the small odontocetes that have been studied directly (e.g., MacGillivray et al. 2014). The sounds important to small odontocetes are predominantly at much higher frequencies than are the dominant components of airgun sounds, thus limiting the potential for masking. In general, masking effects of seismic pulses are expected to be minor, given the normally intermittent nature of seismic pulses. Sills et al. (2017) reported that recorded airguns sounds masked the detection of low-frequency sounds by ringed and spotted seals, especially at the onset of the airgun pulse when signal amplitude was variable. We are not aware of any information concerning masking of hearing in sea turtles.
Disturbance Reactions.―Disturbance includes a variety of effects, including subtle to conspicuous changes in behavior, movement, and displacement. Based on NMFS (2001, p. 9293), National Research Council (NRC 2005), and Southall et al. (2007), we believe that simple exposure to sound, or brief reactions that do not disrupt behavioral patterns in a potentially significant manner, do not constitute harassment or “taking”. By potentially significant, we mean, ‘in a manner that might have deleterious effects to the well-being of individual marine mammals or their populations’.
Reactions to sound, if any, depend on species, state of maturity, experience, current activity, reproductive state, time of day, and many other factors (Richardson et al. 1995; Wartzok et al. 2004; Southall et al. 2007; Weilgart 2007; Ellison et al. 2012). If a marine mammal does react briefly to an underwater sound by changing its behavior or moving a small distance, the impacts of the change are unlikely to be significant to the individual, let alone the stock or population (e.g., New et al. 2013a). However, if a sound source displaces marine mammals from an important feeding or breeding area for a prolonged period, impacts on individuals and populations could be significant (Lusseau and Bejder 2007; Weilgart 2007; New et al. 2013b; Nowacek et al. 2015; Forney et al. 2017). Some studies have attempted modeling to assess consequences of effects from underwater noise at the population level (e.g., New et al. 2013b; King et al. 2015; Costa et al. 2016a,b; Ellison et al. 2016; Harwood et al. 2016; Nowacek et al. 2016; Farmer et al. 2017). Various authors have noted that some marine mammals that show no obvious avoidance or behavioral changes may still be adversely affected by sound (e.g., Weilgart 2007; Wright et al. 2011; Gomez et al. 2016).
Given the many uncertainties in predicting the quantity and types of impacts of noise on marine mammals, it is common practice to estimate how many marine mammals would be present within a particular distance of industrial activities and/or exposed to a particular level of industrial sound. In most cases, this approach likely overestimates the numbers of marine mammals that would be affected in some biologically important manner.
The sound criteria used to estimate how many marine mammals could be disturbed to some biologically important degree by a seismic program are based primarily on behavioral observations of a

Appendices
Draft Environmental Assessment for USGS Northwest Atlantic, 2018 Page 137
few species. Detailed studies have been done on humpback, gray, bowhead, and sperm whales. Less detailed data are available for some other species of baleen whales and small toothed whales, but for many species, there are no data on responses to marine seismic surveys.
Baleen Whales
Baleen whales generally tend to avoid operating airguns, but avoidance radii are quite variable. Whales are often reported to show no overt reactions to pulses from large arrays of airguns at distances beyond a few kilometers, even though the airgun pulses remain well above ambient noise levels out to much longer distances. However, baleen whales exposed to strong noise pulses from airguns often react by deviating from their normal migration route and/or interrupting their feeding and moving away. In the cases of migrating gray and bowhead whales, the observed changes in behavior appeared to be of little or no biological consequence to the animals. They simply avoided the sound source by displacing their migration route to varying degrees, but within the natural boundaries of the migration corridors (Malme et al. 1984; Malme and Miles 1985; Richardson et al. 1995).
Responses of humpback whales to seismic surveys have been studied during migration, on summer feeding grounds, and on Angolan winter breeding grounds; there has also been discussion of effects on the Brazilian wintering grounds. Off Western Australia, avoidance reactions began at 5–8 km from the array, and those reactions kept most pods ~3–4 km from the operating seismic vessel; there was localized displacement during migration of 4–5 km by traveling pods and 7–12 km by more sensitive resting pods of cow-calf pairs (McCauley et al. 1998, 2000). However, some individual humpback whales, especially males, approached within distances of 100–400 m.
More recent studies examining the behavioral responses of humpback whales to airguns have also been conducted off eastern Australia (Cato et al. 2011, 2012, 2013, 2016), although results are not yet available for all studies. Dunlop et al. (2015) reported that humpback whales responded to a vessel operating a 20 in3 airgun by decreasing their dive time and speed of southward migration; however, the same responses were obtained during control trials without an active airgun, suggesting that humpbacks responded to the source vessel rather than the airgun. A ramp up was not superior to triggering humpbacks to move away from the vessel compared with a constant source at a higher level of 140 in3, although an increase in distance from the airgun array was noted for both sources (Dunlop et al. 2016a). Avoidance was also shown when no airguns were operational, indicating that the presence of the vessel itself had an effect on the response (Dunlop et al. 2016a,b). Responses to ramp up and use of a 3130 in3 array elicited greater behavioral changes in humpbacks when compared with small arrays (Dunlop et al. 2016c). Overall, the results showed that humpbacks were more likely to avoid active airgun arrays (of 20 and 140 in3) within 3 km and at levels of at least 140 dB re 1 μPa2 · s (Dunlop et al. 2017). These results are consistent with earlier studies (e.g., McCauley et al. 2000). Although there was no clear evidence of avoidance by humpbacks on their summer feeding grounds in southeast Alaska, there were subtle behavioral effects at distance up to 3.2 km and received levels of 150 to 172 re 1 Pa on an approximate rms basis (Malme et al. 1985).
In the northwest Atlantic, sighting rates were significantly greater during non-seismic periods compared with periods when a full array was operating, and humpback whales were more likely to swim away and less likely to swim towards a vessel during seismic vs. non-seismic periods (Moulton and Holst 2010). In contrast, sightings of humpback whales from seismic vessels off the U.K. during 1994–2010 indicated that detection rates were similar during seismic and non-seismic periods, although sample sizes were small (Stone 2015). It has been suggested that South Atlantic humpback whales wintering off Brazil may be displaced or even strand upon exposure to seismic surveys (Engel et al. 2004), but data from subsequent years indicated that there was no observable direct correlation between strandings and seismic surveys (IWC 2007).
Appendices
Draft Environmental Assessment for USGS Northwest Atlantic, 2018 Page 138
There are no data on reactions of right whales to seismic surveys. However, Rolland et al. (2012) suggested that ship noise causes increased stress in right whales; they showed that baseline levels of stress-related faecal hormone metabolites decreased in North Atlantic right whales with a 6-dB decrease in underwater noise from vessels. Wright et al. (2011), Bain et al. (2015), Houser et al. (2016), and Lyamin et al. (2016) also reported that sound could be a potential source of stress for marine mammals.
Bowhead whales show that their responsiveness can be quite variable depending on their activity (migrating vs. feeding). Bowhead whales migrating west across the Alaskan Beaufort Sea in autumn, in particular, are unusually responsive, with substantial avoidance occurring out to distances of 20–30 km from a medium-sized airgun source (Miller et al. 1999; Richardson et al. 1999). Subtle but statistically significant changes in surfacing–respiration–dive cycles were shown by traveling and socializing bowheads exposed to airgun sounds in the Beaufort Sea, including shorter surfacings, shorter dives, and decreased number of blows per surfacing (Robertson et al. 2013). More recent research on bowhead whales corroborates earlier evidence that, during the summer feeding season, bowheads are less responsive to seismic sources (e.g., Miller et al. 2005; Robertson et al. 2013).
Bowhead whale calls detected in the presence and absence of airgun sounds have been studied extensively in the Beaufort Sea. Bowheads continue to produce calls of the usual types when exposed to airgun sounds on their summering grounds, although numbers of calls detected are significantly lower in the presence than in the absence of airgun pulses (Blackwell et al. 2013, 2015). Blackwell et al. (2013) reported that calling rates in 2007 declined significantly where received SPLs from airgun sounds were 116–129 dB re 1 µPa; at SPLs <108 dB re 1 µPa, calling rates were not affected. When data for 2007–2010 were analyzed, Blackwell et al. (2015) reported an initial increase in calling rates when airgun pulses became detectable; however, calling rates leveled off at a received CSEL10-min (cumulative SEL over a 10-min period) of ~94 dB re 1 µPa2 · s, decreased at CSEL10-min >127 dB re 1 µPa2 · s, and whales were nearly silent at CSEL10-min >160 dB re 1 µPa2 · s. Thus, bowhead whales in the Beaufort Sea apparently decreased their calling rates in response to seismic operations, although movement out of the area could also have contributed to the lower call detection rate (Blackwell et al. 2013, 2015).
A multivariate analysis of factors affecting the distribution of calling bowhead whales during their fall migration in 2009 noted that the southern edge of the distribution of calling whales was significantly closer to shore with increasing levels of airgun sound from a seismic survey a few hundred kilometers to the east of the study area (i.e., behind the westward-migrating whales; McDonald et al. 2010, 2011). It was not known whether this statistical effect represented a stronger tendency for quieting of the whales farther offshore in deeper water upon exposure to airgun sound, or an actual inshore displacement of whales.
There was no indication that western gray whales exposed to seismic sound were displaced from their overall feeding grounds near Sakhalin Island during seismic programs in 1997 (Würsig et al. 1999) or 2001 (Johnson et al. 2007; Meier et al. 2007; Yazvenko et al. 2007a). However, there were indications of subtle behavioral effects among whales that remained in the areas exposed to airgun sounds (Würsig et al. 1999; Gailey et al. 2007; Weller et al. 2006a) and localized redistribution of some individuals within the nearshore feeding ground so as to avoid close approaches by the seismic vessel (Weller et al. 2002, 2006b; Yazvenko et al. 2007a). Despite the evidence of subtle changes in some quantitative measures of behavior and local redistribution of some individuals, there was no apparent change in the frequency of feeding, as evident from mud plumes visible at the surface (Yazvenko et al. 2007b).
Similarly, no large changes in gray whale movement, respiration, or distribution patterns were observed during seismic programs conducted in 2010 (Bröker et al. 2015; Gailey et al. 2016). Although sighting distances of gray whales from shore increased slightly during a 2-week seismic survey, this result was not significant (Muir et al. 2015). However, there may have been a possible localized avoidance response to high sound levels in the area (Muir et al. 2016). The lack of strong avoidance or other strong

Appendices
Draft Environmental Assessment for USGS Northwest Atlantic, 2018 Page 139
responses during the 2001 and 2010 programs was presumably in part a result of the comprehensive combination of real-time monitoring and mitigation measures designed to avoid exposing western gray whales to received SPLs above ~163 dB re 1 μParms (Johnson et al. 2007; Nowacek et al. 2012, 2013b). In contrast, preliminary data collected during a seismic program in 2015 showed some displacement of animals from the feeding area and responses to lower sound levels than expected (Gailey et al. 2017; Sychenko et al. 2017).
Gray whales in British Columbia exposed to seismic survey sound levels up to ~170 dB re 1 μPa did not appear to be strongly disturbed (Bain and Williams 2006). The few whales that were observed moved away from the airguns but toward deeper water where sound levels were said to be higher due to propagation effects (Bain and Williams 2006).
Various species of Balaenoptera (blue, sei, fin, and minke whales) have occasionally been seen in areas ensonified by airgun pulses. Sightings by observers on seismic vessels using large arrays off the
U.K. from 1994 to 2010 showed that the detection rate for minke whales was significantly higher when airguns were not operating; however, during surveys with small arrays, the detection rates for minke whales were similar during seismic and non-seismic periods (Stone 2015). Sighting rates for fin and sei whales were similar when large arrays of airguns were operating vs. silent (Stone 2015). All baleen whales combined tended to exhibit localized avoidance, remaining significantly farther (on average) from large arrays (median closest point of approach or CPA of ~1.5 km) during seismic operations compared with non-seismic periods (median CPA ~1.0 km; Stone 2015). In addition, fin and minke whales were more often oriented away from the vessel while a large airgun array was active compared with periods of inactivity (Stone 2015). Singing fin whales in the Mediterranean moved away from an operating airgun array, and their song notes had lower bandwidths during periods with vs. without airgun sounds (Castellote et al. 2012).
During seismic surveys in the northwest Atlantic, baleen whales as a group showed localized avoidance of the operating array (Moulton and Holst 2010). Sighting rates were significantly lower during seismic operations compared with non-seismic periods. Baleen whales were seen on average 200 m farther from the vessel during airgun activities vs. non-seismic periods, and these whales more often swam away from the vessel when seismic operations were underway compared with periods when no airguns were operating (Moulton and Holst 2010). Blue whales were seen significantly farther from the vessel during single airgun operations, ramp up, and all other airgun operations compared with non-seismic periods (Moulton and Holst 2010). Similarly, fin whales were seen at significantly farther distances during ramp up than during periods without airgun operations; there was also a trend for fin whales to be sighted farther from the vessel during other airgun operations, but the difference was not significant (Moulton and Holst 2010). Minke whales were seen significantly farther from the vessel during periods with than without seismic operations (Moulton and Holst 2010). Minke whales were also more likely to swim away and less likely to approach during seismic operations compared to periods when airguns were not operating (Moulton and Holst 2010). However, Matos (2015) reported no change in sighting rates of minke whales in Vestfjorden, Norway, during ongoing seismic surveys outside of the fjord. Vilela et al. (2016) cautioned that environmental conditions should be taken into account when comparing sighting rates during seismic surveys, as spatial modeling showed that differences in sighting rates of rorquals (fin and minke whales) during seismic periods and non-seismic periods during a survey in the Gulf of Cadiz could be explained by environmental variables.
Data on short-term reactions by cetaceans to impulsive noises are not necessarily indicative of long-term or biologically significant effects. It is not known whether impulsive sounds affect reproductive rate or distribution and habitat use in subsequent days or years. However, gray whales have continued to migrate annually along the west coast of North America with substantial increases in the population over recent

Appendices
Draft Environmental Assessment for USGS Northwest Atlantic, 2018 Page 140
years, despite intermittent seismic exploration (and much ship traffic) in that area for decades. In addition, bowhead whales have continued to travel to the eastern Beaufort Sea each summer, and their numbers have increased notably, despite seismic exploration in their summer and autumn range for many years.
Toothed Whales
Little systematic information is available about reactions of toothed whales to sound pulses. However, there are recent systematic studies on sperm whales, and there is an increasing amount of information about responses of various odontocetes to seismic surveys based on monitoring studies. Seismic operators and protected species observers on seismic vessels regularly see dolphins and other small toothed whales near operating airgun arrays, but in general there is a tendency for most delphinids to show some avoidance of operating seismic vessels (e.g., Stone and Tasker 2006; Moulton and Holst 2010; Barry et al. 2012; Wole and Myade 2014; Stone 2015; Monaco et al. 2016). In most cases, the avoidance radii for delphinids appear to be small, on the order of 1 km or less, and some individuals show no apparent avoidance.
Observations from seismic vessels using large arrays off the U.K. from 1994–2010 indicated that detection rates were significantly higher for killer whales, white-beaked dolphins, and Atlantic white-sided dolphins when airguns were not operating; detection rates during seismic vs. non-seismic periods were similar during seismic surveys using small arrays (Stone 2015). Detection rates for long-finned pilot whales, Risso’s dolphins, bottlenose dolphins, and short-beaked common dolphins were similar during seismic (small or large array) vs. non-seismic operations (Stone 2015). CPA distances for killer whales, white-beaked dolphins, and Atlantic white-sided dolphins were significantly farther (>0.5 km) from large airgun arrays during periods of airgun activity compared with periods of inactivity, with significantly more animals traveling away from the vessel during airgun operation (Stone 2015). Observers’ records suggested that fewer cetaceans were feeding and fewer delphinids were interacting with the survey vessel (e.g., bow-riding) during periods with airguns operating (Stone 2015).
During seismic surveys in the northwest Atlantic, delphinids as a group showed some localized avoidance of the operating array (Moulton and Holst 2010). The mean initial detection distance was significantly farther (by ~200 m) during seismic operations compared with periods when the seismic source was not active; however, there was no significant difference between sighting rates (Moulton and Holst 2010). The same results were evident when only long-finned pilot whales were considered.
Preliminary findings of a monitoring study of narwhals in Melville Bay, Greenland (summer and fall 2012) showed no short-term effects of seismic survey activity on narwhal distribution, abundance, migration timing, and feeding habits (Heide-Jørgensen et al. 2013a). In addition, there were no reported effects on narwhal hunting. These findings do not seemingly support a suggestion by Heide-Jørgensen et al. (2013b) that seismic surveys in Baffin Bay may have delayed the migration timing of narwhals, thereby increasing the risk of narwhals to ice entrapment.
The beluga, however, is a species that (at least at times) shows long-distance (10s of km) avoidance of seismic vessels (e.g., Miller et al. 2005). Captive bottlenose dolphins and beluga whales exhibited changes in behavior when exposed to strong pulsed sounds similar in duration to those typically used in seismic surveys, but the animals tolerated high received levels of sound before exhibiting aversive behaviors (e.g., Finneran et al. 2000, 2002, 2005). Schlundt et al. (2016) also reported that bottlenose dolphins exposed to multiple airgun pulses exhibited some anticipatory behavior.
Most studies of sperm whales exposed to airgun sounds indicate that the sperm whale shows considerable tolerance of airgun pulses; in most cases the whales do not show strong avoidance (e.g., Stone and Tasker 2006; Moulton and Holst 2010). However, foraging behavior can be altered upon exposure to airgun sound (e.g., Miller et al. 2009) which, according to Farmer et al. (2017), could have

Appendices
Draft Environmental Assessment for USGS Northwest Atlantic, 2018 Page 141
significant consequences on individual fitness. Based on data collected by observers on seismic vessels off the U.K. from 1994–2010, detection rates for sperm whales were similar when large arrays of airguns were operating vs. silent; however, during surveys with small arrays, the detection rate was significantly higher when the airguns were not in operation (Stone 2015). Preliminary data from the Gulf of Mexico show a correlation between reduced sperm whale acoustic activity during periods with airgun operations (Sidorovskaia et al. 2014).
There are almost no specific data on the behavioral reactions of beaked whales to seismic surveys. Most beaked whales tend to avoid approaching vessels of other types (e.g., Würsig et al. 1998) and/or change their behavior in response to sounds from vessels (e.g., Pirotta et al. 2012). Thus, it is likely that most beaked whales would also show strong avoidance of an approaching seismic vessel. Observations from seismic vessels off the U.K. from 1994–2010 indicated that detection rates of beaked whales were significantly higher (p<0.05) when airguns were not operating vs. when a large array was in operation, although sample sizes were small (Stone 2015). Some northern bottlenose whales remained in the general area and continued to produce high-frequency clicks when exposed to sound pulses from distant seismic surveys (e.g., Simard et al. 2005).
The limited available data suggest that harbor porpoises show stronger avoidance of seismic operations than do Dall’s porpoises. Based on data collected by observers on seismic vessels off the U.K. from 1994–2010, detection rates of harbor porpoises were significantly higher when airguns were silent vs. when large or small arrays were operating (Stone 2015). In addition, harbor porpoises were seen farther away from the array when it was operating vs. silent, and were most often seen traveling away from the airgun array when it was in operation (Stone 2015). Thompson et al. (2013) reported decreased densities and reduced acoustic detections of harbor porpoise in response to a seismic survey in Moray Firth, Scotland, at ranges of 5–10 km (SPLs of 165–172 dB re 1 μPa, SELs of 145–151 dB μPa2 · s). For the same survey, Pirotta et al. (2014) reported that the probability of recording a porpoise buzz decreased by 15% in the ensonified area, and that the probability was positively related to the distance from the seismic ship; the decreased buzzing occurrence may indicate reduced foraging efficiency. Nonetheless, animals returned to the area within a few hours (Thompson et al. 2013). Kastelein et al. (2013a) reported that a harbor porpoise showed no response to an impulse sound with an SEL below 65 dB, but a 50% brief response rate was noted at an SEL of 92 dB and an SPL of 122 dB re 1 µPa0-peak. However, Kastelein et al. (2012a) reported a 50% detection threshold at a SEL of 60 dB to a similar impulse sound; this difference is likely attributable to the different transducers used during the two studies (Kastelein et al. 2013a). The apparent tendency for greater responsiveness in the harbor porpoise is consistent with its relative responsiveness to boat traffic and some other acoustic sources (Richardson et al. 1995; Southall et al. 2007).
Odontocete reactions to large arrays of airguns are variable and, at least for delphinids, seem to be confined to a smaller radius than has been observed for the more responsive of the mysticetes and some other odontocetes. A 170 dB disturbance criterion (rather than 160 dB) is considered appropriate for delphinids (in particular mid-frequency cetaceans), which tend to be less responsive than the more responsive cetaceans. NMFS is currently developing new guidance for predicting behavioral effects (Scholik-Schlomer 2015). As behavioral responses are not consistently associated with received levels, some authors have made recommendations on different approaches to assess behavioral reactions (e.g., Gomez et al. 2016; Harris et al. 2017).
Sea Turtles
Several recent papers discuss the morphology of the turtle ear (e.g., Christensen-Dalsgaard et al. 2012; Willis et al. 2013) and the hearing ability of sea turtles (e.g., Martin et al. 2012; Piniak et al. 2012a,b; Lavender et al. 2014). The limited available data indicate that sea turtles will hear airgun sounds and

Appendices
Draft Environmental Assessment for USGS Northwest Atlantic, 2018 Page 142
sometimes exhibit localized avoidance (see NSF-USGS PEIS, § 3.4.4.3). In additional, Nelms et al. (2016) suggest that sea turtles could be excluded from critical habitats during seismic surveys.
DeRuiter and Doukara (2012) observed that immediately following an airgun pulse, small numbers of basking loggerhead turtles (6 of 86 turtles observed) exhibited an apparent startle response (sudden raising of the head and splashing of flippers, occasionally accompanied by blowing bubbles from the beak and nostrils, followed by a short dive). Diving turtles (49 of 86 individuals) were observed at distances from the center of the airgun array ranging from 50–839 m. The estimated sound level at the median distance of
130 m was 191 dB re 1 Papeak. These observations were made during ~150 h of vessel-based monitoring from a seismic vessel operating an airgun array (13 airguns, 2440 in3) off Algeria; there was no corresponding observation effort during periods when the airgun array was inactive (DeRuiter and Doukara 2012).
Based on available data, it is likely that sea turtles will exhibit behavioral changes and/or avoidance within an area of unknown size near a seismic vessel. To the extent that there are any impacts on sea turtles, seismic operations in or near areas where turtles concentrate would likely have the greatest impact; however, concentration areas are not known to occur within the proposed project area. There are no specific data that demonstrate the consequences to sea turtles if seismic operations with large or small arrays of airguns occur in important areas at biologically important times of the year. However, a number of mitigation measures can, on a case-by-case basis, be considered for application in areas important to sea turtles (e.g., Pendoley 1997; van der Wal et al. 2016).
Hearing Impairment and Other Physical Effects.―Temporary or permanent hearing impairment is a possibility when marine mammals are exposed to very strong sounds. TTS has been demonstrated and studied in certain captive odontocetes and pinnipeds exposed to strong sounds (reviewed by Southall et al. 2007; Finneran 2015). However, there has been no specific documentation of TTS let alone permanent hearing damage, i.e., PTS, in free-ranging marine mammals exposed to sequences of airgun pulses during realistic field conditions.
Additional data are needed to determine the received sound levels at which small odontocetes would start to incur TTS upon exposure to repeated, low-frequency pulses of airgun sound with variable received levels. To determine how close an airgun array would need to approach in order to elicit TTS, one would (as a minimum) need to allow for the sequence of distances at which airgun pulses would occur, and for the dependence of received SEL on distance in the region of the seismic operation (e.g., Breitzke and Bohlen 2010; Laws 2012). At the present state of knowledge, it is also necessary to assume that the effect is directly related to total received energy (SEL); however, this assumption is likely an over-simplification (Finneran 2012). There is recent evidence that auditory effects in a given animal are not a simple function of received acoustic energy (Finneran 2015). Frequency, duration of the exposure, and occurrence of gaps within the exposure can also influence the auditory effect (Finneran and Schlundt 2010, 2011, 2013; Finneran et al. 2010a,b; Popov et al. 2011, 2013; Finneran 2012, 2015; Kastelein et al. 2012b,c; 2013b,c, 2014, 2015a, 2016a,b; Ketten 2012; Supin et al. 2016).
Recent data have shown that the SEL required for TTS onset to occur increases with intermittent exposures, with some auditory recovery during silent periods between signals (Finneran et al. 2010b; Finneran and Schlundt 2011). Studies on bottlenose dolphins by Finneran et al. (2015) indicate that the potential for seismic surveys using airguns to cause auditory effects on dolphins could be lower than previously thought. Based on behavioral tests, no measurable TTS was detected in three bottlenose dolphins after exposure to 10 impulses from a seismic airgun with a cumulative SEL of up to ~195 dB re 1 µPa2 · s (Finneran et al. 2015; Schlundt et al. 2016). However, auditory evoked potential measurements were more variable; one dolphin showed a small (9 dB) threshold shift at 8 kHz (Finneran et al. 2015; Schlundt et al. 2016).

Appendices
Draft Environmental Assessment for USGS Northwest Atlantic, 2018 Page 143
Recent studies have also shown that the SEL necessary to elicit TTS can depend substantially on frequency, with susceptibility to TTS increasing with increasing frequency above 3 kHz (Finneran and Schlundt 2010, 2011; Finneran 2012). When beluga whales were exposed to fatiguing noise with sound levels of 165 dB re 1 μPa for durations of 1–30 min at frequencies of 11.2–90 kHz, the highest TTS with the longest recovery time was produced by the lower frequencies (11.2 and 22.5 kHz); TTS effects also gradually increased with prolonged exposure time (Popov et al. 2013). Additionally, Popov et al. (2015) demonstrated that the impacts of TTS include deterioration of signal discrimination. Kastelein et al. (2015b) reported that exposure to multiple pulses with most energy at low frequencies can lead to TTS at higher frequencies in some cetaceans, such as the harbor porpoise.
Popov et al. (2016) reported that TTS produced by exposure to a fatiguing noise was larger during the first session (or naïve subject state) with a beluga whale than TTS that resulted from the same sound in subsequent sessions (experienced subject state). Similarly, several other studies have shown that some marine mammals (e.g., bottlenose dolphins, false killer whales) can decrease their hearing sensitivity in order to mitigate the impacts of exposure to loud sounds (e.g., Nachtigall and Supin 2013, 2014, 2015, 2016).
Previous information on TTS for odontocetes was primarily derived from studies on the bottlenose dolphin and beluga, and that for pinnipeds has mostly been obtained from California sea lions and elephant seals (see § 3.6.4.3, § 3.7.4.3, § 3.8.4.3 and Appendix E of the NSF-USGS PEIS). Thus, it is inappropriate to assume that onset of TTS occurs at similar received levels in all cetaceans or pinnipeds (cf. Southall et al. 2007; NMFS 2016a). Some cetaceans or pinnipeds could incur TTS at lower sound exposures than are necessary to elicit TTS in the beluga and bottlenose dolphin or California sea lion and elephant seal, respectively.
Several studies on TTS in porpoises (e.g., Lucke et al. 2009; Popov et al. 2011; Kastelein et al. 2012c, 2013b,c, 2014, 2015a) have indicated that received levels that elicit onset of TTS are lower in porpoises than in other odontocetes. Kastelein et al. (2012c) exposed a harbor porpoise to octave band noise centered at 4 kHz for extended periods. A 6-dB TTS occurred with SELs of 163 dB and 172 dB for low-intensity sound and medium-intensity sound, respectively; high-intensity sound caused a 9-dB TTS at a SEL of 175 dB. Kastelein et al. (2013b) exposed a harbor porpoise to a long, continuous 1.5-kHz tone, which induced a 14-dB TTS with a total SEL of 190 dB. Popov et al. (2011) examined the effects of fatiguing noise on the hearing threshold of Yangtze finless porpoises when exposed to frequencies of 32– 128 kHz at 140–160 dB re 1 Pa for 1–30 min. They found that an exposure of higher level and shorter duration produced a higher TTS than an exposure of equal SEL but of lower level and longer duration. Popov et al. (2011) reported a TTS of 25 dB for a Yangtze finless porpoise that was exposed to high levels of 3-min pulses of half-octave band noise centered at 45 kHz with an SEL of 163 dB.
For the harbor porpoise, Tougaard et al. (2015) suggested an exposure limit for TTS as an SEL of 100–110 dB above the pure tone hearing threshold at a specific frequency; they also suggested an exposure limit of Leq-fast (rms average over the duration of the pulse) of 45 dB above the hearing threshold for behavioral responses (i.e., negative phonotaxis). According to Wensveen et al. (2014) and Tougaard et al. (2015), M-weighting, as used by Southall et al. (2007), might not be appropriate for the harbor porpoise. Thus, Wensveen et al. (2014) developed six auditory weighting functions for the harbor porpoise that could be useful in predicting TTS onset. Mulsow et al. (2015) suggested that basing weighting functions on equal latency/loudness contours may be more appropriate than M-weighting for marine mammals. Houser et al. (2017) provide a review of the development and application of auditory weighting functions, as well as recommendations for future work.
Initial evidence from exposures to non-pulses has also suggested that some pinnipeds (harbor seals in particular) incur TTS at somewhat lower received levels than do most small odontocetes exposed for
Appendices
Draft Environmental Assessment for USGS Northwest Atlantic, 2018 Page 144
similar durations (Kastak et al. 1999, 2005, 2008; Ketten et al. 2001). Kastelein et al. (2012b) exposed two harbor seals to octave-band white noise centered at 4 kHz at three mean received SPLs of 124, 136, and 148 dB re 1 µPa; TTS >2.5 dB was induced at an SEL of 170 dB (136 dB SPL for 60 min), and the maximum TTS of 10 dB occurred after a 120-min exposure to 148 dB re 1 µPa or an SEL of 187 dB. Kastelein et al. (2013c) reported that a harbor seal unintentionally exposed to the same sound source with a mean received SPL of 163 dB re 1 µPa for 1 h induced a 44 dB TTS. For a harbor seal exposed to octave-band white noise centered at 4 kHz for 60 min with mean SPLs of 124–148 re 1 µPa, the onset of PTS would require a level of at least 22 dB above the TTS onset (Kastelein et al. 2013c). Reichmuth et al. (2016) exposed captive spotted and ringed seals to single airgun pulses with SELs of 165–181 dB and SPLs (peak to peak) of 190–207 re 1 µPa; no low-frequency TTS was observed.
Hermannsen et al. (2015) reported that there is little risk of hearing damage to harbor seals or harbor porpoises when using single airguns in shallow water. Similarly, it is unlikely that a marine mammal would remain close enough to a large airgun array for sufficiently long to incur TTS, let alone PTS. However, Gedamke et al. (2011), based on preliminary simulation modeling that attempted to allow for various uncertainties in assumptions and variability around population means, suggested that some baleen whales whose CPA to a seismic vessel is 1 km or more could experience TTS.
There is no specific evidence that exposure to pulses of airgun sound can cause PTS in any marine mammal, even with large arrays of airguns. However, given the possibility that some mammals close to an airgun array might incur at least mild TTS, there has been further speculation about the possibility that some individuals occurring very close to airguns might incur PTS (e.g., Richardson et al. 1995, p. 372ff; Gedamke et al. 2011). In terrestrial animals, exposure to sounds sufficiently strong to elicit a large TTS induces physiological and structural changes in the inner ear, and at some high level of sound exposure, these phenomena become non-recoverable (Le Prell 2012). At this level of sound exposure, TTS grades into PTS. Single or occasional occurrences of mild TTS are not indicative of permanent auditory damage, but repeated or (in some cases) single exposures to a level well above that causing TTS onset might elicit PTS (e.g., Kastak and Reichmuth 2007; Kastak et al. 2008).
The new noise exposure criteria for marine mammals that were recently released by NMFS (2016a) account for the newly-available scientific data on TTS, the expected offset between TTS and PTS thresholds, differences in the acoustic frequencies to which different marine mammal groups are sensitive, and other relevant factors. For impulsive sounds, such airgun pulses, the thresholds use dual metrics of cumulative SEL (SELcum over 24 hours) and Peak SPLflat. Onset of PTS is assumed to be 15 dB higher when considering SELcum and 6 dB higher when considering SPLflat. Different thresholds are provided for the various hearing groups, including LF cetaceans (e.g., baleen whales), MF cetaceans (e.g., most delphinids), HF cetaceans (e.g., porpoise and Kogia spp.), phocids underwater (PW), and otariids underwater (OW).
Nowacek et al. (2013a) concluded that current scientific data indicate that seismic airguns have a low probability of directly harming marine life, except at close range. Several aspects of the planned monitoring and mitigation measures for this project are designed to detect marine mammals occurring near the airgun array, and to avoid exposing them to sound pulses that might, at least in theory, cause hearing impairment. Also, many marine mammals and (to a limited degree) sea turtles show some avoidance of the area where received levels of airgun sound are high enough such that hearing impairment could potentially occur. In those cases, the avoidance responses of the animals themselves would reduce or (most likely) avoid any possibility of hearing impairment. Aarts et al. (2016) noted that an understanding of animal movement is necessary in order to estimate the impact of anthropogenic sound on cetaceans.
Non-auditory physical effects may also occur in marine mammals exposed to strong underwater pulsed sound. Possible types of non-auditory physiological effects or injuries that might (in theory) occur
Appendices
Draft Environmental Assessment for USGS Northwest Atlantic, 2018 Page 145
in mammals close to a strong sound source include stress, neurological effects, bubble formation, and other types of organ or tissue damage. Gray and Van Waerebeek (2011) have suggested a cause-effect relationship between a seismic survey off Liberia in 2009 and the erratic movement, postural instability, and akinesia in a pantropical spotted dolphin based on spatially and temporally close association with the airgun array. It is possible that some marine mammal species (i.e., beaked whales) are especially susceptible to injury and/or stranding when exposed to strong transient sounds (e.g., Southall et al. 2007). Ten cases of cetacean strandings in the general area where a seismic survey was ongoing have led to speculation concerning a possible link between seismic surveys and strandings (Castellote and Llorens 2016). An analysis of stranding data found that the number of long-finned pilot whale stranding along Ireland’s coast increased with seismic surveys operating offshore (McGeady et al. 2016). However, there is no definitive evidence that any of these effects occur even for marine mammals in close proximity to large arrays of airguns. Morell et al. (2017) examined the inner ears of long-finned pilot whales after a mass stranding in Scotland and reported damage to the cochlea compatible with over-exposure from underwater noise; however, no seismic surveys were occurring in the vicinity in the days leading up to the stranding.
Since 1991, there have been 62 Marine Mammal Unusual Mortality Events (UME) in the U.S. (NMFS 2015a). In a hearing to examine the Bureau of Ocean Energy Management’s 2017–2022 OCS Oil and Gas Leasing Program (http://www.energy.senate.gov/public/index.cfm/hearings-and-business- meetings?ID=110E5E8F-3A65-4BEC-9D25-5D843A0284D3), it was Dr. Knapp’s (a geologist from the University of South Carolina) interpretation that there was no evidence to suggest a correlation between UMEs and seismic surveys given the similar percentages of UMEs in the Pacific, Atlantic, and Gulf of Mexico, and the greater activity of oil and gas exploration in the Gulf of Mexico.
Non-auditory effects, if they occur at all, would presumably be limited to short distances and to activities that extend over a prolonged period. Marine mammals that show behavioral avoidance of seismic vessels, including most baleen whales, some odontocetes, and some pinnipeds, are especially unlikely to incur non-auditory physical effects. The brief duration of exposure of any given mammal, the deep water in the majority of the study area, and the planned monitoring and mitigation measures would further reduce the probability of exposure of marine mammals to sounds strong enough to induce non-auditory physical effects.
Sea Turtles
There is substantial overlap in the frequencies that sea turtles detect versus the frequencies in airgun pulses. We are not aware of measurements of the absolute hearing thresholds of any sea turtle to waterborne sounds similar to airgun pulses. Given the high source levels of airgun pulses and the substantial received levels even at distances many km away from the source, it is probable that sea turtles can also hear the sound source output from distant seismic vessels. In the absence of relevant absolute threshold data, we cannot estimate how far away an airgun array might be audible. Moein et al. (1994) and Lenhardt (2002) reported TTS for loggerhead turtles exposed to many airgun pulses (see § 3.4.4 of the NSF-USGS PEIS). This suggests that sounds from an airgun array might cause temporary hearing impairment in sea turtles if they do not avoid the (unknown) radius where TTS occurs (see Nelms et al. 2016). However, exposure duration during the proposed surveys would be much less than during the aforementioned studies. Also, recent monitoring studies show that some sea turtles do show localized movement away from approaching airguns. At short distances from the source, received sound level diminishes rapidly with increasing distance. In that situation, even a small-scale avoidance response could result in a significant reduction in sound exposure.
The U.S. Navy has proposed the following criteria for the onset of hearing impairment for sea turtles: 232 dB re 1 µPa SPL (peak) and 204 dB re 1 μPa²·s SELcum (weighted) for PTS; and 226 dB peak and 189 dB weighted SEL for TTS (USN 2017). Although it is possible that exposure to airgun sounds could cause
Appendices
Draft Environmental Assessment for USGS Northwest Atlantic, 2018 Page 146
mortality or mortal injuries in sea turtles close to the source, this has not been demonstrated and seems highly unlikely (Popper et al. 2014), especially because sea turtles appear to be highly resistant to explosives (Ketten et al. 2005 in Popper et al. 2014). Nonetheless, Popper et al. (2014) proposed sea turtle mortality/mortal injury criteria of 210 dB SEL or >207 dBpeak for sounds from seismic airguns; however, these criteria were largely based on impacts of pile-driving sound on fish.
The PSOs stationed on R/V Hugh R. Sharp would watch for sea turtles, and airgun operations would be shut down if a turtle enters the designated EZ.

Appendices
Draft Environmental Assessment for USGS Northwest Atlantic, 2018 Page 147
Appendix E. Impact of Ship Noise (additional material for §IV.1c, adopted nearly verbatim from the Draft Scripps EA (LGL, 2017).
Other possible effects of seismic surveys on marine mammals and/or sea turtles include masking by vessel noise, disturbance by vessel presence or noise, and injury or mortality from collisions with vessels or entanglement in seismic gear. The Proposed Action lies entirely within the Atlantic Large Whale Take Reduction Plan Regulated Waters (GARFO, 2015; 50CFR 229), which manages the use of certain fishing equipment to prevent entanglement of particularly North American right, humpbank, minke, and fin whales. Seismic streamers are inherently simpler than longlines, gill nets, trawls, or vertical lines that mark or support various fishing gear. These streamers also move through the water behind a sound source and do not extend more than a few meters below the water’s surface. For all of these reasons, the risk of entanglement with seismic gear is considered lower than that for fishing gear for marine mammals.
Houghton et al. (2015) proposed that vessel speed is the most important predictor of received noise levels. Sounds produced by large vessels generally dominate ambient noise at frequencies from 20–300 Hz (Richardson et al. 1995). However, some energy is also produced at higher frequencies (Hermannsen et al. 2014); low levels of high-frequency sound from vessels has been shown to elicit responses in harbor porpoise (Dyndo et al. 2015). Increased levels of ship noise have been shown to affect foraging by porpoise (Teilmann et al. 2015) and humpback whales (Blair et al. 2016).
Ship noise, through masking, can reduce the effective communication distance of a marine mammal if the frequency of the sound source is close to that used by the animal, and if the sound is present for a significant fraction of time (e.g., Richardson et al. 1995; Clark et al. 2009; Jensen et al. 2009; Gervaise et al. 2012; Hatch et al. 2012; Rice et al. 2014; Dunlop 2015; Erbe et al. 2016; Jones et al. 2017). In addition to the frequency and duration of the masking sound, the strength, temporal pattern, and location of the introduced sound also play a role in the extent of the masking (Branstetter et al. 2013, 2016; Finneran and Branstetter 2013; Sills et al. 2017). In order to compensate for increased ambient noise, some cetaceans are known to increase the source levels of their calls in the presence of elevated noise levels from shipping, shift their peak frequencies, or otherwise change their vocal behavior (e.g., Parks et al. 2011, 2012, 2016a,b; Castellote et al. 2012; Melcón et al. 2012; Azzara et al. 2013; Tyack and Janik 2013; Luís et al. 2014; Sairanen 2014; Papale et al. 2015; Bittencourt et al. 2016; Dahlheim and Castellote 2016; Gospić and Picciulin 2016; Gridley et al. 2016; Heiler et al. 2016; Martins et al. 2016; O’Brien et al. 2016; Tenessen and Parks 2016). Similarly, harbor seals increased the minimum frequency and amplitude of their calls in response to vessel noise (Matthews 2017); however, harp seals did not increase their call frequencies in environments with increased low-frequency sounds (Terhune and Bosker 2016).
Holt et al. (2015) reported that changes in vocal modifications can have increased energetic costs for individual marine mammals. A negative correlation between the presence of some cetacean species and the number of vessels in an area has been demonstrated by several studies (e.g., Campana et al. 2015; Culloch et al. 2016; Oakley et al. 2017). Based on modeling, Halliday et al. (2017) suggested that shipping noise can be audible more than 100 km away and could affect the behavior of a marine mammal at a distance of 52 km in the case of tankers.
Baleen whales are thought to be more sensitive to sound at these low frequencies than are toothed whales (e.g., MacGillivray et al. 2014), possibly causing localized avoidance of the proposed project area during seismic operations. Reactions of gray and humpback whales to vessels have been studied, and there is limited information available about the reactions of right whales and rorquals (fin, blue, and minke
Appendices
Draft Environmental Assessment for USGS Northwest Atlantic, 2018 Page 148
whales). Reactions of humpback whales to boats are variable, ranging from approach to avoidance (Payne 1978; Salden 1993). Baker et al. (1982, 1983) and Baker and Herman (1989) found humpbacks often move away when vessels are within several kilometers. Humpbacks seem less likely to react overtly when actively feeding than when resting or engaged in other activities (Krieger and Wing 1984, 1986). Increased levels of ship noise have been shown to affect foraging by humpback whales (Blair et al. 2016). Fin whale sightings in the western Mediterranean were negatively correlated with the number of vessels in the area (Campana et al. 2015). Minke whales and gray seals have shown slight displacement in response to construction-related vessel traffic (Anderwald et al. 2013).
Many odontocetes show considerable tolerance of vessel traffic, although they sometimes react at long distances if confined by ice or shallow water, if previously harassed by vessels, or have had little or no recent exposure to ships (Richardson et al. 1995). Dolphins of many species tolerate and sometimes approach vessels (e.g., Anderwald et al. 2013). Some dolphin species approach moving vessels to ride the bow or stern waves (Williams et al. 1992). Physical presence of vessels, not just ship noise, has been shown to disturb the foraging activity of bottlenose dolphins (Pirotta et al. 2015) and blue whales (Lesage et al. 2017). Sightings of striped dolphin, Risso’s dolphin, sperm whale, and Cuvier’s beaked whale in the western Mediterranean were negatively correlated with the number of vessels in the area (Campana et al. 2015).
There are few data on the behavioral reactions of beaked whales to vessel noise, though they seem to avoid approaching vessels (e.g., Würsig et al. 1998) or dive for an extended period when approached by a vessel (e.g., Kasuya 1986). Based on a single observation, Aguilar Soto et al. (2006) suggest foraging efficiency of Cuvier’s beaked whales may be reduced by close approach of vessels. Tyson et al. (2017) suggested that a juvenile green sea turtle dove during vessel passes and remained still near the sea floor.
The NSF-USGS PEIS concluded that project vessel sounds would not be at levels expected to cause anything more than possible localized and temporary behavioral changes in marine mammals or sea turtles, and would not be expected to result in significant negative effects on individuals or at the population level. In addition, in all oceans of the world, large vessel traffic is currently so prevalent that it is commonly considered a usual source of ambient sound.
Another concern with vessel traffic is the potential for striking marine mammals or sea turtles (e.g., Redfern et al. 2013). Information on vessel strikes is reviewed in § 3.4.4.4, § 3.6.4.4, and § 3.8.4.4 of the NSF-USGS PEIS. Wiley et al. (2016) concluded that reducing ship speed is one of the most reliable ways to avoid ship strikes. However, McKenna et al. (2015) noted the potential absence of lateral avoidance demonstrated by blue whales and perhaps other large whale species to vessels. The NSF-USGS PEIS concluded that the risk of collision of seismic vessels or towed/deployed equipment with marine mammals or sea turtles exists but is extremely unlikely, because of the relatively slow operating speed (typically 7–9 km/h) of the vessel during seismic operations, and the generally straight-line movement of the seismic vessel. During the proposed cruise, most (70%) of the seismic survey effort is expected to occur at a speed of ~15 km/h, and 30% is expected to occur at 9 km/h. However, the number of seismic survey km are low relative to other fast-moving vessels in the area (see Cumulative Effects section). There has been no history of marine mammal vessel strikes by vessels in the U.S. marine academic research fleet in the past two decades.

Appendices
Draft Environmental Assessment for USGS Northwest Atlantic, 2018 Page 149
Appendix F. Direct Effects
Effects of seismic sound on marine invertebrates (crustaceans and cephalopods), marine fish, and their fisheries are discussed in § 3.2.4 and § 3.3.4 and Appendix D of the NSF-USGS PEIS. Relevant new studies on the effects of sound on marine invertebrates, fish, and fisheries that have been published since the release of the NSF-USGS PEIS are summarized below. Although research on the effects of exposure to airgun sound on marine invertebrates and fishes is increasing, many data gaps remain (Hawkins et al. 2015; Carroll et al. 2016).
(a) Effects of Sound on Marine Invertebrates
Noise effects on marine invertebrates are varied, ranging from no overt reactions to behavioral/ physiological responses, injuries, or mortalities (Aguilar de Soto 2016; Carroll et al. 2016; Edmonds et al. 2016). Unknowns that remain include how particle motion, rather than sound pressure levels, affect invertebrates exposed to sound (Hawkins and Popper 2017). The small amount of available information suggests that invertebrates, particularly crustaceans, may be relatively resilient to airgun sounds (Day et al. 2016a,b). Fewtrell and McCauley (2012) exposed captive squid (Sepioteuthis australis) to pulses from a single airgun, with received sound levels ranging from 120 to 184 dB re 1 dB re 1 μPa2 · s SEL. Increases in alarm responses (ink discharge, change in swim pattern or vertical position in water column) were seen at SELs >147–151 dB re 1 μPa2 · s. Solé et al. (2013) exposed four caged cephalopod species to low-frequency (50–400 Hz) sinusoidal wave sweeps (with a 1-s sweep period for 2 h) with received levels of 157 ± 5 dB re 1 μPa and peak levels up to 175 dB re 1 μPa. Besides exhibiting startle responses, all four species examined received damage to the statocyst, which is the organ responsible for equilibrium and movement. The animals showed stressed behavior, decreased activity, and loss of muscle tone.
When New Zealand scallop (Pecten novaezelandiae) larvae were exposed to recorded seismic pulses, significant developmental delays were reported, and 46% of the larvae exhibited body abnormalities; it was suggested that the malformations could be attributable to cumulative exposure (Aguilar de Soto et al. 2013). The experiment used larvae enclosed in 60-mL flasks suspended in a 2-m diameter by 1.3-m water depth tank and exposed to a playback of seismic sound at a distance of 5–10 cm.
Day et al. (2016a,b, 2017) exposed scallops (Pecten fumatus) and egg-bearing female spiny lobsters (Jasus edwardsi) at a location 10–12 m below the surface to airgun sounds. The airgun source was started ~1–1.5 km from the study subjects and passed over the animals; thus, the scallops and lobsters were exposed to airgun sounds as close as 5–8 m away and up to 1.5 km from the source. Three different airgun configurations were used in the field: 45 in3, 150 in3 (low pressure), and 150 in3 (high pressure), each with maximum peak-to-peak source levels of 191–213 dB re 1 μPa; maximum cumulative SEL source levels were 189–199 dB re 1 μPa2 · s. Exposure to seismic sound was found to significantly increase mortality in the scallops, especially over a chronic time scale (i.e., months post-exposure), although not beyond naturally occurring rates of mortality (Day et al. 2017). Non-lethal effects were also recorded, including changes in reflex behavior time, other behavioral patterns, and haemolymph chemistry (Day et al. 2016b, 2017). The female lobsters were maintained until the eggs hatched; no significant differences were found in the quality or quantity of larvae for control versus exposed subjects, indicating that the embryonic development of spiny lobster was not adversely affected by airgun sounds (Day et al. 2016a,b). However, there were non-lethal effects, including changes in reflex behavior time and haemolymph chemistry, as well as apparent damage to statocysts; no mortalities were reported for control or exposed lobsters (Day et al. 2016a,b).
Appendices
Draft Environmental Assessment for USGS Northwest Atlantic, 2018 Page 150
Fitzgibbon et al. (2017) also examined the impact of airgun exposure on spiny lobster through a companion study to the Day et al. (2016a,b, 2017) studies; the same study site, experimental treatment methodologies, and airgun exposures were used. The objectives of the study were to examine the haemolymph biochemistry and nutritional condition of groups of lobsters over a period of up to 365 days post-airgun exposure. Overall, no mortalities were observed across both the experimental and control groups; however, lobster total haemocyte count decreased by 23–60% for all lobster groups up to 120 days post-airgun exposure in the experimental group when compared to the control group. A lower haemocyte count increases the risk of disease through a lower immunological response. The only other haemolyph parameter that was significantly affected by airgun exposure was the Brix index of haemolymph at 120 and 365 days post-airgun exposure in one of the experiments involving egg-laden females. Other studies conducted in the field have shown no effects on Dungeness crab larvae or snow crab embryos to seismic sounds (Pearson et al. 1994; DFO 2004; Morris et al. 2017).
Payne et al. (2015) undertook two pilot studies which (i) examined the effects of a seismic airgun recording in the laboratory on lobster (Homerus americanus) mortality, gross pathology, histopathology, serum biochemistry, and feeding; and (ii) examined prolonged or delayed effects of seismic airgun pulses in the laboratory on lobster mortality, gross pathology, histopathology, and serum biochemistry. For experiment (i), lobsters were exposed to peak-to-peak and root-mean-squared received sound levels of 180 dB re 1 μPa and 171 dB re 1 µParms respectively. Overall there was no mortality, loss of appendages, or other signs of gross pathology observed in exposed lobster. No differences were observed in haemolymph, feeding, ovary histopathology, or glycogen accumulation in the heptapancreas. The only observed differences were greater degrees of tubular vacuolation and tubular dilation in the hepatopancreas of the exposed lobsters. For experiment (ii), lobsters were exposed to 20 airgun shots per day for five successive days in a laboratory setting. The peak-to-peak and root-mean-squared received sound levels ranged from ~176 to 200 dB re 1 μPa and 148 to 172 dB re 1 µParms respectively. The lobsters were returned to their aquaria and examined after six months. No differences in mortality, gross pathology, loss of appendages, hepatopancreas/ovary histopathology or glycogen accumulation in the hepatopacreas were observed between exposed and control lobsters. The only observed difference was a slight statistically significant difference for calcium-protein concentration in the haemolymph, with lobsters in the exposed group having a lower concentration than the control group.
Celi et al. (2013) exposed captive red swamp crayfish (Procambarus clarkia) to linear sweeps with a frequency range of 0.1–25 kHz and a peak amplitude of 148 dB re 1 µParms at 12 kHz for 30 min. They found that the noise exposure caused changes in the haemato-immunological parameters (indicating stress) and reduced agonistic behaviors. Wale et al. (2013a,b) showed increased oxygen consumption and effects on feeding and righting behavior of shore crabs when exposed to ship sound playbacks.
McCauley et al. (2017) conducted a 2-day study to examine the potential effects of sound exposure of a 150 in3 airgun on zooplankton off the coast of Tasmania; they concluded that exposure to airgun sound decreased zooplankton abundance compared to control samples, and caused a two- to three-fold increase in adult and larval zooplankton mortality. They observed impacts on the zooplankton as far as 1.2 km from the exposure location – a much greater impact range than previously thought; however, there was no consistent decline in the proportion of dead zooplankton as distance increased and received levels decreased. The conclusions by McCauley et al. (2017) were based on a relatively small number of zooplankton samples, and more replication is required to increase confidence in the study findings. Richardson et al. (2017) presented results of a modeling exercise intended to investigate the impact of exposure to airgun sound on zooplankton over a much larger temporal and spatial scale than that employed
Appendices
Draft Environmental Assessment for USGS Northwest Atlantic, 2018 Page 151
by McCauley et al. (2017). The exercise modeled a hypothetical survey over an area 80 km by 36 km during a 35-day period. Richardson et al. (2017) postulated that the decrease in zooplankton abundance observed by McCauley et al. (2017) could have been due to active avoidance behavior by larger zooplankton. The modeling results did indicate that there would be substantial impact on the zooplankton populations at a local spatial scale but not at a large spatial scale; zooplankton biomass recovery within the exposure area and out to 15 km occurred 3 days after completion of the seismic survey.
Leite et al. (2016) reported observing a dead giant squid (Architeuthis dux) while undertaking marine mammal observation work aboard a vessel conducting a seismic survey offshore from Brazil. The seismic vessel was operating 48-airgun array with a total volume of 5085 in3. As no further information on the squid could be obtained, it is unknown whether the airgun sounds played a factor in the death of the squid.
(b) Effects of Sound on Fish
Potential impacts of exposure to airgun sound on marine fishes have been reviewed by Popper (2009), Popper and Hastings (2009a,b), and Fay and Popper (2012); they include pathological, physiological, and behavioral effects. Radford et al. (2014) suggested that masking of key environmental sounds or social signals could also be a potential negative effect from sound. Popper et al. (2014) presented guidelines for seismic sound level thresholds related to potential effects on fish. The effect types discussed include mortality, mortal injury, recoverable injury, temporary threshold shift, masking, and behavioral effects. Seismic sound level thresholds were discussed in relation to fish without swim bladders, fish with swim bladders, and fish eggs and larvae. Hawkins and Popper (2017) cautioned that particle motion as well as sound pressure should be considered when assessing the effects of underwater sound on fishes.
Bui et al. (2013) examined the behavioral responses of Atlantic salmon (Salmo salar L.) to light, sound, and surface disturbance events. They reported that the fish showed short-term avoidance responses to the three stimuli. Salmon that were exposed to 12 Hz sounds and/or surface disturbances increased their swimming speeds.
Peña et al. (2013) used an omnidirectional fisheries sonar to determine the effects of a 3-D seismic survey off Vesterålen, northern Norway, on feeding herring (Clupea harengus). They reported that herring schools did not react to the seismic survey; no significant changes were detected in swimming speed, swim direction, or school size when the drifting seismic vessel approached the fish from a distance of 27 km to 2 km over a 6-h period. Peña et al. (2013) attributed the lack of response to strong motivation for feeding, the slow approach of the seismic vessel, and an increased tolerance to airgun sounds.
Miller and Cripps (2013) used underwater visual census to examine the effect of a seismic survey on a shallow-water coral reef fish community in Australia. The census took place at six sites on the reef before and after the survey. When the census data collected during the seismic program were combined with historical data, the analyses showed that the seismic survey had no significant effect on the overall abundance or species richness of reef fish. This was in part attributed to the design of the seismic survey (e.g., 400 m buffer zone around reef), which reduced the impacts of seismic sounds on the fish communities by exposing them to relatively low SELs (<187 dB re 1 μPa2 · s). Fewtrell and McCauley (2012) exposed pink snapper (Pagrus auratus) and trevally (Pseudocaranx dentex) to pulses from a single airgun; the received sound levels ranged from 120 to 184 dB re 1 dB re 1 μPa2 · s SEL. Increases in alarm responses were seen in the fish at SELs >147–151 dB re 1 μPa2 · s; the fish swam faster and formed more cohesive groups in response to the airgun sounds.

Appendices
Draft Environmental Assessment for USGS Northwest Atlantic, 2018 Page 152
Hastings and Miksis-Olds (2012) measured the hearing sensitivity of caged reef fish following exposure to a seismic survey in Australia. When the auditory evoked potentials (AEP) were examined for fish that had been in cages as close as 45 m from the pass of the seismic vessel and at water depth of 5 m, there was no evidence of TTS in any of the fish examined, even though the cumulative SELs had reached 190 dB re 1 μPa2 · s.
Radford et al. (2016) conducted experiments examining how repeated exposures of different sounds to European seabass (Dicentrarchus labrax) can reduce the fishes’ response to that sound. They exposed postlarval seabass to playback recordings of seismic survey sound (single strike SEL 144 dB re 1 μPa2 · s) in large indoor tanks containing underwater speakers. Their findings indicated that short-term exposure of seismic sound increased the ventilation rate (i.e., opercular beat rate [OBR]) of seabass that were not previously exposed to seismic relative to seabass in controlled, ambient sound conditions. Fish that were reared in tanks that were repeatedly exposed to seismic sound over a 12-week period exhibited a reduced OBR response to that sound type, but fish exposed over the same time period to pile-driving noise displayed a reduced response to both seismic and pile-driving noise. An increased ventilation rate is indicative of greater stress in seabass; however, there was no evidence of mortality or effects on growth of the seabass throughout the 12-week study period.
Popper et al. (2016) conducted a study that examined the effects of exposure to seismic airgun sound on caged pallid sturgeon (Scaphirhynchus albus) and paddlefish (Polyodon spathula); the maximum received peak SPL in this study was 224 dB re 1 µPa. Results of the study indicated no mortality, either during or seven days after exposure, and no statistical differences in effects on body tissues between exposed and control fish.
Andrews et al. (2014) conducted functional genomic studies on the inner ear of Atlantic salmon (Salmo salar) that had been exposed to seismic airgun sound. The airguns had a maximum SPL of ~145 dB re 1 µPa2/Hz and the fish were exposed to 50 discharges per trial. The results provided evidence that fish exposed to seismic sound either increased or decreased their expressions of different genes, demonstrating that seismic sound can affect fish on a genetic level.
Sierra-Flores (2015) examined sound as a short-term stressor in Atlantic cod (Gadus morhua) using cortisol as a biomarker. An underwater loudspeaker emitted SPLs ranging from 104 to 110 dB re 1 µParms. Plasma cortisol levels of fish increased rapidly with noise exposure, returning to baseline levels 20-40 min post-exposure. A second experiment examined the effects of long-term noise exposure on Atlantic cod spawning performance. Tanks were stocked with male and female cod and exposed daily to six noise events, each lasting one hour. The noise exposure had a total SPL of 133 dB re 1 µPa. Cod eggs were collected daily and measured for egg quality parameters as well as egg cortisol content. Total egg volume, floating fraction, egg diameter and egg weight did not appear to be negatively affected by noise exposure. However fertilization rate and viable egg productivity were reduced by 40% and 50%, respectively, compared with the control group Mean egg cortisol content was found to be 34% greater in the exposed group as compared to the control group. Elevated cortisol levels inhibit reproductive physiology for males and can result in a greater frequency of larval deformities for spawning females.
(c) Effects of Sound on Fisheries
Handegard et al. (2013) examined different exposure metrics to explain the disturbance of seismic surveys on fish. They applied metrics to two experiments in Norwegian waters, during which fish

Appendices
Draft Environmental Assessment for USGS Northwest Atlantic, 2018 Page 153
distribution and fisheries were affected by airguns. Even though the disturbance for one experiment was greater, the other appeared to have the stronger SEL, based on a relatively complex propagation model.
Handegard et al. (2013) recommended that simple sound propagation models should be avoided and that the use of sound energy metrics like SEL to interpret disturbance effects should be done with caution. In this case, the simplest model (exposures per area) best explained the disturbance effect.
Hovem et al. (2012) used a model to predict the effects of airgun sounds on fish populations. Modeled SELs were compared with empirical data and were then compared with startle response levels for cod. This work suggested that in the future, particular acoustic-biological models could be useful in designing and planning seismic surveys to minimize disturbance to fishing. Their preliminary analyses indicated that seismic surveys should occur at a distance of 5–10 km from fishing areas, in order to minimize potential effects on fishing.
In their introduction, Løkkeborg et al. (2012) described three studies in the 1990s that showed effects on fisheries. Results of a study off Norway in 2009 indicated that fishes reacted to airgun sound based on observed changes in catch rates during seismic shooting; gillnet catches increased during the seismic shooting, likely a result of increased movement of exposed fish, whereas longline catches decreased overall (Løkkeborg et al. 2012).
Streever et al. (2016) completed a Before-After/Control-Impact (BACI) study in the nearshore waters of Prudhoe Bay, Alaska in 2014 which compared fish catch rates during times with and without seismic activity. The airgun arrays used in the geophysical survey had sound pressure levels of 237 dB re 1μPa0-p, 243 dB re 1µPap-p, and 218 dB re 1μParms. Received SPLmax ranged from 107 to 144 dB re 1 μPa, and received SELcum ranged from 111 to 141 dB re 1μPa2-s for airgun pulses measured by sound recorders at four fyke net locations. They determined that fyke nets closest to airgun activities showed decreases in catch per unit effort (CPUE) while nets further away from the airgun source showed increases in CPUE.
Paxton et al. (2017) examined the effects of seismic sounds on the distribution and behavior of fish on a temperate reef during a seismic survey conducted in the Atlantic Ocean on the inner continental shelf of North Carolina. Hydrophones were set up near the seismic vessel path to measure SPLs, and a video camera was set up to observe fish abundances and behaviors. Received SPLs were estimated at ~202 to 230 dB re 1 µPa. Overall abundance of fish was lower when undergoing seismic activity as opposed to days when no seismic occurred. Only one fish was observed to exhibit a startle response to the airgun shots. The authors claim that although the study was based on limited data, it contributes evidence that normal fish use of reef ecosystems is reduced when they are impacted by seismic sounds.
Morris et al. (2017) conducted a two-year (2015–2016) BACI study examining the effects of 2-D seismic exploration on catch rates of snow crab (Chionoecetes opilio) along the eastern continental slope (Lilly Canyon and Carson Canyon) of the Grand Banks of Newfoundland, Canada. The airgun array used was operated from a commercial seismic exploration vessel; it had a total volume of 4880 in3, horizontal zero-to-peak SPL of 251 dB re 1 μPa, and SEL of 229 dB re 1 μPa2·s. The seismic source came 100 m of the sound recorders in 2016. Overall, the findings indicated that the sound from the commercial seismic survey did not significantly reduce snow crab catch rates in the short-term (i.e., days) or longer term (i.e., weeks) in which the study took place. Morris et al. (2017) attributed the natural temporal and spatial variations in the marine environment as a greater influence on observed differences in catch rates between control and experimental sites than exposure to seismic survey sounds.

Appendices
Draft Environmental Assessment for USGS Northwest Atlantic, 2018 Page 154
Appendix G. Other Effects
Sections adopted nearly verbatim from the Draft Scripps EA (LGL, 2017).
Direct Effects on Seabirds and Their Significance
The underwater hearing of seabirds (including loons, scaups, gannets, and ducks) has recently been investigated, and the peak hearing sensitivity was found to be between 1500 and 3000 Hz (Crowell 2016). Great cormorants were also found to respond to underwater sounds and may have special adaptations for hearing underwater (Hansen et al. 2016; Johansen et al. 2016). Effects of seismic sound and other aspects of seismic operations (collisions, entanglement, and ingestion) on seabirds are discussed in § 3.5.4 of the NSF-USGS PEIS. The NSF-USGS PEIS concluded that there could be transitory disturbance, but that there would be no significant impacts of NSF-funded marine seismic research on seabirds or their populations. Given the proposed activities and the mitigation measures, no significant impacts on seabirds would be anticipated. In decades of seismic surveys carried out by the U.S. academic research fleet, PSOs and other crew members have not observed any seismic sound-related seabird injuries or mortality.
Indirect Effects on Marine Mammals, Sea Turtles, Seabirds, Fish, and Their Significance
The proposed seismic operations would not result in any permanent impact on habitats used by marine mammals, sea turtles, seabirds, or fish, or to the food sources they use. The main impact issue associated with the proposed activities would be temporarily elevated anthropogenic sound levels and the associated direct effects on marine mammals, sea turtles, seabirds, and fish as discussed above.
During the proposed seismic surveys, only a small fraction of the available habitat would be ensonified at any given time. Disturbance to fish species and invertebrates, if any, would be short-term, and fish would return to their pre-disturbance behavior once the seismic activity ceased. Thus, the proposed surveys would have little impact on the abilities of marine mammals or sea turtles to feed in the area where seismic work is planned.