DRAFT Draft for Public Reviewcppdc.org/Transportation_Data/VSTP_Draft_Document... · Draft for...
71
Draft for Public Review January 2013 DRAFT
Transcript of DRAFT Draft for Public Reviewcppdc.org/Transportation_Data/VSTP_Draft_Document... · Draft for...

Draft for Public Review
January 2013
DRAFT

Commonly Used Acronyms
ATM Active Traffic Management
BRAC Base Realignment and Closure
BRT Bus Rapid Transit
CFR Code of Federal Regulations
CIP Capital Improvement Program
CoSS Corridor of Statewide Significance
CTB Commonwealth Transportation Board
DMA Dynamic Mobility Applications
DMV Department of Motor Vehicles
DRPT Virginia Department of Rail and Public Transportation
FHWA Federal Highway Administration
ICM Integrated Corridor Management
IPROC Intercity Passenger Rail Operating and Capital Fund
ISRPPP Interstate System Reconstruction and Rehabilitation Pilot Program
ITS Intelligent Transportation Systems
JLARC Joint Legislative and Audit Review Commission
LRT Light Rail Transit
MAP-21 Moving Ahead for Progress in the 21st Century
MPO Metropolitan Planning Organization
MWCOG Metropolitan Washington Council of Governments
OIPI Office of Intermodal Planning and Investment
OTP3 Office of Transportation Private Public Partnerships
PDC Planning District Commission
PPTA Public-Private Transportation Act
PRIIA Passenger Rail Investment and Improvement Act
RIA Rail Industrial Fund
SAFTEA-LU Safe, Accountable, Flexible, Efficient, Transportation Equity Act
SGR State of Good Repair
SJR297 Senate Joint Resolution 297
SMS Statewide Mobility System
SOV Single Occupancy Vehicles
SRTS Safe Routes to Schools
STARS Strategically Targeted Affordable Roadway Solutions
STIP Statewide Transportation Improvement Program
SYIP Six Year Improvement Program
TAP Transportation Alternatives Program
TDM Transportation Demand Management
TDP Transit Development Plan
TMA Transportation Management Association
TTI Travel Time Index
VDOT Virginia Department of Transportation
VEDP Virginia Economic Development Partnership
VRE Virginia Railway Express
VSTP Virginia Surface Transportation Plan
WMATA Washington Metropolitan Area Transit Authority
DRAFT

TABLE OF CONTENTS
Chapter 1: Introduction ................................................................ 1
What is the Virginia Surface Transportation Plan? ................ 1
How was the VSTP Update Developed? ................................ 4
Chapter 2: Current Initiatives....................................................... 7
Transit & Transportation Demand Management:
Programs and Initiatives .............................................................. 7
Highway Programs and Initiatives ..........................................13
Rail Programs and Initiatives ...................................................19
Cross-Modal Initiatives ..............................................................23
Chapter 3: Key Needs ............................................................... 31
Mobility and Accessibility for All Virginians .........................31
Key Social and Economic Trends ..............................................32
Transit & TDM Needs .................................................................33
Highway Needs...........................................................................35
Rail Needs ....................................................................................41
Cross-Modal Policy Needs ........................................................42
Chapter 4: Recommendations .................................................... 47
Transit & TDM Recommendations ............................................ 47
Highway Recommendations ...................................................... 50
Rail Recommendations ............................................................... 54
Cross-Modal Policy Recommendations ................................... 54
Chapter 5: Conclusion ................................................................ 57
Improving Performance Measures ........................................... 57
Promoting Smart Travel Investments ....................................... 57
Appendix A: Highway Recommendations - Tables ................... 59
DRAFT

This page is intentionally left blank
DRAFT

CHAPTER 1: INTRODUCTION
1
What is the Virginia Surface
Transportation Plan? By the year 2035, will Virginians be able to spend more time with their families and less time in traffic? Will the Commonwealth’s highways and bridges be safer for all types of travelers? Will people of all ages have more transportation choices? Will businesses be able to move their goods efficiently along national and international freight networks? The 2035 Virginia Surface Transportation Plan (VSTP) provides recommendations to answer these questions and critical needs pertaining to the future of the Commonwealth’s transportation networks. Developed through an integrated approach involving numerous statewide and regional transportation agencies as well as key stakeholders and the general public, the plan serves as a blueprint for effective and sustainable statewide transportation investments, policies, and planning initiatives during the coming decades. Under the guidance of the Secretary of Transportation, and consistent with the Governor’s Strategic Multimodal Plan, the VSTP provides recommendations for public transit, rail, and highway projects, as well as facilities and programs that support carpooling, bicycling, walking, and other travel modes.
What Are the Commonwealth’s
Transportation Vision and Goals? The VSTP serves to advance the Vision and Goals set forth in VTrans2035, Virginia’s long-range multimodal transportation policy plan.1 The Vision and Goals are identified below:
1 For more information about VTrans2035, visit www.vtrans2035.org
VTrans2035 Vision Virginians envision a multimodal transportation system that is safe, strategic, and seamless.
Travel for people and goods will be safe and uninterrupted.
Transportation improvements will consider the environment and the quality of life in Virginia’s communities while enhancing economic opportunity.
Transportation improvements will respect and reflect the varied needs of Virginia’s diverse communities and regions.
Investments in transportation will be adequate to meet current and future needs.
Transportation decisions will be guided by sustained, informed involvement of Virginia’s community leaders and citizens.
Full accountability and enduring trust will be the hallmarks of transportation planning and investment decisions throughout the Commonwealth.
DRAFT

CHAPTER 1: INTRODUCTION
2 2
VTrans2035 Goals Safety and Security to provide a safe and secure
transportation system. System Maintenance and Preservation to preserve and
maintain the condition of the existing transportation system. Mobility, Connectivity, and Accessibility to facilitate the easy
movement of people and goods, improve interconnectivity of regions and activity centers, and provide access to different modes of transportation.
Environmental Stewardship to protect the environment and improve the quality of life for Virginians.
Economic Vitality to provide a transportation system that supports economic prosperity.
Coordination of Transportation and Land Use to promote livable communities and reduce transportation costs by facilitating the coordination of transportation and land use.
Program Delivery to achieve excellence in the execution of programs and delivery of service.
How Does the VSTP Relate to
Other State Policies and Plans? The original 2035 VSTP was completed in 2010. This Update was developed in conjunction with updates of VTrans2035 and statewide modal plans for Highways, Rail, and Transit/ Transportation Demand Management (Figure 1-1). These and other transportation agency modal plans are subsets of the VSTP, and are also consistent with VTrans policy goals. Drawing upon information developed for the modal plans, this VSTP 2035 Update provides overarching evaluations of current initiatives, assessments of critical needs, and recommendations for projects, strategies, and polices that meet current and anticipated needs and achieve long-term goals for improving the performance of the surface transportation network.
Fig. 1-1: Transportation Planning at the State Level
How Are VSTP Recommendations Funded? As described in Chapter 2, the Virginia Department of Transportation (VDOT), the Virginia Department of Rail and Public Transportation (DRPT) and Virginia’s other transportation agencies have advanced many recommendations in the 2035 VSTP, including the pursuit of additional funding sources. In addition to agency actions, the General Assembly and the Commonwealth
DRAFT

VIRGINIA SURFACE TRANSPORTATION PLAN UPDATE 3
Transportation Board (CTB), which governs VDOT and DRPT, have passed several noteworthy transportation financing initiatives:
Governor’s Omnibus Transportation Funding Bill: The Governor’s 2011 Omnibus Transportation Funding Bill injected $4 billion into Virginia’s transportation network over three years, providing funding for over 900 projects statewide.2
Public Private Transportation Act (PPTA) Project Pipeline: The Office of Transportation Public Private Partnerships (OTP3) has established a “pipeline” of candidate projects. The pipeline contains both well-established transportation public-private projects long identified as priorities, as well as new transportation concepts under consideration for delivery via Virginia’s Public-Private Transportation Act. Conceptual projects identify potential diverse multimodal opportunities for private sector partnerships with the Virginia Commercial Space Flight Authority, the Department of Motor Vehicles, as well as more traditional roadway and transit concepts through VDOT and DRPT.3 Specific P3 projects are discussed in this report.
Six-Year Improvement Program: The VSTP helps to guide the selection of new projects for inclusion in the Six-Year Improvement Program (SYIP), a document approved by the Commonwealth Transportation Board allocating funds for transportation projects. The Commonwealth Transportation Board approved $11.4 billion in allocations for transportation improvement projects beginning in July 2012. The Six-Year Improvement Program was $800 million more than the FY 2011 program, with most of the increase coming from public and private-sector contributions for the Interstate 95 Express Lanes construction, scheduled to begin this year in Northern Virginia.4
2 For more information on the Governor’s Transportation Funding Bill, visit www.governor.virginia.gov/news/viewRelease.cfm?id=572 3 For more information on PPTA, visit www.vappta.org/ppta_pipeline.asp 4 For more information on the SYIP, visit http://syip.virginiadot.org/Pages/allProjects.aspx
The Financial Climate and Addressing Key Needs Since the completion of the 2035 VSTP, government budgets have decreased and funding sources at all levels are increasingly limited. The Commonwealth has intensified its focus on ensuring fiscal responsibility within government agencies. Now, more than ever, it is critical for state agencies to ensure the government is providing the highest benefits for taxpayers. To help identify the best uses of increasingly limited transportation resources, the Governor’s Office of Intermodal Planning and Investment (OIPI) has developed a coordinated performance-based planning framework to help the Commonwealth’s transportation
agencies make strategic, multimodal investment decisions.
Described in the VTrans2035 Update, the framework will enable transportation decision-makers to use a series of investment priorities to strategically guide future investment choices. In support of the framework, each transportation agency contributes technically focused methods to identify highest needs throughout the state. For example, VDOT is implementing a screening process for developing key recommendations in the Statewide Highway Plan. DRPT is conducting an in-depth gap analysis to determine the areas for new or expanded transit service based on a variety of factors through the Statewide Transit and Transportation Demand Management (TDM) Plan. DRPT is also identifying funding sources for recommended projects through the Allocation Plans for Rail, Transit and TDM.
DRAFT

CHAPTER 1: INTRODUCTION
4 4
How was the VSTP
Update Developed?
What was the Role of Government Agencies? The VSTP Update is a joint effort – a product of stakeholder feedback, public input, and local, regional and state collaboration. State transportation agencies, notably VDOT, DRPT and the Office of Intermodal Planning and Investment (OIPI), were primarily responsible for developing the plan. With consistency in mind, the state agencies often consulted with regional long-range plans and
local comprehensive plans.
State agency representatives understood the need for the plan to be based upon integrated approaches and perspectives, recognizing that the future success of Virginia’s transportation systems depend on how well agencies work together to solve the Commonwealth’s most pressing transportation issues. As such, the VSTP 2035 Update not only includes analysis and recommendations for each travel mode, but also makes strides toward a more
collaborative, integrated approach to transportation planning.
How was the Public Involved? Public input was instrumental to the development of the 2035 VSTP Update and associated plans and studies. As described in this section, comments were collected throughout the year 2012 via four public meetings, a month-long online “virtual open house,” and ongoing website input, as well as nine SYIP meetings held in each construction district. Additional outreach efforts beyond those described here were conducted for the modal plans, particularly
with stakeholder groups.
Four meetings were held in the summer of 2012 at which members of the public provided valuable input on the 2035 VSTP update as well as the VTrans2035 update. The open-house style meetings were held at central locations throughout the Commonwealth as
noted below:
The public meetings offered various opportunities for feedback, opening the floor for verbal remarks and providing modal-specific comment cards. The written comments were categorized by
transportation mode and by location.
In addition to on-site meetings, a virtual open house was made available through the Office of Intermodal Planning and Investment website from August 2, 2012 through August 31, 2012. The virtual site included all materials available at the on-site meetings and provided interactive features to help guide participants through the site. The Office of Intermodal Planning and Investment also hosted a web portal that allowed the public to submit electronic feedback throughout the entire process. The VTrans website includes
documentation of the meetings and a summary of the comments.
DRAFT

VIRGINIA SURFACE TRANSPORTATION PLAN UPDATE 5
In all, the public comments touched on a variety of topics and highlighted a range of transportation needs and deficiencies. The following list summarizes recurring themes and heavily emphasized
topics:
Follow clearly definable goals.
Recognize that needs vary across regions.
Look to other states, counties and cities for guidance.
Focus growth in existing communities.
Invest in a multi-modal transportation system.
Increase connectivity between various modes.
Maintain infrastructure including sidewalks and trails.
Invest in bicycle and pedestrian facilities.
Invest in public transportation and increase access to transit.
How is the VSTP Update Organized? The VSTP Update contains 5 chapters, beginning with an introduction and transitioning into discussions of current initiatives,
key needs, recommendations, and conclusions.
Chapter 1 provides the introduction to the VSTP, identifying the plan’s role in Virginia’s transportation planning framework.
Chapter 2 reviews current initiatives for Transit, Highways, and Rail and concludes with a Cross-Modal section. The Cross-Modal section is new to the VSTP and represents a concerted effort to look beyond the independent agencies and toward a multi-modal, multi-jurisdictional, and multi-agency approach to transportation planning. For the purposes of this Update, Cross-Modal projects and initiatives address Freight, Park & Ride, Intelligent Transportation Systems (ITS) and Public-Private Initiatives.
Chapter 3 reviews key needs for Transit, Highways, Rail and Cross-Modal elements.
Chapter 4 provides recommendations for Transit, Highways, Rail and Cross-Modal elements.
Chapter 5 delivers a brief conclusion, looking at the future of
Virginia’s transportation systems.
DRAFT

CHAPTER 1: INTRODUCTION
6 6
This page is intentionally left blank
DRAFT
CHAPTER 2: CURRENT INITIATIVES
7
Transit & Transportation Demand
Management: Programs and Initiatives
Existing Transit Service Existing transit services in Virginia range from high capacity urban rail and commuter rail services to on-demand services in rural areas that often serve as last-resort transportation.
Currently, 62 transit agencies provide urban and rural transit service, as shown in Figure 2-1. Significant portions of the state do
not presently receive any transit service.
Existing TDM Programs Transportation Demand Management programs focus on people-oriented transportation choices and shared-ride transportation solutions to help people make the most efficient use of transportation networks and services. The core mission of TDM is to move more people in fewer vehicles, to shift travel times to reduce peak period traffic, and/or to eliminate travel needs altogether
through strategies such as telework.
Statewide TDM is accomplished through a unique partnership between DRPT, 18 local commuter assistance programs, Metropolitan Planning Organizations (MPOs), various Transportation Management Associations (TMAs) and VDOT. Heavy emphasis is placed on business-to-business promotion to assist employers in starting or expanding employee transportation programs. DRPT also provides technical and financial support to local commuter assistance agencies through grant programs,
research, training, and marketing assistance.
As shown in Figure 2-2, 14 programs and three TMAs provide TDM services. Significant portions of the state do not currently receive
any TDM services.
VDOT complements DRPT’s TDM programs through demand-side strategies such as the recently implemented Demand Management Program, which seeks to facilitate a shift from Single Occupancy Vehicle (SOV) use to travel by foot, bicycle, and/or shared rides. Other VDOT demand-side strategies include the following, which are described further under the Highways and Cross-Modal
sections of this chapter, include:
Using Intelligent Transportation Systems (ITS) to redistribute congestion;
Implementing Park & Ride policies;
Conducting outreach and education;
Promoting telework; and
Accommodating bicycle and pedestrian needs.
Transit Initiatives The following discussion provides an overview of some of the key Transit and TDM projects being implemented throughout the Commonwealth. In addition to these expansions, supporting maintenance and achieving a state of good repair are priorities for the Commonwealth, particularly with respect to replacement of
rolling stock and buses.
DRAFT

CHAPTER 2: CURRENT INITIATIVES
8 8
Fig. 2-1: Existing Transit Service
DRAFT

VIRGINIA SURFACE TRANSPORTATION PLAN UPDATE 9
Fig. 2-2: Existing Transit Programs
DRAFT
CHAPTER 2: CURRENT INITIATIVES
10 10
Transit Study Committee (SJR297) The Senate Joint Resolution 297 (SJR297), passed by the Virginia General Assembly during the 2011 Legislative Session, represents a move towards a more performance-based allocation methodology for limited public transit operating funds. The goal of SJR297 was to propose changes to the Code of Virginia that help maximize the benefits to public transportation and establish an efficient funding allocation process. A study group, tasked with developing an alternative funding methodology, recommended a funding model for transit operating assistance that includes both a formula component and a performance-based component that is
applied within peer groups of similar systems.
As proposed in the study report, the formula-based approach awards funding based on ridership and operating expenses, while the performance-based allocation methodology is centered on standard transit industry performance measures, as acknowledged by the study workgroup. The CTB would reevaluate the proposed measures, with public input, every three years, followed by a one year notice prior to implementation of any changes. Under the reform proposal, local governments and local transit operators would continue to make their own decisions with respect to their operations. The new approach generates several potential benefits
for transit systems such as the following:
Predictable matching rates for capital projects;
Potential to increase state funding based on efficient performance;
More up-to-date budget information to support plans for current service and proposed expansions;
Ability to shift unused state capital grant funds to operating expenses, making programs more stable and providing for a reserve fund;
Regular program adjustments with public input during three-year reviews;
Continued support for locally-based transit system decisions; and
Improved service efficiency.
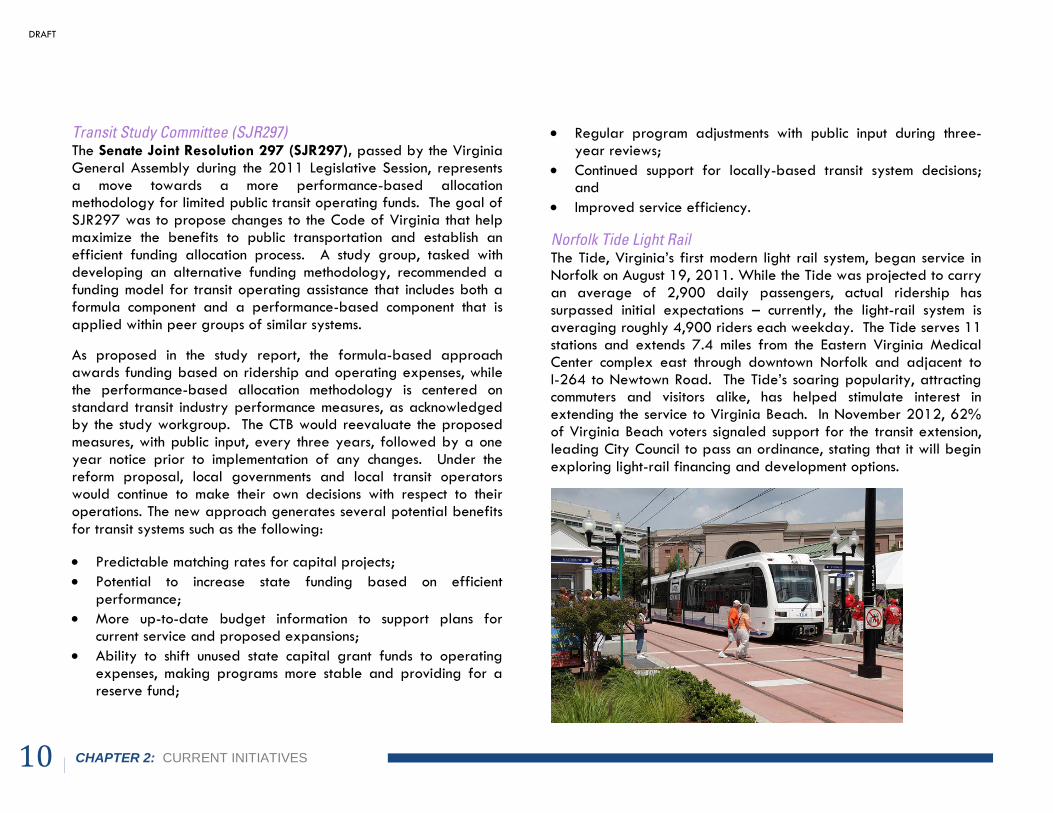
Norfolk Tide Light Rail The Tide, Virginia’s first modern light rail system, began service in Norfolk on August 19, 2011. While the Tide was projected to carry an average of 2,900 daily passengers, actual ridership has surpassed initial expectations – currently, the light-rail system is averaging roughly 4,900 riders each weekday. The Tide serves 11 stations and extends 7.4 miles from the Eastern Virginia Medical Center complex east through downtown Norfolk and adjacent to I-264 to Newtown Road. The Tide’s soaring popularity, attracting commuters and visitors alike, has helped stimulate interest in extending the service to Virginia Beach. In November 2012, 62% of Virginia Beach voters signaled support for the transit extension, leading City Council to pass an ordinance, stating that it will begin
exploring light-rail financing and development options.
DRAFT

VIRGINIA SURFACE TRANSPORTATION PLAN UPDATE 11
Dulles Metro Extension The Dulles Corridor Metrorail Project is the largest transportation infrastructure project in the United States. The Washington Metropolitan Area Transit Authority (WMATA) will operate the 23-mile extension of the existing Metrorail system, which will run from East Falls Church to Ashburn (see Figure 2-3). The extension will serve Tysons Corner, Virginia's largest employment center, and the Reston-Herndon area, the state's second largest employment concentration. It will also provide a one-seat ride from Dulles International Airport to downtown Washington D.C.
Fig. 2-3: Dulles Corridor Metrorail Project Source: Dullesmetro.com
The project includes 11 new stations and is being built in two phases. Phase 1 is underway (as of December 2012) and runs from East Falls Church to Wiehle Avenue on the eastern edge of Reston. The total cost of Phase 1 is $2.6 billion. Phase 2 will run from Wiehle Avenue to Ashburn in eastern Loudoun County. Phase 2 is expected to cost $3.2 billion, with construction finishing in 2018.
Metro’s Capital Improvement Program The Washington Metropolitan Transit Authority (Metro) is investing in the largest and most aggressive capital program since its construction; it is literally being rebuilt to provide safer and more reliable service through its Capital Improvement Program (CIP). The CIP will deliver capital projects that improve safety, enhance reliability, and continue to rebuild Metro’s infrastructure and equipment to achieve a state of good repair. Additional system improvements, including the purchase of state of the art rail cars and increased fare payment options will enhance the customer experience. In FY12, Metro’s CIP investment totaled over $770 million, which was a 26% increase over FY11.
VRE Initiatives The Virginia Railway Express (VRE) Spotsylvania Station and Platform project provides for the design and construction of a new, ADA-accessible platform and head house with public restrooms and canopy used by the Virginia Railway Express (VRE) passenger trains for commuter rail service. By providing access to rail service, the new station will support efforts to remove automobiles from the interstate, thereby reducing interstate congestion and improving the flow of goods. The station is an important element of the network of safely connected intermodal services that enhance the commuting experiences and increase VRE ridership. The timing of the $3.4 million station and platform construction directly coincides with installation of a VRE Hamilton to Crossroads Third Main Track project. The $32.5 million Third Main Track project
DRAFT

CHAPTER 2: CURRENT INITIATIVES
12 12
represents an operational component to improve efficiency and increase on-time performance of passenger and freight rail service and minimize disruptions within this CSX corridor.
Super NoVa Transit/TDM Vision Plan The Commonwealth of Virginia completed the Super NoVa Transit and TDM Vision Plan in late 2012. The DRPT-defined super region for this planning effort encompasses Northern Virginia localities and the jurisdictions extending from Northern Virginia to Caroline County to the south, Culpeper County to the west and Frederick County to the northwest. The plan involved coordination
with Maryland, West Virginia, and the District of Columbia.
The Vision Plan evaluated current transit service and TDM programs, existing and future land use, population and employment conditions, travel patterns and trends, and projected travel demand as a basis for the development of a multi-horizon vision for transit and TDM in the super region. The plan also identified a wide range of transit mode and transportation program enhancements
for:
Local, express, rapid, and priority bus;
Fixed guideway transit – streetcar, light rail transit, heavy rail transit, commuter rail, and intercity passenger rail; and
Transportation demand management.
The Super NoVa Transit and TDM Vision Plan recognized the purposeful connection between land use and transportation, today and into the future. In addition, the Vision Plan identified realistic, but visionary, strategies for enhancing mobility through non-single occupant auto means. The study’s planning efforts culminated in the development of recommendations for a wide range of transit modes as well as TDM programs and infrastructure.
TDM Initiatives TDM services aim to improve mobility by promoting options to reduce reliance on single-occupant vehicles (SOV). Toward this end,
DRPT has recently helped launch several prominent TDM initiatives:
Beginning in 2009, DRPT started requiring all agencies receiving TDM grant funds to develop Long-Range Transportation Demand Management Plans. The plans provide long-term planning, goals, strategies, performance management and budgeting guidance for the operation of TDM programs throughout the Commonwealth. The plans include a 25-year planning horizon; near-term recommendations (1-6 year) will be consistent with the SYIP and Statewide Transportation Improvement Program (STIP).
DRPT also developed the State of the Commute Report to gain information on commuting trends and attitudes in Virginia. An understanding of current commuting trends and behavior is essential to better plan transit and transportation demand management improvements that provide highway congestion relief. The Metropolitan Washington Council of Governments (MWCOG) administered the survey for the Northern Virginia region and DRPT surveyed the remaining markets in Virginia. The results provide a snapshot of the current statewide commuting environment and help identify the similarities and differences in mature and evolving commuter markets. This survey was updated in 2012.
Telework, also known as telecommuting, enables employees to work from home, or a location that is closer to home, for some portion of their weekly work schedules. Telework!VA provides a one-stop online resource for businesses to start or expand a
DRAFT

VIRGINIA SURFACE TRANSPORTATION PLAN UPDATE 13
formal telework program.5 By encouraging employees to perform some or all of their duties without commuting to the office, companies can help reduce traffic congestion, improve air quality and create a flexible workspace. Many businesses experience bottom line benefits from a telework program.
Commonwealth Commuter Choice is a commuter assistance program for state employees who commute to work using qualified vanpools or transit services. Executive Order 71 (01) created Commonwealth Commuter Choice and directs all state agencies to provide a tax-free qualified transportation fringe benefit to full-time employees who regularly commute to their offices in the Northern Virginia and Fredericksburg areas using a qualified vanpool or transit service. The benefit amount must be equal to the employee’s actual monthly cost of commuting, up to the maximum allowable under federal regulations (January 1, 2012; $125 per month).
All executive branch agencies with offices in the counties of Arlington, Fairfax, Loudoun, Prince William, Spotsylvania and Stafford, and the cities of Alexandria, Fairfax, Falls Church, Fredericksburg, Manassas and Manassas Park must provide a Commuter Choice benefit program for full-time employees who regularly report to work in those localities. State agencies are also encouraged to provide the same transportation benefit to full-time employees who report to work in offices outside of the specified localities. By increasing state employee use of vanpools and transit, Commonwealth Commuter Choice helps reduce traffic congestion, air pollution and preserves energy
resources.
5 For more information on Telework!VA, please visit: http://www.teleworkva.org/
Highway Programs and Initiatives VDOT continues to advance construction projects, despite this period of limited additional sources of transportation
revenue. As noted in Chapter 1, the Governor’s 2011 Omnibus Transportation Funding Bill has allowed the advancement of several key highway projects across the state through bond-funded initiatives. The Commonwealth Transportation Board (CTB) Fiscal Years (FY) 2012-2017 SYIP allocated almost $3 billion in additional construction funding to projects. The subsequent FY 2013-2018 SYIP proposes to increase allocations by almost $800
million. Allocations are based on the following priorities:
Complete projects under construction;
Complete preliminary engineering or right of way phases of other projects;
Maximize federal funding;
Address safety issues by funding deficient bridges and pavement; and
Support transportation projects procured under the Public-Private Transportation Act and the Governor’s ongoing transportation priorities.
The following sub-sections highlight a range of current highway programs and initiatives.
Bicycle and Pedestrian Initiatives The mission of the VDOT State Bicycle and Pedestrian Program is to maximize the utility and safety of non-motorized modes for transportation and recreation. The intent of the Program is to promote coordinated, consistent efforts to shape bicycling and walking policies and practices among state agencies, organizations,
DRAFT
CHAPTER 2: CURRENT INITIATIVES
14 14
advocacy groups and the general public. The program also provides planning assistance to state, regional and local
transportation planners for the following activities:
Bicycle or pedestrian studies and plans;
Design standards;
Education and training;
Development/distribution of bicycle and pedestrian data; and
• Bicycle and pedestrian policy implementation.
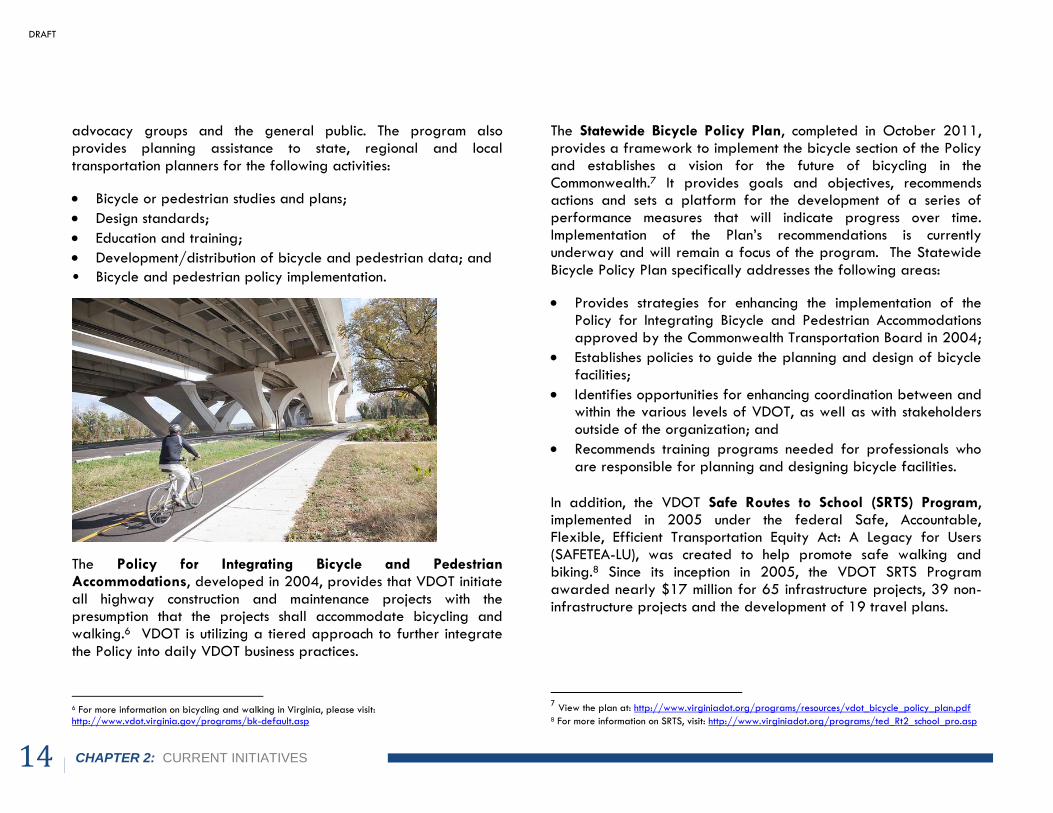
The Policy for Integrating Bicycle and Pedestrian Accommodations, developed in 2004, provides that VDOT initiate all highway construction and maintenance projects with the presumption that the projects shall accommodate bicycling and walking.6 VDOT is utilizing a tiered approach to further integrate
the Policy into daily VDOT business practices.
6 For more information on bicycling and walking in Virginia, please visit: http://www.vdot.virginia.gov/programs/bk-default.asp
The Statewide Bicycle Policy Plan, completed in October 2011, provides a framework to implement the bicycle section of the Policy and establishes a vision for the future of bicycling in the Commonwealth.7 It provides goals and objectives, recommends actions and sets a platform for the development of a series of performance measures that will indicate progress over time. Implementation of the Plan’s recommendations is currently underway and will remain a focus of the program. The Statewide
Bicycle Policy Plan specifically addresses the following areas:
Provides strategies for enhancing the implementation of the Policy for Integrating Bicycle and Pedestrian Accommodations approved by the Commonwealth Transportation Board in 2004;
Establishes policies to guide the planning and design of bicycle facilities;
Identifies opportunities for enhancing coordination between and within the various levels of VDOT, as well as with stakeholders outside of the organization; and
Recommends training programs needed for professionals who
are responsible for planning and designing bicycle facilities.
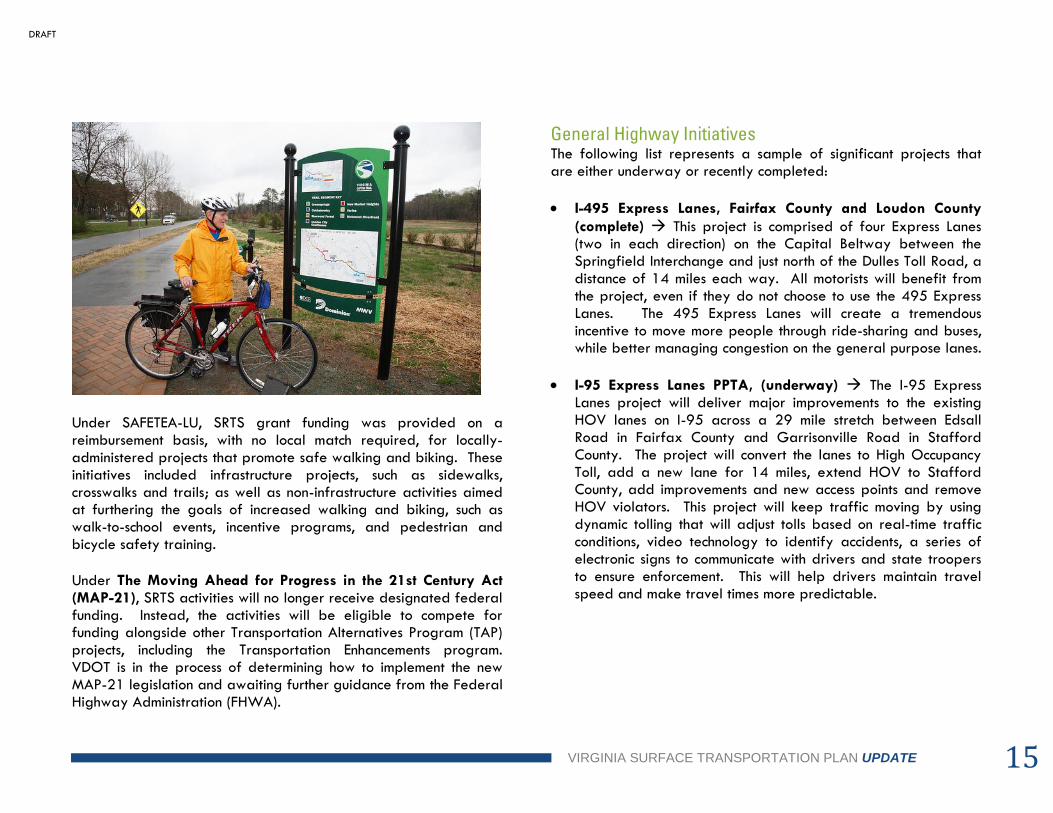
In addition, the VDOT Safe Routes to School (SRTS) Program, implemented in 2005 under the federal Safe, Accountable, Flexible, Efficient Transportation Equity Act: A Legacy for Users (SAFETEA-LU), was created to help promote safe walking and biking.8 Since its inception in 2005, the VDOT SRTS Program awarded nearly $17 million for 65 infrastructure projects, 39 non-infrastructure projects and the development of 19 travel plans.
7 View the plan at: http://www.virginiadot.org/programs/resources/vdot_bicycle_policy_plan.pdf 8 For more information on SRTS, visit: http://www.virginiadot.org/programs/ted_Rt2_school_pro.asp
DRAFT
VIRGINIA SURFACE TRANSPORTATION PLAN UPDATE 15
Under SAFETEA-LU, SRTS grant funding was provided on a reimbursement basis, with no local match required, for locally-administered projects that promote safe walking and biking. These initiatives included infrastructure projects, such as sidewalks, crosswalks and trails; as well as non-infrastructure activities aimed at furthering the goals of increased walking and biking, such as walk-to-school events, incentive programs, and pedestrian and bicycle safety training.
Under The Moving Ahead for Progress in the 21st Century Act (MAP-21), SRTS activities will no longer receive designated federal funding. Instead, the activities will be eligible to compete for funding alongside other Transportation Alternatives Program (TAP) projects, including the Transportation Enhancements program. VDOT is in the process of determining how to implement the new MAP-21 legislation and awaiting further guidance from the Federal Highway Administration (FHWA).
General Highway Initiatives The following list represents a sample of significant projects that are either underway or recently completed:
I-495 Express Lanes, Fairfax County and Loudon County
(complete) This project is comprised of four Express Lanes (two in each direction) on the Capital Beltway between the Springfield Interchange and just north of the Dulles Toll Road, a distance of 14 miles each way. All motorists will benefit from the project, even if they do not choose to use the 495 Express Lanes. The 495 Express Lanes will create a tremendous incentive to move more people through ride-sharing and buses, while better managing congestion on the general purpose lanes.
I-95 Express Lanes PPTA, (underway) The I-95 Express Lanes project will deliver major improvements to the existing HOV lanes on I-95 across a 29 mile stretch between Edsall Road in Fairfax County and Garrisonville Road in Stafford County. The project will convert the lanes to High Occupancy Toll, add a new lane for 14 miles, extend HOV to Stafford County, add improvements and new access points and remove HOV violators. This project will keep traffic moving by using dynamic tolling that will adjust tolls based on real-time traffic conditions, video technology to identify accidents, a series of electronic signs to communicate with drivers and state troopers to ensure enforcement. This will help drivers maintain travel speed and make travel times more predictable.
DRAFT

CHAPTER 2: CURRENT INITIATIVES
16 16
Fairfax County Parkway/ Fair Lakes Interchange, Fairfax County (underway) This project widens Fairfax County Parkway from four to six lanes from south of I-66 to north of Rugby Road (more than three miles). Signals will be eliminated and entrance and exit ramps will be constructed to and from the Fairfax County Parkway, Fair Lakes Parkway and Monument Drive. Shared-use paths and sidewalks will enhance pedestrian access at the interchange and to the Rocky Run Stream Valley Park trail system.
I-66 widening from Route 234 to 29, Prince William County
(complete) VDOT widened 2.5 miles of I-66, from the Route 234 Bypass to Route 29 in Gainesville. Two lanes were added in each direction, one regular and one HOV lane. The median was preserved to accommodate future barrier-separated HOV lanes or transit. The project was completed in August 2010.
Route 28 Improvements PPTA, Fairfax County and Loudon
County (underway) Under this project, six at-grade, signalized intersections will be replaced with high-capacity grade-separated interchanges in the Fairfax County and Loudon County. Ultimate plans call for construction of a total of ten interchanges and widening Route 28 to eight lanes.
I-64 Norview Ave Interchange Improvements, Norfolk
(underway) The Norview Avenue Interchange Improvement Project in Norfolk seeks to eliminate the existing weave movement associated with the on- and off-ramps along this corridor. The existing I-64 east Norview Avenue loop ramp will be replaced with a ramp north of the existing Norview Avenue on-ramp.
Route 460 PPTA, Petersburg to Suffolk (underway) This project entails construction of approximately 55 miles of new four-lane divided limited access highway between Petersburg and Suffolk. The project will extend from the existing U.S. Route 460 near its interchange with Interstate 295 in Prince George County to the U.S. Route 58 bypass just south of the existing U.S. Route 460 in the City of Suffolk.
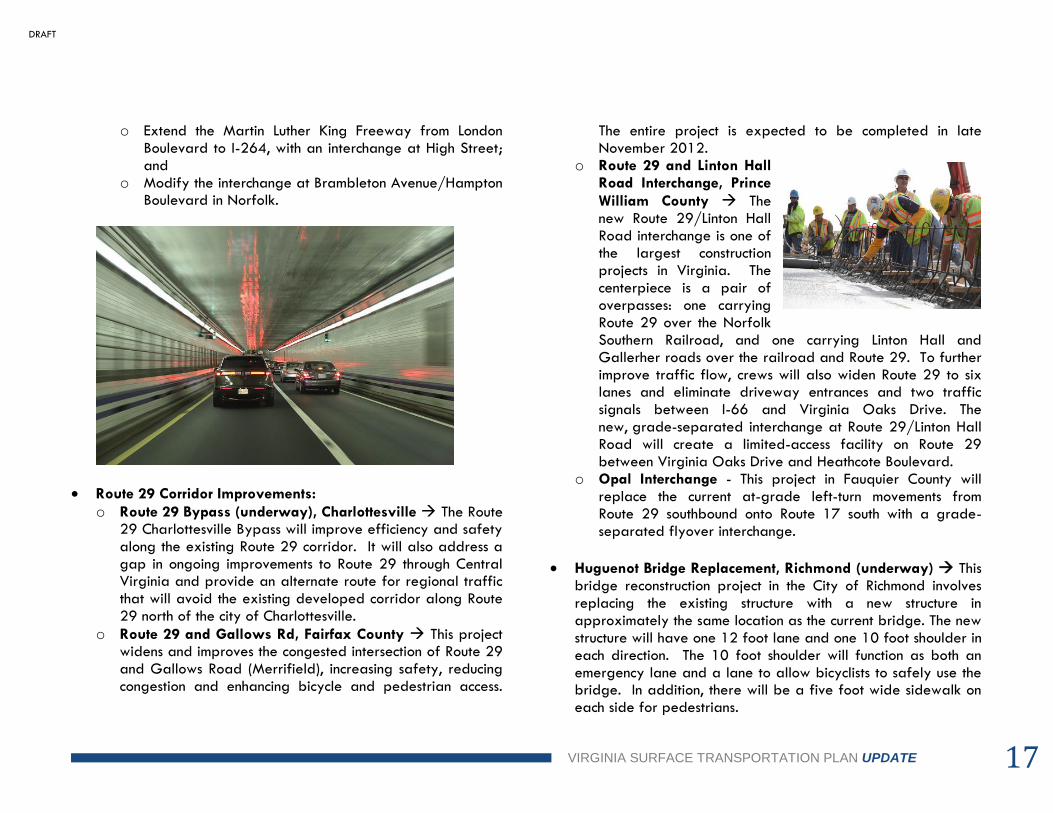
Elizabeth River Tunnels Project PPTA, Norfolk and
Portsmouth (underway) This project is located in Norfolk and Portsmouth and includes a new two-lane tunnel under the Elizabeth River, adjacent to the existing Midtown Tunnel. This project will also:
o Increase transit service between Portsmouth and Norfolk;
o Rehabilitate the existing Midtown Tunnel and both of the Downtown Tunnels;
DRAFT
VIRGINIA SURFACE TRANSPORTATION PLAN UPDATE 17
o Extend the Martin Luther King Freeway from London Boulevard to I-264, with an interchange at High Street; and
o Modify the interchange at Brambleton Avenue/Hampton Boulevard in Norfolk.
Route 29 Corridor Improvements:
o Route 29 Bypass (underway), Charlottesville The Route 29 Charlottesville Bypass will improve efficiency and safety along the existing Route 29 corridor. It will also address a gap in ongoing improvements to Route 29 through Central Virginia and provide an alternate route for regional traffic that will avoid the existing developed corridor along Route 29 north of the city of Charlottesville.
o Route 29 and Gallows Rd, Fairfax County This project widens and improves the congested intersection of Route 29 and Gallows Road (Merrifield), increasing safety, reducing congestion and enhancing bicycle and pedestrian access.
The entire project is expected to be completed in late November 2012.
o Route 29 and Linton Hall Road Interchange, Prince
William County The new Route 29/Linton Hall Road interchange is one of the largest construction projects in Virginia. The centerpiece is a pair of overpasses: one carrying Route 29 over the Norfolk Southern Railroad, and one carrying Linton Hall and Gallerher roads over the railroad and Route 29. To further improve traffic flow, crews will also widen Route 29 to six lanes and eliminate driveway entrances and two traffic signals between I-66 and Virginia Oaks Drive. The new, grade-separated interchange at Route 29/Linton Hall Road will create a limited-access facility on Route 29 between Virginia Oaks Drive and Heathcote Boulevard.
o Opal Interchange - This project in Fauquier County will replace the current at-grade left-turn movements from Route 29 southbound onto Route 17 south with a grade-separated flyover interchange.
Huguenot Bridge Replacement, Richmond (underway) This bridge reconstruction project in the City of Richmond involves replacing the existing structure with a new structure in approximately the same location as the current bridge. The new structure will have one 12 foot lane and one 10 foot shoulder in each direction. The 10 foot shoulder will function as both an emergency lane and a lane to allow bicyclists to safely use the bridge. In addition, there will be a five foot wide sidewalk on each side for pedestrians.
DRAFT

CHAPTER 2: CURRENT INITIATIVES
18 18
I-95 Bridge Replacements, Richmond and Henrico County
(underway) This four year project covers a seven-mile stretch of I-95 between Lombardy Street in Richmond and Upham Brook in Henrico County and includes the replacement of 11 bridges.
I-81 Truck Climbing Lanes, Rockbridge and Montgomery
Counties (underway) This project will add a 12-foot continuous truck climbing lane to southbound I-81 from milepost 120 near Christiansburg to milepost 125.
Tolling/EZ Pass Initiatives Virginia has several toll facilities, located in Northern Virginia, central Virginia and Hampton Roads: the Dulles Toll Road, Dulles Greenway, George P. Coleman Bridge, the Chesapeake Bay-Bridge Tunnel, the Powhite Parkway, Powhite Parkway Extension, the Richmond Downtown Expressway, the Boulevard Bridge and Pocahontas Parkway. The new Jordan Bridge, spanning the Elizabeth River, opened in 2012, and is a fully automated toll facility.
Fig. 2-4: Virginia Toll Facilities
All toll facilities are equipped with E-ZPass, an electronic toll collection system using a transponder that automatically deducts tolls from a prepaid account. E-ZPass is also available in 13 other states on the Eastern Seaboard.
In 2012, Virginia introduced the new E-ZPass Flex, the first-of-its-kind switchable transponder that allows free use to travelers meeting the high occupancy vehicle (HOV) requirements of the new I-495 Express Lanes (Capital Beltway) in Northern Virginia. The EZPass Flex program provides drivers on the new toll lanes with the option of having a faster, less congested commute by allowing the driver to designate when there are three or more people traveling in the vehicle. Tolls vary periodically based on real-time traffic conditions to keep travel flowing along the lanes.
The Federal Highway Administration’s Interstate System Reconstruction and Rehabilitation Pilot Program (ISRRPP) allows a limited number of states to toll some interstate facilities. In 2010, Virginia submitted a proposal to toll portions of I-95, which was approved upon certain conditions in 2011. An updated and expanded application to address the specified conditions was submitted in the summer of 2012.
A recent study showed that 80% of the bridges in the I-95 Corridor are more than 40 years old and 72% of the pavement is deficient. If sufficient improvements are not made by 2035, two-thirds of the facility could be operating at or above capacity, generating a travel time increase of up to 40%. Proposed toll revenue is expected to be used to make pavement, structural, operational, capacity, and safety improvements along the corridor. The revenues would help to close a projected funding gap of $9.6 billion over the next 25 years. VDOT’s ISRRPP application remains under consideration at the time of this writing.
DRAFT

VIRGINIA SURFACE TRANSPORTATION PLAN UPDATE 19
Strategically Targeted Affordable
Roadway Solutions (STARS) STARS is a safety and congestion program involving engineers, planners, and operations staff from state, regional and local agencies. Working together, STARS partners identify “hot spots” along roadways where overlapping safety and congestion problems could be addressed by short term operational improvements. At the core of this new program is an innovative, GIS mapping-based methodology that analyzes and assists with the identification and prioritization of the critical safety and congestion locations throughout the State.
Candidate STARS projects on interstates and/or arterials in urban and/or suburban conditions could include intersections, corridors and/or bottleneck locations. The major goals of the STARS program are to identify roadway improvements that:
Are relatively low in cost (no more than $5,000,000 for a primary project and $30,000,000 for an interstate project);
Address existing mobility and safety problem areas;
Require minimal preliminary engineering (PE) and right-of-way; and
Can be implemented quickly, with a goal of 24 months or less.
Rail Programs and Initiatives As mentioned in the introduction, the VSTP is being updated in conjunction with several modal plans, one of which is the Virginia Statewide Rail Plan. Under the
direction of VTrans, VSTP and the SYIP, the Statewide Rail Plan is intended to help guide Virginia to meet the rail transportation
needs of the traveling public and a diverse, growing economy.
In developing this blueprint, the Rail Plan seeks to profile the Commonwealth’s current rail assets and services, assess the strengths and weaknesses of rail transportation and identify opportunities for improving domestic and international trade. In addition, the plan will identify rail needs, priority corridors, capacity chokepoints and potential improvement projects. The following discussion highlights some of the Commonwealth’s current rail trends and initiatives as they pertain to community and economic development, safety and
security and passenger travel.
DRAFT

CHAPTER 2: CURRENT INITIATIVES
20 20
The Role of Rail in Community
and Economic Development DRPT works closely with Virginia’s economic development agencies to promote and administer the Rail Industrial Access Fund (RIA), which offers state funding for industry rail spur improvements with a local match. In addition to freight access, private sector investors are interested in locations with optimal passenger access, as well. Passenger rail in Virginia offers travelers another option for access to business interests in the northeast, where the cost of living and cost of doing business is much higher. Dependable, efficient rail
service can make a community more attractive to business.
DRPT works with the Virginia Economic Development Partnership (VEDP), which was established by the Virginia General Assembly in 1995 to foster increased expansion of the Commonwealth’s economy by aggressive business recruitment, expansion assistance, and trade development. Responsible for statewide economic development initiatives, the Partnership includes 17 regional economic development organizations within the state; the membership of organizations is comprised of economic development organizations. Together, these state and local agencies offer site selection services, incentive grants, tax exemptions, credits and other means of assistance to attract
business.
VEDP maintains a statewide database of industrial and commercial properties, both publicly and privately owned, with detailed infrastructure and demographic data. The Partnership has a keen interest in promoting sites with superior transportation access that will stand out among competitor locations. Sites with rail access are in demand by companies for whom rail is integral to the supply and distribution network, and increasingly for companies exploring rail as a transportation option at their new Virginia location. By assisting those companies with rail access, DRPT and the Partnership
DRAFT

VIRGINIA SURFACE TRANSPORTATION PLAN UPDATE 21
contribute to job creation, economic vitality, and reduced highway congestion by keeping freight on the rail network that would
otherwise go by truck.
Safety and Security Initiatives Under Virginia Statute and 49 Code of Federal Regulations (CFR), DRPT is the designated State Safety Oversight agency for the Commonwealth. DRPT's State Rail Safety Oversight function involves overseeing safety and security programs for rail fixed guideway transit systems operating in Virginia. DRPT personnel oversee and review system safety and security programs at rail transit agencies in the Hampton Roads and Northern Virginia/Washington, DC regions. In Hampton Roads, DRPT personnel are overseeing the development of the safety and security program for Hampton Roads Transit’s The Tide light rail transit system. In the Northern Virginia/Washington area, DRPT personnel serve on the Tri-state
Oversight Committee (TOC) which oversees rail safety at WMATA.
Major Passenger Projects
DRPT’s Passenger Rail program focuses on projects to serve population centers by improving and expanding existing infrastructure. The Commonwealth is pursuing several passenger rail initiatives, some of which are discussed above in the context of trade, travel, economic development and safety/security:
Amtrak Virginia Continues support of existing services to Washington DC and the Northeast Corridor from Richmond and Lynchburg.
Norfolk Service The Amtrak Virginia extension, serving Norfolk, started in December 2012. DRPT, CSX, Norfolk Southern and the City of Norfolk worked together to complete necessary upgrades for the service, including a new connection between Norfolk Southern and CSX lines, updated rail traffic
operations technology on the route, track and freight siding extensions, and a new turning and service facility. The round-trip train brings intercity passenger rail service to Norfolk for the first time since 1977, and links Norfolk with a single-seat ride to Richmond, Washington, DC and cities as far north as Boston. The cost of this project is $114 million.
I-81/Route 29 This project would reestablish rail service to Roanoke and Bristol. This study is underway.
Arkendale to Powell’s Creek This project will construct a track to address a key bottleneck in the Richmond to DC corridor that slows VRE, Amtrak and CSX trains. It is anticipated that construction will finish in 2017.
Virginia Railway Express This project will expand service from Fredericksburg to a Spotsylvania County station through an additional track. Revenue service for the new Spotsylvania station is expected in late 2013, early 2014.
Southeast High Speed Rail This is a multi-state project that incorporates environmental studies and design to implement faster, more reliable service in multiple areas between Washington DC and the southern cities. The current status of specific sections under study in Virginia are as follows:
o Richmond to Hampton Roads – Tier I NEPA was completed in December 2012.
o Richmond to Raleigh, NC – Final Tier II NEPA is scheduled for 2013 completion. Rail recommendations were approved by both states in April 2012.
o Richmond to Washington DC – Tier II NEPA and preliminary design is scheduled for later 2012, early 2013.
DRAFT
CHAPTER 2: CURRENT INITIATIVES
22 22
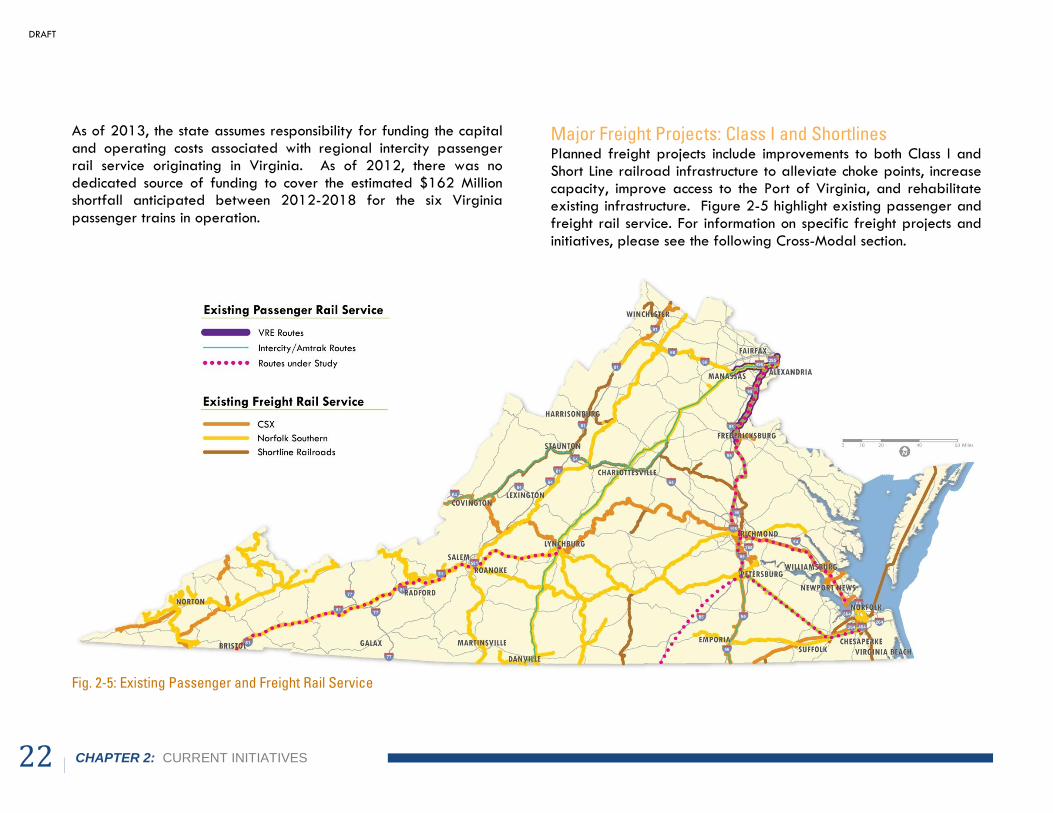
As of 2013, the state assumes responsibility for funding the capital and operating costs associated with regional intercity passenger rail service originating in Virginia. As of 2012, there was no dedicated source of funding to cover the estimated $162 Million shortfall anticipated between 2012-2018 for the six Virginia
passenger trains in operation.
Fig. 2-5: Existing Passenger and Freight Rail Service
Major Freight Projects: Class I and Shortlines Planned freight projects include improvements to both Class I and Short Line railroad infrastructure to alleviate choke points, increase capacity, improve access to the Port of Virginia, and rehabilitate existing infrastructure. Figure 2-5 highlight existing passenger and freight rail service. For information on specific freight projects and
initiatives, please see the following Cross-Modal section.
DRAFT

VIRGINIA SURFACE TRANSPORTATION PLAN UPDATE 23
Cross-Modal Initiatives As described in Chapter 1, the Cross-Modal sections of this Update represent an integration of transportation modes, approaches, policies, and programs. The following sub-sections highlight some of the collaborative Cross-Modal initiatives for Freight, Park & Ride, Intelligent Transportation Systems, and Public-Private
Partnerships.
Freight Initiatives Goods movement is vital to the Commonwealth’s economic success. Nearly a third of Virginia’s growing economy relies significantly on freight transportation. Because of Virginia’s key geographic location along the east coast, our transportation system supports domestic trade for our region and the country. As such, the health of the transportation system is critical to the livelihood of the
Commonwealth and the Nation.
MAP-21 legislation has established an increased emphasis on freight. Congress has called for a National Freight Policy that includes the identification of a National Freight (Highway) Network that provides the highest service to freight movement throughout the nation and to the most significant freight generating activity centers. It also offers an increase to the federal share for projects providing service to freight movement if the project meets certain goals and performance measures; and is included in a state freight plan.
As of 2012, the Virginia Multimodal Freight Transportation Study
will be used to develop a state-wide freight plan that reflects the
MAP-21 required elements.9 Virginia is well ahead of the curve and has already established an initial set of freight policies, strategies, performance measures, trends, needs and issues, all of which are required by MAP-21. The study includes a complete inventory of bottlenecks and strategies that were developed to address heavy truck route conditions and improvements, as well as show evidence of ITS and innovative technology/operations. The Virginia Statewide Multimodal Freight Study (Phase II) consists of
the following:
Statewide Freight Study Identifies projects from all modes (rail, port, airport and highway) that are most important to freight movement, including both programmed near-term projects and potential long-term projects. It also includes potential policies, actions and initiatives that supplement capital projects.
Multimodal Freight Corridor and Sub-region Profiles Provides concise descriptions of the geography, economic structure, commodity flows, transportation facilities and potential capital projects within each of the 11 multimodal freight corridors and four sub-regions in Virginia.
Potential Freight Strategies Strategies have been proposed in several areas, including business information and outreach, intelligent transportation systems, transportation system –
demand management, freight planning and funding.
The freight study evaluated Virginia’s transportation system to support recommendations that enhance the movement of goods for the Commonwealth. Major freight corridors and facilities
highlighted in the study include:
9 VDOT completed the Virginia Multimodal Freight Transportation Study in 2011. The study (Phase I and Phase II) can be viewed at the following site: http://www.vtrans.org/statewide_freight_study.asp
DRAFT
CHAPTER 2: CURRENT INITIATIVES
24 24
Corridors
Highways: Interstates 81, 95, 77, 64, and 85; Principal Arterials US17, US29, and US460; and
Rail Corridors: Norfolk Southern’s Crescent and Heartland
Corridors; CSX’s National Gateway
Intermodal Facilities
Ports: The Ports of Virginia, The Virginia Inland Port, and the AP Maersk Terminal;
Airports: Dulles International Airport, Norfolk International Airport, Richmond International Airport, Roanoke Regional Airport; and
Rail-intermodal: Roanoke Intermodal Facility, CSX Portsmouth
Intermodal Facility, and Norfolk Terminal (Chesapeake)
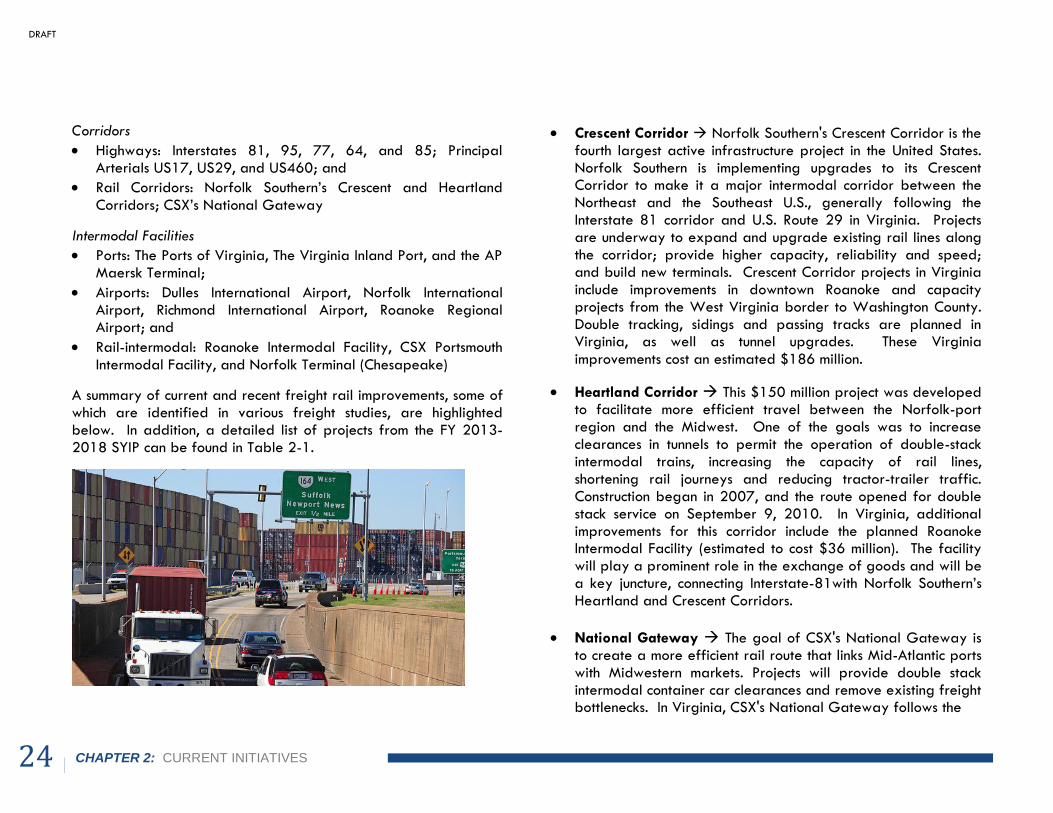
A summary of current and recent freight rail improvements, some of which are identified in various freight studies, are highlighted below. In addition, a detailed list of projects from the FY 2013-2018 SYIP can be found in Table 2-1.
Crescent Corridor Norfolk Southern's Crescent Corridor is the fourth largest active infrastructure project in the United States. Norfolk Southern is implementing upgrades to its Crescent Corridor to make it a major intermodal corridor between the Northeast and the Southeast U.S., generally following the Interstate 81 corridor and U.S. Route 29 in Virginia. Projects are underway to expand and upgrade existing rail lines along the corridor; provide higher capacity, reliability and speed; and build new terminals. Crescent Corridor projects in Virginia include improvements in downtown Roanoke and capacity projects from the West Virginia border to Washington County. Double tracking, sidings and passing tracks are planned in Virginia, as well as tunnel upgrades. These Virginia
improvements cost an estimated $186 million.
Heartland Corridor This $150 million project was developed to facilitate more efficient travel between the Norfolk-port region and the Midwest. One of the goals was to increase clearances in tunnels to permit the operation of double-stack intermodal trains, increasing the capacity of rail lines, shortening rail journeys and reducing tractor-trailer traffic. Construction began in 2007, and the route opened for double stack service on September 9, 2010. In Virginia, additional improvements for this corridor include the planned Roanoke Intermodal Facility (estimated to cost $36 million). The facility will play a prominent role in the exchange of goods and will be a key juncture, connecting Interstate-81with Norfolk Southern’s Heartland and Crescent Corridors.
National Gateway The goal of CSX's National Gateway is to create a more efficient rail route that links Mid-Atlantic ports with Midwestern markets. Projects will provide double stack intermodal container car clearances and remove existing freight bottlenecks. In Virginia, CSX's National Gateway follows the
DRAFT

VIRGINIA SURFACE TRANSPORTATION PLAN UPDATE 25
Interstates 95 and 64 corridors connecting to Hampton Roads. Key Virginia projects include the Virginia Avenue Tunnel project (located in Washington, DC), the Kilby Support Yard project in Hampton Roads and double stack clearance projects in multiple locations. Collectively, these improvements cost $53 million.
Table 2-1: FY 2013-2018 SYIP – Rail Projects
Port of Virginia Craney Island Rail Connector and Norfolk International Terminal Marshalling Yard
Shortlines Track resurfacing, tie replacements, improve signaling and upgrades to allow heavier rail cars and higher speeds
Park & Ride Initiatives Park & Ride facilities offer a convenient and cost-effective commuting alternative and when utilized, the facilities can alleviate congestion and reduce work-site parking demand. There are approximately 300 Park & Ride lots available to commuters throughout Virginia, many of which are regularly at full utilization or above capacity. Virginia’s transportation agencies seek to provide additional Park & Ride facilities to further encourage ridesharing, support transit and aid in easing congestion and
maintenance needs along Virginia’s roadways.
VDOT recently completed a study that reviewed the existing Park & Ride program and made recommendations to improve the program. The Park & Ride Lot Inventory and Usage Study provides an updated inventory of existing lots, a review of other states’ best practices, a Park & Ride lot user survey, Park & Ride website enhancements, and recommended strategies for VDOT to
coordinate with other TDM agencies.10
These efforts will help transportation agencies understand where and when Park & Ride facilities are needed and how to design them to best suit the needs of commuters. VDOT will continue to review existing policies and determine where new guidance may be needed regarding the use of Park & Ride lots as well as the
planning, funding and construction of Park & Ride facilities.
10 For more information on Park & Ride lots and locations, please visit the following website: www.virginiadot.org/parkandride
DRAFT

CHAPTER 2: CURRENT INITIATIVES
26 26
Intelligent Transportation Systems Initiatives Intelligent Transportation Systems are advanced applications which aim to provide innovative services that enable users to be better informed and make safer, more coordinated, and ‘smarter’ use of transportation networks. Public transportation utilizes a range of ITS applications such as GPS transponders on transit vehicles, credit card style fare cards and digital “countdown” signals at rail stations. For highways, ITS technology includes highway cameras, variable speed limits and dynamic messaging signs that change based on roadway conditions. In the case of VDOT’s “Reach the Beach” initiative, dynamic messaging signs will provide real-time travel information to motorists traveling to Virginia Beach or the North Carolina Outer Banks. In addition, VDOT has implemented
statewide traffic information systems such as 511.
VDOT’s new 511 website, 511Virginia.org, was launched in 2008 and offers a range of comprehensive tools that help increase traveler safety and efficiency. Through VDOT’s 511 service,
travelers can receive personalized information including:
Accident and incident alerts;
Live traffic camera images;
Bridge and tunnel reports;
Road construction info;
Free mobile alerts – e-mails or text messages sent whenever conditions change on the roads you most often travel;
Driving directions; and
Gas-saving tips on how to get where you’re going without a car by using trains, buses, subways, ferries and bike paths
Weather conditions.
In the future, it is anticipated that “connected vehicle technology” will deliver transformational safety, mobility and environmental improvements using wireless communications between drivers,
vehicles and transportation infrastructure.
Combined with operational improvements, such as coordinated traffic signals, these ITS strategies can make transportation systems more flexible, efficient and responsive to customer needs. In addition, the improvements provide transit and highway planners with valuable information to identify emerging needs and fine-tune existing routes to optimize the existing surface transportation
system.
In hopes of deploying advanced technologies to solve significant recurring congestion, Virginia has embarked on a series of concurrent initiatives to meet travel needs of its citizens and visitors. The operations element includes an ITS approach to address the
DRAFT
VIRGINIA SURFACE TRANSPORTATION PLAN UPDATE 27
needs and characteristics identified in Virginia’s Statewide Transportation Plan (VTrans2035) for the twelve Corridors of Statewide Significance (CoSS). This methodology provides the opportunity to identify and apply context-sensitive, cost-effective solutions that produce corridor-level benefits, thereby avoiding a
piecemeal approach that simply achieves localized benefits.
A two-pronged approach is being utilized to advance the envisioned operations element: a top-down and bottom-up
approach to reflect planning and real-world experience.
The top-down approach focuses on planning and design elements that reflect industry trends. The approach is subsequently tailored to meet Virginia’s requirements through a statewide Concept of Operations, ITS Architecture development, and Systems Engineering
Analysis.
The bottom-up approach incorporates the lessons learned from actual deployments in efforts to refine and tailor technology applications to better meet the Commonwealth’s needs. This will use before-and-after analyses to improve understanding, and thus expectations, of the benefits of system deployments in the Commonwealth. The bottom-up methodology is also more customer-focused and performance-driven; it builds upon current ITS infrastructural needs by using the Statewide and Regional ITS Architectures for ensuring interoperability among ITS Systems.
A number of promising technology applications have been identified to serve as foundational operations program elements through this effort and include:
Active Traffic Management (ATM) ATM improves mobility and safety using techniques such as speed harmonization (variable speed limits), queue warning (advance alerts of stopped traffic, fog or other obstacles that often result in crashes), and dynamic lane management (including shoulder running during congested periods
with gradual lane closures in advance of lane blockages).
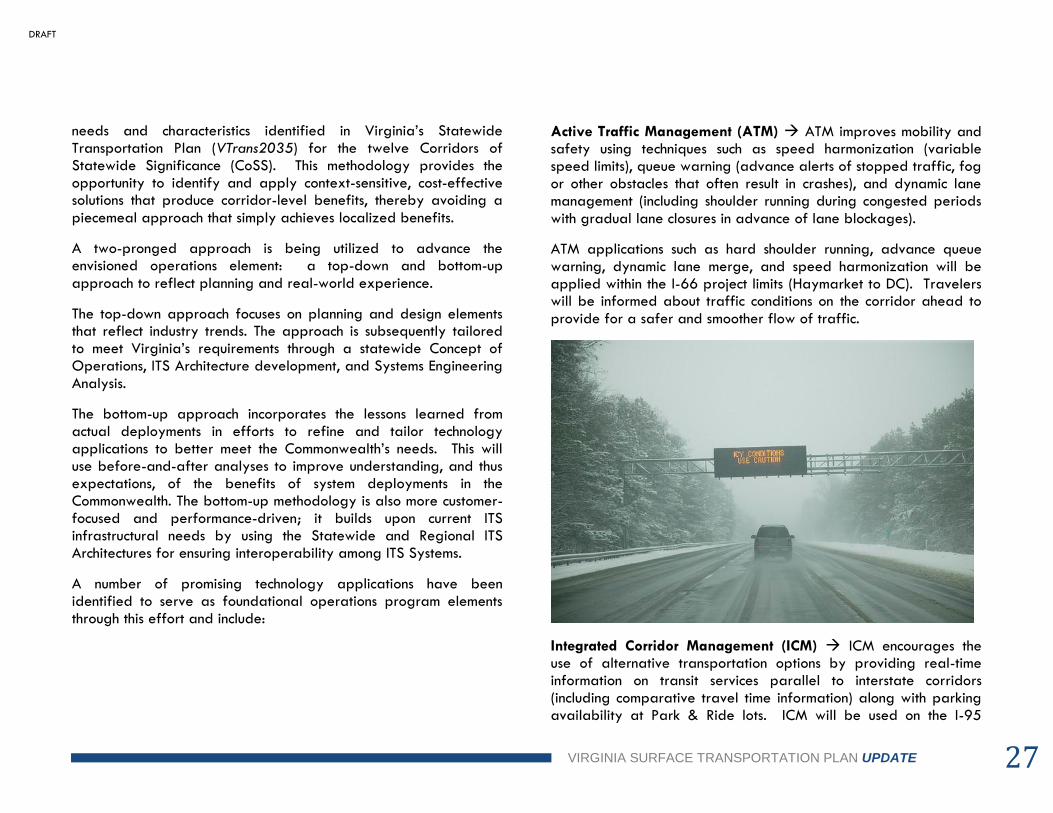
ATM applications such as hard shoulder running, advance queue warning, dynamic lane merge, and speed harmonization will be applied within the I-66 project limits (Haymarket to DC). Travelers will be informed about traffic conditions on the corridor ahead to
provide for a safer and smoother flow of traffic.
Integrated Corridor Management (ICM) ICM encourages the use of alternative transportation options by providing real-time information on transit services parallel to interstate corridors (including comparative travel time information) along with parking availability at Park & Ride lots. ICM will be used on the I-95
DRAFT

CHAPTER 2: CURRENT INITIATIVES
28 28
corridor in Northern Virginia to provide mode, time and route choices to travelers. These strategies will help to manage transportation demand by maximizing the utilization of available capacity across all modes on the corridor. Figure 2-6 provides an example of how ICM can help inform travelers of comparative
travel times.
Fig. 2-6: ICM and Comparative Travel Times
Dynamic Mobility Applications (DMA) DMA involves the improvement of data connectivity/interoperability between elements of the transportation network designed to improve quality of service and overall mobility. As a foundational element, DMA encompasses a broad range of applications for use in the Commonwealth including optimal multimodal route selection, advanced transit information and coordination, and advanced
over-height warning systems.
DMA is being utilized on the Hampton Roads network for tunnels, movable bridges, ferries, urban rail, interstate and arterial systems, making it the most complex operating environment in the Commonwealth. A suite of technology applications is being considered which includes ATM, ICM and DMA, providing network-level travel conditions to avoid chokepoints and restrictions by time
of day for improved mobility of people and goods.
While initial activities will focus on alleviating congestion in and around two of the Commonwealth’s key economic engines (i.e., Northern Virginia and Hampton Roads), other locations will be identified to apply new technologies in the future to address mobility and safety needs.
Public Private Partnership Initiatives A public-private transportation project is one in which a public agency partners with a private firm in planning, financing, constructing and/or operating a road, bridge or other facility. In Virginia, the 1995 Public Private Transportation Act (PPTA) authorized state agencies and local governments to execute agreements with private firms to develop, construct and/or operate transportation facilities.
By partnering with the private sector to build needed infrastructure, the Commonwealth can move forward on projects in a timelier manner than would be possible using traditional funding sources and construction methods - capitalizing on technology, financing
methods, engineering and innovation.
DRAFT

VIRGINIA SURFACE TRANSPORTATION PLAN UPDATE 29
Virginia’s Office of Transportation Public-Private Partnerships (OTP3) was created in 2010 by the Secretary of Transportation to develop and implement a statewide program for PPTA project delivery. The OTP3 works in conjunction with the Secretary of Transportation, Department of Transportation, Department of Rail and Public Transportation, Department of Aviation, Department of Motor Vehicles, Commercial Space Flight Authority, and the Virginia Port Authority and focuses on the development of public-private projects across all modes of transportation.
The PPTA is designed for projects that provide an innovative method of construction or financing that can deliver a project in a faster or less costly manner. Typically, these projects involve tolling or some other method for the private entity to recoup investment costs. Transportation facilities currently authorized for use of the PPTA are roads, bridges, tunnels, overpasses, ferries, mass transit, vehicle parking or similar commercial facilities used for the transportation of persons or goods. To date, Virginia has completed
several PPTA projects:
Route 288
Route 895 Pocahontas Parkway
Route 199
In addition, numerous PPTA projects are underway:
I-95 Express Lanes
Downtown Tunnel/Midtown Tunnel/MLK Extension
Capital Beltway (I-495) Express Lanes
Route 58
Route 28
Coalfields Expressway
Dulles Rail
DRAFT

CHAPTER 2: CURRENT INITIATIVES
30 30
Fig. 2-7: PPTA Projects (as of August 2012) Source: Office of Public-Private Partnerships
DRAFT

CHAPTER 3: KEY NEEDS
31
Mobility and Accessibility
for All Virginians As highlighted in VTrans2035, Virginia must meet the mobility and accessibility needs of its citizens to maintain its status as one of the best places to live and do business.11 Virginians of all ages want and need more travel choices, with a growing preference toward transit and non-motorized transportation options. Utilizing railways for passenger and freight movement and promoting non-motorized transportation options can shift demand from highways to other
forms of travel while reducing congestion.
Virginia must focus on strategies that promote the efficient movement of people and goods to optimize its transportation investments. Promoting strategies for higher-occupancy travel within the existing right-of-way, such as vanpools, transit and bus rapid transit, and High Occupancy Vehicle (HOV) lanes will decrease congestion, improve travel times, and allow the current roadway
system to accommodate more trips. Focus on Freight, Congestion, Choices, and Connections Virginia’s transportation system must continue to adapt to the changing needs of its residents and its economy. The state is becoming increasingly urbanized, the population is aging, roadways are becoming more congested, and trade is becoming more competitive. As described in the following table, four key transportation challenges are particularly influenced by changing socio-economic conditions in the Commonwealth: freight movement,
congestion, travel choices, and rural connectivity.
11 Virginia ranked second in Forbes’ 2012 “Best States to do Business” report.
The VSTP Update identifies a variety of transportation solutions that can help meet Virginia’s future transportation needs including,
but not limited to:
Highway capacity improvements for vehicles;
Rail improvements for moving people and freight;
Suitable mobility options with increased transit assets;
Maintenance of existing transit assets in a state of good repair;
Transportation demand management (TDM) strategies; and
Intelligent transportation system (ITS) technologies that help improve mobility and access for all travelers.
• Intermodal facilities and connections are needed to handle increasing volumes of freight movement through Virginia marine ports, inland ports, rail lines, highways, and airports.
Freight Movement
• Balanced array of transportation investments for passenger and freight movement is needed to reduce traffic congestion in fast-growing urban and suburban areas, especially in the Washington DC metro area.
Congestion
• More travel choices, including public transit, bicycle and pedestrian facilities, are needed to serve growing urban, suburban, and rural populations of people who cannot or choose not to drive, including older adults and people with disabilities.
Travel Choices
• Strategic rural connections are needed to support the revitalization of small cities and communities that struggle with persistent unemployment and poverty rates, especially along Virginia’s southern and western borders.
Rural Connections
DRAFT

CHAPTER 3: KEY NEEDS
32 32
Key Social and Economic Trends
Growth and Wealth Are Concentrated in Urban Regions According to the 2010 U.S. Census, Virginia’s population is over 8.0 million (8,001,024). Forecasts estimate that Virginia’s population
will grow by 2,368,604, by the year 2035.
Projected growth is highly concentrated along the Commonwealth’s eastern “urban crescent.” Planning District Commissions (PDCs) in Northern Virginia, Richmond, Hampton Roads, and the George Washington (Fredericksburg) regions account for 76% of the
population change forecasted for 2035.12
In addition to natural population growth over time, the American military’s Base Realignment and Closure (BRAC) program is expected to draw an additional 355,000 people to 18 bases throughout Virginia. The largest personnel increases will occur in eastern Virginia at Fort Belvoir, Fort Lee, and the Marine Corp Quantico Base. Traffic congestion is likely to increase as jobs grow
and commuting travel rises in the vicinity of expanded bases.
Wealth is also concentrated in urban regions: the PDCs with the highest projected population growth rates (2010-2035) are, in general, also the PDCs with the highest per capita incomes in 2011 (Figure 3-1). These areas tend to have higher congestion levels, but they also have more resources to support multi-modal
transportation investments.
12 A map of Virginia’s PDCs can be found at the Virginia Association of Planning District Commissions’ website: http://www.vapdc.org/displaycommon.cfm?an=1&subarticlenbr=21
Conversely, rural Virginia tends to have higher poverty rates. According to the Virginia Joint Legislative and Audit Review Commission (JLARC), 10.5% of Virginians are living in poverty. The six PDCs with the greatest proportions of people living in poverty are clustered along the rural southern and western borders of Virginia: Southside, Lenowisco, Cumberland Plateau, West Piedmont, Mount Rodgers, and the New River Valley. People living in these areas tend to have longer commutes, yet have less disposable income to pay for gas, while their local governments have to stretch small public coffers widely to support schools, public
safety, and infrastructure.
Fig. 3-1: Percent Change in Population (2011-2035)
and Per Capita Income (2011) Source: VTrans2035 Update
DRAFT

VIRGINIA SURFACE TRANSPORTATION PLAN UPDATE 33
Virginia’s Population is Aging Across America, 10,000 people celebrate their 65th birthday every day, a trend that is expected to continue for the next 20 years. The proportion of Virginians older than 65 is forecasted to increase from 12% in 2010 to more than 18% in 2035. In fact, 2035 projections indicate that the population over 65 will account for as
much as 27% of the total population in select PDCs (Figure 3-2).
The proportion of people with a disability is also likely to increase, since, according to the 2011 American Community Survey, one-third of the population over 65 across the nation is disabled. While the current proportion of the population with a disability is highest (28%) in the rural Cumberland Plateau PDC, the greatest numbers of people with a disability are found in the urban regions of Hampton Roads and Northern Virginia. Therefore, the need for safe, convenient, and efficient travel choices, particularly for non-drivers, is rapidly increasing in urban and rural regions across the
entire Commonwealth.
Fig. 3-2: Percent of Population Age 65 and Older (2035) Source: VTrans2035 Update
Transit & TDM Needs
State of Good Repair Virginia has a large and growing need to replace transit vehicles to meet “State of Good Repair” requirements. Virginia transit agencies of all sizes have a large backlog of
vehicles that have exceeded their useful lives.
Between now and the year 2040, ongoing vehicle replacement will continue to be a pressing funding issue, even if systems do not grow to match population and employment growth. As systems expand,
vehicle replacement needs will also grow.
Capacity Expansion Needs Capacity expansion extends service to areas where it is not currently provided, expands existing services to meet growing demand due to population and employment growth, and funds major capital investments in high demand corridors. Figure 3-3,
below, identifies these needs across the Commonwealth.
Service Expansion At a minimum, human services transit is needed in all areas of the state. Many areas need expansion of existing transit and TDM services to meet increased demand, especially as they transition to more intensely developed area types. Transit and TDM improvements are intended to continue to make public transportation and TDM more viable elements of Virginia’s total transportation system, while relieving highway congestion.
As referenced earlier, the Super NoVa Transit/TDM Vision Plan evaluated growth dynamics and will ultimately help in the identification of regional transit and TDM needs. Figure 3-4 projects regional activity in 2040, accounting for a combination of
population and employment density.
DRAFT

CHAPTER 3: KEY NEEDS
34 34
Capital Investments Future capital investments must reflect the transit visions of major metropolitan areas and address the large demand for added transportation capacity in key corridors. In some cases, these capital investments will relate to prominent projects in high-density corridors, often costing more than $100 million. They are designed to advance major transit projects in Virginia’s most populous urban areas, helping fund initiatives for heavy rail, commuter rail, light
rail transit (LRT), bus rapid transit (BRT) and streetcar.
Fig. 3-3: Transit Service Needs
DRAFT

VIRGINIA SURFACE TRANSPORTATION PLAN UPDATE 35
Fig. 3-4: Activity Density (People & Jobs), 2040 Source: Super NoVa Transit/TDM Vision Plan, October 2012.
Highway Needs Capacity and Congestion on the
Statewide Mobility System Section 33.1-23.03 of the Code of Virginia requires the development of an assessment of highway capacity needs every four years. Identifying capacity needs is a critical
step in the development of long-range planning recommendations as it tells us not only where we have congestion today, but where
we can anticipate congestion in the future.
To meet the code requirement and help make the best decisions for the future of Virginia’s highways, VDOT presents a capacity based needs assessment on the Statewide Mobility System (SMS) network of roadways as part of the development of the Statewide Highway
Plan.
Virginia’s SMS network includes 5,769 centerline miles of highways that have statewide significance. SMS highways play an essential role in the movement of people and goods by ensuring that all regions of Virginia are reasonably accessible. The routes that comprise the SMS include National Highway System facilities, hurricane evacuation routes, multi-lane primaries that provide regional connectivity as well as other primaries that serve vital links between jurisdictions. They typically support high-speed, long distance travel and permit inter-regional connectivity. While the SMS represents only 8% of Virginia’s highway miles, it carries 66%
of all vehicle miles traveled on the Commonwealth’s roads.
DRAFT

CHAPTER 3: KEY NEEDS
36 36
The needs assessment performed for the 2035 VSTP resulted in a Level of Service analysis on the SMS to evaluate roadway capacity. This congestion measure was combined with safety data indicating locations with high crash rates and fatalities to present the 2035 roadway needs. Figure 3-5 displays the results of this analysis.
Fig. 3-5: Crash Density and 2035 Level of Service
To analyze capacity in greater depth for the 2035 Update, VDOT completed an analysis of Travel Time Index data. Travel Time Index (TTI) is defined as a ratio of the average peak period travel time as compared to a free-flow travel time. For example, a corridor with a TTI = 1.5 indicates that travel time during “rush hour” is 1.5 times longer than free flow travel time. TTI has the advantages of being a user perception measure that is easily understood by drivers and also a measure of network reliability, allowing drivers to anticipate delay at certain time periods.
DRAFT
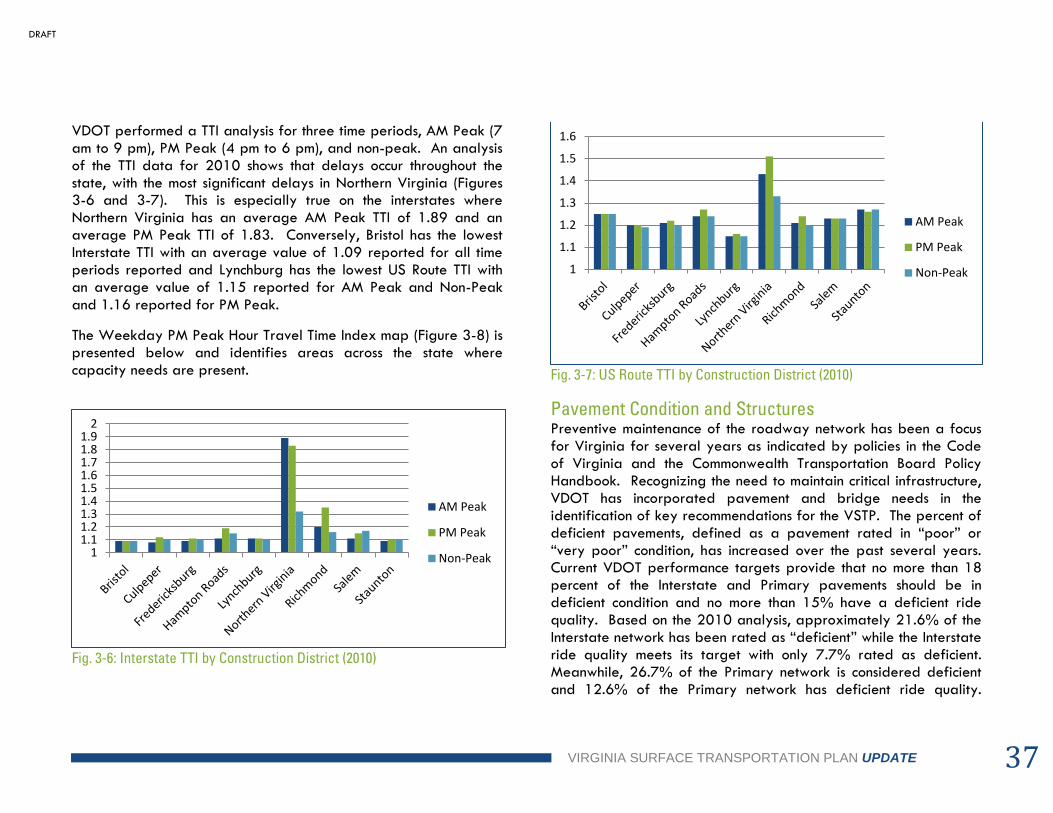
VIRGINIA SURFACE TRANSPORTATION PLAN UPDATE 37
VDOT performed a TTI analysis for three time periods, AM Peak (7 am to 9 pm), PM Peak (4 pm to 6 pm), and non-peak. An analysis of the TTI data for 2010 shows that delays occur throughout the state, with the most significant delays in Northern Virginia (Figures 3-6 and 3-7). This is especially true on the interstates where Northern Virginia has an average AM Peak TTI of 1.89 and an average PM Peak TTI of 1.83. Conversely, Bristol has the lowest Interstate TTI with an average value of 1.09 reported for all time periods reported and Lynchburg has the lowest US Route TTI with an average value of 1.15 reported for AM Peak and Non-Peak
and 1.16 reported for PM Peak.
The Weekday PM Peak Hour Travel Time Index map (Figure 3-8) is presented below and identifies areas across the state where capacity needs are present.
Fig. 3-6: Interstate TTI by Construction District (2010)
Fig. 3-7: US Route TTI by Construction District (2010)
Pavement Condition and Structures Preventive maintenance of the roadway network has been a focus for Virginia for several years as indicated by policies in the Code of Virginia and the Commonwealth Transportation Board Policy Handbook. Recognizing the need to maintain critical infrastructure, VDOT has incorporated pavement and bridge needs in the identification of key recommendations for the VSTP. The percent of deficient pavements, defined as a pavement rated in “poor” or “very poor” condition, has increased over the past several years. Current VDOT performance targets provide that no more than 18 percent of the Interstate and Primary pavements should be in deficient condition and no more than 15% have a deficient ride quality. Based on the 2010 analysis, approximately 21.6% of the Interstate network has been rated as “deficient” while the Interstate ride quality meets its target with only 7.7% rated as deficient. Meanwhile, 26.7% of the Primary network is considered deficient and 12.6% of the Primary network has deficient ride quality.
11.11.21.31.41.51.61.71.81.9
2
AM Peak
PM Peak
Non-Peak
1
1.1
1.2
1.3
1.4
1.5
1.6
AM Peak
PM Peak
Non-Peak
DRAFT

CHAPTER 3: KEY NEEDS
38 38
Recent pavement performance trends in the Commonwealth show a need for requiring additional funds to try to stabilize and improve conditions. Figure 3-9 shows the performance trends over the past five years.
Fig. 3-8: Statewide Travel Time Index (2010)
DRAFT

VIRGINIA SURFACE TRANSPORTATION PLAN UPDATE 39
Fig. 3-9: Pavement Deficiency Trends -Interstate and Primary Networks
In addition to pavement, VDOT has a target where no more than 8% of its bridges and culverts are rated structurally deficient. Structurally deficient indicates that there are elements of the facility that need to be monitored and/or repaired. The performance from FY 2007-2011 was marginally higher than the targeted 8%; however, in FY 2012, the statewide percentage dropped below the threshold to 7.78% (Figure 3-10). Five (Lynchburg, Hampton Roads, Culpeper, Staunton and NOVA) of nine VDOT Construction Districts had fewer than 8.0% deficient structures in FY 2012. The anticipated design life of a bridge is approximately 50 years. While technology may increase the lifespan of bridges, in the next 20 years the percentage of structures 50 years or older will grow substantially as 59.7% of structures in Virginia are 40 years or older. These structures have either exceeded or will soon exceed their originally anticipated design service life of 50 years. The number of structures equal to or greater than 40 years in age, by system, is as follows: 64.4% of the interstate, 64.4% of the primary, 58.1% of the secondary, and 38.6% of the urban system
structures. This suggests the need for a greater investment in the
maintenance of structures to meet the desired performance target.
Fig. 3-10: Percentage of Structurally Deficient Structures - Statewide
Safety At the time of this writing, VDOT is in the process of finalizing the 2012-2016 Strategic Highway Safety Plan (SHSP). The SHSP is Virginia’s statewide, multi-agency, comprehensive safety plan that provides a coordinated framework for reducing deaths and severe injuries on all public roads. Agencies participating in the development of the SHSP include:
VDOT
Virginia Department of Motor Vehicles
Virginia State Police
Virginia Department of Health
Virginia Department of Education
Virginia Department of Fire Protection
2006 2007 2008 2009 2010
Interstate 17.1% 19.1% 20.5% 20.1% 21.6%
Primary 15.8% 21.2% 24.4% 24.3% 26.7%
0%
5%
10%
15%
20%
25%
30%
% N
etw
ork
Statewide Target ≤ 18%
SD=
1,74
6
SD =
1,7
62
SD =
1,8
01
SD=
1,78
5
SD =
1,7
20
SD=
1,63
2
8.38%
8.46% 8.60%
8.53%
8.23%
7.78%
7.2%
7.4%
7.6%
7.8%
8.0%
8.2%
8.4%
8.6%
8.8%
1,500
1,550
1,600
1,650
1,700
1,750
1,800
1,850
FY 2007 FY 2008 FY 2009 FY 2010 FY 2011 FY 2012
% S
tru
ctu
rally
De
fici
en
t St
ruct
ure
s
Nu
mb
er
of
Stru
ctu
rally
De
fici
en
t St
ruct
ure
s
Structures Structures %
DRAFT

CHAPTER 3: KEY NEEDS
40 40
The previous SHSP developed in 2006 set a goal to reduce deaths by 100 and reduce all injury types by 4,000 by 2010. Accomplishments from 2006 – 2010 include the following:
A 23 percent reduction in traffic deaths from 961 in 2006 to 740 in 2010 and a 45 percent reduction in severe injuries from 21,260 in 2006 to 11,664 in 2010; exceeding the goals in the 2006 plan.
Alcohol deaths dropped 27 percent; young driver involved deaths decreased 44 percent; and speed related deaths decreased 29 percent.
Safety belt use increased to more than 81 percent.
Enhancement of the graduated driver’s license law and drivers’ education requirements
Improved enforcement through 6,000 arrests during 2009 Checkpoint Strikeforce program; over 150,000 traffic summons to aggressive drivers; and 41,000 summons for safety belt violations from 2005 to 2010 during the two-week Click It or Ticket enforcement period in May.
Initiatives to improve child passenger safety including increasing the minimum age from 6 to 8 years in which children are to be properly secured in a child safety seat; distributing over 680,000 pieces of child passenger safety educational materials from 2007-2010; operating the VDH Low Income Safety Seat Distribution and Education Program; and inspecting over 2,600 child safety seats from 2006-2010.
Roadway safety is generally improving, as evidenced by the drop in traffic related deaths and severe injuries between 2001 and 2010. Since 2001, deaths dropped over 20% and severe injuries declined by almost 60%. While this achievement is remarkable, Figure 3-11 shows there are unmet goals for improving traffic safety in Virginia. In 2010, more than 700 people died on Virginia’s roadways and nearly 12,000 suffered severe injuries.
Fig. 3-11: Virginia Traffic Deaths and Severe Injuries (2001-2010)
20 jurisdictions accounted for 48% of the deaths and severe injuries from 2001 to 2010. These jurisdictions include 14 counties, 5 cities and the County of Henrico who maintains their own roads. An analysis of the crash data over this 10-year time period shows that while crashes occur throughout Virginia, the majority of crashes are concentrated in the more populous areas of the Commonwealth, including Northern Virginia, Richmond, and Hampton Roads. However, the majority of deaths and severe injuries do not occur on the 1,100 miles of Virginia’s Interstates, but rather on primary and secondary roadways. The primary system has more than 8,000 miles of roadways and accounts for the most severe crashes occurring in Virginia. Virginia’s secondary system of highways, consisting of almost 49,000 miles of roads, accounts for the second highest number of severe crashes. Secondary roads can range from rural high-speed highways, to multi-lane suburban thoroughfares, to low-speed residential streets. Urban system
27
,05
0
26
,16
3
25
,51
6
23
,34
2
22
,48
9
21
,26
0
19
,79
6
16
,53
9
13
,11
7
11
,66
4
935 913 942 922 946 961
1,026
821 756 740
0
200
400
600
800
1,000
1,200
0
5,000
10,000
15,000
20,000
25,000
30,000
2001 2002 2003 2004 2005 2006 2007 2008 2009 2010
Pe
rso
ns
Kill
ed
Pe
rso
ns
Seve
rely
Inju
red
Severe Injuries Deaths
DRAFT

VIRGINIA SURFACE TRANSPORTATION PLAN UPDATE 41
roads, found in Virginia’s cities and totaling nearly 11,600 miles, have a similar mix of highways as the secondary road system, but have fewer deaths. However, urban roadways still account for a significant percentage of the severe injury crashes occurring in Virginia. The planned long range goal is to reduce deaths and severe injuries by 50% over the next 20 years. This goal follows the national Towards Zero Deaths initiative. In meeting this goal, a target reduction of approximately 3% per year until 2016 was set. Virginia would save over 100 lives and prevent over 1,700 severe injuries with the SHSP objective. Using the 5E approach of engineering, education, enforcement, evaluation and emergency response strategies, Virginia’s safety partners will work together to target resources where the severe crashes are occurring. Strategies cover driver behavior addressed through education and enforcement and crash types, like roadway departures and intersection crashes, which can be addressed by engineering and emergency response. The SHSP will be implemented with a data driven approach that will support collaboration on actions and initiatives to reduce the number of severe crashes. Safety remains a top priority and VDOT has incorporated safety performance measures in the identification of key projects for the VSTP.
Rail Needs The Virginia Rail Plan provides a profile and assessment of Virginia’s rail assets and services, evaluating the system’s strengths and weaknesses in light of recent trends in domestic
and international trade. DRPT conducted system analysis and collaborated with freight rail operators and passenger rail providers to assess the needs of the Commonwealth’s critical rail
assets and services. These needs were incorporated into the VSTP
Update and are highlighted below.
Class I Corridor Development – Passenger and Freight Virginia’s Class I Railroad major corridors include the CSX National Gateway, the Norfolk Southern Heartland Corridor and the Norfolk Southern Crescent Corridor. DRPT maintains focus on these corridors and recently met with rail operators and other stakeholders to
identify the following key system needs:
Alleviate choke points
Achieve double stack clearances
Increase track capacity (additional track, passing siding)
Rail yard improvements
Port of Virginia access
Shortline Improvements Shortline Railroads serve as the first and last link in the business to business delivery via rail, acting as the originating and terminating railroads for nearly one-third of all rail shipments. In addition, Shortlines provide intense switching movements that are not profitable to Class I railroads. Virginia’s Shortlines are vital to the rail network and Shortline infrastructure is aging and in many cases, improvements are required to ensure the handling of heavy rail cars and container shipments. Extensive research and stakeholder
involvement have helped identify the following Shortline Rail needs:
Heavier, welded rail to allow higher speeds;
Signal and communications improvements;
Tie replacement and track resurfacing; and
Bridge improvements.
DRAFT

CHAPTER 3: KEY NEEDS
42 42
Dedicated Funding and State-Sponsored Rail Service The Intercity Passenger Rail Operating and Capital (IPROC) fund was established by the General Assembly in 2011 as a strategy to sustain Virginia's share of Amtrak Virginia's operating budget in preparation for the Passenger Rail Investment and Improvement Act of 2008 (PRIIA). PRIIA requires that state governments be responsible for operating costs for regional rail routes of fewer
than 750 miles starting in 2013.
While a steady funding stream is yet to be identified for IPROC, the legislation gave the Commonwealth Transportation Board (CTB) and General Assembly the flexibility to allocate existing transportation revenues into the fund. In 2012, the General Assembly provided $28.7 million of the FY 2011 General Fund surplus for the operating and capital needs of Virginia intercity passenger rail services, and authorized a transfer of $26.1 million of Rail Enhancement Funds for passenger needs for 2013 and 2014. However, a shortfall is anticipated in FY 2015 even with this additional funding. By 2018, the total capital and operating costs of Virginia's intercity passenger rail routes is estimated to total
$162 million.
Unless dedicated operating and associated capital funding is identified, these regional passenger rail routes could be terminated. Virginia has demonstrated successful service, and without funding, the state could lose the passenger rail train slots currently provided by host railroads. Costs to re-establish
passenger service after it is lost would likely be prohibitive.
Cross-Modal Policy Needs While our basic need for transportation is relatively stable over time, the way that we meet this need is always changing and evolving. Recent legislative changes at the Federal and State levels indicate the policy direction and responses that will shape the future of transportation, particularly in light of trends in funding. Emerging trends have created a platform of challenges and opportunities that we must address as we update Virginia’s Surface
Transportation Plan.
As we plan for the future, the following are some of the key trends in transportation that the Plan Update will seek to address and
incorporate:
Fiscal Climate: Like other sectors of the economy, transportation has faced increasing challenges resulting from a growing imbalance between fiscal needs and resources. The increasingly constrained funding environment has brought greater attention to both creative funding for transportation investments and scrutiny of the
investments’ cost-effectiveness.
Rising Costs: Rising energy costs have affected the cost of construction for capital projects, while making traditional gasoline-based transportation less affordable. This trend calls for alternative and more energy-efficient modes and approaches to
moving people and goods.
DRAFT

VIRGINIA SURFACE TRANSPORTATION PLAN UPDATE 43
Return on Investment: An increasing emphasis on the return on investment for all public expenditures affects transportation investments in particular. This trend will necessitate measuring the impacts and benefits of transportation investments to other economic sectors, the environment, and quality of life.
Technology: As described in Chapter 2, ITS strategies are congestion management tools that combine advanced technologies and innovative practices. To manage available capacity across modes along a corridor, the goal is to optimize the use of transportation infrastructure assets. Most importantly perhaps, ITS initiatives help manage corridors as dynamic systems – systems that are multi-modal, multi-agency, and multi-jurisdictional. In this way, ITS serve as a microcosm for how “we” must think about transportation; no longer can “we” maintain a silo approach where we simply focus on individual systems (for example: rail, transit, highways). Instead, “we” must take advantage of available resources, both human and technological, to integrate operations to
manage total corridor capacity.
Truck Freight Movement As mentioned previously, measuring capacity is a critical step in determining current and future congestion problems. Excessive congestion can have serious impacts on Virginia’s economy when it impedes the movement of freight traffic. To identify areas where this occurs, VDOT has overlaid level of service data on corridors with high volumes of truck traffic; corridors which can be assumed to
carry high volumes of freight.
Due to higher speeds and longer travel distances, Virginia’s interstate system carries the lion’s share of the truck traffic. I-85, I-95, I-64, especially between Richmond and Hampton Roads, and I-77 are the heaviest volume truck routes in the state. In Northern Virginia, I-495 and I-66 also carry a significant amount of freight, while in rural areas of the state, Routes 29 and 58 are noteworthy
freight corridors.
The data from 2009 (Figure 3-12) indicate significant freight bottlenecks on I-81 near Roanoke and on I-64 near the Hampton Roads Bridge Tunnel. The level of service on I-95 shows a need for improvement north of Richmond, around Fredericksburg, and at
Quantico.
Meanwhile, the projected 2035 level of service indicates needs on all interstate freight corridors (Figure 3-13). This no-build analysis also displays a need for improvements in the major urban areas of
Northern Virginia, Richmond and Hampton Roads.
DRAFT

CHAPTER 3: KEY NEEDS
44 44
Fig. 3-12: Truck Freight Bottlenecks (2009)
DRAFT

VIRGINIA SURFACE TRANSPORTATION PLAN UPDATE 45
Fig. 3-13: Truck Freight Bottlenecks (2035)
DRAFT

CHAPTER 3: KEY NEEDS
46 46
This page is intentionally left blank
DRAFT

CHAPTER 4: RECOMMENDATIONS
47
Transit & TDM Recommendations In efforts to support the VTrans2035 Update and formulate transit investment recommendations, the Statewide Transit/TDM Plan Update considered three various funding
scenarios. The “Low Investment” scenario would rely on continuation of current funding levels. Meanwhile, the “Moderate Investment” and “High Investment” scenarios would require significant increases in both state and local funding. The scenarios are described in
detail below and summarized in Table 4-1:
Low Investment: This scenario assumes minimal investment in transit and TDM services. Transit capacity expansion consists of improvements identified in each transit operator’s 6-year Transit Development Plan (TDP) through 2018. No additional transit expansion is assumed beyond 2018. This scenario addresses State of Good Repair (SGR) needs for existing facilities and vehicles and any new facilities and vehicles associated with new service that is identified in TDPs. It also includes Major Capital Projects currently under development. For TDM, it continues existing programs, and growing existing TDM agency budgets to reflect expected inflation rates.
Moderate Investment: This scenario includes expansion of transit capacity to meet service needs associated with population growth and increasing urbanization through 2040. It addresses SGR for all existing and future vehicles and facilities. It also includes Major Capital Investment Projects, assuming lower cost solutions where applicable. For TDM, it includes extension of services into geographic areas not currently receiving TDM service, at levels consistent with average services of existing programs.
High Investment: This last scenario includes all investments in the Moderate Investment scenario, plus additional capacity enhancements that are designed to increase transit modal share. Major Capital Investment Projects assume higher cost alternative solutions where applicable. For TDM, the High Investment scenario closes geographic gaps and funds new or improved strategies consistent with recommended area-type
programs.
Table 4-1: Transit and TDM Investment Scenarios
Addressing Critical Needs The identified needs include both physical capital improvements and the ongoing cost to operate and maintain the increased services that are recommended to enhance mobility and increase
transit and TDM modal share.
DRAFT

CHAPTER 4: RECOMMENDATIONS
48 48
State of Good Repair – Investments State of Good Repair includes issues related to evaluating the condition of existing equipment and facilities and prioritizing local transit investment decisions. Preventive maintenance and rehabilitation are ways to address ongoing needs. In addition, the Commonwealth must monitor the state of good repair for new assets added to the inventory (e.g., new service expansion buses). Table 4-2 highlights the SGR vehicle replacement requirements
under the various investment scenarios.
Table 4-2: State of Good Repair – Ongoing Vehicle Replacement Needs
Transit/TDM Capacity Expansion – Investments The expansion of transit and TDM services can be addressed through strategic capital investments and operating and maintenance expenses – these pursuits can help meet increasing
demand and can help improve economic opportunities.
Service capacity enhancements include the extension of transit and TDM services into regions of the Commonwealth that do not currently have service but have an identified need for it; transit improvements in areas that currently have insufficient service; and expansion of service to reflect anticipated population growth and/or shifting needs. Table 4-3 identifies the projected increases (2040) in capacity for public transit and human services under the
various investment scenarios.
Table 4-3: Transit Capacity Enhancements (2040)
Major Transit Capital Projects – Investments Investing in rapid transit systems such as streetcars, light rail, and bus rapid transit will increase mobility options in congested urban areas. Major Capital Projects include capital costs of construction, right of way acquisition, and equipment purchase (both rolling stock and supporting systems), plus continued operating and maintenance costs, to address high-capacity needs in heavily developed areas of the Commonwealth. For this analysis, completed transit vision plan recommendations from Richmond and the Hampton Roads region, plus the Super NoVa Study corridor recommendations, have been taken into consideration. Since actual technologies have not been determined for many regions, a range of major capital
DRAFT

VIRGINIA SURFACE TRANSPORTATION PLAN UPDATE 49
investments has been developed, reflecting a range of technology
and costs for any given corridor.
Overview of Recommendations After evaluating public transportation needs, the Statewide Transit/TDM Plan Update developed broad recommendations for addressing State of Good Repair and Transit/TDM expansion. The following recommendations highlight several ways in which the Commonwealth can capitalize on its current transit assets and better
prepare for the challenges of the future:
Expand transit and TDM services to keep pace with projected population growth and development densities;
Increase TDM services in major urban areas and other areas where TDM programs have demonstrated success;
Retain mode share in areas with existing transit service;
Increase transit service in areas where population and employment growth call for more aggressive transit service; and
Invest in major transit capital projects, as identified through major metropolitan visioning efforts, using technology options in
the low to moderate cost range.
The projected capital and operating costs for each scenario are summarized in Table 4-4.
Finally, under the Low Investment Scenario, 2040 projections estimate that there will be 20.1 riders per capita in 2040, a decrease of 4.2 riders per capita from 2012 levels (24.3). Meanwhile, riders per capita are expected to increase to 30.2 and 33.9 under the Moderate and High Investment Scenarios,
respectively.
Table 4-4: Transit and TDM Scenario Costs (2013-2040)
DRAFT
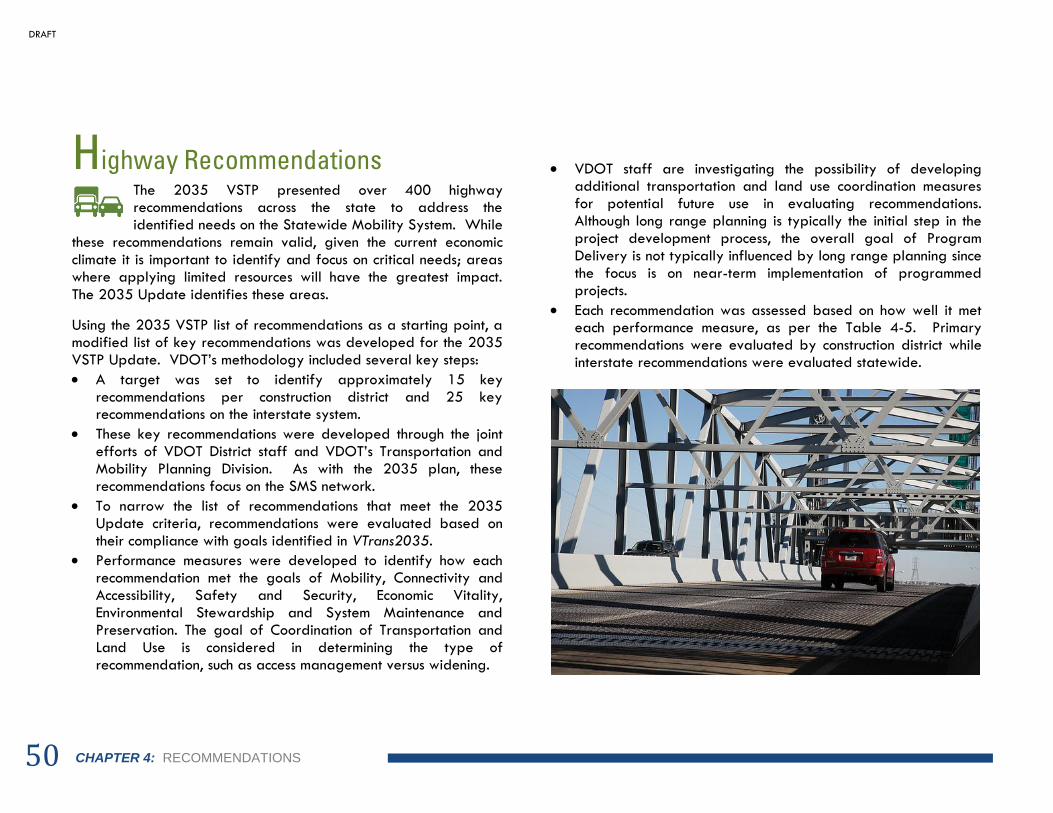
CHAPTER 4: RECOMMENDATIONS
50 50
Highway Recommendations The 2035 VSTP presented over 400 highway recommendations across the state to address the identified needs on the Statewide Mobility System. While
these recommendations remain valid, given the current economic climate it is important to identify and focus on critical needs; areas where applying limited resources will have the greatest impact.
The 2035 Update identifies these areas.
Using the 2035 VSTP list of recommendations as a starting point, a modified list of key recommendations was developed for the 2035 VSTP Update. VDOT’s methodology included several key steps:
A target was set to identify approximately 15 key recommendations per construction district and 25 key recommendations on the interstate system.
These key recommendations were developed through the joint efforts of VDOT District staff and VDOT’s Transportation and Mobility Planning Division. As with the 2035 plan, these recommendations focus on the SMS network.
To narrow the list of recommendations that meet the 2035 Update criteria, recommendations were evaluated based on their compliance with goals identified in VTrans2035.
Performance measures were developed to identify how each recommendation met the goals of Mobility, Connectivity and Accessibility, Safety and Security, Economic Vitality, Environmental Stewardship and System Maintenance and Preservation. The goal of Coordination of Transportation and Land Use is considered in determining the type of recommendation, such as access management versus widening.
VDOT staff are investigating the possibility of developing additional transportation and land use coordination measures for potential future use in evaluating recommendations. Although long range planning is typically the initial step in the project development process, the overall goal of Program Delivery is not typically influenced by long range planning since the focus is on near-term implementation of programmed projects.
Each recommendation was assessed based on how well it met each performance measure, as per the Table 4-5. Primary recommendations were evaluated by construction district while interstate recommendations were evaluated statewide.
DRAFT

VIRGINIA SURFACE TRANSPORTATION PLAN UPDATE 51
Table 4-5: Highway Recommendations – Rating Criteria
Goal Performance Factors Weight Relative to Goal
Mobility, Connectivity and Accessibility
A. 2007 weighted LOS - Evaluates congestion by qualitatively measuring operating conditions such as speed, travel time, freedom to maneuver, traffic interruptions, comfort and convenience.
33%
B. 2007 weighted volume to capacity ratio (V/C) - The number of vehicles using a road compared to the roadway's traffic carrying capacity.
33%
C. 2007 weighted flow rate - The number of passenger cars/per hour/per lane in the peak direction.
33%
Total 100%
Safety and Security A. Fatal + Injury crashes per mile (2003-2007) 100%
Total 100%
Economic Vitality
A. 2007 weighted daily volume heavy trucks 50%
B. The unemployment rate from all affected jurisdictions, using official data from the Virginia Employment Commission (VEC). Jurisdiction Unemployment Rate > 1 percent national average or per capita income is 80% or less national average (ARRA Measures)
50%
Total 100%
Environmental Stewardship
A. Are there environmental issues that would affect major project decisions?
50%
B. Is the recommendation likely to stay within existing right-of-way limits?
50%
Total 100%
System Maintenance and Preservation
A. Does the corridor have pavement condition rated as poor or very poor?
25%
B. Inclusion of other modes - Does the recommendation include HOV or provisions for other modes?
25%
C. Bridge conditions - Square footage (bridge deck) of structurally deficient bridges
25%
D. Cost Effectiveness - Recommendations Cost/2035 Vehicle Miles Traveled
25%
Total 100%
Following this initial evaluation, the highest ranking recommendations were compared to recommendations identified in regional planning documents developed by Metropolitan Planning Organizations and Planning District Commissions, including
constrained Long Range Transportation Plans and Rural Regional Long Range Plans. In some instances, local Comprehensive Plans were reviewed for further clarification. Any new recommendations on the SMS identified in these documents were also evaluated for inclusion on the Update recommendation list. VDOT District staff reviewed the list to note any recommendations identified as District priorities. Recommendations included in a local or regional plan were advanced through the process. An additional step involved ranking each VDOT construction district’s recommendations for safety and congestion needs against the performance of the respective district’s average. The performance measures used to perform this analysis included:
Current and Horizon Year Flow Rate Ranking – Flow rate is a measure of demand along roadways. Flow rate represents the number of vehicles that are passing a given section of a lane or a roadway during the peak hour. VDOT calculated this performance measure for the current year (2011) and the plan’s horizon year (2035). Next, VDOT compared the flow rate of each facility by district to create a regional ranking – allowing one facility to be compared to another.
Current and Horizon Year Volume to Capacity Ranking – One of most common measures of a roadway’s performance is volume to capacity. It is calculated by dividing the volume of traffic in the peak hour (volume) by the amount of traffic the roadway can handle (capacity). If the volume to capacity ratio is greater than 1.0 the roadway is over capacity. As with flow rate, all traffic is converted to passenger car equivalents to account for larger vehicles such as tractor trailers and buses. VDOT calculated this performance measure for the current year (2011) and the plan’s horizon year (2035). VDOT then compared the volume to capacity ratio of each facility by
DRAFT

CHAPTER 4: RECOMMENDATIONS
52 52
district to create a regional ranking – allowing one facility to
be compared to another.
Fatal and Injury Crashes Ranking – Safety is a top priority for VDOT. Fatal and injury crashes is a performance measure VDOT used to rank and evaluate road improvements. VDOT calculated the fatal and injury crashes per mile during a 5-year period. VDOT then compared the fatal and injury crash rate of each facility by district to create a regional ranking – allowing one facility to be compared to another.
The result of this analysis, in combination with the feedback received through the public involvement process, was used to guide the identification of 166 highway recommendations to be highlighted in the 2035 Virginia Surface Transportation Plan Update. Table 4-6 provides a summary of Highway recommendations by VDOT Construction District, while Figure 4-1 maps the locations of all recommended highway projects, including Cross-Modal projects (ITS and Park & Ride lots). Please see Appendix A for a complete list of recommended projects.
Table 4-6: Summary of Highway Recommendations
DRAFT

VIRGINIA SURFACE TRANSPORTATION PLAN UPDATE 53
Fig. 4-1: Highway Recommendations (Including ITS and Park & Ride)
DRAFT

CHAPTER 4: RECOMMENDATIONS
54 54
Rail Recommendations This rail project list, which was developed through system analysis and in collaboration with passenger rail operators and railroads, provides an actionable plan for passenger
and freight rail investments in Virginia. The plan builds upon the progress made in rail funding in recent years, including the dedication of a portion of the vehicle rental tax to the Rail Enhancement Fund, the creation of the Intercity Passenger Rail Operating and Capital Fund (IPROC), and DRPT’s innovative public private partnership approach that has helped advance many rail initiatives. Table 4-7 lists the rail recommendations by corridor,
including those programmed in the FY 2013-2018 SYIP.
Table 4-7: Rail Recommendations by Corridor (2013-2040)
Cross-Modal Policy Recommendations
The VSTP Update emphasizes the integration of multimodal planning and offers recommendations that are representative of a challenging financial environment. Maximizing the ability of Virginia’s existing transportation system is especially critical given limited available funds. In the near future, Virginia’s transportation funding will shift to focus on maintaining assets, responding to emergencies and mitigating congestion. Funding for new construction projects will continue to diminish. The maintenance of existing transportation assets to ensure the safety of the public will
remain the first priority.
The VSTP Update will be used as a guiding document that identifies multimodal solutions for future transportation deficiencies. As Virginia seeks to address specific transportation problems, the recommendations identified in the VSTP Update offer a range of solutions for consideration. As noted earlier, Figure 5-2 (Highways Section) maps the recommended project locations for Park & Ride
and ITS.
Park & Ride In order to increase the number of Park & Ride facilities across Virginia, VDOT recently conducted the VDOT Statewide Park & Ride Lot Inventory and Usage Study which includes recommendations for new and expanded lots. Existing Park & Ride lots in each of VDOT’s construction districts were reviewed and determinations for additional spaces were made based on lot capacity and travel demand patterns.
DRAFT

VIRGINIA SURFACE TRANSPORTATION PLAN UPDATE 55
VDOT recommends 50 new park and ride locations; some locations require constructing new lots, while others propose to utilize the lots of existing businesses. In addition, VDOT proposes enhancements at 11 locations throughout the state. Enhancements include, but are not limited to:
Expanding existing facilities;
Resurfacing existing lots;
Improving signage; and
Adding passenger waiting areas.
The Park & Ride study included a user survey and also reviewed other states’ best practices, identified potential website enhancements, and explored coordination strategies between VDOT and other TDM agencies. This resulted in several future Park & Ride initiatives, such as: continued planning and coordination with DRPT, regional planning organizations, localities, and TDM agencies to: 1) determine locations for new and expanded facilities; and 2)
develop implementation strategies to support Virginia’s commuters.
Intelligent Transportation Systems As indicated in Chapter 2, VDOT is pursuing several ITS initiatives to enable the improved use of Virginia’s roadway network. Presently, VDOT has over 200 ITS recommendations identified in the FY 2014 Operations Improvement Program and as part of the Secretary and Commissioner’s New Technology Initiatives. These
recommendations pertain to a variety of proposals including:
Installation of Variable Message Signs;
Installation of cameras and closed circuit television;
Installation of transportation kiosks;
Signal optimization;
Installation of fiber for communications; and
Installation of weather cameras.
Notable recommendations include:
I-64/I-77 Afton Mountain Active Traffic and Safety Management System;
I-95 Integrated Corridor Management Implementation in Fredericksburg District;
Norris Bridge Operations Improvements;
I-64 Dynamic Network Management Initiative for Hampton Roads;
ITS improvements for lane reversals in Hampton Roads Districts;
I-95 Integrated Corridor Management Implementation in Northern Virginia District;
Parking information signing in Northern Virginia District;
New Central Region Transportation Operations Center in Richmond District; and
Deployment of new ITS assets along I-64, I-66 and I-81
throughout Staunton District
Fostering Public Private Partnerships In the 21st century, the costs for transportation infrastructure, construction, and maintenance will continue to rise, making innovative delivery methods critical to the future vitality of Virginia’s transportation network. Public-private partnerships allow the Commonwealth to better leverage public funds and implement critical infrastructure improvements years sooner than would have been possible if dependent solely upon traditional funding processes. As mentioned in Chapter 1, the Governor recently (June 2012) released a list of PPTA pipeline projects, which represent regional multimodal priorities and potential opportunities for private sector investment and innovation. Projects selected for procurement under the PPTA are consistent with the Commonwealth’s transportation goals of:
DRAFT
CHAPTER 4: RECOMMENDATIONS
56 56
Improving safety and security
Reducing congestion
System maintenance and preservation
Mobility
Connectivity
Accessibility
Environmental stewardship
Economic vitality
Coordination of transportation and land use and program delivery
In addition to the current and completed projects mentioned in Chapter 2, eight candidate and 14 conceptual PPTA projects have been identified to address transportation needs in the Commonwealth. Projects may be candidates for delivery via the PPTA once aspects of business and financial suitability are further developed. Conceptual projects identify potential diverse multimodal opportunities for private sector partnerships with the Virginia Commercial Space Flight Authority, the Department of Motor Vehicles, the Virginia Port Authority, as well as more traditional roadway and transit concepts through the Department of Transportation and Department of Rail and Public Transportation.
Candidate Projects
I-95 Corridor Improvements: procurement underway in 2012
Regional Traffic Operations Centers: procurement underway in 2012
Port of Virginia: procurement underway in 2012
I-64 HOV to HOT Conversion: project development in 2012
I-64 Peninsula Improvements: project development in 2012
Hampton Roads Crossing Improvements: project development in 2012
I-66 Corridor Improvements: project development in 2013
NOVA North-South Corridor: project development in 2013
Conceptual Projects
I-495 Express Lanes extension (VDOT / VDRPT)
"GoldStar" Truck Validation System (DMV)
Wallops Island Visitor and Support Facilities (VCSFA)
Advertising / Sponsorship Opportunities (VDOT)
Dulles Metro Rail Station Air Rights opportunities (VDRPT/VDOT)
Rest Area Enhancements – electric car charging stations (VDOT)
Rest Area Enhancements - truck parking facilities (VDOT)
Parking Facilities Privatization (VDOT)
I-81 Managed Travel Lanes System – Roanoke (VDOT)
Cell Towers / Fiber Optic opportunities (VDOT)
Route 460/58 Connector (VDOT)
Innovation Drive, Bristol (VDOT)
Route 460/I-85 Connector (VDOT)
Route 460 Business Corridor Improvements (VDOT)
DRAFT

CHAPTER 5: CONCLUSION
57
Improving Performance Measures Performance measures are used by government agencies to benchmark, assess, and guide improvements on many programs and goals including: investment choices and results, internal business operations, system conditions (e.g. mobility, safety, maintenance,
etc.), project delivery, and employee and user satisfaction.
MAP-21, signed into law by President Obama on July 6, 2012, addresses transportation challenges through a streamlined performance-based planning framework. Ultimately, MAP-21 shows a national commitment to performance-based planning, a commitment that has been concurrently cultivated in the Commonwealth through the VTrans2035 Update process. In Virginia, measures of transportation performance have been related closely to one of several long-range goals. Furthermore, performance based planning is used in the programming of transportation projects. Virginia uses performance as one of several factors that influence the selection of projects in the transportation program. This is an opportunity to better link the project selection and the performance metrics under each long-range goal in
VTrans2035.
This need, coupled with increasing national emphasis on performance-based planning, creates links to better develop a framework that aligns performance measurement with planning and programming. The VTrans2035 Update seeks to do just that – revising the current framework to establish a clear process that links goals, investment priorities, and the selection of programs and projects by partner agencies. The general public and stakeholders contributed greatly to this realignment, providing critical feedback
at public meetings, regional forums and through interactive online
channels. Performance-based planning can ultimately help the Commonwealth reach measurable milestones in a more efficient
and cost-effective manner.
Promoting Smart Travel Investments In order to respond to both current and emerging needs, Virginia’s transportation system will need to be increasingly smarter, more efficient and more responsive to the needs of its “customers” – the residents and businesses that depend on it. Addressing challenges of the future and developing recommendations will continue to promote safety, manage congestion and help maintain the existing
infrastructure.
In order to get the most out of our current and future investments, “we” will increasingly need to ‘travel smarter.’ Traveling smarter will require a flexible approach, depending highly on innovative and technological strategies that meet regional and local mobility needs. In addressing these needs, there are a number of broad policy directions that will allow us to better optimize and adapt our
transportation system for the challenges of the future:
Technology Virginia’s transportation network in the 21st century will increasingly rely on innovative transportation and information technology to extend our reach and use our existing networks more intelligently. Existing programs like 511 and Reach the Beach provide drivers with vital information that allows them to make informed travel choices saving them valuable time. Integrating even more information technology into our existing infrastructure will allow us to extend programs such as Integrated Corridor Management and Travel Demand Management to make the best possible use of our
vested resources.
DRAFT

CHAPTER 5: CONCLUSION
58 58
Flexibility Transportation must provide for greater flexibility, offering an array of safe and convenient travel choices. In addition to informing travelers and offering diverse travel choices such as transit, walking and biking, Virginia’s transportation policies will focus on extending the range of intermodal choices and connections between modes so that goods can move seamlessly through the
national and global freight networks.
Efficiency Delivering an efficient and effective transportation system will continue to be a key focus of transportation planning in the Commonwealth. The recent federal and statewide emphasis on performance based planning will impact how plans and programs are evaluated and projects are selected. In particular, there will be a focus on the integration of transportation and land use,
economic development and the overall quality of life in a region.
Given that resources will likely remain limited into the foreseeable future, the Commonwealth must leverage investments through creative partnerships. Meanwhile, agency collaboration, innovative technologies and operational solutions can help us make smarter
decisions, enhance efficiency and improve safety.
DRAFT

59
APPENDIX A: HIGHWAY RECOMMENDATIONS
DRAFT

APPENDIX A: HIGHWAY RECOMMENDATIONS
60 60
DRAFT

VIRGINIA SURFACE TRANSPORTATION PLAN UPDATE 61
DRAFT
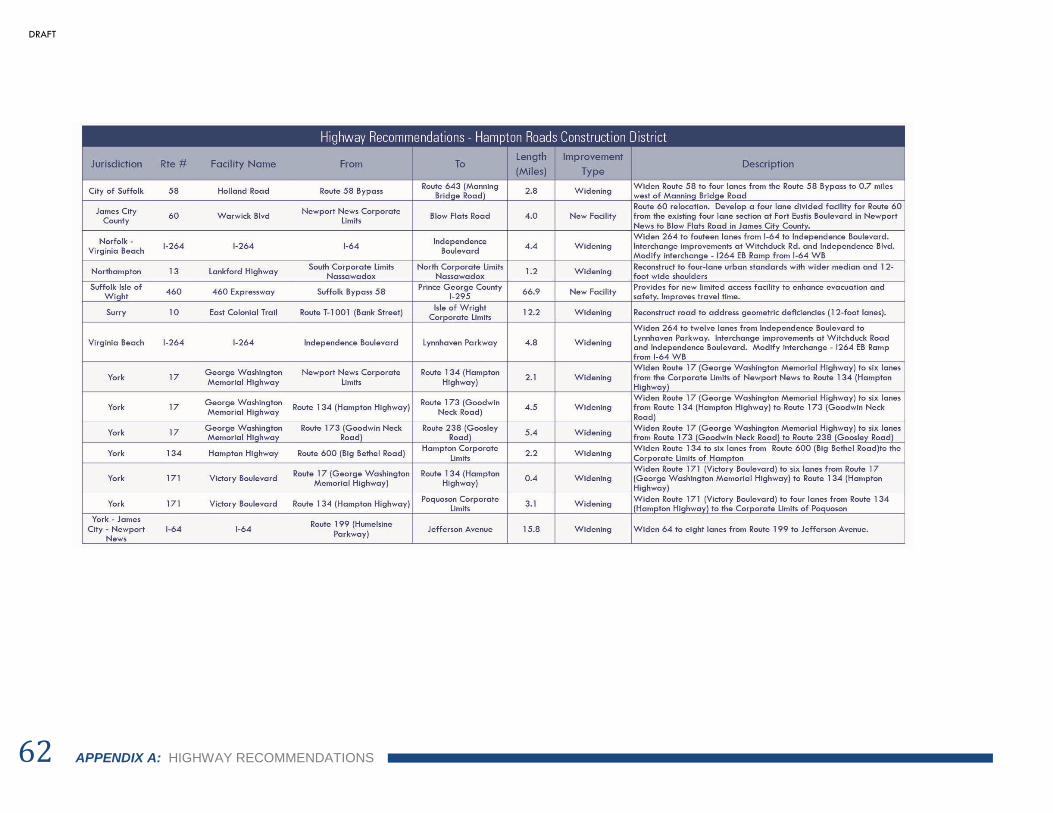
APPENDIX A: HIGHWAY RECOMMENDATIONS
62 62
DRAFT

VIRGINIA SURFACE TRANSPORTATION PLAN UPDATE 63
DRAFT
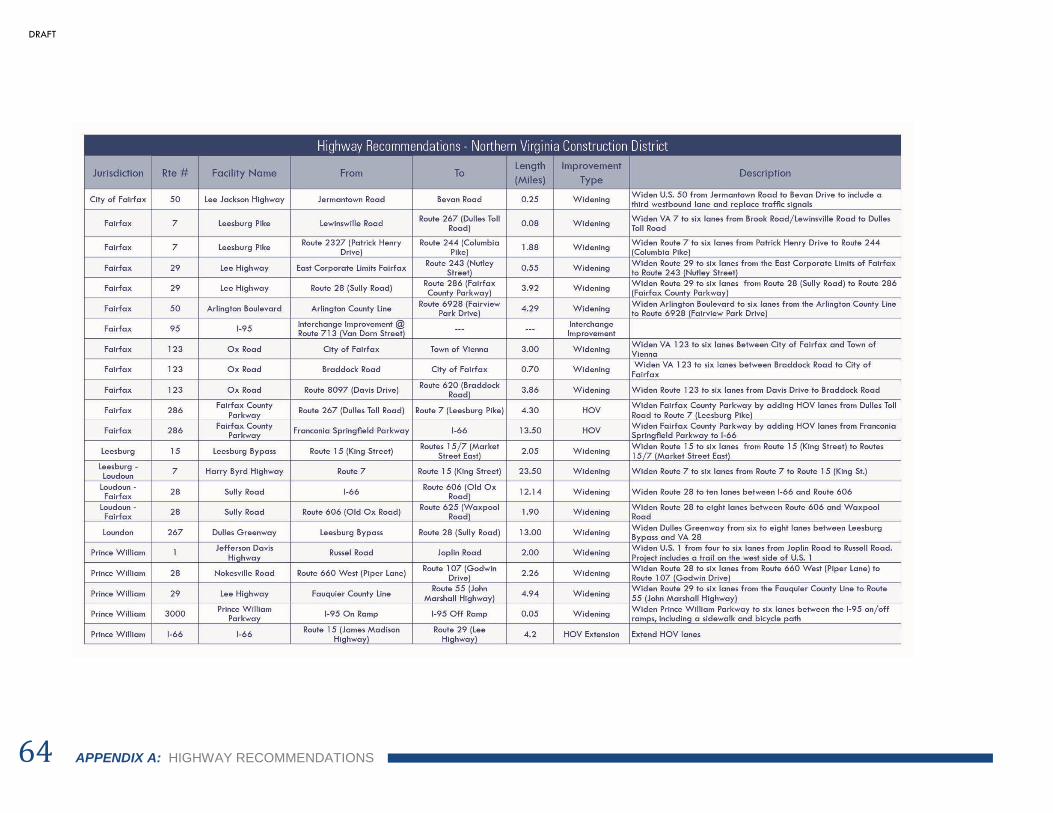
APPENDIX A: HIGHWAY RECOMMENDATIONS
64 64
DRAFT

VIRGINIA SURFACE TRANSPORTATION PLAN UPDATE 65
DRAFT

APPENDIX A: HIGHWAY RECOMMENDATIONS
66 66
DRAFT
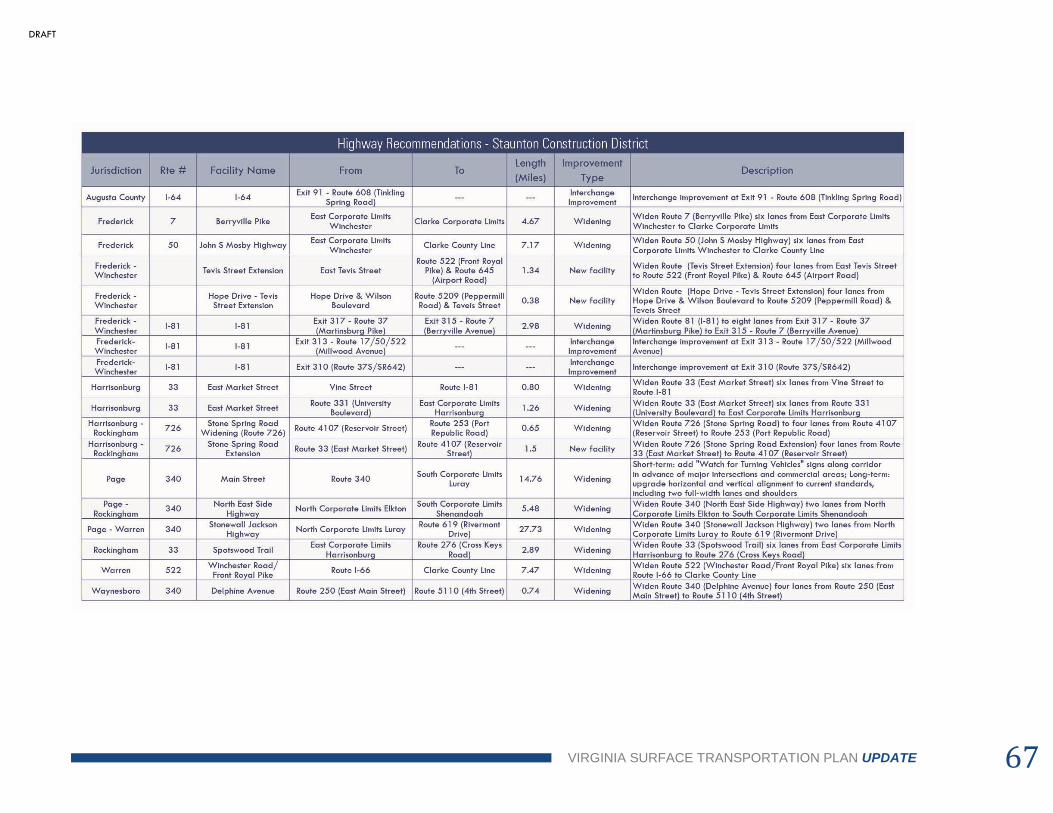
VIRGINIA SURFACE TRANSPORTATION PLAN UPDATE 67
DRAFT