Draft decisions 2011-16 Access Arrangements for APT Allgas and Envestra (Qld) Warwick Anderson...
43
Draft decisions 2011-16 Access Arrangements for APT Allgas and Envestra (Qld) Warwick Anderson General Manager, Network Regulation 1 March 2011 Public forum
-
Upload
wilfred-mckenzie -
Category
Documents
-
view
214 -
download
1
Transcript of Draft decisions 2011-16 Access Arrangements for APT Allgas and Envestra (Qld) Warwick Anderson...

Draft decisions2011-16 Access Arrangements for
APT Allgas and Envestra (Qld)
Warwick AndersonGeneral Manager, Network Regulation
1 March 2011Public forum
Housekeeping matters
• Please sign the attendance sheet
• A record of this meeting will be made
2

Purpose of the forum
• Present the main features of the AER’s draft decision on the access arrangement proposals submitted by APT Allgas and Envestra
• Inform parties intending to make submissions on the AER’s draft decision
3

Submissions
• Submissions on the AER’s draft decision can be sent to [email protected], until 21 April
• The AER’s access arrangement guideline provides guidance on making submissions– available at www.AER.gov.au
• Timeframes under the NGL and NGR limit the AER’s ability to accept late submissions
4

Revenues & Prices - APT Allgas
• The AER has determined lower revenues & prices than those proposed by APT Allgas.
• The main reductions are to the proposed WACC, forecast opex and tax allowance.
• Tariffs for haulage services are expected to rise in real terms by about 3.6 per cent per annum (on average) over the AA period.
• The tariffs for ancillary services were revised and will increase each year only by the rate of change in CPI.
5
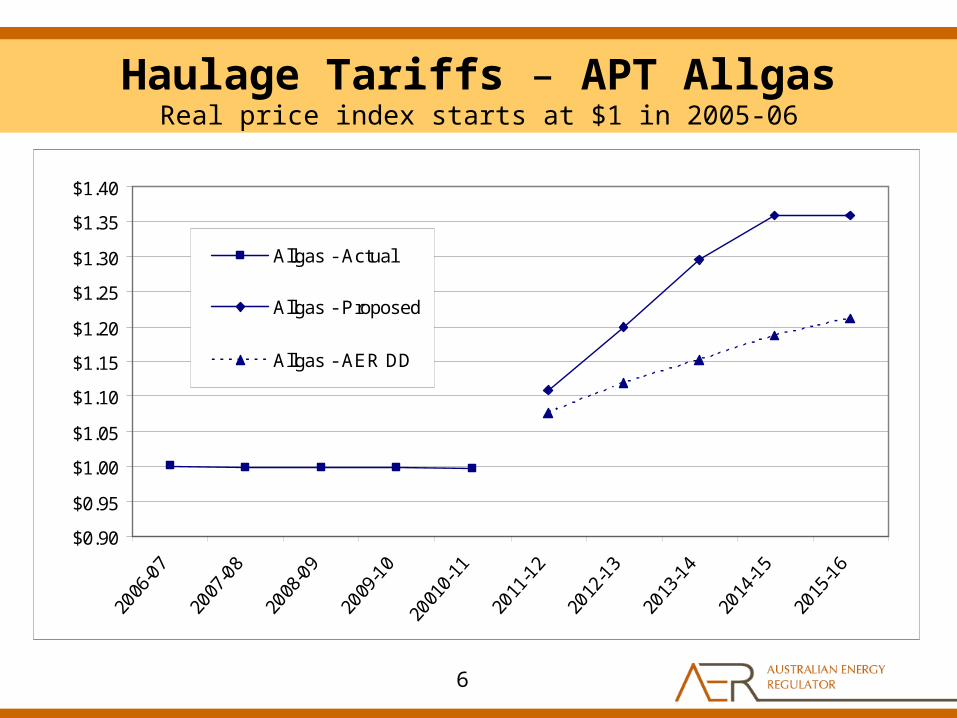
Haulage Tariffs – APT AllgasReal price index starts at $1 in 2005-06
$0.90
$0.95
$1.00
$1.05
$1.10
$1.15
$1.20
$1.25
$1.30
$1.35
$1.40
Allgas - Actual
Allgas - Proposed
Allgas - AER DD
6

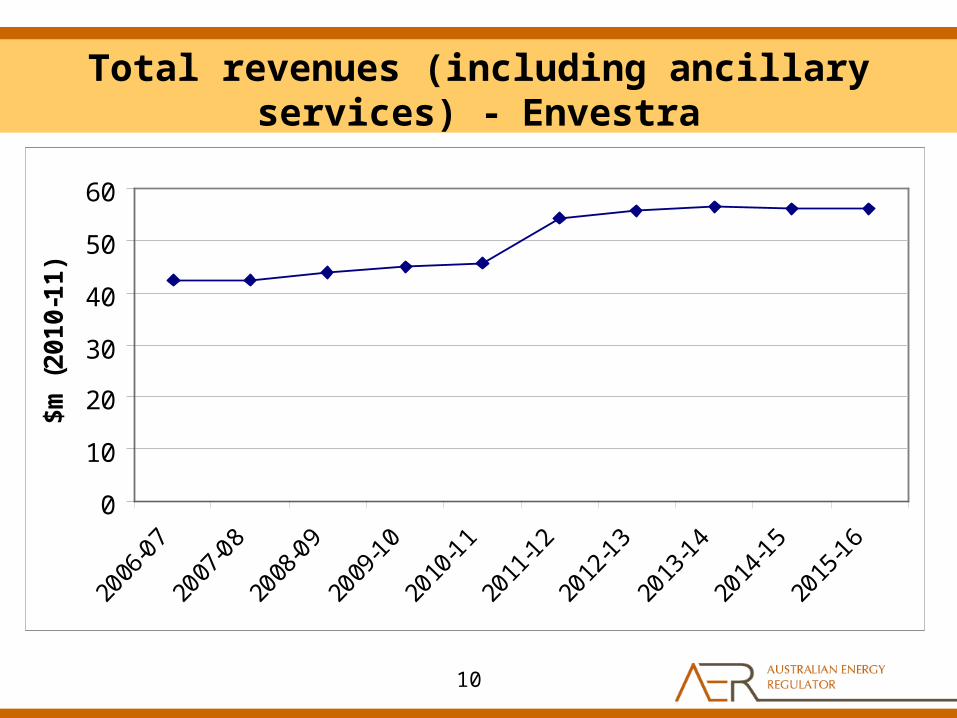
Total revenues (including ancillary services)
- APT Allgas
7
0
10
20
30
40
50
60
70
80
2006
-07
2007
-08
2008
-09
2009
-10
2010
-11
2011
-12
2012
-13
2013
-14
2014
-15
2015
-16
$m
(2
01
0-1
1)

Revenues & Prices - Envestra
• The AER has determined lower revenues & prices than those proposed by Envestra.
• The main reductions are to Envestra’s proposed WACC, forecast capex and forecast opex.
• Tariffs for haulage services are expected to rise in real terms by about 2.6 per cent per annum (on average) over the AA period.
• The tariffs for ancillary services were revised and will increase each year only by the rate of change in CPI.
8

Haulage Tariffs - Envestra Real price index starts at $1 in 2005-06
$0.90
$1.00
$1.10
$1.20
$1.30
$1.40
$1.50
$1.60
$1.70
Envestra Qld - Actual
Envestra Qld - Proposed
Envestra Qld - AER DD
9
Total revenues (including ancillary services) - Envestra
10
0
10
20
30
40
50
60
2006
-07
2007
-08
2008
-09
2009
-10
2010
-11
2011
-12
2012
-13
2013
-14
2014
-15
2015
-16
$m
(2
01
0-1
1)

Key drivers of results
• Key drivers:– Return on capital (asset base * cost of capital) – Return of capital (depreciation)– Capital expenditure forecasts – Operating expenditure forecasts– Demand forecasts - for converting revenues
to prices.
11
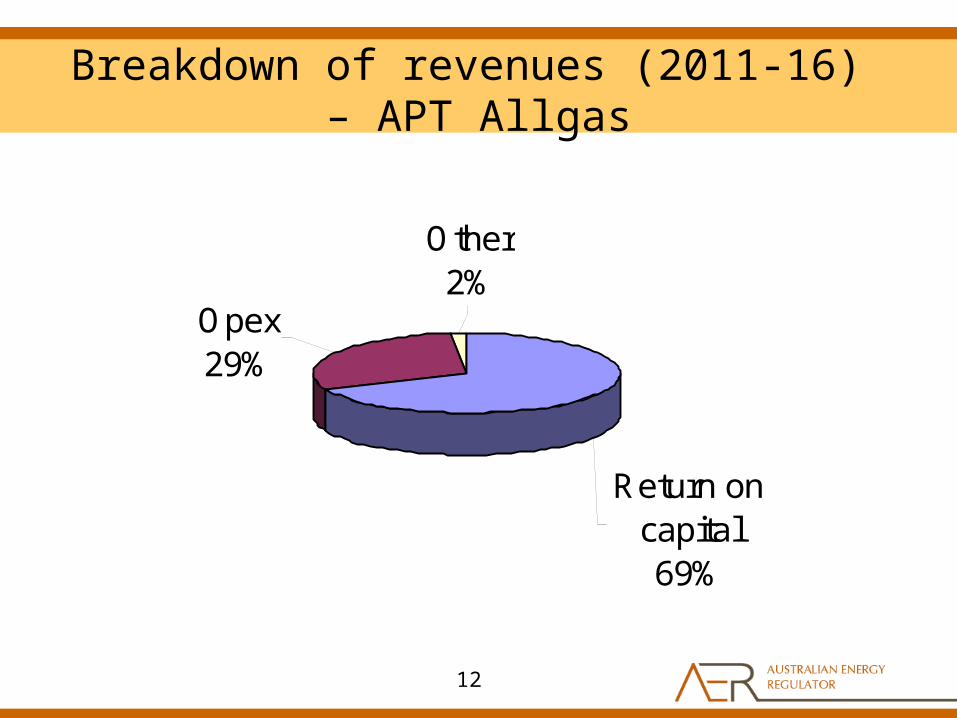
Breakdown of revenues (2011-16) – APT Allgas
12
Return on capital69%
Other2%
Opex29%

Breakdown of revenues (2011-16) – Envestra
13
Opex31%
Other9%
Return on capital60%

Cost of capital (WACC)
• The nominal cost of capital has increased significantly (see following table)
• Debt risk premium, more than tripled since the earlier AA period.
• The cost of equity has decreased, due mostly to a reduction in the equity beta.
• The AER has set the market risk premium to its pre-GFC level of 6%.
14

WACC parameters
15
Parameters (%)Earlier AA
periodAPT Allgas proposal
Envestra proposal
AER draft decision
Nominal risk free rate 5.3 5.1 5.3 5.7
Inflation forecast 2.8 2.5 2.6 2.5
Cost of equity 11.3 12.2 13.0 10.5
Equity beta 1.1 1.1 0.8-1.1 0.8
Market risk premium 6 6.5 6.5-8.0 6
Cost of debt 6.6 8.9 8.7 9.6
Debt risk premium 1.3 3.9 3.4 3.9
Gearing (D/(D+E)) 60 60 55 60
Nominal cost of capital 8.7 10.2 10.6 10.0

Revenues under different WACCs – APT Allgas
16
0.0
10.0
20.0
30.0
40.0
50.0
60.0
70.0
80.0
90.0
2011-12 2012-13 2013-14 2014-15 2015-16
$m (
no
min
al)
Allgas - Proposed
Allgas - AER DD
Allgas - Earlier AA

Revenues under different WACCs – Envestra
0.0
10.0
20.0
30.0
40.0
50.0
60.0
70.0
80.0
2011-12 2012-13 2013-14 2014-15 2015-16
$m
(n
om
ina
l)
Envestra Qld - Proposed
Envestra Qld - AER DD
Envestra Qld - Earlier AA
17

Regulatory asset base – APT Allgas
0
100
200
300
400
500
600
As a
t 30 J
un
e (
$m
, n
om
inal)
Proposed
AER approved
18

Capital expenditure – APT Allgas
• AER accepted APT Allgas’s proposed capex.
• AER identified a few issues with APT Allgas’s capex proposal. But the impact was not material.
19

Total capex – APT Allgas
0
5
10
15
20
25
30
35
40
2006-07 2007-08 2008-09 2009-10 2010-11 2011-12 2012-13 2013-14 2014-15 2015-16
Rea
l $'
m 2
010-
11
Actual Estimate QCA allowance
Allgas forecast AER allowance
20

Capex by purpose – APT Allgas
Customer Requested
57%
Network augmentation
5%
Network renewal29%
Non-system9%
Customer Requested
63%Network
augmentation8%
Network renewal23%
Non-system6%
Earlier AA period
(actual)
Next AA period
(as proposed/accepted)
21

Regulatory asset base – Envestra
0
100
200
300
400
500
600
As a
t 30 J
un
e (
$m
, n
om
inal)
Proposed
AER approved
22

Capital expenditure - Envestra
• Envestra proposed a 71% real increase in capex compared to the earlier AA period– due largely to Envestra’s proposed expansion of its
mains replacement program.
• The AER accepted most of the proposed capex. Adjustments for– contingency amounts– overhead costs– real cost escalation and – mains replacement in Brisbane.
23

Total capex - Envestra
0
5
10
15
20
25
30
35
40
2006-07 2007-08 2008-09 2009-10 2010-11 2011-12 2012-13 2013-14 2014-15 2015-16
Rea
l $'
m 2
010-
11
Actual spend Estimate QCA allowanceEnvestra forecast AER allowance
24

Capex by purpose - Envestra
0
2
4
6
8
10
12
14
16
18
2006-07 2007-08 2008-09 2009-10(estimate)
2010-11(estimate)
2011-12 2012-13 2013-14 2014-15 2015-16
Mains replacement Grow th Assets Other capital expenditure
25

Mains replacement capex - Envestra
0
10
20
30
40
50
60
70
2003-04 2004-05 2005-06 2006-07 2007-08 2008-09 2009-10 2010-11 2011-12 2012-13 2013-14 2014-15 2015-16
Actual Approved Forecast
Mai
ns
rep
lace
d (
km)
26

Return of capital
• Both Envestra & APT Allgas proposed shorter asset lives than used previously.
• The AER has accepted these asset lives– increased the rate of depreciation.
• Return of capital has increased significantly.
• The following graph shows the trend in regulatory depreciation.
27

Regulatory depreciation – APT Allgas
-2.0
-1.5
-1.0
-0.5
0.0
0.5
1.0
1.5
2.0
2.520
06-0
7
2007
-08
2008
-09
2009
-10
2010
-11
2011
-12
2012
-13
2013
-14
2014
-15
2015
-16
$m (
2010
-11)
28

Regulatory depreciation - Envestra
-3.0
-2.0
-1.0
0.0
1.0
2.0
3.0
4.020
06-0
7
2007
-08
2008
-09
2009
-10
2010
-11
2011
-12
2012
-13
2013
-14
2014
-15
2015
-16$m
(20
10-1
1)
29

Operating expenditure – APT Allgas
• APT Allgas proposed a 23% real increase in opex compared to the earlier AA period, principally due to:– increased input costs – increased UAG costs, and– the need for various types of non-base year costs.
• The AER amendments, including– input cost escalators– a reduction in the price assumptions for UAG– various proposed step changes.
• The AER’s draft decision results in a 12% real increase in opex compared the earlier AA period.
30

Total opex – APT Allgas
APT Allgas opex
0
5
10
15
20
25
2001-02 2002-03 2003-04 2004-05 2005-06 2006-07 2007-08 2008-09 2009-10 2010-11 2011-12 2012-13 2013-14 2014-15 2015-16
Real
$'m
201
0-11
Actual Estimate QCA allowance AER allowance Allgas's forecast
31

Operating expenditure - Envestra
• Envestra proposed a 16% real increase in opex compared to the earlier AA period, principally due to:– increasing input costs– increasing UAG costs– increased network development, and – the need for various non-base year costs.
• The AER required a number of amendments, including:– input cost escalation– network development– UAG expenditure and– several of the proposed non base year costs.
• The AER’s draft decision results in an 11% real reduction in opex compared to the earlier AA period.
32

Base year costs - Envestra
33
Opex/km
0100020003000400050006000700080009000
$(2
00
9-1
0)/
km

Total opex - Envestra
Envestra opex
0
5
10
15
20
25
2001-02 2002-03 2003-04 2004-05 2005-06 2006-07 2007-08 2008-09 2009-10 2010-11 2011-12 2012-13 2013-14 2014-15 2015-16
Rea
l $'m
201
0-11
Actual Estimate QCA allowance Envestra's forecast AER allowance
34
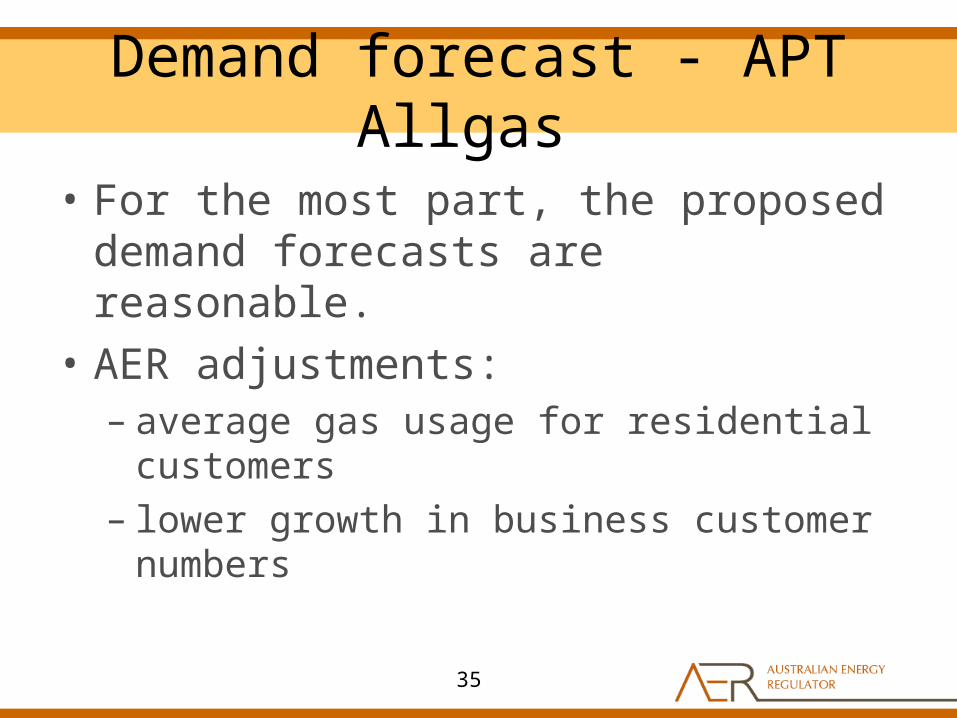
Demand forecast - APT Allgas
• For the most part, the proposed demand forecasts are reasonable.
• AER adjustments:– average gas usage for residential customers– lower growth in business customer numbers
35

APT Allgas residential customer numbers forecast
Residential customer numbers
0
10,000
20,000
30,000
40,000
50,000
60,000
70,000
80,000
90,000
100,000
2006-07 2007-08 2008-09 2009-10 2010-11 2011-12 2012-13 2013-14 2014-15 2015-16
Actual AER draft decision
36

APT Allgas average residential consumption forecast
Average residential consumption
0
2
4
6
8
10
12
14
2006-07 2007-08 2008-09 2009-10 2010-11 2011-12 2012-13 2013-14 2014-15 2015-16
GJ
Actual APT Allgas proposal AER draft decision
37

Demand forecast - Envestra
• For the most part, the proposed demand forecasts are reasonable.
• AER adjustments:– average gas usage for residential customers
38

Envestra residential customer numbers forecast
Residential customer numbers
0
10,000
20,000
30,000
40,000
50,000
60,000
70,000
80,000
90,000
100,000
2005-06 2006-07 2007-08 2008-09 2009-10 2010-11 2011-12 2012-13 2013-14 2014-15 2015-16
Actual AER draft decision
39

Envestra average residential consumption
Average residential consumption
0
2
4
6
8
10
12
1999-00 2000-01 2001-02 2002-03 2003-04 2004-05 2005-06 2006-07 2007-08 2008-09 2009-10 2010-11 2011-12 2012-13 2013-14 2014-15 2015-16
GJ
Actual AER draft decision Envestra proposal
+
40

Terms and conditions
• Submissions:– overall terms and conditions were weighted
too much in favour of the service providers.
• The AER accepts most of the proposed terms and conditions for both service providers.
• However, changes are required to provide a better balance between the service providers and customers
41

Consultant advice
• Cost of capital: Professor Kevin Davis
• Opex and capex forecasts: Wilson Cook
• Labour cost growth: Access Economics
• Demand forecasts: ACIL Tasman
42

Timeline
Release of draft decisions 17 February 2011
Public forum on draft decisions 1 March 2011
Revised proposals to be submitted 23 March 2011
Submissions on draft decisions due 21 April 2011
Release of final decisions Late May 2011
43


![[XLS] · Web view2011 1/3/2011 1/3/2011 1/5/2011 1/7/2011 1/7/2011 1/7/2011 1/7/2011 1/7/2011 1/7/2011 1/7/2011 1/7/2011 1/7/2011 1/11/2011 1/11/2011 1/11/2011 1/11/2011 1/11/2011](https://static.fdocuments.in/doc/165x107/5b3f90027f8b9aff118c4b4e/xls-web-view2011-132011-132011-152011-172011-172011-172011-172011.jpg)