Draft Clark College 2016 Financial Report-unaudited · Management’s Discussion and Analysis ......
66
Transcript of Draft Clark College 2016 Financial Report-unaudited · Management’s Discussion and Analysis ......


2 | P a g e
This page intentionally left blank

3 | P a g e
Clark College
2017 Financial Report Table of Contents Trustees and Executive Officers ............................................................................................................ 4
Independent Auditor’s Report on Financial Statements ........................................................................ 5
Management’s Discussion and Analysis................................................................................................ 9
College Statement of Net Position ....................................................................................................... 21
Foundation Statement of Financial Position ........................................................................................ 22
College Statement of Revenues, Expenses and Changes in Net Position ............................................ 23
Foundation Statement of Activities and Changes in Net Position ....................................................... 24
College Statement of Cash Flows ........................................................................................................ 25
Foundation Statement of Cash Flows .................................................................................................. 27
Notes to the Financial Statements ........................................................................................................ 28
Required Supplementary Information .................................................................................................. 57
For information about the financial data included in this report, contact: Bob Williamson, Vice President of Administrative Services Clark College 1933 Fort Vancouver Way Vancouver, WA 98663 360-992-2464 For information about enrollment, degrees awarded, or academic programs, contact: Institutional Planning and Effectiveness Clark College 1933 Fort Vancouver Way Vancouver, WA 98663 360-992-2840 or Visit the home page at http://www.clark.edu

4 | P a g e
Trustees and Executive Officers BOARD OF TRUSTEES Jada Rupley, Chair Royce Pollard, Vice Chair Rekah Strong Jack Burkman Jane Jacobsen EXECUTIVE OFFICERS Robert K. Knight, President Bob Williamson, Vice President of Administrative Services Dr. Tim Cook, Vice President of Instruction William Belden, Vice President of Student Affairs Dr. Darcy Rourk, Interim Vice President of Human Resources and Compliance Kevin Witte, Vice President of Economic and Community Development Shanda Diehl, Associate Vice President of Planning and Effectiveness Dr. Loretta Capeheart, Associate Vice President of Diversity, Equity, and Inclusion Dr. Chato Hazelbaker, Chief Communications Officer and Interim Technology Director Lisa Gibert, Clark College Foundation President and CEO Trustees and Officer list effective as of October 31, 2017

5 | P a g e
Independent Auditor’s Report on Financial Statements
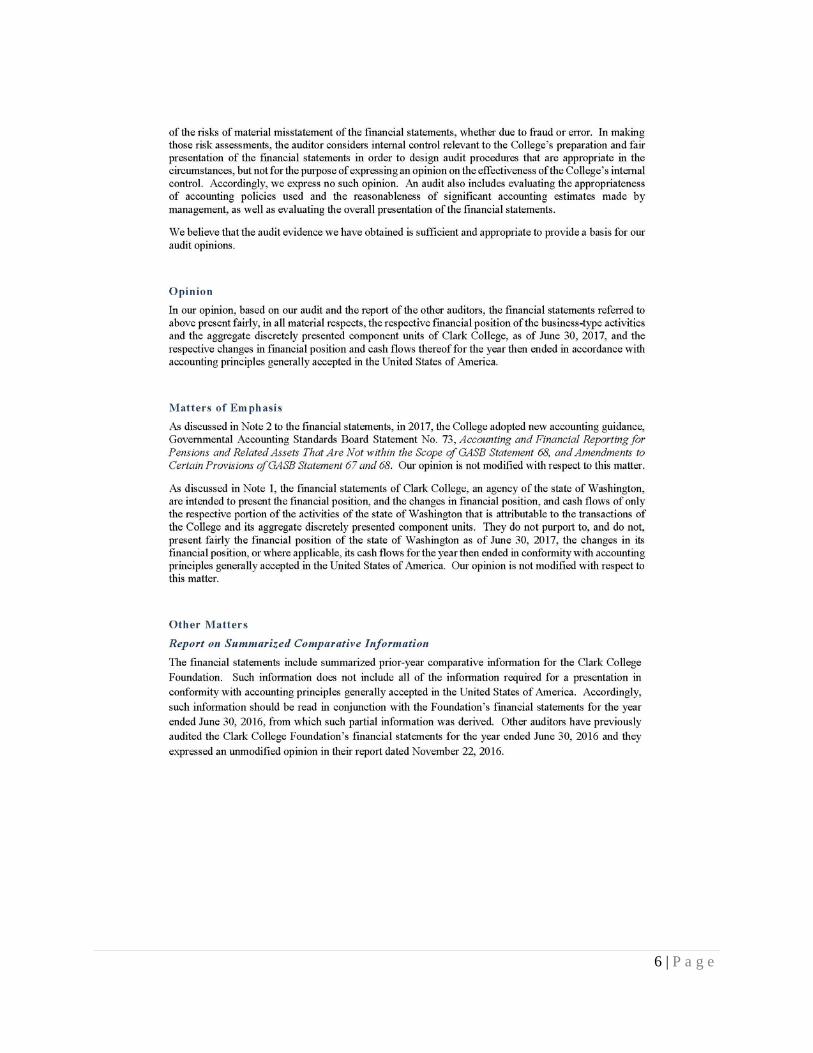
6 | P a g e
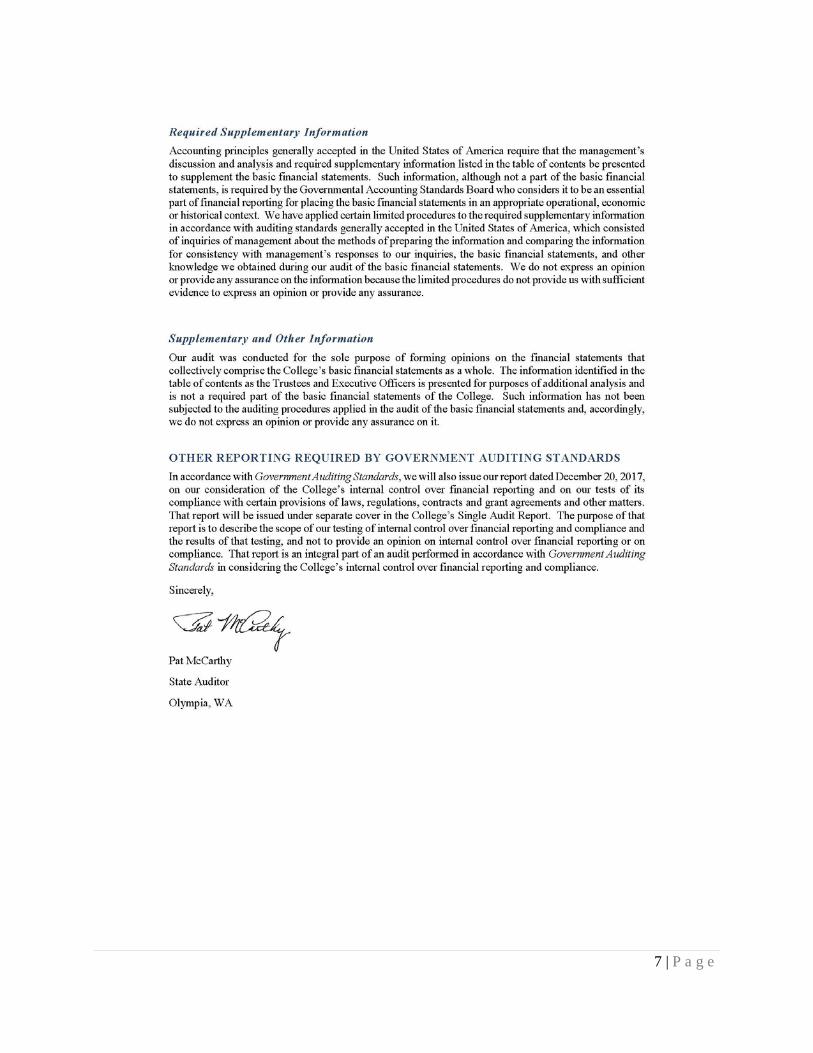
7 | P a g e

8 | P a g e

9 | P a g e
Management’s Discussion and Analysis
Clark College The following discussion and analysis provides an overview of the financial position and activities of Clark College (the College) for the fiscal year ended June 30, 2017 (FY 2017). This overview provides readers with an objective and easily readable analysis of the College’s financial performance for the year, based on currently known facts and conditions. This discussion has been prepared by management and should be read in conjunction with the College’s financial statements and accompanying note disclosures. Reporting Entity Clark College is one of thirty public community and technical college districts in the state of Washington, providing comprehensive, open-door academic programs, workforce education, basic skills and community service educational programs to approximately 12,300 students. The College confers associates degrees, certificates and high school diplomas. The College was established in 1933. Its primary purpose is to provide opportunities for diverse learners to achieve their educational and professional goals, thereby enriching the social, cultural, and economic environment of our region and the global community. The College’s main campus is located in Vancouver, Washington, a community of about 174,800 residents. The College also offers classes at our satellite locations in east Vancouver at the Columbia Tech Center, and in north Vancouver on the campus of Washington State University Vancouver. Economic and Community Development classes are offered in downtown Vancouver at the Columbia Bank Building. The College is currently planning for an additional location in north Clark County and has just completed building a new Science, Technology, Engineering and Math (STEM) building at its main campus to serve the increased demand for training in these fields. The College is governed by a five member Board of Trustees appointed by the governor with the consent of the state Senate. By statute, the Board of Trustees has full control of the College, except as otherwise provided by law. Using the Financial Statements The financial statements presented in this report encompass the College and its component unit, the Clark College Foundation. The College’s financial statements include the Statement of Net Position; the Statement of Revenues, Expenses and Changes in Net Position, and the Statement of Cash Flows. The Statement of Net Position provides information about the College as of June 30, 2017. The Statement of Revenue, Expenses and Changes in Net Position and the Statement of Cash flows provide information about operations and activities over the entire fiscal year. Together, these statements, along with the accompanying notes, provide a comprehensive way to assess the College’s financial health.

10 | P a g e
The Statement of Net Position and Statement of Revenues, Expenses and Changes in Net Position are reported under the accrual basis of accounting where all of the current year’s revenues and expenses are taken into account regardless of when cash is received or payments are made. Full accrual statements are intended to provide a view of the College’s financial position similar to that presented by most private-sector companies. These financial statements are prepared in accordance with generally accepted accounting principles as prescribed by the Governmental
Accounting Standards Board (GASB), which establishes standards for external financial reporting for public colleges and universities. The full scope of the College’s activities is considered to be a single business-type activity and accordingly, is reported within a single column in the basic financial statements. During 2017, the College adopted GASB Statement No. 73, Accounting and Financial Reporting for Pensions and Related Assets That Are Not within the Scope of GASB Statement 68, and Amendments to Certain Provisions of GASB Statements 67 and 68 as amended by GASB Statement No. 71. It establishes financial reporting requirements for defined benefit pensions that are provided to employees of state and local governmental employers and that are not administered through trusts or equivalent arrangements and therefore outside the scope of Statement 68. The College is required to record its proportionate share of net pension liabilities, deferred inflows, pension expense and benefit payments. The change in accounting principle resulted in $4,159,228 in pension liability associated with GASB Statement No. 73. Additional information can be found in Notes 17 and 18. Statement of Net Position The Statement of Net Position provides information about the College’s financial position, and presents the College’s assets, liabilities, and net position at year-end and includes all assets and liabilities of the College. A condensed Statement of Net Position is as follows:
Condensed Statement of Net PositionAs of June 30th
FY 2017 FY 2016
AssetsCurrent Assets 29,235,432 26,062,537Capital Assets, net 136,548,751 133,156,531
Total Assets 165,784,183$ 159,219,068$ Deferred Outflows 3,549,045$ 2,456,961$ Liabilities
Current Liabilities 6,897,233 8,441,688 Other Liabilities, non-current 32,620,078 17,666,551
Total Liabilities 39,517,311$ 26,108,239$ Deferred Inflows 1,752,373$ 2,190,884$ Net Position 128,063,544$ 133,376,906$
11 | P a g e
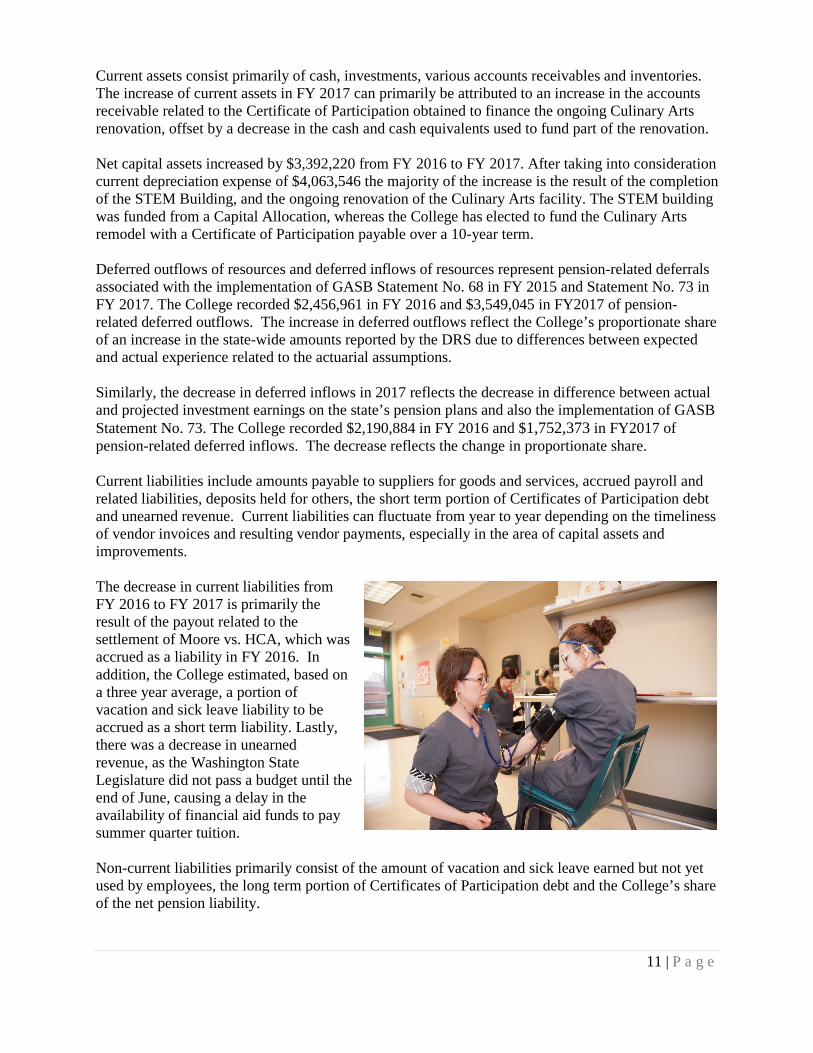
Current assets consist primarily of cash, investments, various accounts receivables and inventories. The increase of current assets in FY 2017 can primarily be attributed to an increase in the accounts receivable related to the Certificate of Participation obtained to finance the ongoing Culinary Arts renovation, offset by a decrease in the cash and cash equivalents used to fund part of the renovation. Net capital assets increased by $3,392,220 from FY 2016 to FY 2017. After taking into consideration current depreciation expense of $4,063,546 the majority of the increase is the result of the completion of the STEM Building, and the ongoing renovation of the Culinary Arts facility. The STEM building was funded from a Capital Allocation, whereas the College has elected to fund the Culinary Arts remodel with a Certificate of Participation payable over a 10-year term. Deferred outflows of resources and deferred inflows of resources represent pension-related deferrals associated with the implementation of GASB Statement No. 68 in FY 2015 and Statement No. 73 in FY 2017. The College recorded $2,456,961 in FY 2016 and $3,549,045 in FY2017 of pension-related deferred outflows. The increase in deferred outflows reflect the College’s proportionate share of an increase in the state-wide amounts reported by the DRS due to differences between expected and actual experience related to the actuarial assumptions. Similarly, the decrease in deferred inflows in 2017 reflects the decrease in difference between actual and projected investment earnings on the state’s pension plans and also the implementation of GASB Statement No. 73. The College recorded $2,190,884 in FY 2016 and $1,752,373 in FY2017 of pension-related deferred inflows. The decrease reflects the change in proportionate share. Current liabilities include amounts payable to suppliers for goods and services, accrued payroll and related liabilities, deposits held for others, the short term portion of Certificates of Participation debt and unearned revenue. Current liabilities can fluctuate from year to year depending on the timeliness of vendor invoices and resulting vendor payments, especially in the area of capital assets and improvements. The decrease in current liabilities from FY 2016 to FY 2017 is primarily the result of the payout related to the settlement of Moore vs. HCA, which was accrued as a liability in FY 2016. In addition, the College estimated, based on a three year average, a portion of vacation and sick leave liability to be accrued as a short term liability. Lastly, there was a decrease in unearned revenue, as the Washington State Legislature did not pass a budget until the end of June, causing a delay in the availability of financial aid funds to pay summer quarter tuition. Non-current liabilities primarily consist of the amount of vacation and sick leave earned but not yet used by employees, the long term portion of Certificates of Participation debt and the College’s share of the net pension liability.
12 | P a g e
The College’s non-current liabilities increased mainly due to the issuance of two Certificates of Participation debt instruments and an increase in the College’s proportionate share of the net pension liability. In addition, the College established its proportionate share of the pension liability related to the implementation of GASB 73. Net position represents the value of the College’s assets after liabilities are deducted. The College is required by accounting standards to report its net position in four categories:
Net Investment in Capital Assets – The College’s total investment in property, plant, equipment, and infrastructure net of accumulated depreciation and outstanding debt obligations related to those capital assets. Changes in these balances are discussed above.
Restricted:
Nonexpendable – consists of funds which a donor or external party has imposed the restriction that the corpus or principal is not available for expenses but for investment purposes only. Historically, donors interested in establishing such funds to benefit the College or its students have chosen to do so through the Foundation. As a result, the College is not reporting any balance in this category. Expendable – resources the College is legally or contractually obligated to spend in accordance with restrictions placed by donor and/or external parties who have placed time or purpose restrictions on the use of the asset. The expendable balance for the College is funds held for student loans and institutional financial aid funds per RCW 28B.15.820.
Unrestricted: Includes all other assets not subject to externally imposed restrictions, but which may be designated or obligated for specific purposes by the Board of Trustees or Executive Cabinet. Prudent balances are maintained for use as working capital, as a reserve against emergencies and for other purposes, in accordance with policies established by the Board of Trustees.
Net PositionAs of June 30th FY 2017 FY 2016
Net investment in capital assets $133,744,435 $133,156,531Restricted
Expendable - Grants in Aid 914,217 348,419 Expendable - Student Loans 35,758 35,893
Unrestricted (6,630,866) (163,937) Total Net Position $128,063,544 $133,376,906 Statement of Revenues, Expenses and Changes in Net Position The Statement of Revenues, Expenses and Changes in Net Position accounts for the College’s changes in total net position during FY 2017. The objective of the statement is to present the revenues earned, both operating and non-operating, and the expenses incurred by the College, along with any other revenue, expenses, and gains and losses of the College. Generally, operating revenues are earned by the College in exchange for providing goods and services. Tuition, grants and contracts are included in this category. In contrast, non-operating revenues include monies the College receives from another government agency without directly

13 | P a g e
giving equal value to that agency in return. Accounting standards require that the College categorize state operating appropriations and Pell Grants as non-operating revenues. Operating expenses are expenses incurred in the normal operation of the College, including depreciation on property and equipment. When operating revenues, excluding state appropriations and Pell Grants, are measured against operating expenses, the College shows an operating loss. The operating loss is reflective of the external funding necessary to keep tuition lower than the cost of the services provided. A condensed comparison of the College’s revenues, expenses and changes in net position for the years ended June 30, 2017 and 2016 is presented as follows:
As of June 30thFY 2017 FY 2016 Change
Operating Revenues
Student tuition and fees, net 21,324,126$ 22,189,151$ (865,025)$
Auxiliary enterprise sales 6,038,382 6,310,438 (272,056)
State and local gants and contracts 23,141,563 22,424,548 717,015
Federal grants and contracts 703,782 961,827 (258,045)
Other operating revenues 1,275,315 1,733,173 (457,858)
Total operating revenues 52,483,168 53,619,137 (1,135,969)
Operating Expenses (102,312,248) (98,791,399) (3,520,849)
Operating Loss (49,829,080) (45,172,262) (4,656,818)
Non-operating revenues
State appropriations 34,267,598 30,794,673 3,472,925
Federal Pell grant revenue 12,450,915 13,867,167 (1,416,252)
Investment income, net 125,989 58,444 67,545
Non-operating expenses (3,090,314) (3,153,243) 62,929
Net non-operating revenues (expense) 43,754,188 41,567,041 2,187,147
Income (loss) before capital contributions (6,074,892) (3,605,221) (2,469,671)
Capital Appropriations and Contributions 5,939,757 23,218,914 (17,279,157)
Change in Net Position (135,135) 19,613,693 (19,748,828)
Net Position, Beginning of the Year 133,376,906 113,763,213 19,613,693
Change in Accounting Principle (5,178,227) - (5,178,227)
Net Position, End of the Year 128,063,544$ 133,376,906$ (5,313,362)$
Condensed Statement of Revenues, Expenses, and Changes in Net Position
14 | P a g e
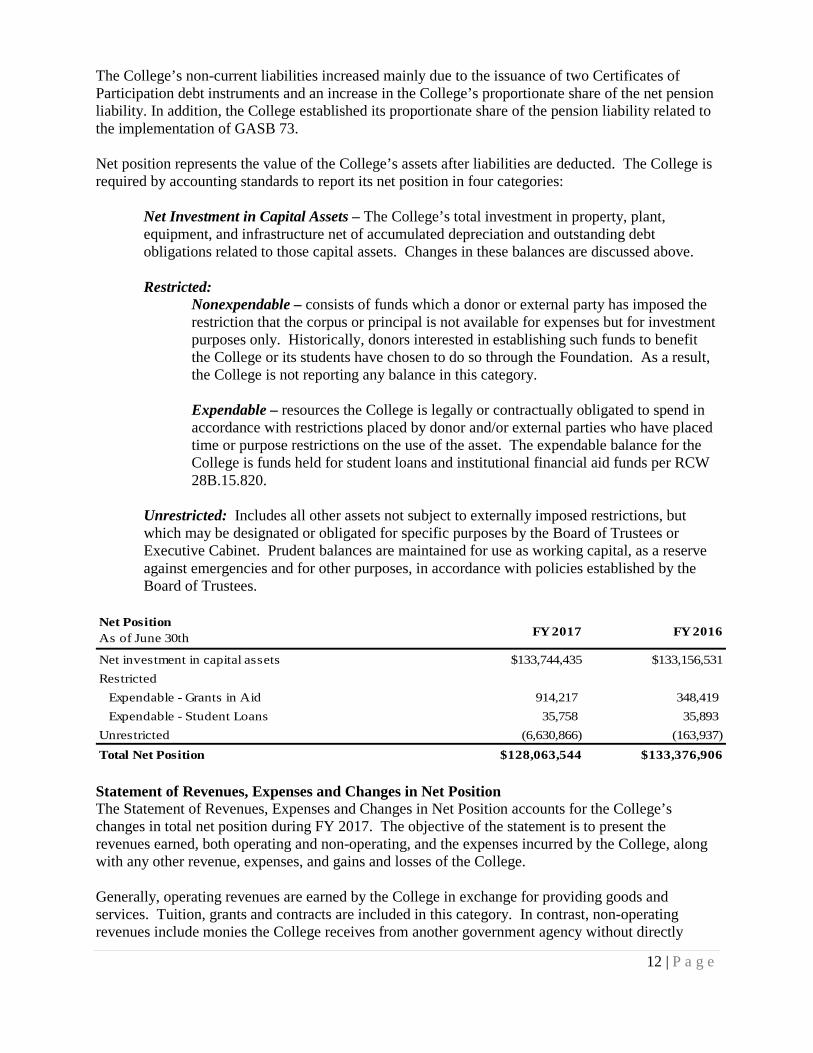
Revenues The state of Washington appropriates funds to the community college system as a whole. The State Board for Community and Technical Colleges (SBCTC) then allocates monies to each college. In FY 2017, the SBCTC moved forward with a new allocation model, allocating funds to each of the 34 College’s based on 3 year average FTE actuals. In FY 2017, the College saw a small increase in its state allocation due to the implementation of this new model. In addition, the College received a one-time allocation of $1,878,730 for a portion of its share of Moore vs HCA settlement cost. This allocation does not carry forward to future years.
In FY 2017, the College’s decrease in tuition and fee revenue is primarily attributable to the decline in enrollment along with changes in enrollment levels such as fewer part-time students, as well as a decrease in international students. Pell Grant revenues generally follow enrollment trends. As the College’s enrollment decreased during FY 2017, so did the College’s Pell Grant revenue. For FY 2017, the College attempted to keep other fees as stable as possible, resulting in only small changes in these revenues.
0
2000
4000
6000
8000
10000
12000
$20,000,000
$22,000,000
$24,000,000
$26,000,000
$28,000,000
$30,000,000
$32,000,000
$34,000,000
$36,000,000
FY 2008 FY 2009 FY 2010 FY 2011 FY 2012 FY 2013 FY 2014 FY 2015 FY 2016 FY 2017
State Operating Allocation Compared to Annual Full Time Equivalent Enrollments
Final State Operating Allocation FTEs
15 | P a g e
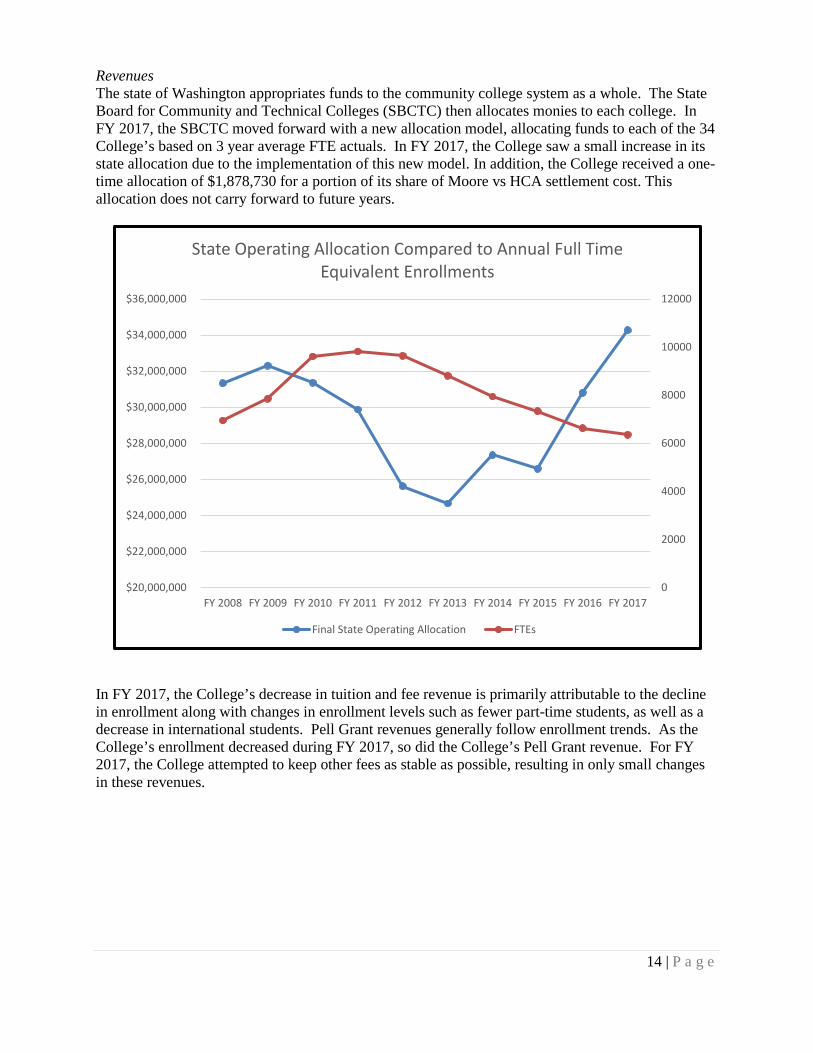
In FY 2017, state and local operating grant and contract revenues increased by $717,015 when compared with FY 2016. This is primarily attributable to a steady increase in Running Start enrollments as well as a slight increase in the Running Start reimbursement rates. The College continued to serve students under the terms of contracted programs. The College contracts with local high schools to enroll Running Start students who earn both high school and college credit for these courses.
21%
22%
12%1%
6%
5%
33%
FY 2017 Selected Elements of Revenue Tuition and Fees,net,$21,324,126
Grants and Contracts,$23,141,563
Pell Grants, $12,450,915
Federal Grants, $703,782
Auxiliary Enterprise Sales,$6,038,382
Capital Appropriations,$5,523,948
State Appropriations,$34,267,598
19%
19%
12%
1%
5%
18%
26%
FY 2016 Tuition and Fees, net,$22,189,151
Grants and Contracts,$22,424,548
Pell Grants,$13,867,167
Federal Grants,$961,827
Auxiliary EnterpriseSales, $6,310,438
Capital Appropriations,$21,683,045
State Appropriations,$30,794,673

16 | P a g e
The College receives capital spending authority on a biennial basis. In accordance with accounting standards, the amount shown as capital appropriation revenue on the financial statements is the amount expended in the current year. Expenses from capital project funds that do not meet accounting standards for capitalization are reported as operating expenses. Those expenses that meet the capitalization standard are not shown as expense in the current period and are instead recognized as depreciation expense over the expected useful life of the asset.
Exterior patio area for the new Tod and Maxine McClaskey Culinary Arts Institute
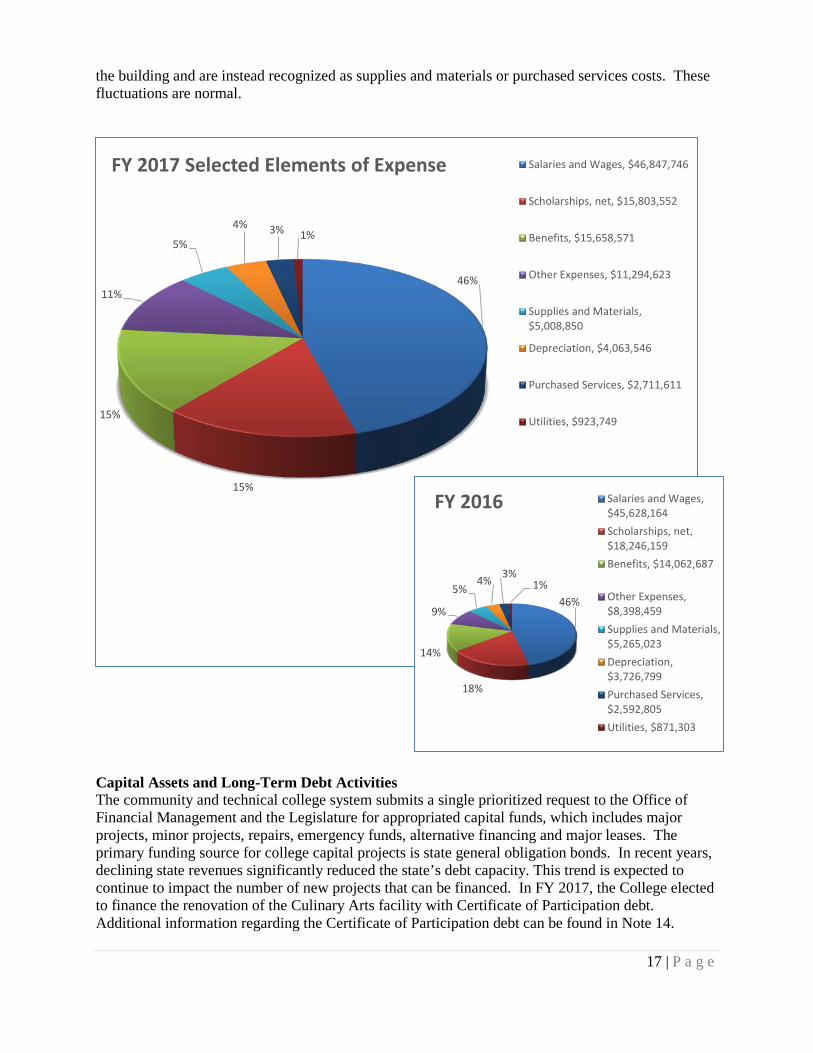
Expenses Faced with severe budget cuts over the past six years, the College has continuously sought opportunities to identify savings and efficiencies, while also looking at opportunities for innovation. More recently, in FY 2017, salary costs increased by over $1.2 million as a direct result of the 1.8% salary increase appropriated by the Legislature. In addition, benefits increased by approximately $1.6 million as a result of the increased healthcare and retirement costs, as well as the accrual of pension adjustments related to GASB 68 and 73 reporting. Scholarships including financial aid declined by over $2.4 million in FY 2017. This is in direct correlation to the decline in enrollment, whereby the College served fewer students seeking aid than in prior years. In addition, the College has continued to educate students on financial literacy, encouraging a reduction in loans taken out by our students. Other Expenses increased by over $2.8 million and was partially attributable to the Moore vs. HCA settlement payout costs of $1.29 million. Certain capital project costs do not meet accounting criteria for capitalization as part of the cost of
17 | P a g e
the building and are instead recognized as supplies and materials or purchased services costs. These fluctuations are normal.
Capital Assets and Long-Term Debt Activities The community and technical college system submits a single prioritized request to the Office of Financial Management and the Legislature for appropriated capital funds, which includes major projects, minor projects, repairs, emergency funds, alternative financing and major leases. The primary funding source for college capital projects is state general obligation bonds. In recent years, declining state revenues significantly reduced the state’s debt capacity. This trend is expected to continue to impact the number of new projects that can be financed. In FY 2017, the College elected to finance the renovation of the Culinary Arts facility with Certificate of Participation debt. Additional information regarding the Certificate of Participation debt can be found in Note 14.
46%
15%
15%
11%
5%
4% 3% 1%
FY 2017 Selected Elements of Expense Salaries and Wages, $46,847,746
Scholarships, net, $15,803,552
Benefits, $15,658,571
Other Expenses, $11,294,623
Supplies and Materials,$5,008,850
Depreciation, $4,063,546
Purchased Services, $2,711,611
Utilities, $923,749
46%
18%
14%
9%
5%4% 3%
1%
FY 2016 Salaries and Wages,$45,628,164Scholarships, net,$18,246,159Benefits, $14,062,687
Other Expenses,$8,398,459Supplies and Materials,$5,265,023Depreciation,$3,726,799Purchased Services,$2,592,805Utilities, $871,303

18 | P a g e
At June 30, 2017, the College had invested $136,587,691 in capital assets, net of accumulated depreciation. This represents an increase of $3,431,160 from last year, as shown in the table on the following page.
Asset Type June 30, 2017 June 30, 2016 ChangeLand $11,021,429 $10,904,347 $117,082Construction in Progress $5,065,860 $32,618,594 -$27,552,734Buildings, net $114,692,622 $83,900,022 $30,792,600Other Improvements and Infrastructure, net $3,180,945 $3,172,412 $8,533Equipment, net $2,348,209 $2,383,378 -$35,169Library Resources, net $239,686 $177,778 $61,908Total Capital Assets, Net $136,548,751 $133,156,531 $3,392,220
The increase in net capital assets can be attributed to the completion of the STEM Building, ongoing renovation of the Culinary Arts facility, and normal replacement and acquisition of equipment and library resources. The only significant capital project in process on June 30, 2017 was the Culinary Arts facility renovation. Additional information on capital assets can be found in Note 7 of the Notes to the Financial Statements.
South facade view of the new STEM building
Economic Factors That May Affect the Future From FY 2009 through FY 2015, the College’s state operating appropriations decreased by approximately 15 percent. Compounding that decrease was the enactment of the Affordable Education Act in FY 2016, which reduced tuition rates by 5% at the College. The Legislature did,
19 | P a g e
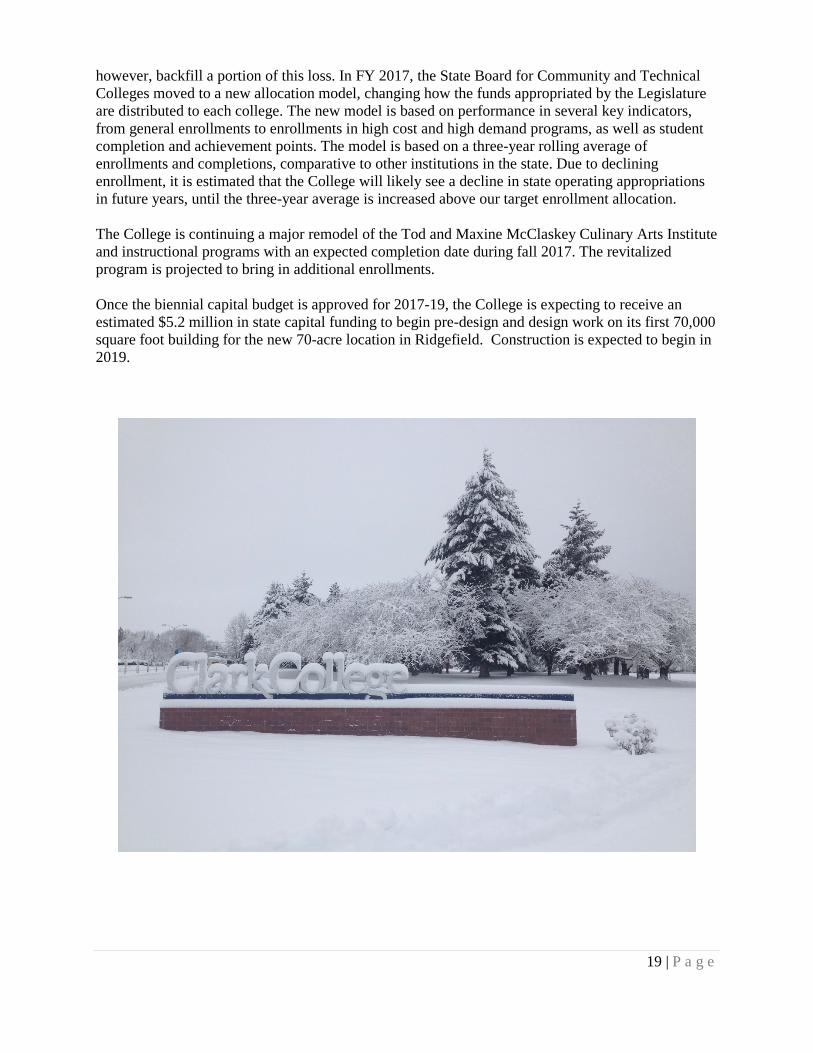
however, backfill a portion of this loss. In FY 2017, the State Board for Community and Technical Colleges moved to a new allocation model, changing how the funds appropriated by the Legislature are distributed to each college. The new model is based on performance in several key indicators, from general enrollments to enrollments in high cost and high demand programs, as well as student completion and achievement points. The model is based on a three-year rolling average of enrollments and completions, comparative to other institutions in the state. Due to declining enrollment, it is estimated that the College will likely see a decline in state operating appropriations in future years, until the three-year average is increased above our target enrollment allocation. The College is continuing a major remodel of the Tod and Maxine McClaskey Culinary Arts Institute and instructional programs with an expected completion date during fall 2017. The revitalized program is projected to bring in additional enrollments. Once the biennial capital budget is approved for 2017-19, the College is expecting to receive an estimated $5.2 million in state capital funding to begin pre-design and design work on its first 70,000 square foot building for the new 70-acre location in Ridgefield. Construction is expected to begin in 2019.

20 | P a g e
This page intentionally left blank.
21 | P a g e
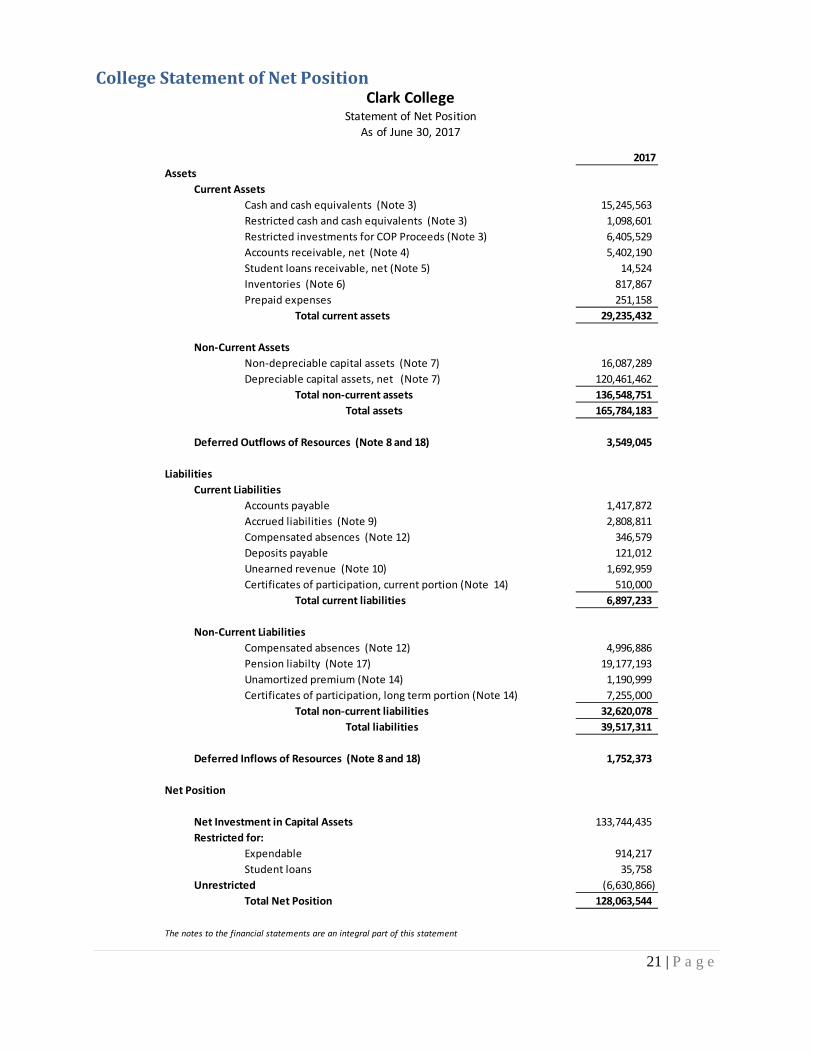
College Statement of Net Position
2017Assets
Current AssetsCash and cash equivalents (Note 3) 15,245,563 Restricted cash and cash equivalents (Note 3) 1,098,601 Restricted investments for COP Proceeds (Note 3) 6,405,529 Accounts receivable, net (Note 4) 5,402,190 Student loans receivable, net (Note 5) 14,524 Inventories (Note 6) 817,867 Prepaid expenses 251,158
Total current assets 29,235,432
Non-Current AssetsNon-depreciable capital assets (Note 7) 16,087,289 Depreciable capital assets, net (Note 7) 120,461,462
Total non-current assets 136,548,751 Total assets 165,784,183
Deferred Outflows of Resources (Note 8 and 18) 3,549,045
LiabilitiesCurrent Liabilities
Accounts payable 1,417,872 Accrued liabilities (Note 9) 2,808,811 Compensated absences (Note 12) 346,579 Deposits payable 121,012 Unearned revenue (Note 10) 1,692,959 Certificates of participation, current portion (Note 14) 510,000
Total current liabilities 6,897,233
Non-Current LiabilitiesCompensated absences (Note 12) 4,996,886 Pension liabilty (Note 17) 19,177,193 Unamortized premium (Note 14) 1,190,999 Certificates of participation, long term portion (Note 14) 7,255,000
Total non-current liabilities 32,620,078 Total liabilities 39,517,311
Deferred Inflows of Resources (Note 8 and 18) 1,752,373
Net Position
Net Investment in Capital Assets 133,744,435 Restricted for:
Expendable 914,217 Student loans 35,758
Unrestricted (6,630,866) Total Net Position 128,063,544
The notes to the financial statements are an integral part of this statement
Clark CollegeStatement of Net Position
As of June 30, 2017

22 | P a g e
Foundation Statement of Financial Position

23 | P a g e
College Statement of Revenues, Expenses and Changes in Net Position
2017Operating Revenues
Student tuition and fees 29,400,353 Less scholarship discounts and allowances (8,076,227) Auxiliary enterprise sales 6,038,382 State and local grants and contracts 23,141,563 Federal grants and contracts 703,782 Other operating revenues 1,275,315
Total operating revenue 52,483,168
Operating ExpensesSalaries and wages 46,847,746 Benefits 15,658,571 Scholarships, net of discounts 15,803,552 Other expense 11,294,623 Supplies and materials 5,008,850 Depreciation 4,063,546 Purchased services 2,711,611 Utilities 923,749
Total operating expenses 102,312,248
Operating income (loss) (49,829,080)
Non-Operating Revenues (Expenses)State appropriations 34,267,598 Federal Pell grant revenue 12,450,915 Investment income, gains and losses 125,989 Loss on disposal (8,637) Building fee remittance (2,457,804) Innovation fund remittance (590,031) Interest on indebtedness (33,842)
Net non-operating revenues (expenses) 43,754,188
Income or (loss) before capital contributions (6,074,892)
Capital appropriations 5,523,948 Capital contribution-Foundation 415,809
Increase (decrease) in net position (135,135)
Net PositionNet position, beginning of year 133,376,906 Cumulative effect of change in accounting principle (Note 2) (5,178,227) Net position, beginning of year, as restated 128,198,679 Net position, end of year 128,063,544
The notes to the financial statements are an integral part of this statement
Clark CollegeStatement of Revenues, Expenses and Changes in Net Position
For the Year Ended June 30, 2017

24 | P a g e
Foundation Statement of Activities and Changes in Net Position

25 | P a g e
College Statement of Cash Flows
2017Cash flow from operating activities
Student tuition and fees, net 19,533,521 Grants and contracts 23,584,796 Payments to vendors (19,614,603) Payments for utilities (900,840) Payments to employees (46,816,705) Payments for benefits (15,840,178) Auxiliary enterprise sales 5,920,592 Payments for scholarships (15,803,552) Loans issued to students (105,157) Collection of loans to students 113,079 Other receipts 4,526,907
Net cash used by operating activities (45,402,140)
Cash flow from noncapital financing activitiesState appropriations 33,814,631 Pell grants 12,450,915 Building fee remittance (2,442,232) Innovation fund remittance (603,657) Principal paid on noncapital debt (25,000) Interest paid on noncapital debt (16,137)
Net cash provided by noncapital financing activities 43,178,520
Cash flow from capital and related financing activitiesProceeds from capital debt 2,133,599 Capital appropriations 4,279,888 Capital contribution-Foundation 1,622,993 Purchases of capital assets (7,389,464)
Net cash used by capital and related financing activities 647,016
Cash flow from investing activitiesIncome of investments 125,989
Net cash provided by investing activities 125,989
Increase (decrease) in cash and cash equivalents (1,450,615)
Cash and cash equivalents at the beginning of the year 17,794,779
Cash and cash equivalents at the end of the year 16,344,164
The notes to the financial statements are an integral part of this statement
Clark CollegeStatement of Cash Flows
For the Years Ended June 30, 2017
26 | P a g e
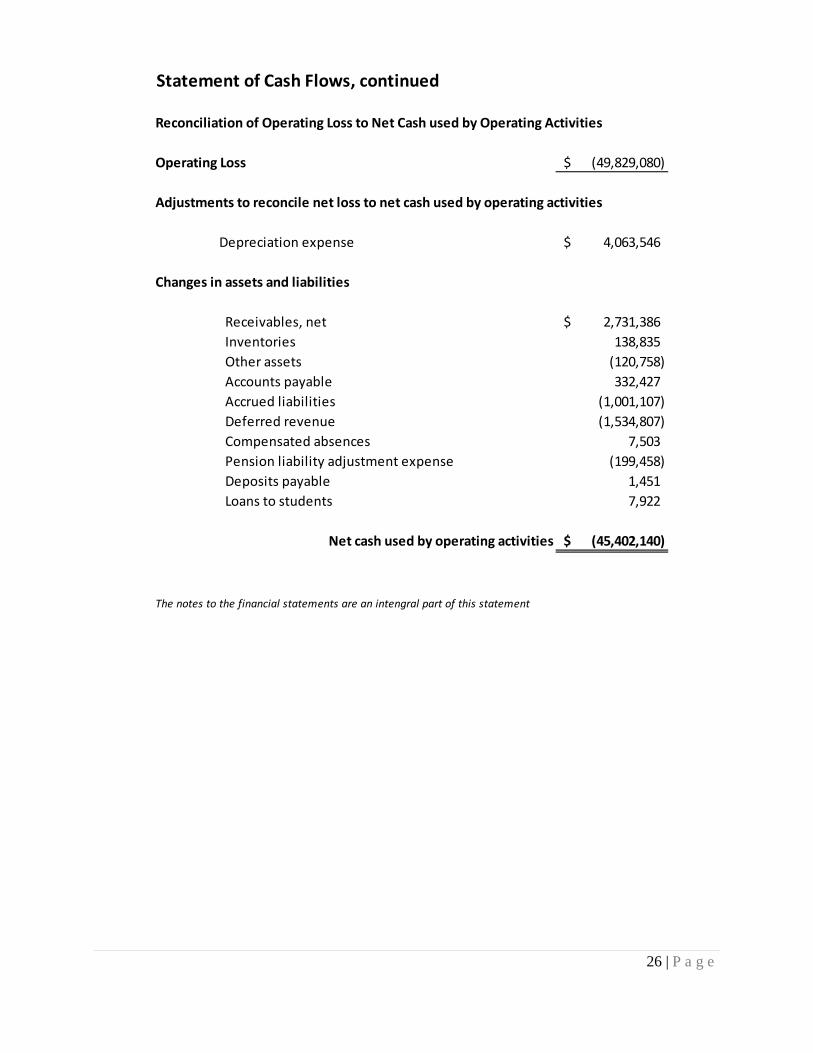
Reconciliation of Operating Loss to Net Cash used by Operating Activities
Operating Loss (49,829,080)$
Adjustments to reconcile net loss to net cash used by operating activities
Depreciation expense 4,063,546$
Changes in assets and liabilities
Receivables, net 2,731,386$ Inventories 138,835 Other assets (120,758) Accounts payable 332,427 Accrued liabilities (1,001,107) Deferred revenue (1,534,807) Compensated absences 7,503 Pension liability adjustment expense (199,458) Deposits payable 1,451 Loans to students 7,922
Net cash used by operating activities (45,402,140)$
The notes to the financial statements are an intengral part of this statement
Statement of Cash Flows, continued

27 | P a g e
Foundation Statement of Cash Flows

28 | P a g e
Notes to the Financial Statements June 30, 2017 These notes form an integral part of the financial statements. 1. Summary of Significant Accounting Policies Financial Reporting Entity Clark College (the College) is a comprehensive community college offering open-door academic programs, workforce education, basic skills, and community services. The College confers associates degrees, certificates and high school diplomas. It is governed by a five-member Board of Trustees appointed by the Governor and confirmed by the state Senate. The College is an agency of the State of Washington. The financial activity of the College is included in the State’s Comprehensive Annual Financial Report. The Clark College Foundation (the Foundation) is a separate but affiliated non-profit entity, incorporated under Washington law in 1973 and recognized as a tax exempt 501(c)(3) charity. The Foundation’s charitable purpose is to help individuals, families and organizations blend their personal priorities with the charitable priorities of Clark College to create a growing base of diverse endowments as well as increasing range of current, planned, and periodically, strategic capital gifts that advance Clark College as an extraordinary community college. Because the majority of the Foundation’s income and resources are restricted by donors and may only be used for the benefit of the College or its students, the Foundation is considered a component unit based on the criteria contained in Governmental Accounting Standards Board (GASB) Statement Nos. 61, 39 and 14. A component unit is an entity which is legally separate from the College, but has the potential to provide significant financial benefits to the College or whose relationship with the College is such that excluding it would cause the College’s financial statements to be misleading or incomplete. The Foundation’s financial statements are discretely presented in this report. The Foundation’s statements have been prepared in accordance with accounting principles generally accepted in the United States of America. Intra-entity transactions and balances between the College and the Foundation are not eliminated for financial statement presentation. During the fiscal year ended June 30, 2017, the Foundation distributed $1,765,087 to the College for restricted and unrestricted purposes, which includes student scholarships, program support, and capital improvements. A copy of the Foundation’s complete financial statements may be obtained from the Foundation’s Administrative Offices at 360-992-2301. Basis of Presentation The financial statements have been prepared in accordance with GASB Statement No. 34, Basic Financial Statements and Management Discussion and Analysis for State and Local Governments as amended by GASB Statement No. 35, Basic Financial Statements and Management Discussion and Analysis for Public Colleges and Universities. For financial reporting purposes, the College is considered a special-purpose government engaged only in Business Type Activities (BTA). In accordance with BTA reporting, the College presents a Management’s Discussion and Analysis; a Statement of Net Position; a Statement of Revenues, Expenses and Changes in Net Position; a Statement of Cash Flows; and Notes to the Financial Statements. The format provides a comprehensive, entity-wide perspective of the College’s assets, deferred outflows, liabilities, deferred inflows, net position, revenues, expenses, changes in net position and cash flows.

29 | P a g e
Basis of Accounting The financial statements of the College have been prepared using the economic resources measurement focus and the accrual basis of accounting. Under the accrual basis, revenues are recognized when earned and expenses are recorded when an obligation has been incurred, regardless of the timing of the cash flows. All significant intra-agency transactions have been eliminated. However, revenues and expenses from the College’s auxiliary enterprises are treated as though the College were dealing with private vendors. Non-exchange transactions, in which the College receives (or gives) value without directly giving (or receiving) equal value in exchange includes state and federal appropriations, and certain grants and donations. Revenues are recognized, net of estimated uncollectible amounts, as soon as all eligibility requirements imposed by the provider have been met. The preparation of financial statements in conformity with accounting principles generally accepted in the United States of America requires management to make estimates and assumptions that affect the reported amounts of assets and liabilities and disclosure of contingent assets and liabilities at the date of the financial statements and the reported amounts of revenue and expenses during the reporting period. Actual results could differ from those estimates. Cash and Cash Equivalents Cash and cash equivalents include cash on hand and bank demand deposits. Cash equivalents are defined as highly liquid investments with an original maturity of 90 days or less. Funds invested through the Washington State Treasurer’s Local Government Investment Pool (LGIP) are reported as cash equivalents. Cash and cash equivalents that are held with the intent to fund College operations are classified as current assets along with operating funds invested in the LGIP. The College records all cash, cash equivalents, and investments at amortized cost. Accounts Receivable Accounts receivable consists of tuition and fee charges to students and auxiliary enterprise services provided to students, faculty and staff. This also includes amounts due from federal, state and local governments or private sources as allowed under the terms of grants and contracts. Accounts receivable are shown net of estimated uncollectible amounts. Inventories Inventories, consisting primarily of merchandise for resale in the College bookstore and course-related supplies, are valued at cost using the first in, first out (FIFO) method. Capital Assets In accordance with state law, capital assets constructed with state funds are owned by the State of Washington. Property titles are shown accordingly. However, responsibility for managing the assets rests with the College. As a result, the assets are included in the financial statements because excluding them would be misleading. Land, buildings and equipment are recorded at cost, or if acquired by gift, at acquisition value at the date of the gift. GASB 34 guidance concerning preparing initial estimates for historical cost and accumulated depreciation related to infrastructure was followed. Capital additions, replacements and major renovations are capitalized. The value of assets constructed includes all material direct and indirect construction costs. Any interest costs incurred are capitalized during the period of construction. Routine repairs and maintenance are charged to operating expense in the year in which the expense was incurred. In accordance with the state capitalization policy, all land, intangible assets
30 | P a g e
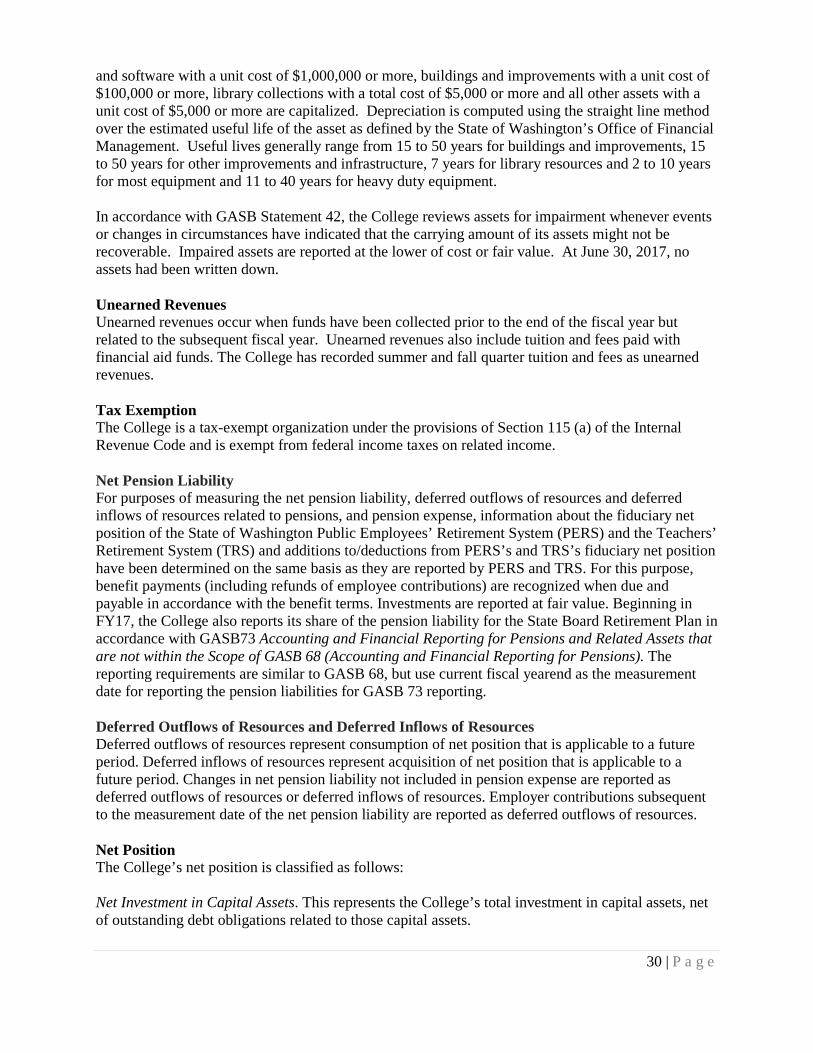
and software with a unit cost of $1,000,000 or more, buildings and improvements with a unit cost of $100,000 or more, library collections with a total cost of $5,000 or more and all other assets with a unit cost of $5,000 or more are capitalized. Depreciation is computed using the straight line method over the estimated useful life of the asset as defined by the State of Washington’s Office of Financial Management. Useful lives generally range from 15 to 50 years for buildings and improvements, 15 to 50 years for other improvements and infrastructure, 7 years for library resources and 2 to 10 years for most equipment and 11 to 40 years for heavy duty equipment. In accordance with GASB Statement 42, the College reviews assets for impairment whenever events or changes in circumstances have indicated that the carrying amount of its assets might not be recoverable. Impaired assets are reported at the lower of cost or fair value. At June 30, 2017, no assets had been written down. Unearned Revenues Unearned revenues occur when funds have been collected prior to the end of the fiscal year but related to the subsequent fiscal year. Unearned revenues also include tuition and fees paid with financial aid funds. The College has recorded summer and fall quarter tuition and fees as unearned revenues. Tax Exemption The College is a tax-exempt organization under the provisions of Section 115 (a) of the Internal Revenue Code and is exempt from federal income taxes on related income. Net Pension Liability For purposes of measuring the net pension liability, deferred outflows of resources and deferred inflows of resources related to pensions, and pension expense, information about the fiduciary net position of the State of Washington Public Employees’ Retirement System (PERS) and the Teachers’ Retirement System (TRS) and additions to/deductions from PERS’s and TRS’s fiduciary net position have been determined on the same basis as they are reported by PERS and TRS. For this purpose, benefit payments (including refunds of employee contributions) are recognized when due and payable in accordance with the benefit terms. Investments are reported at fair value. Beginning in FY17, the College also reports its share of the pension liability for the State Board Retirement Plan in accordance with GASB73 Accounting and Financial Reporting for Pensions and Related Assets that are not within the Scope of GASB 68 (Accounting and Financial Reporting for Pensions). The reporting requirements are similar to GASB 68, but use current fiscal yearend as the measurement date for reporting the pension liabilities for GASB 73 reporting. Deferred Outflows of Resources and Deferred Inflows of Resources Deferred outflows of resources represent consumption of net position that is applicable to a future period. Deferred inflows of resources represent acquisition of net position that is applicable to a future period. Changes in net pension liability not included in pension expense are reported as deferred outflows of resources or deferred inflows of resources. Employer contributions subsequent to the measurement date of the net pension liability are reported as deferred outflows of resources. Net Position The College’s net position is classified as follows: Net Investment in Capital Assets. This represents the College’s total investment in capital assets, net of outstanding debt obligations related to those capital assets.

31 | P a g e
Restricted for Nonexpendable. This consists of endowment and similar type funds for which donors or other outside sources have stipulated as a condition of the gift instrument that the principal is to be maintained inviolate and in perpetuity and invested for the purpose of producing present and future income which may either be expended or added to the principal. Restricted for Loans. The loan funds are established for the explicit purpose of providing student support as prescribed by statute or granting authority. Restricted for Expendable. These include resources the College is legally or contractually obligated to spend in accordance with restrictions imposed by third parties. The expendable balance for the College is funds held for student loans and institutional financial aid funds per RCW 28B.15.820. Unrestricted. These represent resources derived from student tuition and fees, and sales and services of educational departments and auxiliary enterprises. Classification of Revenues and Expenses The College has classified its revenues and expenses as either operating or non-operating according to the following criteria: Operating Revenues. This includes activities that have the characteristics of exchange transactions such as (1) student tuition and fees, net of waivers and scholarship discounts and allowances, (2) sales and services of auxiliary enterprises and (3) most federal, state and local grants and contracts which includes Running Start revenue and various grants for funding student tuition and operations. Operating Expenses. Operating expenses include salaries, wages, fringe benefits, utilities, supplies and materials, purchased services, and depreciation. Non-operating Revenues. This includes activities that have the characteristics of non-exchange transactions, such as gifts and contributions, Federal Pell grant revenue, state appropriations and investment income. Non-operating Expenses. Non-operating expenses include state remittance related to the building fee and the innovation fee, and loss of disposal. Scholarship Discounts and Allowances Student tuition and fee revenues, and certain other revenues from students, are reported net of scholarship discounts and allowances in the Statements of Revenues, Expenses and Changes in Net Position. Scholarship discounts and allowances are the difference between the stated charge for goods and services provided by the College, and the amount that is paid by students and/or third parties making payments on the students’ behalf. Certain governmental grants, such as Pell grants, and other federal, state or non-governmental programs are recorded as either operating or non-operating revenues in the College’s financial statements. To the extent that revenues from such programs are used to satisfy tuition and fees and other student charges, the College has recorded a scholarship discount and allowance. Discounts and allowances for the year ending June 30, 2017 are $8,076,227. State Appropriations The State of Washington appropriates funds to the College on both an annual and biennial basis. These revenues are reported as non-operating revenues on the Statements of Revenues, Expenses, and Changes in Net Position, and recognized as such when the related expenses are incurred.

32 | P a g e
Building and Innovation Fee Remittance Tuition collected includes amounts remitted to the Washington State Treasurer’s office to be held and appropriated in future years. The Building Fee portion of tuition charged to students is an amount established by the Legislature and is subject to change annually. The fee provides funding for capital construction and projects on a system wide basis using a competitive biennial allocation process. The Building Fee is remitted on the 35th day of each quarter. The Innovation Fee was established in order to fund the State Board of Community and Technical College’s Strategic Technology Plan. The use of the fund is to implement new ERP software across the entire system. On a monthly basis, the College’s remits the portion of tuition collected for the Innovation Fee to the State Treasurer for allocation to SBCTC. These remittances are non-exchange transactions reported as an expense in the non-operating revenues and expenses section of the statement of revenues, expenses and changes in net position. 2. Accounting and Reporting Changes In June 2015, the GASB issued Statement No. 73, Accounting and Financial Reporting for Pensions and Related Assets That Are Not within the Scope of GASB Statement 68, and Amendments to Certain Provisions of GASB Statements 67 and 68. This Statement is intended to improve financial reporting of governments whose employees are provided with pensions that are not within the scope of Statement No. 68, improve the usefulness of information associated with governments that hold assets accumulated for purposes of providing defined benefit pensions not within the scope of Statement No. 68, and to clarify the application of certain provisions of Statements No. 67 and 68. In addition, it establishes requirements for defined contribution plans that are not within the scope of Statement 68. GASB 73 is effective for fiscal years beginning after June 15, 2016. The College has implemented this pronouncement during the 2017 fiscal year. The College recorded a beginning balance adjustment to long-term obligations of $5,178,227 as a result of the implementation of GASB Statement No. 73. In March 2016, the GASB issued Statement No. 82, Pension Issues-an Amendment of GASB Statements No. 67, No. 68, and No.73. This Statement essentially addresses issues regarding the presentation of payroll-related measures in the required supplementary information. The College has implemented this standard in relation to the RSI presented with its financial statements. Accounting Standard Impacting the Future In June 2015, the GASB issued Statement No. 75, Accounting and Financial Reporting for Postemployment Benefits Other Than Pensions (OPEB), which will be in effect for the fiscal year ending June 30, 2018. This Statement establishes standards of accounting and financial reporting for defined benefit OPEB and defined contribution OPEB that are provided to the employees of state and local governmental employer through plans that are administered through trusts or equivalent arrangements. This Statement also establishes standards of accounting and financial reporting for OPEB plans that are not administered through trusts or equivalent arrangements. The College’s participation in OPEB is described in Note 19, and does not currently impact the College’s financial statements. As a result of implementing this Statement, the College will be required to recognize its proportionate share of the state’s actuarially determine OPEB liability, net of any assets segregated and restricted in a qualified trust, together with any associated deferred inflows and deferred outflows of resources, benefit expense related to the plan, and to restate net position for all periods presented. This Statement will have a significant impact on the College’s financial statements.

33 | P a g e
3. Cash and Cash Equivalents Cash and cash equivalents include bank demand deposits, petty cash held at the College and unit shares in the Washington State Treasurer’s Local Government Investment Pool (LGIP). The LGIP is comparable to a Rule 2a-7 money market fund recognized by the Securities and Exchange Commission (17 CFR 270.2a-7). Rule 2a-7 funds are limited to high quality obligations with limited maximum and average maturities, the effect of which is to minimize both the market and credit risk. The LGIP is an unrated investment pool. The LGIP portfolio is invested in a manner that meets the requirements set forth by the Governmental Accounting Standards Board for the maturity, quality, diversification and liquidity for external investment pools that wish to measure all of its investments at amortized costs. The LGIP transacts with its participants at a stable net asset value per share of one dollar, which results in the amortized cost reported equaling the number of shares in the LGIP. The LGIP measures its investments at amortized cost in accordance with guidance set forth by GASB, as amended by Statements No. 72 and No. 79, and the investments are limited to high quality obligations with limited and average maturities, which minimizes both credit and market risk. The LGIP has a minimum transaction size, deposit or withdrawal, of $5,000, and while there is not currently a maximum transaction size, the LGIP does request pool participants to provide them with a least a one-day notice for deposits or withdrawals of $10 million or more. The LGIP participants are limited to one transaction per day. The LGIP does not impose liquidity fees or redemption gates on participant withdrawals. The College adjusts its LGIP investment amounts monthly to reflect interest earnings as reported from the Office of the State Treasurer. The Office of the State Treasurer prepares a stand-alone LGIP financial report. A copy of the report is available from the OST, PO Box 40200, Olympia, Washington 98504-0200, or online at: http://www.tre.wa.gov/partners/for-local-governments/local-government-investment-pool-lgip/2017-lgip-comprehensive-annual-financial-report/. In addition, more information is available regarding the LGIP in the Washington State Consolidated Annual Financial report, which can be found online at http://www.ofm.wa.gov/cafr/. As of June 30, 2017, the carrying amount of the College’s cash and cash equivalents was $16,344,164. Restricted cash for COP proceeds invested at LGIP were $6,405,529. The remaining restricted cash included in total cash consists of amounts restricted for loans and institutional financial aid funds per RCW 28B.15.820, and amounts held for retainage. The classification is represented in the table below.
Cash and Cash Equivalents 2017Local Government Investment Pool 14,712,918$ Bank Demand 517,645 Restricted Cash - Held for Financial Aid 956,740 Restricted Cash - Held for Retainage 141,861 Petty Cash and Change Funds 15,000 Total Cash and Cash Equivalents 16,344,164
Local Government Investment Pool-Restricted COP Proceeds 6,405,529$

34 | P a g e
Custodial Credit Risks—Deposits Custodial credit risk for bank demand deposits is the risk that in the event of a bank failure, the College’s deposits may not be returned to it. All of the College’s demand deposits are with the Bank of America. All cash and equivalents, except for change funds and petty cash held by the College, are insured by the Federal Deposit Insurance Corporation (FDIC) or by collateral held by the Washington Public Deposit Protection Commission (PDPC). Interest Rate Risk—Investments While the College does not currently have any investments other than the LGIP, when investing historically, the College manages its exposure to interest rate changes by limiting the duration of investments to mature at various points in the year. The College administrative policy 450.033 identifies investment parameters as ranging from overnight and up to one year in duration, depending on the stability of the cash balance and the annual cycle of cash liquidity needs. Concentration of Credit Risk—Investments State law limits College operating investments to the highest quality sectors of the domestic fixed income market and specifically excludes corporate stocks, corporate and foreign bonds, futures contracts, commodities, real estate, limited partnerships and negotiable certificates of deposit. College policy does not limit the amount the College may invest in any one issuer. Custodial Credit Risk—Investments Custodial credit risk for investments is the risk that in the event of the failure of the counterparty to a transaction, the College will not be able to recover the value of investment or collateral securities that are in the possession of an outside party. At June 30, 2017, the college did not have any investments other than the LGIP. Investment Expenses Investment income for the College is shown net of investment expenses. The investment expenses incurred for the fiscal year ended June 30, 2017 were $1,187. 4. Accounts Receivable Accounts receivable consists of tuition and fee charges to students and auxiliary enterprise services provided to students, faculty and staff. It also includes amounts due from federal, state and local governments or private sources in connection with reimbursements of allowable expenses made according to sponsored agreements. At June 30, 2017, accounts receivable were as follows:

35 | P a g e
Accounts Receivable 2017Due from State Appropriation 3,731,001$ Student Tuition and Fees 1,445,920Due from Other State Agencies 784,963Due from Federal Government 78,847Auxiliary Enterprises 48,405Other 179,684Subtotal 6,268,820$ Less Allowance for Uncollectible Accounts (866,630)Accounts Receivable, net 5,402,190$
5. Loans Receivable Loans receivable as of June 30, 2017 consisted primarily of student loans, as follows.
Loans Receivable 2017Student Loans Receivable 18,155$ Less Allowance for Uncollectible Accounts (3,631)$ Loans Receivable, net 14,524$
6. Inventories Merchandise inventories, stated at cost using the FIFO method, totaled $817,867 as of June 30, 2017.
7. Capital Assets A summary of the changes in capital assets for the year ended June 30, 2017 is presented as follows. The current year depreciation expense was $4,063,546.

36 | P a g e
Capital AssetsBalance at
June 30, 2016Additions/ Transfers
Retirements Balance at
June 30, 2017
Nondepreciable capital assets
Land 10,904,347$ 117,082$ -$ 11,021,429$
Construction in progress 32,618,594 (27,552,734) - 5,065,860
Subtotal 43,522,941 (27,435,652) - 16,087,289
Depreciable capital assets
Buildings 126,808,299 34,003,854 - 160,812,153
Improvements and infrastructure 6,972,558 288,366 - 7,260,924
Equipment 8,963,019 540,976 (240,750) 9,263,245
Library resources 3,853,845 66,859 - 3,920,704
Subtotal 146,597,721 34,900,055 (240,750) 181,257,026
Less accumulated depreciation
Buildings 42,908,277 3,211,254 - 46,119,531
Improvements and infrastructure 3,800,146 279,833 - 4,079,979
Equipment 6,579,641 567,508 (232,113) 6,915,036
Library resources 3,676,067 4,951 - 3,681,018
Total accumulated depreciation 56,964,131 4,063,546 (232,113) 60,795,564
Total depreciable capital assets 89,633,590 30,836,509 (8,637) 120,461,462
Capital assets, net of accumulated depreciation
133,156,531$ 3,400,857$ (8,637)$ 136,548,751$
8. Deferred Outflows and Deferred Inflows of Resources In addition to assets, the Statement of Net Position will sometimes report a separate section for deferred outflows of resources. This separate financial statement element represents a consumption of equity that applies to a future reporting period(s) and so will not be recognized as an outflow of resources (expense) until then. The category of deferred outflow of resources reported in statement of net position relates to pensions. Deferred outflows on pensions are recorded when projected earnings on pension plan investments exceed actual earnings and are amortized to pension expense using a systematic and rational method over a closed five-year period. Deferred outflows on pensions also include the difference between expected and actual experience with regard to economic or demographic factors; changes of assumptions about future economic, demographic, or other input factors; or changes in the state’s proportionate share of net pension liability. These are amortized over the average expected remaining service lives of all employees that are provided with pensions through each pension plan. State contributions to pension plans made subsequent to the measurement date are also deferred and reduce net pension liability in the subsequent year. In addition to liabilities, the Statement of Net Position will sometimes report a separate section for deferred inflows of resources. This separate financial statement element represents an acquisition of equity that applies to a future reporting period(s) and so will not be recognized as an inflow of

37 | P a g e
resources (revenue) until that time. Deferred inflows of resources reported by the College relate to pensions. Deferred inflows on pensions are recorded when actual earnings on pension plan investments exceed projected earnings and are amortized to pension expense using a systematic and rational method over a closed five-year period. Deferred inflows on pensions also include the difference between expected and actual experience with regard to economic or demographic factors; changes of assumptions about future economic, demographic, or other input factors; or changes in the state’s proportionate share of net pension liability. These are amortized over the average expected remaining service lives of all employees that are provided with pensions through each pension plan. 9. Accrued Liabilities At June 30, 2017, accrued liabilities are the following:
Accrued Liabilities 2017Amounts Owed to Employees 1,933,442$ Amounts Held for Others and Retainage 875,369Total Accrued Liabilities 2,808,811$
10. Unearned Revenue Unearned revenue is comprised of receipts which have not yet met revenue recognition criteria, as follows:
Unearned Revenue 2017Summer and Fall Quarter Tuition and Fees 1,683,573$ Other Deposits 9,386Total Unearned Revenue 1,692,959$
11. Risk Management The College is exposed to various risk of loss related to tort liability, injuries to employees, errors and omissions, theft of, damage to, and destruction of assets, and natural disasters. The College purchases insurance to mitigate these risks. Management believes such coverage is sufficient to preclude any significant uninsured losses for the covered risks. The College purchases commercial property insurance through the master property program administered by the Department of Enterprise Services. The policy has a deductible of $250,000 per occurrence and the policy limit is $100,000,000 per occurrence. The College has had no claims in excess of the coverage amount within the past three years. The College currently has elected to have coverage for three buildings, the contents of eight buildings and business interruption for the building that houses our primary data center. The College made these selections by carefully evaluating building age, condition, contents, and use. The College assumes its potential property losses for all other buildings and contents on campus. The College participates in a State of Washington risk management self-insurance program, which covers its exposure to tort, general damage and vehicle claims. Premiums paid to the State are based

38 | P a g e
on actuarially determined projections and include allowances for payments of both outstanding and current liabilities. Coverage is provided up to $10,000,000 for each claim with no deductible. The college has had no claims in excess of the coverage amount within the past three years.
The College, in accordance with state policy, pays unemployment claims on a pay-as-you-go basis. The college finances these costs by assessing all funds a monthly payroll expense for unemployment compensation for all employees. Payments made for claims from July 1, 2016 through June 30, 2017, were $184,608. Cash reserves for unemployment compensation for all employees at June 30, 2017, were $4,579. 12. Compensated Absences At termination of employment, employees may receive cash payments for all accumulated vacation and compensatory time. Employees who retire get 25% of the value of their accumulated sick leave credited to a Voluntary Employees’ Beneficiary Association (VEBA) account, which can be used for future medical expenses and insurance purposes. The amounts of unpaid vacation and compensatory time accumulated by College employees are accrued when incurred. An estimated amount, based on a three-year average payout, is accrued as a current liability. The remaining amount of accrued annual and sick leave is categorized as non-current liabilities. The accrued leave liability is shown below, as of June 30:
Leave Type 2017 2016 ChangeVacation $1,569,124 $1,538,893 $30,231Sick 3,774,341 3,796,565 (22,224)Compensatory - 504 (504)Total $5,343,465 $5,335,962 $7,503
Current Portion 346,579$ 337,239$ 9,340$ Long Term Portion 4,996,886$ 4,998,723$ (1,837)$
13. Leases Payable The College has leases for property and office equipment with various vendors. These leases are classified as operating leases. As of June 30, 2017, the minimum lease payments under operating leases consist of the following:
Leases PayableFiscal Year Equipment Leases Property Leases2018 129,482 347,821 2019 129,482 355,758 2020 129,482 355,758 2021 21,580 355,758 2022 - 355,758 2023 - 88,940 Total minimum lease payments 410,026$ 1,859,793$

39 | P a g e
14. Certificates of Participation Payable In August 2016, the College obtained financing for a lighting, plumbing, and HVAC control upgrade through certificates of participation (COP), issued by the Washington Office of State Treasurer (OST) in the amount of $496,205. The lease amount financed was $440,000, as the bond sold for a premium of $66,437, which the College will amortize over the life of the COP. The interest rate charged is 1.8536% and is for a 12-year term. In February 2017, the College obtained financing to renovate the Gaiser Hall Culinary Arts Facility through certificates of participation (COP), issued by the Washington Office of State Treasurer (OST) in the amount of $8,500,000. The lease amount financed was $7,350,000, as the bond sold for a premium of $1,168,215, which the College will amortize over the life of the COP. The interest rate charged is 2.27373% and is for a 10-year term. For FY 2017, interest accrued during construction, less interest earnings and current year amortization, were capitalized in the amount of $74,938. The College’s debt service requirements for these note agreements are as follows in Note 15. 15. Annual Debt Service Requirements Future debt service requirements for certificates of participation at June 30, 2017 are as follows:
Fiscal year Principal Interest Total 2018 510,000$ 507,029$ 1,017,029$ 2019 655,000 360,050 1,015,0502020 690,000 327,300 1,017,3002021 720,000 292,800 1,012,8002022 755,000 256,800 1,011,8002023 795,000 219,050 1,014,0502024 835,000 179,300 1,014,3002025 875,000 137,550 1,012,5502026 920,000 93,800 1,013,8002027 965,000 47,800 1,012,8002028 45,000 900 45,900Total 7,765,000$ 2,422,379$ 10,187,379$
16. Schedule of Long Term Liabilities
Balance outstanding
6/30/16 Additions Reductions
Balance outstanding
6/30/17Current portion
Certificates of Participation $ - 7,790,000$ 25,000$ $ 7,765,000 $ 510,000 Compensated Absences $ 5,335,962 1,864,143$ 1,856,640$ $ 5,343,465 $ 346,579 Net pension obligation $ 17,846,055 5,333,379$ 4,002,242$ $ 19,177,193 Unamortized Premium $ - 1,234,651$ 44,015$ $ 1,190,636 Total 23,182,017$ 16,222,173$ 5,927,897$ 33,476,294$ 856,579$

40 | P a g e
17. Pension Liability Pension liabilities reported as of June 30, 2017 consists of the following:
PERS 1 6,271,680$
PERS 2/3 7,389,897
TRS 1 973,463
TRS 2/3 382,925
SBRP 4,159,228
Total 19,177,193$
Pension Liability by Plan
18. Retirement Plans A. General The College offers three contributory pension plans. The Washington State Public Employees Retirement System (PERS) and Teachers Retirement System (TRS) plans are cost sharing multiple employer defined benefit pension plans administered by the State of Washington Department of Retirement Systems. The State Board Retirement Plan (SBRP) is a defined contribution single employer pension plan with a supplemental payment when required. SBRP is administered by the State Board for Community and Technical Colleges (SBCTC) and available to faculty, exempt administrative and professional staff of the state’s public community and technical colleges. The College reports its proportionate share of the total pension liability as it is a part of the college system. For FY 2017, the payroll for College employees was $14,438,240 for PERS, $1,567,465 for TRS, and $24,531,125 for SBRP. Total covered payroll was $40,536,830. Clark College implemented Government Accounting Standards Board Statement No. 68, Accounting and Financial Reporting for Pensions for the fiscal year 2015 financial reporting. The College’s defined benefit pension plans were created by statutes rather than through trust documents. With the exception of the supplemental defined benefit component of the state board retirement plan, they are administered in a way equivalent to pension trust arrangements as defined by the GASB. In accordance with Statement No. 68, the College has elected to use the prior fiscal year end as the measurement date for reporting net pension liabilities to align with the State CAFR. Basis of Accounting Pension plans administered by the state are accounted for using the accrual basis of accounting. Under the accrual basis of accounting, employee and employer contributions are recognized in the period in which employee services are performed; investment gains and losses are recognized as incurred; and benefits and refunds are recognized when due and payable in accordance with the terms of the applicable plan. For purposes of measuring the net pension liability, deferred outflows of resources and deferred inflows of resources related to pensions, and pension expense, information about the fiduciary net position of all plans and additions to/deductions from all plan fiduciary net
41 | P a g e
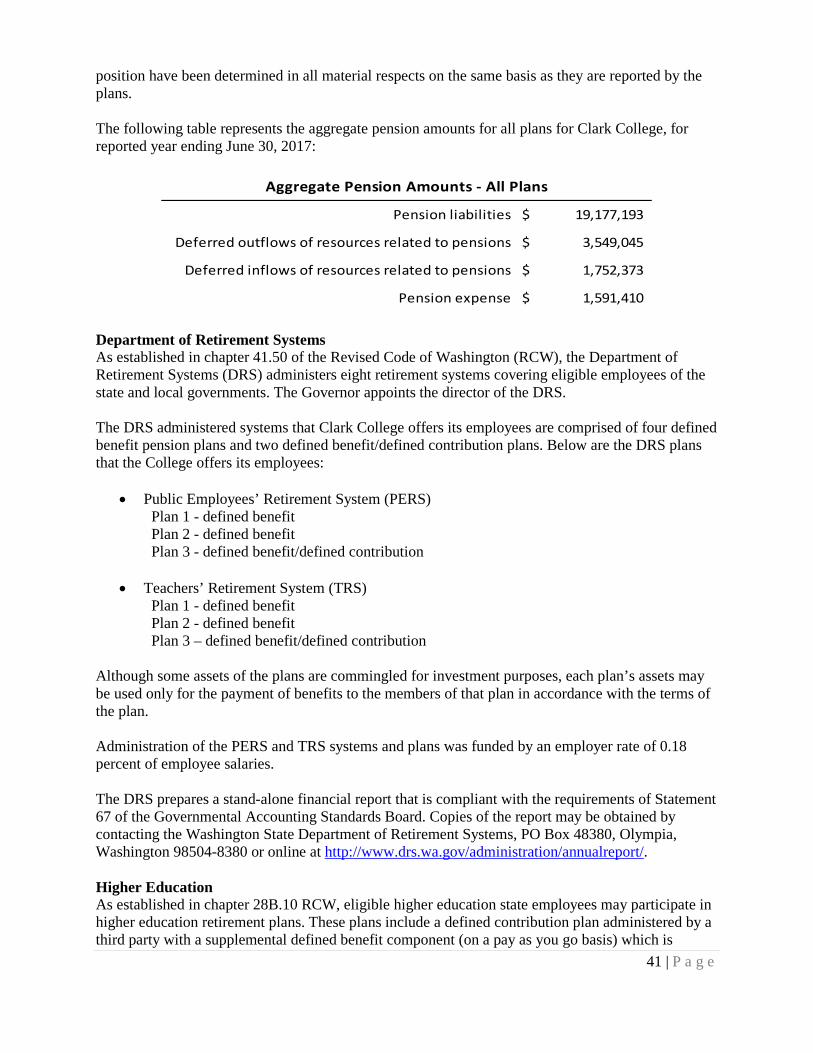
position have been determined in all material respects on the same basis as they are reported by the plans. The following table represents the aggregate pension amounts for all plans for Clark College, for reported year ending June 30, 2017:
Pension liabilities 19,177,193$
Deferred outflows of resources related to pensions 3,549,045$
Deferred inflows of resources related to pensions 1,752,373$
Pension expense 1,591,410$
Aggregate Pension Amounts - All Plans
Department of Retirement Systems As established in chapter 41.50 of the Revised Code of Washington (RCW), the Department of Retirement Systems (DRS) administers eight retirement systems covering eligible employees of the state and local governments. The Governor appoints the director of the DRS. The DRS administered systems that Clark College offers its employees are comprised of four defined benefit pension plans and two defined benefit/defined contribution plans. Below are the DRS plans that the College offers its employees:
• Public Employees’ Retirement System (PERS) Plan 1 - defined benefit Plan 2 - defined benefit Plan 3 - defined benefit/defined contribution
• Teachers’ Retirement System (TRS) Plan 1 - defined benefit Plan 2 - defined benefit Plan 3 – defined benefit/defined contribution
Although some assets of the plans are commingled for investment purposes, each plan’s assets may be used only for the payment of benefits to the members of that plan in accordance with the terms of the plan. Administration of the PERS and TRS systems and plans was funded by an employer rate of 0.18 percent of employee salaries. The DRS prepares a stand-alone financial report that is compliant with the requirements of Statement 67 of the Governmental Accounting Standards Board. Copies of the report may be obtained by contacting the Washington State Department of Retirement Systems, PO Box 48380, Olympia, Washington 98504-8380 or online at http://www.drs.wa.gov/administration/annualreport/. Higher Education As established in chapter 28B.10 RCW, eligible higher education state employees may participate in higher education retirement plans. These plans include a defined contribution plan administered by a third party with a supplemental defined benefit component (on a pay as you go basis) which is

42 | P a g e
administered by the state. The College implemented Statement No. 73 of the Governmental Accounting Standards Board (GASB) Accounting and Financial Reporting for Pensions and Related Assets That Are Not within the Scope of GASB Statement 68, and Amendments to Certain Provisions of GASB Statements 67 and 68 for the fiscal year 2017 financial reporting. The College has elected to use the current fiscal year end as the measurement date for reporting net pension liabilities for the State Board Supplemental Retirement Plan in alignment with the State CAFR. B. College Participation in Plans Administered by the Department of Retirement Systems PERS Plan Description. The Legislature established the PERS Plan in 1947. PERS Plan 1 provides retirement and disability benefits and minimum benefit increases to eligible nonacademic plan members hired prior to October 1, 1977. Entrance to PERS Plan 1 is closed to new employees. PERS Plans 2 and 3 provide retirement and disability benefits and a cost-of-living adjustment to eligible nonacademic plan members hired on or after October 1, 1977. Retirement benefits are vested after five years of eligible service. PERS Plan 3 has a defined contribution component that members may elect to self-direct as established by the Employee Retirement Benefits Board. PERS 3 defined benefit plan benefits are vested after an employee completes ten years of eligible service.
PERS participants joining the system on or after March 1, 2002, for state and higher education employees, or September 1, 2002, for local government employees, have the irrevocable option of choosing membership in either PERS Plan 2 or PERS Plan 3. The option must be exercised within 90 days of employment. Employees who fail to choose within 90 days default to PERS Plan 3.
Benefits Provided. PERS Plan 1 members are vested after the completion of five years of eligible service. Plan 1 members are eligible for retirement after 30 years of service, or at the age of 60 with five years of service, or at the age of 55 with 25 years of service. The monthly benefit is 2 percent of the average final compensation (AFC) per year of service capped at 60 percent. The AFC is the average of the member’s 24 highest consecutive service months.
PERS Plan 1 members retiring from inactive status prior to the age of 65 may receive actuarially reduced benefits. Plan 1 members may elect to receive an optional cost of living allowance (COLA) that provides an automatic annual adjustment based on the Consumer Price Index. The adjustment is capped at 3 percent annually. To offset the cost of this annual adjustment, the benefit is reduced.
A member with five years of covered employment is eligible for non-duty disability retirement. Prior to the age of 55, the benefit amount is 2 percent of the AFC for each year of service. This is reduced by 2 percent for each year that the member’s age is less than 55. The total benefit is limited to 60 percent of the AFC. Plan 1 members may elect to receive an optional COLA amount based on the Consumer Price Index, capped at 3 percent annually. To offset the cost of this annual adjustment, the benefit is reduced.
PERS Plan 2 members are vested after completing five years of eligible service. Plan 2 members are eligible for normal retirement at the age of 65 with five years of service. The monthly benefit is 2 percent of the AFC per year of service. There is no cap on years of service credit and a COLA is granted based on the Consumer Price Index, capped at 3 percent annually. The AFC is the average of the member’s 60 highest paid consecutive months. PERS Plan 2 members have the option to retire early with reduced benefits.

43 | P a g e
The defined benefit portion of PERS Plan 3 provides members a monthly benefit that is 1 percent of the AFC per year of service. There is no cap on years of service credit. Plan 3 provides the same COLA as Plan 2. The AFC is the average of the member’s 60 highest paid consecutive months.
Effective June 7, 2006, PERS Plan 3 members are vested in the defined benefit portion of their plan after 10 years of service; or after five years of service, if 12 months of that service are earned after age 44; or after five service credit years earned in PERS Plan 2 by June 1, 2003. Plan 3 members are immediately vested in the defined contribution portion of their plan.
PERS Plan 3 members have the option to retire early with reduced benefits. PERS members meeting specific eligibility requirements have options available to enhance their retirement benefits. Some of these options are available to their survivors, with reduced benefits. TRS Plan Description. The Legislature established the TRS Plan in 1938. TRS Plans 1 and 2 are defined benefit plans. TRS Plan 1 was closed to new entrants on September 30, 1977. Employees currently have a choice of entering TRS Plan 2 or 3. TRS Plan 2 and 3 provide retirement benefits to certain eligible faculty hired on or after October 1, 1977. TRS Plan 3 includes both a defined benefit portion and a defined contribution portion. The defined benefit portion is funded by employer contributions only. Benefits are vested after an employee completes five or ten years of eligible service, depending on the employee’s age and service credit, and include an annual cost-of living adjustment. The defined contribution component is fully funded by employee contributions and investment performance. Although members can only be a member of either Plan 2 or Plan 3, the defined benefit portions of Plan 2 and Plan 3 are accounted for in the same pension trust fund. All assets of this Plan 2/3 defined benefit plan may legally be used to pay the defined benefits of any of the Plan 2 or Plan 3 members or beneficiaries, as defined by the terms of the plan. Therefore, Plan 2/3 is considered a single defined benefit plan for reporting purposes. Plan 3 accounts for the defined contribution portion of benefits for Plan 3 members. Legislation passed in 2007 gives TRS members hired on or after July 1, 2007, 90 days to make an irrevocable choice to become a member of TRS Plan 2 or Plan 3. At the end of 90 days, any member who has not made a choice becomes a member of Plan 3.
Benefits Provided. TRS plans provide retirement, disability, and death benefits to eligible members.
TRS Plan 1 members are vested after the completion of five years of eligible service. Plan 1 members are eligible for retirement at any age after 30 years of service, or at the age of 60 with five years of service, or at the age of 55 with 25 years of service. The monthly benefit is 2 percent of the average final compensation (AFC) for each year of service credit, up to a maximum of 60 percent. The AFC is the total earnable compensation for the two consecutive highest-paid fiscal years, divided by two.
TRS Plan 1 members may elect to receive an optional cost of living allowance (COLA) amount based on the Consumer Price Index, capped at 3 percent annually. To offset the cost of this annual adjustment, the benefit is reduced.
TRS Plan 2 retirement benefits are vested after completing five years of eligible service. Plan 2 members are eligible for normal retirement at the age of 65 with five years of service. The monthly benefit is 2 percent of the AFC per year of service. A COLA is granted based on the Consumer Price
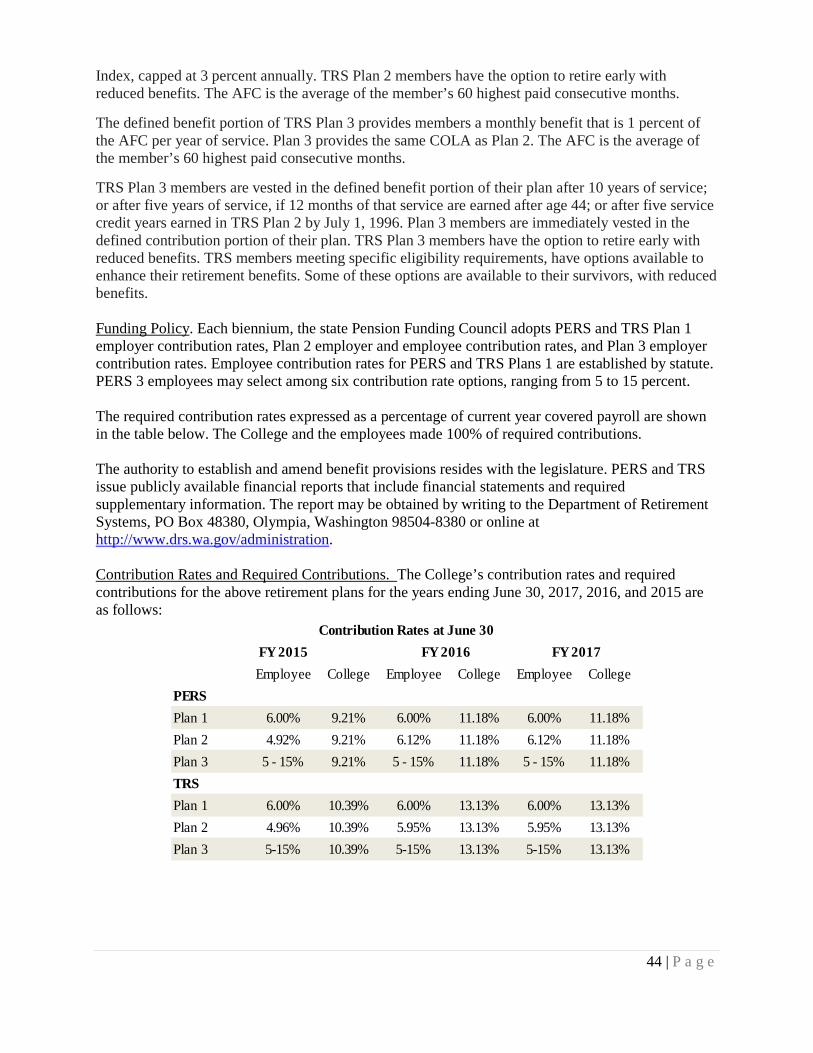
44 | P a g e
Index, capped at 3 percent annually. TRS Plan 2 members have the option to retire early with reduced benefits. The AFC is the average of the member’s 60 highest paid consecutive months.
The defined benefit portion of TRS Plan 3 provides members a monthly benefit that is 1 percent of the AFC per year of service. Plan 3 provides the same COLA as Plan 2. The AFC is the average of the member’s 60 highest paid consecutive months.
TRS Plan 3 members are vested in the defined benefit portion of their plan after 10 years of service; or after five years of service, if 12 months of that service are earned after age 44; or after five service credit years earned in TRS Plan 2 by July 1, 1996. Plan 3 members are immediately vested in the defined contribution portion of their plan. TRS Plan 3 members have the option to retire early with reduced benefits. TRS members meeting specific eligibility requirements, have options available to enhance their retirement benefits. Some of these options are available to their survivors, with reduced benefits. Funding Policy. Each biennium, the state Pension Funding Council adopts PERS and TRS Plan 1 employer contribution rates, Plan 2 employer and employee contribution rates, and Plan 3 employer contribution rates. Employee contribution rates for PERS and TRS Plans 1 are established by statute. PERS 3 employees may select among six contribution rate options, ranging from 5 to 15 percent. The required contribution rates expressed as a percentage of current year covered payroll are shown in the table below. The College and the employees made 100% of required contributions. The authority to establish and amend benefit provisions resides with the legislature. PERS and TRS issue publicly available financial reports that include financial statements and required supplementary information. The report may be obtained by writing to the Department of Retirement Systems, PO Box 48380, Olympia, Washington 98504-8380 or online at http://www.drs.wa.gov/administration. Contribution Rates and Required Contributions. The College’s contribution rates and required contributions for the above retirement plans for the years ending June 30, 2017, 2016, and 2015 are as follows:
FY 2015Employee College Employee College Employee College
PERSPlan 1 6.00% 9.21% 6.00% 11.18% 6.00% 11.18%Plan 2 4.92% 9.21% 6.12% 11.18% 6.12% 11.18%Plan 3 5 - 15% 9.21% 5 - 15% 11.18% 5 - 15% 11.18%TRSPlan 1 6.00% 10.39% 6.00% 13.13% 6.00% 13.13%Plan 2 4.96% 10.39% 5.95% 13.13% 5.95% 13.13%Plan 3 5-15% 10.39% 5-15% 13.13% 5-15% 13.13%
FY 2016 FY 2017Contribution Rates at June 30

45 | P a g e
FY 2015Employee College Employee College Employee College
PERSPlan 1 $8,615 $13,223 $6,887 $12,833 $6,159 $11,475 Plan 2 $451,770 $845,854 $587,476 $1,073,086 $610,997 $1,116,377 Plan 3 $273,580 $381,792 $280,619 $472,984 $290,420 $485,428 TRSPlan 1 $2,162 $3,744 $1,692 $3,613 $0 $0 Plan 2 $6,069 $12,713 $8,210 $18,025 $8,667 $19,126 Plan 3 $81,989 $115,656 $93,491 $163,032 $112,198 $187,243
Required/Actual ContributionsFY 2016 FY 2017
Investments The Washington State Investment Board (WSIB) has been authorized by statute as having investment management responsibility for the pension funds. The WSIB manages retirement fund assets to maximize return at a prudent level of risk. Retirement funds are invested in the Commingled Trust Fund (CTF). Established on July 1, 1992, the CTF is a diversified pool of investments that invests in fixed income, public equity, private equity, real estate, and tangible assets. Investment decisions are made within the framework of a Strategic Asset Allocation Policy and a series of written WSIB adopted investment policies for the various asset classes in which the WSIB invests. For the year ended June 30, 2016, the annual money-weighted rate of return on the pension investments, net of pension plan expenses are as follows:
Pension Plan Rate of ReturnPERS Plan 1 2.19%PERS Plan 2/3 2.47%TRS Plan 1 2.09%TRS Plan 2/3 2.51%
These money-weighted rates of return express investment performance, net of pension plan investment expense, and reflects both the size and timing of cash flows. The PERS and TRS target asset allocation and long-term expected real rate of return as of June 30, 2016, are summarized in the following table:
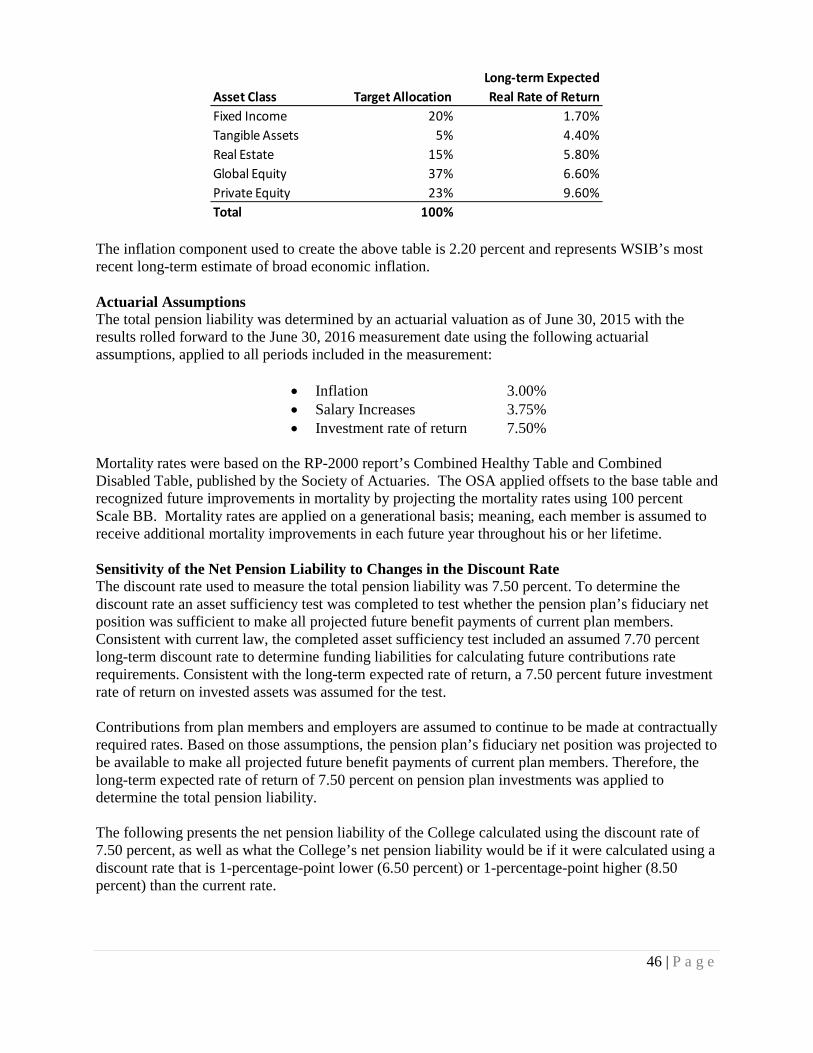
46 | P a g e
Asset Class Target AllocationLong-term Expected Real Rate of Return
Fixed Income 20% 1.70%Tangible Assets 5% 4.40%Real Estate 15% 5.80%Global Equity 37% 6.60%Private Equity 23% 9.60%Total 100%
The inflation component used to create the above table is 2.20 percent and represents WSIB’s most recent long-term estimate of broad economic inflation. Actuarial Assumptions The total pension liability was determined by an actuarial valuation as of June 30, 2015 with the results rolled forward to the June 30, 2016 measurement date using the following actuarial assumptions, applied to all periods included in the measurement:
• Inflation 3.00% • Salary Increases 3.75% • Investment rate of return 7.50%
Mortality rates were based on the RP-2000 report’s Combined Healthy Table and Combined Disabled Table, published by the Society of Actuaries. The OSA applied offsets to the base table and recognized future improvements in mortality by projecting the mortality rates using 100 percent Scale BB. Mortality rates are applied on a generational basis; meaning, each member is assumed to receive additional mortality improvements in each future year throughout his or her lifetime. Sensitivity of the Net Pension Liability to Changes in the Discount Rate The discount rate used to measure the total pension liability was 7.50 percent. To determine the discount rate an asset sufficiency test was completed to test whether the pension plan’s fiduciary net position was sufficient to make all projected future benefit payments of current plan members. Consistent with current law, the completed asset sufficiency test included an assumed 7.70 percent long-term discount rate to determine funding liabilities for calculating future contributions rate requirements. Consistent with the long-term expected rate of return, a 7.50 percent future investment rate of return on invested assets was assumed for the test. Contributions from plan members and employers are assumed to continue to be made at contractually required rates. Based on those assumptions, the pension plan’s fiduciary net position was projected to be available to make all projected future benefit payments of current plan members. Therefore, the long-term expected rate of return of 7.50 percent on pension plan investments was applied to determine the total pension liability. The following presents the net pension liability of the College calculated using the discount rate of 7.50 percent, as well as what the College’s net pension liability would be if it were calculated using a discount rate that is 1-percentage-point lower (6.50 percent) or 1-percentage-point higher (8.50 percent) than the current rate.
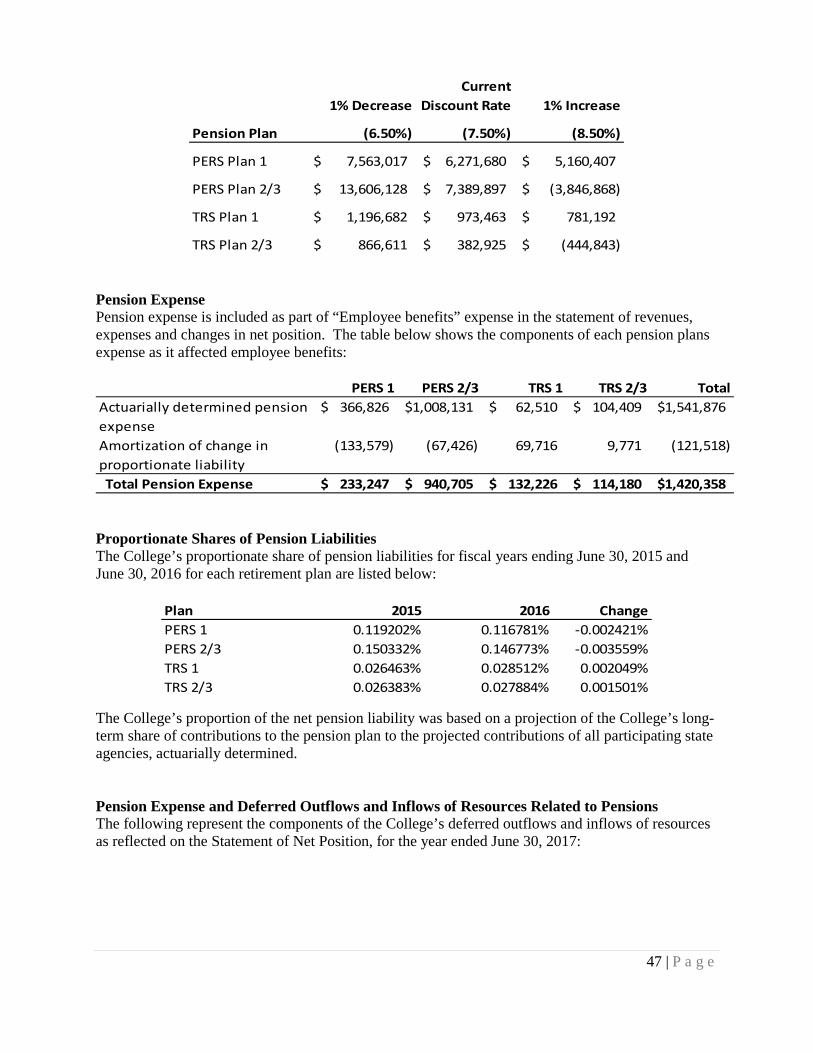
47 | P a g e
1% DecreaseCurrent
Discount Rate 1% Increase
Pension Plan (6.50%) (7.50%) (8.50%)
PERS Plan 1 7,563,017$ 6,271,680$ 5,160,407$
PERS Plan 2/3 13,606,128$ 7,389,897$ (3,846,868)$
TRS Plan 1 1,196,682$ 973,463$ 781,192$
TRS Plan 2/3 866,611$ 382,925$ (444,843)$ Pension Expense Pension expense is included as part of “Employee benefits” expense in the statement of revenues, expenses and changes in net position. The table below shows the components of each pension plans expense as it affected employee benefits:
PERS 1 PERS 2/3 TRS 1 TRS 2/3 TotalActuarially determined pension expense
366,826$ 1,008,131$ 62,510$ 104,409$ 1,541,876$
Amortization of change in proportionate liability
(133,579) (67,426) 69,716 9,771 (121,518)
Total Pension Expense 233,247$ 940,705$ 132,226$ 114,180$ 1,420,358$
Proportionate Shares of Pension Liabilities The College’s proportionate share of pension liabilities for fiscal years ending June 30, 2015 and June 30, 2016 for each retirement plan are listed below:
Plan 2015 2016 ChangePERS 1 0.119202% 0.116781% -0.002421%PERS 2/3 0.150332% 0.146773% -0.003559%TRS 1 0.026463% 0.028512% 0.002049%TRS 2/3 0.026383% 0.027884% 0.001501%
The College’s proportion of the net pension liability was based on a projection of the College’s long-term share of contributions to the pension plan to the projected contributions of all participating state agencies, actuarially determined. Pension Expense and Deferred Outflows and Inflows of Resources Related to Pensions The following represent the components of the College’s deferred outflows and inflows of resources as reflected on the Statement of Net Position, for the year ended June 30, 2017:
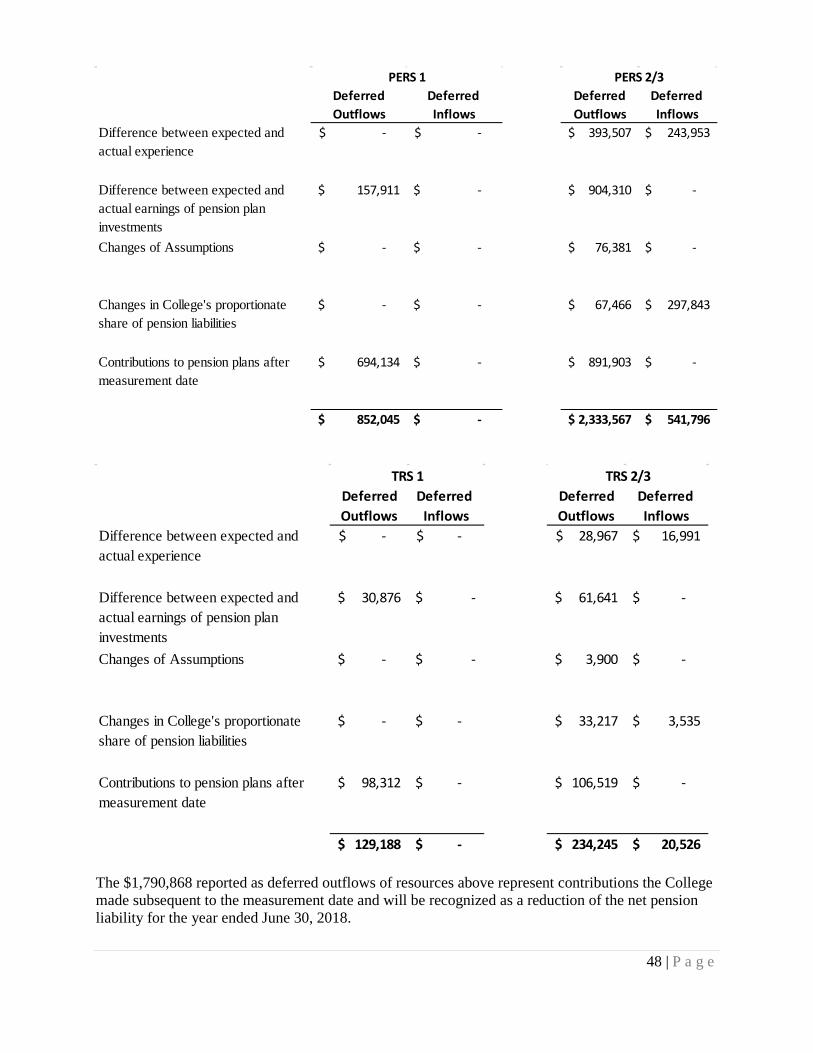
48 | P a g e
The $1,790,868 reported as deferred outflows of resources above represent contributions the College made subsequent to the measurement date and will be recognized as a reduction of the net pension liability for the year ended June 30, 2018.
Deferred Deferred Deferred Deferred Outflows Inflows Outflows Inflows
Difference between expected and actual experience
-$ -$ 393,507$ 243,953$
Difference between expected and actual earnings of pension plan investments
157,911$ -$ 904,310$ -$
Changes of Assumptions -$ -$ 76,381$ -$
Changes in College's proportionate share of pension liabilities
-$ -$ 67,466$ 297,843$
Contributions to pension plans after measurement date
694,134$ -$ 891,903$ -$
852,045$ -$ 2,333,567$ 541,796$
PERS 1 PERS 2/3
Deferred Deferred Deferred Deferred Outflows Inflows Outflows Inflows
Difference between expected and actual experience
-$ -$ 28,967$ 16,991$
Difference between expected and actual earnings of pension plan investments
30,876$ -$ 61,641$ -$
Changes of Assumptions -$ -$ 3,900$ -$
Changes in College's proportionate share of pension liabilities
-$ -$ 33,217$ 3,535$
Contributions to pension plans after measurement date
98,312$ -$ 106,519$ -$
129,188$ -$ 234,245$ 20,526$
TRS 1 TRS 2/3

49 | P a g e
Other amounts reported as deferred outflows and inflows of resources will be recognized in pension expense as follows:
Year ended June 30: PERS 1 PERS 2/3 TRS 1 TRS 2/3
2018 (38,881) (62,321) (7,980) 8,640
2019 (38,881) (84,810) (7,980) 8,640
2020 145,024 625,429 28,886 57,149
2021 90,649 421,570 17,950 32,822
2022 (52)
157,911$ 899,868$ 30,876$ 107,199$
C. College Participation in Plan Administered by the State Board for Community and Technical Colleges State Board Retirement Plan (SBRP) – Supplemental Defined Benefits Plans Plan Description. The State Board Retirement Plan is a privately administered single-employer defined contribution plans with a supplemental defined benefit plan component, which guarantees a minimum retirement benefit based upon a one-time calculation at each employee’s retirement date. The supplemental component is financed on a pay-as-you-go basis. Clark College participates in this plan as authorized by chapter 28B.10 RCW and reports its proportionate share of the total pension liability The State Board for Community and Technical Colleges makes direct payments to qualifying retirees when the retirement benefits provided by the fund sponsors do not meet the benefit goals, no assets are accumulated in trusts or equivalent arrangements. Clark College participate in this plan as authorized by chapter 28B.10 RCW, the plan covers faculty and other positions as designated by each participating employer. Benefits Provided. The State Board Supplemental Retirement Plans provide retirement, disability, and death benefits to eligible members. As of July 1, 2011, the State Board Supplemental Retirement Plan was closed to new entrants. The SBRP supplemental pension benefits are unfunded. For the year ended June 30, 2017, supplemental benefits were paid by the SBCTC on behalf of the system as a total in the amount of $902,000. In 2012, legislation (RCW 28B.10.423) was passed requiring colleges to pay into a Supplemental Benefit Fund managed by the State Investment Board, for the purpose of funding future benefit obligations. During FY 2017, the College paid into this fund at a rate of 0.5% of covered salaries, totaling $125,490. As of June 30, 2017, the SBCTC system accounted for $13,280,150 of the fund balance. Members are eligible to receive benefits under this plan at age 62 with 10 years of credited service. The supplemental benefit is a lifetime benefit equal to the amount a member’s goal income exceeds their assumed income. The monthly goal income is the one-twelfth of 2 percent of the member’s average annual salary multiplied by the number of years of service (such product not to exceed one-twelfth of fifty percent of the member’s average annual salary). The member’s assumed income is an

50 | P a g e
annuity benefit the retired member would receive from their defined contribution Retirement Plan benefit in the first month of retirement had they invested all employer and member contributions equally between a fixed income and variable income annuity investment. Plan members have the option to retire early with reduced benefits. Actuarial Assumptions The total pension liability was determined by an actuarial valuation as of June 30, 2016, with the results rolled forward to the June 30, 2017, measurement date using the following actuarial assumptions, applied to all periods included in the measurement:
Mortality rates were based on the RP-2000 Combined Healthy Table and Combined Disabled Table published by the Society of Actuaries. The Office of the State Actuary applied offsets to the base table and recognized future improvements in mortality by projecting the mortality rates using 100 percent Scale BB. Mortality rates are applied on a generational basis, meaning members are assumed to receive additional mortality improvements in each future year, throughout their lifetime. Most actuarial assumptions used in the June 30, 2016, valuation were based on the results of the April 2016 Supplemental Plan Experience Study. Additional assumptions related to the fixed income and variable income investments were based on feedback from financial administrators of the State Board Supplemental Retirement Plan. Material assumption changes during the measurement period include the discount rate increase from 2.85 percent to 3.58 percent and the variable income investment return assumption dropping from 6.75 percent to 6.25 percent. Discount Rate The discount rate used to measure the total pension liability was set equal to the Bond Buyer General Obligation 20-Bond Municipal Bond Index, or 3.58 percent for the June 30, 2017, measurement date. Pension Expense For the year ended June 30, 2017, the College reported $171,051 for pension expense in the State Board Supplemental Retirement Plans. Proportionate Shares of Pension Liabilities The College’s proportionate share of pension liabilities for fiscal year ending June 30, 2017 was 4.375831%. The College’s proportion of the net pension liability was based on a projection of the College’s long-term share of contributions to the pension plan to the projected contributions of all participating College’s, actuarially determined. Plan Membership Membership of the State Board Supplemental Retirement Plan (SBRP) consisted of the following at June 30, 2016, the date of the latest actuarial valuation:
Salary increases 3.50% - 4.25%
Fixed Income and Variable Income Investment Returns
4.25%-6.25%

51 | P a g e
Plan
Inactive Members (or Beneficiaries) Currently Receiving Benefits
Inactive Members Entitled to But Not Yet Receiving Benefits
Active Members
Total Members
SBRP-Clark College 23 0 294 317
Number of Participating Members
Change in Total Pension Liability The following table presents the College’s proportionate share of the change in total pension liability of State Board Supplemental Retirement Plans at June 30, 2017, the latest measurement date for all plans:
Total Pension Liability Amount
Service Cost 237,039$
Interest 153,768
Changes of benefit terms -
Differences between expected and actual experience (1,108,661)
Changes of assumptions (261,675)
Benefit Payments (39,470)
Other -
Net Change in Total Pension Liability (1,018,999)
Total Pension Liability - Beginning 5,178,227
Total Pension Liability - Ending 4,159,228$
Change in Total Pension Liability
Sensitivity of the Total Pension Liability to Changes in the Discount Rate The following table presents the College’s total pension liability, calculated using the discount rate of 3.58 percent, as well as what the College’s total pension liability would be if it were calculated using a discount rate that is 1 percentage point lower (2.58 percent) or 1 percentage point higher (4.58 percent) than the current rate:
1% DecreaseCurrent
Discount Rate 1% Increase
Pension Plan (2.58%) (3.58%) (4.58%)
SBRP 4,778,364$ 4,159,228$ 3,646,468$

52 | P a g e
Deferred Outflows of Resources and Deferred Inflows of Resources Related to Pensions The following represents the components of the College’s deferred outflows and inflows of resources as it relates to the State Board Supplemental Retirement Plan, as reflected on the Statement of Net Position, for the year ended June 30, 2017:
Amounts reported as deferred outflows of resources and deferred inflows of resources related to pensions will be recognized in pension expense in the fiscal years ended June 30:
D. Defined Contribution Plans
Public Employees’ Retirement System Plan 3 The Public Employees’ Retirement System (PERS) Plan 3 is a combination defined benefit/defined contribution plan administered by the state through the Department of Retirement Systems (DRS). Refer to Note 18.B for PERS Plan descriptions. PERS Plan 3 has a dual benefit structure. Employer contributions finance a defined benefit component, and member contributions finance a defined contribution component. As established by chapter 41.34 RCW, employee contribution rates to the defined contribution component range from 5 percent to 15 percent of salaries, based on member choice. Members who do not choose a contribution rate default to a 5 percent rate. There are currently no requirements for employer contributions to the defined contribution component of PERS Plan 3. PERS Plan 3 defined contribution retirement benefits are dependent on employee contributions and investment earnings on those contributions. Members may elect to self-direct the investment of their
Deferred Outflows
Deferred Inflows
Difference between expected and actual experience
-$ 962,814$
Changes of assumptions 227,237$
Transactions subsequent to the measurement date
Total -$ 1,190,051$
SBRP
2018 (180,328) 2019 (180,328) 2020 (180,328) 2021 (180,328) 2022 (180,328)
Thereafter (288,411)
SBRP
53 | P a g e
contributions. Any expenses incurred in conjunction with self-directed investments are paid by members. Absent a member’s self-direction, PERS Plan 3 contributions are invested in the retirement strategy fund that assumes the member will retire at age 65. Members in PERS Plan 3 are immediately vested in the defined contribution portion of their plan, and can elect to withdraw total employee contributions, adjusted by earnings and losses from investments of those contributions, upon separation from PERS-covered employment. Teachers’ Retirement System Plan 3 The Teachers’ Retirement System (TRS) Plan 3 is a combination defined benefit/defined contribution plan administered by the state through the Department of Retirement Systems (DRS). Refer Note 18.B for TRS Plan descriptions. TRS Plan 3 has a dual benefit structure. Employer contributions finance a defined benefit component, and member contributions finance a defined contribution component. As established by chapter 41.34 RCW, employee contribution rates to the defined contribution component range from 5 percent to 15 percent of salaries, based on member choice. Members who do not choose a contribution rate default to a 5 percent rate. There are currently no requirements for employer contributions to the defined contribution component of TRS Plan 3. TRS Plan 3 defined contribution retirement benefits are dependent on employee contributions and investment earnings on those contributions. Members may elect to self-direct the investment of their contributions. Any expenses incurred in conjunction with self-directed investments are paid by members. Absent a member’s self-direction, TRS Plan 3 contributions are invested in the retirement strategy fund that assumes the member will retire at age 65. Members in TRS Plan 3 are immediately vested in the defined contribution portion of their plan, and can elect to withdraw total employee contributions, adjusted by earnings and losses from investments of those contributions, upon separation from TRS-covered employment. State Board Retirement Plan Plan Description. As authoutized by chapter 28B.10 RCW, faculty and exempt administrative and professional staff are eligible to participate in SBRP. The Teacher’s Insurance and Annuity Association (TIAA) and the College Retirement Equities Fund (CREF) are the companion organizations through which individual retirement annuities are purchased. Employees have at all times a 100% vested interest in their accumulations. TIAA-CREF benefits are payable upon termination at the member’s option unless the participant is re-employed in another institution which participates in TIAA-CREF. The Plan has a supplemental payment component that guarantees a minimum retirement benefit goal based upon a one-time calculation at each employee’s retirement date. The SBCTC makes direct payments on behalf of the College to qualifying retirees when the retirement benefit provided by TIAA-CREF does not meet the benefit goal. Employees are eligible for a non-reduced supplemental payment after the age of 65 with ten years of full-time service. The minimum retirement benefit goal is 2% of the average annual salary for each year of full-time service up to a maximum of 25 years. However, if the participant does not elect to make the 10%

54 | P a g e
TIAA-CREF contribution after age 49, the benefit goal is 1.5% for each year of full-time service for those years the lower contribution rate is selected. The SBCTC is authorized to amend benefit provisions including contribution rates under RCW 28B.10.400. In 2011, the plan was amended to eliminate the supplemental benefit provisions for all employees hired after June 30, 2011. Contributions. Contribution rates for the SBRP (TIAA-CREF), which are based upon age, are 5%, 7.5% or 10% of salary and are 100% matched by the College. Employee and employer contributions for the year ended June 30, 2017 were each $2,094,839 and $2,094,824, respectively. Washington State Deferred Compensation Program The College, through the state of Washington, offers its employees a deferred compensation plan created under Internal Revenue Code Section 457. The plan, available to all State employees, permits individuals to defer a portion of their salary until future years. The state of Washington administers the plan on behalf of the College’s employees. The deferred compensation is not available to employees until termination, retirement or unforeseeable financial emergency. The College does not have access to the funds. 19. Other Post-Employment Benefits Health care and life insurance programs for employees of the State of Washington are administered by the Washington State Health Care Authority (HCA). The HCA calculates the premium amounts each year that are sufficient to fund the statewide health and life insurance programs on a pay-as-you-go basis. These costs are passed through to individual state agencies based upon active employee headcount; the agencies pay the premiums for active employees to the HCA. The agencies may also charge employees for certain higher cost options elected by the employee. State of Washington retirees may elect coverage through state health and life insurance plans, for which they pay less than the full cost of the benefits, based on their age and other demographic factors. The health care premiums for active employees, which are paid by the agency during the employees’ working careers, subsidize the “underpayments” of retirees. An additional factor in the Other Post-Employment Benefits (OPEB) obligation is a payment that is required by the State Legislature to reduce the premiums for retirees covered by Medicare (an “explicit” subsidy). This explicit subsidy is also passed through to state agencies via active employee rates charged to the agency. There is no formal state or College plan that underlies the subsidy of retiree health and life insurance. The actuary allocated the statewide disclosure information to the community and technical college system level. The SBCTC further allocated these amounts among the colleges. The College’s share of the GASB 45 actuarially accrued liability (AAL) is $33,097,037, with an annual required contribution (ARC) of $2,982,111. The ARC represents the amortization of the liability for FY 2017 plus the current expense for active employees, which is reduced by the current contributions of approximately $639,844. The College’s net OPEB obligation at June 30, 2017 was approximately $8,723,766. This amount is not included in the College’s financial statements. The College paid $8,124,823 for healthcare expenses in 2017, which included its pay-as-you-go portion of the OPEB liability.

55 | P a g e
20. Operating Expenses by Program In the Statement of Revenues, Expenses and Changes in Net Position, operating expenses are displayed by natural classifications, such as salaries, benefits, and supplies. The table below summarizes operating expenses by program or function such as instruction, student financial aid, and academic support. The College included compensated absence accrual expense and pension expense with institutional support for the purpose of this table. The following table lists operating expenses by program for the year ending June 30, 2017.
Expenses by Functional ClassificationInstruction 36,487,967$ Academic Support Services 8,723,078 Student Services 8,756,785 Institutional Support 11,630,618 Operations and Maintenance of Plant 8,598,785 Scholarships and Other Student Financial Aid 15,803,552 Auxiliary enterprises 8,247,917 Depreciation 4,063,546 Total Operating Expenses 102,312,248$
21. Commitments and Contingencies Two claims have been filed against Clark College. In one, a former employee alleges the College refused to rehire her when her previous position re-opened. The employee claims discrimination, retaliation and wrongful termination, among other charges. This claim was settled in November 2017, and had no impact on the financial position of the College. In the other, a former employee alleges she was subjected to disparate treatment, contract breach, discrimination, defamation, and civil rights violations, among other charges. The College has been notified of anotherd potential claim, which may be filed, but has not yet been filed. The outcome of these claims, including any potential loss, cannot be estimated at this time. As discussed in Note 11, the College participates in the State of Washington risk management self-insurance program, and coverage is adequate to protect the College from a negative impact to its financial position. Additionally, the College is engaged in various legal actions in the ordinary course of business. Management does not believe the ultimate outcome of these actions will have a material adverse effect on the financial statements. The College has commitments of $6,864,192 for the renovation of the Culinary Arts facility. The construction is funded partially through local capital and Certificate of Participation debt proceeds. At June 30, 2017, the renovation was in the midst of its construction phase.

56 | P a g e
This page intentionally left blank.

57 | P a g e
Required Supplementary Information Pension Plan Information Cost Sharing Employer Plans Schedules of Clark College’s Proportionate Share of the Net Pension Liability
Fiscal Year
College’s proportion of the
net pension liability
College proportionate
share of the net pension liability
College covered payroll
College’s proportionate
share of the net pension liability as a percentage
of its covered payroll
Plan’s fiduciary net position as a
percentage of the total pension
liability
2014 0.126007% $ 6,347,662 $ 13,737,461 46.21% 61.19%
2015 0.119202% $ 6,235,373 $ 13,482,980 46.25% 59.10%
2016 0.116781% $ 6,271,681 $ 13,828,741 45.35% 57.03%
2017
2018
2019
2020
2021
2022
2023
Schedule of Clark College's Share of the Net Pension Liability
Public Employees’ Retirement System (PERS) Plan 1Measurement Date of June 30
*These schedules are to be built prospectively until they contain 10 years of data.

58 | P a g e
Cost Sharing Employer Plans Schedules of Clark College’s Proportionate Share of the Net Pension Liability
Fiscal Year
College’s proportion of the
net pension liability
College proportionate
share of the net pension liability
College covered payroll
College’s proportionate
share of the net pension liability as a percentage
of its covered payroll
Plan’s fiduciary net position as a
percentage of the total pension
liability
2014 0.158501% $ 3,203,878 $ 13,594,117 23.57% 93.29%
2015 0.150332% $ 5,371,449 $ 13,339,404 40.27% 89.20%
2016 0.146773% $ 7,389,896 $ 13,712,161 53.89% 85.82%
2017
2018
2019
2020
2021
2022
2023
Schedule of Clark College's Share of the Net Pension Liability
Public Employees’ Retirement System (PERS) Plan 2/3Measurement Date of June 30
*These schedules are to be built prospectively until they contain 10 years of data.

59 | P a g e
Cost Sharing Employer Plans Schedules of Clark College’s Proportionate Share of the Net Pension Liability
Fiscal Year
College’s proportion of the
net pension liability
College proportionate
share of the net pension liability
College covered payroll
College’s proportionate
share of the net pension liability as a percentage
of its covered payroll
Plan’s fiduciary net position as a
percentage of the total pension
liability
2014 0.026433% $ 779,629 $ 1,189,441 65.55% 68.77%
2015 0.026463% $ 838,385 $ 1,267,135 66.16% 65.70%
2016 0.028512% $ 973,463 $ 1,400,943 69.49% 62.07%
2017
2018
2019
2020
2021
2022
2023
Schedule of Clark College's Share of the Net Pension Liability
Teachers’ Retirement System (TRS) Plan 1Measurement Date of June 30
*These schedules are to be built prospectively until they contain 10 years of data.

60 | P a g e
Cost Sharing Employer Plans Schedules of Clark College’s Proportionate Share of the Net Pension Liability
Fiscal Year
College’s proportion of the
net pension liability
College proportionate
share of the net pension liability
College covered payroll
College’s proportionate
share of the net pension liability as a percentage
of its covered payroll
Plan’s fiduciary net position as a
percentage of the total pension
liability
2014 0.026905% $ 86,900 $ 1,159,481 7.49% 96.81%
2015 0.026383% $ 222,620 $ 1,232,234 18.07% 92.48%
2016 0.027884% $ 382,925 $ 1,374,104 27.87% 88.72%
2017
2018
2019
2020
2021
2022
2023
Schedule of Clark College's Share of the Net Pension Liability
Teachers’ Retirement System (TRS) Plan 2/3Measurement Date of June 30
*These schedules are to be built prospectively until they contain 10 years of data.

61 | P a g e
Pension Plan Information Cost Sharing Employer Plans Schedules of Contributions
2014 $ 557,742 $ 557,742 $ - $13,737,461 4.06%
2015 $ 547,849 $ 547,849 $ - $13,482,980 4.06%
2016 $ 662,258 $ 662,258 $ - $13,828,741 4.79%
2017 $ 694,134 $ 694,134 $ - $14,419,186 4.81%
2018
2019
2020
2021
2022
2023
Fiscal Year
Schedule of Contributions
Public Employees’ Retirement System (PERS) Plan 1Fiscal Year Ended June 30
Contractually Required
Contributions
Contributions in relation to
the Contractually
Required Contributions
Contribution deficiency (excess)
Covered payroll
Contributions as a percentage of covered payroll
Notes: These schedules will be built prospectively until they contain 10 years of data.

62 | P a g e
Cost Sharing Employer Plans Schedules of Contributions
2014 $ 1,214,484 $ 1,214,484 $ - $13,594,117 8.93%
2015 $ 1,204,544 $ 1,204,544 $ - $13,339,404 9.03%
2016 $ 1,496,858 $ 1,496,858 $ - $13,712,161 10.92%
2017 $ 1,574,755 $ 1,574,755 $ - $14,316,617 11.00%
2018
2019
2020
2021
2022
2023
Fiscal Year
Schedule of Contributions
Public Emplyees’ Retirement System (PERS) Plan 2/3Fiscal Year Ended June 30
Contractually Required
Contributions
Contributions in relation to
the Contractually
Required Contributions
Contribution deficiency (excess)
Covered payroll
Contributions as a percentage of covered payroll
Notes: These schedules will be built prospectively until they contain 10 years of data.

63 | P a g e
Cost Sharing Employer Plans Schedules of Contributions
2014 $ 52,271 $ 52,271 $ - $ 1,189,441 4.39%
2015 $ 59,219 $ 59,219 $ - $ 1,267,135 4.67%
2016 $ 64,952 $ 64,952 $ - $ 1,400,943 4.64%
2017 $ 98,312 $ 98,312 $ - $ 1,590,618 6.18%
2018
2019
2020
2021
2022
2023
Fiscal Year
Schedule of Contributions
Teachers’ Retirement System (TRS) Plan 1Fiscal Year Ended June 30
Contractually Required
Contributions
Contributions in relation to
the Contractually
Required Contributions
Contribution deficiency (excess)
Covered payroll
Contributions as a percentage of covered payroll
Notes: These schedules will be built prospectively until they contain 10 years of data.

64 | P a g e
Cost Sharing Employer Plans Schedules of Contributions
2014 $ 115,350 $ 115,350 $ - $ 1,159,481 9.95%
2015 $ 125,768 $ 125,768 $ - $ 1,232,234 10.21%
2016 $ 174,273 $ 174,273 $ - $ 1,374,104 12.68%
2017 $ 204,687 $ 204,687 $ - $ 1,589,505 12.88%
2018
2019
2020
2021
2022
2023
Fiscal Year
Schedule of Contributions
Teachers’ Retirement System (TRS) Plan 2/3Fiscal Year Ended June 30
Contractually Required
Contributions
Contributions in relation to
the Contractually
Required Contributions
Contribution deficiency (excess)
Covered payroll
Contributions as a percentage of covered payroll
Notes: These schedules will be built prospectively until they contain 10 years of data.

65 | P a g e
State Board Supplemental Defined Benefit Plan
Service Cost $ 237,039
Interest 153,768
Changes of benefit terms -
Differences between expected and actual experience (1,108,661)
Changes of assumptions (261,675)
Benefit Payments (39,470)
Other -
Net Change in Total Pension Liability (1,018,999)
Total Pension Liability - Beginning 5,178,227
Total Pension Liability - Ending $ 4,159,228
College's Proportion of the Pension Liability 4.375831%Covered-employee payroll 24,531,125$ Total Pension Liability as a percentage of covered-employee payroll 16.954901%
Total Pension Liability
Schedule of Changes in the Total Pension Liability and Related Ratios
State Board Retirement PlanFiscal Year Ended June 30
2017
Notes: These schedules will be built prospectively until they contain 10 years of data. State Board Supplemental Defined Benefit Plans Notes to Required Supplementary Information The State Board Supplemental Retirement Plans are financed on a pay-as-you-go basis. State institutions of higher education make direct payments to qualifying retirees when the retirement benefits provided by the fund sponsors do not meet the benefit goals, no assets are accumulated in trusts or equivalent arrangements. Potential factors that may significantly affect trends in amounts reported include changes to the discount rate, salary growth and the variable income investment return.

66 | P a g e
This page intentionally left blank