
E-cadherin regulates tissue factor release in cancer 1 Cancer cells ...

Air Toxics Hot Spots Program
Draft Cancer Unit Risk Factor (URF) for Tertiary-Butyl Acetate (TBAc)
Office of Environmental Health Hazard Assessment (OEHHA) Scientific Review Panel Presentation December 2016

TBAc Background Information
Tert-butyl acetate (TBAc; CAS 540-88-5) is a solvent used in several applications (e.g. coatings, cleaners, and adhesives).
Vapor pressure: 47 mm Hg @ 25°C.
There are no carcinogenicity studies for TBAc. However, exposure to tertiary-butanol (TBA; CAS 75-65-0), a primary metabolite of TBAc, has been shown to cause tumors in rats and mice.
2
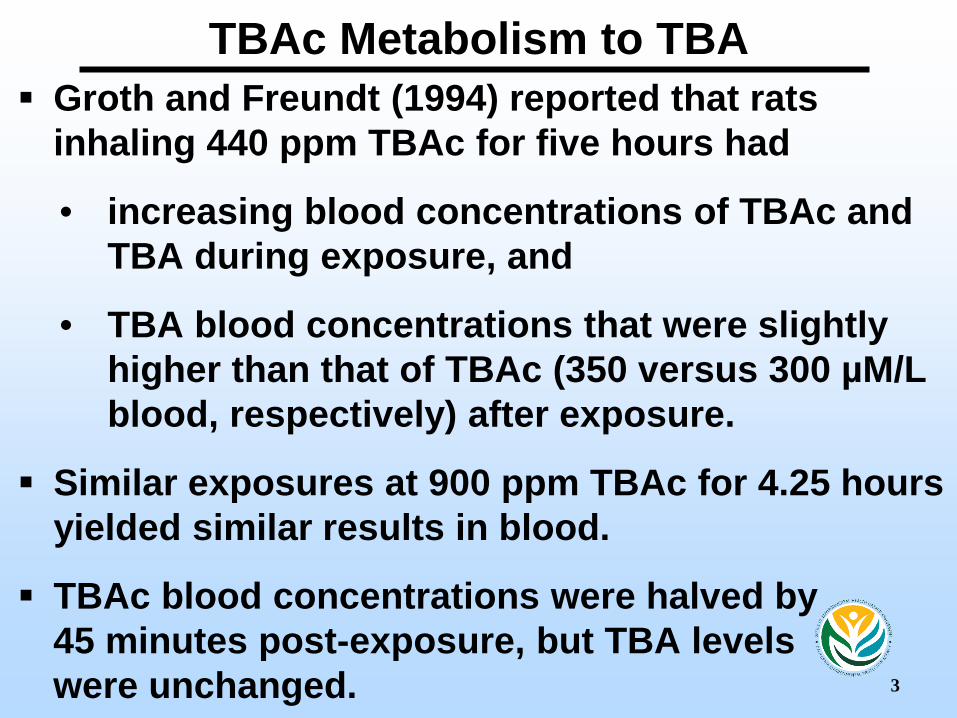
TBAc Metabolism to TBA Groth and Freundt (1994) reported that rats
inhaling 440 ppm TBAc for five hours had
• increasing blood concentrations of TBAc and TBA during exposure, and
• TBA blood concentrations that were slightly higher than that of TBAc (350 versus 300 µM/L blood, respectively) after exposure.
Similar exposures at 900 ppm TBAc for 4.25 hours yielded similar results in blood.
TBAc blood concentrations were halved by 45 minutes post-exposure, but TBA levels were unchanged.
3

TBAc Toxicokinetics
Absorption: Cruzan and Kirkpatrick (2006) rat data suggest that TBAc is absorbed rapidly upon inhalation, but saturation may occur at high exposure concentrations.
Distribution: These same studies also suggest that inhaled TBAc is rapidly distributed to tissues or exhaled.
Metabolism: through hydroxylation, oxidation, and/or glucuronidation. Two major metabolic pathways proposed in rats:
4
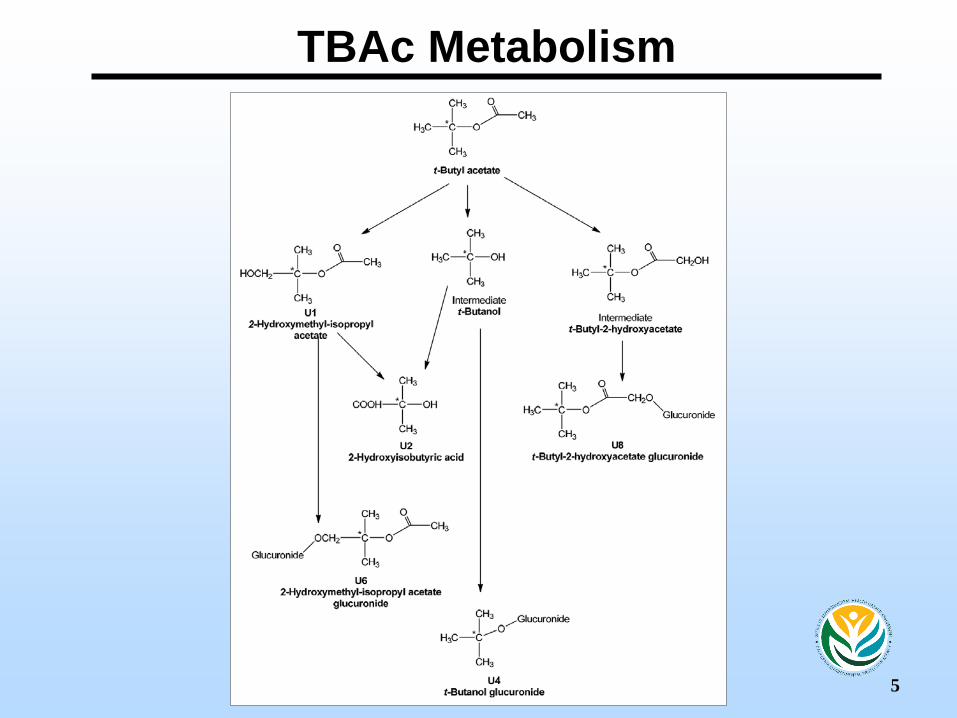
TBAc Metabolism
5

TBAc Toxicokinetics: Metabolism Major Pathways: 1. hydroxylation of TBAc to 2-hydroxymethyl- isopropyl acetate (U1) and a) oxidation to 2-hydroxyisobutyric acid (U2; major urinary metabolite) or b) conjugation to 2-hydroxymethyl- isopropyl acetate glucuronide (U6) 2. cleavage of the ester linkage in TBAc to form TBA intermediate and a) oxidation to U2 or b) conjugated to TBA-glucuronide (U4)
6

TBAc Toxicokinetics: Elimination Most of the inhaled dose is eliminated within
the first 24 hours post exposure Primary route of excretion: urine (69-89% of the
inhaled dose. Secondary excretion routes: feces (0.97-2.7%)
and exhaled air (4.8-27%; has a larger role at higher exposure concentrations).
A low level of tissue retention (<3%) was reported.
Elimination Half-life: 45 minutes in rats exposed by inhalation (Groth and
Freundt, 1994).
7

TBAc Cancer Risk Assessment Based on 2-year TBA drinking water studies of
rats and mice (NTP, 1995).
Study population: F344 rats and B6C3F1 mice (60/sex/treatment group).
Exposure method and duration: drinking water ingestion for up to 103 weeks
Male rats: 0, 1.25, 2.5, or 5 mg/mL
Female rats: 0, 2.5, 5 or 10 mg/mL
Male and female mice: 0, 5, 10, or 20 mg/mL
8

Increased tumor incidences in Fischer 344 male rats and male and female B6C3F1 mice exposed to
tertiary-butanol in drinking water (NTP, 1995)
Sex, species Tumor type
Administered dose
(mg/mL) Exposed dose
(mg/kg-day) Tumor
incidence Male rats Renal tubule
adenomas and carcinomas (single section)
0 1.25 2.5 5
0 90
200 420
1/50 3/50 4/50 3/50
Male rats Renal tubule adenomas and carcinomas (step-sectioned)
0 1.25 2.5 5
0 90
200 420
8/50 13/50
19/50** 13/50
Male mice Thyroid follicular cell adenomas
0 5
10 20
0 540
1,040 2,070
1/60 0/59 4/59 2/57
Female mice
Thyroid follicular cell adenomas
0 0 2/58+
5 510 3/60 10 1,020 2/59 20 2,110 9/59*
9 Fisher exact test pairwise comparison with controls: * p = 0.028; ** p = 0.012. Cochran-Armitage trend test for dose response: + p = 0.007

TBAc Cancer Risk Assessment
Critical effects: renal tubule adenomas and carcinomas in male rats, thyroid follicular cell tumors in female mice. A poly-3 survival-adjusted lifetime tumor
incidence correction was applied to the NTP (1995) male rat kidney tumor data and female mouse thyroid data to compensate for non-tumor-related mortality.
10

Significantly increased poly-3 survival-adjusted tumor incidences in Fischer 344 male rats and
female B6C3F1 mice exposed to tertiary-butanol in drinking water (NTP, 1995)
Sex, species Tumor type
Exposed dose
(mg/kg-day)
Poly-3 corrected tumor
incidence Male rats Renal tubule
adenomas and carcinomas
0 90
200 420
8/35 13/34
19/34** 13/33
Female mice
Thyroid follicular cell adenomas
0 2/48+
510 3/51 1,020 2/52 2,110 9/53*
11
Fisher exact test pairwise comparison with controls: * p = 0.038; ** p = 0.005. Cochran-Armitage trend test for dose response: + p = 0.006

TBA Cancer Risk Assessment: Animal Cancer Slope Factors (CSFanimal)
12
TBA cancer slope factors (CSFs) were calculated from the poly-3-corrected data using the Multistage Cancer Model function of U.S. EPA Benchmark Dose Software (BMDS; version 2.6).
A CSFanimal = 4.3 × 10⁻³ (mg/kg-day)-1 was calculated using BMDS from the corrected male rat kidney tumor data set with the high dose (420 mg/kg-day) eliminated, using a 1st degree polynomial.

TBA Cancer Risk Assessment: Animal Cancer Slope Factors (CSFanimal)
13
The high dose tumor incidence data was dropped from the model to allow model convergence, and a 1st degree polynomial was used to model the data for goodness-of-fit purposes.
A CSFanimal = 7 × 10⁻⁵ (mg/kg-day)-1 was also calculated using BMDS from the corrected female mouse thyroid tumor data set using a 3rd degree polynomial multistage cancer model.

BMDS output from an analysis of the NTP (1995) TBA tumor data
AIC: Akaike Information Criterion BMD: Benchmark Dose BMDL: lower 95% confidence limit on the BMD 14
Sex/strain/species/ tumor site
BMD mg/kg-
day
BMDL mg/kg-
day
Goodness of fit
p-value AIC
Male F344 rat renal tubule adenomas and carcinomas; high dose dropped
18.76 11.55 0.86 133.55
Female B6C3F1 mouse thyroid follicular cell adenomas
1523.69 647.06 0.74 109.31

TBAc-induced incidence of male rat renal tubule adenomas and carcinomas:
Multi-stage Cancer Model
15

TBAc CSFanimal and CSFhuman
Male rat kidney tumor data yielded the lowest CSFanimal value.
This animal cancer potency estimate was converted to a human potency equivalent.
Animal cancer potency estimate for TBA was converted to human equivalents [in (mg/kg-day)-1] using body weight (BW)3/4 scaling.
16

TBAc CSFhuman Derivation
CSFhuman = CSFanimal × (BWhuman/BWanimal)1/4
= 4.3 × 10⁻³ (mg/kg-day)-1 × (70 kg/0.431 kg)
= 1.5 × 10⁻² (mg/kg-day)-1
A TBAc CSForal was derived for TBAc from the TBA CSFhuman value above, assuming: • A TBAc-to-TBA metabolic conversion factor
(TBAc MC) of 0.71 • A molar conversion factor (MCF) of 0.64
(MCF = TBA molecular weight ÷ TBAc molecular weight = 74.12 ÷ 116.16). 17
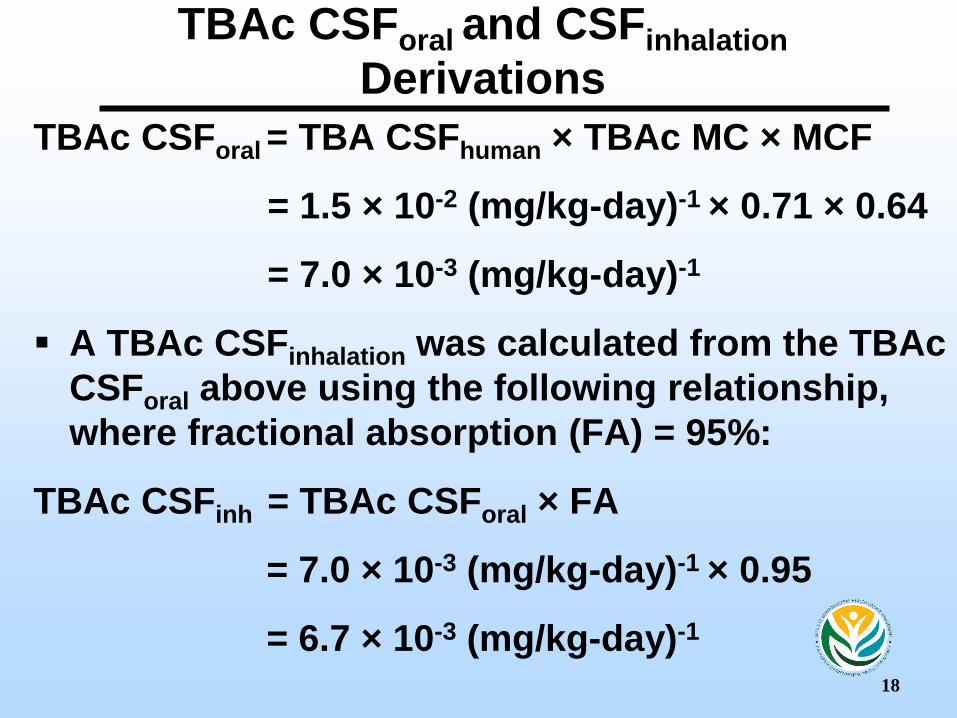
TBAc CSForal and CSFinhalation Derivations
TBAc CSForal = TBA CSFhuman × TBAc MC × MCF
= 1.5 × 10⁻² (mg/kg-day)-1 × 0.71 × 0.64
= 7.0 × 10⁻³ (mg/kg-day)-1
A TBAc CSFinhalation was calculated from the TBAc CSForal above using the following relationship, where fractional absorption (FA) = 95%:
TBAc CSFinh = TBAc CSForal × FA
= 7.0 × 10⁻³ (mg/kg-day)-1 × 0.95 = 6.7 × 10⁻³ (mg/kg-day)-1
18

TBAc Cancer UR Derivation TBAc unit risk factor (URF) was derived from the
CSFinh value for TBAc
Used a human breathing rate (BR) of 20 m3/day, an average human BW of 70 kg, and a mg to μg conversion (CV) of 1000:
TBAc URF = (CSFinh × BR)
(BW × CV)
= (6.7 × 10⁻³ (mg/kg-day)-1 × 20 m3/day)
(70 kg × 1000 µg/mg)
= 1.9 × 10⁻⁶ (µg/m3)-1
19

TBAc Cancer Risk Summary
Proposed TBAc Risk Factors: CSForal = 7.0 × 10⁻³ (mg/kg-day)-1
CSFinh = 6.7 × 10⁻³ (mg/kg-day)-1
URF = 1.9 × 10⁻⁶ (μg/m3)-1
Previous TBAc Risk Factors (ARB, 2006): CSFinh = 2.0 × 10⁻³ (mg/kg-day)-1
URF = 4.0 × 10⁻⁷ (μg/m3)-1
20

Questions?
21

TBAc Public Comments and OEHHA Responses
OEHHA received comments on TBAc from: Lyondell Chemical Company and Dr. James S. Felton, PhD (on behalf of
Lyondell Chemical Co.).
22

TBAc Public Comments and OEHHA Responses
Public Comment Topics: Male rat kidney tumors: Mode of Action
• Non-genotoxicity • Male rat specificity of renal effects • Sustained, elevated cell proliferation • Dose-response similarities between MoA and
tumors TBA-induced female mouse thyroid tumors Inhalation Unit Risk Derivation
23

TBAc Comments: Mode of Action (MoA)
Use of TBA-induced male rat kidney tumors as the primary basis for derivation of the TBAc URF is not justified given that this tumor response is likely mediated through the non-human-relevant α2u-globulin MoA (McGregor, 2010; Bus et al., 2015).
A weight-of-evidence (WoE) examination of the overall data supports the conclusion that TBA is operating by the α2u-globulin MoA.
Essentially, all seven criteria for this MoA, as outlined by IARC (1999), have been
fulfilled (Table 1).
24

25
TBAc Comments: MoA
* Although IARC (1999) stated that all seven criteria must be fulfilled in order to conclude that a chemical is operating by an α2u-globulin MoA, the IARC Working Group paper used as the basis for these criteria differentiated the seven criteria into “essential” and “additional supporting evidence” (Swenberg and Lehman-McKeeman, 1999).
Table 1: Does TBA meet IARC criteria for an α2u-globulin MoA?
OEHHA LyondellBasell View Essential Criteria 1. Non-genotoxicity No Yes 2. Male rat specificity Not Completely Yes 3. Characteristic histopath Yes Yes 4. α2u-globulin identified Yes Yes Additional Supporting Evidence* 5. Reversible binding to α2u-globulin Yes Yes 6. Sustained, increased cell proliferation Not completely Probably 7. Dose response similarities between MoA and tumors No Yes

OEHHA Responses: MoA
1. The “weight of evidence” supports our position that male rat kidney tumors observed in the NTP (1995) TBA drinking water cancer bioassay are relevant to human cancer risk assessment. (Responses to specific criteria comments are shown in the following slides.)
2. The use of the complete IARC (1999) criteria for an agent causing kidney tumours through an α2u-globulin-associated response in male rats, as listed in the Consensus Report and described in the Document is appropriate.
26

TBAc Comments: Criterion 1 – Non-genotoxicity
TBAc and TBA were negative in high-quality studies examining: 1. bacterial reverse mutations, 2. in vitro human lymphocyte and mammalian cell
(CHO) chromosomal aberrations (TBAc and TBA, respectively)
3. mammalian cell (L5178Y mouse lymphoma) mutations (TBA)
4. in vivo rat bone marrow and mouse micronucleus assays (TBAc and TBA, respectively).
27

TBAc Comments: Criterion 1 – Non-genotoxicity
WoE evaluation of the genotoxicity data summarized in the TBAc Technical Support Document (TSD) results in the clear conclusion that both TBAc and its metabolic surrogate, TBA, are non-genotoxic.
28

OEHHA Responses: Criterion 1 – Non-genotoxicity
The genotoxicity data for TBAc is generally negative, but limited.
TBA has not been shown to cause chromosomal damage but has produced mixed results for bacterial gene mutation.
29

OEHHA Responses: Criterion 1 – Non-genotoxicity
TBA has been observed to cause DNA damage (primary DNA damage, adduct formation, oxidative DNA damage). DNA damage assays were performed in vitro and in vivo using several different assay endpoints, and they were uniformly positive.
It is also notable, given the positive DNA damage data for TBA, that the positive bacterial gene mutation assay data was generated in a Salmonella strain which
is sensitive to oxidative DNA damage.
30

OEHHA Responses: Criterion 1 – Non-genotoxicity
Negative results from different types of chromosomal assays may increase the “weight-of-evidence” regarding chromosomal damage, but does not necessarily predominate in an overall assessment of genotoxicity. Positive data should not be dismissed lightly.
Overall, genotoxicity data do not prove TBA is non-genotoxic. Therefore, TBA does not fit IARC Criterion 1.
31

TBAc Comments: Criterion 1 – Non-genotoxicity
Methyl tertiary-butyl ether (MTBE) and ethyl tertiary-butyl ether (ETBE) are extensively metabolized to TBA, representing metabolic surrogates of TBAc through their common metabolism to TBA.
The negative genotoxicity profiles of MTBE and ETBE should be included in the overall WoE evaluation supporting a conclusion of non-genotoxicity.
32

OEHHA Responses: Criterion 1 – Non-genotoxicity
A comprehensive evaluation of MTBE and ETBE genotoxicity data is beyond the scope of the TSD. However, the TSD does discuss TBA genotoxicity studies that also present positive genotoxicity data for MTBE.
Those studies include reports of DNA damage (Tang et al., 1997; Sgambato et al., 2009), bacterial gene mutation (Williams-Hill et al., 1999), and DNA adduct formation (Yuan et al., 2007).
33

TBAc Comments: Criterion 1 – Non-genotoxicity
There are problems with the studies by Tang et al. (1997), Sgambato et al., (2009), Williams-Hill et al. (1999), and Yuan et al. (2007). Namely,
1) Tang et al. (1997) assessed DNA breakage in the Comet assay using a non-standard, subjective, and qualitative method, reporting only the appearance or lack of appearance of a Comet tail in an HL-60 cell line not known to be metabolically competent.
34
OEHHA Responses: Criterion 1 – Non-genotoxicity
The methodological issues described by the commenter do not detract from our conclusion that TBAc does not meet IARC Criterion 1.
1) Tang et al. (1997) visually quantified the percentage of DNA present in the tail. Although this potentially adds some variability between data scorers due to the subjectivity of visual scoring, it is still an acceptable laboratory method.
35

TBAc Comments: Criterion 1 – Non-genotoxicity
2) Sgambato et al. (2009) used a single IC50 test concentration and only one indicator of cytotoxicity (MTT test) in their Comet assay. An IC30 is recommended to avoid confounding by increased cytotoxicity (Tice et al., 2000) as are multiple cytotoxicity indicators (Storer et al., 1996; Speit et al., 2015).
36

OEHHA Responses: Criterion 1 – Non-genotoxicity
2) Sgambato et al. (2009) did not observe a significant difference in the amount of dead cells in treated versus control cultures.
OEHHA acknowledges that cytotoxicity is a potential confounder in the interpretation of the Comet assay results contained in the Sgambato et al. (2009) study and has added that information to the document.
37

TBAc Comments: Criterion 1 – Non-genotoxicity
3) Yuan et al. (2007) used an accelerated mass spectroscopy method that is prone to false positive results of DNA adduct formation, but did not use synthetic standards of adducted DNA bases to avoid misinterpretation of results.
38

OEHHA Responses: Criterion 1 – Non-genotoxicity
3) Regarding Yuan et al. (2007), OEHHA has not found a scientific consensus that accelerator mass spectrometry is prone to false positive results.
Use of synthetic standards to confirm the identity of the DNA adducts would have been helpful. A discussion of this information has been added to the document.
39

TBAc Comments: Criterion 1 – Non-genotoxicity
4) Williams-Hill et al. (1999) observed a mutagenic response in a non-GLP (Good Laboratory Practices) in vitro TA102 assay using Salmonella enterica serovar Typhimurium (S. Typhi), which has a high and variable background incidence of revertants. TBA induced only a very weak response, barely meeting the requirement for a positive response (a 2-fold increase in mutation incidence).
40

TBAc Comments: Criterion 1 – Non-genotoxicity
4) continued..
Findings by Williams-Hill et al. (1999) were not replicated in two independent and GLP-compliant tests in the TA102 tester strain (McGregor, 2005).
These replications confirmed that the DMSO vehicle, an oxidative stress inhibitor, did not influence their negative findings in the TA102 strain, which is highly sensitive to oxidative stress.
41

OEHHA Responses: Criterion 1 – Non-genotoxicity
4) GLP standards are designed to be applied to data submitted to the US Food and Drug Administration (FDA) for regulatory approval.
Research data submitted to peer-reviewed scientific journals, such as that by Williams-Hill et al. (1999), are not required to meet GLP standards, and GLP studies should not be construed as being more scientifically valid than non-GLP studies.
42

OEHHA Responses: Criterion 1 – Non-genotoxicity
4) continued… The control revertant rate reported by Williams-Hill et al. (1999) is consistent with the laboratory quality control standards they described. Their TBA mutation data appear to show a dose-response relationship with the mid-dose exposure group exhibiting a mutation response of approximately 2-fold greater than control. Therefore, the positive TBA bacterial gene mutation reported is valid, and should be considered in any discussion of TBA genotoxicity. 43

TBAc Comments: Criterion 2 – Male rat specificity
TBA is, at most, a very weak kidney tumorigen.
A positive finding of tumorigenicity was not identified in the original NTP bioassay using standard histopathological sectioning of the kidney (NTP, 1995; Cirvello et al., 1995). Statistical significance of the response was only achieved in the mid-dose when subsequent step-sectioning of the kidney was conducted.
NTP declared the TBA kidney finding only as some evidence of carcinogenicity in male
rats. 44

OEHHA Responses: Criterion 2 – Male rat specificity
In the NTP (1995) report, standard pathology sectioning and step-sectioning were discussed as analogous to a partial evaluation and a definitive evaluation, respectively.
The step-sectioning procedure is essentially a more sensitive procedure for detecting tumors in the tissue under examination.
45

OEHHA Responses: Criterion 2 – Male rat specificity
continued… The “Explanation of Levels of Evidence of Carcinogenic Activity” section of the NTP report states that two categories for positive results of carcinogenic activity are “clear evidence” and “some evidence”. NTP clearly considers the TBA male rat kidney tumor results to be positive results.
46

TBAc Comments: Criterion 2 – Male rat specificity
In the TBAc TSD, lack of fulfillment of IARC Criterion #2 is largely based on kidney changes described in the female rat, namely exacerbation of chronic progressive nephropathy (CPN), increases in renal inflammation, and renal pelvis transitional cell hyperplasia (NTP, 1995).
In the 2-year study, females were affected with a dose-related exacerbation of CPN, not an α2u-globulin MoA.
47

TBAc Comments: Criterion 2 – Male rat specificity
continued…
Although an adverse effect, CPN is not a nephrotoxic effect (Hard et al., 2009). It is an enhancement of the development of a spontaneous disease process that is very common in the F344 rat (Hard and Khan, 2004), but not relevant to humans.
48

OEHHA Responses: Criterion 2 – Male rat specificity
The document has been revised to include:
1) an expanded description of the NTP findings regarding CPN, suppurative inflammation, and transitional epithelial hyperplasia (TEH) observed in TBA-exposed rats.
2) a discussion of the differing male and female rat dose-responses for CPN, suppurative inflammation, and TEH.
These data indicate it is unlikely that suppurative inflammation and TEH are directly linked to CPN. 49

OEHHA Responses: Criterion 2 – Male rat specificity
The document has also been specifically revised to indicate that: 1) the exacerbation of CPN in female rats
indicates an adverse renal effect, and 2) the induction of suppurative inflammation
and TEH are nephrotoxic effects.
The data listed in the revised document and discussed above indicate that TBA does not completely fit IARC Criterion #2.
50

TBAc Comments: Criterion 6 – Sustained, increased cell proliferation (CP)
The TBAc TSD used three studies to assess whether IARC Criterion #6 was supported, Borghoff et al. (2001), Takahashi et al. (1993), and Faber et al. (2014).
Borghoff et al. (2001) reported a dose-dependent increase in renal tubule CP at 10 days post TBA exposure.
Takahashi et al. (1993) applied proliferating cell nuclear antigen (PCNA) staining to recuts of kidney tissue from the NTP
(1995) 13-week TBA drinking water study 51

TBAc Comments: Criterion 6 – Sustained, increased cell proliferation
…and reported an increase in the median cell proliferation only in the mid-dose exposure group (20 mg/ml), a dose much higher than the high dose (5 mg/ml) used in the NTP carcinogenicity study.
Faber et al. (2014) reported a negative cell proliferation response observed in a 13-week study of TBAc. This comparison was not strictly appropriate as the tumor finding applied in the TSD to TBA, not TBAc.
52

TBAc Comments: Criterion 6 – Sustained, increased cell proliferation
The TSD did not refer to the work of Lindamood et al. (1992), who demonstrated via PCNA, in a 13-week drinking water study, a statistically significant increase in renal tubule S-phase nuclei at doses of 1 and 2% of TBA in male rats, matching the occurrence of the hyaline droplet response in their study.
53

TBAc Comments: Criterion 6 – Sustained, increased cell proliferation continued… At the high dose of 4% in male rats, there were no hyaline droplets or any cell proliferation responses (Lindamood et al., 1992). Nevertheless, the male rat data of Lindamood
et al. (1992) and Takahashi et al. (1993) at 13-weeks were consistent, and coupled with the results of Borghoff et al. (2001) at 10-days, provide some evidence that IARC Criterion #6 is fulfilled.
54

OEHHA Responses: Criterion 6 – Sustained, increased cell proliferation
The document has been revised to include a description of the Lindamood et al. (1992) male rat renal tubular epithelial cell proliferation data from the NTP 90-day TBA drinking water study.
However, the Takahashi et al. (1993) study appears to report virtually the same data as that in Lindamood et al. (1992), with the primary difference being that the data are presented in graphic rather than numeric format.
55

OEHHA Responses: Criterion 6 – Sustained, increased cell proliferation continued... The NTP (1995) report did not report the
PCNA cell proliferation data included in Lindamood et al. (1992) and Takahashi et al. (1993). These data, based upon the 90-day but not 2-year NTP experiments, are insufficient to change the conclusion in the TSD that TBA does not completely fit IARC Criterion #6.
56

TBAc Comments: Criterion 7 – Dose response similarities between MoA
and tumors The TBAc TSD uses immunohistochemical
staining of rat kidney for α2u-globulin as evidence of an absence of dose-response.
This technique should only be used for qualitatively localizing accumulating hyaline droplets that stain positively for the α2u-globulin protein, and should not be relied upon to support regulatory decision-making.
The ELISA is a more sensitive and quantitative measure of changes in the kidney accumulation of this protein. 57

OEHHA Responses: Criterion 7 – Dose response similarities between MoA
and tumors
OEHHA agrees that an enzyme-linked immunosorbent assay (ELISA) for renal α2u-globulin is more sensitive and easier to quantify than renal α2u-globulin immunohistochemical staining.
OEHHA is not aware of any published evidence indicating that renal α2u-globulin immunohistochemical staining is unreliable.
58
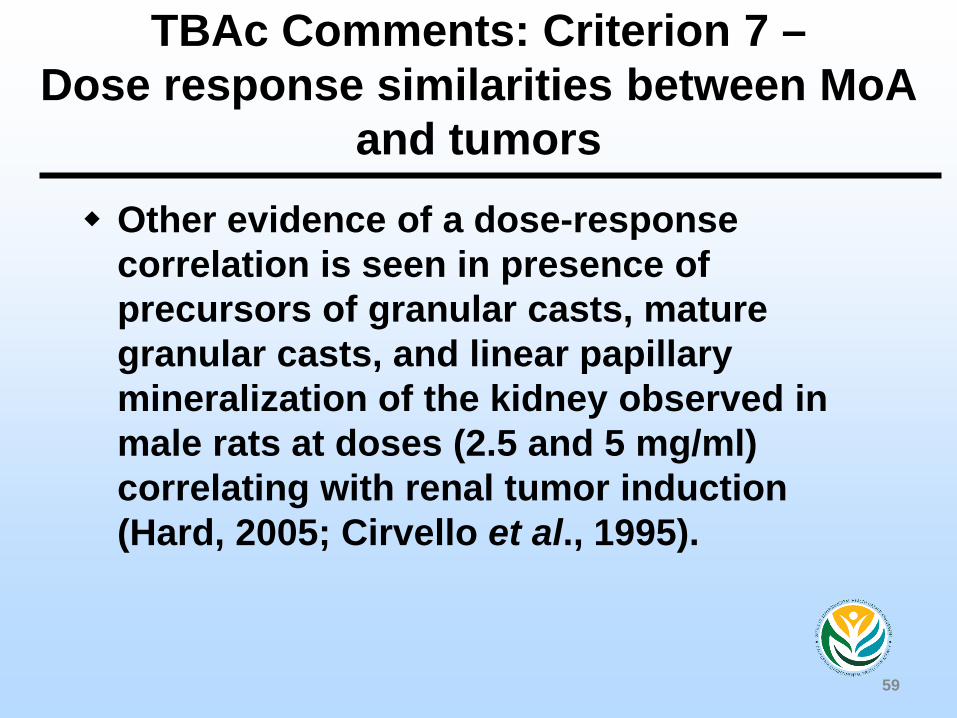
TBAc Comments: Criterion 7 – Dose response similarities between MoA
and tumors Other evidence of a dose-response
correlation is seen in presence of precursors of granular casts, mature granular casts, and linear papillary mineralization of the kidney observed in male rats at doses (2.5 and 5 mg/ml) correlating with renal tumor induction (Hard, 2005; Cirvello et al., 1995).
59

TBAc Comments: Criterion 7 – Dose response similarities between MoA
and tumors
CPN compromised survival of the rats in the 5 mg/ml groups (Hard, 2005; Cirvello et al., 1995).
Allowances should be made in the TBAc TSD to account for confounding factors of CPN exacerbation and survival.
60

OEHHA Responses: Criterion 7 – Dose response similarities between MoA
and tumors
NTP reported that incidence of linear mineralization (associated with α2u induction) increased with dose in the NTP (1995) 2-year study, but severity scores did not exhibit a dose-response. This information has been added to the discussion of IARC Criterion #7 in the document.
61

OEHHA Responses: Criterion 7 – Dose response similarities between MoA
and tumors NTP (1995) observed that there was no
morphologic evidence of extensive cell necrosis (granular cast formation) resulting from TBA exposure. This information has been added to the document.
NTP (1995) did not state that: 1) nephropathy was a cause of mortality in male and female rats; 2) survival affected tumor response; 3) that either nephropathy or mortality were confounding factors regarding renal tumor response. 62

TBAc Comments: Criterion 7 – Dose response similarities between MoA
and tumors The TBAc TSD has given no consideration to a
more likely alternative MoA. A feature of the TBA studies was exacerbation of
spontaneous CPN, which was probably the cause of lower survival in the high-dose male rats.
Advanced and end-stage CPN has been shown to be responsible for a low incidence of renal tubule tumors in control rats, and is therefore a risk factor for renal cancer development, particularly in male rats (Hard et al., 2012).
63

OEHHA Responses: Criterion 7 – Dose response similarities between MoA
and tumors
F344 rats have a relatively high incidence of CPN, but the male rat renal tubule tumor incidence in the NTP historical control database is low (< 1%), and there are several chemicals that exacerbate CPN without increasing male rat renal tumor incidence (Seely et al., 2002).
64

OEHHA Responses: Criterion 7 – Dose response similarities between MoA
and tumors
Melnick et al. (2012) evaluated 58 NTP carcinogenicity studies using male F344 rats and 11 studies using female F344 rats for relationships between exacerbated CPN and induction of rat renal tumors.
Melnick et al. (2012) found widespread inconsistencies in the hypothesized relationship between CPN and rat renal tumors.
65

OEHHA Responses: Criterion 7 – Dose response similarities between MoA
and tumors
Melnick et al. (2012) stated: 1) CPN is not an established MoA or
mechanism of renal carcinogenicity. 2) Neither the etiology of this kidney disease
in aging control rats nor the mechanism of chemically exacerbated CPN in rats is known.
66

OEHHA Responses: Criterion 7 – Dose response similarities between MoA
and tumors
3) There is no basis for establishing a MoA for enhancement of CPN in rats or for defining critical biological processes that could occur in rats and presumably could not likewise occur in humans. This indicates to OEHHA that it is unlikely
that that nephropathy is the cause of the male rat kidney tumors in the NTP (1995) study.
67

TBAc Comments: TBA-Induced Mouse Thyroid Tumors
Use of TBA-induced mouse thyroid tumors would not be justified based on MoA information suggesting a quantitative and/or qualitative lack of human relevance.
68

TBAc Comments: TBA-Induced Mouse Thyroid Tumors
Data suggest that the high-dose specific thyroid tumorigenicity of TBA results from a non-mutagenic MoA associated with enhanced catabolism of thyroid hormone mediated by TBA. This MoA is common to multiple rodent thyroid carcinogens such as phenobarbital (PB).
69

OEHHA Responses: TBA-Induced Mouse Thyroid Tumors The TBA-induced female mouse thyroid
tumors observed in the NTP 1995 TBA drinking water cancer bioassay are relevant to human cancer risk assessment.
Data indicate it is unlikely that the TBA-induced female mouse thyroid tumors reported by NTP (1995) are the result of compensatory thyroid hyperplasia secondary to thyroid hormone insufficiency.
70

OEHHA Responses: TBA-Induced Mouse Thyroid Tumors
The Cancer Hazard Evaluation: Female Mouse Thyroid Follicular Cell Tumor Data section of the TSD notes that TBA:
1) causes little or no increases in absolute or relative liver weights;
2) does not induce cytochrome P450 activity to the same degree as seen with PB;
3) does not cause large decreases in T3 or T4 levels;
71

OEHHA Responses: TBA-Induced Mouse Thyroid Tumors
continued…
4) does not increase thyroid-stimulating hormone (TSH) levels; and
5) does not cause acute abnormal mouse thyroid histopathological changes.
72

OEHHA Responses: TBA-Induced Mouse Thyroid Tumors
Additionally, TBAc has not been shown to
1) cause significant changes to thyroid gland histopathology or thyroid/parathyroid gland weights in mice;
2) induce decreases in T4 levels at relatively high dose exposures in female mice; or
3) increases in TSH levels or decreases in T3 levels in male or female mice.
73

TBAc Comments: TBA-Induced Mouse Thyroid Tumors
TBAc toxicity limits achieving of TBA tumorigenic doses in mice. As reviewed in Bus et al. (2015), 1) inhalation of 3000 ppm TBAc for 6 hours caused
prostration in mice (Cruzan and Kirkpatrick, 2006). 2) TBA induced tumors in only female mice given
2110 mg/kg/day in drinking water, equivalent to 3300 ppm TBAc by inhalation conservatively assuming 100% TBAc-to-TBA metabolism.
3) realistically assuming 50% metabolism, 2110 mg/kg/day equates to 6657 ppm TBAc,
which exceeds the maximum tolerated dose (MTD) in mice. 74

OEHHA Responses: TBA-Induced Mouse Thyroid Tumors
According to the model by Bus et al. (2015), in order to produce the TBA dose (2115 mg/kg-day) that caused thyroid tumors in female mice (NTP, 1995), TBAc inhalation exposures would have to exceed 3000 ppm, the level that produced adverse CNS effects in the acute study by Cruzan and Kirkpatrick (2006).
75

OEHHA Responses: TBA-Induced Mouse Thyroid Tumors
In the NTP (1995) study, female mice were not exposed to TBA levels greater than the MTD.
There is no reason to discount female mouse thyroid tumor data on the basis of mortality.
Use of the BMDS model assumes that there is cancer risk at all carcinogen doses greater than zero.
Therefore, even if the model proposed by Bus et al. (2015) were correct, TBAc exposure is
still expected to pose a cancer risk at concentrations below 3000 ppm. 76

OEHHA Responses: TBA-Induced Mouse Thyroid Tumors
The Bus et al. (2015) model overestimates TBAc air concentrations required to produce an oral TBAc dose of 2115 mg/kg-day.
In their algorithm, BW and minute volume (MV) are sensitive parameters, and subsequent work by Salazar et al. (2015) acknowledges changes in metabolism with repeated exposure.
77

OEHHA Responses: TBA-Induced Mouse Thyroid Tumors
OEHHA recalculated the TBAc inhalation concentration, at the 2110 mg/kg-day oral dose from the NTP (1995) study, to be 2393 ppm using average BWs for male and female mice in the NTP (1995) study, and MVs calculated from US EPA guidance (2012a) that considers specific mouse BWs.
2393 ppm < 3000 ppm observed to cause acute CNS effects, and roughly 4-fold greater than the TBA BMDL05 (point of departure)
of 647 mg/kg-day. 78

TBAc Comments: Proposed Non-cancer Risk Assessment
An alternative approach to TBAc chronic risk assessment has been proposed based on non-cancer neurotoxicity findings by Bus et al. (2015). This alternative approach yielded acute and chronic TBAc reference concentrations (RfCs) of 1.5 and 0.3 ppm, respectively.
79

OEHHA Responses: Proposed Non-cancer Risk Assessment
The TBAc cancer unit risk factor described in the document is both adequate and justified by the available data, as discussed in the responses above. Derivation of a TBAc non-cancer Reference Exposure Level (REL) is outside the scope of this document.
80

TBAc Comments: Inhalation UR Derivation
There are several issues with the TBAc inhalation unit risk estimates. These include unspecified rationales for
1) use of a 5% BMR response versus a 10% standard, and
2) elimination of the top dose in derivation of the BMR which resulted in a 2-point dose response.
81

OEHHA Responses: Inhalation UR Derivation
1) The OEHHA Air Toxics Hot Spots Risk Assessment Guidelines Technical Support Document for Cancer Potency Factors (2009) is general and not proscriptive in its statement that a benchmark tumor incidence rate of 10% is often used unless there is a significant dose response at an incidence rate <10%.
82

OEHHA Responses: Inhalation UR Derivation
2) The CSFanimal was calculated from the NTP (1995) male rat kidney tumor data set with the high dose (420 mg/kg-day) eliminated due to lack of model convergence.
An explanation of this was added to the document.
The US EPA Benchmark Dose Technical Guidance document (2012b) considers this approach appropriate when none of the available models provide an adequate
fit. 83

TBAc Comments: Inhalation UR Derivation
There are several issues with the TBAc inhalation unit risk estimates. These include
1) unexplained assumptions of 95% TBAc absorption, and
2) 71% TBAc-to-TBA metabolism.
The 95% estimate wrongly assumes that the total amount of TBAc radioactivity equivalents in rats after a 6-hour exposure (50.7 mg/kg) was equal to the total amount of TBAc inhaled over the course of that entire exposure period.
84

TBAc Comments: Inhalation UR Derivation
Assuming an EPA default MVrat = 0.000174 m3/min, and a BWrat = 0.21 kg,
1) total volume of TBAc vapor breathed over 6 hours = 360 min × 0.000174 m3/min = 0.063 m3.
2) total mg inhaled TBAc = 0.063 m3 × 474 mg/m3 = 29.7 mg (given 1 ppm TBAc = 4.74 mg/m3).
3) inhaled 6-hr TBAc dose = 29.7 mg ÷ 0.21 kg = 141 mg/kg > 50.7 mg/kg. 4) absorbed dose may be around 35% (50.7 mg/kg ÷ 141 mg/kg).
85

OEHHA Responses: Inhalation UR Derivation
The calculations in the comment:
1) use a US EPA default BWrat to generate an estimated rat respiration rate,
2) overestimate the MVrat, and inhaled mg TBAc by a factor of 1.1.
BWrats in the Cruzan and Kirkpatrick (2007) metabolism study are available to calculate an estimated respiration rate for those rats.
86

OEHHA Responses: Inhalation UR Derivation
Using the low-end BWrat, 210 g (Cruzan and Kirkpatrick, 2007) in the US EPA (2012a) default ventilation rate (VR) algorithm: 1) estimated MVrat = 0.156 L/min
2) total volume of TBAc vapor breathed over 6 hours = 360 min × 0.000156 m3/min = 0.05616 m3.
3) total mg inhaled TBAc = 0.05616 m3 × 474 mg/m3 = 26.62 mg (given 1 ppm TBAc = 4.74 mg/m3).
4) inhaled 6-hr TBAc dose = 26.62 mg ÷ 0.21 kg = 126.76 mg/kg > 50.7 mg/kg.
87

OEHHA Responses: Inhalation UR Derivation
Absorbed dose could be as low as 40% (50.7 mg/kg ÷ 126.76 mg/kg). However, 1) Cruzan and Kirkpatrick (2007) reported 4.8%
of inhaled mass was exhaled up to 7 days post exposure.
2) unmeasured excreta in the first six hours could explain much of the difference between calculated and absorbed radioactivity.
3) nose-only chambers can depress animal ventilation rates (Mauderly, 1986).
88
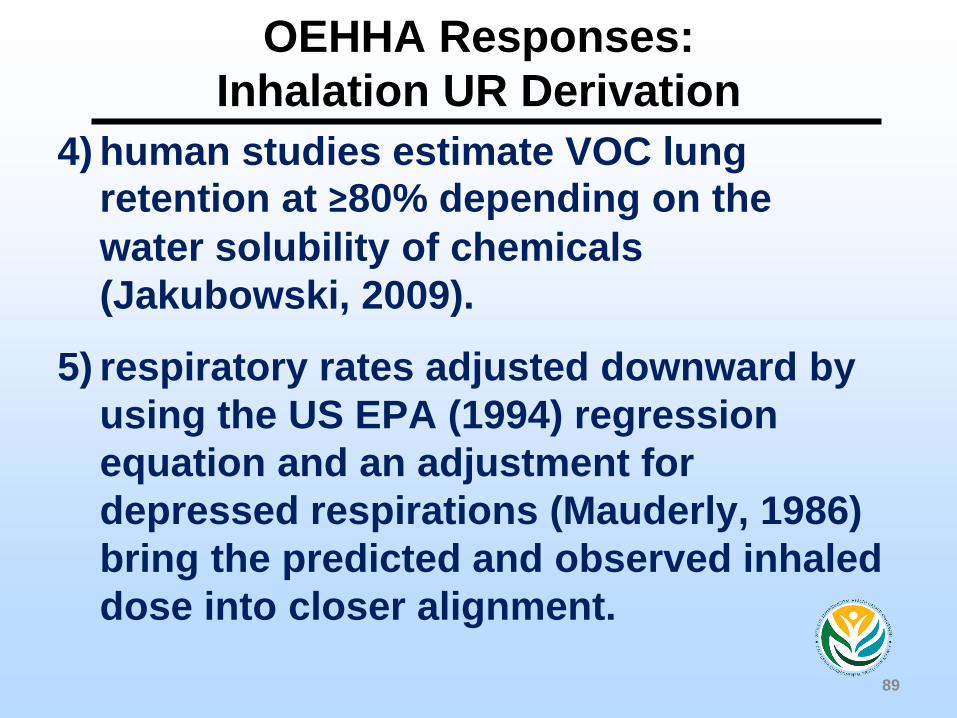
OEHHA Responses: Inhalation UR Derivation
4) human studies estimate VOC lung retention at ≥80% depending on the water solubility of chemicals (Jakubowski, 2009).
5) respiratory rates adjusted downward by using the US EPA (1994) regression equation and an adjustment for depressed respirations (Mauderly, 1986) bring the predicted and observed inhaled dose into closer alignment.
89

OEHHA Responses: Inhalation UR Derivation
Thus, the chamber concentration and inhaled dose is not expected to reflect the depressed respirations observed in nose-only administration methods.
OEHHA concluded from the radioactivity study conducted by Cruzan and Kirkpatrick (2006) that metabolism to TBA could be as much as 71% at the lower of two single dose levels and as much as 82% at the higher dose level based on the U2 and U4 pathways reported in Table V of that
paper.
90

Questions?
91


![[XLS] Database.xls · Web viewGeneric Numerical Standards Inhalation URF Metadata Oral SLope Factor Metadata Inhalation RfC Metadata Oral RfD Metadata Potable GW Inhalation Tox value](https://static.fdocuments.in/doc/165x107/5aa288c77f8b9a80378d1f15/xls-viewgeneric-numerical-standards-inhalation-urf-metadata-oral-slope-factor.jpg)