draft BE presentation MA2 - remember.irena.orgremember.irena.org/sites/Documents/Shared...
21
UNFCCC SBI 45 MULTILATERAL ASSESSMENT BELGIUM Marrakech, 12 November 2016
Transcript of draft BE presentation MA2 - remember.irena.orgremember.irena.org/sites/Documents/Shared...
UNFCCC SBI 45MULTILATERAL ASSESSMENT
BELGIUM
Marrakech, 12 November 2016

Geography• north-western Europe
• 30 528 km2
Population• 11,2 million inhab. (2015)
• 367 inhab./km2 (2015)
GDP• 36 524 €/inhab. (2015)
• +2,2% /yr. (2014/2015)
GHG emissions• 113,9 Mton CO2-eq. excl.
LULUCF (2014)
• 10,2 tonnes CO2-eq/capita (2014)
Belgium 2

3GHG emissions profile (2014)
Source: National GHG Inventory, June 2016
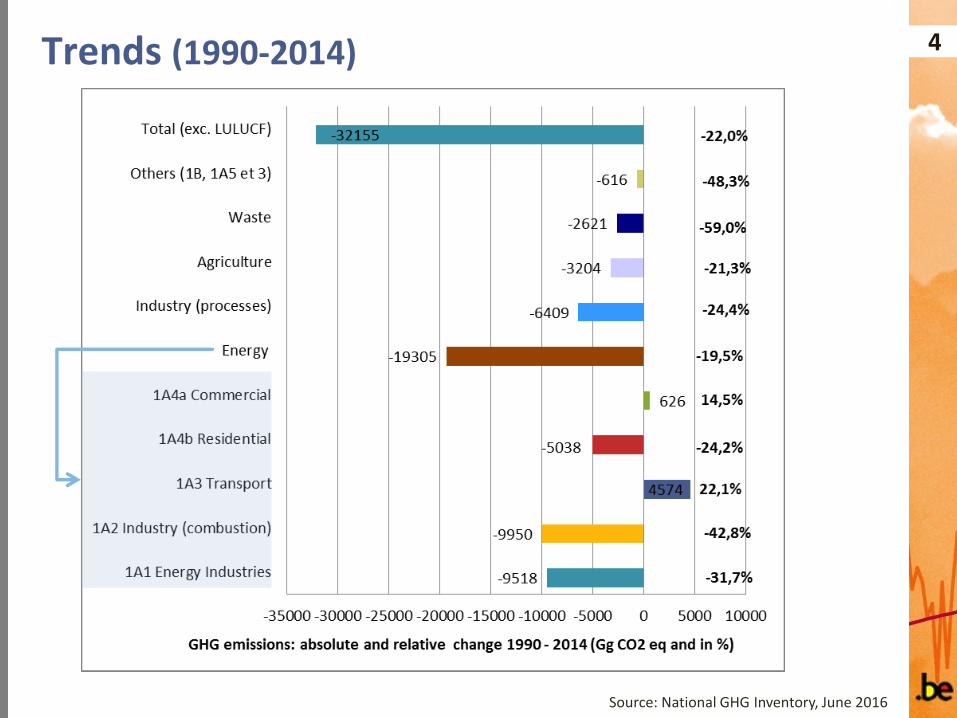
Trends (1990-2014) 4
Source: National GHG Inventory, June 2016

60%
70%
80%
90%
100%
110%
120%
130%
140%
150%
160%
1990 1991 1992 1993 1994 1995 1996 1997 1998 1999 2000 2001 2002 2003 2004 2005 2006 2007 2008 2009 2010 2011 2012 2013 2014
Decoupling emissions from growth 5
Source: World Bank/OECD, Belgian Statistics, National GHG Inventory (June 2016)
1990GDP: 265 billion €9,95 million inhabitantsGHG: 146 021 kt CO2-eq.
2014GDP: 400 billion €11,15 million inhabitantsGHG: 113 867 kt CO2-eq.
GHG emissions
Population
GDP (at constant prices)
KP CP1 target
+51%
-22%
+12%

Belgium’s target within the EU 6
2020
2030
(versus 1990)
(versus 1990)

7Belgium’s target within the EU
BE: -35%(subject to final approval under
the Effort Sharing Regulation)
BE: -15%(Effort Sharing
Decision)

Trends and targets (2020) 8
Historic emissions
Projectedemissions(WEM)
2013-2020 budget
-15 %
30
40
50
60
70
80
902
00
5
20
06
20
07
20
08
20
09
20
10
20
11
20
12
20
13
20
14
20
15
20
16
20
17
20
18
20
19
20
20
20
21
20
22
20
23
20
24
20
25
20
26
20
27
20
28
20
29
20
30

Trends and targets (2030) 9
Historic emissions
Projectedemissions(WEM)
2013-2020 budget
-15 %
30
40
50
60
70
80
902
00
5
20
06
20
07
20
08
20
09
20
10
20
11
20
12
20
13
20
14
20
15
20
16
20
17
20
18
20
19
20
20
20
21
20
22
20
23
20
24
20
25
20
26
20
27
20
28
20
29
20
30
Transport+12%
Buildings
-15%
Agriculture-1%
Waste-48%0
5
10
15
20
25
30
35
2015 2020 2025 2030 2035
Mt
CO
2-e
q.
EC proposal2021-2030
-35%
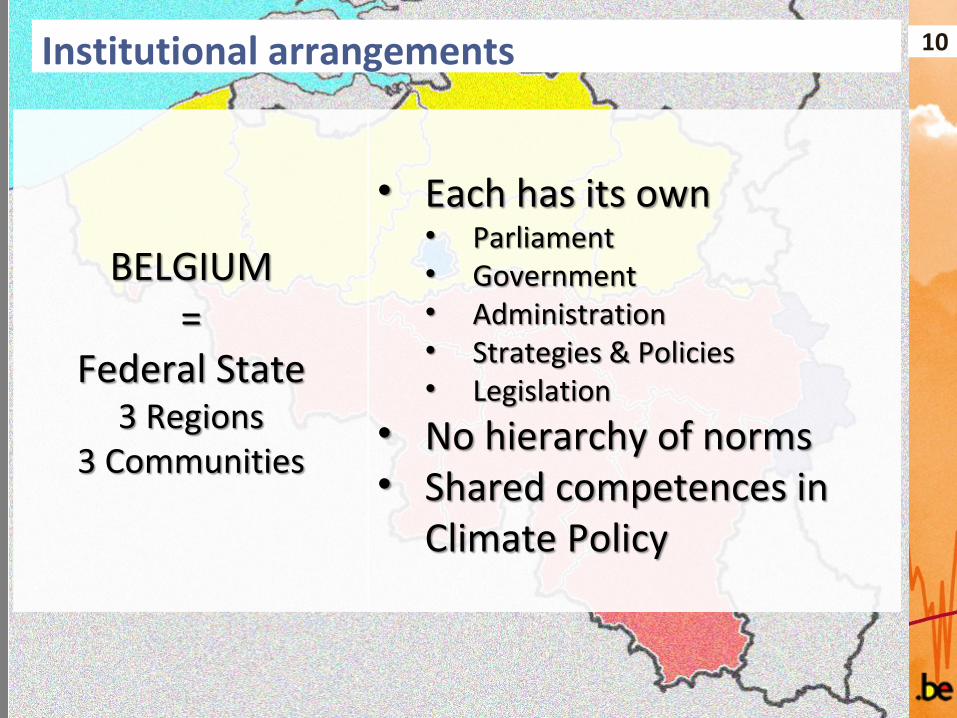
• Each has its own • Parliament• Government• Administration• Strategies & Policies• Legislation
• No hierarchy of norms• Shared competences in
Climate Policy
BELGIUM=
Federal State3 Regions
3 Communities
Institutional arrangements 10

11
“CLIMATE” COMPETENCES (ILLUSTRATIVE)
Federal Regions Communities
Environment + ++ -
Energy ++ ++ -
Transport + ++ -
Land use planning - ++ -
Agriculture - ++ -
Education - - ++
Taxation ++ + -
Research ++ ++ ++
Foreign Affairs ++ + +
…

Organization of climate policy 12
• Strategies, plans, policies & measures:
- Prepared, adopted and implemented by regional and federal authorities
- Coordination through cooperation agreements
• National Climate Commission (since 2002) :
- National Climate Plan (preparation, approval, evaluation and update)
- Common methodologies (impact assessments, projections)
- Reporting obligations (Inventories, Nat. Coms & BRs, EU Monitoring Mechanism), Exchange of information, etc,)

Recent Developments 13
National burden sharing 2013-2020
National climate and energy plan 2030

Recent developments:
National burden sharing 2013-202014
• political agreement (December 2015)• enforced by a (legally binding) cooperation agreement (October 2016)• incl. provisions regarding Monitoring, Reporting & “compliance” (annual)
2020 target BEL FlemishRegion
WalloonRegion
Brussels CapitalRegion
Federal
Non-ETS (vs 2005) -15% -15,7% -14,7% -8,8% PAMs(15250+7000 kton CO2-eq)
RESTotalTransport
13% 4224 Mtoe10%
2,156 MtoePAMs
1,277 MtoePAMs
0,073 MtoePAMs
0,718 Mtoe10%
Auctioning revenuesActual Through 2020
1st 326 M€Further
53%52,76%
30%30,65%
7%7,54%
10%9,05%
International climate finance
50 M€/year 14,5 M€ 8,25 M€ 2,25 M€ 25 M€

National Burden Sharing 2013-2020 15
Flemish Region (-15,7%)
Walloon Region (-14,7%)
Brussels Region (-8,8%)
PAM FED add (7000 kt)
0
10
20
30
40
50
60
70
80
2013 2014 2015 2016 2017 2018 2019 2020
Mt
CO
2-e
q
Flemish Region
Walloon Region
Brussels Region
Federal
ETS auctioning revenues share
Flemish Region2.156
Walloon Region1.277
Brussels Region0.073
Federal0.718
Renewable Energy (Mtoe)
Flemish Region
14.5
Walloon Region
8.25
Brussels Region
2.25
Federal25
International finance (M€/yr)

Examples of key policies and measures 16
• Off-shore wind energy
• Different supports schemes for wind, solar, biomass energy production
• Biofuel incorporation in transport fuels
Renewableenergy
• Different support schemes for energy savings in existing buildings
• EU Directive on Energy Performance of Buildings (new-built)
Buildings
• Distance-based road charging system for heavy goods vehicles
• Investments in public transport & cycling infrastructure
• Free public transport for commuters
Transport
• Industry: sectoral agreements
• Agriculture: manure management policy (pig farming)Others
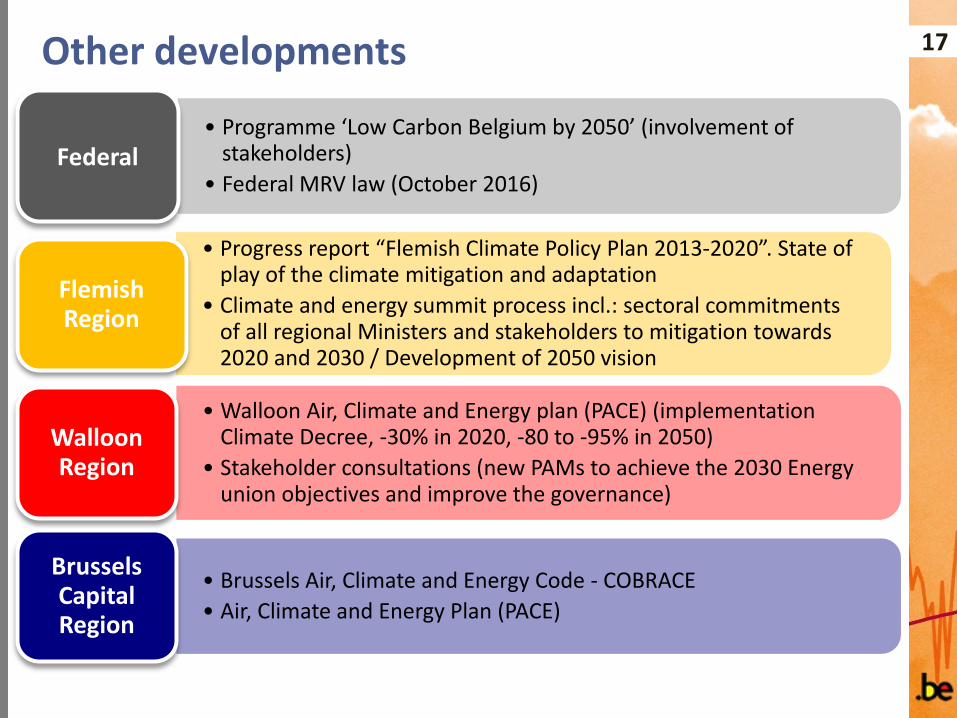
Other developments 17
• Programme ‘Low Carbon Belgium by 2050’ (involvement of stakeholders)
• Federal MRV law (October 2016)Federal
• Progress report “Flemish Climate Policy Plan 2013-2020”. State of play of the climate mitigation and adaptation
• Climate and energy summit process incl.: sectoral commitmentsof all regional Ministers and stakeholders to mitigation towards2020 and 2030 / Development of 2050 vision
Flemish Region
• Walloon Air, Climate and Energy plan (PACE) (implementation Climate Decree, -30% in 2020, -80 to -95% in 2050)
• Stakeholder consultations (new PAMs to achieve the 2030 Energy union objectives and improve the governance)
Walloon Region
• Brussels Air, Climate and Energy Code - COBRACE
• Air, Climate and Energy Plan (PACE)
Brussels Capital Region

Recent developments:
National Energy and Climate Plan
18
• Key element of EU Energy Union governance• High-level strategic planning document, including overarching strategy
covering five dimensions:o Energy security, solidarity and trusto Integrated energy marketo Energy efficiencyo Decarbonising the economyo Research, innovation and competiveness
• 2021-2030, with a perspective to 2050

THANK YOU

20MRV arrangements for PAMs
- PAMS monitored and impact evaluated by each authority
- Results are exchanged and compiled (National Climate Commission)
- Methodologies vary depending of the type of policies, the sector, the target, the availability of data, etc. (harmonized to the extent possible)
- Evaluation of emission reductions not possible for all types of measures ( estimate the global impact of clusters of measures)
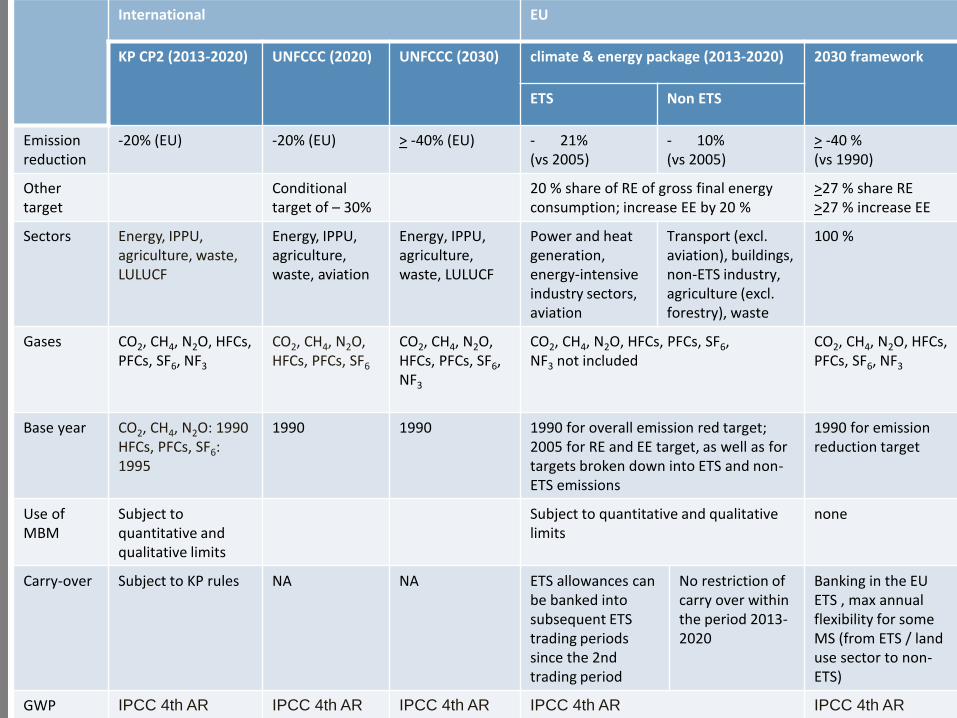
21International EU
KP CP2 (2013-2020) UNFCCC (2020) UNFCCC (2030) climate & energy package (2013-2020) 2030 framework
ETS Non ETS
Emission reduction
-20% (EU) -20% (EU) > -40% (EU) - 21% (vs 2005)
- 10% (vs 2005)
> -40 % (vs 1990)
Othertarget
Conditional target of – 30%
20 % share of RE of gross final energy consumption; increase EE by 20 %
>27 % share RE>27 % increase EE
Sectors Energy, IPPU, agriculture, waste, LULUCF
Energy, IPPU, agriculture, waste, aviation
Energy, IPPU, agriculture, waste, LULUCF
Power and heat generation, energy-intensive industry sectors, aviation
Transport (excl. aviation), buildings, non-ETS industry, agriculture (excl. forestry), waste
100 %
Gases CO2, CH4, N2O, HFCs, PFCs, SF6, NF3
CO2, CH4, N2O, HFCs, PFCs, SF6
CO2, CH4, N2O, HFCs, PFCs, SF6, NF3
CO2, CH4, N2O, HFCs, PFCs, SF6,NF3 not included
CO2, CH4, N2O, HFCs, PFCs, SF6, NF3
Base year CO2, CH4, N2O: 1990 HFCs, PFCs, SF6: 1995
1990 1990 1990 for overall emission red target; 2005 for RE and EE target, as well as for targets broken down into ETS and non-ETS emissions
1990 for emission reduction target
Use of MBM
Subject to quantitative and qualitative limits
Subject to quantitative and qualitative limits
none
Carry-over Subject to KP rules NA NA ETS allowances can be banked into subsequent ETS trading periods since the 2nd trading period
No restriction of carry over within the period 2013-2020
Banking in the EU ETS , max annual flexibility for some MS (from ETS / land use sector to non-ETS)
GWP IPCC 4th AR IPCC 4th AR IPCC 4th AR IPCC 4th AR IPCC 4th AR