DRAFT ASSET MANAGEMENT PLAN 2015/16 SUMMARY OF PLANS
47
DRAFT ASSET MANAGEMENT PLAN 2015/16 SUMMARY OF PLANS
Transcript of DRAFT ASSET MANAGEMENT PLAN 2015/16 SUMMARY OF PLANS
DRAFT ASSET MANAGEMENT PLAN 2015/16 SUMMARY OF PLANS

Asset Management Plan Summary │2
Document Control
Document ID: 59_04_070905_lgasa_iamp template v11
Rev No Date Revision Details Author Reviewer Approver
1 March 2010 Version 1 Paul Alberton Paul Alberton Peter Oye
2 March 2011 Version 2 Paul Alberton Paul Alberton Peter Oye
3 April 2013 Version 3 Paul Alberton Paul Alberton Mal Hemmerling
4 February 2015 Version 4 Ashley Curtis Paul Alberton Mal Hemmerling
Asset Management Plan 2015-16
Date:
Endorsed by:
Produced by City of Playford
12 Bishopstone Road
Davoren Park SA 5112
For further contact
(08) 8256 0333 or visit www.playford.sa.gov.au
© Images and content. City of Playford
© Copyright 2012 – All rights reserved.
The Institute of Public Works Engineering Australia.
www.ipwea.org.au/namsplus
Asset Management Plan Summary │3
TABLE OF CONTENTS
1. EXECUTIVE SUMMARY ................................................................................................................. 5
What Council Provides ................................................................................................................. 5
Asset Based Services Provided by Council ................................................................................... 5
What does it Cost? ....................................................................................................................... 5
Plans for the Future ...................................................................................................................... 6
Measuring our Performance ........................................................................................................ 6
Confidence Levels ......................................................................................................................... 6
The Next Steps .............................................................................................................................. 6
Growth .......................................................................................................................................... 7
What is an Asset Management Plan? ......................................................................................... 7
2. INTRODUCTION ............................................................................................................................ 8
2.1 Background ........................................................................................................................... 8
2.2 Stewardship ........................................................................................................................ 10
2.3 Plan Framework ................................................................................................................. 10
2.4 Core and Advanced Asset Management ........................................................................... 10
2.5 Community Consultation ................................................................................................... 10
3. LEVELS OF SERVICE .................................................................................................................... 11
3.1 Customer Research and Expectations .............................................................................. 11
3.2 Strategic and Corporate Goals .......................................................................................... 13
3.3 Legislative Requirements ................................................................................................... 13
3.4 Current Levels of Service ................................................................................................... 14
3.5 Desired Levels of Service ................................................................................................... 15
4. FUTURE DEMAND ...................................................................................................................... 16
4.1 Demand Drivers .................................................................................................................. 16
4.2 Demand Forecast ............................................................................................................... 16
4.3 Demand Impact on Assets ................................................................................................. 16
4.4 Demand Management Plan ............................................................................................... 17
4.5 Asset Programs to meet Demand ..................................................................................... 17
5. LIFECYCLE MANAGEMENT PLAN ............................................................................................... 18
5.1 Background Data ................................................................................................................ 18
5.2 Risk Management Plan ...................................................................................................... 19
5.3 Routine Operations and Maintenance Plan...................................................................... 20
5.4 Renewal / Replacement Plan ............................................................................................. 22
5.5 Creation/ Acquisition / Upgrade Plan ............................................................................... 25
5.6 Disposal Plan....................................................................................................................... 26
6. FINANCIAL SUMMARY ............................................................................................................... 27
6.1 Financial Statements and Projections ............................................................................... 28
6.2 Funding Strategy ................................................................................................................ 32
6.3 Valuation Forecasts ............................................................................................................ 32
6.4 Key Assumptions made in Financial Forecasts ................................................................. 33
6.5 Forecast Reliability and Confidence................................................................................... 34
Asset Management Plan Summary │4
7. PLAN IMPROVEMENT AND MONITORING................................................................................ 36
7.1 Improvement Program ...................................................................................................... 36
7.3 Monitoring and Review Procedures ................................................................................. 39
7.4 Performance Measures ..................................................................................................... 39
8. REFERENCES ............................................................................................................................... 40
9. APPENDICES ............................................................................................................................... 41
Appendix A ABBREVIATIONS ............................................................................................... 42
Appendix B GLOSSARY ........................................................................................................ 43
Asset Management Plan Summary │5
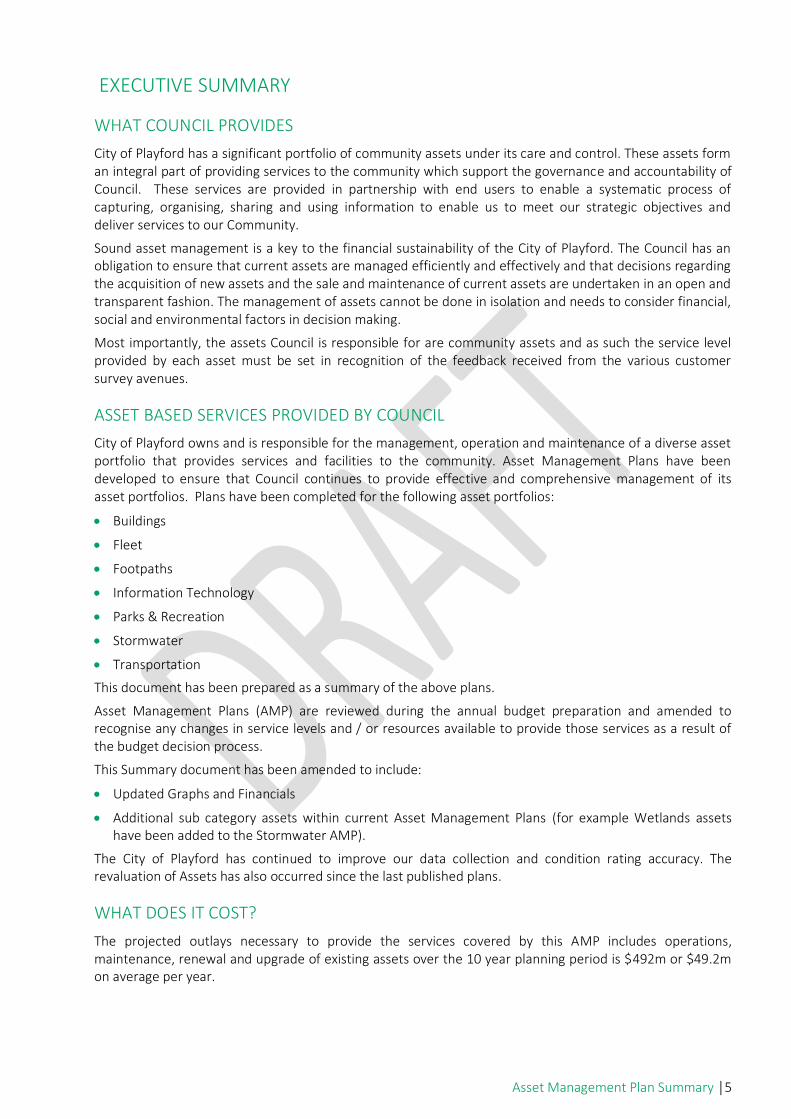
EXECUTIVE SUMMARY
WHAT COUNCIL PROVIDES
City of Playford has a significant portfolio of community assets under its care and control. These assets form an integral part of providing services to the community which support the governance and accountability of Council. These services are provided in partnership with end users to enable a systematic process of capturing, organising, sharing and using information to enable us to meet our strategic objectives and deliver services to our Community.
Sound asset management is a key to the financial sustainability of the City of Playford. The Council has an obligation to ensure that current assets are managed efficiently and effectively and that decisions regarding the acquisition of new assets and the sale and maintenance of current assets are undertaken in an open and transparent fashion. The management of assets cannot be done in isolation and needs to consider financial, social and environmental factors in decision making.
Most importantly, the assets Council is responsible for are community assets and as such the service level provided by each asset must be set in recognition of the feedback received from the various customer survey avenues.
ASSET BASED SERVICES PROVIDED BY COUNCIL
City of Playford owns and is responsible for the management, operation and maintenance of a diverse asset portfolio that provides services and facilities to the community. Asset Management Plans have been developed to ensure that Council continues to provide effective and comprehensive management of its asset portfolios. Plans have been completed for the following asset portfolios:
Buildings
Fleet
Footpaths
Information Technology
Parks & Recreation
Stormwater
Transportation
This document has been prepared as a summary of the above plans.
Asset Management Plans (AMP) are reviewed during the annual budget preparation and amended to recognise any changes in service levels and / or resources available to provide those services as a result of the budget decision process.
This Summary document has been amended to include:
Updated Graphs and Financials
Additional sub category assets within current Asset Management Plans (for example Wetlands assets have been added to the Stormwater AMP).
The City of Playford has continued to improve our data collection and condition rating accuracy. The revaluation of Assets has also occurred since the last published plans.
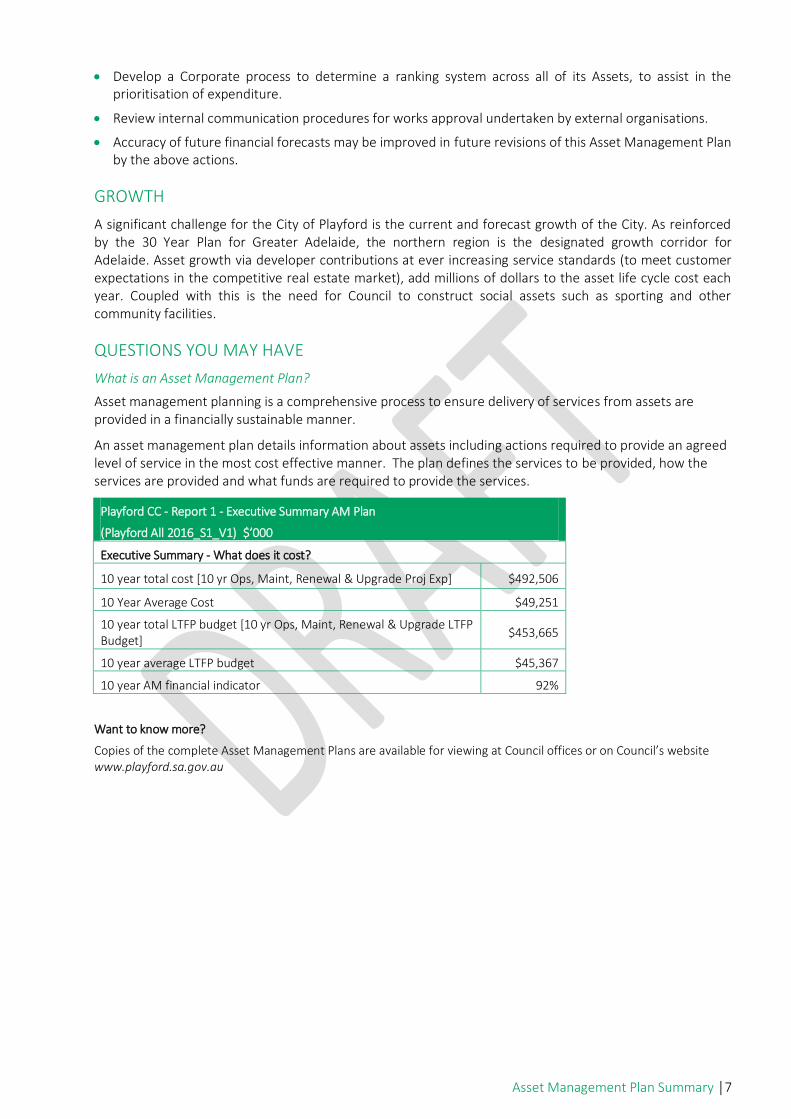
WHAT DOES IT COST?
The projected outlays necessary to provide the services covered by this AMP includes operations, maintenance, renewal and upgrade of existing assets over the 10 year planning period is $492m or $49.2m on average per year.

Asset Management Plan Summary │6
PLANS FOR THE FUTURE
City of Playford plans to operate and maintain the assets network to achieve the following strategic objectives.
1. Ensure the assets network is maintained at a safe and functional standard as set out in this Asset Management Plan
2. Provide rapid response to assets problems
3. Comply with Disability & Discrimination Act (DDA)
4. Reduce the level of risk exposure to Council and ensure the network compliments Council’s strategies
5. Meet community expectations in a financially sustainable manner via improved risk management, legislative compliance and management processes
6. Prompt wider community participation and engagement in local community activities.
MEASURING OUR PERFORMANCE
Quality
Assets will be maintained in a reasonably usable condition. Defects found or reported that are outside our service standard will be repaired. Maintenance response service levels are in the detailed plans.
Function
Assets will be managed to function at a required service level. Our intent is that an appropriate Asset Management System is maintained to facilitate this.
The main consequence of the service function of our assets is the sustainable provision of built assets that contribute to community wellbeing.
Safety
We monitor all Assets and prioritise and repair defects in accordance with our inspection schedule to ensure they are safe and fully operational.
CONFIDENCE LEVELS
This AMP is based on medium level of confidence information.
THE NEXT STEPS
This actions resulting from this Asset Management Plan are:
Review data management quality procedures.
Maintain Geographic Information System data regarding assets.
Develop criteria for risk treatment.
Assess asset capacity and condition rating.
Communicate public responsibilities with respect to environmental care.
Research international best practice.
Develop processes that inspect and condition assess assets on a regular basis.
Develop processes for capturing new and disposed assets, to ensure they are recorded into the asset register.
Investigate maintenance and operating costs at an asset level.
Move towards service driven asset management using a ‘bottom up’ approach for gathering asset information for individual assets to support the optimisation of activities and programs to meet agreed community service levels.
Conduct revaluations of Assets and develop the migration of the information into the asset register
Asset Management Plan Summary │7
Develop a Corporate process to determine a ranking system across all of its Assets, to assist in the prioritisation of expenditure.
Review internal communication procedures for works approval undertaken by external organisations.
Accuracy of future financial forecasts may be improved in future revisions of this Asset Management Plan by the above actions.
GROWTH
A significant challenge for the City of Playford is the current and forecast growth of the City. As reinforced by the 30 Year Plan for Greater Adelaide, the northern region is the designated growth corridor for Adelaide. Asset growth via developer contributions at ever increasing service standards (to meet customer expectations in the competitive real estate market), add millions of dollars to the asset life cycle cost each year. Coupled with this is the need for Council to construct social assets such as sporting and other community facilities.
QUESTIONS YOU MAY HAVE
What is an Asset Management Plan?
Asset management planning is a comprehensive process to ensure delivery of services from assets are provided in a financially sustainable manner.
An asset management plan details information about assets including actions required to provide an agreed level of service in the most cost effective manner. The plan defines the services to be provided, how the services are provided and what funds are required to provide the services.
Playford CC - Report 1 - Executive Summary AM Plan
(Playford All 2016_S1_V1) $’000
Executive Summary - What does it cost?
10 year total cost [10 yr Ops, Maint, Renewal & Upgrade Proj Exp] $492,506
10 Year Average Cost $49,251
10 year total LTFP budget [10 yr Ops, Maint, Renewal & Upgrade LTFP Budget]
$453,665
10 year average LTFP budget $45,367
10 year AM financial indicator 92%
Want to know more?
Copies of the complete Asset Management Plans are available for viewing at Council offices or on Council’s website www.playford.sa.gov.au
Asset Management Plan Summary │8
2. INTRODUCTION
2.1. BACKGROUND
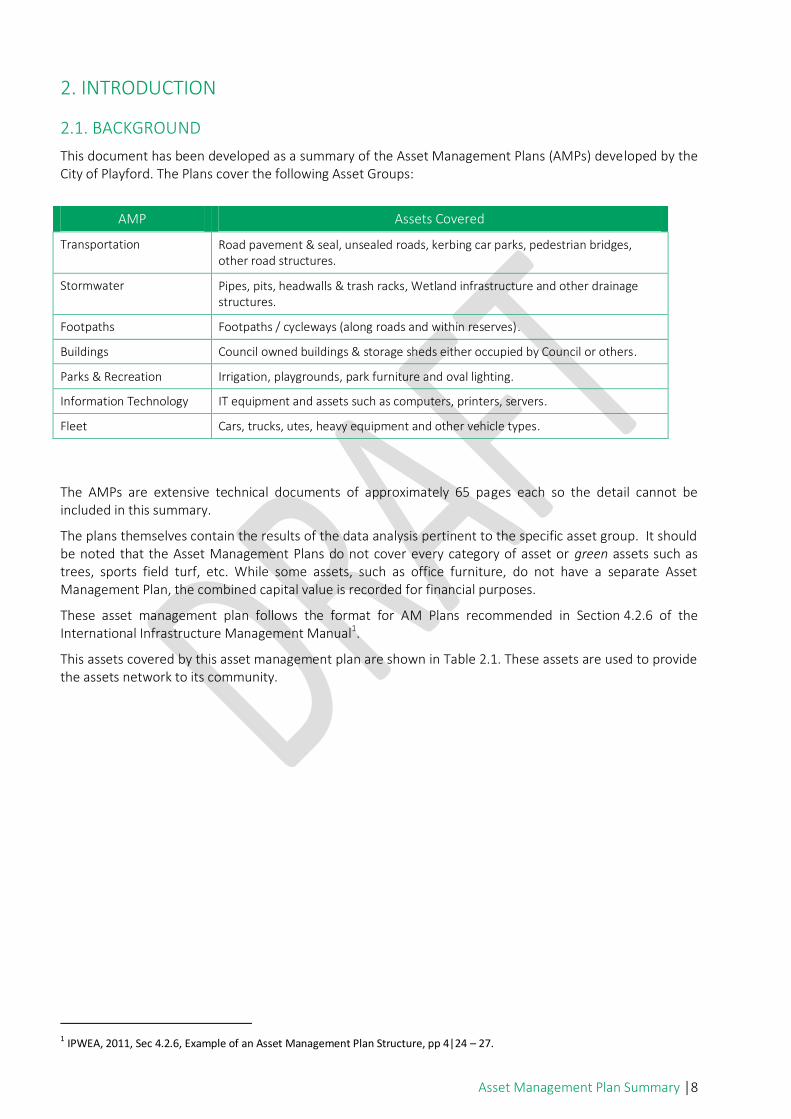
This document has been developed as a summary of the Asset Management Plans (AMPs) developed by the City of Playford. The Plans cover the following Asset Groups:
The AMPs are extensive technical documents of approximately 65 pages each so the detail cannot be included in this summary.
The plans themselves contain the results of the data analysis pertinent to the specific asset group. It should be noted that the Asset Management Plans do not cover every category of asset or green assets such as trees, sports field turf, etc. While some assets, such as office furniture, do not have a separate Asset Management Plan, the combined capital value is recorded for financial purposes.
These asset management plan follows the format for AM Plans recommended in Section 4.2.6 of the International Infrastructure Management Manual1.
This assets covered by this asset management plan are shown in Table 2.1. These assets are used to provide the assets network to its community.
1 IPWEA, 2011, Sec 4.2.6, Example of an Asset Management Plan Structure, pp 4|24 – 27.
AMP Assets Covered
Transportation Road pavement & seal, unsealed roads, kerbing car parks, pedestrian bridges, other road structures.
Stormwater Pipes, pits, headwalls & trash racks, Wetland infrastructure and other drainage structures.
Footpaths Footpaths / cycleways (along roads and within reserves).
Buildings Council owned buildings & storage sheds either occupied by Council or others.
Parks & Recreation Irrigation, playgrounds, park furniture and oval lighting.
Information Technology IT equipment and assets such as computers, printers, servers.
Fleet Cars, trucks, utes, heavy equipment and other vehicle types.

Asset Management Plan Summary │9
Table 2.1: Assets covered by this Plan
Subcategory Asset Dimension Renewal $
Transportation Car park 86 ea 7,904,530
Kerb 1, 095,727 m 65,321,321
Structures 655 ea 17,591,197
Sealed Road 5,841,260 m² 145,029,190
Unsealed Road 448,384 m² 4,246,201
Stormwater Pipes 441,369 m 103,907,753
Pits 11,524 ea 24,260,807
Other Capture 987 ea 9,373,798
Water Delivery 799 ea 13,125,974
Footpaths Footpaths 922,613 m² 73,653,449
Other 27 ea 122,234
Buildings Community 44 ea 36,902,171
Corporate 38 ea 34,092,937
Other 47 ea 1,389,899
Public Toilet 18 ea 1,819,000
Sporting 47 ea 57,519,391
Parks & Recreation Irrigation 1,369,576 m² 17,081,659
Playground 76 ea 4,530,676
Other Structures 1,795 ea 16,504,696
Information Technology 1,370 ea 4,291,903
Fleet Vehicles 167 ea 12,031,068
Trailers 58 ea 643,953
Plant 65 ea 579,302
These assets have a renewal value of $651,923,109.
Assumptions
This Plan is based on current service level and indexed 2013/2014 dollars. It does not take into consideration any new equipment or systems that may be implemented over the coming year.
Key stakeholders in the preparation and implementation of this are:
Assets & Project Management Governance and Asset Management Strategies
Councillors/Board Members Represent needs of community/shareholders.
Allocate resources to meet the organisation’s objectives in providing services while managing risks.
Ensure organisation is financially sustainable.
CEO/General Manager Manage organisation operational activities and future planning strategic direction.
Operational Teams Design, documentations, capital work projects.
Operational and service levels, data information and analysis.
Finance Team Long Term Financial Plans and operational financial data.
Community & Ratepayers End user of services.
Asset Management Plan Summary │10
2.2. STEWARDSHIP
A principal role of Council is the provision of services to its community. Some of these services are provided by assets. Council’s goal in managing assets is to meet the required level of service in the most cost effective manner for present and future consumers.
The objective of the Asset Management Plans (AMPs) is to enable responsible management of assets (and services provided from assets), compliance with regulatory requirements, and to communicate funding required to provide required levels of service for the lowest whole of life cost.
The key elements of asset management are:
Taking a total life cycle approach.
Developing cost effective management strategies for the long term.
Providing a defined level of service and monitoring performance.
Understanding and meeting the demands of growth through demand management and asset investment.
Managing risks associated with asset failures.
Sustainable use of physical resources.
Continuous improvement in asset management practices.
The asset management plan is to be read in conjunction with the organisation’s other strategic documents as follows:
Strategic Plan Delivery Program 2015/16 – 2018/19 (inclusive of 2015/16 Annual Business Plan and Budget)
Strategic Plan
Long Term Financial Plan 2015/16 – 2024/25
Playford Community Vision 2043
2.3. PLAN FRAMEWORK
Key elements of the plan are:
Levels of service – specifies the services and levels of service provided by Council.
Future demand – how this will impact on future service delivery.
Life cycle management – how Council will manage its existing and future assets to provide the required services.
Financial summary – what funds are required to provide the required services.
Asset management practices.
Monitoring – how the plan will be monitored to ensure it meets Council’s objectives.
Asset Management Improvement Plan.
2.4. CORE AND ADVANCED ASSET MANAGEMENT
This Asset Management Plan is prepared as a ‘core’ asset management plan in accordance with the International Infrastructure Management Manual. It is prepared to meet minimum legislative and organisational requirements for sustainable service delivery and long term financial planning and reporting. Core asset management is a ‘top down’ approach where analysis is applied at the ‘system’ or ‘network’ level.
Future revisions of this will move towards ‘advanced’ asset management using a ‘bottom up’ approach for gathering asset information for individual assets to support the optimisation of activities and programs to meet agreed service levels.
2.5. COMMUNITY CONSULTATION
This ‘core’ asset management plan is prepared to facilitate community consultation initially through feedback on public display of the draft AMP prior to adoption by the Council.

Asset Management Plan Summary │11
3. LEVELS OF SERVICE
3.1. CUSTOMER RESEARCH AND EXPECTATIONS
The City of Playford has been undertaking an independent evaluation of Council services through a Resident Satisfaction Survey since 2001.
In 2014, Newfocus Research successfully tendered for this task and was commissioned to undertake the Resident Satisfaction Survey.
Objectives
The broad objectives of the Resident Satisfaction Survey were to:
Aid an understanding of customers’ needs and expectations in order to assist in the design and delivery of Council services
Measure resident perceptions of the City as a place to live
Understand what could be done to improve perceptions and presentation of the City
Evaluate the effectiveness of Council services and programs.
Methodology
Quantitative research among the broad population within suburbs of the City of Playford.
A sample of 600 residents were interviewed by telephone. We interviewed 100 residents in each ward and fieldwork was conducted July and August 2014.
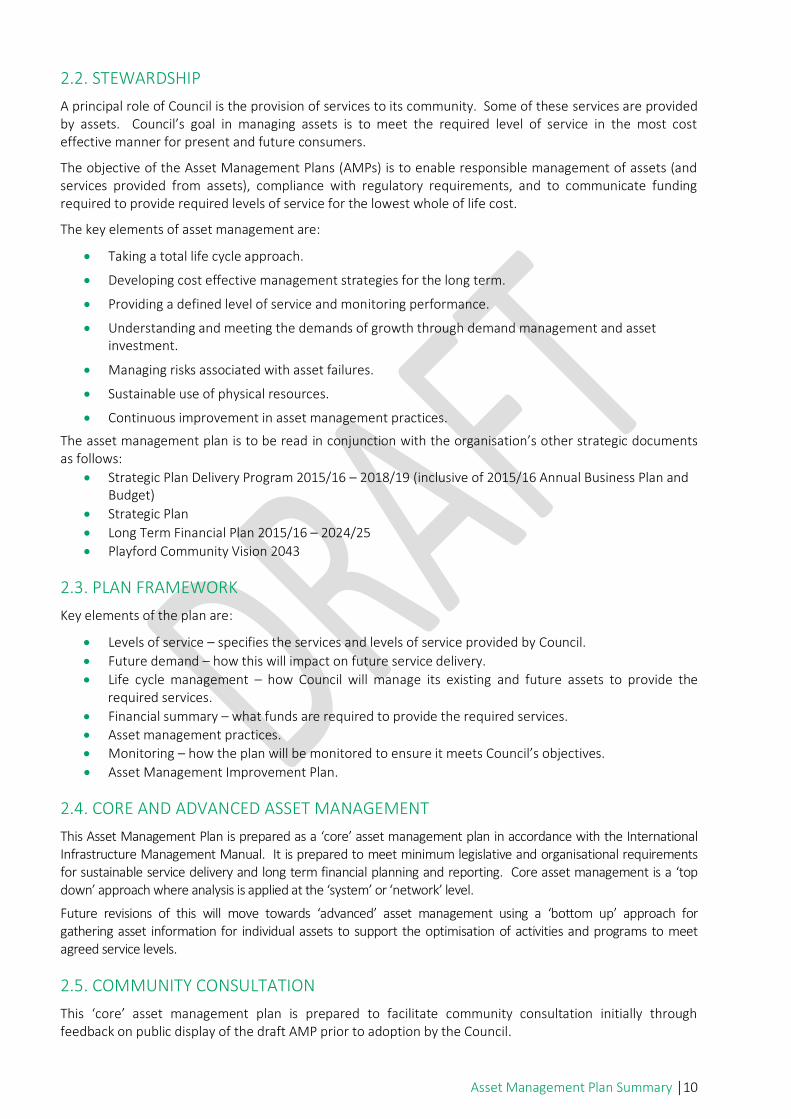
SUMMARY RESULTS:
Council Strategic Goals
The City of Playford Council Plan 2011/12-2014/15 set four goals for the Council, namely:
Community Wellbeing
Environmental Care
Economic Prosperity
Organisational Excellence
The Resident Satisfaction Survey carried out in 2014 evaluated Council’s service delivery for the 2013/14 financial year against these goals. In January 2014, Council endorsed its new Strategic Plan and future Resident Satisfaction Surveys and results will be reported according to the five strategies in that document.
Community Wellbeing
Community Assets Mean score (0-10)
2012 2013 2014
Parks and gardens are well maintained 7.4 7.0 7.4
Playgrounds are well maintained 7.5 7.4 7.6
Recreation & Leisure Mean score (0-10)
2012 2013 2014
The provision and maintenance of bicycle paths is
excellent 6.2 6.2 6.1
Ovals and sporting grounds are well maintained 7.8 7.8 7.9
Council supports a range of local sporting clubs* 7.5 7.2 7.4
Council supports a range of community groups and
programs in Playford* 7.5 7.4 7.4
Asset Management Plan Summary │12
Crime & Safety Mean score (0-10)
2012 2013 2014
Graffiti and vandalism control is effective 6.2 6.5 6.8
Environmental Care
Environment & City Mean score (0-10)
2012 2013 2014
The City of Playford is well presented 6.7 6.7 6.8
Verges are well maintained 6.0 6.1 5.9
The Council is environmentally responsible 7.4 7.2 7.3
Waste Management Mean score (0-10)
2012 2013 2014
The streets are clean 6.8 6.8 6.8
I am satisfied with the kerbside garbage collection service 8.4 8.2 8.3
I am satisfied with the hard waste collection service 7.5 7.4 7.5
City Infrastructure
City Infrastructure Mean score (0-10)
2012 2013 2014
Footpaths are well maintained 5.6 5.6 5.4
The street lighting is adequate 6.6 6.5 6.6
Storm water drainage in your street is adequately maintained 6.7 6.6 6.5
The local streets are well maintained 6.0 5.9 5.8
The rural roads are well maintained 5.6 5.7 5.5
Organisational Excellence
Communications Mean score (0-10)
2012 2013 2014
The Council's goals and vision are clear and communicated to
residents 6.2 6.3 5.7
The Council communicates well with its residents 6.0 6.1 5.5
Government & Strategy Mean score (0-10)
2012 2013 2014
The Council is responsive to community needs 6.2 6.2 5.9
The Council invites residents to participate in decision-making 5.9 5.9 5.4
The Council is open and accountable to the community 6.2 6.3 5.8
The Council provides value for money in return for the rates I
pay each year 5.1 5.5 5.0
The Council plans for the future 6.7 6.7 6.4
Elected Members do their job of representing my views well 5.7 5.8 5.2
Asset Management Plan Summary │13
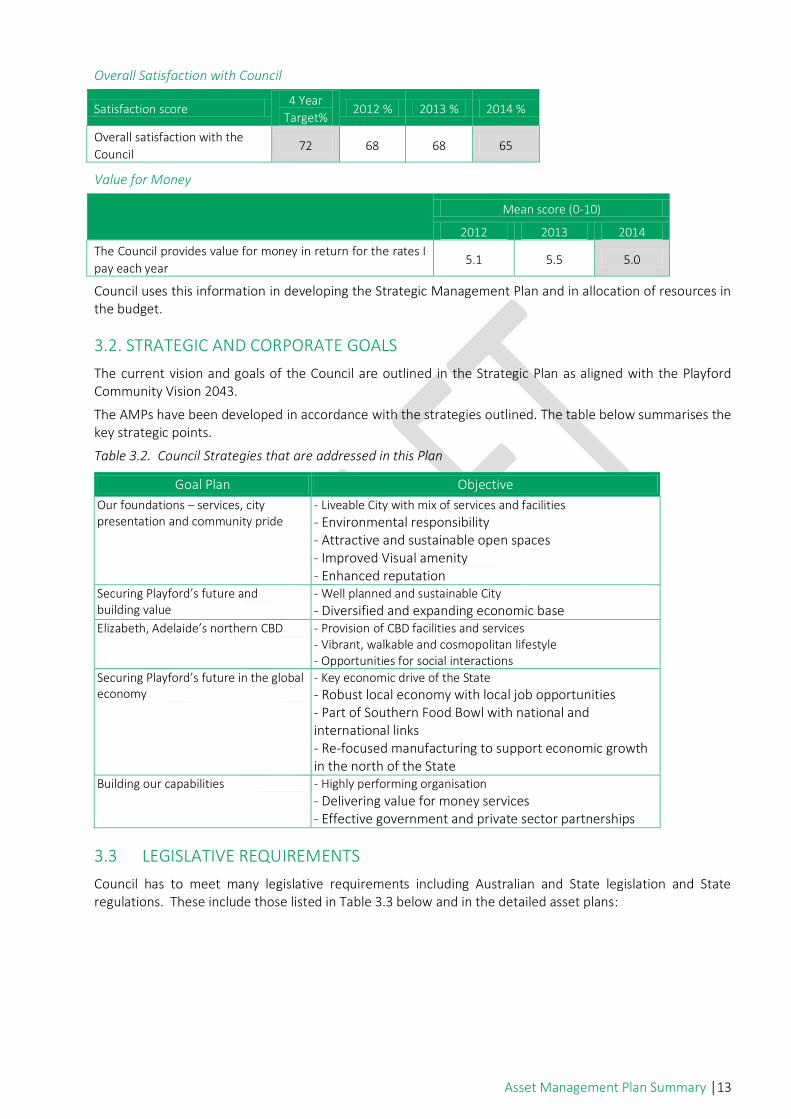
Overall Satisfaction with Council
Satisfaction score 4 Year
Target% 2012 % 2013 % 2014 %
Overall satisfaction with the
Council 72 68 68 65
Value for Money
Mean score (0-10)
2012 2013 2014
The Council provides value for money in return for the rates I
pay each year 5.1 5.5 5.0
Council uses this information in developing the Strategic Management Plan and in allocation of resources in the budget.
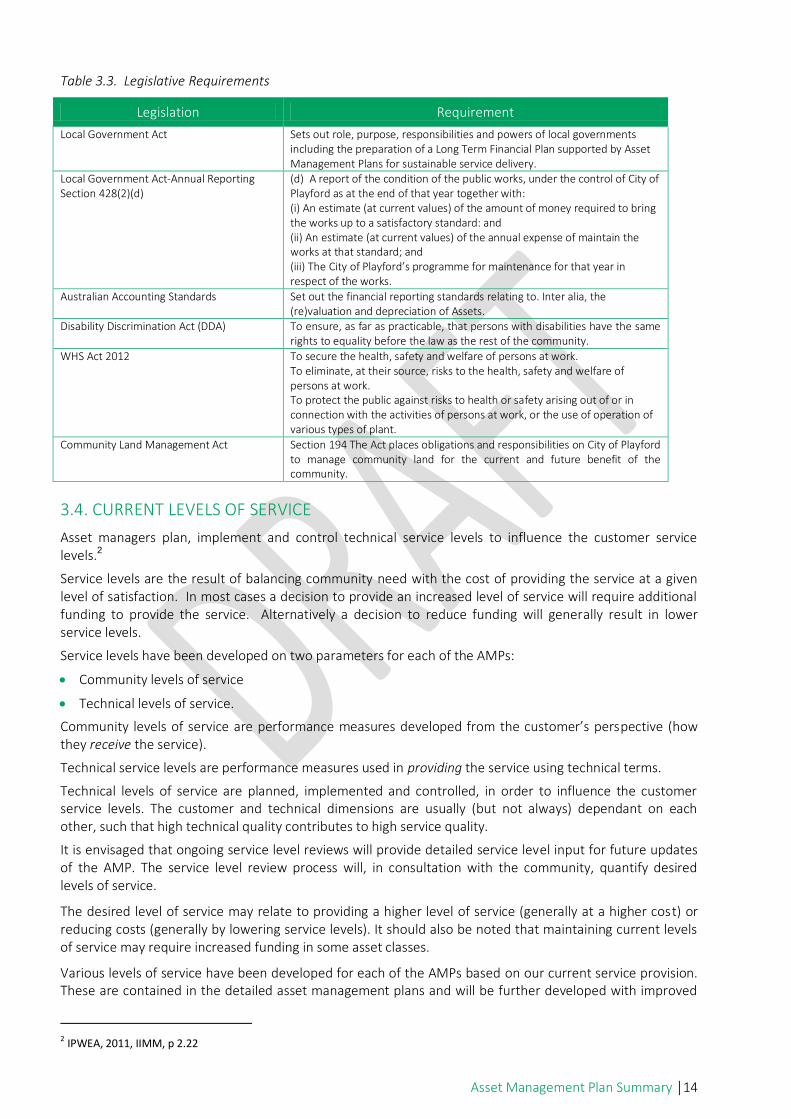
3.2. STRATEGIC AND CORPORATE GOALS
The current vision and goals of the Council are outlined in the Strategic Plan as aligned with the Playford Community Vision 2043.
The AMPs have been developed in accordance with the strategies outlined. The table below summarises the key strategic points.
Table 3.2. Council Strategies that are addressed in this Plan
Goal Plan Objective
Our foundations – services, city presentation and community pride
- Liveable City with mix of services and facilities
- Environmental responsibility - Attractive and sustainable open spaces - Improved Visual amenity - Enhanced reputation
Securing Playford’s future and building value
- Well planned and sustainable City
- Diversified and expanding economic base Elizabeth, Adelaide’s northern CBD - Provision of CBD facilities and services
- Vibrant, walkable and cosmopolitan lifestyle - Opportunities for social interactions
Securing Playford’s future in the global economy
- Key economic drive of the State
- Robust local economy with local job opportunities - Part of Southern Food Bowl with national and international links - Re-focused manufacturing to support economic growth in the north of the State
Building our capabilities - Highly performing organisation
- Delivering value for money services - Effective government and private sector partnerships
3.3 LEGISLATIVE REQUIREMENTS
Council has to meet many legislative requirements including Australian and State legislation and State regulations. These include those listed in Table 3.3 below and in the detailed asset plans:
Asset Management Plan Summary │14
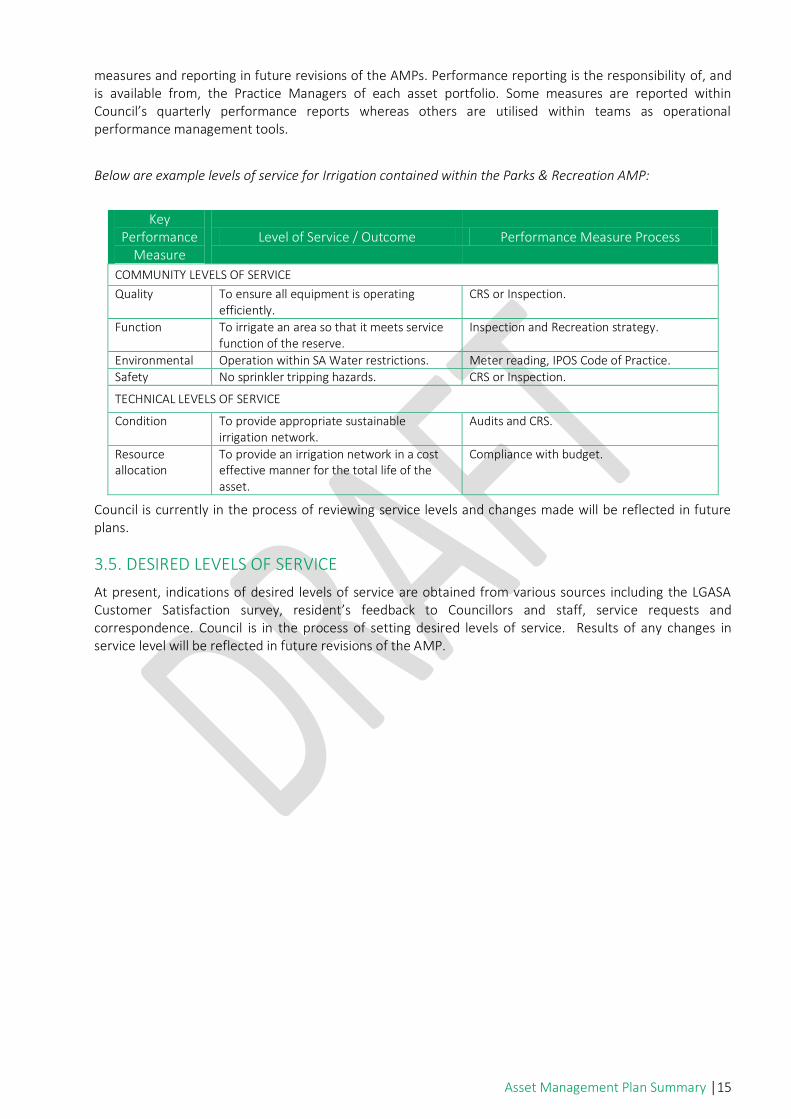
Table 3.3. Legislative Requirements
Legislation Requirement
Local Government Act Sets out role, purpose, responsibilities and powers of local governments including the preparation of a Long Term Financial Plan supported by Asset Management Plans for sustainable service delivery.
Local Government Act-Annual Reporting Section 428(2)(d)
(d) A report of the condition of the public works, under the control of City of Playford as at the end of that year together with: (i) An estimate (at current values) of the amount of money required to bring the works up to a satisfactory standard: and (ii) An estimate (at current values) of the annual expense of maintain the works at that standard; and (iii) The City of Playford’s programme for maintenance for that year in respect of the works.
Australian Accounting Standards Set out the financial reporting standards relating to. Inter alia, the (re)valuation and depreciation of Assets.
Disability Discrimination Act (DDA) To ensure, as far as practicable, that persons with disabilities have the same rights to equality before the law as the rest of the community.
WHS Act 2012 To secure the health, safety and welfare of persons at work. To eliminate, at their source, risks to the health, safety and welfare of persons at work. To protect the public against risks to health or safety arising out of or in connection with the activities of persons at work, or the use of operation of various types of plant.
Community Land Management Act Section 194 The Act places obligations and responsibilities on City of Playford to manage community land for the current and future benefit of the community.
3.4. CURRENT LEVELS OF SERVICE
Asset managers plan, implement and control technical service levels to influence the customer service levels.2
Service levels are the result of balancing community need with the cost of providing the service at a given level of satisfaction. In most cases a decision to provide an increased level of service will require additional funding to provide the service. Alternatively a decision to reduce funding will generally result in lower service levels.
Service levels have been developed on two parameters for each of the AMPs:
Community levels of service
Technical levels of service.
Community levels of service are performance measures developed from the customer’s perspective (how they receive the service).
Technical service levels are performance measures used in providing the service using technical terms.
Technical levels of service are planned, implemented and controlled, in order to influence the customer service levels. The customer and technical dimensions are usually (but not always) dependant on each other, such that high technical quality contributes to high service quality.
It is envisaged that ongoing service level reviews will provide detailed service level input for future updates of the AMP. The service level review process will, in consultation with the community, quantify desired levels of service.
The desired level of service may relate to providing a higher level of service (generally at a higher cost) or reducing costs (generally by lowering service levels). It should also be noted that maintaining current levels of service may require increased funding in some asset classes.
Various levels of service have been developed for each of the AMPs based on our current service provision. These are contained in the detailed asset management plans and will be further developed with improved
2 IPWEA, 2011, IIMM, p 2.22
Asset Management Plan Summary │15
measures and reporting in future revisions of the AMPs. Performance reporting is the responsibility of, and is available from, the Practice Managers of each asset portfolio. Some measures are reported within Council’s quarterly performance reports whereas others are utilised within teams as operational performance management tools.
Below are example levels of service for Irrigation contained within the Parks & Recreation AMP:
Key
Performance Measure
Level of Service / Outcome Performance Measure Process
COMMUNITY LEVELS OF SERVICE
Quality To ensure all equipment is operating efficiently.
CRS or Inspection.
Function To irrigate an area so that it meets service function of the reserve.
Inspection and Recreation strategy.
Environmental Operation within SA Water restrictions. Meter reading, IPOS Code of Practice. Safety No sprinkler tripping hazards. CRS or Inspection.
TECHNICAL LEVELS OF SERVICE
Condition To provide appropriate sustainable irrigation network.
Audits and CRS.
Resource allocation
To provide an irrigation network in a cost effective manner for the total life of the asset.
Compliance with budget.
Council is currently in the process of reviewing service levels and changes made will be reflected in future plans.
3.5. DESIRED LEVELS OF SERVICE
At present, indications of desired levels of service are obtained from various sources including the LGASA Customer Satisfaction survey, resident’s feedback to Councillors and staff, service requests and correspondence. Council is in the process of setting desired levels of service. Results of any changes in service level will be reflected in future revisions of the AMP.
Asset Management Plan Summary │16
4. FUTURE DEMAND
4.1. DEMAND DRIVERS
Drivers affecting demand include, but are not limited to: population change, changes in demographics, seasonal factors, vehicle ownership rates, consumer preferences and expectations, technological changes, economic factors, agricultural practices, and environmental awareness.
4.2. DEMAND FORECAST
Playford continues to experience new residential development, most recently in Andrews Farm, Craigmore, Hillbank and Blakeview. The most significant gains in population are expected in Andrews Farm, Angle Vale, Blakeview, Craigmore, Munno Para, Munno Para West, Munno Para Downs, Virginia, Waterloo Corner, Buckland Park and Smithfield. Elizabeth East and Elizabeth Downs are expected to the most significant population decreases during this period, with both areas expected to have little growth in housing stock. The forecast population growth rates are lower than household growth in most areas as a result of the decreasing number of people per household. The two obvious exceptions to this pattern are Munno Para, Munno Para West, Munno Para Downs, which are expected to have a relatively stable household size as a result of the in-migration of families during this period and Elizabeth where the average household size is already very low and the existing household structure is likely to be maintained.
There is a need to resolve a range of issues to manage the growth in a way that it retains City of Playford as a desirable location in which to live. Such issues include, but are not limited to: land availability, infrastructure, regional facilities, industrial land, employment opportunities, and transport.
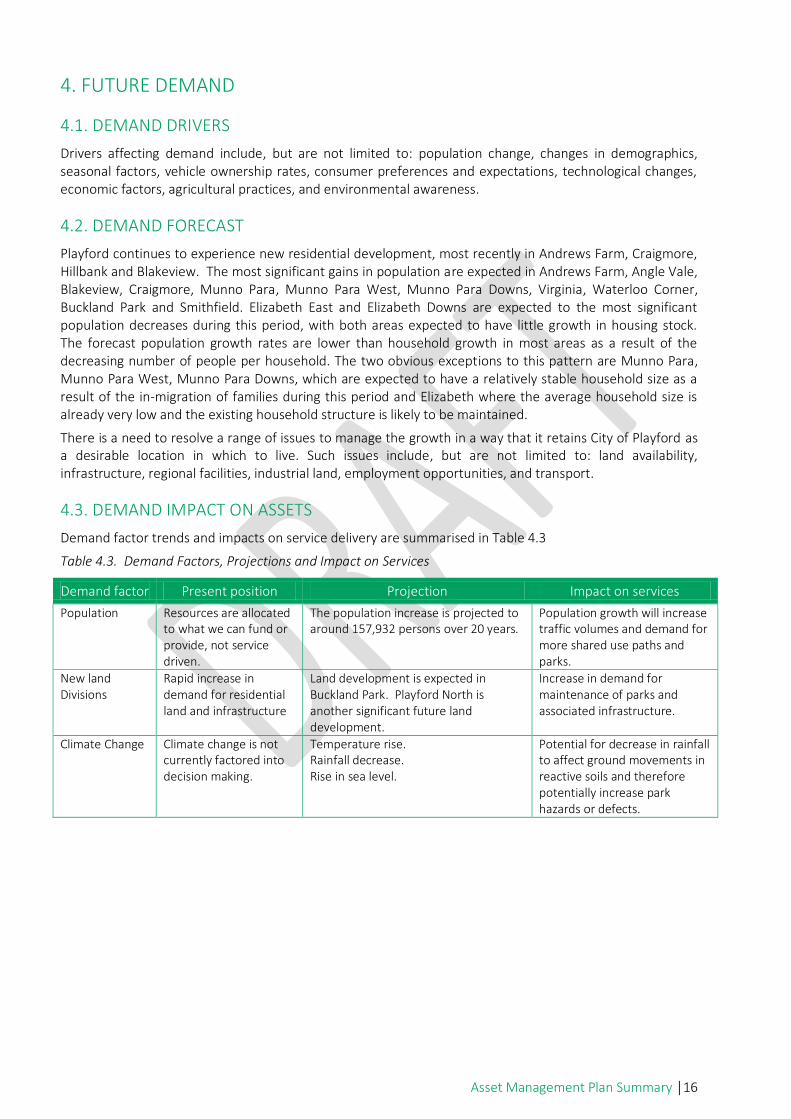
4.3. DEMAND IMPACT ON ASSETS
Demand factor trends and impacts on service delivery are summarised in Table 4.3
Table 4.3. Demand Factors, Projections and Impact on Services
Demand factor Present position Projection Impact on services
Population Resources are allocated to what we can fund or provide, not service driven.
The population increase is projected to around 157,932 persons over 20 years.
Population growth will increase traffic volumes and demand for more shared use paths and parks.
New land Divisions
Rapid increase in demand for residential land and infrastructure
Land development is expected in Buckland Park. Playford North is another significant future land development.
Increase in demand for maintenance of parks and associated infrastructure.
Climate Change Climate change is not currently factored into decision making.
Temperature rise. Rainfall decrease. Rise in sea level.
Potential for decrease in rainfall to affect ground movements in reactive soils and therefore potentially increase park hazards or defects.
Asset Management Plan Summary │17
4.4. DEMAND MANAGEMENT PLAN
Demand for new services will be managed through a combination of managing existing assets, upgrading of existing assets and providing new assets to meet demand and demand management. Demand management practices include non-asset solutions, insuring against risks and managing failures.
Non-asset solutions focus on providing the required service without the need for the organisation to own the assets and management actions including reducing demand for the service, reducing the level of service (allowing some assets to deteriorate beyond current service levels) or educating customers to accept appropriate asset failures3. Examples of non-asset solutions include providing services from existing infrastructure such as aquatic centres and libraries that may be in another community area or public toilets provided in commercial premises.
Opportunities identified to date for demand management are contained in the detailed plans. Further opportunities will be developed in future revisions of this plan.
4.5. ASSET PROGRAMS TO MEET DEMAND
Changes to the size and scope of City of Playford’s Assets network is an ongoing issue that can be driven by changes in work practices, technology, and growth. Acquiring these new assets will commit City of Playford to fund ongoing operations and maintenance costs for the period that the service provided from the assets is required. City of Playford would need to increase annual maintenance budgets to ensure sufficient maintenance funds over the life cycle of all newly created assets.
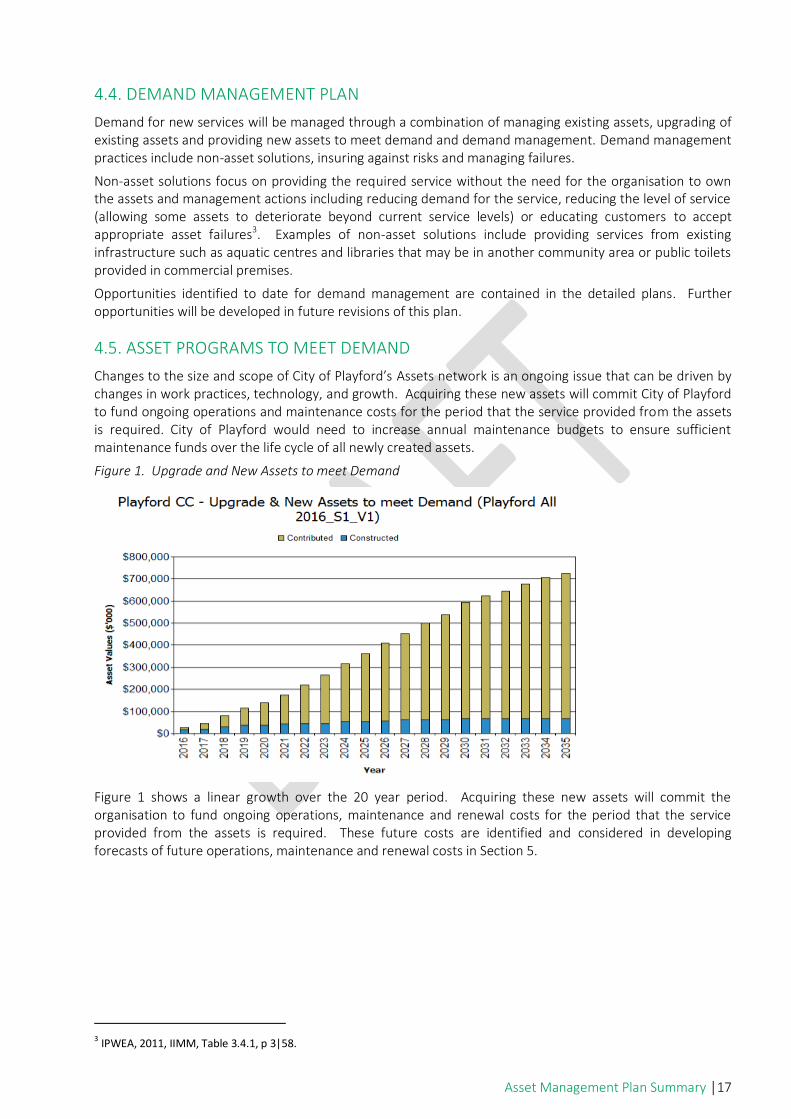
Figure 1. Upgrade and New Assets to meet Demand
Figure 1 shows a linear growth over the 20 year period. Acquiring these new assets will commit the organisation to fund ongoing operations, maintenance and renewal costs for the period that the service provided from the assets is required. These future costs are identified and considered in developing forecasts of future operations, maintenance and renewal costs in Section 5.
3 IPWEA, 2011, IIMM, Table 3.4.1, p 3|58.
Asset Management Plan Summary │18
5. LIFECYCLE MANAGEMENT PLAN
The Lifecycle Management Plan details how Council plans to manage and operate the assets at the agreed levels of service (defined in Section 3) while optimising life cycle costs.
5.1. BACKGROUND DATA
This data covers currently owned assets. Many of City of Playford’s Assets are nearing the end of their useful life. Therefore careful monitoring of those assets with low condition rating at a detailed component level is necessary to manage appropriate service provision and associated risk.
5.1.1. PHYSICAL PARAMETERS
The Council owned assets covered by this are shown in Table 2.1.
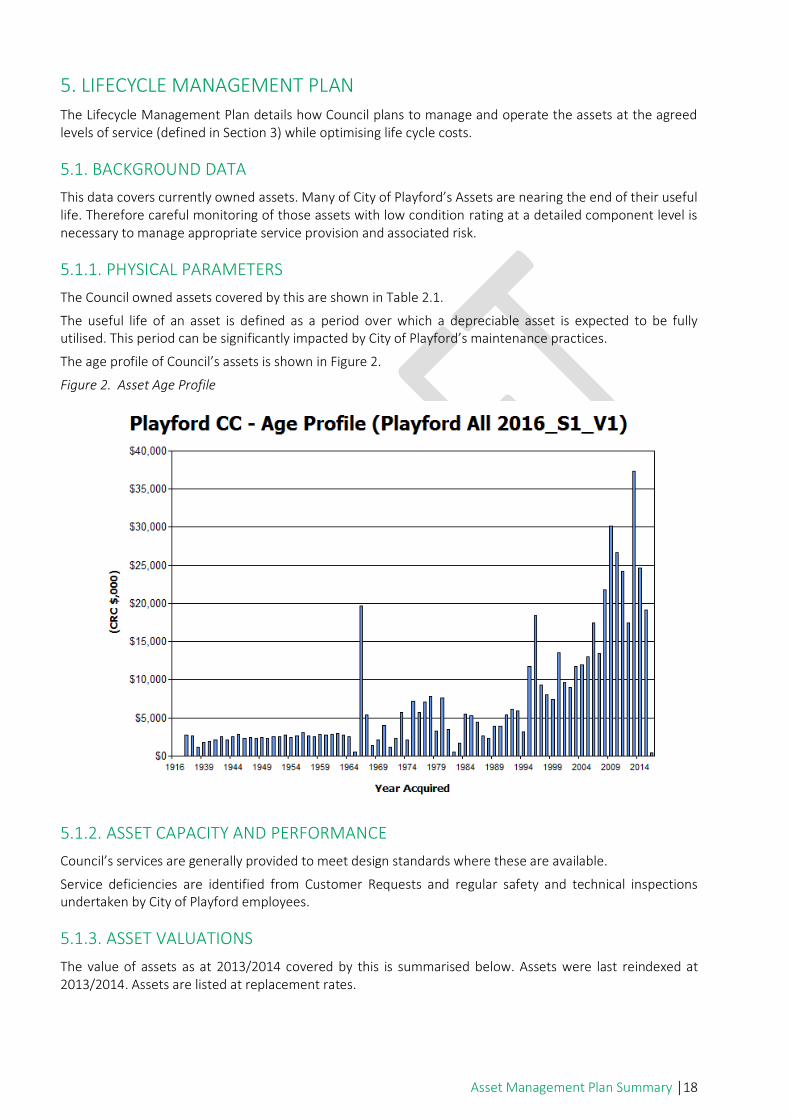
The useful life of an asset is defined as a period over which a depreciable asset is expected to be fully utilised. This period can be significantly impacted by City of Playford’s maintenance practices.
The age profile of Council’s assets is shown in Figure 2.
Figure 2. Asset Age Profile
5.1.2. ASSET CAPACITY AND PERFORMANCE
Council’s services are generally provided to meet design standards where these are available.
Service deficiencies are identified from Customer Requests and regular safety and technical inspections undertaken by City of Playford employees.
5.1.3. ASSET VALUATIONS
The value of assets as at 2013/2014 covered by this is summarised below. Assets were last reindexed at 2013/2014. Assets are listed at replacement rates.
Asset Management Plan Summary │19
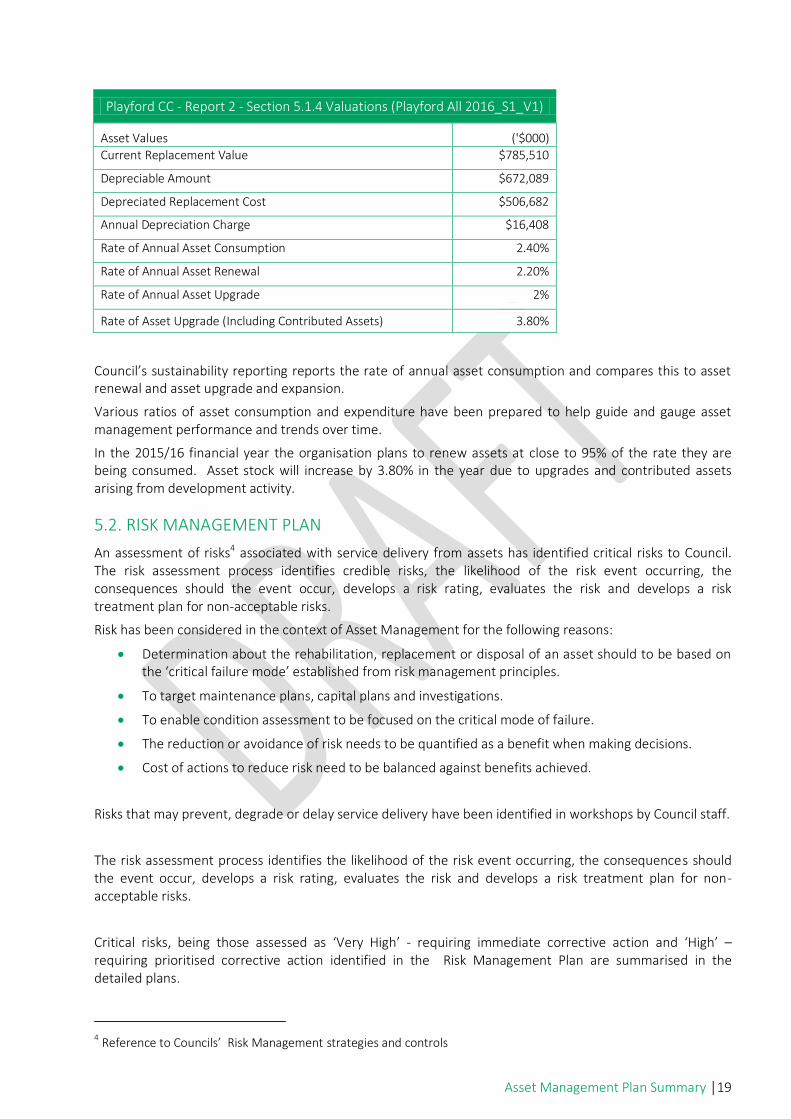
Playford CC - Report 2 - Section 5.1.4 Valuations (Playford All 2016_S1_V1)
Asset Values ('$000) Current Replacement Value $785,510
Depreciable Amount $672,089
Depreciated Replacement Cost $506,682
Annual Depreciation Charge $16,408
Rate of Annual Asset Consumption 2.40%
Rate of Annual Asset Renewal 2.20%
Rate of Annual Asset Upgrade 2%
Rate of Asset Upgrade (Including Contributed Assets) 3.80%
Council’s sustainability reporting reports the rate of annual asset consumption and compares this to asset renewal and asset upgrade and expansion.
Various ratios of asset consumption and expenditure have been prepared to help guide and gauge asset management performance and trends over time.
In the 2015/16 financial year the organisation plans to renew assets at close to 95% of the rate they are being consumed. Asset stock will increase by 3.80% in the year due to upgrades and contributed assets arising from development activity.
5.2. RISK MANAGEMENT PLAN
An assessment of risks4 associated with service delivery from assets has identified critical risks to Council. The risk assessment process identifies credible risks, the likelihood of the risk event occurring, the consequences should the event occur, develops a risk rating, evaluates the risk and develops a risk treatment plan for non-acceptable risks.
Risk has been considered in the context of Asset Management for the following reasons:
Determination about the rehabilitation, replacement or disposal of an asset should to be based on the ‘critical failure mode’ established from risk management principles.
To target maintenance plans, capital plans and investigations.
To enable condition assessment to be focused on the critical mode of failure.
The reduction or avoidance of risk needs to be quantified as a benefit when making decisions.
Cost of actions to reduce risk need to be balanced against benefits achieved.
Risks that may prevent, degrade or delay service delivery have been identified in workshops by Council staff.
The risk assessment process identifies the likelihood of the risk event occurring, the consequences should the event occur, develops a risk rating, evaluates the risk and develops a risk treatment plan for non-acceptable risks.
Critical risks, being those assessed as ‘Very High’ - requiring immediate corrective action and ‘High’ – requiring prioritised corrective action identified in the Risk Management Plan are summarised in the detailed plans.
4 Reference to Councils’ Risk Management strategies and controls
Asset Management Plan Summary │20
5.3. ROUTINE OPERATIONS AND MAINTENANCE PLAN
Routine maintenance is the regular ongoing work that is necessary to keep assets operating, including instances where portions of the asset fail and need immediate repair to make the asset operational again.
5.3.1. OPERATIONS AND MAINTENANCE PLAN
Operations activities affect service levels including quality and function through street sweeping and grass mowing frequency, intensity and spacing of street lights and cleaning frequency and opening hours of building and other facilities.
Maintenance includes all actions necessary for retaining an asset as near as practicable to an appropriate service condition including regular ongoing day-to-day work necessary to keep assets operating, e.g. road patching but excluding rehabilitation or renewal. Maintenance may be classifies into reactive, planned and specific maintenance work activities.
Reactive maintenance is unplanned repair work carried out in response to service requests and management/supervisory directions.
Planned maintenance is repair work that is identified and managed through a maintenance management system (MMS). MMS activities include inspection, assessing the condition against failure/breakdown experience, prioritising, scheduling, actioning the work and reporting what was done to develop a maintenance history and improve maintenance and service delivery performance.
Specific maintenance is replacement of higher value components/sub-components of assets that is undertaken on a regular cycle including repainting, replacing air conditioning units, etc. This work falls below the capital/maintenance threshold but may require a specific budget allocation.
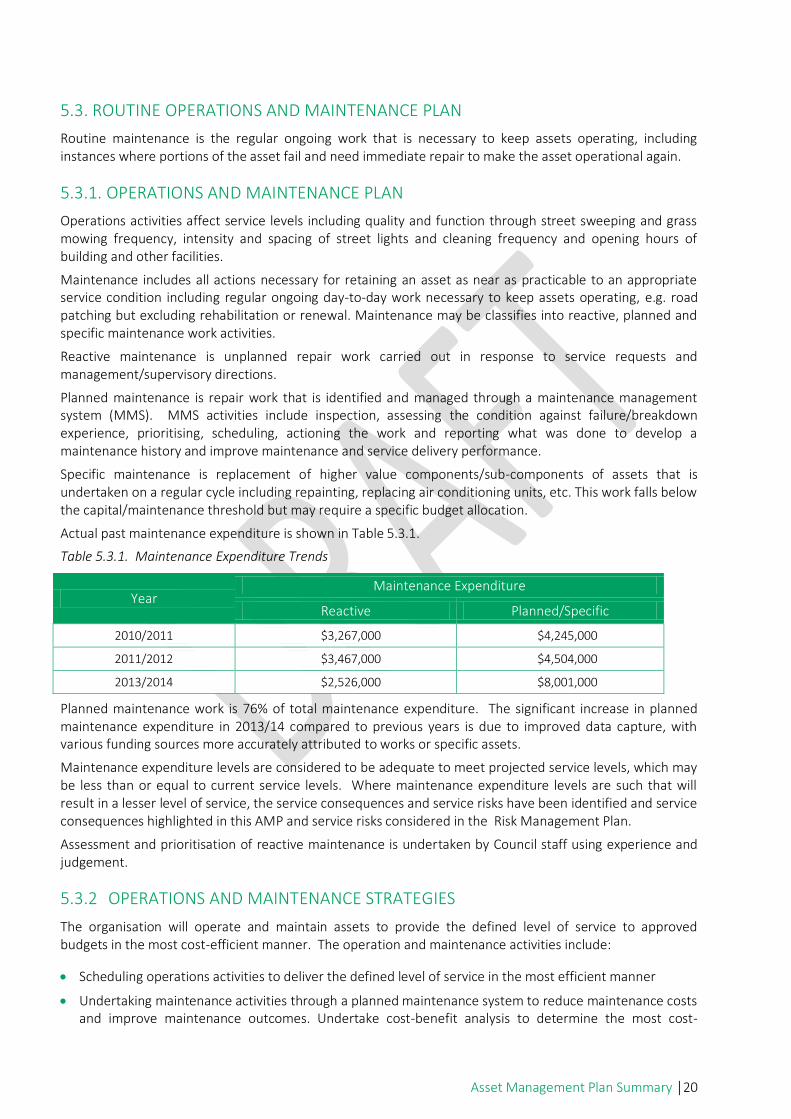
Actual past maintenance expenditure is shown in Table 5.3.1.
Table 5.3.1. Maintenance Expenditure Trends
Year Maintenance Expenditure
Reactive Planned/Specific
2010/2011 $3,267,000 $4,245,000
2011/2012 $3,467,000 $4,504,000
2013/2014 $2,526,000 $8,001,000
Planned maintenance work is 76% of total maintenance expenditure. The significant increase in planned maintenance expenditure in 2013/14 compared to previous years is due to improved data capture, with various funding sources more accurately attributed to works or specific assets.
Maintenance expenditure levels are considered to be adequate to meet projected service levels, which may be less than or equal to current service levels. Where maintenance expenditure levels are such that will result in a lesser level of service, the service consequences and service risks have been identified and service consequences highlighted in this AMP and service risks considered in the Risk Management Plan.
Assessment and prioritisation of reactive maintenance is undertaken by Council staff using experience and judgement.
5.3.2 OPERATIONS AND MAINTENANCE STRATEGIES
The organisation will operate and maintain assets to provide the defined level of service to approved budgets in the most cost-efficient manner. The operation and maintenance activities include:
Scheduling operations activities to deliver the defined level of service in the most efficient manner
Undertaking maintenance activities through a planned maintenance system to reduce maintenance costs and improve maintenance outcomes. Undertake cost-benefit analysis to determine the most cost-

Asset Management Plan Summary │21
effective split between planned and unplanned maintenance activities (at least 70% planned as measured by cost).
Maintain a current asset risk register for assets and present service risks associated with providing services from assets and reporting Very High and High risks and residual risks after treatment to management and Council/Board,
Review current and required skills base and implement workforce training and development to meet required operations and maintenance needs.
Review asset utilisation to identify underutilised assets and appropriate remedies, and over utilised assets and customer demand management options.
Maintain a current hierarchy of critical assets and required operations and maintenance activities.
Develop and regularly review appropriate emergency response capability.
Review management of operations and maintenance activities to ensure Council is obtaining best value for resources used.
Asset hierarchy
An asset hierarchy provides a framework for structuring data in an information system to assist in collection of data, reporting information and making decisions. The hierarchy includes the asset class and component used for asset planning and financial reporting and service level hierarchy used for service planning and delivery.
The organisation’s service hierarchy are to be reviewed in future plans.
Critical Assets
Critical assets are those assets which have a high consequence of failure but not necessarily a high likelihood of failure. By identifying critical assets and critical failure modes, organisations can target and refines investigative activities, maintenance plans and capital expenditure plans at the appropriate time.
Operations and maintenances activities may be targeted to mitigate critical assets failure and maintain service levels. These activities may include increased inspection frequency, higher maintenance intervention levels, etc. Critical assets failure modes and required operations and maintenance activities are to be reviewed in future plans.
5.3.3 SUMMARY OF FUTURE OPERATIONS AND MAINTENANCE EXPENDITURES
Future operations and maintenance expenditure is forecast to trend in line with the value of the asset stock as shown in Figure 4. Note that all costs are shown in indexed 2013/2014 dollar values.
Figure 4. Projected Operations and Maintenance Expenditure

Asset Management Plan Summary │22
Deferred maintenance, i.e. works that are identified for maintenance and unable to be funded are to be included in the risk assessment process in the Assets Risk Management Plan.
Maintenance is funded from Council’s operating budget and grants where available. This is further discussed in Section 6.2.
5.4. RENEWAL/ REPLACEMENT PLAN
Renewal expenditure is major work which does not increase the asset’s design capacity but restores, rehabilitates, replaces or renews an existing asset to its original service potential. Work over and above restoring an asset to original service potential is upgrade / expansion or new works expenditure.
5.4.1. RENEWAL PLAN
Assets requiring renewal are identified from estimates of remaining life obtained from the asset register through the ‘Renewal Model’. Candidate proposals are inspected to verify accuracy of remaining life estimate and to develop a preliminary renewal estimate.
Assets requiring renewal / replacement are identified from one of three methods provided in the ‘Expenditure Template’.
Method 1 uses Asset Register data to project the renewal costs using acquisition year and useful life to determine the renewal year, or
Method 2 uses capital renewal expenditure projections from external condition modelling systems (such as Pavement Management Systems), or
Method 3 uses a combination of average network renewals plus defect repairs in the Renewal Plan and Defect Repair Plan worksheets on the ‘Expenditure template’.
Method 1 was used for this asset management plan.
The useful lives of assets used to develop projected asset renewal expenditures are detailed in the individual plans.
5.4.2. RENEWAL AND REPLACEMENT STRATEGIES
The organisation will plan capital renewal and replacement projects to meet level of service objectives and minimise infrastructure service risks by:
Planning and scheduling renewal projects to deliver the defined level of service in the most efficient manner.
Asset Management Plan Summary │23
Undertaking project scoping for all capital renewal and replacement projects to identify:
o the service delivery ‘deficiency’, present risk and optimum time for renewal/replacement,
o the project objectives to rectify the deficiency,
o the range of options, estimated capital and life cycle costs for each options that could address the service deficiency,
o and evaluate the options against evaluation criteria adopted by Council, and
o select the best option to be included in capital renewal programs.
Using ‘low cost’ renewal methods (cost of renewal is less than replacement) wherever possible.
Maintain a current infrastructure risk register for assets and service risks associated with providing services from infrastructure assets and reporting Very High and High risks and residual risks after treatment to management and Council.
Review current and required skills base and implement workforce training and development to meet required construction and renewal needs.
Maintain a current hierarchy of critical assets and capital renewal treatments and timings required.
Review management of capital renewal and replacement activities to ensure Council is obtaining best value for resources used.
Renewal ranking criteria
Asset renewal and replacement is typically undertaken to either:
Ensure the reliability of the existing infrastructure to deliver the service it was constructed to facilitate (e.g. replacing a bridge that has a 5 t load limit), or
To ensure the infrastructure is of sufficient quality to meet the service requirements (e.g. roughness of a road).5
It is possible to get some indication of capital renewal and replacement priorities by identifying assets or asset groups that:
Have a high consequence of failure.
Have a high utilisation and subsequent impact on users would be greatest.
The total value represents the greatest net value to the organisation.
Have the highest average age relative to their expected lives.
Are identified in the AMP as key cost factors.
Have high operational or maintenance costs, and
Where replacement with modern equivalent assets would yield material savings.6
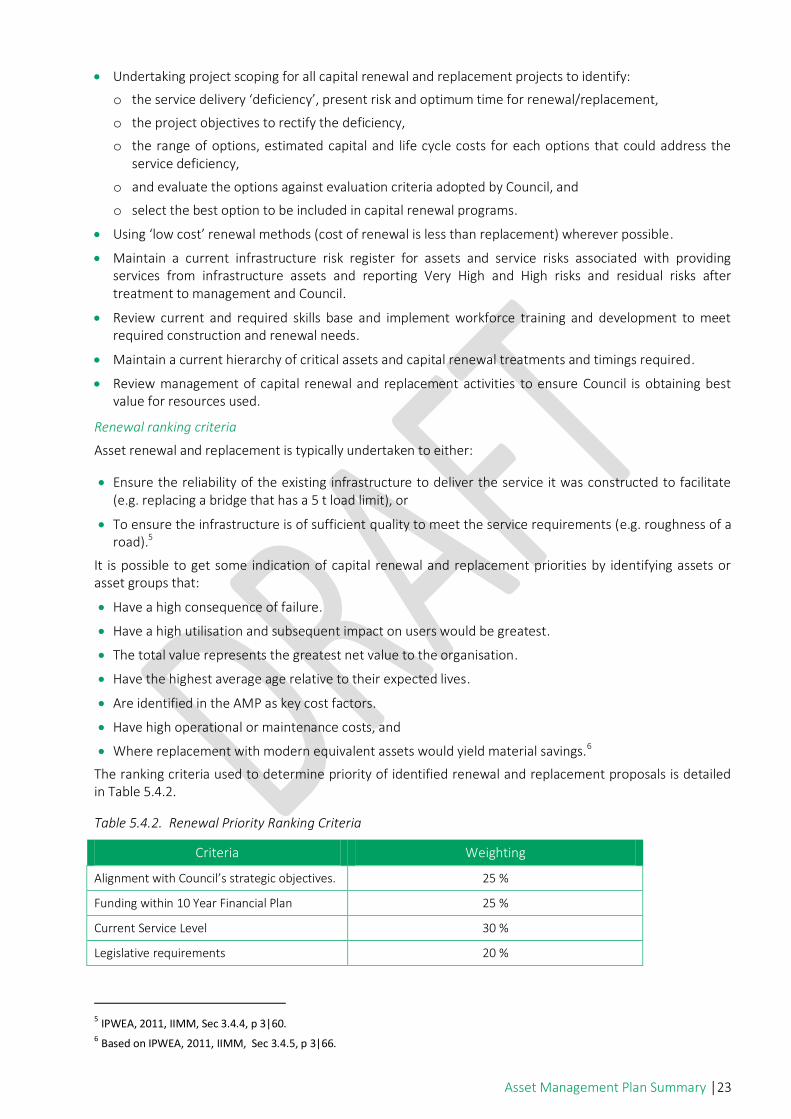
The ranking criteria used to determine priority of identified renewal and replacement proposals is detailed in Table 5.4.2.
Table 5.4.2. Renewal Priority Ranking Criteria
Criteria Weighting
Alignment with Council’s strategic objectives. 25 %
Funding within 10 Year Financial Plan 25 %
Current Service Level 30 %
Legislative requirements 20 %
5 IPWEA, 2011, IIMM, Sec 3.4.4, p 3|60.
6 Based on IPWEA, 2011, IIMM, Sec 3.4.5, p 3|66.

Asset Management Plan Summary │24
5.4.3. SUMMARY OF FUTURE RENEWAL EXPENDITURE
Projected future renewal expenditures are forecast to increase over time as the asset stock ages. The costs are summarised in Figure 5. Note that all costs are shown in indexed 2013/2014 dollar values.
Figure 5. Projected Capital Renewal and Replacement Expenditure
Deferred renewal, i.e. those assets identified for renewal but not scheduled for renewal in the current capital works programs, are to be rescheduled and included in future workplans. This most frequently occurs when timing of the renewal of an asset is adjusted to align with the timing of strategic projects such as a major upgrade or Lighthouse Project.
Asset Management Plan Summary │25
5.5. CREATION/ ACQUISITION / UPGRADE PLAN
New works are those works that create a new asset that did not previously exist, or works which upgrade or improve an existing asset beyond its existing capacity. They may result from growth, social or environmental needs.
5.5.1. SELECTION CRITERIA
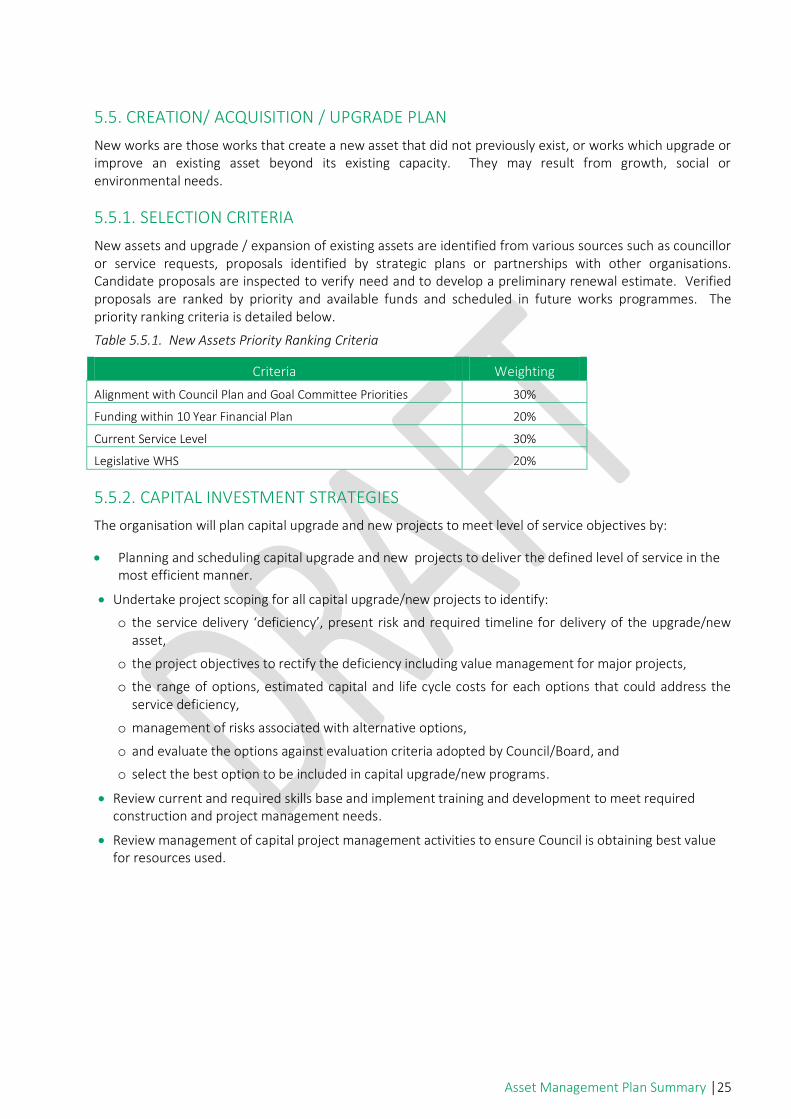
New assets and upgrade / expansion of existing assets are identified from various sources such as councillor or service requests, proposals identified by strategic plans or partnerships with other organisations. Candidate proposals are inspected to verify need and to develop a preliminary renewal estimate. Verified proposals are ranked by priority and available funds and scheduled in future works programmes. The priority ranking criteria is detailed below.
Table 5.5.1. New Assets Priority Ranking Criteria
Criteria Weighting
Alignment with Council Plan and Goal Committee Priorities 30%
Funding within 10 Year Financial Plan 20%
Current Service Level 30%
Legislative WHS 20%
5.5.2. CAPITAL INVESTMENT STRATEGIES
The organisation will plan capital upgrade and new projects to meet level of service objectives by:
Planning and scheduling capital upgrade and new projects to deliver the defined level of service in the most efficient manner.
Undertake project scoping for all capital upgrade/new projects to identify:
o the service delivery ‘deficiency’, present risk and required timeline for delivery of the upgrade/new asset,
o the project objectives to rectify the deficiency including value management for major projects,
o the range of options, estimated capital and life cycle costs for each options that could address the service deficiency,
o management of risks associated with alternative options,
o and evaluate the options against evaluation criteria adopted by Council/Board, and
o select the best option to be included in capital upgrade/new programs.
Review current and required skills base and implement training and development to meet required construction and project management needs.
Review management of capital project management activities to ensure Council is obtaining best value for resources used.

Asset Management Plan Summary │26
5.5.3 SUMMARY OF FUTURE UPGRADE / NEW ASSETS EXPENDITURE
Planned upgrade / new asset expenditures are summarised in figure 6. All costs are shown in indexed 2013/2014 dollar values.
Figure 6. Planned Capital Upgrade / New Asset Expenditure
New assets and services are to be funded from Council’s capital works program and grants where available. This is further discussed in Section 6.2.
5.6. DISPOSAL PLAN
Disposal includes any activity associated with disposal of a decommissioned asset including sale, demolition or relocation. Assets identified for possible decommissioning and disposal are shown in Table 5.6, together with estimated annual savings from not having to fund operations and maintenance of the assets. These assets will be further reinvestigated to determine the required levels of service and see what options are available for alternate service delivery, if any. Any revenue gained from asset disposals is accommodated in the organisation’s long term financial plan.
Where cashflow projections from asset disposals are not available, these will be developed in future revisions of this AMP.
Table 5.6. Assets identified for Disposal
Asset Reason for Disposal Timing Cashflow from
disposal
Munno Para Bowling Club, Bicentennial Tennis Club, Angle Vale Pre-School (excluding land sales)
Redevelopment of site and alternative site use
2018/2019 $2,448,000
Asset Management Plan Summary │27
6. FINANCIAL SUMMARY
This section contains the financial requirements resulting from all the information presented in the previous sections of this plan. The financial projections will be improved as further information becomes available on desired levels of service and current and projected future asset performance.
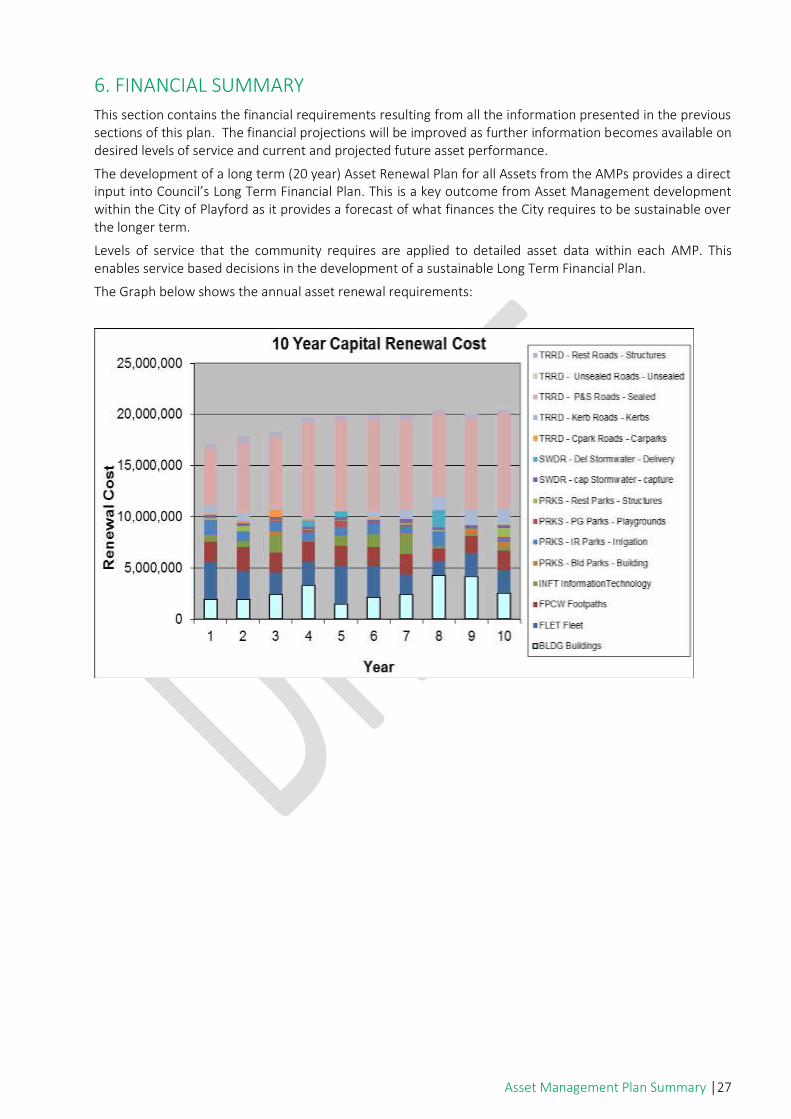
The development of a long term (20 year) Asset Renewal Plan for all Assets from the AMPs provides a direct input into Council’s Long Term Financial Plan. This is a key outcome from Asset Management development within the City of Playford as it provides a forecast of what finances the City requires to be sustainable over the longer term.
Levels of service that the community requires are applied to detailed asset data within each AMP. This enables service based decisions in the development of a sustainable Long Term Financial Plan.
The Graph below shows the annual asset renewal requirements:
Asset Management Plan Summary │28
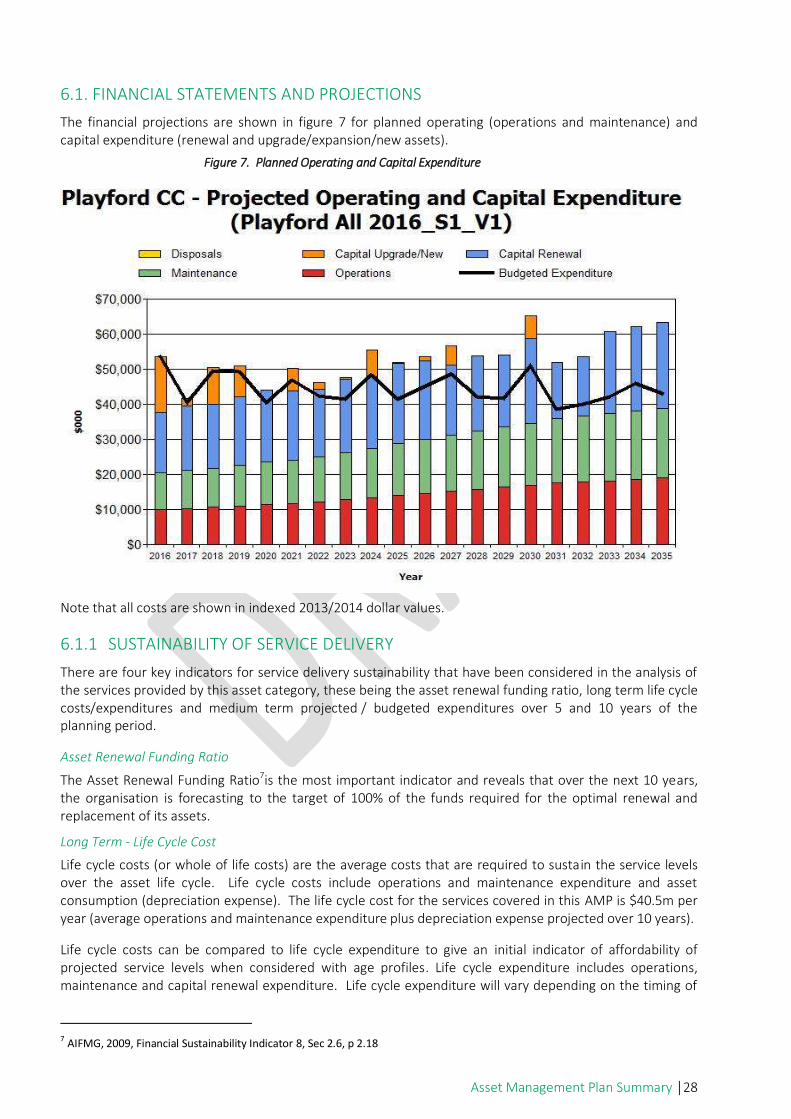
6.1. FINANCIAL STATEMENTS AND PROJECTIONS
The financial projections are shown in figure 7 for planned operating (operations and maintenance) and capital expenditure (renewal and upgrade/expansion/new assets).
Figure 7. Planned Operating and Capital Expenditure
Note that all costs are shown in indexed 2013/2014 dollar values.
6.1.1 SUSTAINABILITY OF SERVICE DELIVERY
There are four key indicators for service delivery sustainability that have been considered in the analysis of the services provided by this asset category, these being the asset renewal funding ratio, long term life cycle costs/expenditures and medium term projected / budgeted expenditures over 5 and 10 years of the planning period.
Asset Renewal Funding Ratio
The Asset Renewal Funding Ratio7is the most important indicator and reveals that over the next 10 years, the organisation is forecasting to the target of 100% of the funds required for the optimal renewal and replacement of its assets.
Long Term - Life Cycle Cost
Life cycle costs (or whole of life costs) are the average costs that are required to sustain the service levels over the asset life cycle. Life cycle costs include operations and maintenance expenditure and asset consumption (depreciation expense). The life cycle cost for the services covered in this AMP is $40.5m per year (average operations and maintenance expenditure plus depreciation expense projected over 10 years).
Life cycle costs can be compared to life cycle expenditure to give an initial indicator of affordability of projected service levels when considered with age profiles. Life cycle expenditure includes operations, maintenance and capital renewal expenditure. Life cycle expenditure will vary depending on the timing of
7 AIFMG, 2009, Financial Sustainability Indicator 8, Sec 2.6, p 2.18

Asset Management Plan Summary │29
asset renewals. The life cycle expenditure over the 10 year planning period is $39.9m per year (average operations and maintenance plus capital renewal budgeted expenditure in LTFP over 10 years).
A shortfall between life cycle cost and life cycle expenditure is the life cycle gap. The life cycle gap for services covered by this AMP is $-.59m per year (-ve = gap, +ve = surplus).
Life cycle expenditure is 99% of life cycle costs.
The life cycle costs and life cycle expenditure comparison highlights any difference between present outlays and the average cost of providing the service over the long term. If the life cycle expenditure is less than that life cycle cost, it is most likely that outlays will need to be increased or cuts in services made in the future.
Knowing the extent and timing of any required increase in outlays and the service consequences if funding is not available will assist organisations in providing services to their communities in a financially sustainable manner. This is the purpose of the AMPs and LTFP.
Medium term – 10 year financial planning period
This AMP identifies the projected operations, maintenance and capital renewal expenditures required to provide an agreed level of service to the community over a 10 year period. This provides input into 10 year financial and funding plans aimed at providing the required services in a sustainable manner.
These projected expenditures may be compared to budgeted expenditures in the 10 year period to identify any funding shortfall. In a core AMP, a gap is generally due to increasing asset renewals for ageing assets.
The projected operations, maintenance and capital renewal expenditure required over the 10 year planning period is $43.8m on average per year.
Estimated (budget) operations, maintenance and capital renewal funding is $39.9m on average per. This indicates that Council expects to have 91% of the projected expenditures needed to provide the services documented in the AMP.
Medium Term – 5 year financial planning period
The projected operations, maintenance and capital renewal expenditure required over the first 5 years of the planning period is $40.6m on average per year.
Estimated (budget) operations, maintenance and capital renewal funding is $39.1m on average per year. This indicates that Council expects to have 96% of projected expenditures required to provide the services shown in this asset management plan.
Asset management financial indicators
Figure 7b shows the asset management financial indicators over the 10 year planning period and for the long term life cycle.
Figure 7b: Asset Management Financial Indicators

Asset Management Plan Summary │30
The above graph reflects that Council is in a strong sustainable position as the results are close to the 100% target for these measures. Providing services from assets in a sustainable manner requires the matching and managing of service levels, risks, projected expenditures and financing to achieve a financial indicator of approximately 1.0 for the first years of the asset management plan and ideally over the 10 year life of the Long Term Financial Plan.
Figure 8 shows the projected asset renewals in the 20 year planning period from the asset register. The projected asset renewals are compared to planned renewal expenditure in the capital works program and capital renewal expenditure in year 1 of the planning period as shown in Figure 8.
Figure 8. Projected and Planned Renewals and Current Renewal Expenditure
Report 4, Table 6.1.1 shows the shortfall between projected renewal and replacement expenditures and expenditure accommodated in Long Term Financial Plan.
Table 6.1.1: Projected and LTFP Budgeted Renewals and Financing Shortfall
Playford CC - Report 4 - Table 6.1.1 Renewals Financing (Playford All 2016_S1_V1)

Asset Management Plan Summary │31
Playford CC - Report 4 - Table 6.1.1 Renewals Financing (Playford All 2016_S1_V1)
Year End
Projected LTFP Renewal Financing
Cumulative Shortfall($'000)
Jun-30 Renewals Renewal Budget
Shortfall ($'000)
(- gap, + surplus)
($'000) ($'000) (- gap, + surplus)
2016 $17,131 $17,131 $0 $0
2017 $18,375 $17,947 -$428 -$428
2018 $18,133 $18,323 $190 -$239
2019 $19,437 $19,735 $298 $59
2020 $20,524 $19,857 -$667 -$608
2021 $19,821 $19,949 $128 -$480
2022 $19,222 $19,928 $707 $227
2023 $20,948 $20,428 -$520 -$293
2024 $20,516 $20,047 -$469 -$761
2025 $22,899 $20,441 -$2,458 -$3,219
2026 $22,432 $23,271 $839 -$2,380
2027 $19,923 $22,410 $2,487 $107
2028 $21,558 $21,610 $52 $159
2029 $20,490 $21,122 $633 $791
2030 $24,407 $24,106 -$302 $490
2031 $16,032 $18,069 $2,037 $2,527
2032 $16,773 $19,446 $2,673 $5,200
2033 $23,403 $21,693 -$1,710 $3,490
2034 $24,047 $25,304 $1,257 $4,747
2035 $24,322 $22,571 -$1,750 $2,997
Providing services in a sustainable manner will require matching of projected asset renewal and replacement expenditure to meet agreed service levels with the corresponding capital works program accommodated in the long term financial plan.
A gap between projected asset renewal/replacement expenditure and amounts accommodated in the LTFP indicates that further work is required on reviewing service levels in the AM Plan (including possibly revising the LTFP) before finalising the asset management plan to manage required service levels and funding to eliminate any funding gap.
We will manage the ‘gap’ by developing this asset management plan to provide guidance on future service levels and resources required to provide these services, and review future services, service levels and costs with the community.
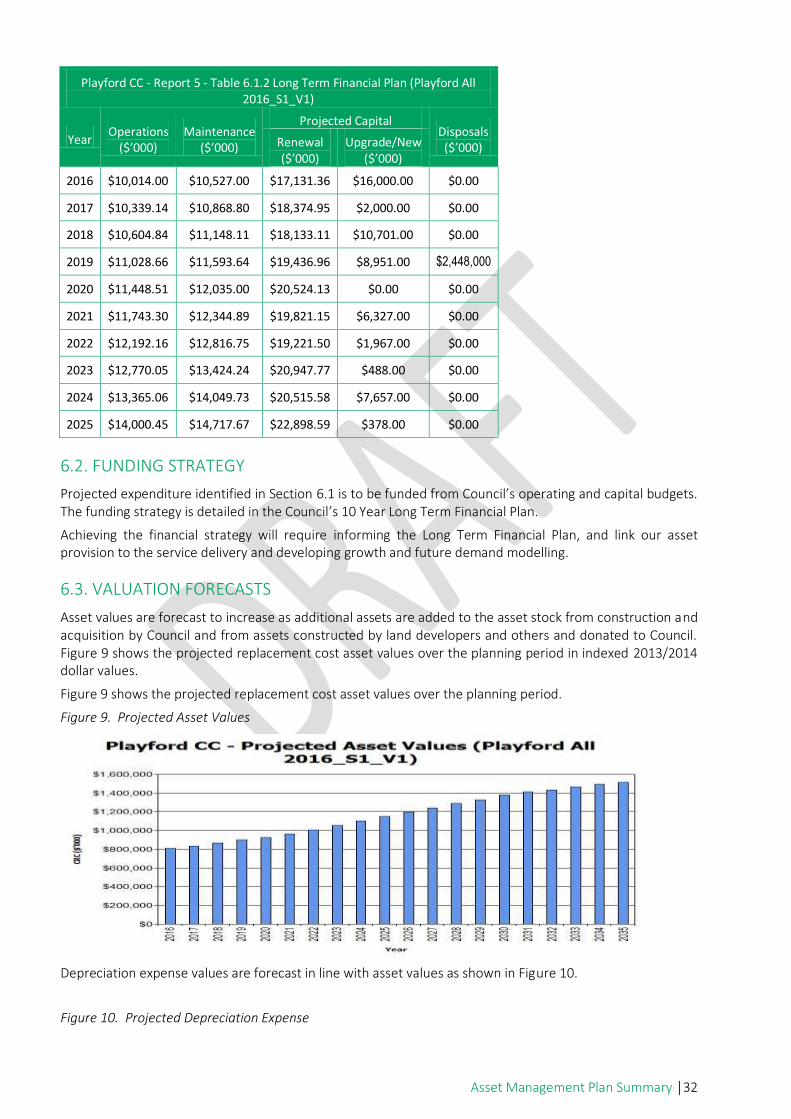
Table 6.1.2 shows the projected expenditures for the 10 year long term financial plan.
Table 6.1.2: Projected Expenditures for Long Term Financial Plan ($000)
Asset Management Plan Summary │32
Playford CC - Report 5 - Table 6.1.2 Long Term Financial Plan (Playford All 2016_S1_V1)
Year Operations
($’000) Maintenance
($’000)
Projected Capital Disposals
($’000) Renewal ($’000)
Upgrade/New ($’000)
2016 $10,014.00 $10,527.00 $17,131.36 $16,000.00 $0.00
2017 $10,339.14 $10,868.80 $18,374.95 $2,000.00 $0.00
2018 $10,604.84 $11,148.11 $18,133.11 $10,701.00 $0.00
2019 $11,028.66 $11,593.64 $19,436.96 $8,951.00 $2,448,000
2020 $11,448.51 $12,035.00 $20,524.13 $0.00 $0.00
2021 $11,743.30 $12,344.89 $19,821.15 $6,327.00 $0.00
2022 $12,192.16 $12,816.75 $19,221.50 $1,967.00 $0.00
2023 $12,770.05 $13,424.24 $20,947.77 $488.00 $0.00
2024 $13,365.06 $14,049.73 $20,515.58 $7,657.00 $0.00
2025 $14,000.45 $14,717.67 $22,898.59 $378.00 $0.00
6.2. FUNDING STRATEGY
Projected expenditure identified in Section 6.1 is to be funded from Council’s operating and capital budgets. The funding strategy is detailed in the Council’s 10 Year Long Term Financial Plan.
Achieving the financial strategy will require informing the Long Term Financial Plan, and link our asset provision to the service delivery and developing growth and future demand modelling.
6.3. VALUATION FORECASTS
Asset values are forecast to increase as additional assets are added to the asset stock from construction and acquisition by Council and from assets constructed by land developers and others and donated to Council. Figure 9 shows the projected replacement cost asset values over the planning period in indexed 2013/2014 dollar values.
Figure 9 shows the projected replacement cost asset values over the planning period.
Figure 9. Projected Asset Values
Depreciation expense values are forecast in line with asset values as shown in Figure 10.
Figure 10. Projected Depreciation Expense

Asset Management Plan Summary │33
The depreciated replacement cost (current replacement cost less accumulated depreciation) will vary over the forecast period depending on the rates of addition of new assets, disposal of old assets and consumption and renewal of existing assets. Forecast of the assets’ depreciated replacement cost is shown in figure 11.
Figure 11. Projected Depreciated Replacement Cost
6.4. KEY ASSUMPTIONS MADE IN FINANCIAL FORECASTS
This section details the key assumptions made in presenting the information contained in this Asset Management Plan and in preparing forecasts of required operating and capital expenditure and asset values, depreciation expense and carrying amount estimates. It is presented to enable readers to gain an understanding of the levels of confidence in the data behind the financial forecasts.
Asset Management Plan Summary │34
Key assumptions made in this Asset Management Plan and risks that may change are shown in the detailed plans.
Accuracy of future financial forecasts may be improved in future revisions of this Asset Management Plan by the following actions:
Undertaking regular defect surveys.
Improved tracking of operation / maintenance and rehabilitation costs.
Centralised asset management and data analysis.
Asset audit and improved data collection.
Improved analysis in growth and demand factors.
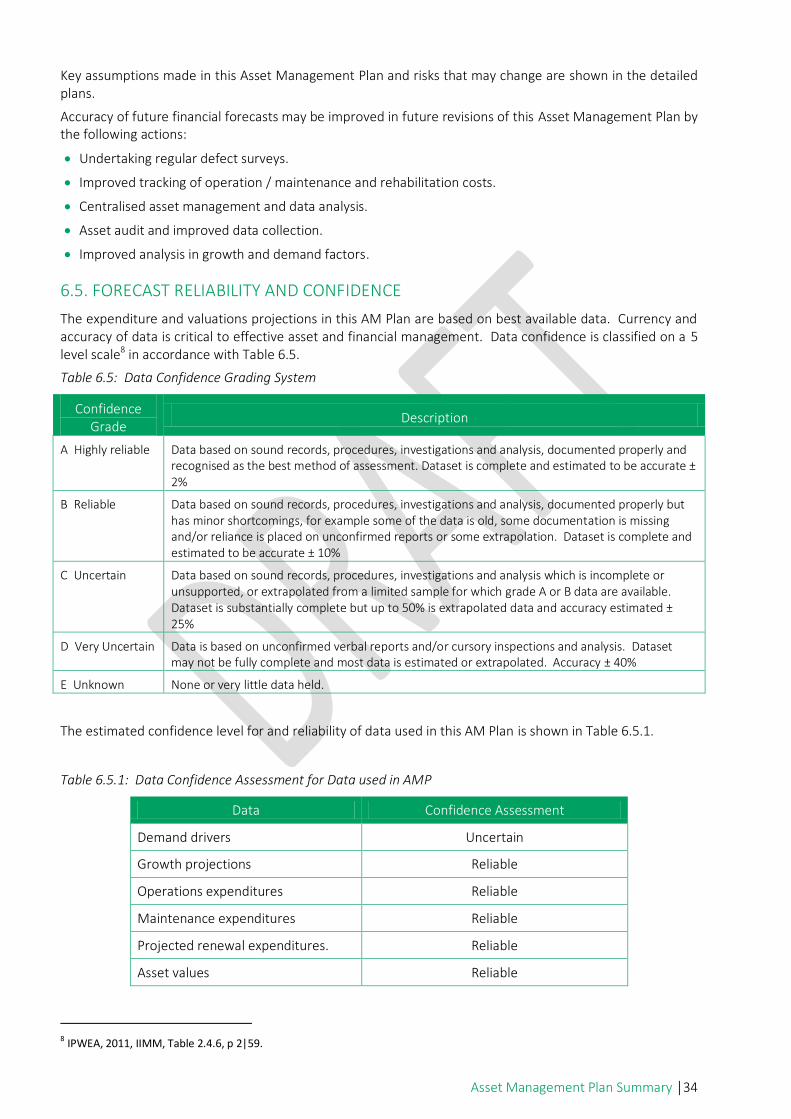
6.5. FORECAST RELIABILITY AND CONFIDENCE
The expenditure and valuations projections in this AM Plan are based on best available data. Currency and accuracy of data is critical to effective asset and financial management. Data confidence is classified on a 5 level scale8 in accordance with Table 6.5.
Table 6.5: Data Confidence Grading System
Confidence Grade
Description
A Highly reliable Data based on sound records, procedures, investigations and analysis, documented properly and recognised as the best method of assessment. Dataset is complete and estimated to be accurate ± 2%
B Reliable Data based on sound records, procedures, investigations and analysis, documented properly but has minor shortcomings, for example some of the data is old, some documentation is missing and/or reliance is placed on unconfirmed reports or some extrapolation. Dataset is complete and estimated to be accurate ± 10%
C Uncertain Data based on sound records, procedures, investigations and analysis which is incomplete or unsupported, or extrapolated from a limited sample for which grade A or B data are available. Dataset is substantially complete but up to 50% is extrapolated data and accuracy estimated ± 25%
D Very Uncertain Data is based on unconfirmed verbal reports and/or cursory inspections and analysis. Dataset may not be fully complete and most data is estimated or extrapolated. Accuracy ± 40%
E Unknown None or very little data held.
The estimated confidence level for and reliability of data used in this AM Plan is shown in Table 6.5.1.
Table 6.5.1: Data Confidence Assessment for Data used in AMP
Data Confidence Assessment
Demand drivers Uncertain
Growth projections Reliable
Operations expenditures Reliable
Maintenance expenditures Reliable
Projected renewal expenditures. Reliable
Asset values Reliable
8 IPWEA, 2011, IIMM, Table 2.4.6, p 2|59.

Asset Management Plan Summary │35
Asset residual values Reliable
Asset useful lives Reliable
Condition modelling Reliable
Network renewals Reliable
Defect repairs Uncertain
Upgrade/New expenditures Uncertain
Disposal expenditures Reliable
Over all data sources the data confidence is assessed as reliable confidence level for data used in the preparation of this AMP.
Asset Management Plan Summary │36
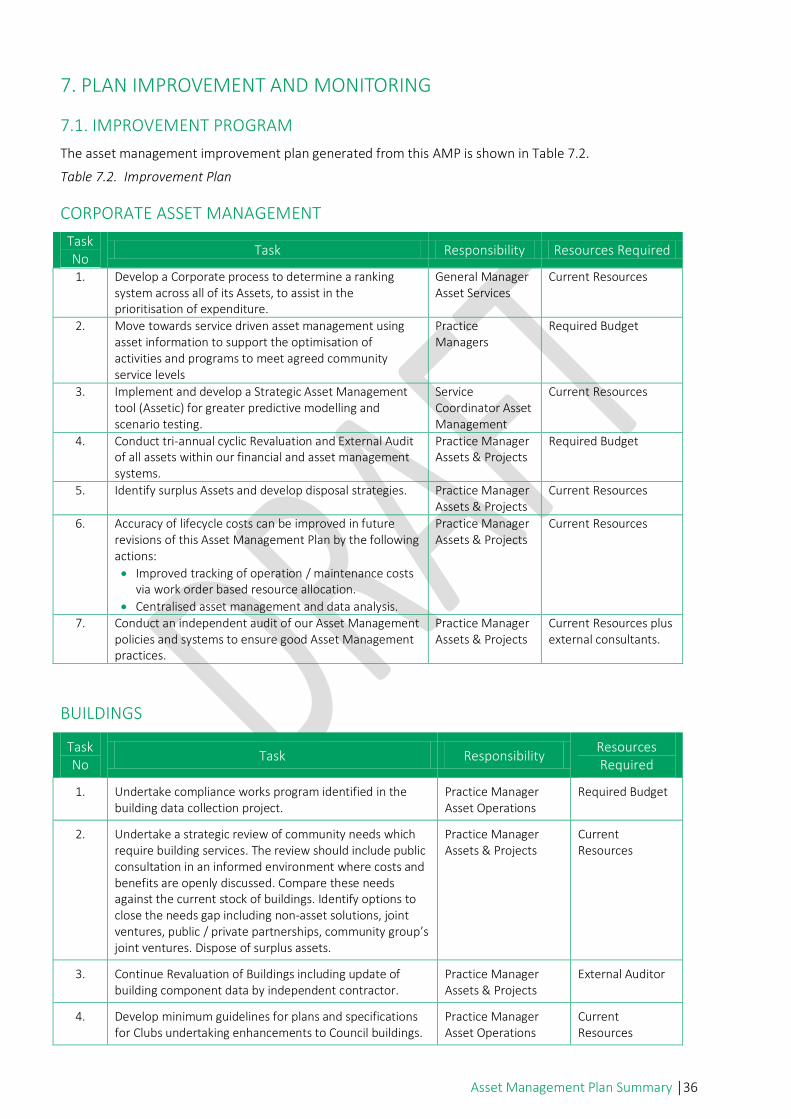
7. PLAN IMPROVEMENT AND MONITORING
7.1. IMPROVEMENT PROGRAM
The asset management improvement plan generated from this AMP is shown in Table 7.2.
Table 7.2. Improvement Plan
CORPORATE ASSET MANAGEMENT
Task No
Task Responsibility Resources Required
1. Develop a Corporate process to determine a ranking system across all of its Assets, to assist in the prioritisation of expenditure.
General Manager Asset Services
Current Resources
2. Move towards service driven asset management using asset information to support the optimisation of activities and programs to meet agreed community service levels
Practice Managers
Required Budget
3. Implement and develop a Strategic Asset Management tool (Assetic) for greater predictive modelling and scenario testing.
Service Coordinator Asset Management
Current Resources
4. Conduct tri-annual cyclic Revaluation and External Audit of all assets within our financial and asset management systems.
Practice Manager Assets & Projects
Required Budget
5. Identify surplus Assets and develop disposal strategies. Practice Manager Assets & Projects
Current Resources
6. Accuracy of lifecycle costs can be improved in future revisions of this Asset Management Plan by the following actions:
Improved tracking of operation / maintenance costs via work order based resource allocation.
Centralised asset management and data analysis.
Practice Manager Assets & Projects
Current Resources
7. Conduct an independent audit of our Asset Management policies and systems to ensure good Asset Management practices.
Practice Manager Assets & Projects
Current Resources plus external consultants.
BUILDINGS
Task No
Task Responsibility Resources Required
1. Undertake compliance works program identified in the building data collection project.
Practice Manager Asset Operations
Required Budget
2. Undertake a strategic review of community needs which require building services. The review should include public consultation in an informed environment where costs and benefits are openly discussed. Compare these needs against the current stock of buildings. Identify options to close the needs gap including non-asset solutions, joint ventures, public / private partnerships, community group’s joint ventures. Dispose of surplus assets.
Practice Manager Assets & Projects
Current Resources
3. Continue Revaluation of Buildings including update of building component data by independent contractor.
Practice Manager Assets & Projects
External Auditor
4. Develop minimum guidelines for plans and specifications for Clubs undertaking enhancements to Council buildings.
Practice Manager Asset Operations
Current Resources

Asset Management Plan Summary │37
Task No
Task Responsibility Resources Required
5. Review internal service provision maintenance and renewal rates against industry benchmarks to ensure continuous improvement in service delivery.
Practice Manager Asset Operations
Current Resources
6. Develop informative links between Parks & Recreation Plans and the Fleet AMPs.
General Manager City Services
Current Resources
PARKS & RECREATION
Task No
Task Responsibility Resources Required
1. Develop processes that inspect and condition rate Parks & Recreation assets on a regular basis, such as IPWEA Practice Notes 9.
Practice Manager Assets & Projects
Current Resources
2. Develop processes for capturing new and disposed Parks & Recreation assets to ensure they are recorded into the asset register.
Practice Manager Assets & Projects / Practice Manager City Operations
Current Resources
3. Develop maintenance and service levels in line with the reserve hierarchy.
Recreational Planner
Current Resources
4. Conduct revaluations of Parks & Recreation Assets and develop the migration of the information into Life Cycle.
Practice Manager Assets & Projects
Current Resources
5. Develop a Corporate process to determine a ranking system across all of its Assets, to assist in the prioritisation of expenditure.
Practice Manager Assets & Projects
Current Resources
6. Review the need for other Parks & Recreation Assets (e.g. Significant trees, landscaping, etc.) in future revisions of the plan.
Practice Manager Assets & Projects / Practice Manager City Operations
Current Resources

Asset Management Plan Summary │38
CIVIL TRANSPORTATION
Task No
Task Responsibility Resources Required
1. Develop service levels for all asset categories. Service Coordinator Planning and Quality
Current Resources
2. Revalue assets. Practice Manager Assets and Projects
Current Resources
3. Continue to undertake bi-annual condition assessments of the road network.
Service Coordinator Asset Management
Current Resources
4. Ensure consistent operational distinction between maintenance and Capital works.
Practice Manager Assets and Projects/ Practice Manager City Operations
Current Resources
5. Develop a plan for proactive maintenance and renewal works, including recording all costs against each job.
Practice Manager City Operations
Current Resources
6. Review of risk management plan detailed in Section 5.2 of AMP.
Service Coordinator Asset Management
Current Resources
7. Include Sports playing courts in next review of Plan.
Service Coordinator Asset Management
Current Resources
INFORMATION COMMUNICATION TECHNOLOGY
Task No
Task Responsibility Resources Required
1. Review process to develop a model to support decision making in regard to leasing or purchasing of Assets
Service Coordinator ICT
Current Resources
2. Software audit and data capture Service Coordinator ICT
Current Resources
3. Develop tools to assist Growth Modelling for technology assets
Service Coordinator ICT
Current Resources
4. Develop model to redefine Service Levels Service Coordinator ICT
Current Resources
FLEET MANAGEMENT
Task No
Task Responsibility Resources Required
1. Investigate Utilisation and develop benchmarks. Practice Manager Asset Operations
Required budget as per Council Plan
2. Develop modelling associated with growth and service delivery
Practice Manager Asset Operations
Current Resources
3. Develop knowledge management systems that house and provide reports on emissions and carbon footprint of fleet.
Service Coordinator Fleet and Service Coordinator ICT
Current Resources
4. Undertake a major review of this asset management plan on a 2 year cycle.
Practice Manager Asset Operations
Current Resources
5. Review of risk management plan detailed in Section 5.2. Practice Manager Asset Operations
Current Resources

Asset Management Plan Summary │39
7.3. MONITORING AND REVIEW PROCEDURES
This AMP will be reviewed during annual budget planning processes as part of the Annual Business Plan, and amended to recognise any material changes in service levels and/or resources available to provide those services as a result of budget decisions.
The AMP will be updated annually to ensure it represents the current service level, asset values, projected operations, maintenance, capital renewal and replacement, capital upgrade/new and asset disposal expenditures and projected expenditure values incorporated into the Council’s long term financial plan.
The AMP has a life of 4 years (Council/Board election cycle) and is due for complete revision and updating within 12 months of each Council/Board election.
7.4. PERFORMANCE MEASURES
The effectiveness of the AMP can be measured in the following ways:
The degree to which the required projected expenditures identified in this AMP are incorporated into the organisation’s LTFP.
The degree to which 1 to 5 year detailed works programs, budgets, business plans and organisational structures take into account the overarching works program trends provided by the AMP.
The degree to which the existing and projected service levels and service consequences (what we cannot do), risks and residual risks are incorporated into the organisation’s Strategic Plan and associated plans.
The Asset Renewal Funding Ratio achieving the target of 1.0.
Asset Management Plan Summary │40
8. REFERENCES
- IPWEA, 2006, ‘International Infrastructure Management Manual’, Institute of Public Works Engineering Australia, Sydney, www.ipwea.org.au/IIMM
- IPWEA, 2008, ‘NAMS.PLUS Asset Management’, Institute of Public Works Engineering Australia, Sydney, www.ipwea.org.au/namsplus.
- IPWEA, 2009, ‘Australian Infrastructure Financial Management Guidelines’, Institute of Public Works Engineering Australia, Sydney, www.ipwea.org.au/AIFMG.
- IPWEA, 2011, ‘International Infrastructure Management Manual’, Institute of Public Works Engineering Australia, Sydney, www.ipwea.org.au/IIMM
- City of Playford ‘Strategic Plan’,
- City of Playford, ‘Annual Business Plan’.

Asset Management Plan Summary │41
9. APPENDICES
Appendix A Abbreviations
Appendix B Glossary

Asset Management Plan Summary │42
Appendix A ABBREVIATIONS
AAAC Average annual asset consumption
AM Asset management
AMP Asset management plan
ARI Average recurrence interval
ASC Annual service cost
BOD Biochemical (biological) oxygen demand
CRC Current replacement cost
CWMS Community wastewater management systems
DA Depreciable amount
DRC Depreciated replacement cost
EF Earthworks/formation
IRMP Infrastructure risk management plan
LCC Life Cycle cost
LCE Life cycle expenditure
LTFP Long term financial plan
MMS Maintenance management system
PCI Pavement condition index
RV Residual value
SoA State of the Assets
SS Suspended solids
vph Vehicles per hour
WDCRC Written down current replacement cost
Asset Management Plan Summary │43
APPENDIX B GLOSSARY
Annual service cost (ASC)
1) Reporting actual cost
The annual (accrual) cost of providing a service including operations, maintenance, depreciation, finance/opportunity and disposal costs less revenue.
2) For investment analysis and budgeting
An estimate of the cost that would be tendered, per annum, if tenders were called for the supply of a service to a performance specification for a fixed term. The Annual Service Cost includes operations, maintenance, depreciation, finance / opportunity and disposal costs, less revenue.
Asset
A resource controlled by an entity as a result of past events and from which future economic benefits are expected to flow to the entity. Infrastructure assets are a sub-class of property, plant and equipment which are non-current assets with a life greater than 12 months and enable services to be provided.
Asset category
Sub-group of assets within a class hierarchy for financial reporting and management purposes.
Asset class
A group of assets having a similar nature or function in the operations of an entity, and which, for purposes of disclosure, is shown as a single item without supplementary disclosure.
Asset condition assessment
The process of continuous or periodic inspection, assessment, measurement and interpretation of the resultant data to indicate the condition of a specific asset so as to determine the need for some preventative or remedial action.
Asset hierarchy
A framework for segmenting an asset base into appropriate classifications. The asset hierarchy can be based on asset function or asset type or a combination of the two.
Asset management (AM)
The combination of management, financial, economic, engineering and other practices applied to physical assets with the objective of providing the required level of service in the most cost effective manner.
Asset renewal funding ratio
The ratio of the net present value of asset renewal funding accommodated over a 10 year period in a long term financial plan relative to the net present value of projected capital renewal expenditures identified in an asset management plan for the same period [AIFMG Financial Sustainability Indicator No 8].
Average annual asset consumption (AAAC)*
The amount of an organisation’s asset base consumed during a reporting period (generally a year). This may be calculated by dividing the depreciable amount by the useful life (or total future economic benefits/service potential) and totalled for each and every asset OR by dividing the carrying amount (depreciated replacement cost) by the remaining useful life (or remaining future economic benefits/service potential) and totalled for each and every asset in an asset category or class.
Borrowings
A borrowing or loan is a contractual obligation of the borrowing entity to deliver cash or another financial asset to the lending entity over a specified period of time or at a specified point in time, to cover both the initial capital provided and the cost of the interest incurred for providing this capital. A borrowing or loan provides the means for the borrowing entity to finance outlays (typically physical assets) when it has insufficient funds of its own to do so, and for the lending entity to make a financial return, normally in the form of interest revenue, on the funding provided.
Capital expenditure
Relatively large (material) expenditure, which has benefits, expected to last for more than 12 months. Capital expenditure includes renewal, expansion and upgrade. Where capital projects involve a combination of renewal, expansion and/or upgrade expenditures, the total project cost needs to be allocated accordingly.
Capital expenditure - expansion
Expenditure that extends the capacity of an existing asset to provide benefits, at the same standard as is currently enjoyed by existing beneficiaries, to a new group of users. It is discretionary expenditure, which increases future operations and maintenance costs, because it increases the organisation’s asset base, but may be associated with additional revenue from the new user group, e.g. extending a drainage or road network, the provision of an oval or park in a new suburb for new residents.
Capital expenditure - new
Expenditure which creates a new asset providing a new service/output that did not exist beforehand. As it increases service potential it may impact revenue and will increase future operations and maintenance expenditure.
Capital expenditure - renewal
Expenditure on an existing asset or on replacing an existing asset, which returns the service capability of the asset up to that which it had originally. It is periodically required expenditure, relatively large (material) in value compared with the value of the components or sub-components of the asset being renewed. As it reinstates existing service potential, it generally has no impact on revenue, but may reduce

Asset Management Plan Summary │44
future operations and maintenance expenditure if completed at the optimum time, e.g. resurfacing or resheeting a material part of a road network, replacing a material section of a drainage network with pipes of the same capacity, resurfacing an oval.
Capital expenditure - upgrade
Expenditure, which enhances an existing asset to provide a higher level of service or expenditure that will increase the life of the asset beyond that which it had originally. Upgrade expenditure is discretionary and often does not result in additional revenue unless direct user charges apply. It will increase operations and maintenance expenditure in the future because of the increase in the organisation’s asset base, e.g. widening the sealed area of an existing road, replacing drainage pipes with pipes of a greater capacity, enlarging a grandstand at a sporting facility.
Capital funding
Funding to pay for capital expenditure.
Capital grants
Monies received generally tied to the specific projects for which they are granted, which are often upgrade and/or expansion or new investment proposals.
Capital investment expenditure
See capital expenditure definition
Capitalisation threshold
The value of expenditure on non-current assets above which the expenditure is recognised as capital expenditure and below which the expenditure is charged as an expense in the year of acquisition.
Carrying amount
The amount at which an asset is recognised after deducting any accumulated depreciation / amortisation and accumulated impairment losses thereon.
Class of assets
See asset class definition
Component
Specific parts of an asset having independent physical or functional identity and having specific attributes such as different life expectancy, maintenance regimes, risk or criticality.
Core asset management
Asset management which relies primarily on the use of an asset register, maintenance management systems, job resource management, inventory control, condition assessment, simple risk assessment and defined levels of service, in order to establish alternative treatment options and long-term cashflow predictions. Priorities are usually established on the basis of financial return gained by carrying out the work (rather than detailed risk analysis and optimised decision- making).
Cost of an asset
The amount of cash or cash equivalents paid or the fair value of the consideration given to acquire an asset at the time of its acquisition or construction, including any costs necessary to place the asset into service. This includes one-off design and project management costs.
Critical assets
Assets for which the financial, business or service level consequences of failure are sufficiently severe to justify proactive inspection and rehabilitation. Critical assets have a lower threshold for action than non-critical assets.
Current replacement cost (CRC)
The cost the entity would incur to acquire the asset on the reporting date. The cost is measured by reference to the lowest cost at which the gross future economic benefits could be obtained in the normal course of business or the minimum it would cost, to replace the existing asset with a technologically modern equivalent new asset (not a second hand one) with the same economic benefits (gross service potential) allowing for any differences in the quantity and quality of output and in operating costs.
Deferred maintenance
The shortfall in rehabilitation work undertaken relative to that required to maintain the service potential of an asset.
Depreciable amount
The cost of an asset, or other amount substituted for its cost, less its residual value.
Depreciated replacement cost (DRC)
The current replacement cost (CRC) of an asset less, where applicable, accumulated depreciation calculated on the basis of such cost to reflect the already consumed or expired future economic benefits of the asset.
Depreciation / amortisation
The systematic allocation of the depreciable amount (service potential) of an asset over its useful life.
Economic life
See useful life definition.
Expenditure
The spending of money on goods and services. Expenditure includes recurrent and capital outlays.
Expenses
Decreases in economic benefits during the accounting period in the form of outflows or depletions of assets or increases in liabilities that result in decreases in equity, other than those relating to distributions to equity participants.

Asset Management Plan Summary │45
Fair value
The amount for which an asset could be exchanged, or a liability settled, between knowledgeable, willing parties, in an arm’s length transaction.
Financing gap
A financing gap exists whenever an entity has insufficient capacity to finance asset renewal and other expenditure necessary to be able to appropriately maintain the range and level of services its existing asset stock was originally designed and intended to deliver. The service capability of the existing asset stock should be determined assuming no additional operating revenue, productivity improvements, or net financial liabilities above levels currently planned or projected. A current financing gap means service levels have already or are currently falling. A projected financing gap if not addressed will result in a future diminution of existing service levels.
Heritage asset
An asset with historic, artistic, scientific, technological, geographical or environmental qualities that is held and maintained principally for its contribution to knowledge and culture and this purpose is central to the objectives of the entity holding it.
Impairment Loss
The amount by which the carrying amount of an asset exceeds its recoverable amount.
Infrastructure assets
Physical assets that contribute to meeting the needs of organisations or the need for access to major economic and social facilities and services, e.g. roads, drainage, footpaths and cycleways. These are typically large, interconnected networks or portfolios of composite assets. The components of these assets may be separately maintained, renewed or replaced individually so that the required level and standard of service from the network of assets is continuously sustained. Generally the components and hence the assets have long lives. They are fixed in place and are often have no separate market value.
Investment property
Property held to earn rentals or for capital appreciation or both, rather than for:
(a) use in the production or supply of goods or services or for administrative purposes; or
(b) sale in the ordinary course of business.
Key performance indicator
A qualitative or quantitative measure of a service or activity used to compare actual performance against a standard or other target. Performance indicators commonly relate to statutory limits, safety, responsiveness, cost, comfort, asset performance, reliability, efficiency, environmental protection and customer satisfaction.
Level of service
The defined service quality for a particular service/activity against which service performance may be measured. Service levels usually relate to quality, quantity, reliability, responsiveness, environmental impact, acceptability and cost.
Life Cycle Cost *
1. Total LCC The total cost of an asset throughout its life including planning, design, construction, acquisition, operation, maintenance, rehabilitation and disposal costs.
2. Average LCC The life cycle cost (LCC) is average cost to provide the service over the longest asset life cycle. It comprises average operations, maintenance expenditure plus asset consumption expense, represented by depreciation expense projected over 10 years. The Life Cycle Cost does not indicate the funds required to provide the service in a particular year.
Life Cycle Expenditure
The Life Cycle Expenditure (LCE) is the average operations, maintenance and capital renewal expenditure accommodated in the long term financial plan over 10 years. Life Cycle Expenditure may be compared to average Life Cycle Cost to give an initial indicator of affordability of projected service levels when considered with asset age profiles.
Loans / borrowings
See borrowings.
Maintenance
All actions necessary for retaining an asset as near as practicable to an appropriate service condition, including regular ongoing day-to-day work necessary to keep assets operating, e.g. road patching but excluding rehabilitation or renewal. It is operating expenditure required to ensure that the asset reaches its expected useful life.
• Planned maintenance
Repair work that is identified and managed through a maintenance management system (MMS). MMS activities include inspection, assessing the condition against failure/breakdown criteria/experience, prioritising scheduling, actioning the work and reporting what was done to develop a maintenance history and improve maintenance and service delivery performance.
Reactive maintenance: Unplanned repair work that is carried out in response to service requests and management/ supervisory directions.
Specific maintenance: Maintenance work to repair components or replace sub-components that need to be identified as a specific maintenance item in the maintenance budget.
Unplanned maintenance: Corrective work required in the short-term to restore an asset to
Asset Management Plan Summary │46
working condition so it can continue to deliver the required service or to maintain its level of security and integrity.
Maintenance expenditure *
Recurrent expenditure, which is periodically or regularly required as part of the anticipated schedule of works required to ensure that the asset achieves its useful life and provides the required level of service. It is expenditure, which was anticipated in determining the asset’s useful life.
Materiality
The notion of materiality guides the margin of error acceptable, the degree of precision required and the extent of the disclosure required when preparing general purpose financial reports. Information is material if its omission, misstatement or non-disclosure has the potential, individually or collectively, to influence the economic decisions of users taken on the basis of the financial report or affect the discharge of accountability by the management or governing body of the entity.
Modern equivalent asset
Assets that replicate what is in existence with the most cost-effective asset performing the same level of service. It is the most cost efficient, currently available asset which will provide the same stream of services as the existing asset is capable of producing. It allows for technology changes and, improvements and efficiencies in production and installation techniques
Net present value (NPV)
The value to the organisation of the cash flows associated with an asset, liability, activity or event calculated using a discount rate to reflect the time value of money. It is the net amount of discounted total cash inflows after deducting the value of the discounted total cash outflows arising from e.g. the continued use and subsequent disposal of the asset after deducting the value of the discounted total cash outflows.
Non-revenue generating investments
Investments for the provision of goods and services to sustain or improve services to the community that are not expected to generate any savings or revenue to the Council, e.g. parks and playgrounds, footpaths, roads and bridges, libraries, etc.
Operations
Regular activities to provide services such as public health, safety and amenity, e.g. street sweeping, grass mowing and street lighting.
Operating expenditure
Recurrent expenditure, which is continuously required to provide a service. In common use the term typically includes, e.g. power, fuel, staff, plant equipment, on-costs and overheads but excludes maintenance and depreciation. Maintenance and depreciation is on the other hand included in operating expenses.
Operating expense
The gross outflow of economic benefits, being cash and non-cash items, during the period arising in the course of ordinary activities of an entity when those outflows result in decreases in equity, other than decreases relating to distributions to equity participants.
Operating expenses
Recurrent expenses continuously required to provide a service, including power, fuel, staff, plant equipment, maintenance, depreciation, on-costs and overheads.
Operations, maintenance and renewal financing ratio
Ratio of estimated budget to projected expenditure for operations, maintenance and renewal of assets over a defined time (e.g. 5, 10 and 15 years).
Operations, maintenance and renewal gap
Difference between budgeted expenditures in a long term financial plan (or estimated future budgets in absence of a long term financial plan) and projected expenditures for operations, maintenance and renewal of assets to achieve/maintain specified service levels, totalled over a defined time (e.g. 5, 10 and 15 years).
Pavement management system (PMS)
A systematic process for measuring and predicting the condition of road pavements and wearing surfaces over time and recommending corrective actions.
PMS Score
A measure of condition of a road segment determined from a Pavement Management System.
Rate of annual asset consumption *
The ratio of annual asset consumption relative to the depreciable amount of the assets. It measures the amount of the consumable parts of assets that are consumed in a period (depreciation) expressed as a percentage of the depreciable amount.
Rate of annual asset renewal *
The ratio of asset renewal and replacement expenditure relative to depreciable amount for a period. It measures whether assets are being replaced at the rate they are wearing out with capital renewal expenditure expressed as a percentage of depreciable amount (capital renewal expenditure/DA).
Rate of annual asset upgrade/new *
A measure of the rate at which assets are being upgraded and expanded per annum with capital upgrade/new expenditure expressed as a percentage of depreciable amount (capital upgrade/expansion expenditure/DA).
Recoverable amount
The higher of an asset's fair value, less costs to sell and its value in use.

Asset Management Plan Summary │47
Recurrent expenditure
Relatively small (immaterial) expenditure or that which has benefits expected to last less than 12 months. Recurrent expenditure includes operations and maintenance expenditure.
Recurrent funding
Funding to pay for recurrent expenditure.
Rehabilitation
See capital renewal expenditure definition above.
Remaining useful life
The time remaining until an asset ceases to provide the required service level or economic usefulness. Age plus remaining useful life is useful life.
Renewal
See capital renewal expenditure definition above.
Residual value
The estimated amount that an entity would currently obtain from disposal of the asset, after deducting the estimated costs of disposal, if the asset were already of the age and in the condition expected at the end of its useful life.
Revenue generating investments
Investments for the provision of goods and services to sustain or improve services to the community that are expected to generate some savings or revenue to offset operating costs, e.g. public halls and theatres, childcare centres, sporting and recreation facilities, tourist information centres, etc.
Risk management
The application of a formal process to the range of possible values relating to key factors associated with a risk in order to determine the resultant ranges of outcomes and their probability of occurrence.
Section or segment
A self-contained part or piece of an infrastructure asset.
Service potential
The total future service capacity of an asset. It is normally determined by reference to the operating capacity and economic life of an asset. A measure of service potential is used in the not-for-profit sector/public sector to value assets, particularly those not producing a cash flow.
Service potential remaining
A measure of the future economic benefits remaining in assets. It may be expressed in dollar values (Fair Value) or as a percentage of total anticipated future economic benefits. It is also a measure of the percentage of the asset’s potential to provide services that are still available for use in providing services (Depreciated Replacement Cost/Depreciable Amount).
Specific Maintenance
Replacement of higher value components/sub-components of assets that is undertaken on a regular cycle including repainting, replacement of air conditioning equipment, etc. This work generally falls below the capital/ maintenance threshold and needs to be identified in a specific maintenance budget allocation.
Strategic Longer-Term Plan
A plan covering the term of office of councillors (4 years minimum) reflecting the needs of the community for the foreseeable future. It brings together the detailed requirements in the Council’s longer-term plans such as the asset management plan and the long-term financial plan. The plan is prepared in consultation with the community and details where the Council is at that point in time, where it wants to go, how it is going to get there, mechanisms for monitoring the achievement of the outcomes and how the plan will be resourced.
Sub-component
Smaller individual parts that make up a component part.
Useful life
Either:
(a) the period over which an asset is expected to be available for use by an entity, or
(b) the number of production or similar units expected to be obtained from the asset by the entity.
It is estimated or expected time between placing the asset into service and removing it from service, or the estimated period of time over which the future economic benefits embodied in a depreciable asset, are expected to be consumed by the Council.
Value in Use
The present value of future cash flows expected to be derived from an asset or cash generating unit. It is deemed to be depreciated replacement cost (DRC) for those assets whose future economic benefits are not primarily dependent on the asset's ability to generate net cash inflows, where the entity would, if deprived of the asset, replace its remaining future economic benefits.
Source: IPWEA, 2009, Glossary
Additional and modified glossary items shown *