Dr. Z Facilities Study Presentation - 3-30-17 Final ... · 4Q 178 252 298 233 203 214 ... 10 SONOMA...
30
Tomball Independent School District Demographic Update January 2017 Learn from Yesterday… Understand Today… Plan for the Future
Transcript of Dr. Z Facilities Study Presentation - 3-30-17 Final ... · 4Q 178 252 298 233 203 214 ... 10 SONOMA...

TomballIndependentSchool District
Demographic Update
January 2017
Learn from Yesterday…Understand Today…Plan for the Future

Houston MSA New Home Ranking Report
2
ISD Ranking by Annual Closings- 3Q16
Rank District Name Annual Starts Annual Closings VDL Future1 Fort Bend ISD 3,061 3,220 3,617 15,0192 Katy ISD 2,345 2,618 3,162 18,5613 Cypress‐Fairbanks ISD 2,650 2,428 3,743 8,1934 Lamar CISD 2,472 2,415 4,844 16,9515 Houston ISD 1,612 2,273 3,030 5,2656 Conroe ISD 1,775 1,944 4,327 26,2157 Klein ISD 1,193 1,458 2,087 2,2938 Humble ISD 1,072 1,056 1,711 8,9719 Alvin ISD 1,114 1,011 2,000 15,55810 Tomball ISD 847 938 2,274 3,83811 Clear Creek ISD 828 879 1,392 4,39212 Spring ISD 606 574 817 6,93713 Aldine ISD 537 548 823 1,72714 New Caney ISD 385 546 641 3,91215 Dickinson ISD 385 440 609 4,91316 Pearland ISD 361 383 411 42717 Montgomery ISD 324 379 1,017 4,60918 Goose Creek CISD 311 375 322 97419 Spring Branch ISD 493 374 1,431 71820 Pasadena ISD 349 362 213 232

New Housing Activity
• Tomball ISD is on track to start more than 800 homes in 2016• The district has closed 725 homes through 3Q16• Inventory has cooled slightly to better match the housing activity
levels in the region
Tomball ISD Housing Activity
Starts 2010 2011 2012 2013 2014 2015 20161Q 186 166 273 324 279 282 2102Q 230 239 416 274 355 252 1943Q 184 339 337 276 452 248 2294Q 178 252 298 233 203 214
Total 778 996 1,324 1,107 1,289 996 633
Closings 2010 2011 2012 2013 2014 2015 20161Q 128 112 289 311 221 289 2442Q 178 203 281 331 239 281 2403Q 205 340 347 277 274 273 2414Q 235 265 350 238 306 214
Total 746 920 1,267 1,157 1,040 1,057 725
0
200
400
600
800
1000
1200
1400
2010 2011 2012 2013 2014 2015 2016
Annual Starts Annual Closings Avg Inventory
3

Annual Closing Distribution 3Q16
4
Top 10 Subdivisions ‐ 3Q16 (Ranked by Annual Closings)
Rank SubdivisionAnnual Closings
Quarter Closings VDL
1 HAYDEN LAKES 201 64 1852 OAKCREST NORTH 174 52 50
3WILDWOOD AT NORTHPOINTE‐WILDWOOD 147 19 165
4 CREEKSIDE PARK WEST 142 39 5635 WOODTRACE 75 21 2756 CREEKSIDE PARK EAST 65 13 1577 NORTHPOINTE/ENCLAVE 43 12 608 CARLTONWOODS CREEKSIDE (CWC) 30 7 1329 WILLOWCREEK RANCH 23 2 6710 SONOMA RIDGE 9 2 7
TOTALS 909 231 1,661

Vacant Developed Lots 3Q16
Top 10 Subdivisions ‐ 3Q16 (Ranked by remaining VDL)
Rank SubdivisionAnnual Closings VDL Future
1 CREEKSIDE PARK WEST 142 563 2592 WOODTRACE 75 275 3953 HAYDEN LAKES 201 185 794 TWELVE OAKS PARKSIDE 0 184 0
5WILDWOOD AT NORTHPOINTE‐WILDWOOD 147 165 80
6 CREEKSIDE PARK EAST 65 157 07 CARLTON WOODS CREEKSIDE (CWC) 30 132 38 DECKER OAKS 0 130 09 LAKES AT CREEKSIDE 3 123 35710 WILLOWCREEK RANCH 23 67 92
TOTALS 686 1,981 1,265
5

Future Lots 3Q16
Top 10 Subdivisions ‐ 3Q16 (Ranked by Future Inventory)
Rank Subdivision VDL Future1 ROSEHILL RESERVE 0 8622 WOODTRACE 275 3953 OAKCREST NORTH 50 3774 LAKES AT CREEKSIDE 123 3575 CUMBERLAND CREEK 0 2716 CREEKSIDE PARK WEST 563 2597 FAIRWAY FARMS 0 2428 RALEIGH CREEK 57 2269 NORTHPOINTE/LAKES 1 22610 ENCLAVE AT NORTHPOINTE ‐ WILDWOOD 0 100
TOTALS 1,069 3,315
6

Residential ActivityCarlton Woods and Creekside Park
Future Apartments14.38 acres260 units
Future Apartments14.28 acres290 units
Creekside Park East
• 1,403 total lots• 0 futures• 16 U/C• 1,215 occupied• 157 VDL• 29 annual starts• 11 starts in 3Q16• Student Yield = 0.54
Carlton Woods
• 313 total lots• 3 future lots• 16 U/C• 152 occupied• 7 annual starts• Student Yield = 0.21
Creekside Forest Elementary Zone-
Built Out with 1,392 homes
7
_̂
_̂
_̂
KUYKENDAHL
RD
TIMBERCREEKELEM
CREEKVIEWELEM
CREEKSIDEPARKJH
CREEKVIEW
TIMBERCREEK
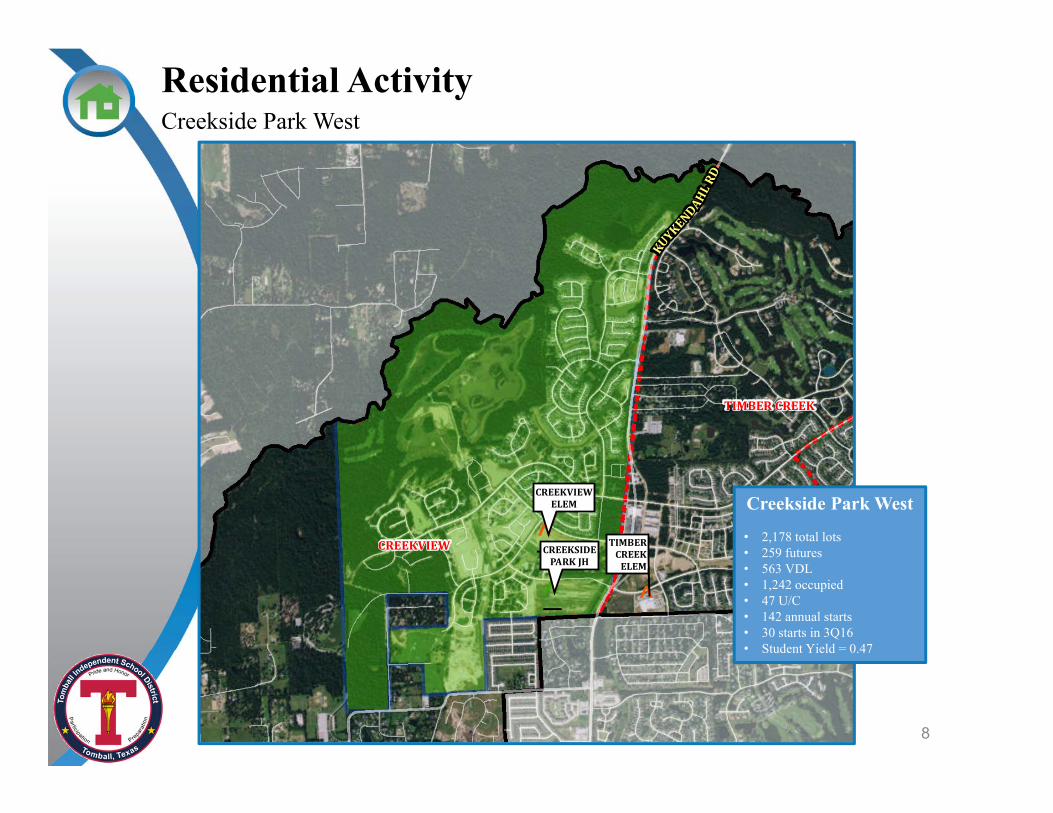
Residential Activity Creekside Park West
Creekside Park West
• 2,178 total lots• 259 futures• 563 VDL• 1,242 occupied• 47 U/C• 142 annual starts• 30 starts in 3Q16• Student Yield = 0.47
8

Residential Activity Lakes at Creekside
Lakes at Creekside• 500 total lots fall within
Tomball ISD• 354 futures• 123 VDL• 4 U/C• 21 annual starts in 2016• 4 starts in 3Q16• $300K - $1M
Klein ISD
9
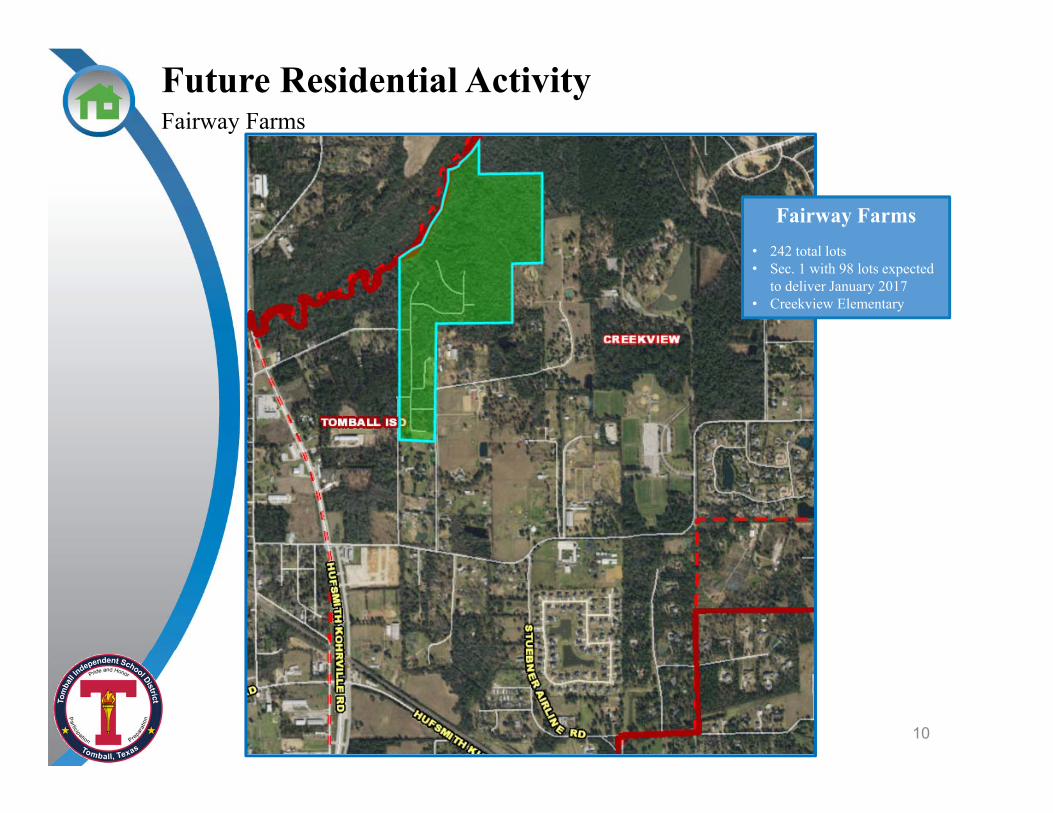
Future Residential ActivityFairway Farms
Fairway Farms• 242 total lots• Sec. 1 with 98 lots expected
to deliver January 2017• Creekview Elementary
10

Residential Activity Woodtrace Woodtrace
• 850 total lots• 395 future• 24 U/C• 275 VDL• 117 occupied• 72 annual starts• $250K – $550K• Decker Prairie Elementary• Student Yield = 0.66
Magnolia ISD
11

Future Residential ActivityRosehill Reserve
Rosehill Reserve• 862 future lots• Financing issues and
complications from recent flooding have delayed lot deliveries until further notice
• $250K – $600K• Rosehill Elementary
12

Residential ActivityHayden Lakes and Oakcrest at Wildwood
Hayden Lakes• 611 total lots• 79 futures• 48 U/C• 258 occupied• 185 VDL• 197 annual starts• $200K-$500K• Wildwood Elementary
Oakcrest at Wildwood• 1,035 total lots• 377 futures• 46 U/C• 531 occupied• 50 VDL• Building 200 homes in 2017• Anticipated build-out in 2019• $200K - $400K• Wildwood Elementary
13

Residential ActivityTreeline North
_̂_̂
_̂
NELD
RIDGEPK
WY
NORTHPOINTEINT
WILLOWCREEKELEM
WILLOWWOODJH
¬«249
CANYONPOINTE
WILLOWCREEK
Treeline North• 52 future lots• Final plat under review with Planning
and Zoning in October 2015• Development likely starting mid 2016• Willow Creek Elementary
14

Multi-Family ActivityFuture Village of Creekside Park
Future Multi-Family• 3 future MF sites• Development and unit completion
timeframe unknown at this time• 2 future sites in Timber Creek Elementary• 1 future site in Creekview Elementary
15

Multi-Family ActivityPeck Station
Peck Station• Designed to include 310
units at completion• Infrastructure GW
currently underway• Searching for developer
after initial GW completed for MF project
• Tomball Elementary
16

Multi-Family ActivityTomball Commons
Tomball Commons• Concept plan has 360 units
at completion• Rezoned for a planned
development by the city• Current timeframe from
developer is unknown• Tomball Elementary
17

2016/17 Apartment Yield Analysis
• Tomball ISD has 980 students currently residing in more than 3,600 multi-family units
• The district average multi-family yield is 0.27
18
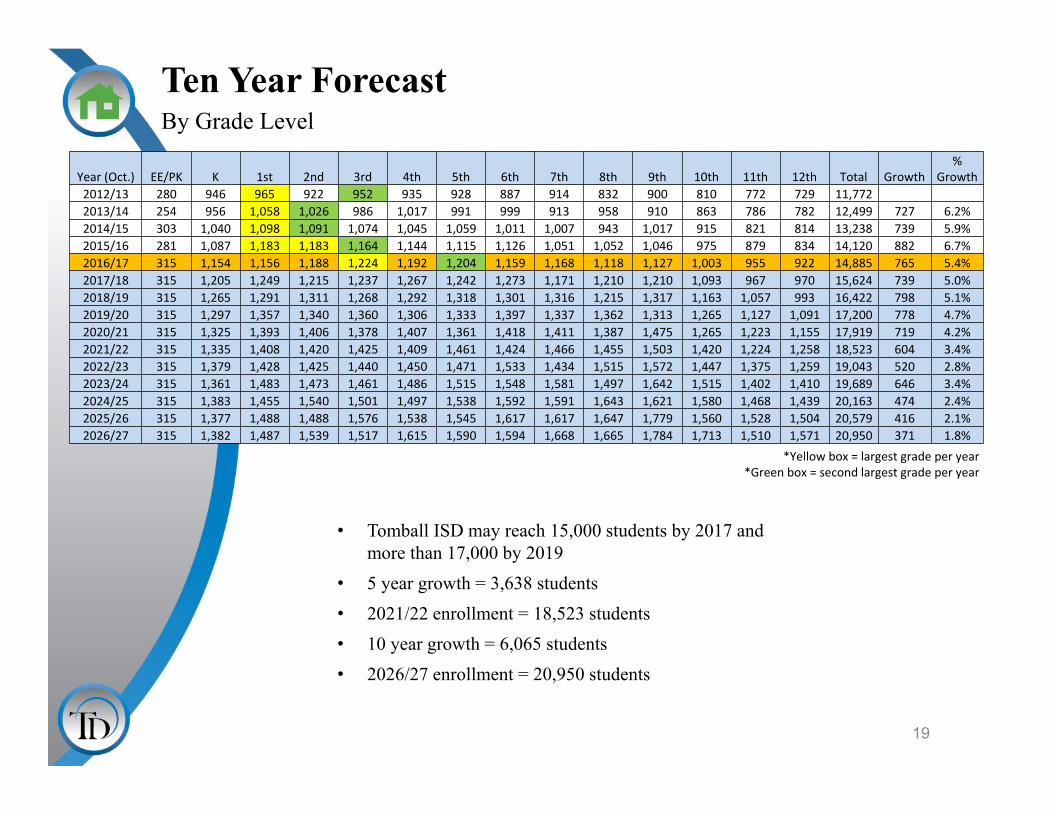
Ten Year ForecastBy Grade Level
19
• Tomball ISD may reach 15,000 students by 2017 and more than 17,000 by 2019
• 5 year growth = 3,638 students• 2021/22 enrollment = 18,523 students• 10 year growth = 6,065 students• 2026/27 enrollment = 20,950 students
*Yellow box = largest grade per year*Green box = second largest grade per year
Year (Oct.) EE/PK K 1st 2nd 3rd 4th 5th 6th 7th 8th 9th 10th 11th 12th Total Growth%
Growth2012/13 280 946 965 922 952 935 928 887 914 832 900 810 772 729 11,7722013/14 254 956 1,058 1,026 986 1,017 991 999 913 958 910 863 786 782 12,499 727 6.2%2014/15 303 1,040 1,098 1,091 1,074 1,045 1,059 1,011 1,007 943 1,017 915 821 814 13,238 739 5.9%2015/16 281 1,087 1,183 1,183 1,164 1,144 1,115 1,126 1,051 1,052 1,046 975 879 834 14,120 882 6.7%2016/17 315 1,154 1,156 1,188 1,224 1,192 1,204 1,159 1,168 1,118 1,127 1,003 955 922 14,885 765 5.4%2017/18 315 1,205 1,249 1,215 1,237 1,267 1,242 1,273 1,171 1,210 1,210 1,093 967 970 15,624 739 5.0%2018/19 315 1,265 1,291 1,311 1,268 1,292 1,318 1,301 1,316 1,215 1,317 1,163 1,057 993 16,422 798 5.1%2019/20 315 1,297 1,357 1,340 1,360 1,306 1,333 1,397 1,337 1,362 1,313 1,265 1,127 1,091 17,200 778 4.7%2020/21 315 1,325 1,393 1,406 1,378 1,407 1,361 1,418 1,411 1,387 1,475 1,265 1,223 1,155 17,919 719 4.2%2021/22 315 1,335 1,408 1,420 1,425 1,409 1,461 1,424 1,466 1,455 1,503 1,420 1,224 1,258 18,523 604 3.4%2022/23 315 1,379 1,428 1,425 1,440 1,450 1,471 1,533 1,434 1,515 1,572 1,447 1,375 1,259 19,043 520 2.8%2023/24 315 1,361 1,483 1,473 1,461 1,486 1,515 1,548 1,581 1,497 1,642 1,515 1,402 1,410 19,689 646 3.4%2024/25 315 1,383 1,455 1,540 1,501 1,497 1,538 1,592 1,591 1,643 1,621 1,580 1,468 1,439 20,163 474 2.4%2025/26 315 1,377 1,488 1,488 1,576 1,538 1,545 1,617 1,617 1,647 1,779 1,560 1,528 1,504 20,579 416 2.1%2026/27 315 1,382 1,487 1,539 1,517 1,615 1,590 1,594 1,668 1,665 1,784 1,713 1,510 1,571 20,950 371 1.8%

Summary
• Houston’s unemployment rate is currently near 5%, and has risen 0.4% in the last 12 months.
• The Wildwood Elementary zone has accounted for more than half of all district annual closings due to activity in Hayden Lakes, Oakcrest at Wildwood and Wildwood at Northpointe.
• Tomball ISD has more than 3,800 planned future lots.
• Roughly 6.8% of the current student body resides in multi-family units.
• The district may add more than 3,600 students by 2021.
• Fall 2021 enrollment: 18,523 students.
• The 10 year enrollment forecast adds over 6,000 students to the district by the 2026/27 school year.
20

Future Planning
21
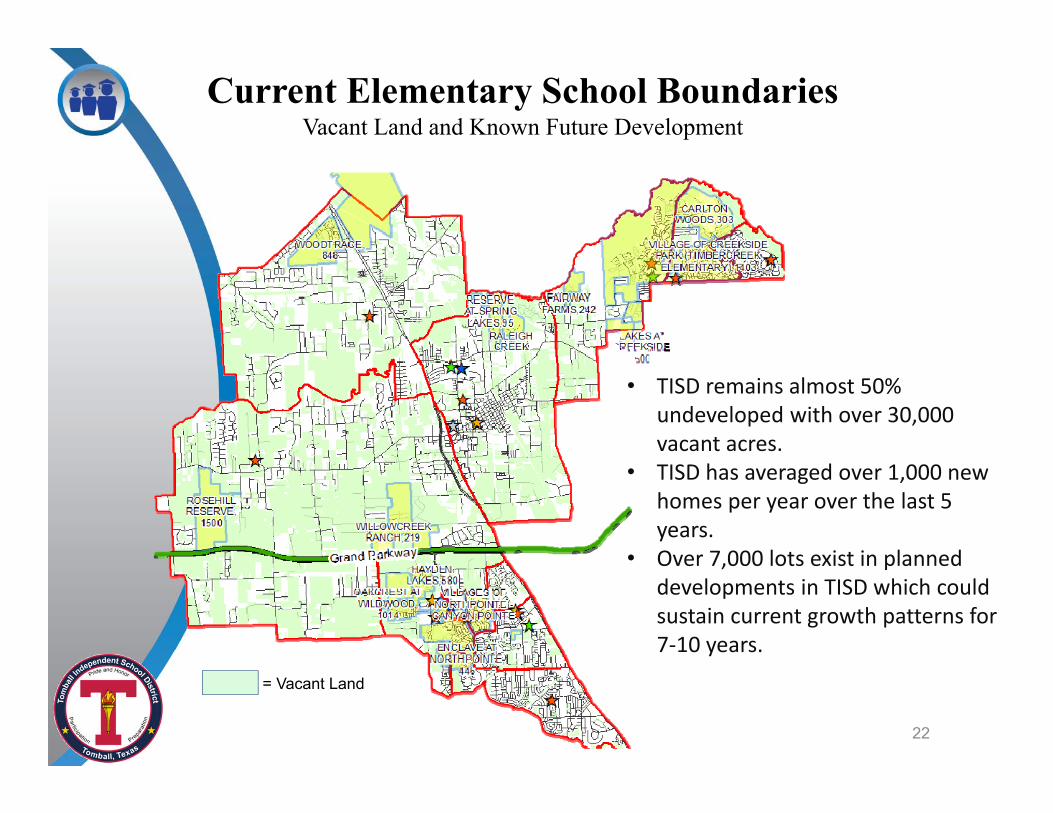
Current Elementary School Boundaries Vacant Land and Known Future Development
• TISD remains almost 50% undeveloped with over 30,000 vacant acres.
• TISD has averaged over 1,000 new homes per year over the last 5 years.
• Over 7,000 lots exist in planned developments in TISD which could sustain current growth patterns for 7‐10 years.
= Vacant Land
22

Tomball Memorial High School ZoneVacant Land and Known Future Development
• TMHS zone has over 2,700 vacant acres.• Over 2,000 existing or future home sites.
= Vacant Land
23
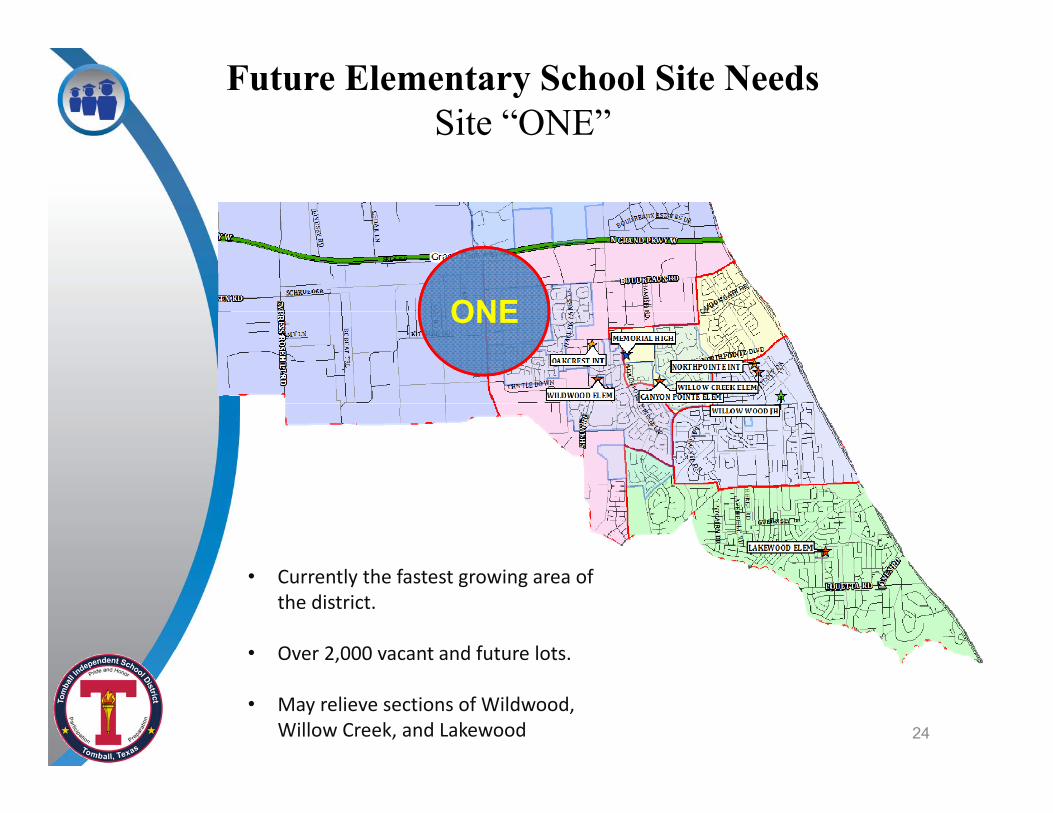
Future Elementary School Site Needs Site “ONE”
• Currently the fastest growing area of the district.
• Over 2,000 vacant and future lots.
• May relieve sections of Wildwood, Willow Creek, and Lakewood
ONE
24
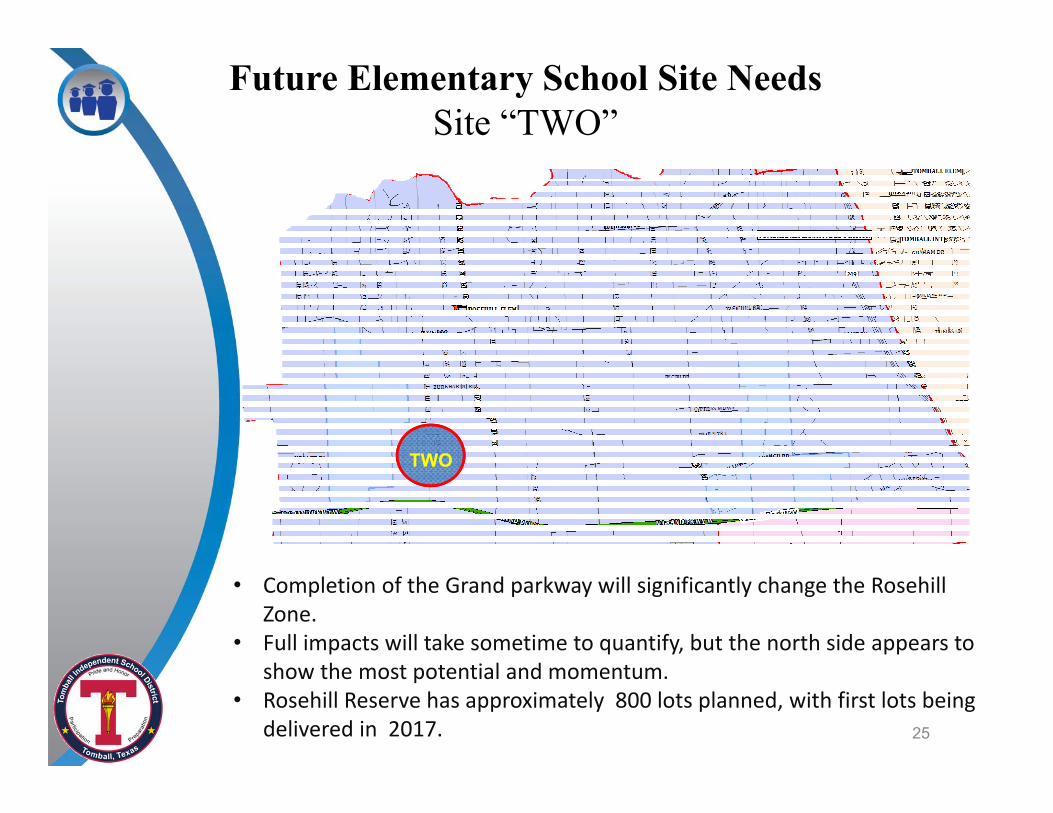
Future Elementary School Site Needs Site “TWO”
• Completion of the Grand parkway will significantly change the Rosehill Zone.
• Full impacts will take sometime to quantify, but the north side appears to show the most potential and momentum.
• Rosehill Reserve has approximately 800 lots planned, with first lots being delivered in 2017.
TWO
25
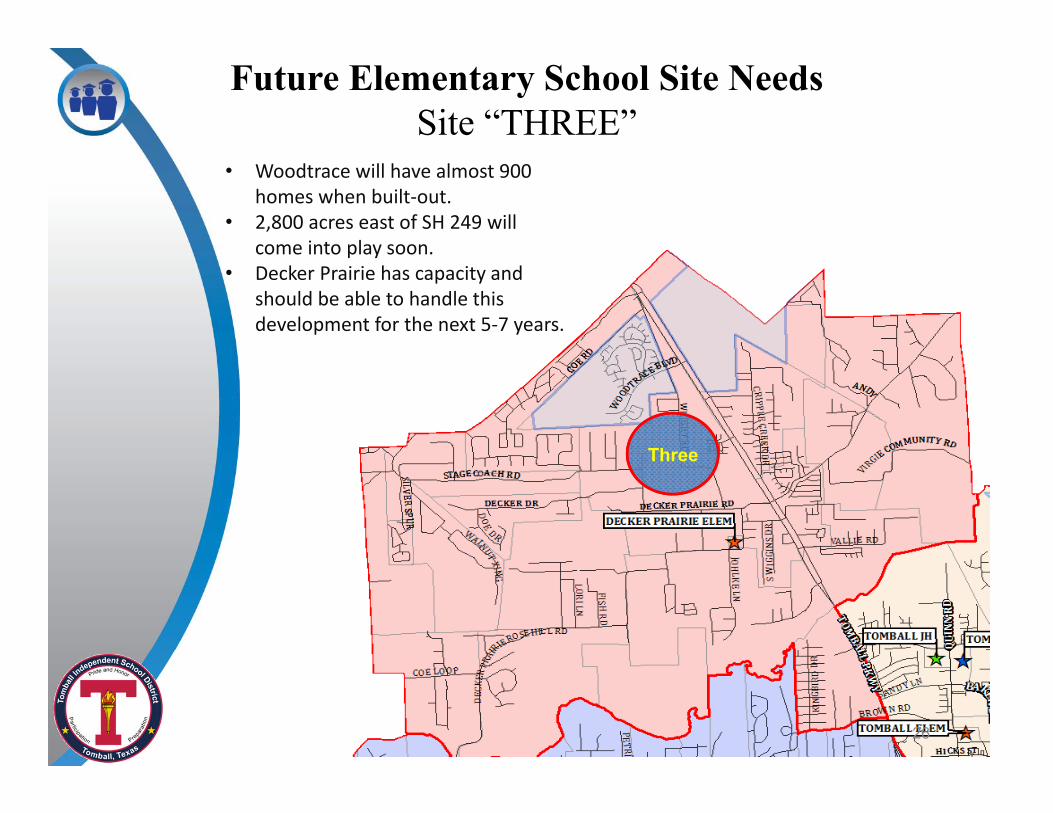
Future Elementary School Site Needs Site “THREE”
• Woodtrace will have almost 900 homes when built‐out.
• 2,800 acres east of SH 249 will come into play soon.
• Decker Prairie has capacity and should be able to handle this development for the next 5‐7 years.
Three
26
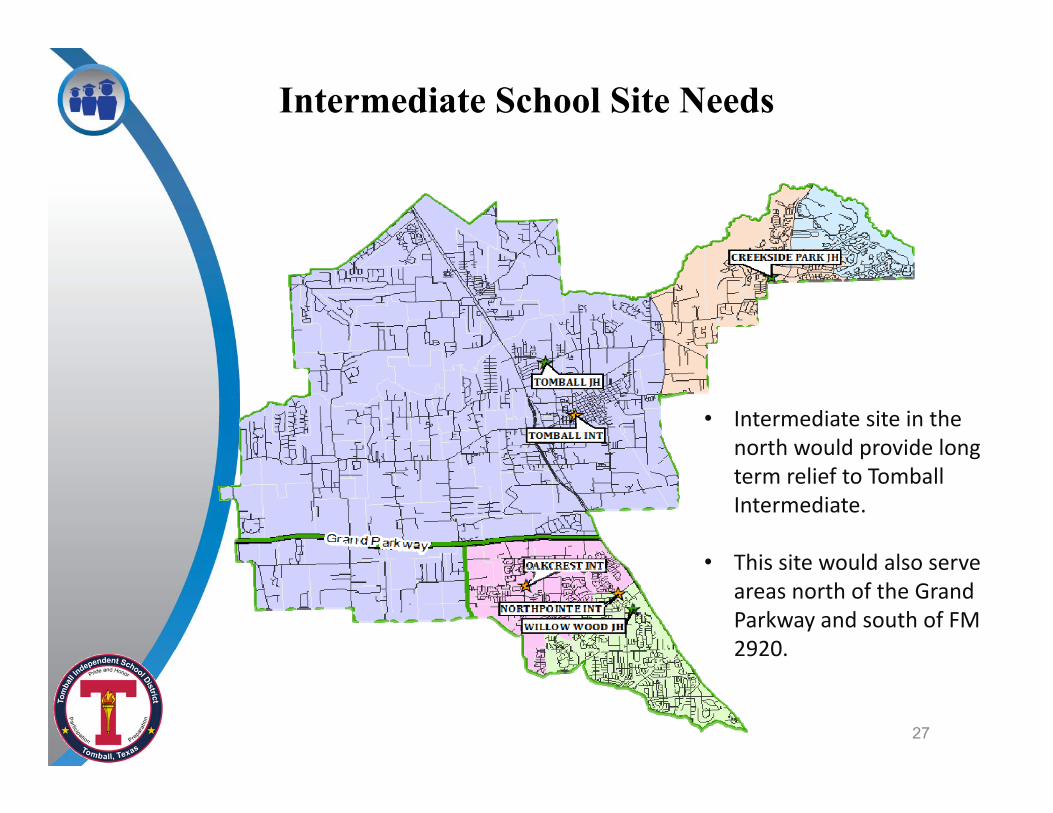
Intermediate School Site Needs
• Intermediate site in the north would provide long term relief to Tomball Intermediate.
• This site would also serve areas north of the Grand Parkway and south of FM 2920.
27

Junior High School Site Needs
• Junior High site in the proximity of Telge Road would relieve Willow Wood.
• This site would likely also serve areas north of the Grand Parkway and south of FM 2920.JH
Site
28

Future High School Site Needs
• Future High School needs will be dependent on district capacity decisions.
THS Capacity: 3,628 / 4,172TMHS Capacity: 2,349 / 2,701
• Tomball Memorial may exceed capacity in 4 years.
29
Questions
30


![260-2501 Tipping Bucket Rain Gauge User ManualE } À > Ç v Æ } } ] } v z z z z z z z z z z z z z z z z z z z z z z z z z z z z z z z z z z z z z z z z z z z z z z z z z z z z z z](https://static.fdocuments.in/doc/165x107/60df9ff0f4aa6921e4565fc2/260-2501-tipping-bucket-rain-gauge-user-manual-e-v-v-z-z.jpg)