Dr Prashant Kumar - UN ESCAP 2B - Prashant...Dr Prashant Kumar Department of Civil & Environmental...
14
Urban Nexus In Practice, What Can Work and What May Not? by Dr Prashant Kumar Department of Civil & Environmental Engineering UN ESCAP Expert Group Meeting, 10-11 Nov 2016, Bangkok www.surrey.ac.uk
Transcript of Dr Prashant Kumar - UN ESCAP 2B - Prashant...Dr Prashant Kumar Department of Civil & Environmental...

Urban Nexus
In Practice, What Can Work and What May Not?
by
Dr Prashant Kumar
Department of Civil & Environmental Engineering
UN ESCAP Expert Group Meeting, 10-11 Nov 2016, Bangkok
www.surrey.ac.uk

Outline
Background
Global Scale
Emission-Food-Land use Nexus
City Scale
Water-Energy-Pollution Nexus for Megacity Delhi
Building Scale
Energy-Pollution
Summary & Conclusions
www.surrey.ac.uk

The Need
Growing urbanisation – global challenges – climate change, pollution
and demand for clean water, air, energy and food
30 megacities (>10 million); 10 new cities each year (>7 million)
~70% of global population in urban areas by 2050
UN Development Goals for 2030 – halving premature deaths caused
by indoor and outdoor pollution
Emissions: Climate (CO2, N2O, CH4) & Health (PM, SO2, NO2, CO)
Inter-dependencies: Food Land Energy Emissions Water
www.surrey.ac.uk
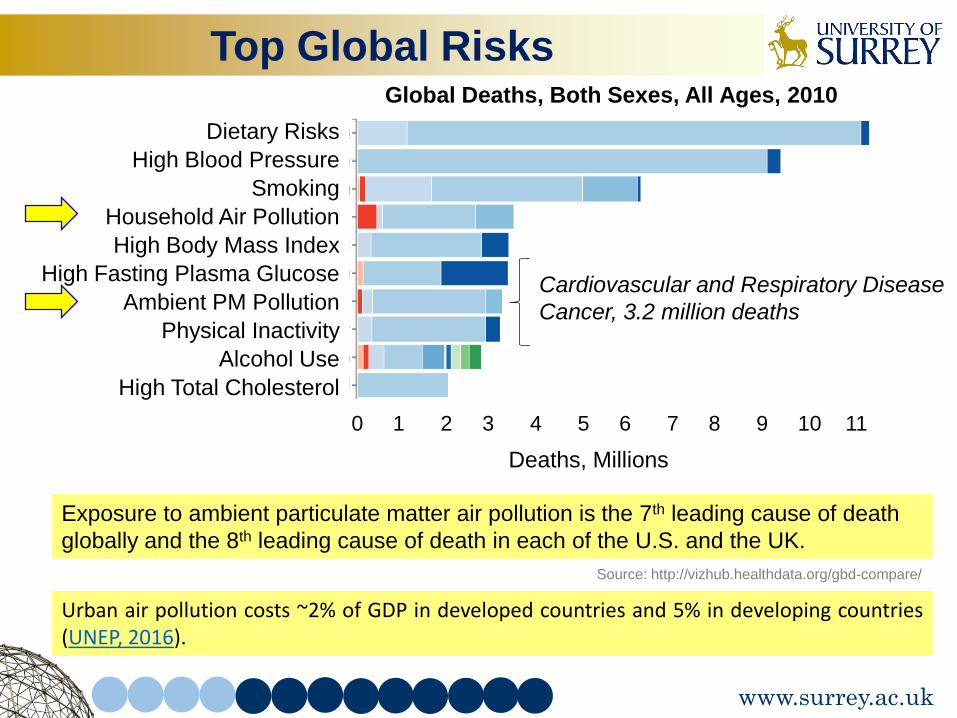
Top Global Risks Global Deaths, Both Sexes, All Ages, 2010
Dietary Risks
High Blood Pressure
Smoking
Household Air Pollution
High Body Mass Index
High Fasting Plasma Glucose
Ambient PM Pollution
Physical Inactivity
Alcohol Use
High Total Cholesterol
Deaths, Millions
Cardiovascular and Respiratory Disease
Cancer, 3.2 million deaths
Exposure to ambient particulate matter air pollution is the 7th leading cause of death
globally and the 8th leading cause of death in each of the U.S. and the UK.
Source: http://vizhub.healthdata.org/gbd-compare/
Urban air pollution costs ~2% of GDP in developed countries and 5% in developing countries (UNEP, 2016).
0 1 2 3 4 5 6 7 8 9 10 11
www.surrey.ac.uk
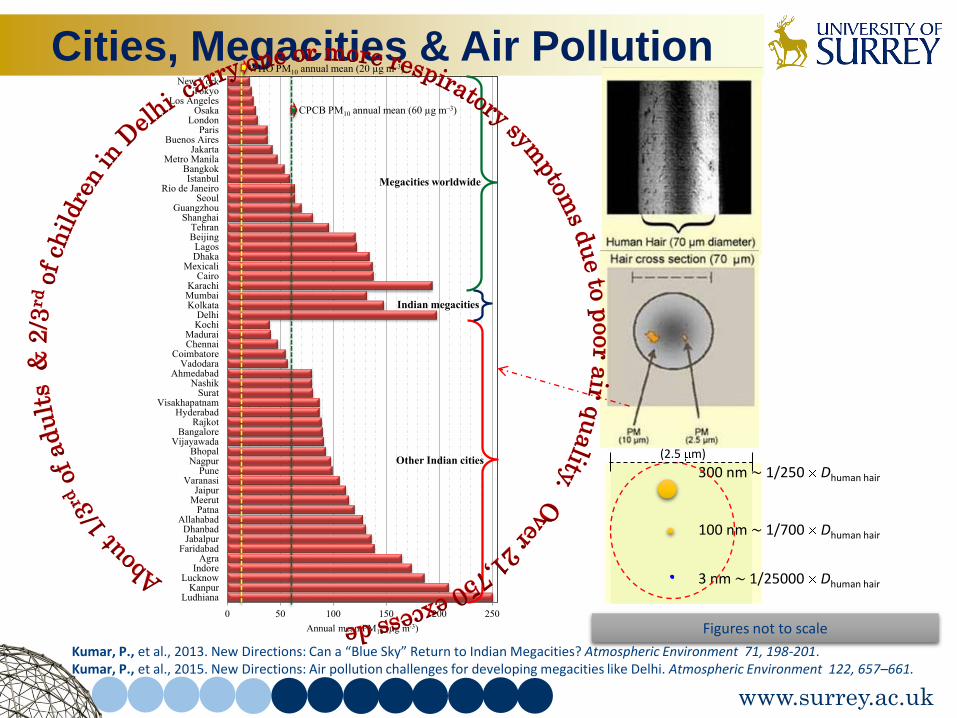
Cities, Megacities & Air Pollution
www.surrey.ac.uk
0 50 100 150 200 250
LudhianaKanpur
LucknowIndore
AgraFaridabad
JabalpurDhanbad
AllahabadPatna
MeerutJaipur
VaranasiPune
NagpurBhopal
VijayawadaBangalore
RajkotHyderabad
VisakhapatnamSurat
NashikAhmedabad
VadodaraCoimbatore
ChennaiMadurai
KochiDelhi
KolkataMumbaiKarachi
CairoMexicali
DhakaLagos
BeijingTehran
ShanghaiGuangzhou
SeoulRio de Janeiro
IstanbulBangkok
Metro ManilaJakarta
Buenos AiresParis
LondonOsaka
Los AngelesTokyo
New York
Annual mean PM10 (µg m-3)
WHO PM10 annual mean (20 µg m–3)
Megacities worldwide
Other Indian cities
Indian megacities
CPCB PM10 annual mean (60 µg m–3)
Kumar, P., et al., 2013. New Directions: Can a “Blue Sky” Return to Indian Megacities? Atmospheric Environment 71, 198-201. Kumar, P., et al., 2015. New Directions: Air pollution challenges for developing megacities like Delhi. Atmospheric Environment 122, 657–661.
Figures not to scale
(2.5 m)
300 nm ~ 1/250 Dhuman hair
100 nm ~ 1/700 Dhuman hair
3 nm ~ 1/25000 Dhuman hair

Global Scale: Emission-Food Nexus
Scenarios of adaptation
• The scenarios determine how sensitive agricultural production is to climate-related hazards and the capacity to cope with
climate-related food shocks in the future high, low or no adaptation scenarios
• The ‘’low’ and high’ adaptation scenario corresponds to a change of 5-10% and 10-15% in the 2050s, respectively,
compared with present-day
• The low (+2 C), medium (+2.5-3ºC) and high (≥4 C), emissions scenario above pre-industrial levels by the end of the 21st
century
Source: http://www.metoffice.gov.uk/food-insecurity-index/
Present day
www.surrey.ac.uk

www.surrey.ac.uk
Emissions: High (≥4°C); Adaptation: None
Emissions: Intermediate (+2.5-3°C); Adaptation: None
Emissions: Low (+2°C); Adaptation: None
Global Scale: Emission-Food Nexus
UN ESCAP Meeting Nov 2016
2050
Emissions: High (≥4°C); Adaptation: High
Emissions: Intermediate (+2.5-3°C); Adaptation: Low
Emissions: Low (+2°C); Adaptation: Low
2050
Source

City Scale
• Challenges in urban management are overwhelmingly addressed within disciplinary boundaries
• Feedback, synergies and trade-offs between components of urban systems are still poorly understood
• Need broader nexus - interdependencies of urban activities
• It’s a mass balance and assess trade-offs between components
• But balance is sensitive and trade-offs specific to cities
www.surrey.ac.uk
Water Energy Pollution
Land use
Food
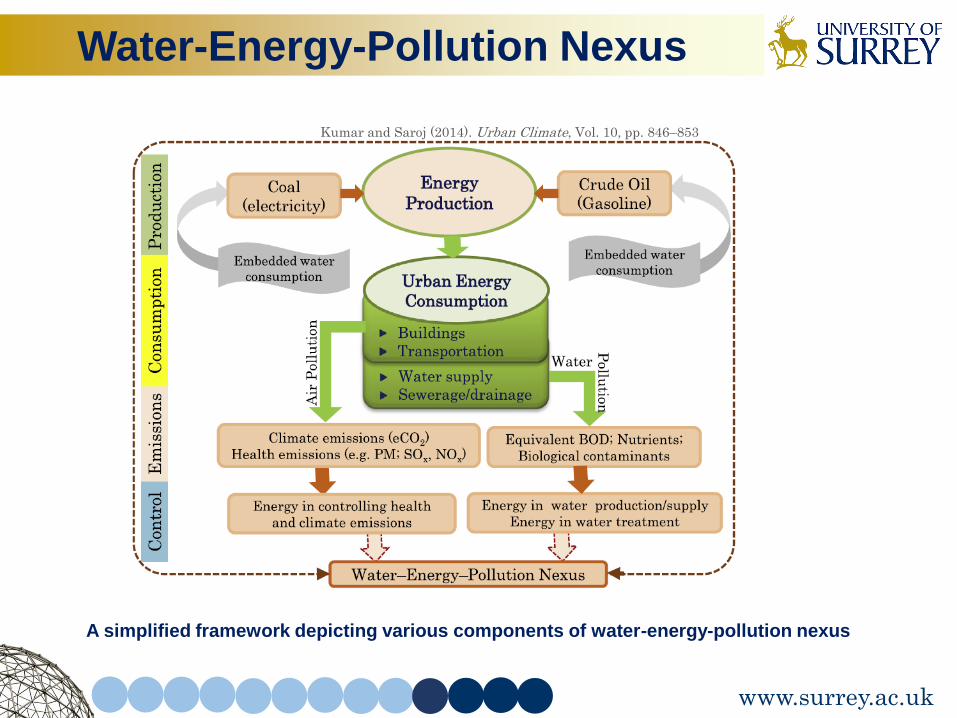
Water-Energy-Pollution Nexus
A simplified framework depicting various components of water-energy-pollution nexus
www.surrey.ac.uk
Kumar and Saroj (2014). Urban Climate, Vol. 10, pp. 846–853

City Scale (Energy-Pollution)
www.surrey.ac.uk
Power plants Transportation
Supply ~735 MW (demand 4464 MW) 4.74 million (2010)
2.72 million tons of eCO2/year +
20-25% plant output + ~27% transmission = 4 million tons of eCO2/year
Normalisation gives: Climate: ~4 million tons eCO2 emissions/year
Health: ~0.55 million tons health emissions/year
Delhi
Climate emissions >>>> Health emissions
Climate emissions >>>> Health emissions
~10.9 million tons CO2/year ~0.61 million tons health emissions/year
Source: Kumar and Saroj (2014). Urban Climate, Vol. 10, pp. 846–853

City Scale (Water-Energy)
www.surrey.ac.uk
Power plants Treatment
Supply ~735 MW (demand 4464 MW) 4.3 million m3/day; 20 million (2011)
1.4 million m3/day water consumed +
0.105 million m3/day water evaporated +
Waste water produced
Delhi
Power plants ~1/3rd of water supply
Pumping distribution >>>> Treatment
~0.44 (0.22+0.22) million kWh/day (potable + waste water treatment)
+ ~1.76 million kWh/day
(Pumping and distribution)
Source: Kumar and Saroj (2014). Urban Climate, Vol. 10, pp. 846–853
Energy requirement in production and supply of water + wastewater management is a small fraction (15%) of total energy supply of Delhi

Building Scale
www.surrey.ac.uk
Major share of total generated energy is consumed by modern urban
buildings; both commercial and residential buildings are culprits
These buildings cover only 0.2% of land worldwide, but account for 30−40%
energy use and ∼8% of total greenhouse gas emissions
HVAC accounts for ½ of building energy use, which is generated by power
plants emitting pollutants that add to background levels penetrating indoors
Quantitative correlations between energy use and indoor air killing 4.3
million/yr globally is poorly understood; more relevant to rural world,
low/middle income countries
While optimal energy use is key for sustainable building operation,
maintaining quality of indoor air to acceptable standards is equally important
from a health perspective
Kumar and Morawska (2013). Env Sc Tech 47, 7591-7592

Summary & Conclusions Growing urban population and urban areas, stressing land use (majorly the
productive agricultural land) and food security
Important to identify major and modest contributors, before targeting them
Putting forward a right combination of energy efficient building designs,
energy saving technologies, informed behavioural choices and optimization
based on local climatic conditions can lead to substantial reductions in
energy consumption and hence, pollutant emissions within the buildings
Energy required for water production and quality improvements very small
compared with other sectors
Inefficient water pumping has an impact on global warming and climate
change through higher greenhouse gas emissions (e.g., 20 to 30% increase
in pump efficiency decrease 50% carbon emissions)
Fulfilling small energy demand of wastewater treatment for environmental
protection can bring substantial benefit to water availability for better
energy/economic productivity and public health
Nexus sectors are overwhelmingly studied in isolation; decision and
priorities on trade-offs based on local needs
www.surrey.ac.uk

THANK YOU
CONTACT
DR PRASHANT KUMAR
Email: [email protected]
Webpage: http://www2.surrey.ac.uk/cce/people/prashant_kumar/
www.iscapeproject.eu