Dr Emma Page - bhiva.org · HIV ART 4. HIV NAÏVE 5. HCV HIV ART 6. HCV HIV NAÏVE • Blood...
27
Dr Emma Page Imperial College London 16-19 April 2013, Manchester Central Convention Complex 19 th Annual Conference of the British HIV Association (BHIVA)
-
Upload
trinhtuong -
Category
Documents
-
view
213 -
download
0
Transcript of Dr Emma Page - bhiva.org · HIV ART 4. HIV NAÏVE 5. HCV HIV ART 6. HCV HIV NAÏVE • Blood...

Dr Emma Page Imperial College London
16-19 April 2013, Manchester Central Convention Complex
19th Annual Conference of the British HIV Association (BHIVA)

Alterations in the balance of Th1 cells to Th17 and Th22 cells in HIV-1/HCV co-infection is associated with immune activation, microbial translocation
and liver fibrosis
EE Page, L Greathead, R Metcalf, M Hart, SA Clark, A Boasso, D Fuchs, M Anderson, F Gotch, B Gazzard, M Nelson, P
Kelleher

Background
• HIV/HCV: more rapid & frequent progression to liver fibrosis1
• Mechanisms driving liver fibrosis likely multiple & complex
• Increased microbial translocation may drive liver fibrosis:
– promoting systemic immune activation2-4
– LPS signalling via TLR4 in the liver5
• Th176 & Th227 cells:
– Integral to maintaining the immune integrity of the gut mucosa
– Depletion in HIV may lead to increased microbial translocation
• CD4 T cell subsets have interdependent relationships
- Ratios more important than proportions in determining immune control
- Th17 & Th1 cells have reciprocal relationship
1.Soto. J Hepatol 1997;26:1-5S, 2.Schacker TW. J Clin Invest 2002;110:1133-1139, 3.Estes JD. JID 2008;198:45664, 4.Estes JD. JID 2007;195:551-61, 5.
Seki E. Nat Med 2007;13:1324-13324, 6. Acosta-Rodriguez EV. Nat Imunol 2007;8:639-646, 7. Duhen T. Nat Immunol 2009;10:857-863.

Hypothesis
Alterations in Th1, Th17 and Th22 cells in HIV-1 infection are associated with microbial translocation and immune activation and the rapid development
of fibrotic liver disease in HIV-1/HCV co-infection
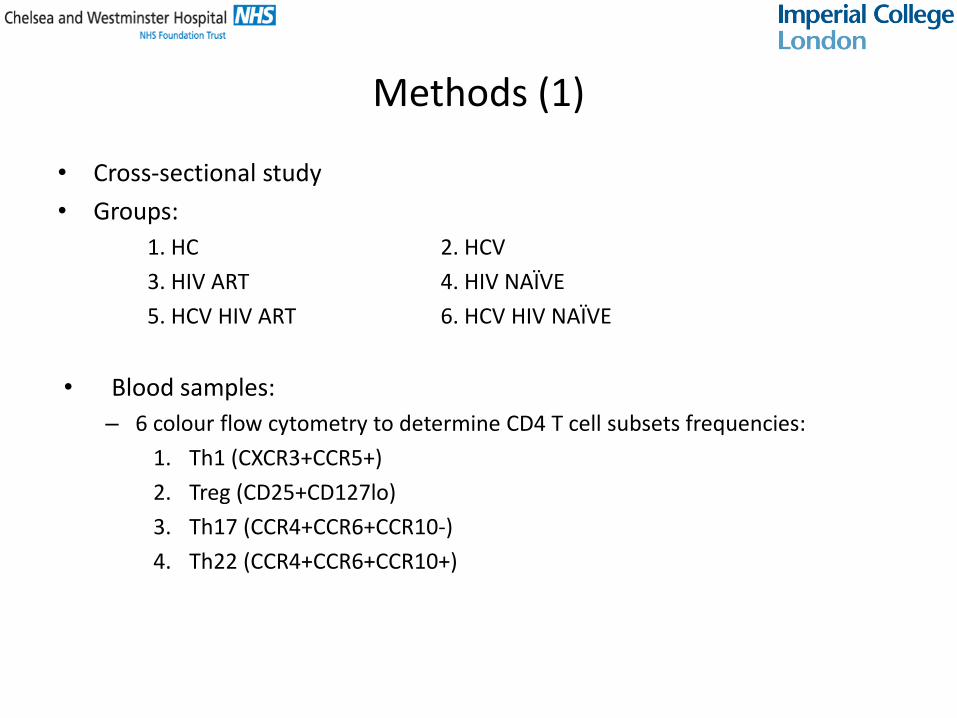
Methods (1)
• Cross-sectional study
• Groups:
1. HC 2. HCV
3. HIV ART 4. HIV NAÏVE
5. HCV HIV ART 6. HCV HIV NAÏVE
• Blood samples:
– 6 colour flow cytometry to determine CD4 T cell subsets frequencies:
1. Th1 (CXCR3+CCR5+)
2. Treg (CD25+CD127lo)
3. Th17 (CCR4+CCR6+CCR10-)
4. Th22 (CCR4+CCR6+CCR10+)


Methods (3)
• Blood samples (continued):
– ELISAs on serum
• Neopterin (marker of immune activation)
• LBP (markers of microbial translocation)
• FibroScan
• Statistical analysis: (Graphpad Prism version 5.0)
– Categorical variables: Chi-squared analysis / Fisher’s exact test
– Continuous variables: Kuskal Wallis test with Dunn’s post test
(to correct for multiple comparisons)
– Correlations: Spearman’s rank correlation coefficient
(r = +/- 0.5000 taken as significant)
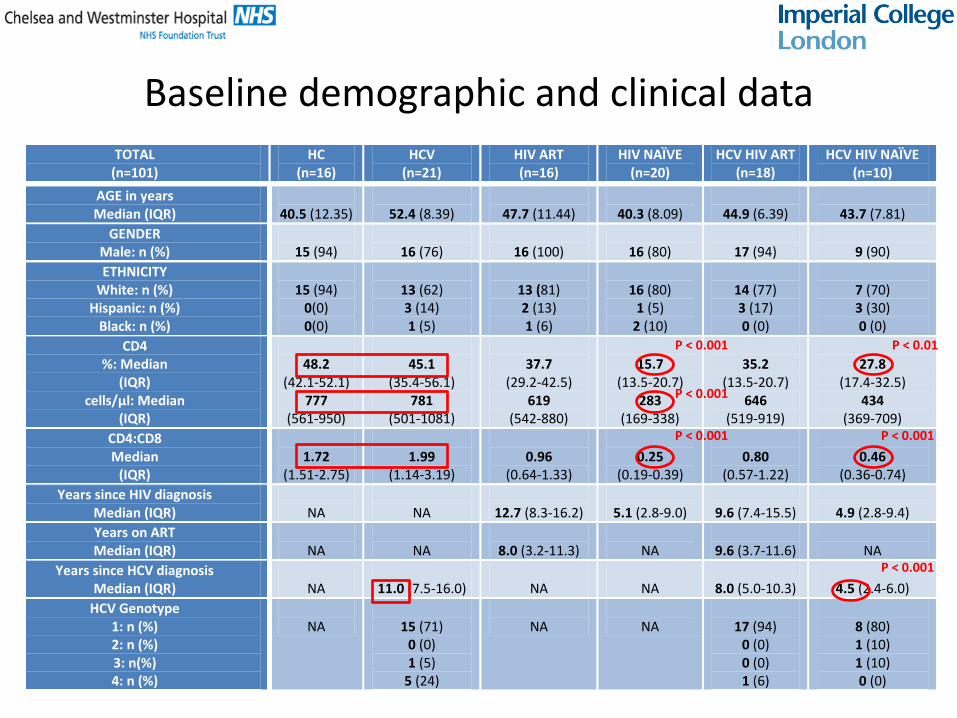
TOTAL (n=101)
HC (n=16)
HCV (n=21)
HIV ART (n=16)
HIV NAÏVE (n=20)
HCV HIV ART (n=18)
HCV HIV NAÏVE (n=10)
AGE in years Median (IQR)
40.5 (12.35)
52.4 (8.39)
47.7 (11.44)
40.3 (8.09)
44.9 (6.39)
43.7 (7.81)
GENDER Male: n (%)
15 (94)
16 (76)
16 (100)
16 (80)
17 (94)
9 (90)
ETHNICITY White: n (%)
Hispanic: n (%) Black: n (%)
15 (94)
0(0) 0(0)
13 (62) 3 (14) 1 (5)
13 (81) 2 (13) 1 (6)
16 (80)
1 (5) 2 (10)
14 (77) 3 (17) 0 (0)
7 (70) 3 (30) 0 (0)
CD4 %: Median
(IQR) cells/µl: Median
(IQR)
48.2
(42.1-52.1) 777
(561-950)
45.1
(35.4-56.1) 781
(501-1081)
37.7
(29.2-42.5) 619
(542-880)
15.7
(13.5-20.7) 283
(169-338)
35.2
(13.5-20.7) 646
(519-919)
27.8
(17.4-32.5) 434
(369-709)
CD4:CD8 Median
(IQR)
1.72
(1.51-2.75)
1.99
(1.14-3.19)
0.96
(0.64-1.33)
0.25
(0.19-0.39)
0.80
(0.57-1.22)
0.46
(0.36-0.74)
Years since HIV diagnosis Median (IQR)
NA
NA
12.7 (8.3-16.2)
5.1 (2.8-9.0)
9.6 (7.4-15.5)
4.9 (2.8-9.4)
Years on ART Median (IQR)
NA
NA
8.0 (3.2-11.3)
NA
9.6 (3.7-11.6)
NA
Years since HCV diagnosis Median (IQR)
NA
11.0 (7.5-16.0)
NA
NA
8.0 (5.0-10.3)
4.5 (2.4-6.0)
HCV Genotype 1: n (%) 2: n (%) 3: n(%) 4: n (%)
NA
15 (71)
0 (0) 1 (5)
5 (24)
NA
NA
17 (94)
0 (0) 0 (0) 1 (6)
8 (80) 1 (10) 1 (10) 0 (0)
Baseline demographic and clinical data
P < 0.01 P < 0.001
P < 0.001
P < 0.001 P < 0.001
P < 0.001
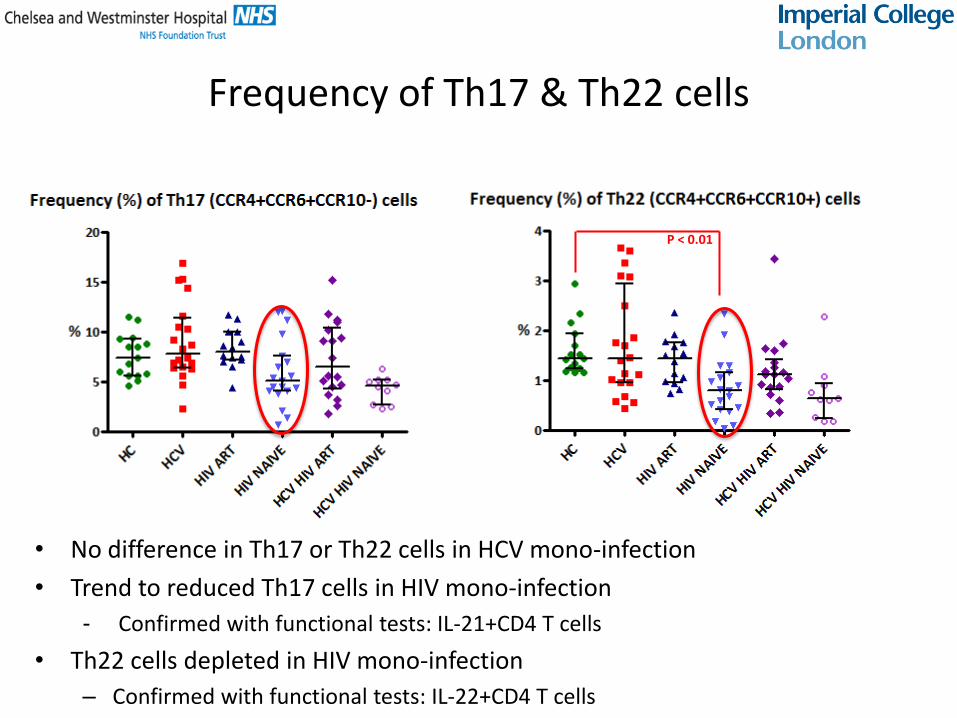
Frequency of Th17 & Th22 cells
P < 0.01
• No difference in Th17 or Th22 cells in HCV mono-infection
• Trend to reduced Th17 cells in HIV mono-infection
- Confirmed with functional tests: IL-21+CD4 T cells
• Th22 cells depleted in HIV mono-infection
– Confirmed with functional tests: IL-22+CD4 T cells

Frequency of Th17 & Th22 cells
P < 0.05
P < 0.01
P < 0.01
P < 0.05
• Th17 and Th22 cells depleted in HIV/HCV co-infection
– Confirmed with functional tests: IL-21+CD4 T cells & IL-22+CD4 T cells

Frequency of Treg & Th1 cells
P < 0.05
• No difference between groups in Treg cells
• Th1 cells increased in HCV
• Th1 cells unchanged in HIV

Frequency of Treg & Th1 cells
P < 0.05
P < 0.001 P < 0.05
• Marked depletion of Th1 cells in HIV/HCV co-infection
– Striking compared to HCV mono-infection
– Deletion compared to HIV mono-infection

Shifts in CD4 T cell subsets
P < 0.001 P < 0.05
• HIV/HCV co-infection
reduced Th1:Th22 & Th1:Th17 cell ratio

0 5 10 15 20 250
1
2
3
4
0 10 20 30 40 50 600.0
0.5
1.0
1.5
2.0
2.5
0 5 10 15 20 25 300.0
0.5
1.0
1.5
2.0
2.5
0 5 10 15 20 250
5
10
15
20
0 10 20 30 40 50 600
3
6
9
12
15
0 5 10 15 20 25 300
2
4
6
8
10
0 5 10 15 20 250
5
10
1522.525.0
0 10 20 30 40 50 600
2
4
6
8
10
0 5 10 15 20 250.0
0.3
0.6
0.9
1.2
1.5
Correlations: immune activation & CD4 T cell subsets
Th17
Th22
neopterin
neopterin neopterin
neopterin
HIV mono-infection HIV/HCV co-infection
r -0.5737
r -0.5316
r 0.1515
r 0.1459
Th1
neopterin neopterin
r -0.4236 r -0.5793
HCV mono-infection
r -0.4339
r -0.4776
r -0.1167
neopterin
neopterin
neopterin

0 5 10 15 20 250
1
2
3
4
0 10 20 30 40 50 600.0
0.5
1.0
1.5
2.0
2.5
0 5 10 15 20 25 300.0
0.5
1.0
1.5
2.0
2.5
0 5 10 15 20 250
5
10
15
20
0 10 20 30 40 50 600
3
6
9
12
15
0 5 10 15 20 25 300
2
4
6
8
10
0 5 10 15 20 250
5
10
1522.525.0
0 10 20 30 40 50 600
2
4
6
8
10
0 5 10 15 20 250.0
0.3
0.6
0.9
1.2
1.5
Correlations: immune activation & CD4 T cell subsets
Th17
Th22
neopterin
neopterin neopterin
neopterin
HIV mono-infection HIV/HCV co-infection
r -0.5737
r -0.5316
r 0.1515
r 0.1459
Th1
neopterin neopterin
r -0.4236 r -0.5793
HCV mono-infection
r -0.4339
r -0.4776
r -0.1167
neopterin
neopterin
neopterin

0 10 20 30 40 50 60 700
1
2
3
4
0 20 40 60 80 1000.0
0.5
1.0
1.5
2.0
2.5
0 20 40 60 80 1000.0
0.5
1.0
1.5
2.0
2.5
0 20 40 600
5
10
15
20
0 20 40 60 80 1000
3
6
9
12
15
0 20 40 60 80 1000
2
4
6
8
10
0 20 40 60 80 1000
5
10
15
20
25
0 20 40 60 80 1000
2
4
6
8
10
0 20 40 60 80 1000.0
0.5
1.0
1.5
2.0
Correlations: microbial translocation & CD4 T cell subsets
Th17
Th22
LBP
LBP LBP
LBP
HIV mono-infection HIV/HCV co-infection
r -0.5029
r -0.3800
r -0.0303
r -0.0973
Th1
LBP LBP
r -0.3717 r -0.5000
HCV mono-infection
r 0.3829
0.3829
r -0.1509
LBP
LBP
LBP

0 5 10 15 20 250
1
2
3
4
5
0 10 20 30 40 50 600.0
0.5
1.0
1.52.53.0
0 10 20 300.0
0.1
0.2
0.3
0.4
0.5
0 5 10 15 20 250
5
10
15
20
25
0 20 40 60 800
3
6
9
12
152530
0 10 20 300.0
0.5
1.0
1.5
2.0
2.55.05.5
Th1:Th17
Th1:Th22
neopterin
neopterin neopterin
neopterin
HCV mono-infection HIV/HCV co-infection
r -0.1544
r -0.0542
r 0.5170
r 0.4380
HIV mono-infection
r -0.5515
r -0.4788
neopterin
neopterin
Correlations: immune activation & CD4 T cell shifts

0 5 10 15 20 250
1
2
3
4
5
0 10 20 30 40 50 600.0
0.5
1.0
1.52.53.0
0 10 20 300.0
0.1
0.2
0.3
0.4
0.5
0 5 10 15 20 250
5
10
15
20
25
0 20 40 60 800
3
6
9
12
152530
0 10 20 300.0
0.5
1.0
1.5
2.0
2.55.05.5
Th1:Th17
Th1:Th22
neopterin
neopterin neopterin
neopterin
HCV mono-infection HIV/HCV co-infection
r -0.1544
r -0.0542
r 0.5170
r 0.4380
HIV mono-infection
r -0.5515
r -0.4788
neopterin
neopterin
Correlations: immune activation & CD4 T cell shifts

0 20 40 60 800.0
0.5
1.0
1.5
2.02.54.5
0 20 40 60 80 1000.0
0.5
1.0
1.52.53.0
0 20 40 60 80 1000.0
0.1
0.2
0.3
0.4
0.5
0 20 40 60 800
5
10
15
20
25
0 20 40 60 80 1000
10
20
30
0 20 40 60 80 1000
2
4
6
Th1:Th17
Th1:Th22
LBP
LBP LBP
LBP
HCV mono-infection HIV/HCV co-infection
r -0.6311
r -0.5604
r 0.4688
r 0.4399
HIV mono-infection
r -0.5785
r -0.2727
LBP
LBP
Correlations: microbial translocation & CD4 T cell shifts
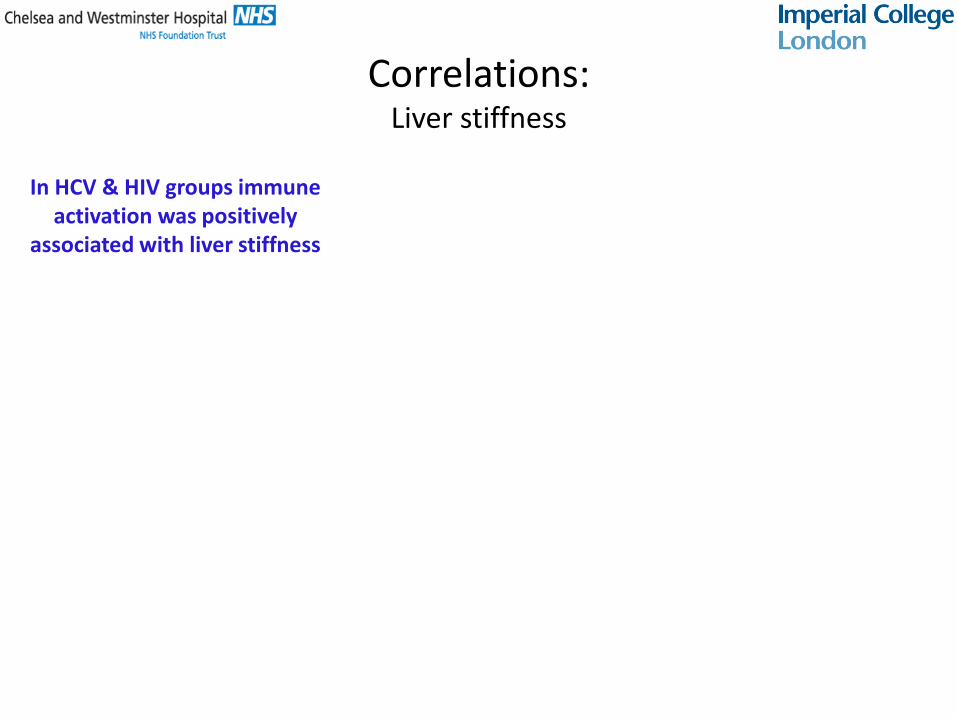
Correlations: Liver stiffness
In HCV & HIV groups immune activation was positively
associated with liver stiffness

3 6 9 120.0
0.5
1.0
1.5
Correlations: Liver stiffness
3 6 9 120.0
0.1
0.2
0.3
0.4
0.5
0 3 6 9 12 150.0
0.5
1.0
1.5
2.0
2.55.05.5
HIV/HCV co-infection
HIV/HCV co-infection HIV/HCV co-infection
Th1
Th1:Th17 Th1:Th22
Liver stiffness (Kpa)
Liver stiffness (Kpa) Liver stiffness (Kpa)
r -0.6239
r -0.6991 r -0.6869
In HCV & HIV groups immune activation was positively
associated with liver stiffness

Conclusions
• preferential depletion of Th17 and Th22 cells
• Depleted Th17 cells associated with increased levels of immune activation and microbial translocation
HIV/HCV co-infection HIV mono-infection
• depletion of Th1, Th17 & Th22 cells
AND
• Shifts away from Th1 cells towards Th17 and Th22 cells
• Shifts away from Th1 cells associated with increased levels of microbial translocation, immune activation and liver stiffness.
• preferential expansion of Th1 cells
• Shifts towards Th1 cells associated with reduced levels of microbial translocation
HCV mono-infection
In HIV mono-infection a preferential reduction in Th17 cells may lead to increased levels of microbial
translocation & immune activation.
In HIV/HCV co-infection an additional lack of Th1 cell expansion with alterations in the balance of Th1 to Th17 cells may contribute toward development of
liver fibrosis through secretion of pro-inflammatory cytokines
Limitations
• Cross-sectional – causality cannot be determined
• Accuracy of markers used for microbial translocation
• Liver fibrosis assessment: use of transient elastography rather than biopsy
• Lack of paired gut or liver samples

Acknowledgements
Patients & Staff
Peter Kelleher Sally Ann Clark Melanie Hart Louise Greathead Rebecca Metcalf Adriano Boasso
Brian Gazzard Mark Nelson Mike Anderson Grants
Dietmar Fuchs