Dr Dev Kambhampati | Census-USA- An Aging Nation
28
U.S. Department of Commerce Economics and Statistics Administration U.S. CENSUS BUREAU census.gov An Aging Nation: The Older Population in the United States Population Estimates and Projections Current Population Reports Issued May 2014 P25-1140 By Jennifer M. Ortman, Victoria A. Velkoff, and Howard Hogan INTRODUCTION This report examines how the age structure of the U.S. population is expected to change over the coming decades and focuses on the older population in terms of age, sex, race, and Hispanic origin. 1 The size and structure of the older population is important to public and private interests, both socially and economically. Between 2012 and 2050, the United States will experi- ence considerable growth in its older population (see Figure 1). 2 In 2050, the population aged 65 and over is projected to be 83.7 million, almost double its esti- mated population of 43.1 million in 2012. The baby boomers are largely responsible for this increase in the older population, as they began turning 65 in 2011. 3 By 2050, the surviving baby boomers will be over the age of 85. The aging of the population will have wide-ranging implications for the country. By “aging,” demographers often mean that the proportion of the population in the older ages increases. As the United States ages over the next several decades, its older population will become more racially and ethnically diverse. The projected growth of the older population in the United States will present challenges to policy makers and programs, such as Social Security and Medicare. It will also affect families, businesses, and health care providers. 1 In this report, the “older population” refers to those aged 65 and over. 2 This report discusses data for the United States, including the 50 states and the District of Columbia. 3 The baby boom generation consists of people born between mid- 1946 and mid-1964 (Hogan, Perez, and Bell, 2008). 2012 NATIONAL PROJECTIONS This report is based on the 2012 National Projections. The 2012 National Projections are of the resident population, by age, sex, race, and Hispanic origin, and include demographic components of change (births, deaths, and net international migration). The projec- tions are based on the 2010 Census and were produced using a cohort-component method. In this method, the components of population change are projected sepa- rately for each birth cohort (persons born in a given year) based on past trends. The base population is advanced each year by using projected survival rates and net international migration. Each year, a new birth cohort is added to the population by applying the pro- jected fertility rates to the projected female population. The projections cover the period 2012 to 2060 (U.S. Census Bureau, 2012b). 4 The 2012 National Projections include a main series and three alternative series. 5 These four projection series provide results for differing assumptions of net international migration. All other methodology and assumptions, including fertility and mortality, are the 4 This report is based on projections for the years 2013 to 2050. Projections beyond 2050 are not included in the report because the international projections used in this report are not available for years after 2050. Results for the U.S. projections through 2060 are included in the appendixes to this report. The Census Bureau’s official population estimates are used for 2012 (U.S. Census Bureau, 2012c). When both population estimates and projections are available, as is the case for 2012, estimates are the preferred data. The population estimates are available at <www.census.gov/popest>. 5 The main series, referred to as the Middle series, was released in December 2012. The three alternative series, released in May 2013, were based on assumptions of low, high, and constant levels of net international migration (U.S. Census Bureau, 2012b).
-
Upload
dr-dev-kambhampati -
Category
Healthcare
-
view
179 -
download
0
description
Dr Dev Kambhampati | Census-USA- An Aging Nation
Transcript of Dr Dev Kambhampati | Census-USA- An Aging Nation
U.S. Department of CommerceEconomics and Statistics Administration
U.S. CENSUS BUREAU
census.gov
An Aging Nation: The Older Population in the United StatesPopulation Estimates and Projections
Current Population Reports
Issued May 2014P25-1140
By Jennifer M. Ortman, Victoria A. Velkoff, and Howard Hogan
INTRODUCTION
This report examines how the age structure of the U.S. population is expected to change over the coming decades and focuses on the older population in terms of age, sex, race, and Hispanic origin.1 The size and structure of the older population is important to public and private interests, both socially and economically.
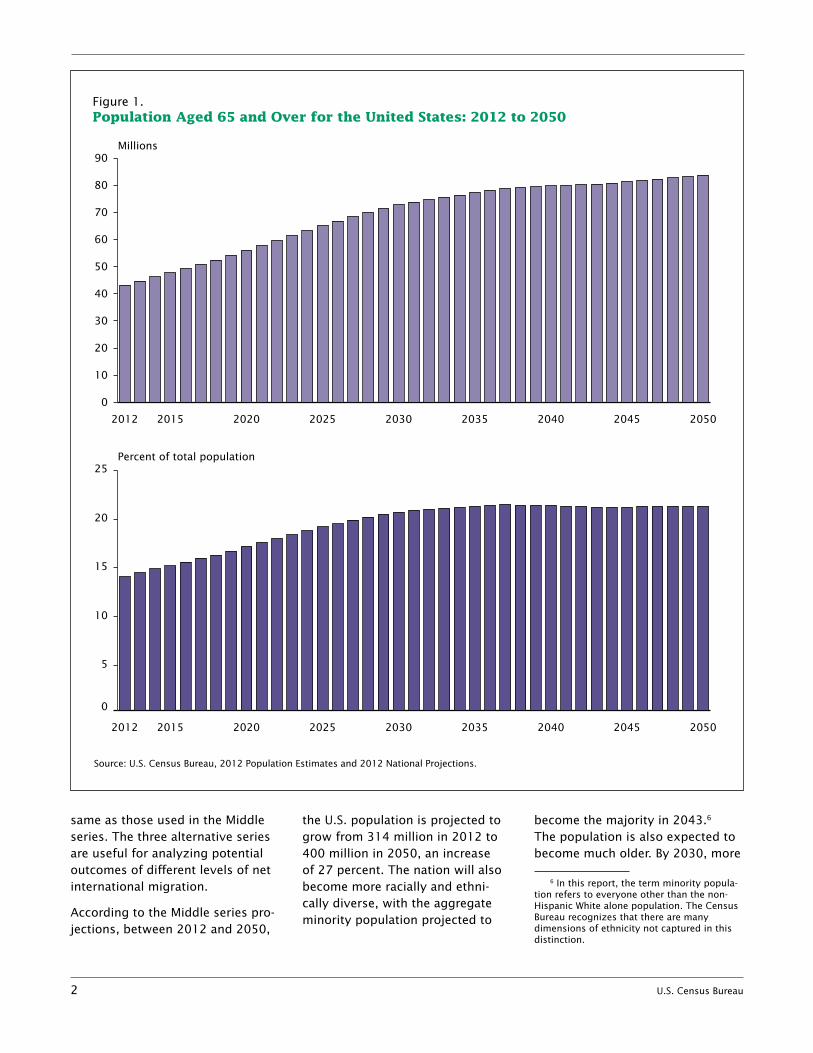
Between 2012 and 2050, the United States will experi-ence considerable growth in its older population (see Figure 1).2 In 2050, the population aged 65 and over is projected to be 83.7 million, almost double its esti-mated population of 43.1 million in 2012. The baby boomers are largely responsible for this increase in the older population, as they began turning 65 in 2011.3 By 2050, the surviving baby boomers will be over the age of 85.
The aging of the population will have wide-ranging implications for the country. By “aging,” demographers often mean that the proportion of the population in the older ages increases. As the United States ages over the next several decades, its older population will become more racially and ethnically diverse. The projected growth of the older population in the United States will present challenges to policy makers and programs, such as Social Security and Medicare. It will also affect families, businesses, and health care providers.
1 In this report, the “older population” refers to those aged 65 and over.
2 This report discusses data for the United States, including the 50 states and the District of Columbia.
3 The baby boom generation consists of people born between mid-1946 and mid-1964 (Hogan, Perez, and Bell, 2008).
2012 NATIONAL PROJECTIONS
This report is based on the 2012 National Projections. The 2012 National Projections are of the resident population, by age, sex, race, and Hispanic origin, and include demographic components of change (births, deaths, and net international migration). The projec-tions are based on the 2010 Census and were produced using a cohort-component method. In this method, the components of population change are projected sepa-rately for each birth cohort (persons born in a given year) based on past trends. The base population is advanced each year by using projected survival rates and net international migration. Each year, a new birth cohort is added to the population by applying the pro-jected fertility rates to the projected female population. The projections cover the period 2012 to 2060 (U.S. Census Bureau, 2012b).4
The 2012 National Projections include a main series and three alternative series.5 These four projection series provide results for differing assumptions of net international migration. All other methodology and assumptions, including fertility and mortality, are the
4 This report is based on projections for the years 2013 to 2050. Projections beyond 2050 are not included in the report because the international projections used in this report are not available for years after 2050. Results for the U.S. projections through 2060 are included in the appendixes to this report. The Census Bureau’s official population estimates are used for 2012 (U.S. Census Bureau, 2012c). When both population estimates and projections are available, as is the case for 2012, estimates are the preferred data. The population estimates are available at <www.census.gov/popest>.
5 The main series, referred to as the Middle series, was released in December 2012. The three alternative series, released in May 2013, were based on assumptions of low, high, and constant levels of net international migration (U.S. Census Bureau, 2012b).
2 U.S. Census Bureau
same as those used in the Middle series. The three alternative series are useful for analyzing potential outcomes of different levels of net international migration.
According to the Middle series pro-jections, between 2012 and 2050,
the U.S. population is projected to grow from 314 million in 2012 to 400 million in 2050, an increase of 27 percent. The nation will also become more racially and ethni-cally diverse, with the aggregate minority population projected to
become the majority in 2043.6 The population is also expected to become much older. By 2030, more
6 In this report, the term minority popula-tion refers to everyone other than the non-Hispanic White alone population. The Census Bureau recognizes that there are many dimensions of ethnicity not captured in this distinction.
Figure 1.Population Aged 65 and Over for the United States: 2012 to 2050
0
10
20
30
40
50
60
70
80
90
205020452040203520302025202020152012
0
5
10
15
20
25
205020452040203520302025202020152012
Source: U.S. Census Bureau, 2012 Population Estimates and 2012 National Projections.
Millions
Percent of total population
Keyboxtext
U.S. Census Bureau 3
than 20 percent of U.S. residents are projected to be aged 65 and over, compared with 13 percent in 2010 and 9.8 percent in 1970.
The 2012 National Projections, including summary tables, down-loadable files, methodology and assumptions, and the press release for the main series and three alternative series can be found at <www.census.gov/population /projections/data/national/2012 .html>.
MORTALITY: DRIVER OF TRENDS IN THE OLDER POPULATION
The size and composition of the older population in 2050 will be largely determined by two fac-tors: the size and composition of the population 27 years and over in 2012 and the future course of mortality for that population. While past fertility rates were the main driver shaping the size of these cohorts to date, mortality will influ-ence the pace at which that popu-lation declines at the older ages.
Nearly everyone who will be 65 years and over and living in the United States in 2050 already lives here. No one born after 1985—those 27 and younger in 2012—can add to this population, because they will not be over the age of 65 by 2050. Since most immigrants are projected to be under the age of 40 when they arrive in the United States, international migra-tion will play a limited role in creat-ing the future population over age 65. Future migration will have even less of a role in shaping the future population over age 85.
The mortality assumptions for these population projections are guided by past trends and current levels of mortality observed in the United States and in other developed nations (see “Drivers of Mortality” text box). Trends in health-related
conditions such as smoking and obesity were also assessed.
Survivorship rates have shown improvement for many decades. In the United States, life expectancy at age 65 was 15.2 years in 1972 and rose to 19.1 years in 2010—a net gain of 3.9 years.7 The survival gains for those turning 85 have also been impressive. In 1972, the average time to live for someone
7 Life expectancy data for the United States presented in this section were obtained from the National Center for Health Statistics and are available at <www.cdc.gov/nchs>.
turning 85 was 5.5 years. By 2010, this had risen to 6.5 years—a net gain of 1 year. Similar trends have been observed in almost all devel-oped nations. For example, life expectancy at age 65 in Sweden increased from 15.7 years in 1972 to 19.8 years in 2010. Life expectancy at age 85 in Sweden increased from 4.9 years in 1972 to 6.2 years in 2010.8
8 Life expectancy data for Sweden were obtained from the Human Mortality Database and are available at <www.mortality.org>.
DRIVERS OF MORTALITY
Mortality projections are based on observed trends in recent decades, where public health campaigns, behavioral changes, and medical advances drove improvements. In projecting the popula-tion, we must ask how likely these improvements are to continue, and what is most likely to change. We see no evidence that trends in medical advances, at least with respect to the older population, will either greatly accelerate or begin to show serious diminish-ing returns. It is assumed their effect is represented in past trends. However, we do see evidence that public health campaigns and behavioral changes can and are altering the trends with respect to two important drivers of mortality: smoking and obesity.
One important trend is the reduction in smoking. A lifetime of smoking greatly reduces old-age survival. In 1970, 45 percent of the population aged 25 to 44 smoked (this is the population aged 67 to 86 in 2012) (American Lung Association, 2011). In 2011, only 22.1 percent of those aged 25 to 44 smoked (this will be the population aged 64 to 83 in 2050) (Centers for Disease Control and Prevention, 2012). Reduction in smoking at younger ages is expected to improve survivorship for these cohorts when they reach the older ages.
Another health-related condition expected to influence future trends in survivorship is obesity. The incidence of obesity increased dramatically between 1980 and 2008, doubling for adults and tripling for children (National Center for Chronic Disease Prevention and Health Promotion, 2011). According to the Centers for Disease Control, “Obesity increases the risk of a number of health condi-tions including hypertension, adverse lipid concentrations, and type 2 diabetes” (Ogden et al., 2012:1). The direct effect of obesity on survival is less than that for smoking, and there is evidence that the trend is leveling off. The longer-term implications are yet unknown, but could dampen continued improvements in survivor-ship in future years.
4 U.S. Census Bureau
For the 2012 National Projections, mortality rates were projected separately for males and females by three race and Hispanic-origin groups: Non-Hispanic White and Asian or Pacific Islander; Non-Hispanic Black or American Indian and Alaska Native; and Hispanics of any race. These groups were used to account for differences in mortality between subgroups of the population.9
Based on trends in mortality between 1989 and 2009, the projections assumed that life expectancy would continue to
9 Due to concerns about the quality of race reporting in the death data over the time series, the non-Hispanic race groups were collapsed into two categories. Groups with similar mortality patterns were combined. As a result, mortality rates were produced for three race and Hispanic-origin groups: (1) non-Hispanic White and Asian or Pacific Islander (API), (2) non-Hispanic Black and American Indian or Alaska Native (AIAN), and (3) Hispanic (of any race). For more informa-tion, see the 2012 National Projections meth-odology statement at <www.census.gov /population/projections/files/methodology /methodstatement12.pdf>.
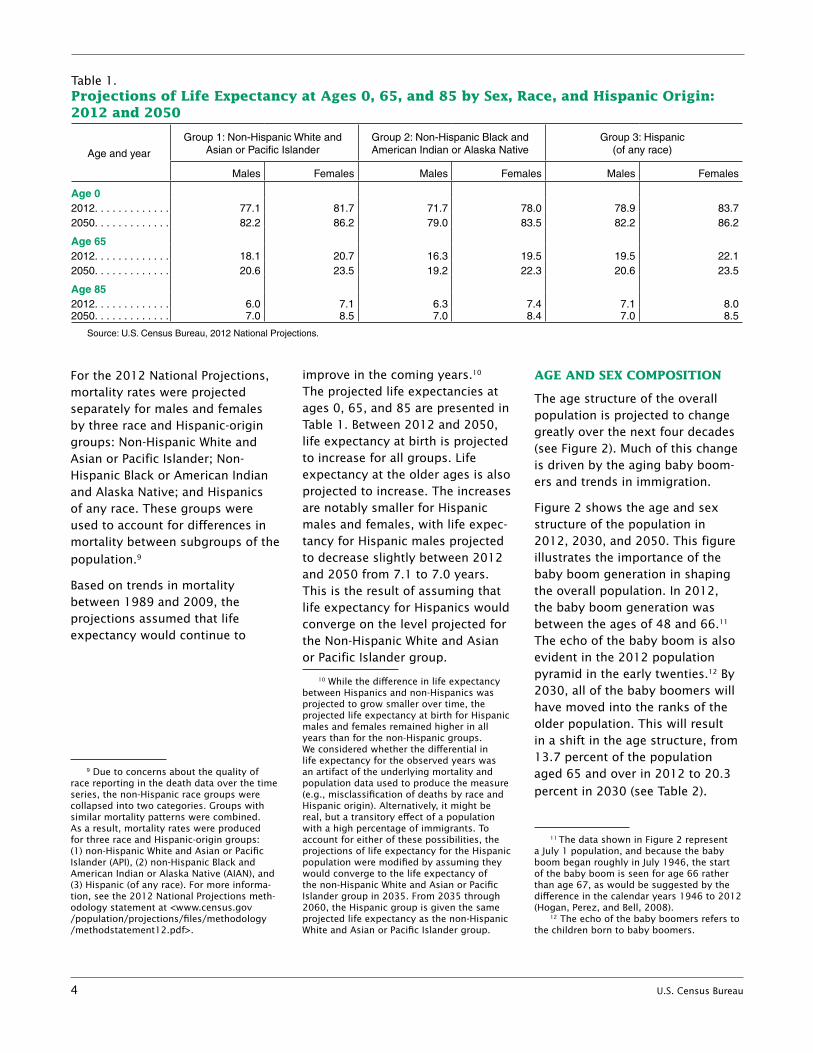
improve in the coming years.10 The projected life expectancies at ages 0, 65, and 85 are presented in Table 1. Between 2012 and 2050, life expectancy at birth is projected to increase for all groups. Life expectancy at the older ages is also projected to increase. The increases are notably smaller for Hispanic males and females, with life expec-tancy for Hispanic males projected to decrease slightly between 2012 and 2050 from 7.1 to 7.0 years. This is the result of assuming that life expectancy for Hispanics would converge on the level projected for the Non-Hispanic White and Asian or Pacific Islander group.
10 While the difference in life expectancy between Hispanics and non-Hispanics was projected to grow smaller over time, the projected life expectancy at birth for Hispanic males and females remained higher in all years than for the non-Hispanic groups. We considered whether the differential in life expectancy for the observed years was an artifact of the underlying mortality and population data used to produce the measure (e.g., misclassification of deaths by race and Hispanic origin). Alternatively, it might be real, but a transitory effect of a population with a high percentage of immigrants. To account for either of these possibilities, the projections of life expectancy for the Hispanic population were modified by assuming they would converge to the life expectancy of the non-Hispanic White and Asian or Pacific Islander group in 2035. From 2035 through 2060, the Hispanic group is given the same projected life expectancy as the non-Hispanic White and Asian or Pacific Islander group.
AGE AND SEX COMPOSITION
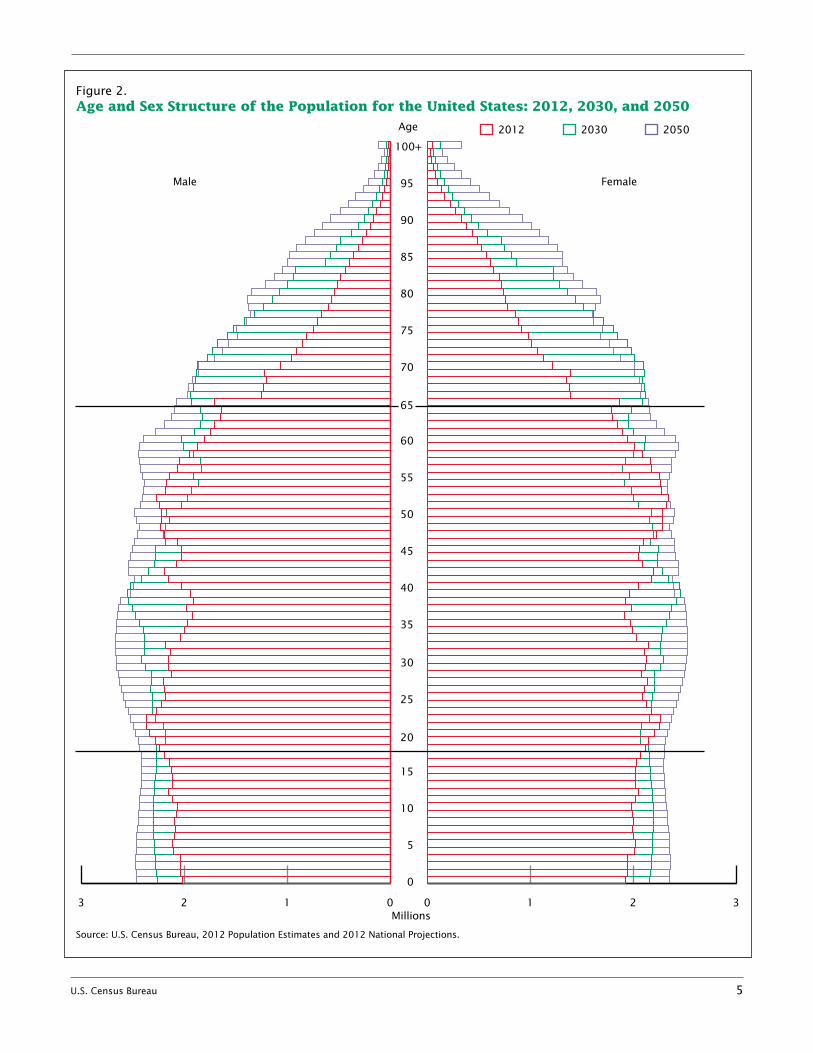
The age structure of the overall population is projected to change greatly over the next four decades (see Figure 2). Much of this change is driven by the aging baby boom-ers and trends in immigration.
Figure 2 shows the age and sex structure of the population in 2012, 2030, and 2050. This figure illustrates the importance of the baby boom generation in shaping the overall population. In 2012, the baby boom generation was between the ages of 48 and 66.11 The echo of the baby boom is also evident in the 2012 population pyramid in the early twenties.12 By 2030, all of the baby boomers will have moved into the ranks of the older population. This will result in a shift in the age structure, from 13.7 percent of the population aged 65 and over in 2012 to 20.3 percent in 2030 (see Table 2).
11 The data shown in Figure 2 represent a July 1 population, and because the baby boom began roughly in July 1946, the start of the baby boom is seen for age 66 rather than age 67, as would be suggested by the difference in the calendar years 1946 to 2012 (Hogan, Perez, and Bell, 2008).
12 The echo of the baby boomers refers to the children born to baby boomers.
Table 1.Projections of Life Expectancy at Ages 0, 65, and 85 by Sex, Race, and Hispanic Origin: 2012 and 2050
Age and year
Group 1: Non-Hispanic White and Asian or Pacific Islander
Group 2: Non-Hispanic Black and American Indian or Alaska Native
Group 3: Hispanic (of any race)
Males Females Males Females Males Females
Age 02012. . . . . . . . . . . . . 77.1 81.7 71.7 78.0 78.9 83.72050. . . . . . . . . . . . . 82.2 86.2 79.0 83.5 82.2 86.2
Age 652012. . . . . . . . . . . . . 18.1 20.7 16.3 19.5 19.5 22.12050. . . . . . . . . . . . . 20.6 23.5 19.2 22.3 20.6 23.5
Age 852012. . . . . . . . . . . . . 6.0 7.1 6.3 7.4 7.1 8.02050. . . . . . . . . . . . . 7.0 8.5 7.0 8.4 7.0 8.5
Source: U.S. Census Bureau, 2012 National Projections.
U.S. Census Bureau 5
Figure 2.Age and Sex Structure of the Population for the United States: 2012, 2030, and 2050
Source: U.S. Census Bureau, 2012 Population Estimates and 2012 National Projections.
3 2 1 0
0
5
10
15
20
25
30
35
40
45
50
55
60
65
70
75
80
85
90
95
100+
0 1 2 3
2012 2030
Male
Age
Female
Millions
2050
6 U.S. Census Bureau
In 2012, 62.8 percent of the U.S. population was aged 18 to 64. By 2030, as the baby boomers age, the proportions in these working ages will drop to 57.3 percent.
In 2050, every age group is pro-jected to be larger than it was in 2012. This is not the case between 2012 and 2030 or between 2030 and 2050. For instance, the num-ber of men aged 48 to 58 and the number of women aged 47 to 58 in 2030 are projected to be smaller than those in the same age groups in 2012 (see Figure 2). This is because large cohorts of baby boomers were in these age groups in 2012, and smaller and younger cohorts will have replaced them by 2030. Similarly, the number of women aged 66 to 77 is projected to peak in 2030 and be smaller in 2050 than it was in 2030, as the smaller birth cohorts born in the late 1970s moves into these age groups.
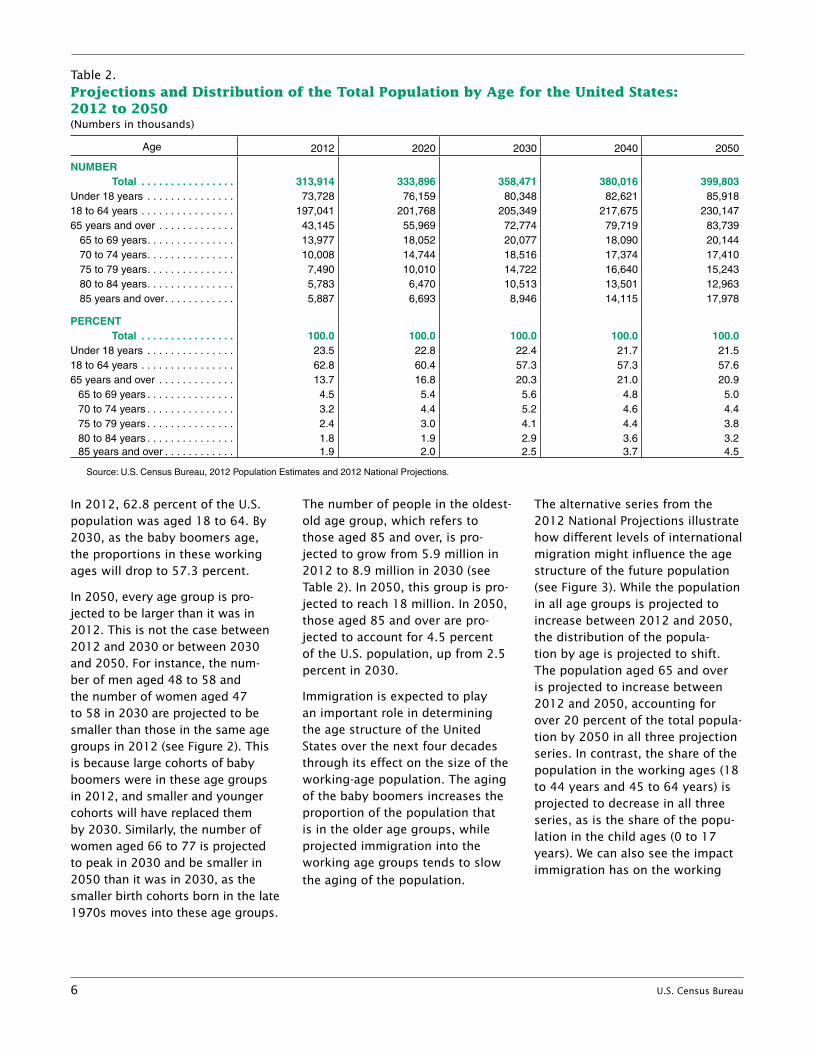
The number of people in the oldest-old age group, which refers to those aged 85 and over, is pro-jected to grow from 5.9 million in 2012 to 8.9 million in 2030 (see Table 2). In 2050, this group is pro-jected to reach 18 million. In 2050, those aged 85 and over are pro-jected to account for 4.5 percent of the U.S. population, up from 2.5 percent in 2030.
Immigration is expected to play an important role in determining the age structure of the United States over the next four decades through its effect on the size of the working-age population. The aging of the baby boomers increases the proportion of the population that is in the older age groups, while projected immigration into the working age groups tends to slow the aging of the population.
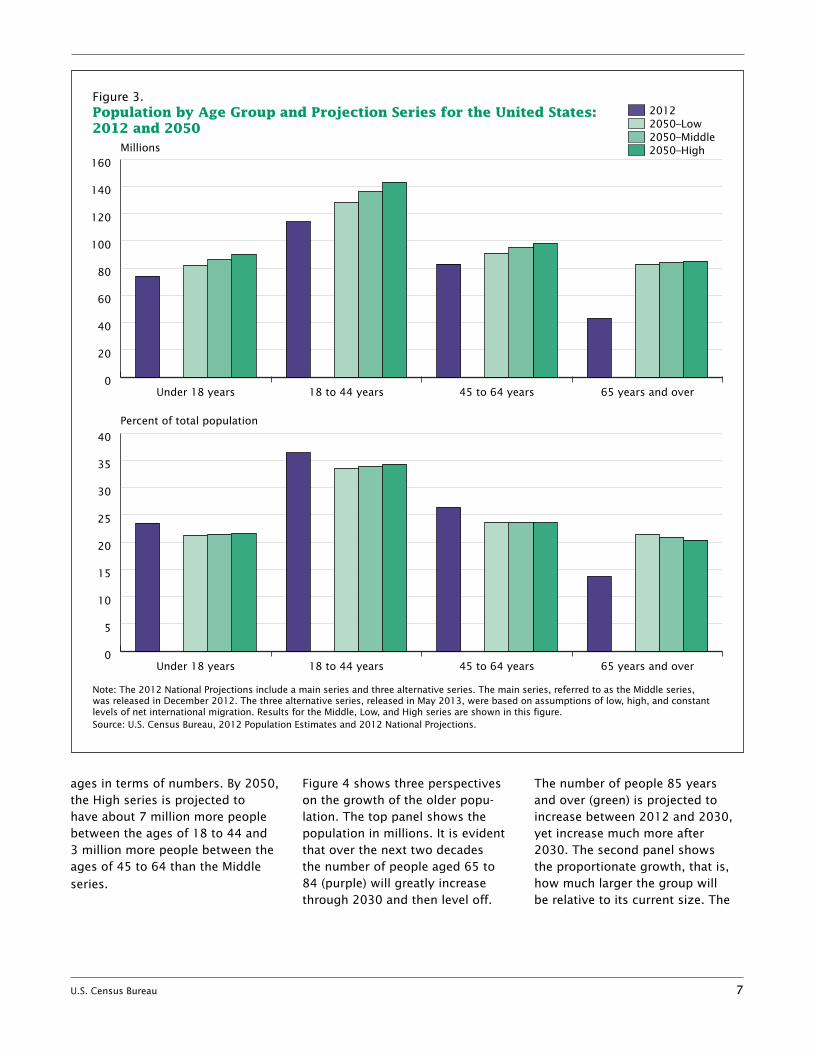
The alternative series from the 2012 National Projections illustrate how different levels of international migration might influence the age structure of the future population (see Figure 3). While the population in all age groups is projected to increase between 2012 and 2050, the distribution of the popula-tion by age is projected to shift. The population aged 65 and over is projected to increase between 2012 and 2050, accounting for over 20 percent of the total popula-tion by 2050 in all three projection series. In contrast, the share of the population in the working ages (18 to 44 years and 45 to 64 years) is projected to decrease in all three series, as is the share of the popu-lation in the child ages (0 to 17 years). We can also see the impact immigration has on the working
Table 2. Projections and Distribution of the Total Population by Age for the United States: 2012 to 2050(Numbers in thousands)
Age 2012 2020 2030 2040 2050
NUMBER Total . . . . . . . . . . . . . . . . 313,914 333,896 358,471 380,016 399,803Under 18 years . . . . . . . . . . . . . . . 73,728 76,159 80,348 82,621 85,91818 to 64 years . . . . . . . . . . . . . . . . 197,041 201,768 205,349 217,675 230,14765 years and over . . . . . . . . . . . . . 43,145 55,969 72,774 79,719 83,739
65 to 69 years . . . . . . . . . . . . . . . 13,977 18,052 20,077 18,090 20,14470 to 74 years . . . . . . . . . . . . . . . 10,008 14,744 18,516 17,374 17,41075 to 79 years . . . . . . . . . . . . . . . 7,490 10,010 14,722 16,640 15,24380 to 84 years . . . . . . . . . . . . . . . 5,783 6,470 10,513 13,501 12,96385 years and over . . . . . . . . . . . .
PERCENT
5,887 6,693 8,946 14,115 17,978
Total . . . . . . . . . . . . . . . . 100 .0 100 .0 100 .0 100 .0 100 .0Under 18 years . . . . . . . . . . . . . . . 23.5 22.8 22.4 21.7 21.518 to 64 years . . . . . . . . . . . . . . . . 62.8 60.4 57.3 57.3 57.665 years and over . . . . . . . . . . . . . 13.7 16.8 20.3 21.0 20.9
65 to 69 years . . . . . . . . . . . . . . . 4.5 5.4 5.6 4.8 5.070 to 74 years . . . . . . . . . . . . . . . 3.2 4.4 5.2 4.6 4.475 to 79 years . . . . . . . . . . . . . . . 2.4 3.0 4.1 4.4 3.880 to 84 years . . . . . . . . . . . . . . . 1.8 1.9 2.9 3.6 3.285 years and over . . . . . . . . . . . . 1.9 2.0 2.5 3.7 4.5
Source: U.S. Census Bureau, 2012 Population Estimates and 2012 National Projections.
U.S. Census Bureau 7
ages in terms of numbers. By 2050, the High series is projected to have about 7 million more people between the ages of 18 to 44 and 3 million more people between the ages of 45 to 64 than the Middle series.
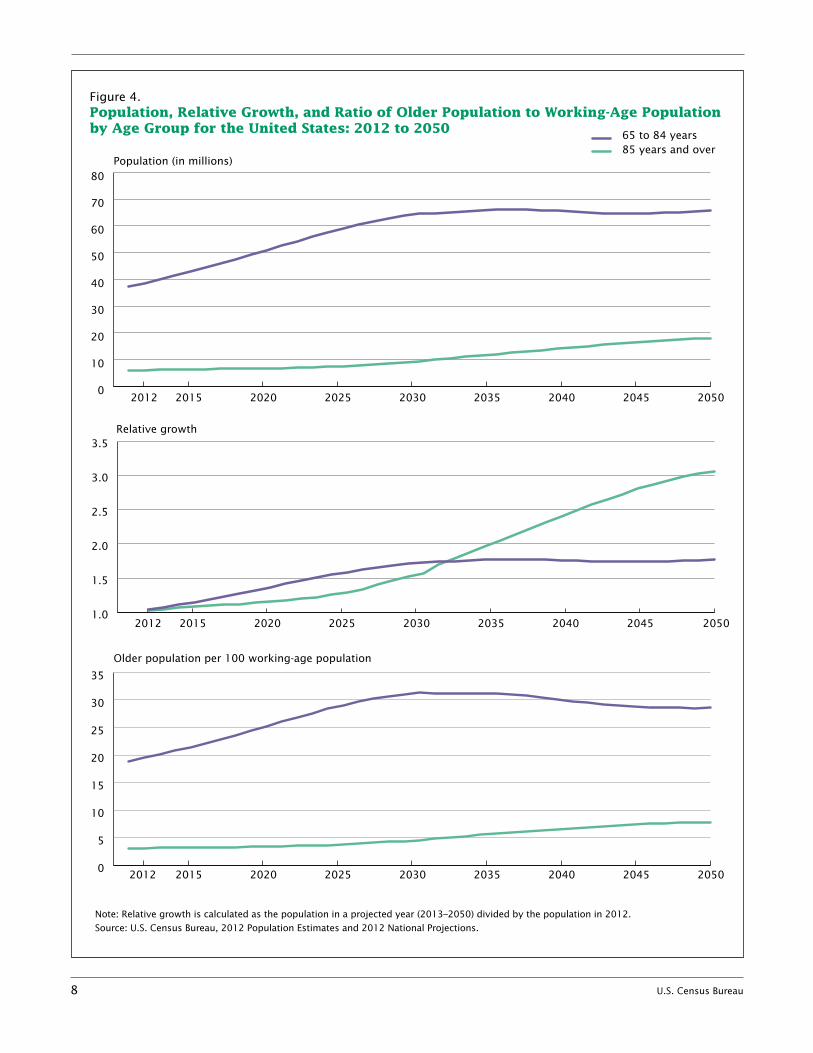
Figure 4 shows three perspectives on the growth of the older popu-lation. The top panel shows the population in millions. It is evident that over the next two decades the number of people aged 65 to 84 (purple) will greatly increase through 2030 and then level off.
The number of people 85 years and over (green) is projected to increase between 2012 and 2030, yet increase much more after 2030. The second panel shows the proportionate growth, that is, how much larger the group will be relative to its current size. The
Figure 3.Population by Age Group and Projection Series for the United States: 2012 and 2050
Note: The 2012 National Projections include a main series and three alternative series. The main series, referred to as the Middle series, was released in December 2012. The three alternative series, released in May 2013, were based on assumptions of low, high, and constant levels of net international migration. Results for the Middle, Low, and High series are shown in this figure.Source: U.S. Census Bureau, 2012 Population Estimates and 2012 National Projections.
20122050–Low2050–Middle2050–HighMillions
Percent of total population
0
5
10
15
20
25
30
35
40
65 years and over45 to 64 years18 to 44 yearsUnder 18 years
0
20
40
60
80
100
120
140
160
65 years and over45 to 64 years18 to 44 yearsUnder 18 years
8 U.S. Census Bureau
Figure 4.Population, Relative Growth, and Ratio of Older Population to Working-Age Population by Age Group for the United States: 2012 to 2050
Note: Relative growth is calculated as the population in a projected year (2013–2050) divided by the population in 2012.
Source: U.S. Census Bureau, 2012 Population Estimates and 2012 National Projections.
Population (in millions)
Relative growth
Older population per 100 working-age population
85 years and over65 to 84 years
0
10
20
30
40
50
60
70
80
205020452040203520302025202020152012
0
5
10
15
20
25
30
35
205020452040203520302025202020152012
1.0
1.5
2.0
2.5
3.0
3.5
205020452040203520302025202020152012

U.S. Census Bureau 9
population aged 65 to 84 will obviously grow, but not come near to doubling its current size. How-ever, the population 85 years and over will double by 2036 and then triple by 2049. The third perspec-tive measures the size of the older population relative to the working-age population, defined as ages 18 to 64. While currently there are 19 people aged 65 to 84 for every 100 working-age people, this ratio will climb to over 30 by 2028. That is to say, there will be approximately three working-age people to sup-port each person aged 65 to 84. The ratios are smaller for the popu-lation 85 years and over. The ratio grows from around 3 to well over 7. However, this means that from currently having over 33 working- age people for each of the 85 and over group, this ratio falls to fewer than 13 in 2046.
Figure 5 shows estimates of the youth, old age, and total depen-dency ratios for 1940 through
2010 and projected dependency ratios for 2020 through 2050 (see “Dependency Ratios” text box). The total dependency ratio, rep-resenting the sum of the youth and old-age dependency ratios, increased from 60 in 1940 to 82 in 1960 due to increases in youth
dependency, at the time driven by birth of the baby boomers. How-ever, the total dependency ratio decreased to around 60 between 1990 and 2010 as the baby boom-ers entered adulthood and youth dependency declined. After 2010, as the baby boomers begin to enter
DEPENDENCY RATIOS
Dependency ratios provide a way to examine the changing age structure of the younger as well as older populations. Dependency ratios are an indicator of the potential burden of the dependent population, approximated by those under 18 years and those 65 years and over, on those in the working-age population. The ratios are calculated by dividing the number of people in the dependent age groups by the number in the working ages and then multiply-ing by 100:
Total dependency = ( Population under 18 years + Population 65 years and over ) * 100Population 18 to 64 years
( Population 65 years and overOld-age dependency = ) * 100
Population 18 to 64 years
( Population under 18 yearsYouth dependency = )* 100
Population 18 to 64 years
Figure 5.Dependency Ratios for the United States: 1940 to 2050
2050
2040
2030
2020
2010
2000
1990
1980
1970
1960
1950
1940
Note: Total dependency = ((Population under 18 + Population aged 65 and over) / (Population aged 18 to 64)) * 100.Old-age dependency = (Population aged 65 and over / Population aged 18 to 64) * 100.Youth dependency = (Population under 18 / Population aged 18 to 64) * 100.Source: U.S. Census Bureau, 1940 to 2012 Population Estimates and 2012 National Projections.
Keyboxtext
Youth
49
51
65
61
46
42
41
38
38
39
38
37
Old age Total
60
64
82
78
65
62
61
59
74
75
75
65
11
13
17
17
19
20
20
21
28
35
36
37
10 U.S. Census Bureau
the older population, the old-age dependency ratio is projected to increase from 21 in 2010 to over 30 by 2030. As a result of the large increase in the old-age dependency ratio, the total dependency ratio is also projected to increase after 2010, reaching almost 75 by 2030. However, the young and old popu-lations present very different chal-lenges to society and the economy, so while the total dependency ratio may not again approach the high of 82 in 1960, the changing composi-tion of the total dependency ratio will be important.
The youth dependency ratio increased between 1940 and 1960 as the larger number of births led to a sharp increase in the size of the child population. Youth depen-dency ratios began to fall after the 1960s, as birth rates began to fall. Between 1970 and 1980, youth dependency fell from 61 to 46 children per every 100 adults in the working ages. By 2010, the youth dependency ratio dropped
to 38. The youth dependency ratio remains stable at around 37 in all projected years.
In contrast, the ratio of the older population to the working ages has increased steadily over the last several decades, from 11 in 1940 to 21 in 2010. The old-age depen-dency ratio sees a rapid increase between 2010 and 2030, from 21 to 35, as the baby boomers move into the 65 years and over category. After 2030, the old-age dependency ratio continues to increase slightly to 36 by 2050. It is interesting to note that by 2030, youth and old-age dependency ratios are projected to be almost equal, with each accounting for about half of the total dependency ratio for the United States.
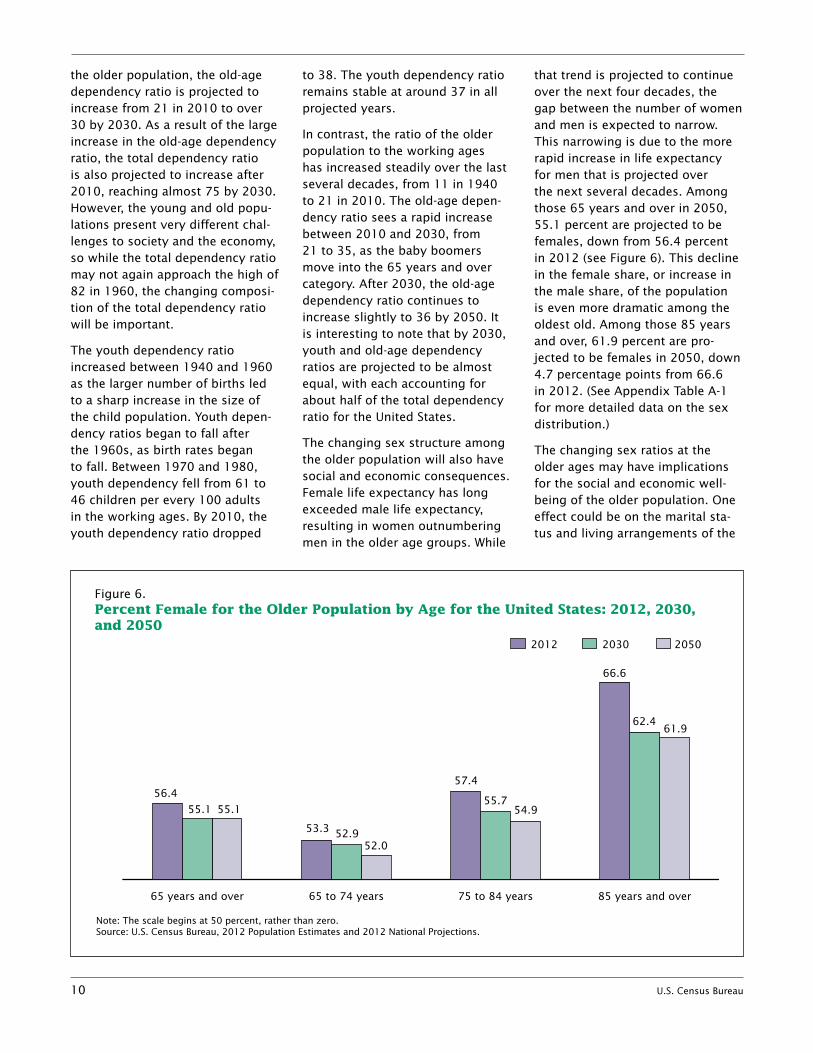
The changing sex structure among the older population will also have social and economic consequences. Female life expectancy has long exceeded male life expectancy, resulting in women outnumbering men in the older age groups. While
that trend is projected to continue over the next four decades, the gap between the number of women and men is expected to narrow. This narrowing is due to the more rapid increase in life expectancy for men that is projected over the next several decades. Among those 65 years and over in 2050, 55.1 percent are projected to be females, down from 56.4 percent in 2012 (see Figure 6). This decline in the female share, or increase in the male share, of the population is even more dramatic among the oldest old. Among those 85 years and over, 61.9 percent are pro-jected to be females in 2050, down 4.7 percentage points from 66.6 in 2012. (See Appendix Table A-1 for more detailed data on the sex distribution.)
The changing sex ratios at the older ages may have implications for the social and economic well-being of the older population. One effect could be on the marital sta-tus and living arrangements of the
Figure 6.Percent Female for the Older Population by Age for the United States: 2012, 2030, and 2050
Note: The scale begins at 50 percent, rather than zero.Source: U.S. Census Bureau, 2012 Population Estimates and 2012 National Projections.
56.4
55.1 55.1
53.3 52.952.0
57.4
66.6
62.461.9
55.754.9
55.1
2012 2030 2050
85 years and over75 to 84 years65 to 74 years65 years and over
U.S. Census Bureau 11
older population. Because women tend to outlive men, the share of women living alone tends to be higher than that of men. Subse-quently, older men are more likely to be married, while older women are more likely to be widowed (Kinsella and Velkoff, 2001). While women are projected to continue to outlive men, life expectancy is projected to increase more for men than women, potentially resulting in a smaller share of women liv-ing alone at the oldest ages in the future, at least for the youngest old (i.e., ages 65 to 84). The chang-ing sex ratios could also have an impact on the types of care that are available to the older population. For example, because men and women are expected to survive to older ages, spouses may be able to care for one another longer. There could also be increased demand for assisted-living arrangements or institutional care for couples.
RACE AND HISPANIC ORIGIN
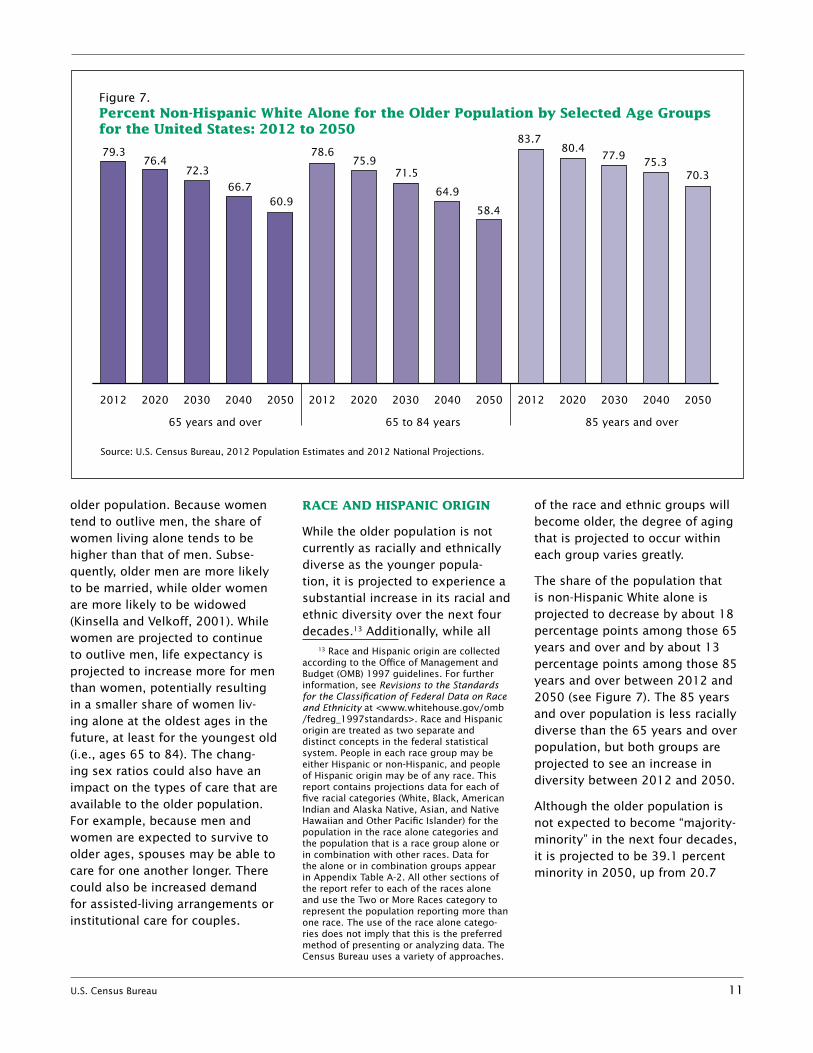
While the older population is not currently as racially and ethnically diverse as the younger popula-tion, it is projected to experience a substantial increase in its racial and ethnic diversity over the next four decades.13 Additionally, while all
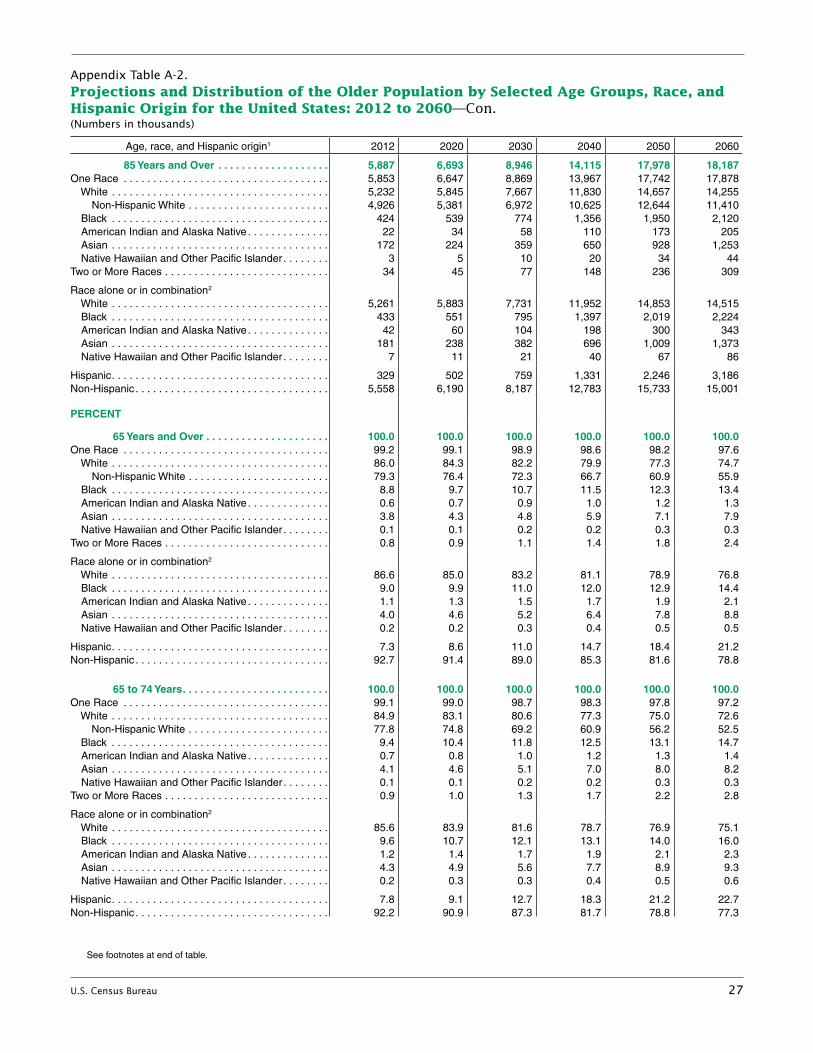
13 Race and Hispanic origin are collected according to the Office of Management and Budget (OMB) 1997 guidelines. For further information, see Revisions to the S tandards for the Classification of Federal Data on Race and Ethnicity at <www.whitehouse.gov/omb /fedreg_1997standards>. Race and Hispanic origin are treated as two separate and distinct concepts in the federal statistical system. People in each race group may be either Hispanic or non-Hispanic, and people of Hispanic origin may be of any race. This report contains projections data for each of five racial categories (White, Black, American Indian and Alaska Native, Asian, and Native Hawaiian and Other Pacific Islander) for the population in the race alone categories and the population that is a race group alone or in combination with other races. Data for the alone or in combination groups appear in Appendix Table A-2. All other sections of the report refer to each of the races alone and use the Two or More Races category to represent the population reporting more than one race. The use of the race alone catego-ries does not imply that this is the preferred method of presenting or analyzing data. The Census Bureau uses a variety of approaches.
of the race and ethnic groups will become older, the degree of aging that is projected to occur within each group varies greatly.
The share of the population that is non-Hispanic White alone is projected to decrease by about 18 percentage points among those 65 years and over and by about 13 percentage points among those 85 years and over between 2012 and 2050 (see Figure 7). The 85 years and over population is less racially diverse than the 65 years and over population, but both groups are projected to see an increase in diversity between 2012 and 2050.
Although the older population is not expected to become “majority-minority” in the next four decades, it is projected to be 39.1 percent minority in 2050, up from 20.7
Figure 7.Percent Non-Hispanic White Alone for the Older Population by Selected Age Groups for the United States: 2012 to 2050
Source: U.S. Census Bureau, 2012 Population Estimates and 2012 National Projections.
79.376.4
72.3
65 years and over 85 years and over65 to 84 years
78.675.9
71.5
83.780.4
77.975.3
70.3
58.4
64.966.760.9
205020402030202020122050204020302020201220502040203020202012
12 U.S. Census Bureau
percent in 2012.14 Among the 85 years and over population, 29.7 percent are projected to be minor-ity in 2050, up from 16.3 percent in 2012.
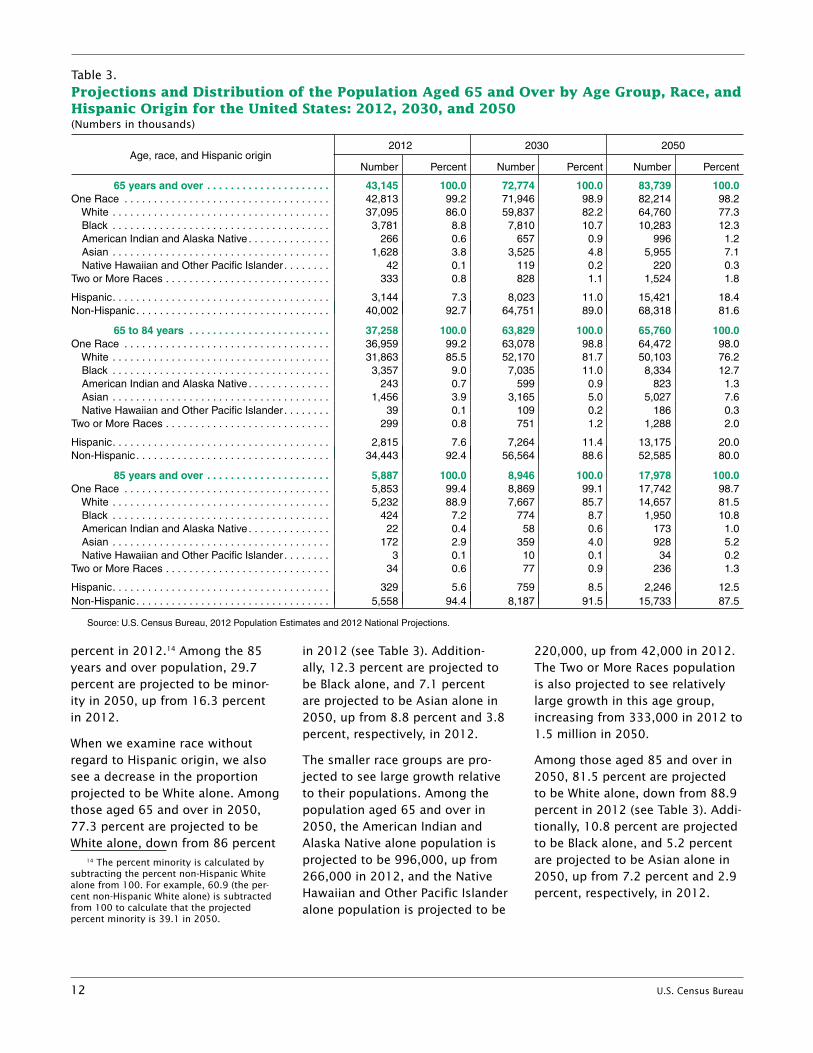
When we examine race without regard to Hispanic origin, we also see a decrease in the proportion projected to be White alone. Among those aged 65 and over in 2050, 77.3 percent are projected to be White alone, down from 86 percent
14 The percent minority is calculated by subtracting the percent non-Hispanic White alone from 100. For example, 60.9 (the per-cent non-Hispanic White alone) is subtracted from 100 to calculate that the projected percent minority is 39.1 in 2050.
in 2012 (see Table 3). Addition-ally, 12.3 percent are projected to be Black alone, and 7.1 percent are projected to be Asian alone in 2050, up from 8.8 percent and 3.8 percent, respectively, in 2012.
The smaller race groups are pro-jected to see large growth relative to their populations. Among the population aged 65 and over in 2050, the American Indian and Alaska Native alone population is projected to be 996,000, up from 266,000 in 2012, and the Native Hawaiian and Other Pacific Islander alone population is projected to be
220,000, up from 42,000 in 2012. The Two or More Races population is also projected to see relatively large growth in this age group, increasing from 333,000 in 2012 to 1.5 million in 2050.
Among those aged 85 and over in 2050, 81.5 percent are projected to be White alone, down from 88.9 percent in 2012 (see Table 3). Addi-tionally, 10.8 percent are projected to be Black alone, and 5.2 percent are projected to be Asian alone in 2050, up from 7.2 percent and 2.9 percent, respectively, in 2012.
Table 3.Projections and Distribution of the Population Aged 65 and Over by Age Group, Race, and Hispanic Origin for the United States: 2012, 2030, and 2050(Numbers in thousands)
Age, race, and Hispanic origin2012 2030 2050
Number Percent Number Percent Number Percent
65 years and over . . . . . . . . . . . . . . . . . . . . . 43,145 100 .0 72,774 100 .0 83,739 100 .0One Race . . . . . . . . . . . . . . . . . . . . . . . . . . . . . . . . . . . 42,813 99.2 71,946 98.9 82,214 98.2 White . . . . . . . . . . . . . . . . . . . . . . . . . . . . . . . . . . . . . 37,095 86.0 59,837 82.2 64,760 77.3 Black . . . . . . . . . . . . . . . . . . . . . . . . . . . . . . . . . . . . . 3,781 8.8 7,810 10.7 10,283 12.3 American Indian and Alaska Native . . . . . . . . . . . . . . 266 0.6 657 0.9 996 1.2 Asian . . . . . . . . . . . . . . . . . . . . . . . . . . . . . . . . . . . . . 1,628 3.8 3,525 4.8 5,955 7.1 Native Hawaiian and Other Pacific Islander . . . . . . . . 42 0.1 119 0.2 220 0.3Two or More Races . . . . . . . . . . . . . . . . . . . . . . . . . . . . 333 0.8 828 1.1 1,524 1.8
Hispanic . . . . . . . . . . . . . . . . . . . . . . . . . . . . . . . . . . . . . 3,144 7.3 8,023 11.0 15,421 18.4Non-Hispanic . . . . . . . . . . . . . . . . . . . . . . . . . . . . . . . . . 40,002 92.7 64,751 89.0 68,318 81.6
65 to 84 years . . . . . . . . . . . . . . . . . . . . . . . . 37,258 100 .0 63,829 100 .0 65,760 100 .0One Race . . . . . . . . . . . . . . . . . . . . . . . . . . . . . . . . . . . 36,959 99.2 63,078 98.8 64,472 98.0 White . . . . . . . . . . . . . . . . . . . . . . . . . . . . . . . . . . . . . 31,863 85.5 52,170 81.7 50,103 76.2 Black . . . . . . . . . . . . . . . . . . . . . . . . . . . . . . . . . . . . . 3,357 9.0 7,035 11.0 8,334 12.7 American Indian and Alaska Native . . . . . . . . . . . . . . 243 0.7 599 0.9 823 1.3 Asian . . . . . . . . . . . . . . . . . . . . . . . . . . . . . . . . . . . . . 1,456 3.9 3,165 5.0 5,027 7.6 Native Hawaiian and Other Pacific Islander . . . . . . . . 39 0.1 109 0.2 186 0.3Two or More Races . . . . . . . . . . . . . . . . . . . . . . . . . . . . 299 0.8 751 1.2 1,288 2.0
Hispanic . . . . . . . . . . . . . . . . . . . . . . . . . . . . . . . . . . . . . 2,815 7.6 7,264 11.4 13,175 20.0Non-Hispanic . . . . . . . . . . . . . . . . . . . . . . . . . . . . . . . . . 34,443 92.4 56,564 88.6 52,585 80.0
85 years and over . . . . . . . . . . . . . . . . . . . . . 5,887 100 .0 8,946 100 .0 17,978 100 .0One Race . . . . . . . . . . . . . . . . . . . . . . . . . . . . . . . . . . . 5,853 99.4 8,869 99.1 17,742 98.7 White . . . . . . . . . . . . . . . . . . . . . . . . . . . . . . . . . . . . . 5,232 88.9 7,667 85.7 14,657 81.5 Black . . . . . . . . . . . . . . . . . . . . . . . . . . . . . . . . . . . . . 424 7.2 774 8.7 1,950 10.8 American Indian and Alaska Native . . . . . . . . . . . . . . 22 0.4 58 0.6 173 1.0 Asian . . . . . . . . . . . . . . . . . . . . . . . . . . . . . . . . . . . . . 172 2.9 359 4.0 928 5.2 Native Hawaiian and Other Pacific Islander . . . . . . . . 3 0.1 10 0.1 34 0.2Two or More Races . . . . . . . . . . . . . . . . . . . . . . . . . . . . 34 0.6 77 0.9 236 1.3
Hispanic . . . . . . . . . . . . . . . . . . . . . . . . . . . . . . . . . . . . . 329 5.6 759 8.5 2,246 12.5Non-Hispanic . . . . . . . . . . . . . . . . . . . . . . . . . . . . . . . . . 5,558 94.4 8,187 91.5 15,733 87.5
Source: U.S. Census Bureau, 2012 Population Estimates and 2012 National Projections.

U.S. Census Bureau 13
As with the 65 years and over group, the smaller race groups are projected to see large relative increases in the 85 years and over age group. Among those 85 years and over in 2050, the American Indian and Alaska Native alone population is projected to reach 173,000, up from 22,000 in 2012, and the Native Hawaiian and Other Pacific Islander alone population is projected to be 34,000, up from 3,000 in 2012. The Two or More Races oldest-old population, aged 85 and over, is also projected to see a relatively large increase, from 34,000 in 2012 to 236,000 in 2050 (see Table 3).
The proportion of the older popula-tion that is Hispanic is projected to increase quickly over the next four decades. In 2050, 18.4 percent of the population aged 65 and over is projected to be Hispanic, up from
7.3 percent in 2012 (see Figure 8). The proportion of the oldest-old population that is Hispanic is also projected to increase by about 7 percentage points between 2012 and 2050.
In 2050, the non-Hispanic popula-tion aged 65 and over is projected to reach 68.3 million, up from 40 million in 2012. The Hispanic population aged 65 and over is projected to grow from 3.1 million to 15.4 million, a fivefold increase (see Table 3).
The non-Hispanic population aged 85 and over is projected to nearly triple, from 5.6 million in 2012 to 15.7 million in 2050. In contrast, during this period, the Hispanic population in this age group is pro-jected to increase almost sevenfold, from 329,000 to 2.2 million (see Table 3).
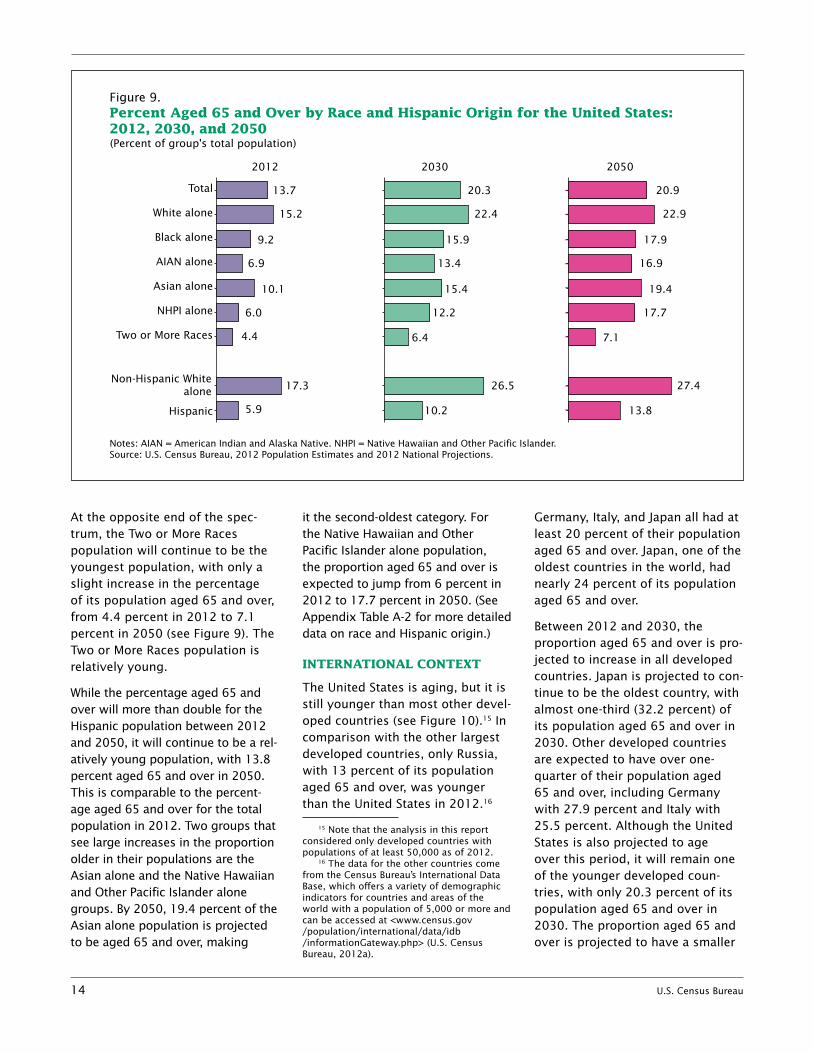
Although the proportion aged 65 and over in each race and ethnic group is projected to increase between 2012 and 2050, the percentage-point increase varies by race and Hispanic origin. Some groups will see increases of nearly 12 percentage points, while others will see increases of less than 3 percentage points.
Figure 9 shows the share of the total population within each race and Hispanic-origin group that is aged 65 and over in 2012, 2030, and 2050. The non-Hispanic White alone population is the oldest, with 17.3 percent of its population aged 65 and over in 2012. By 2030, over one-quarter of the non-Hispanic White alone population is projected to be aged 65 and over, still the oldest among all groups.
Figure 8.Percent Hispanic for the Older Population by Selected Age Groups for the United States: 2012 to 2050
Source: U.S. Census Bureau, 2012 Population Estimates and 2012 National Projections.
7.38.6
11.0
65 years and over 85 years and over65 to 84 years
7.68.8
11.4
20.0
5.6
7.58.5
12.5
9.4
15.814.7
18.4
205020402030202020122050204020302020201220502040203020202012
14 U.S. Census Bureau
At the opposite end of the spec-trum, the Two or More Races population will continue to be the youngest population, with only a slight increase in the percentage of its population aged 65 and over, from 4.4 percent in 2012 to 7.1 percent in 2050 (see Figure 9). The Two or More Races population is relatively young.
While the percentage aged 65 and over will more than double for the Hispanic population between 2012 and 2050, it will continue to be a rel-atively young population, with 13.8 percent aged 65 and over in 2050. This is comparable to the percent-age aged 65 and over for the total population in 2012. Two groups that see large increases in the proportion older in their populations are the Asian alone and the Native Hawaiian and Other Pacific Islander alone groups. By 2050, 19.4 percent of the Asian alone population is projected to be aged 65 and over, making
it the second-oldest category. For the Native Hawaiian and Other Pacific Islander alone population, the proportion aged 65 and over is expected to jump from 6 percent in 2012 to 17.7 percent in 2050. (See Appendix Table A-2 for more detailed data on race and Hispanic origin.)
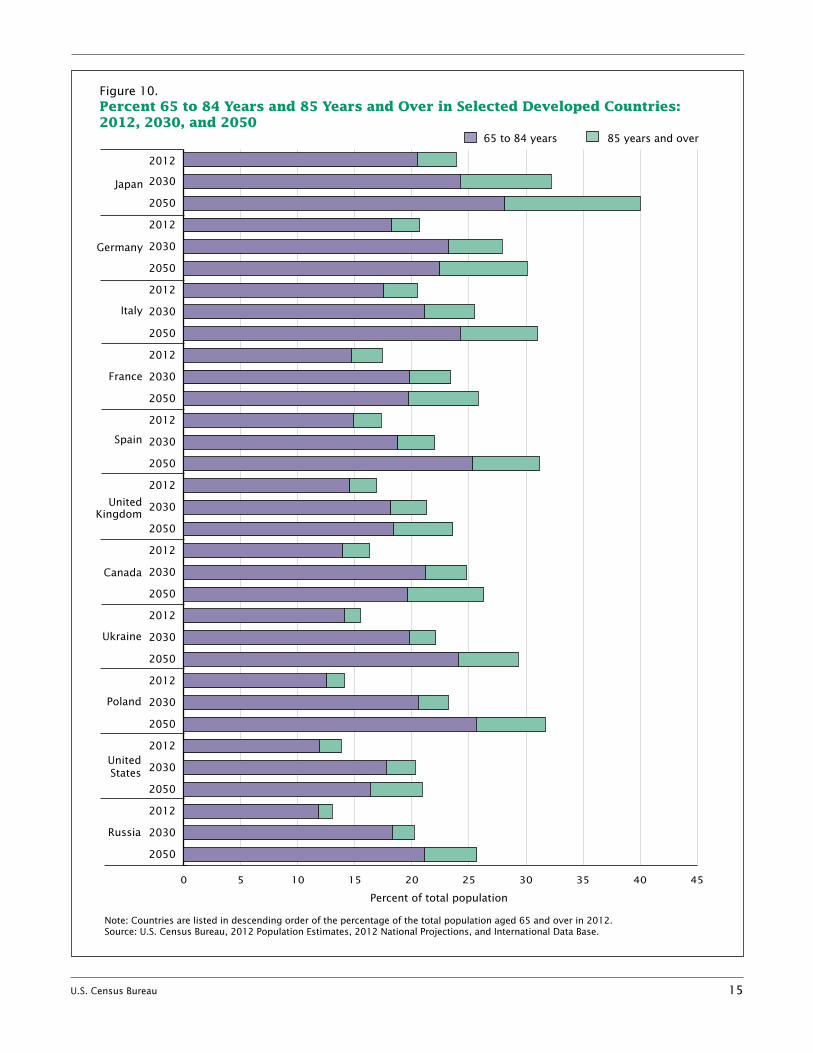
INTERNATIONAL CONTEXT
The United States is aging, but it is still younger than most other devel-oped countries (see Figure 10).15 In comparison with the other largest developed countries, only Russia, with 13 percent of its population aged 65 and over, was younger than the United States in 2012.16
15 Note that the analysis in this report considered only developed countries with populations of at least 50,000 as of 2012.
16 The data for the other countries come from the Census Bureau’s International Data Base, which offers a variety of demographic indicators for countries and areas of the world with a population of 5,000 or more and can be accessed at <www.census.gov /population/international/data/idb /informationGateway.php> (U.S. Census Bureau, 2012a).
Germany, Italy, and Japan all had at least 20 percent of their population aged 65 and over. Japan, one of the oldest countries in the world, had nearly 24 percent of its population aged 65 and over.
Between 2012 and 2030, the proportion aged 65 and over is pro-jected to increase in all developed countries. Japan is projected to con-tinue to be the oldest country, with almost one-third (32.2 percent) of its population aged 65 and over in 2030. Other developed countries are expected to have over one-quarter of their population aged 65 and over, including Germany with 27.9 percent and Italy with 25.5 percent. Although the United States is also projected to age over this period, it will remain one of the younger developed coun-tries, with only 20.3 percent of its population aged 65 and over in 2030. The proportion aged 65 and over is projected to have a smaller
Figure 9.Percent Aged 65 and Over by Race and Hispanic Origin for the United States: 2012, 2030, and 2050
Hispanic
Non-Hispanic Whitealone
Two or More Races
NHPI alone
Asian alone
AIAN alone
Black alone
White alone
Total
Notes: AIAN = American Indian and Alaska Native. NHPI = Native Hawaiian and Other Pacific Islander.Source: U.S. Census Bureau, 2012 Population Estimates and 2012 National Projections.
2012 2030
13.7
15.2
9.2
6.9
10.1
6.0
4.4
17.3
5.9
20.3
22.4
15.9
13.4
15.4
12.2
6.4
26.5
10.2
20.9
22.9
17.9
16.9
19.4
17.7
7.1
27.4
13.8
2050
(Percent of group's total population)
U.S. Census Bureau 15
Figure 10.Percent 65 to 84 Years and 85 Years and Over in Selected Developed Countries: 2012, 2030, and 2050
Note: Countries are listed in descending order of the percentage of the total population aged 65 and over in 2012.Source: U.S. Census Bureau, 2012 Population Estimates, 2012 National Projections, and International Data Base.
65 to 84 years 85 years and over
Percent of total population
0 5 10 15 20 25 30 35 40 45
2050
2030
2012
2050
2030
2012
2050
2030
2012
2050
2030
2012
2050
2030
2012
2050
2030
2012
2050
2030
2012
2050
2030
2012
2050
2030
2012
2050
2030
2012
2050
2030
2012
Japan
Germany
Italy
France
Spain
United Kingdom
Canada
Ukraine
Poland
United States
Russia
Russ
ia St
ates
Po
land U
krai
ne
Can
ada
Kin
gdom
Sp
ain
Fr
ance
Ita
ly
G
erm
any
Jap
an
Unit
edU
nit
ed
16 U.S. Census Bureau
increase from 2030 to 2050 in the United States compared with many other developed countries where this proportion is projected to continue to increase over the next several decades. Japan’s projected increase is the most dramatic, with the proportion aged 65 and over increasing to over 40 percent of the population by 2050. Germany, Italy, Poland, and Spain are expected to have over 30 percent of their popu-lation aged 65 and over in 2050.
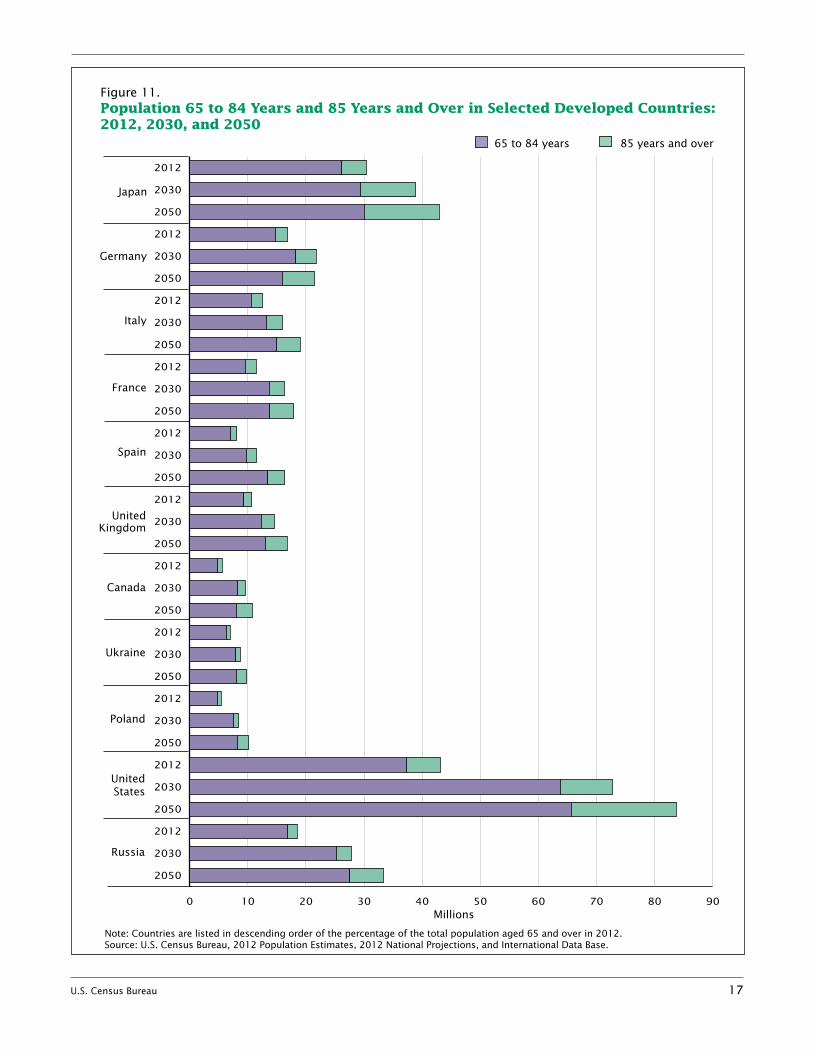
Although the United States is rela-tively young compared with many other developed countries, it has the largest number of people aged 65 and over among the developed countries, with over 43 million older people in 2012 (see Figure 11). Japan had the second largest, with just over 30 million in 2012. The United States is projected to continue to have the largest number of people aged 65 and over among the developed coun-tries, with just under 73 million by 2030 and almost 83 million by 2050. Japan is projected to have the second-largest number of older people among the developed countries, with almost 39 million in 2030 and nearly 43 million in 2050.
In 2012, the United States also had the largest number of people in the oldest-old age category among developed countries, with 5.9 million people aged 85 and older. Japan is a close second with 4.3 million. By 2030, Japan is projected to surpass the United States in terms of the oldest old, with 9.5 million people aged 85 and older,
compared with 8.9 million people in the United States. However, by 2050, as the baby boomers enter into the oldest-old age category, the United States is once again projected to have the largest population of oldest old among the developed countries, with nearly 18 million people in this age category. Japan is projected to have just fewer than 13 million people aged 85 and older in 2050. All the other developed countries are projected to have fewer than 6 million oldest old in 2050.
Figure 12 presents the youth, old age, and total dependency ratios for 2012 and the projected change in each dependency ratio between 2012 and 2030 and between 2030 and 2050. Japan had the highest total dependency ratio in 2012, of almost 68, which is due mainly to a high old-age dependency ratio of 40. While France, the United Kingdom, and the United States also had relatively high total depen-dency ratios (i.e., 66, 61, and 59 respectively), these ratios are high because of large youth dependency ratios.
For all of the countries, the total dependency ratio is projected to increase by 2030. Almost all of this increase in the total dependency ratio is driven by an increase in the old-age dependency ratios. The youth dependency ratios are projected to increase very little. In Japan, Italy, Spain, and Poland, the youth dependency ratios are actu-ally projected to decrease between 2012 and 2030.
Between 2030 and 2050, the total dependency ratio is projected to increase for most countries. The exception is the United States. The U.S. total dependency ratio is projected to decline slightly in this period due to a decrease in the youth dependency ratio. For the countries that are projected to have increases in the dependency ratios, some will see large increases, such as Japan, Spain, and Poland. These increases are driven by increases in the old-age dependency ratios. Other countries, such as Canada, France, and the United Kingdom, are projected to see more modest increases of less than 5.
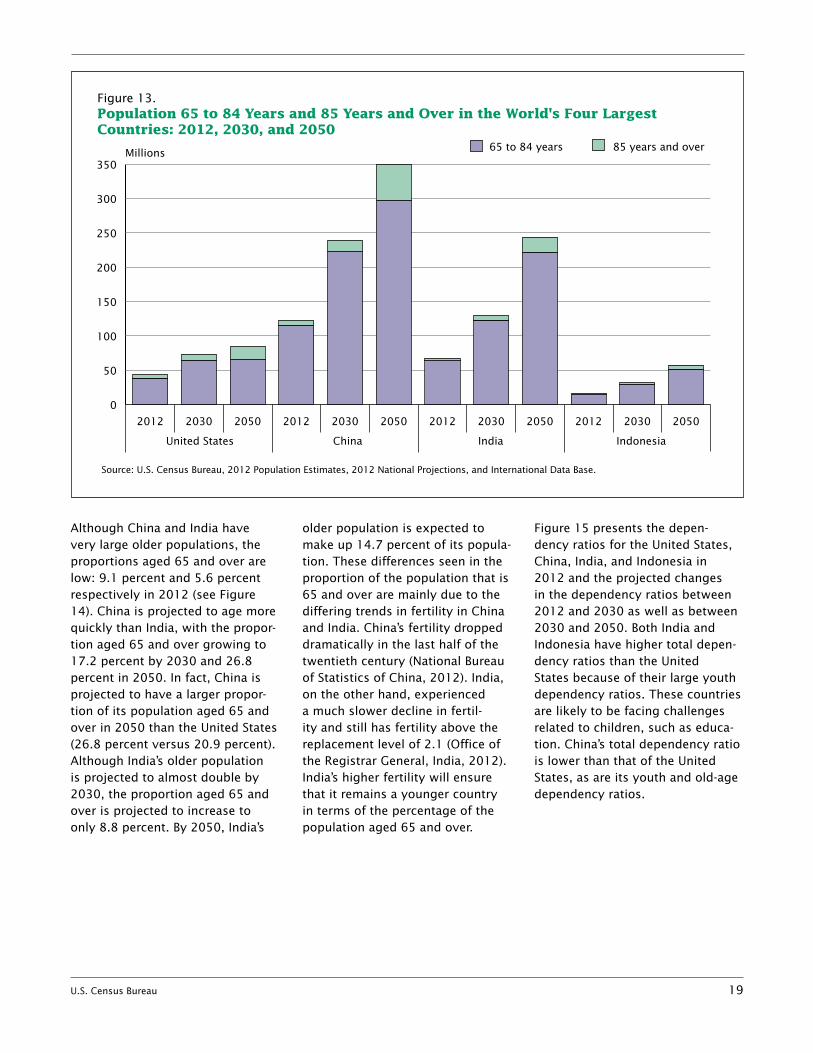
Another way to evaluate the older population in United States is to compare it with the older popula-tions in the other largest coun-tries in the world: China, India, and Indonesia. China, the world’s largest population with 1.3 billion people in 2012, also had the world’s largest older population, with 122 million people aged 65 and over (see Figure 13). India, with 1.2 billion in 2012, had the second-largest population in the world and the second-largest older population, at 67 million. The United States had the third-largest older population (43 million), fol-lowed by Indonesia (15.8 million). By 2030, China’s older population is projected to grow to 238.8 million. By 2050, its older population is projected to number 348.8 million, which is larger than the total U.S. population today.
U.S. Census Bureau 17
Figure 11.Population 65 to 84 Years and 85 Years and Over in Selected Developed Countries: 2012, 2030, and 2050
Note: Countries are listed in descending order of the percentage of the total population aged 65 and over in 2012.Source: U.S. Census Bureau, 2012 Population Estimates, 2012 National Projections, and International Data Base.
65 to 84 years 85 years and over
Millions0 10 20 30 40 50 60 70 80 90
2050
2030
2012
2050
2030
2012
2050
2030
2012
2050
2030
2012
2050
2030
2012
2050
2030
2012
2050
2030
2012
2050
2030
2012
2050
2030
2012
2050
2030
2012
2050
2030
2012
Japan
Germany
Italy
France
Spain
United Kingdom
Canada
Ukraine
Poland
United States
Russia

18 U.S. Census Bureau
Figure 12.Dependency Ratios in Selected Developed Countries: 2012, 2030, and 2050
Russia
United States
Poland
Ukraine
Canada
United Kingdom
Spain
France
Italy
Germany
Japan
Note: Countries are listed in descending order of the percentage of the total population aged 65 and over in 2012.Total dependency = ((Population under 18 + Population aged 65 and over) / (Population aged 18 to 64)) * 100.Old-age dependency = (Population aged 65 and over / Population aged 18 to 64) * 100.Youth dependency = (Population under 18 / Population aged 18 to 64) * 100.Change between 2012 and 2030 is calculated by subtracting the dependency ratio in 2012 from the dependency ratio in 2030.Change between 2030 and 2050 is calculated by subtracting the dependency ratio in 2030 from the dependency ratio in 2050.Source: U.S. Census Bureau, 2012 Population Estimates, 2012 National Projections, and International Data Base.
27.6
25.5
26.5
37.0
27.8
33.6
29.9
25.0
26.4
37.4
27.1
-2.2
2.8
-0.2
0.5
-1.5
1.2
2.4
0.9
0.0
1.7
2.9
19.6
16.9
10.6
13.1
8.9
9.3
18.4
12.8
17.4
13.5
13.9
28.9
8.8
19.8
1.9
28.8
2.1
3.3
19.2
24.7
-0.9
12.3
26.1
6.5
15.4
4.7
23.9
4.4
3.4
17.2
21.9
0.9
12.2
2.8
2.3
4.4
-2.8
4.9
-2.3
-0.1
2.0
2.7
-1.8
0.1
17.4
19.6
10.4
13.6
7.4
10.5
20.8
13.7
17.4
15.3
16.8
67.6
58.3
59.1
65.9
54.4
60.8
55.3
47.9
47.0
59.3
46.0
40.0
32.8
32.6
29.0
27.2
25.4
22.9
20.6
21.9
18.9
26.6
2012
Russia
United States
Poland
Ukraine
Canada
United Kingdom
Spain
France
Italy
Germany
Japan
Change, 2012–2030
Russia
United States
Poland
Ukraine
Canada
United Kingdom
Spain
France
Italy
Germany
Japan
Change, 2030–2050
Old ageYouth Total
U.S. Census Bureau 19
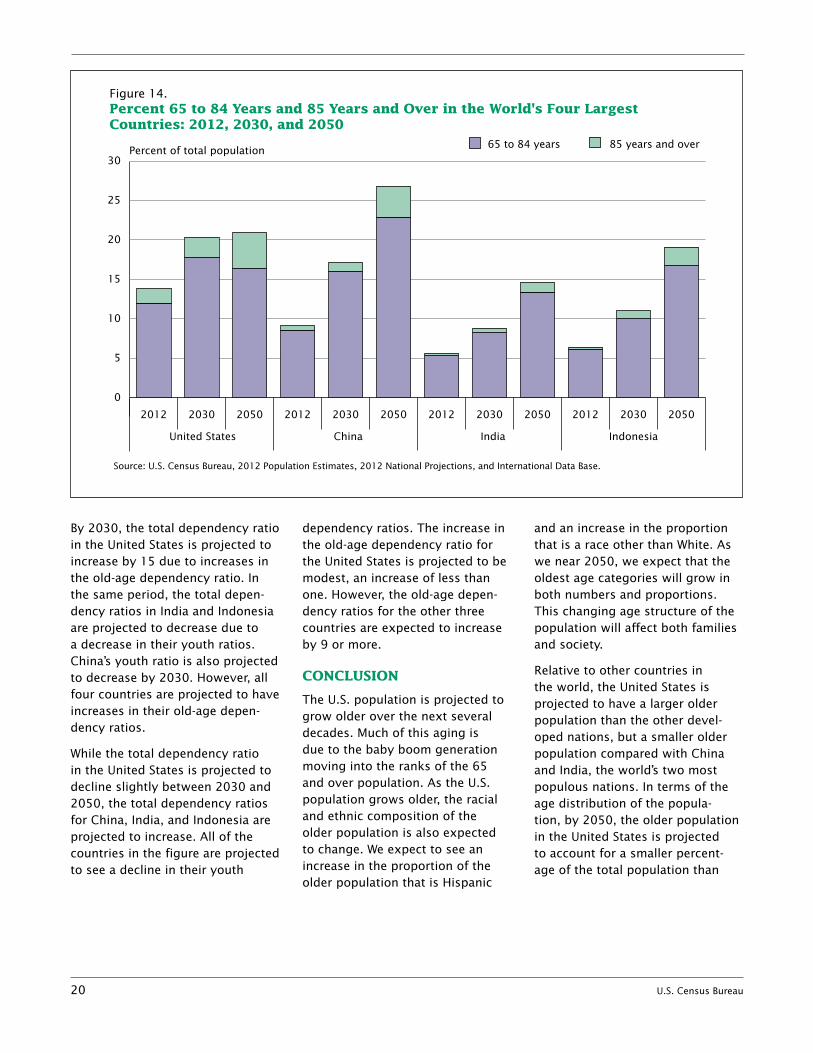
Although China and India have very large older populations, the proportions aged 65 and over are low: 9.1 percent and 5.6 percent respectively in 2012 (see Figure 14). China is projected to age more quickly than India, with the propor-tion aged 65 and over growing to 17.2 percent by 2030 and 26.8 percent in 2050. In fact, China is projected to have a larger propor-tion of its population aged 65 and over in 2050 than the United States (26.8 percent versus 20.9 percent). Although India’s older population is projected to almost double by 2030, the proportion aged 65 and over is projected to increase to only 8.8 percent. By 2050, India’s
older population is expected to make up 14.7 percent of its popula-tion. These differences seen in the proportion of the population that is 65 and over are mainly due to the differing trends in fertility in China and India. China’s fertility dropped dramatically in the last half of the twentieth century (National Bureau of Statistics of China, 2012). India, on the other hand, experienced a much slower decline in fertil-ity and still has fertility above the replacement level of 2.1 (Office of the Registrar General, India, 2012). India’s higher fertility will ensure that it remains a younger country in terms of the percentage of the population aged 65 and over.
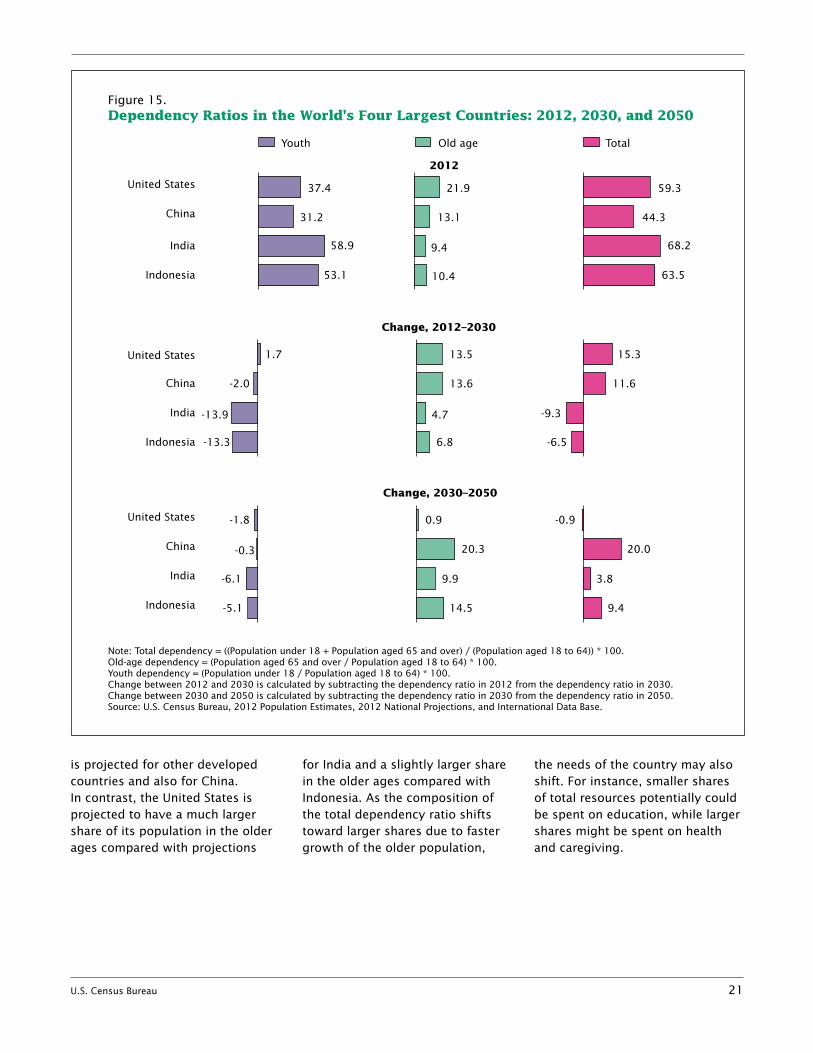
Figure 15 presents the depen-dency ratios for the United States, China, India, and Indonesia in 2012 and the projected changes in the dependency ratios between 2012 and 2030 as well as between 2030 and 2050. Both India and Indonesia have higher total depen-dency ratios than the United States because of their large youth dependency ratios. These countries are likely to be facing challenges related to children, such as educa-tion. China’s total dependency ratio is lower than that of the United States, as are its youth and old-age dependency ratios.
Figure 13.Population 65 to 84 Years and 85 Years and Over in the World's Four Largest Countries: 2012, 2030, and 2050
Source: U.S. Census Bureau, 2012 Population Estimates, 2012 National Projections, and International Data Base.
65 to 84 years 85 years and overMillions
United States China IndonesiaIndia
0
50
100
150
200
250
300
350
205020302012205020302012205020302012205020302012
20 U.S. Census Bureau
By 2030, the total dependency ratio in the United States is projected to increase by 15 due to increases in the old-age dependency ratio. In the same period, the total depen-dency ratios in India and Indonesia are projected to decrease due to a decrease in their youth ratios. China’s youth ratio is also projected to decrease by 2030. However, all four countries are projected to have increases in their old-age depen-dency ratios.
While the total dependency ratio in the United States is projected to decline slightly between 2030 and 2050, the total dependency ratios for China, India, and Indonesia are projected to increase. All of the countries in the figure are projected to see a decline in their youth
dependency ratios. The increase in the old-age dependency ratio for the United States is projected to be modest, an increase of less than one. However, the old-age depen-dency ratios for the other three countries are expected to increase by 9 or more.
CONCLUSION
The U.S. population is projected to grow older over the next several decades. Much of this aging is due to the baby boom generation moving into the ranks of the 65 and over population. As the U.S. population grows older, the racial and ethnic composition of the older population is also expected to change. We expect to see an increase in the proportion of the older population that is Hispanic
and an increase in the proportion that is a race other than White. As we near 2050, we expect that the oldest age categories will grow in both numbers and proportions. This changing age structure of the population will affect both families and society.
Relative to other countries in the world, the United States is projected to have a larger older population than the other devel-oped nations, but a smaller older population compared with China and India, the world’s two most populous nations. In terms of the age distribution of the popula-tion, by 2050, the older population in the United States is projected to account for a smaller percent-age of the total population than
Figure 14.Percent 65 to 84 Years and 85 Years and Over in the World's Four Largest Countries: 2012, 2030, and 2050
Source: U.S. Census Bureau, 2012 Population Estimates, 2012 National Projections, and International Data Base.
65 to 84 years 85 years and overPercent of total population
United States China IndonesiaIndia
0
5
10
15
20
25
30
205020302012205020302012205020302012205020302012
U.S. Census Bureau 21
is projected for other developed countries and also for China. In contrast, the United States is projected to have a much larger share of its population in the older ages compared with projections
for India and a slightly larger share in the older ages compared with Indonesia. As the composition of the total dependency ratio shifts toward larger shares due to faster growth of the older population,
the needs of the country may also shift. For instance, smaller shares of total resources potentially could be spent on education, while larger shares might be spent on health and caregiving.
Figure 15.Dependency Ratios in the World's Four Largest Countries: 2012, 2030, and 2050
Indonesia
India
China
United States
Note: Total dependency = ((Population under 18 + Population aged 65 and over) / (Population aged 18 to 64)) * 100.Old-age dependency = (Population aged 65 and over / Population aged 18 to 64) * 100.Youth dependency = (Population under 18 / Population aged 18 to 64) * 100.Change between 2012 and 2030 is calculated by subtracting the dependency ratio in 2012 from the dependency ratio in 2030.Change between 2030 and 2050 is calculated by subtracting the dependency ratio in 2030 from the dependency ratio in 2050.Source: U.S. Census Bureau, 2012 Population Estimates, 2012 National Projections, and International Data Base.
2012
Indonesia
India
China
United States
Change, 2012–2030
Indonesia
India
China
United States
Change, 2030–2050
37.4
31.2
53.1
58.9
1.7
-2.0
-13.3
-13.9
-1.8
-0.3
-5.1
-6.1
21.9
13.1
10.4
9.4
13.5
13.6
6.8
4.7
15.3
11.6
-6.5
-9.3
-0.9
20.0
9.4
3.8
0.9
20.3
14.5
9.9
59.3
44.3
63.5
68.2
Old ageYouth Total
22 U.S. Census Bureau
DATA SOURCES AND METHODOLOGY
This report uses estimates of the total U.S. population as of July 1, 2012, and projections of the total U.S. population as of July 1 for the years 2013 to 2050. When both population estimates and projections are available, as is the case for 2012, estimates are the preferred data. For example, the total population estimate for 2012 was 313,914,040 while the population projection for 2012 was 314,004,465. The universe is the resident population of the United States (50 states and the District of Columbia).
The projections are based on the 2010 Census and were produced using a cohort-component method, which uses the components of population change (births, deaths, and net international migration) to project forward. The assump-tions for the components of change are based on time series analysis. Historical mortality trends were calculated using the National Center for Health Statistics’ data on deaths and the U.S. Census Bureau’s population estimates for 1989 to
2009. Fertility trends were calcu-lated using the National Center for Health Statistics’ birth data and the Census Bureau’s estimates of the female population. The time series included data from 1989 to 2009. Trends in net international migration were primarily based on decennial census and American Community Survey estimates on foreign-born immigration for the period from 1980 to 2010.
The methodology for the projec-tions used in this report is available at <www.census.gov/population /projections/files/methodology /methodstatement12.pdf>.
Data for other countries were obtained from the Census Bureau’s International Data Base, available at <www.census.gov/population /international/data/idb>. The International Data Base provides estimates and projections of the population in all countries for the period from 1950 to 2050. The methodology used to produce the projections for the Interna-tional Data Base is available at <www.census.gov/population /international/data/idb/estandproj .pdf>.
All derived values were computed using unrounded data. In the text, figures, and tables, most whole numbers were rounded to the near-est thousand or million and most decimal numbers were rounded to the nearest tenth or whole number.
DATA ACCURACY
These projections are based on the 2010 Census and may, therefore, contain nonsampling error due to potential enumeration errors such as differential undercoverage or overcoverage by demographic characteristics. Technical docu-mentation for the 2010 Census is available at <www.census.gov /prod/cen2010/doc/sf1.pdf>. Nonsampling error also exists as the assumptions for the com-ponents of change were based on time series analysis. Future changes in policy or other factors that might influence levels of the population components and their directions cannot be predicted. Thus, if actual trends or levels in fertility, mortality, or international migration differ radically from the assumed trends and levels, the population projections will be less accurate.
U.S. Census Bureau 23
SOURCES
American Lung Association. Trends in Tobacco Use. American Lung Association, Research and Program Services, Epidemiology and Statistics Unit. 2011. <www.lung.org/finding-cures /our-research/trend-reports /Tobacco-Trend-Report.pdf>, accessed May 21, 2013.
Centers for Disease Control and Prevention. Current Cigarette Smoking Among Adults—United States, 2011. Morbidity and Mortality Weekly Report Vol. 61, No. 44. 2012. pp. 889–894. <www.cdc.gov/mmwr/pdf/wk /mm6144.pdf>, accessed August 7, 2013.
Hogan, Howard, Debbie Perez, and William R. Bell. Who (Really) Are the First Baby Boomers?, in Joint Statistical Meetings Proceedings, Social Statistics Section, Alexandria, VA: American Statistical Association. 2008. pp. 1009–1016.
Kinsella, Kevin and Victoria A. Velkoff. An Aging World: 2001. International Population Reports, P95/01-1, U.S. Census Bureau: Washington, DC. 2001. <www.census.gov/prod /2001pubs/p95-01-1.pdf>, accessed February 12, 2014.
National Bureau of Statistics of China. China S tatistical Yearbook 2012. China Statistics Press: Beijing. 2012. <www.stats.gov .cn/tjsj/ndsj/2012/indexeh .htm>, accessed August 7, 2013.
National Center for Chronic Disease Prevention and Health Promotion. Obesity: Halting the Epidemic by Making Health Easier. Centers for Disease Control and Prevention: Atlanta, GA. 2011. <www.cdc .gov/chronicdisease/resources /publications/aag/pdf/2011 /Obesity_AAG_WEB_508.pdf>, accessed September 25, 2013.
Office of the Registrar General, India. Sample Registration System Statistical Report, 2010. Ministry of Home Affairs, Government of India: New Delhi. 2012. <www.censusindia.gov .in/2011-Common/srs.html>, accessed August 7, 2013.
Ogden, Cynthia L., Margaret D. Carroll, Brian K. Kit, and Katherine M. Flegal. Prevalence of Obesity in the United States, 2009–2010. NCHS Data Brief No. 82. 2012. <www.cdc.gov /nchs/data/databriefs/db82 .pdf>, accessed May 21, 2013.
U.S. Census Bureau. International Data Base. Washington, DC. 2012a. <www.census.gov /population/international /data/idb/informationGateway .php>, accessed May 20, 2013.
______. 2012 National Population Projections. Washington, DC. 2012b. <www.census.gov /population/projections/data /national/2012.html>, accessed May 20, 2013.
______. 2012 Population Estimates. Washington, DC. 2012c. <www.census.gov/popest/data /index.html>, accessed May 20, 2013.
______. Intercensal Estimates of the Resident Population by Single Year of Age, Sex, Race, and Hispanic Origin for the United States: April 1, 2000 to July 1, 2010. Washington, DC. 2011. <www.census.gov/popest/data /intercensal/national/nat2010 .html>, accessed May 20, 2013.
______. Monthly Intercensal Estimates of the United States Population by Age and Sex. Washington, DC. 2004a. <www.census.gov/popest/data /intercensal/national/index .html>, accessed May 20, 2013.
______. National Estimates by Age, Sex, Race: 1900–1979 (PE-11). Washington, DC. 2004b. <www.census.gov/popest/data /national/asrh/pre-1980/PE-11 .html>, accessed May 20, 2013.
______. Quarterly Population Estimates, 1980 to 1990. Population Estimates Program: Washington, DC. 2000. <www.census.gov/popest/data /national/asrh/1980s/80s_nat _detail.html>, accessed May 20, 2013.
24 U.S. Census Bureau
SUGGESTED CITATION
Ortman, Jennifer M., Victoria A. Velkoff, and Howard Hogan. An Aging Nation: The Older Population in the United States, Current Population Reports, P25-1140. U.S. Census Bureau, Washington, DC. 2014.
CONTACTS
U.S. Census Bureau Customer Service Center 301-763-2422 or 1-866-758-1060 (toll-free) or visit <ask.census.gov> for further information.
Population Projections Branch 301-763-2428
USER COMMENTS
The Census Bureau welcomes the comments and advice of users of our data and reports. Please send comments and suggestions to:
Chief, Population Division U.S. Census Bureau Washington, DC 20233-8800
U.S. Census Bureau 25
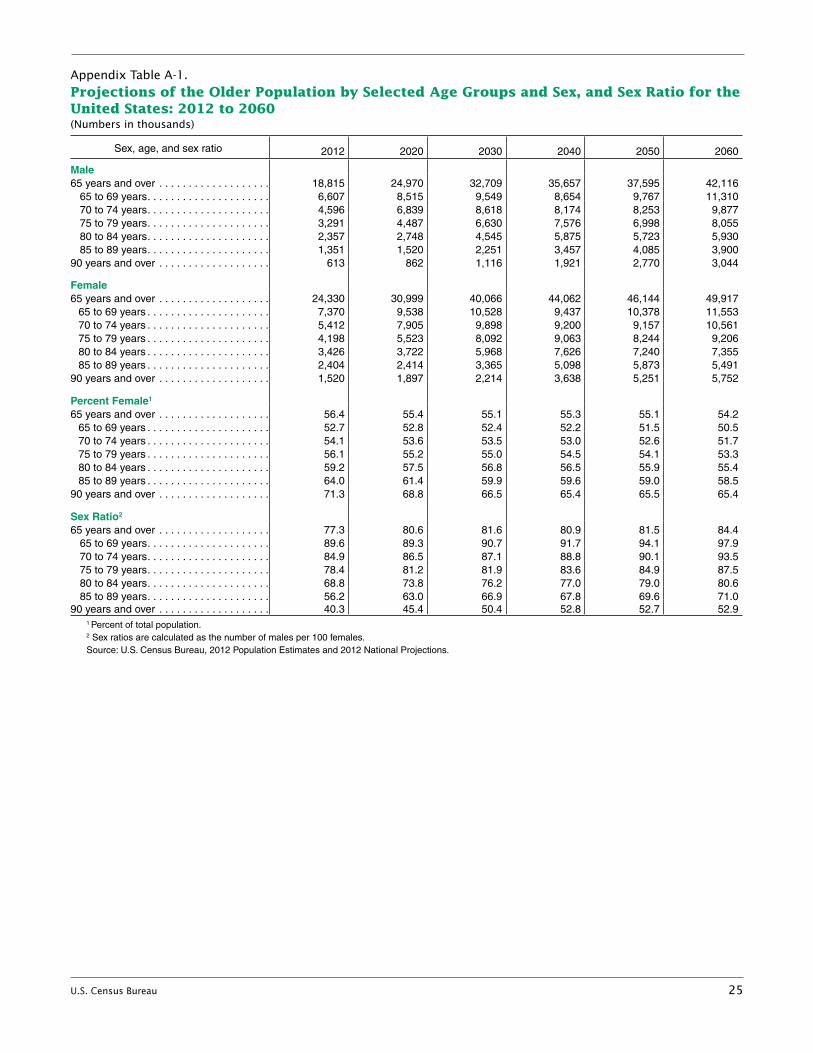
Appendix Table A-1. Projections of the Older Population by Selected Age Groups and Sex, and Sex Ratio for the United States: 2012 to 2060(Numbers in thousands)
Sex, age, and sex ratio 2012 2020 2030 2040 2050 2060
Male65 years and over . . . . . . . . . . . . . . . . . . . 18,815 24,970 32,709 35,657 37,595 42,116
65 to 69 years . . . . . . . . . . . . . . . . . . . . . 6,607 8,515 9,549 8,654 9,767 11,31070 to 74 years . . . . . . . . . . . . . . . . . . . . . 4,596 6,839 8,618 8,174 8,253 9,87775 to 79 years . . . . . . . . . . . . . . . . . . . . . 3,291 4,487 6,630 7,576 6,998 8,05580 to 84 years . . . . . . . . . . . . . . . . . . . . . 2,357 2,748 4,545 5,875 5,723 5,93085 to 89 years . . . . . . . . . . . . . . . . . . . . . 1,351 1,520 2,251 3,457 4,085 3,900
90 years and over . . . . . . . . . . . . . . . . . . . 613 862 1,116 1,921 2,770 3,044
Female65 years and over . . . . . . . . . . . . . . . . . . . 24,330 30,999 40,066 44,062 46,144 49,917
65 to 69 years . . . . . . . . . . . . . . . . . . . . . 7,370 9,538 10,528 9,437 10,378 11,55370 to 74 years . . . . . . . . . . . . . . . . . . . . . 5,412 7,905 9,898 9,200 9,157 10,56175 to 79 years . . . . . . . . . . . . . . . . . . . . . 4,198 5,523 8,092 9,063 8,244 9,20680 to 84 years . . . . . . . . . . . . . . . . . . . . . 3,426 3,722 5,968 7,626 7,240 7,35585 to 89 years . . . . . . . . . . . . . . . . . . . . . 2,404 2,414 3,365 5,098 5,873 5,491
90 years and over . . . . . . . . . . . . . . . . . . . 1,520 1,897 2,214 3,638 5,251 5,752
Percent Female1
65 years and over . . . . . . . . . . . . . . . . . . . 56.4 55.4 55.1 55.3 55.1 54.265 to 69 years . . . . . . . . . . . . . . . . . . . . . 52.7 52.8 52.4 52.2 51.5 50.570 to 74 years . . . . . . . . . . . . . . . . . . . . . 54.1 53.6 53.5 53.0 52.6 51.775 to 79 years . . . . . . . . . . . . . . . . . . . . . 56.1 55.2 55.0 54.5 54.1 53.380 to 84 years . . . . . . . . . . . . . . . . . . . . . 59.2 57.5 56.8 56.5 55.9 55.485 to 89 years . . . . . . . . . . . . . . . . . . . . . 64.0 61.4 59.9 59.6 59.0 58.5
90 years and over . . . . . . . . . . . . . . . . . . . 71.3 68.8 66.5 65.4 65.5 65.4
Sex Ratio2
65 years and over . . . . . . . . . . . . . . . . . . . 77.3 80.6 81.6 80.9 81.5 84.465 to 69 years . . . . . . . . . . . . . . . . . . . . . 89.6 89.3 90.7 91.7 94.1 97.970 to 74 years . . . . . . . . . . . . . . . . . . . . . 84.9 86.5 87.1 88.8 90.1 93.575 to 79 years . . . . . . . . . . . . . . . . . . . . . 78.4 81.2 81.9 83.6 84.9 87.580 to 84 years . . . . . . . . . . . . . . . . . . . . . 68.8 73.8 76.2 77.0 79.0 80.685 to 89 years . . . . . . . . . . . . . . . . . . . . . 56.2 63.0 66.9 67.8 69.6 71.0
90 years and over . . . . . . . . . . . . . . . . . . . 40.3 45.4 50.4 52.8 52.7 52.91 Percent of total population.2 Sex ratios are calculated as the number of males per 100 females.Source: U.S. Census Bureau, 2012 Population Estimates and 2012 National Projections.
26 U.S. Census Bureau
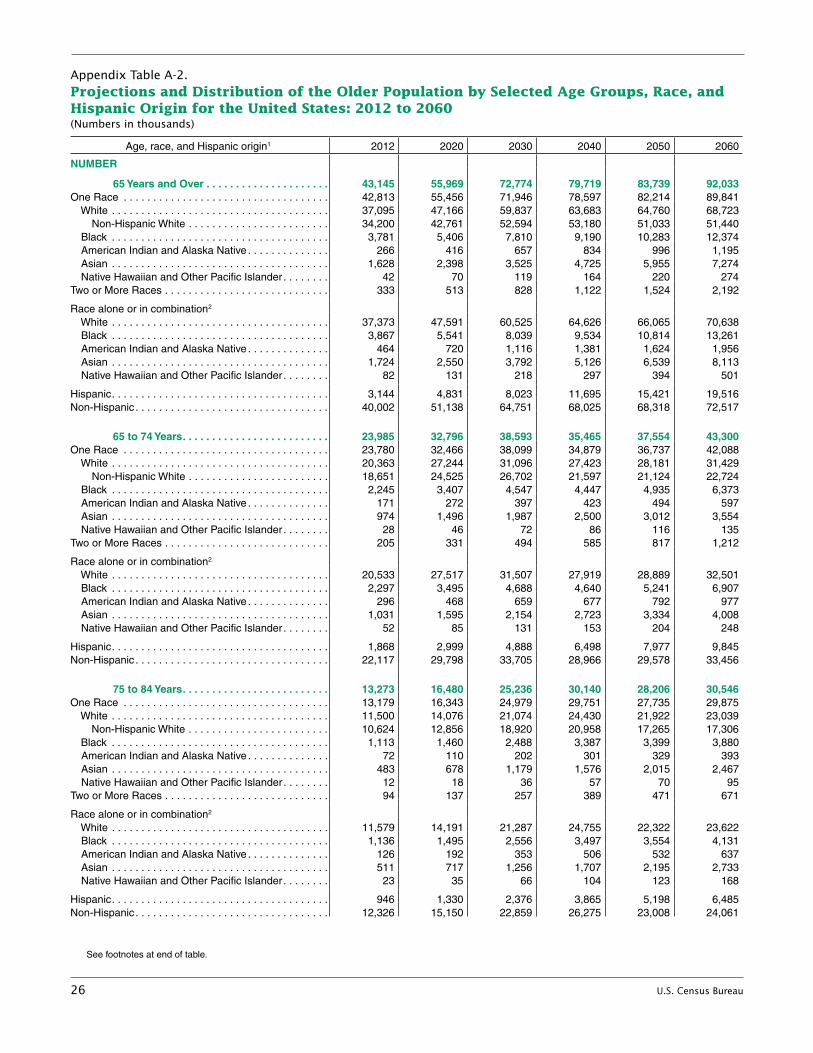
Appendix Table A-2.Projections and Distribution of thHispanic Origin for the United States: 2012 to 2060(Numbers in thousands)
e Older Population by Selected Age Groups, Race, and
Age, race, and Hispanic origin1 2012 2020 2030 2040 2050 2060
NUMBER
65 Years and Over . . . . . . . . . . . . . . . . . . . . . 43,145 55,969 72,774 79,719 83,739 92,033One Race . . . . . . . . . . . . . . . . . . . . . . . . . . . . . . . . . . . 42,813 55,456 71,946 78,597 82,214 89,841 White . . . . . . . . . . . . . . . . . . . . . . . . . . . . . . . . . . . . . 37,095 47,166 59,837 63,683 64,760 68,723 Non-Hispanic White . . . . . . . . . . . . . . . . . . . . . . . . 34,200 42,761 52,594 53,180 51,033 51,440 Black . . . . . . . . . . . . . . . . . . . . . . . . . . . . . . . . . . . . . 3,781 5,406 7,810 9,190 10,283 12,374
American Indian and Alaska Native . . . . . . . . . . . . . . 266 416 657 834 996 1,195 Asian . . . . . . . . . . . . . . . . . . . . . . . . . . . . . . . . . . . . . 1,628 2,398 3,525 4,725 5,955 7,274
Native Hawaiian and Other Pacific Islander . . . . . . . . 42 70 119 164 220 274Two or More Races . . . . . . . . . . . . . . . . . . . . . . . . . . . .
Race alone or in combination2
333 513 828 1,122 1,524 2,192
White . . . . . . . . . . . . . . . . . . . . . . . . . . . . . . . . . . . . . 37,373 47,591 60,525 64,626 66,065 70,638 Black . . . . . . . . . . . . . . . . . . . . . . . . . . . . . . . . . . . . . 3,867 5,541 8,039 9,534 10,814 13,261
American Indian and Alaska Native . . . . . . . . . . . . . . 464 720 1,116 1,381 1,624 1,956 Asian . . . . . . . . . . . . . . . . . . . . . . . . . . . . . . . . . . . . . 1,724 2,550 3,792 5,126 6,539 8,113
Native Hawaiian and Other Pacific Islander . . . . . . . . 82 131 218 297 394 501
Hispanic . . . . . . . . . . . . . . . . . . . . . . . . . . . . . . . . . . . . . 3,144 4,831 8,023 11,695 15,421 19,516Non-Hispanic . . . . . . . . . . . . . . . . . . . . . . . . . . . . . . . . . 40,002 51,138 64,751 68,025 68,318 72,517
65 to 74 Years . . . . . . . . . . . . . . . . . . . . . . . . . 23,985 32,796 38,593 35,465 37,554 43,300One Race . . . . . . . . . . . . . . . . . . . . . . . . . . . . . . . . . . . 23,780 32,466 38,099 34,879 36,737 42,088 White . . . . . . . . . . . . . . . . . . . . . . . . . . . . . . . . . . . . . 20,363 27,244 31,096 27,423 28,181 31,429 Non-Hispanic White . . . . . . . . . . . . . . . . . . . . . . . . 18,651 24,525 26,702 21,597 21,124 22,724 Black . . . . . . . . . . . . . . . . . . . . . . . . . . . . . . . . . . . . . 2,245 3,407 4,547 4,447 4,935 6,373
American Indian and Alaska Native . . . . . . . . . . . . . . 171 272 397 423 494 597 Asian . . . . . . . . . . . . . . . . . . . . . . . . . . . . . . . . . . . . . 974 1,496 1,987 2,500 3,012 3,554
Native Hawaiian and Other Pacific Islander . . . . . . . . 28 46 72 86 116 135Two or More Races . . . . . . . . . . . . . . . . . . . . . . . . . . . .
Race alone or in combination2
205 331 494 585 817 1,212
White . . . . . . . . . . . . . . . . . . . . . . . . . . . . . . . . . . . . . 20,533 27,517 31,507 27,919 28,889 32,501 Black . . . . . . . . . . . . . . . . . . . . . . . . . . . . . . . . . . . . . 2,297 3,495 4,688 4,640 5,241 6,907
American Indian and Alaska Native . . . . . . . . . . . . . . 296 468 659 677 792 977 Asian . . . . . . . . . . . . . . . . . . . . . . . . . . . . . . . . . . . . . 1,031 1,595 2,154 2,723 3,334 4,008
Native Hawaiian and Other Pacific Islander . . . . . . . . 52 85 131 153 204 248
Hispanic . . . . . . . . . . . . . . . . . . . . . . . . . . . . . . . . . . . . . 1,868 2,999 4,888 6,498 7,977 9,845Non-Hispanic . . . . . . . . . . . . . . . . . . . . . . . . . . . . . . . . . 22,117 29,798 33,705 28,966 29,578 33,456
75 to 84 Years . . . . . . . . . . . . . . . . . . . . . . . . . 13,273 16,480 25,236 30,140 28,206 30,546One Race . . . . . . . . . . . . . . . . . . . . . . . . . . . . . . . . . . . 13,179 16,343 24,979 29,751 27,735 29,875 White . . . . . . . . . . . . . . . . . . . . . . . . . . . . . . . . . . . . . 11,500 14,076 21,074 24,430 21,922 23,039 Non-Hispanic White . . . . . . . . . . . . . . . . . . . . . . . . 10,624 12,856 18,920 20,958 17,265 17,306 Black . . . . . . . . . . . . . . . . . . . . . . . . . . . . . . . . . . . . . 1,113 1,460 2,488 3,387 3,399 3,880
American Indian and Alaska Native . . . . . . . . . . . . . . 72 110 202 301 329 393 Asian . . . . . . . . . . . . . . . . . . . . . . . . . . . . . . . . . . . . . 483 678 1,179 1,576 2,015 2,467
Native Hawaiian and Other Pacific Islander . . . . . . . . 12 18 36 57 70 95Two or More Races . . . . . . . . . . . . . . . . . . . . . . . . . . . .
Race alone or in combination2
94 137 257 389 471 671
White . . . . . . . . . . . . . . . . . . . . . . . . . . . . . . . . . . . . . 11,579 14,191 21,287 24,755 22,322 23,622 Black . . . . . . . . . . . . . . . . . . . . . . . . . . . . . . . . . . . . . 1,136 1,495 2,556 3,497 3,554 4,131
American Indian and Alaska Native . . . . . . . . . . . . . . 126 192 353 506 532 637 Asian . . . . . . . . . . . . . . . . . . . . . . . . . . . . . . . . . . . . . 511 717 1,256 1,707 2,195 2,733
Native Hawaiian and Other Pacific Islander . . . . . . . . 23 35 66 104 123 168
Hispanic . . . . . . . . . . . . . . . . . . . . . . . . . . . . . . . . . . . . . 946 1,330 2,376 3,865 5,198 6,485Non-Hispanic . . . . . . . . . . . . . . . . . . . . . . . . . . . . . . . . . 12,326 15,150 22,859 26,275 23,008 24,061
See footnotes at end of table.
U.S. Census Bureau 27
Appendix Table A-2.Projections and Distribution of thHispanic Origin for the United States: 2012 to 2060(Numbers in thousands)
e Older Population by Selected Age Groups, Race, and —Con.
Age, race, and Hispanic origin1 2012 2020 2030 2040 2050 2060
85 Years and Over . . . . . . . . . . . . . . . . . . . 5,887 6,693 8,946 14,115 17,978 18,187One Race . . . . . . . . . . . . . . . . . . . . . . . . . . . . . . . . . . . 5,853 6,647 8,869 13,967 17,742 17,878 White . . . . . . . . . . . . . . . . . . . . . . . . . . . . . . . . . . . . . 5,232 5,845 7,667 11,830 14,657 14,255 Non-Hispanic White . . . . . . . . . . . . . . . . . . . . . . . . 4,926 5,381 6,972 10,625 12,644 11,410 Black . . . . . . . . . . . . . . . . . . . . . . . . . . . . . . . . . . . . . 424 539 774 1,356 1,950 2,120 American Indian and Alaska Native . . . . . . . . . . . . . . 22 34 58 110 173 205 Asian . . . . . . . . . . . . . . . . . . . . . . . . . . . . . . . . . . . . . 172 224 359 650 928 1,253 Native Hawaiian and Other Pacific Islander . . . . . . . . 3 5 10 20 34 44Two or More Races . . . . . . . . . . . . . . . . . . . . . . . . . . . .
Race alone or in combination2
34 45 77 148 236 309
White . . . . . . . . . . . . . . . . . . . . . . . . . . . . . . . . . . . . . 5,261 5,883 7,731 11,952 14,853 14,515 Black . . . . . . . . . . . . . . . . . . . . . . . . . . . . . . . . . . . . . 433 551 795 1,397 2,019 2,224 American Indian and Alaska Native . . . . . . . . . . . . . . 42 60 104 198 300 343 Asian . . . . . . . . . . . . . . . . . . . . . . . . . . . . . . . . . . . . . 181 238 382 696 1,009 1,373 Native Hawaiian and Other Pacific Islander . . . . . . . . 7 11 21 40 67 86
Hispanic . . . . . . . . . . . . . . . . . . . . . . . . . . . . . . . . . . . . . 329 502 759 1,331 2,246 3,186Non-Hispanic . . . . . . . . . . . . . . . . . . . . . . . . . . . . . . . . .
PERCENT
5,558 6,190 8,187 12,783 15,733 15,001
65 Years and Over . . . . . . . . . . . . . . . . . . . . . 100 .0 100 .0 100 .0 100 .0 100 .0 100 .0One Race . . . . . . . . . . . . . . . . . . . . . . . . . . . . . . . . . . . 99.2 99.1 98.9 98.6 98.2 97.6 White . . . . . . . . . . . . . . . . . . . . . . . . . . . . . . . . . . . . . 86.0 84.3 82.2 79.9 77.3 74.7 Non-Hispanic White . . . . . . . . . . . . . . . . . . . . . . . . 79.3 76.4 72.3 66.7 60.9 55.9 Black . . . . . . . . . . . . . . . . . . . . . . . . . . . . . . . . . . . . . 8.8 9.7 10.7 11.5 12.3 13.4 American Indian and Alaska Native . . . . . . . . . . . . . . 0.6 0.7 0.9 1.0 1.2 1.3 Asian . . . . . . . . . . . . . . . . . . . . . . . . . . . . . . . . . . . . . 3.8 4.3 4.8 5.9 7.1 7.9 Native Hawaiian and Other Pacific Islander . . . . . . . . 0.1 0.1 0.2 0.2 0.3 0.3Two or More Races . . . . . . . . . . . . . . . . . . . . . . . . . . . .
Race alone or in combination2
0.8 0.9 1.1 1.4 1.8 2.4
White . . . . . . . . . . . . . . . . . . . . . . . . . . . . . . . . . . . . . 86.6 85.0 83.2 81.1 78.9 76.8 Black . . . . . . . . . . . . . . . . . . . . . . . . . . . . . . . . . . . . . 9.0 9.9 11.0 12.0 12.9 14.4 American Indian and Alaska Native . . . . . . . . . . . . . . 1.1 1.3 1.5 1.7 1.9 2.1 Asian . . . . . . . . . . . . . . . . . . . . . . . . . . . . . . . . . . . . . 4.0 4.6 5.2 6.4 7.8 8.8 Native Hawaiian and Other Pacific Islander . . . . . . . . 0.2 0.2 0.3 0.4 0.5 0.5
Hispanic . . . . . . . . . . . . . . . . . . . . . . . . . . . . . . . . . . . . . 7.3 8.6 11.0 14.7 18.4 21.2Non-Hispanic . . . . . . . . . . . . . . . . . . . . . . . . . . . . . . . . . 92.7 91.4 89.0 85.3 81.6 78.8
65 to 74 Years . . . . . . . . . . . . . . . . . . . . . . . . . 100 .0 100 .0 100 .0 100 .0 100 .0 100 .0One Race . . . . . . . . . . . . . . . . . . . . . . . . . . . . . . . . . . . 99.1 99.0 98.7 98.3 97.8 97.2 White . . . . . . . . . . . . . . . . . . . . . . . . . . . . . . . . . . . . . 84.9 83.1 80.6 77.3 75.0 72.6 Non-Hispanic White . . . . . . . . . . . . . . . . . . . . . . . . 77.8 74.8 69.2 60.9 56.2 52.5 Black . . . . . . . . . . . . . . . . . . . . . . . . . . . . . . . . . . . . . 9.4 10.4 11.8 12.5 13.1 14.7 American Indian and Alaska Native . . . . . . . . . . . . . . 0.7 0.8 1.0 1.2 1.3 1.4 Asian . . . . . . . . . . . . . . . . . . . . . . . . . . . . . . . . . . . . . 4.1 4.6 5.1 7.0 8.0 8.2 Native Hawaiian and Other Pacific Islander . . . . . . . . 0.1 0.1 0.2 0.2 0.3 0.3Two or More Races . . . . . . . . . . . . . . . . . . . . . . . . . . . .
Race alone or in combination2
0.9 1.0 1.3 1.7 2.2 2.8
White . . . . . . . . . . . . . . . . . . . . . . . . . . . . . . . . . . . . . 85.6 83.9 81.6 78.7 76.9 75.1 Black . . . . . . . . . . . . . . . . . . . . . . . . . . . . . . . . . . . . . 9.6 10.7 12.1 13.1 14.0 16.0 American Indian and Alaska Native . . . . . . . . . . . . . . 1.2 1.4 1.7 1.9 2.1 2.3 Asian . . . . . . . . . . . . . . . . . . . . . . . . . . . . . . . . . . . . . 4.3 4.9 5.6 7.7 8.9 9.3 Native Hawaiian and Other Pacific Islander . . . . . . . . 0.2 0.3 0.3 0.4 0.5 0.6
Hispanic . . . . . . . . . . . . . . . . . . . . . . . . . . . . . . . . . . . . . 7.8 9.1 12.7 18.3 21.2 22.7Non-Hispanic . . . . . . . . . . . . . . . . . . . . . . . . . . . . . . . . . 92.2 90.9 87.3 81.7 78.8 77.3
See footnotes at end of table.
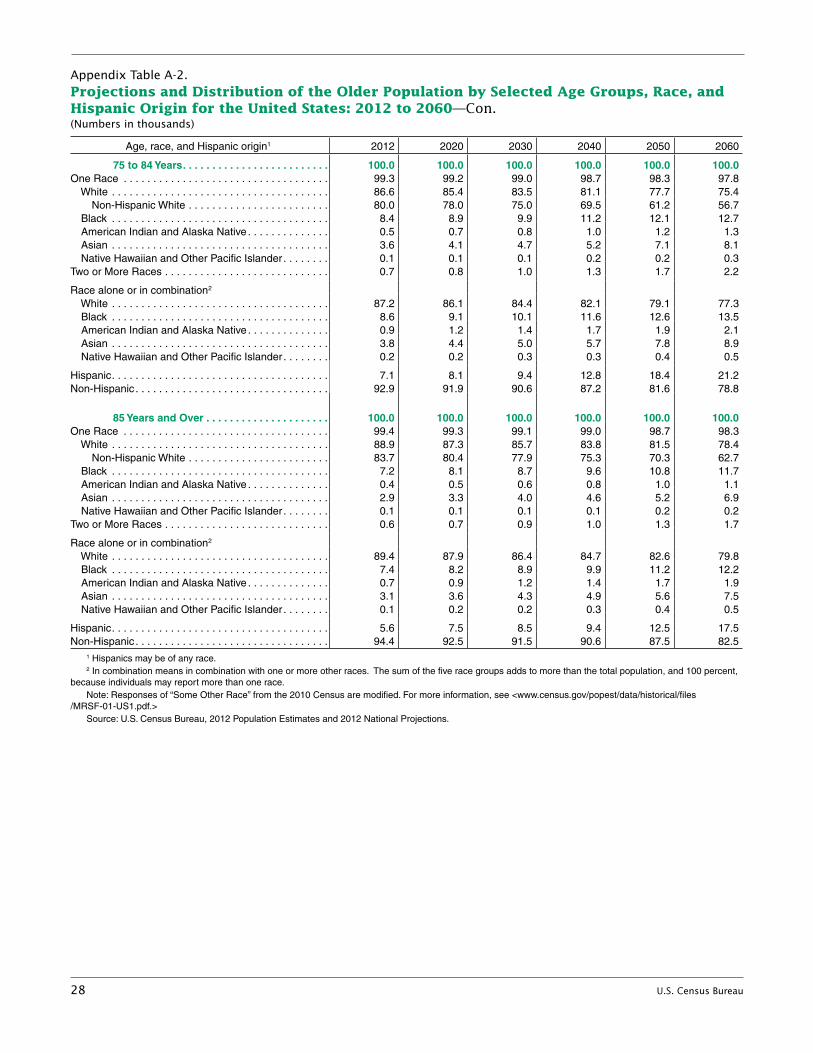
28 U.S. Census Bureau
Appendix Table A-2.Projections and Distribution of thHispanic Origin for the United States: 2012 to 2060(Numbers in thousands)
e Older Population by Selected Age Groups, Race, and —Con.
Age, race, and Hispanic origin1 2012 2020 2030 2040 2050 2060
75 to 84 Years . . . . . . . . . . . . . . . . . . . . . . . . . 100 .0 100 .0 100 .0 100 .0 100 .0 100 .0One Race . . . . . . . . . . . . . . . . . . . . . . . . . . . . . . . . . . . 99.3 99.2 99.0 98.7 98.3 97.8 White . . . . . . . . . . . . . . . . . . . . . . . . . . . . . . . . . . . . . 86.6 85.4 83.5 81.1 77.7 75.4 Non-Hispanic White . . . . . . . . . . . . . . . . . . . . . . . . 80.0 78.0 75.0 69.5 61.2 56.7 Black . . . . . . . . . . . . . . . . . . . . . . . . . . . . . . . . . . . . . 8.4 8.9 9.9 11.2 12.1 12.7 American Indian and Alaska Native . . . . . . . . . . . . . . 0.5 0.7 0.8 1.0 1.2 1.3 Asian . . . . . . . . . . . . . . . . . . . . . . . . . . . . . . . . . . . . . 3.6 4.1 4.7 5.2 7.1 8.1 Native Hawaiian and Other Pacific Islander . . . . . . . . 0.1 0.1 0.1 0.2 0.2 0.3Two or More Races . . . . . . . . . . . . . . . . . . . . . . . . . . . . 0.7 0.8 1.0 1.3 1.7 2.2
Race alone or in combination2
White . . . . . . . . . . . . . . . . . . . . . . . . . . . . . . . . . . . . . 87.2 86.1 84.4 82.1 79.1 77.3 Black . . . . . . . . . . . . . . . . . . . . . . . . . . . . . . . . . . . . . 8.6 9.1 10.1 11.6 12.6 13.5 American Indian and Alaska Native . . . . . . . . . . . . . . 0.9 1.2 1.4 1.7 1.9 2.1 Asian . . . . . . . . . . . . . . . . . . . . . . . . . . . . . . . . . . . . . 3.8 4.4 5.0 5.7 7.8 8.9 Native Hawaiian and Other Pacific Islander . . . . . . . . 0.2 0.2 0.3 0.3 0.4 0.5
Hispanic . . . . . . . . . . . . . . . . . . . . . . . . . . . . . . . . . . . . . 7.1 8.1 9.4 12.8 18.4 21.2Non-Hispanic . . . . . . . . . . . . . . . . . . . . . . . . . . . . . . . . . 92.9 91.9 90.6 87.2 81.6 78.8
85 Years and Over . . . . . . . . . . . . . . . . . . . . . 100 .0 100 .0 100 .0 100 .0 100 .0 100 .0One Race . . . . . . . . . . . . . . . . . . . . . . . . . . . . . . . . . . . 99.4 99.3 99.1 99.0 98.7 98.3 White . . . . . . . . . . . . . . . . . . . . . . . . . . . . . . . . . . . . . 88.9 87.3 85.7 83.8 81.5 78.4 Non-Hispanic White . . . . . . . . . . . . . . . . . . . . . . . . 83.7 80.4 77.9 75.3 70.3 62.7 Black . . . . . . . . . . . . . . . . . . . . . . . . . . . . . . . . . . . . . 7.2 8.1 8.7 9.6 10.8 11.7 American Indian and Alaska Native . . . . . . . . . . . . . . 0.4 0.5 0.6 0.8 1.0 1.1 Asian . . . . . . . . . . . . . . . . . . . . . . . . . . . . . . . . . . . . . 2.9 3.3 4.0 4.6 5.2 6.9 Native Hawaiian and Other Pacific Islander . . . . . . . . 0.1 0.1 0.1 0.1 0.2 0.2Two or More Races . . . . . . . . . . . . . . . . . . . . . . . . . . . . 0.6 0.7 0.9 1.0 1.3 1.7
Race alone or in combination2
White . . . . . . . . . . . . . . . . . . . . . . . . . . . . . . . . . . . . . 89.4 87.9 86.4 84.7 82.6 79.8 Black . . . . . . . . . . . . . . . . . . . . . . . . . . . . . . . . . . . . . 7.4 8.2 8.9 9.9 11.2 12.2 American Indian and Alaska Native . . . . . . . . . . . . . . 0.7 0.9 1.2 1.4 1.7 1.9 Asian . . . . . . . . . . . . . . . . . . . . . . . . . . . . . . . . . . . . . 3.1 3.6 4.3 4.9 5.6 7.5 Native Hawaiian and Other Pacific Islander . . . . . . . . 0.1 0.2 0.2 0.3 0.4 0.5
Hispanic . . . . . . . . . . . . . . . . . . . . . . . . . . . . . . . . . . . . . 5.6 7.5 8.5 9.4 12.5 17.5Non-Hispanic . . . . . . . . . . . . . . . . . . . . . . . . . . . . . . . . . 94.4 92.5 91.5 90.6 87.5 82.5
1 Hispanics may be of any race.2 In combination means in combination with one or more other races. The sum of the five race groups adds to more than the total population, and 100 percent,
because individuals may report more than one race.Note: Responses of “Some Other Race” from the 2010 Census are modified. For more information, see <www.census.gov/popest/data/historical/files
/MRSF-01-US1.pdf.>Source: U.S. Census Bureau, 2012 Population Estimates and 2012 National Projections.