DPR-MGM Minerals 2
65
Detailed Project Report – 5 MW Solar Power Plant MGM Minerals Ltd
description
A Detailed Project Report of Solar PV Power Plant
Transcript of DPR-MGM Minerals 2
– 5 MW Solar Power Plant MGM Minerals Ltd

Contents
1 Executive Summary.............................................................................................................................42 Introduction.....................................................................................................................................6
2.1 Overview of Indian Power Sector.....................................................................................82.2 Initiatives of the Central Government in Renewable Energy Sector...................82.3 Initiatives of Orissa Government in Renewable Energy Sector:...........................9
3 Brief Profile of the Company...................................................................................................103.1 Introduction...........................................................................................................................103.2 Promoters Background......................................................................................................10
4 Project Background....................................................................................................................125 Meteorological information......................................................................................................14
5.1 Radiation Climatology of India........................................................................................145.2 Radiation Climatology Of Orissa....................................................................................215.3 Meteorological Data...........................................................................................................215.4 Climate Data.........................................................................................................................22
6 Site Selection................................................................................................................................245.1 Profile of the District..........................................................................................................245.2 District Map...........................................................................................................................255.3 Profile of the Land...............................................................................................................25
6 Technical Features.....................................................................................................................266.1 Proposed technology.........................................................................................................266.2 Plant Layout..........................................................................................................................276.3 Plant Specification..............................................................................................................276.4 Civil Infrastructure..............................................................................................................31
7 Power Evacuation........................................................................................................................338 Project Execution Plan...............................................................................................................349 Operational Features.................................................................................................................36
9.1 Factors Effecting Generation...........................................................................................369.2 Organization of power plant O &M................................................................................379.3 Protection of People and Equipment............................................................................38
10 Financial Analysis....................................................................................................................3910.1 Key Assumption...................................................................................................................3910.2 Project Cost...........................................................................................................................4010.3 Means of Finance................................................................................................................4010.4 Profitability Statement......................................................................................................41
10.4.1 Projections of Performance, Profitability and Repayment............................41
10.4.2 Projected Cash Flow...................................................................................................43
10.4.3 Projected Balance Sheet...........................................................................................44
10.4.4 Interest and Repayment Schedule........................................................................46
10.5 Financial Analysis................................................................................................................4710.5.1 Debt Service Coverage Ratio:.................................................................................47
10.5.2 Internal Rate of Return:............................................................................................48
11 Project Contribution to the sustainable development................................................50
2

1 Executive Summary
The techno - commercial feasibility report will highlight the technical and financial aspects of the proposed project activity of 5 MW Grid Connected Solar Power generation project at Khurda district of Orissa State under Built Own Operate (BOO) mode. With a strategy to contribute towards sustainable development priorities of the host country government by investing in renewable energy technology, MGM Minerals Limited is developing a solar energy project in the state of Orissa.
Technical Aspects:
1 Proposed Capacity 5 MW 2 Project Site Village: Patrapada
Tehasil: Tangi P.S.: Tangi District: Khurda State: Orissa Country: India Latitude-19°58'31"N to 19°58'44"N Longitude-85°27'43"E to 85°28'7"E
3 Type of system Fixed Structure4 Type of PV Modules A poly crystalline silicon cell is a combination of
more than one silicon cell in the form of wafer. This system can operate at an efficiency of 14.6% and is significantly cheaper than single crystalline cells.
5 Projected Land Required 25 Acres6 Power Conversion
Efficiency of PV Module13%
7 Total Modules required 178568 Module capacity 280 Wp9 Inverter Capacity 500 kW Inverters (10)10 Projected Annual Energy
Production 8.322 MU with Degradation factor of 0% per annum
11 Capacity Utilization factor 19%
12 Grid Evacuation The Power Generated at 415 V in the plant will be stepped up to 33/132 kV and connected to the 33/132 kV substation of GRIDCO which is available nearby the project site.
13 Life Time 20 Years14 Power Plant Composition Solar array, solar modules, power conditioning
system, control room, data logging system, monitoring system, junction boxes, cables and other accessories.
15 Expected Annual Green 6990 tCO2e
3

House Gas Emission Reduction
16 Expected Commissioning September 201017 Project Promoter MGM Minerals limited
Financial Aspects:
1 Capital Cost 4995 Lakhs INR 2 Debt Equity Ratio 01:013 Rate of Interest 15%4 Term Loan 2500 Lakhs INR5 Loan Tenure 10 Years6 Moratorium 3 Years 7 Equity Contribution 2500 Lakhs INR8 Power Sale Price Rs 15/Unit 9 Pay Back Period With CDM 8 Year
10 Pay Back Period Without CDM 9 Year11 DSCR with CDM 1.8512 DSCR without CDM 1.7813 IRR with CDM 12.79%14 IRR without CDM 11.74%15 NPV @10% discount with CDM 480.8516 NPV @10% discount without CDM 303.25
4

2 Introduction
Energy usage has a dichotomous relationship with the development of the civilization. With rapid growth in urbanization and industrialization, the pressure is now on the energy sector to meet up the growing demand so as to sustain the human energy requirement for day to day activity and support growth. Over use of fossil fuel on the other hand is result in depletion of the finite fossil fuel reserve and bringing about environmental degradation. Concern over the sustainability of the energy supply and the environmental issues due to over use of the finite resources is forcing the human race to think of a judicious solution of meeting up the energy requirement without disturbing the ecological balance and raising concern over the energy security.
In the wake of rising fossil fuel price, bleak projection of the fossil fuel reserve and increasing concerns over country’s energy security; the government is strategized towards a radical shift in the power sector plan and favoring the enhancement of the renewable energy in the power generation mix. With an objective to deepen institutional reform concerted effort has been made in Indian power sector by the government with specific focus over the renewable energy sector.
JNSSM Scheme:
With an objective to harness the huge untapped solar energy potential in the country and promote self energy sufficiency and independency, the Government of India has launched promotional scheme and incentives to enhance private sector participation in the field. The project is being conceptualized considering benefits as mentioned in Jawaharlal Nehru National Solar Mission (JNNSM) for setting up Grid connected Solar Power Plants. Jawaharlal Nehru National Solar Mission (JNNSM) aims at development and deployment of solar energy technologies in the country to achieve parity with grid power tariff by 2022. In the first phase i.e. till 2013 the mission targets 1100 MW of solar power both thermal and photovoltaic. The mission has also set up a national level entity i.e. the NTPC Vidyut Vyapar Nigam Limited (NVVN) who would purchase all the power generated from such solar power plants at tariff determined by the Central Electricity Regulatory Commission (CERC). At present the CERC has announced a tariff of Rs 17.91 per unit. Orissa has been at the forefront in the use of renewable energy and demonstrates its effective utilization to the nation.
Benefits of Grid Connected Solar Power Systems:
a. The project activity will act as a corner stone towards diversification of national energy supply and lower dependency on fossil fuel. Such initiative will also contribute towards bridging up of the demand supply gap which is well reflected
5

in peak shortage ranges around 14% whereas energy shortage is about 8.8% at national level.
b. To meet the huge energy requirement in order to sustain the current economic and industrial growth with diversity and 5% spinning reserve a capacity addition of 72,000 MW is required during the Eleventh Plan period which accounts for a considerable amount of capital investment; so such initiative by the project proponent will obviously promote private sector participation in harmonizing the growth requirement of the country and will assist in stimulating and accelerating the commercialization of renewable energy technologies and markets at the grid level under private ownership.
c. The deployment of project activity would also support governments’ mission of achieving of 10% of total planned power generation capacity addition through renewable.
d. Successful implementation of the project will address the environmental concern and global warming. Generating power using solar energy will reduce green house gas emission associated with generation of electrical energy from combustion of fossil fuel in grid connected power plant that would have generated otherwise. The project will also result in reducing the pollution load due to emission of SOx, NOx and TSP which would have emitted otherwise for generating equivalent quantum of power in the fossil fuel based power plant.
Energy is the backbone of human development and progress. The growing industrialization, changes in life style is paving towards sharp rise in the energy demand with an projected rise of more than half of the current demand over the next twenty five years while the condition of energy supply becoming increasingly uncertain due to finite availability fossil fuel, enhancing the concern over the energy security. The increasing demand of energy is slowly depleting and exhausting the natural resources. If not dealt in sensible and sustainable way will result towards complete exhaustion of the existing natural resources. Utilizing renewable energy resources can be considered as an identical solution towards judicious use of the existing natural resources before it is too late.
Power generation through use of conventional energy sources has always been a stress full activity in terms of its impact over the environment. These effects are wide ranging and include perturbation of global climate, threat to endangered species and towards the biodiversity. Even such impacts also entails towards human health, destruction of land and production of radioactive and toxic waste. Using of renewable energy sources and thereby reducing the consumption of fossil fuel can offer our planet a chance to reduce carbon emissions, clean the air, and put our civilization on a more sustainable footing. It also offers countries around the world the chance to improve their energy security and spur economic development.
6

2.1 Overview of Indian Power Sector
Energy is the sine qua non of development. India with over a billion people, today only produces 728962 MU against the annual energy requirement of 799578 MU of electricity leaving over 600 million Indians, a population equal to the combined population of USA and EU, without access to electricity. This constrained energy access is reflected, in the relatively low Human Development Index of India. With an economic growth slightly above 8% and projected growth rate of over the same the country is proceeding towards serious dearth of power. The Central Electricity Authority (CEA) has projected concern over serious power shortage in the coming fiscal. Indian Power sector is highly fossil fuel dominated one owing to the comparatively lower cost of power generation from the same. Fossil fuel comprises of 63.3% of the total installed capacity rest being catered by large hydro power project 24.87%, nuclear 2.81% leaving 9.02% from renewable. However, with the improvement in technology and declaration of the incentives from the government in terms of tariff support and tax break on renewable products is expected to be commercialized the sector in the near future. The sector is expected to grow outward from the vibrant domestic capital market, increased activities in the area of project financing, and private equity investment.
With an installed capacity of 146752.81 MW, which is highly fossil fuel dominated the country is facing the serious problem of energy shortage in the range of 10.5% and peak deficit in the range of 13.5%. The power shortage is prevailing and steadily dominating in spite of consistent sectoral growth in terms of enhancement of installed capacity. Such demand supply viability gap has occurred in the back drop of high economic growth, rapid industrialization and abrupt change in life style leading enhancement of per capita energy consumption. In order the match the pace of growth and fulfilling the deficit the sector is expanding its capacity leading towards depletion of the fossil fuel reserve, concern of enhanced environmental pollution and energy security. The high capital cost of installation, lack of commercialized technology, lower Capacity Utilization Factor and inconsistency in supplying of power owing to its high dependency on the nature has hindered the prioritization and development of the renewable energy sector.
2.2 Initiatives of the Central Government in Renewable Energy Sector
The ever growing concern over the energy security of the nation had initiated the thought process of attaining energy self sufficiency for the nation. The very idea of Energy Self sufficiency was identified as a major driver for promoting renewable
7

energy technology. The prior experience of oil shock in 70’s, increasing crude price in the global market and uncertainties associated with its supply had paved way towards formulation of strategy under Commission for Additional Sources of Energy in the Department of Science & Technology in March 1981. The Commission was charged with the responsibility of formulating policies and their implementation, programmes for development of new and renewable energy apart from coordinating and intensifying R&D in the sector. In 1982, a new department, i.e., Department of Non-conventional Energy Sources (DNES), that incorporated CASE, was created in the then Ministry of Energy. In 1992, DNES became the Ministry of Non-conventional Energy Sources which was re-christened as the Ministry of New and Renewable Energy in October 2006. Meanwhile the main course power sector has undergone a massive transition and reform from monopolistic SEB era to a separate generation, transmission and distribution utilities, regulatory bodies and participation from private and foreign players promoting a competitive approach to bridge up the future challenge of the increasing demand, energy security and global environmental concern. Initiatives of the government to promote participation in Renewable Energy Sector are as follows:
1. Out of the overall target of 70,000 MW power generation installed capacity addition during the 11th Plan period, 14,500 MW (about 20%) capacity additions is proposed from renewable.
2. A provision of Rs. 3925 crore is proposed as subsidy for grid-interactive and distributed renewable power, including captive power which would save conventional power.
3. Provision of Rs. 200 crore has been kept for subsidy for solar power (grid-interactive and distributed/ decentralized).
4. Proposal for Rs. 220 crore of financial outlay on research, design and development of solar photovoltaic under 11th Plan.
5. Planned capacity addition of 30,000 MW is envisaged for the 12 th and 13th Plan Period.
6. Accelerated depreciation benefit for tax purpose in the first year of installation.7. Relieve of exercise duty on manufacture of most of the finished product.8. Low import tariff for capital equipment and most of the material and
component.9. Soft loan to manufacturers and user of renewable energy technologies.10.Five year tax holiday for tax generation project.11.Remunerative price under alternative power purchase policy by the state
government for the power generated through renewable energy technology fed to the grid by private party.
12.Facility for banking and wheeling of power.
8

2.3 Initiatives of Orissa Government in Renewable Energy Sector:
The state of Orissa has been at the forefront of adopting renewable energy technologies. The State Government under the aegis of Dept. of Science and Technology, constituted Orissa Renewable Energy Development Agency (OREDA) as a nodal agency in 1984 with a view to popularize the exploitation and use of renewable energy resources in the state. Since, its inception, OREDA has provided renewable energy solutions to more than 2.00 Lakhs households in the state by providing solar photovoltaic power plants, solar home light systems, solar street light systems, biomass gasifier and biogas plants. The National Biogas & Manure Management Program (NBMMP) has been one of the major programs of OREDA right from its inception. Orissa is one of the leading states in the country as far as the biogas programme is concerned. OREDA has bagged two gold shields during 1995 - 96 & 1999 - 2000 for best overall performance at the national level.
OREDA’s vision is to make 10% of all new power capacity addition for the period up to 2012 from renewable energy. Orissa is the first State in the Country to take up Power Sector Reform to ensure stable and quality power at a reasonable cost. The Energy Department has three public Sector Undertakings viz. Grid Corporation of Orissa Limited (GRIDCO), Orissa Hydro Power Corporation Limited (OHPC) and Orissa Power Generation Corporation Limited (OPGC) under its Administrative control. The Orissa Electricity Regulatory Commission (OERC), which is a quasi judicial independent body, ensures a transparent regulatory regime in the power sector of the state.
3 Brief Profile of the Company
3.1 Introduction
MGM Minerals Limited is a part of 100 Crore MGM Group and is into mining and exporting iron ore, having its own mines in Sundargarh district of Orissa.
The Group is setting up an integrated steel plant of 0.25 MT per annum capacity including power plant of 16 MW Capacity through WHRB process. The first phase of the above plant will be commissioned in 4-5 months time. The plant is being set up in Dhenkanal district of Orissa. The plant includes sponge iron plant, waste heat recovery power plant and steel billets manufacturing facilities.
The Group is also diversifying into Horticulture for which land has already been acquired in different districts in Orissa.
9

3.2 Promoters Background
The promoters of MGM Minerals Limited are Mr. Rajib Lochan Mohanty and Mr. Pankaj Lochan Mohanty and Mrs. Meenoti Mohanty.
Rajib Lochan Mohanty
Mr. Rajib Lochan Mohanty is the son of Late Mana Govinda Mohanty, aged about 59 years (D.O.B 05-09-1950), Marine Engineer, is a resident of 2A, Forest Park, Bhubaneswar. He has 10 years experience in shipping and 25 years experience in mining business. He is a Director Sun Alloys & Minerals Ltd. & MGM Minerals Ltd. His net worth is about Rs. 17.46 Crores.
Pankaj Lochan Mohanty
Mr. Pankaj Lochan Mohanty is son of Late Mana Govinda Mohanty, aged about 49 years (D.O.B 13-02-1961), is a resident of 2A, Forest Park, Bhubaneswar. He is a Director of Sun Alloys & Minerals Ltd., MGM Minerals Ltd., and Blue Lagoon Farms Pvt. Ltd. He has 25 years experience in mining business. His net worth is about 17.38 Crores. Meenoti Mohanty
Mrs. Meenoti Mohanty is wife of Mr. Rajib Lochan Mohanty aged about 55 years (D.O.B. 15-06-55) is a resident of 2A, Forest Park, Bhubaneswar. She has 15 years experience in mining business. He is a Director in Aeon Minerals (P) Ltd & MGM Minerals Ltd. Her net worth is about 0.50 Crore.
10

4 Project Background
MGM Minerals Limited proposes to set up a 5 MW grid connected Solar Power plant at Khurda District in the state of Orissa with the objective of renewable power generation and supplying clean electricity to grid on BOO (Build, Own & Operate) basis. The main objective of the project promoter is to be in tune with the sustainable development priorities of the country and contribute towards climate change mitigation initiative envisaged by the host country government. Successful operation of the project activity will act as a cornerstone towards promotion of the technology. With an age long relationship in the domain the promoter is intended to set the project activity and demonstrates feasibility of grid interactive solar power in supplying of reliable clean energy to the grid and support electrical demand in the country, which is blessed with more than 320 days of sunshine.
The solar power plant shall operate on the principle of direct conversion of sunlight to electrical energy by employing photovoltaic technology and supply it directly to the grid.
The plant location is chosen as MGM Minerals Limited is having 15 acres of open land available in that region, which is well suited for solar PV installations and hence will reduce the leveling cost, shadow losses and cost for cabling as well due to its proximity to grid. MGM Minerals Limited is also in the process of acquiring 10 acres of land adjacent to the current 15 acres of land. 33 KV line of adequate capacity is available nearby at Jankia, Khurda district about 5 Km from the proposed site and connectivity to the proposed plant can be nade by drawing 5 Km of 33 KV line for power synchronization with state grid through CESU’s 33 KV system.
The promoter will ensure installation of the proposed solar plant and related infrastructure will meet international standards for the industry. The power plant will be scheduled for commissioning within one year from the date of possession of land through the Orissa Government.
The power plant shall consist of:
11

Solar Array capacity (5 MW - rated high efficiency modules)
Solar Modules Mounting Structure (may be with a combination of stationary
and tracking systems)
Power Conditioning Unit – 10 nos. of 500 kVA main inverters.
Data Logging System
Monitoring Equipments
Junction Boxes
Cables & Earthling materials
Distribution Panels
Control Room
12

5 Meteorological information
5.1 Radiation Climatology of India
The solar radiant energy, in its passage through the atmosphere undergoes depletion due to absorption and scattering by the various constituents of the atmosphere at different levels. While most of absorptions are due to radiatively active gases, chief of which are carbon dioxide, ozone and water vapour, the scattering takes place due to all constituents of the atmosphere including suspended particulate matter. The singlemost modifier of the radiation field is the cloud, both due to absorption and scattering processes. Both the absorption and scattering processes take place selectively, i.e. specific gases absorb or scatter at specific wavelengths/wavelength bands. The absorption can be weak or strong and partial or total. The scattering occurs both in the forward and backward directions. The back scattering process can be termed as reflected radiant energy at the appropriate levels. Ultimately, the radiant energy that reaches the earth’s surface is made of the direct beam solar irradiation, the scattered (diffuse) solar irradiation and the downward terrestriant radiant energy from the atmosphere. This heats up the earth’s surface and causes evaporation of moisture in the soil and over water surfaces.The earth’s surface and the constituents of the atmosphere including clouds and particulate matter emit radiant energy in the infra-red region at their own temperatures. This energy is absorbed by different atmospheric layers at different wavelengths, resulting in higher energy level content. But these absorbing layers also emit their heat resulting in the lowering of the heat energy content. However, since the temperatures of the different layers decrease as the height increases in the tropospheric region, the downward radiant energy from the higher layers is generally lower than those emitted upward by the lower layers. This results in a net loss of the radiant energy in the infra-red wavelengths (terrestrial radiantenergy). It is in this terrestrial radiant energy regime that all living organisms including humans are immersed fully and thrive. It is also this energy field which causes the changes in the temperature of the air layer close to it and hence the density of air, leading a chain of interactions to affect the atmospheric temperature and humidity and then the atmospheric pressure and the wind field. This ultimately causes the weather patterns and the changes in them.The amount of radiant energy from the sun over a place is not the same on each day. The varying distance between the sun and the earth contributes to a small percentage in the radiation field. Because of the tilt of the axis of rotation of the earth about itself, the length of the day and night over a place changes everyday. Also because of the tilt and the rotational movement of the earth, various parts of
13

the earth are irradiated differently leading to differential heating of any part on the earth’s surface. Superposed over this is the varying topography of the earth’s terrain, the relative distances from the oceans and the latitudinal distance from the equator. Thus the amount of solar radiant energy at a place varies depending on the time of the day and the season. The amount is quite low at the time of sunrise or sunset as the radiant energy has to traverse a longer pathlength than what it will be when the sun is at its zenith position. Besides, the radiant energy is vastly affected by the different types and amounts of clouds. Naturally occurring events like volcanoes, storms and forest fires and the pollutants released into the atmosphere by the human and animal activities do reduce the amount of radiant energy reaching the earth’s surface due to increased absorption and scattering effects. Thus the radiation regimes are quite likely to be different even between two adjoining regions and hence their monitoring is highly desirable and beneficial.
Global Solar Radiation January
14

February
March
15

April
May
16

June
July
17

August
18

September
October
November
19

December
20

5.2 Radiation Climatology of Orissa Month Jan Fe
bMar
Apr
May
Jun Jul Aug
Sep
Oct
Nov
Dec
Insolation (kWh /m2/ day)
4.65
5.35
6.02
6.51
6.44
4.70
3.91
3.93
4.30
4.83
4.55
4.34
Orissa is blessed with ample solar radiation throughout the year and is ideal for solar power project. Based on the average insolation data the proposed Solar Plant is estimated to generate 8.322 million units of electrical energy annually.
Source: NASA
5.3 Meteorological Data
Southern Latitude: 19 0 28 ‘ N
Northern Latitude 20 0 17 ‘ N
Western Longitude 84 0 29 ‘ N
Eastern Longitude 86 0 25 ‘ N
Mid Latitude 190 53 ‘ N
Mid Longitude 85 0 56 ‘ N
Insolation Incident On A Horizontal Surface [kWh/m2/day]: 4.96
Insolation Clearness Index 0.53
Month
Monthly Average Insolation [kWh/m2/day
Monthly Average Clearness Index K
Monthly Average DaylightHours
Monthly Average DaylightCloud Amount (%)
Monthly Average Relative Humidity at 10 m (%)
Monthly Average clear sky days
Monthly average day time cloud amount (%)
Jan 4.71 0.61 11.0 26.8 56.6 13 26.8
Feb 5.46 0.63 11.5 28.3 63.4 12 28.3
Mar 6.12 0.62 12.0 32.5 65.6 8 32.5
Apr 6.49 0.61 12.6 41.5 71.6 4 41.5
May 6.30 0.57 13.0 51.9 77.1 2 51.9
Jun 4.51 0.41 13.3 76.1 80.8 0 79.5
Jul 4.00 0.36 13.2 82.5 82.1 0 82.5
Aug 4.01 0.37 12.8 82.9 82.1 0 82.9
21

Month
Monthly Average Insolation [kWh/m2/day
Monthly Average Clearness Index K
Monthly Average DaylightHours
Monthly Average DaylightCloud Amount (%)
Monthly Average Relative Humidity at 10 m (%)
Monthly Average clear sky days
Monthly average day time cloud amount (%)
Sep 4.34 0.43 12.2 71.1 81.5 1 71.1
Oct 4.63 0.51 11.7 51.2 75.3 5 51.2
Nov 4.48 0.57 11.2 38.5 60.9 10 38.5
Dec 4.51 0.62 10.9 24.5 52.3 17 24.5
5.4 Climate Data
Month Temperature (0C) Average Day
Temperature (0C)
Normal Rainfall
(in mm.) Maximum Minimum
January 29 14 21.5 12.6
February 36 16 26.0 27.1
March 36 21 28.5 24.3
April 39 27 33.0 27.2
May 38 27 32.5 52.9
June 36 23 29.5 225.1
July 34 22 28.0 347.7
August 31 20 25.5 357.5
September 33 22 27.5 217.5
October 33 20 26.5 86.3
November 31 18 24.5 20.4
December 30 17 23.5 3.3
22

23

6 Site Selection
6.1 Profile of the District
State Orissa District District Background: The District KHURDA came into being on 1
st April, 1993 by dividing it off its erstwhile Puri District which after division became Puri, Khurda and Nayagarh. Later on in the year 2000 the District name is changed as KHORDHA.
Basic Information of the District : Sub-division - 02 Tehasil - 10 Blocks - 10 Notified Area Council (NAC) - 02 Municipality - 02 Municipal Corporation - 01 Parliamentary Constituency - 2 Assembly Constituency - 08
The district is bounded by Cuttack, Nayagarh, Puri and Ganjam districts.
Location:Latitude - 19°40' N to 20°27‘ NLongitude - 84°56' E to 86°05‘ E
24

6.2 District Map
6.3 Profile of the Land
The proposed project is in:
Village PatrapadaTehasil TangiPolice Station Tangi Police StationArea of the land 25 acres
Satellite view of the proposed land:
25
Proposed Site

7 Technical Features
7.1 Proposed technology
Poly crystalline technology based modules will be used in the proposed power plant. These modules are made with high efficiency multi crystalline solar cells (i.e. 13% to 17%). Polycrystalline solar cells are made by a casting process in which molten silicon is poured into a mould and allowed to cool, then sliced into wafers. This process results in cells that are significantly cheaper to produce than single crystal cells, but whose efficiency is limited to less than 20% due to internal resistance at the boundaries of the silicon crystals.
These polycrystalline solar cells are best candidates for large-scale application of photovoltaic energy conversion because they have shown efficiencies in excess of 15%.These cells are encapsulated between a low iron content high transitivity tempered glass and premium quality back sheet to provide efficient protection from the environmental conditions. The laminates are framed with strong, robust and anodized aluminum profile with multiple holes for ease of installation. The modules
are fitted with 4 -terminal Tyco junction box with 16A, 40V schottky bypass diodes (3 diodes) and plug in connectors.
26

7.2 Plant Layout
The Photovoltaic (PV) Grid connected power plant comprises of mainly of 3 components: The PV array, Module Mounting Structure and the Inverters. The PV array converts the light energy to direct current (DC) power. The Module mounting structure is used to hold the module in position. The DC power is converted to alternating current (AC) power by the PCU, which is connected to the utility power grid.
As part of the land requirement for the 5 MWp Solar plant, MGM Minerals has estimated 25 acres for the project activity based on the panel size. Based on the system design developed for this potential project, a 5 MWp PV array would require approximately 25 acres of land.
7.3 Plant Specification
Electrical Specification Standard Test Conditions (STC)
Specification Unit
Module Name ELDORA 40
Rated Power Pmax (W) 37 40
Voltage at Maximum Power Vmp (V) 17.0 17.1
Current at Maximum Power Imp (A) 2.25 2.35
Open Circuit Voltage Voc (V) 21.8 21.9
Short Circuit Current Isc (A) 2.40 4.45
Maximum system Voltage Vsys (V) IEC/UL 1000 V
Temp. coefficient of Pmax Tk (Pmax) ± 2.5 W
Normal Operating Cell Temp. 45 ºC ± 2 ºC Normal Operating Cell Temperature
27

Electrical Specification Standard Test Conditions (STC)
Specification Unit
Standard Test Conditions (STC)
1000 W / m2, 25 ºC, AM 1.5
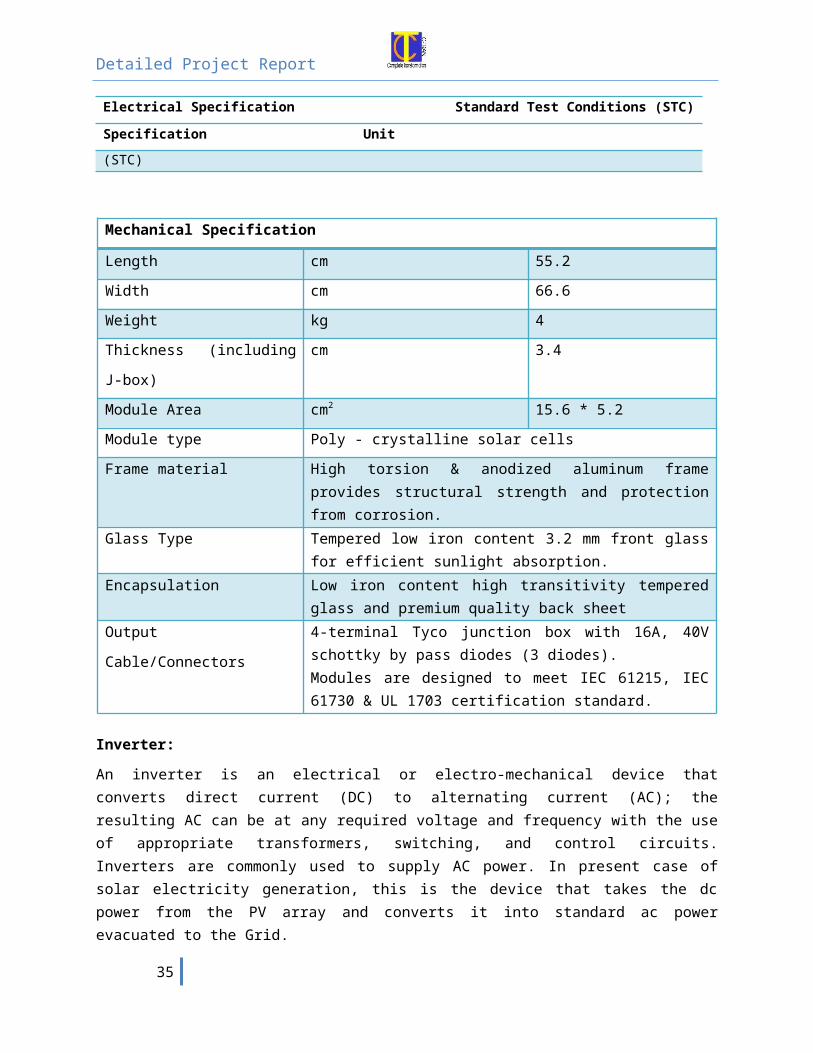
Mechanical Specification
Length cm 55.2
Width cm 66.6
Weight kg 4
Thickness (including J-
box)
cm 3.4
Module Area cm2 15.6 * 5.2
Module type Poly - crystalline solar cells
Frame material High torsion & anodized aluminum frame provides structural strength and protection from corrosion.
Glass Type Tempered low iron content 3.2 mm front glass for efficient sunlight absorption.
Encapsulation Low iron content high transitivity tempered glass and premium quality back sheet
Output Cable/Connectors 4-terminal Tyco junction box with 16A, 40V schottky by pass diodes (3 diodes).Modules are designed to meet IEC 61215, IEC 61730 & UL 1703 certification standard.
Inverter:
An inverter is an electrical or electro-mechanical device that converts direct current (DC) to alternating current (AC); the resulting AC can be at any required voltage and frequency with the use of appropriate transformers, switching, and control circuits. Inverters are commonly used to supply AC power. In present case of solar electricity generation, this is the device that takes the dc power from the PV array and converts it into standard ac power evacuated to the Grid.The power conditioning unit will be chosen from either of the following types:
Option I:
10 numbers of 500 kVA current-controlled grid-connect inverters will be used for interface with grid. The system will have full protection as per international
28

standard, such as IEEE 929-2000 & UL 1741, for protection against grid over voltage / frequency, islanding and all other fault conditions.Suitable lighting protection and earthling system will be installed for safety of personnel and protection of the equipment. An integrated data logging system for performance measurement and visual display of the important parameters, such as daily/ monthly and cumulative energy generated w. r. t. solar intensity, wind velocity, ambient temp, module temperature etc. will also be installed.
Option- II:
High efficient inverter modules will be ground mounted in series and parallel strings. 834 numbers of 6 kW or 625 numbers of 8 kW string inverters will be used for interface with grid. The system will have full protection as per international standard, such as IEEE 929-2000 & UL 1741, for protection against grid over voltage /frequency, islanding and all other fault conditions.Suitable lighting protection and earthling system will be installed for safety of personnel and protection of the equipment. An integrated data logging system for performance measurement and visual display of the important parameters, such as daily / monthly and cumulatively energy generated w. r. t solar intensity, wind velocity, ambient temp, module temperature etc. also be installed.
29

The above mentioned details are for probable system planned to be installed at the proposed Solar Park.
Option III:
Sunny Boy Grid-Connect inverters (SB- 1100 Sunny Boy 1100 W String Inverter) will be used with one series string of between 40 photovoltaic modules per inverter. 333 Inverter Units can be linked in parallel allowing extreme system design flexibility with the possibility of low cost system expansion and maximum system efficiency. This makes the inverter ideal for use alone or as part of a large PV plant. This make installation is safer and easier, special polarized plug -in Multi Contact cable connectors are used for DC input and an AC connector for the grid connection. The inverters can be located as close to the PV string as desired (even on the roof, IP65 protection), eliminating long DC wire runs and allowing low DC currents. Inverters automatically shut down in the event of: High/Low grid AC-voltage; High/Low grid frequency; Grid failure; or Inverter Malfunction. These inverters automatically adjust PV array loading to provide maximum efficiency of solar panels by means of a maximal power point tracker (MPPT).
Technical Specification (SB - 1100 Sunny Boy 1100 W String Inverter)
Number of panels required 333
Output Voltage Range 207 -264Vac
Output Frequency Range 47.0 - 50.5 Hz
Power consumption in operation ~ 4W
Power consumption at night (standby) 0.1W.
Max. efficiency >93%
Certification G83
Solar module mounting structure:
Ground mounted solar arrays require fairly precise foundation setup, are more susceptible to theft/vandalism.
Control Room:
A control room facility that will house the centre's communications and control systems will be there at the plant site. The control room building will house all the electronic equipment like MCB, Central Inverters, Low Voltage Panels, Transformer and high voltage panel.
Junction Boxes:An electrical junction box is a container for electrical junctions, usually intended to conceal them from sight and to some extent to eliminate tampering. Junction boxes form an integral part of a circuit protection system.
30

Monitoring equipments:Monitoring equipment enables a system owner to track system production and to benchmark power generation against installer projections to ensure that systems are operating properly. Monitoring systems can also be used to automate the recording of kilowatt-hour generation.
Cables and connectors:Solar cables are extremely robust and resist high mechanical load and abrasion. High temperature resistance and excellent water proofing characteristics provide a long service life to the cables used in large scale projects. The connectors with high current capacity and easy mode of assembly are to be used for the connections of the power plant cables.
7.4 Civil Infrastructure
Leveling:Preliminary leveling shall be required for the land to have the PV filed in the same plane. However, in this case, it is not entirely possible. Hence the structures are designed to maintain the horizontal plane.
Trenches:All the conduits between the various connection points will be subterranean and routed in trenches.
Construction Roads:A network of interconnected tracks provides accessibility to the different places in the plant. There are two different types of tracks:
Main track: This runs and along the perimeter Secondary tracks: These connect the main tracks along the rows of
structures.
Final Roads:Main roads inside the plant as well as the access tracks to the plant will be conditioned to permit the traffic of all kind of vehicles during normal operation including visiting.
Fencing:A fence shall be installed along the perimeter of the plant.
Building:
31

There will be a building to house the inverters and the switchgears. An option to have outdoor inverters is also considered and in this case they could be placed outside of the building.
32

8 Power Evacuation
The electricity generated from Solar Park can be fed to either 33 kV line by putting a sub-station. Alternatively the electricity can be fed to the nearest sub-station by laying a HT transmission line.
33

9 Project Execution Plan
The project is planned to be implemented at the earliest. The most essential aspect regarding the implementation of the project is to ensure that the project is completed within the scheduled. The project zero date starts once the clearance is being obtained. It is envisaged that the project will have the following phases of activity.
Phase I – Project Development
Phase II- Finalization of equipment and contracts
Phase III- Procure & Construction
Phase IV- Plant Commissioning
Project Development:
In a power project development of the project plays an important role. Almost 50% of the work is done if one achieves the power purchase agreement from the respective state utilities. The project development start with visits to the region, understanding about the regional conditions, socio economic conditions, transportation facilities and infrastructure facilities available in the region. Apart from the above the tasks listed below will be under project development;
Preparation of Detailed Project Report (DPR)
Submission of DPR
Power Purchase Agreement
Clearance from State Level Technical Committee and Land acquisition (Govt.
land preferred)
During this phase, a project team will be formed for the execution of the project. The engineers from this group will be involved from early stages of execution of project. These personnel should evolved critical team of installation of commissioning. After the plant is commissioned these engineers and technicians should occupy key position in the organization structure for the operation and maintenance of the plant.
The responsibilities of the project team shall be –
Planning & Programming of all resources required for project completion
Inspection of major fabrication items
34
Organize the construction and commissioning of the plant
Monitoring and controlling the project process
Execute the project within the planned budget
Finalization of equipment and contracts:
In the power plant modules and junction boxes are lead items and the planning schedule for the project implementation should provide adequate time period for the acquisition and installation of these equipments. The specification for major equipment shall be drawn up at an early stage of the project. Programme of design information, from the equipment suppliers, that satisfied the overall project schedule shall be drawn up.
Since the project execution calls for closer coordination among the contractors, consultants, and the company, proper contract coordination and monitoring procedures shall be made to plan and monitor the project progress.
Procurement & Construction:
The procurement is an important function of the implementation of the project. Once the purchase order is place, the project team follows up regularly to ensure smooth and timely execution of the contract and for obtaining technical information for the inter packing engineering.
When the contracts for the equipment are awarded, detailed programme in the form of network are tied up with the supplier to clearly indicate the owner’s obligations and the supplier’s responsibilities. Upon placement of the purchase order, the project team shall follow up regularly to ensure smooth and timely execution of the contract and or obtaining technically information for the inter package engineering. The procurement activity includes review of review of drawings, expediting, stage and final pre delivery inspection, supervision of installation and commissioning. During construction the erection and commissioning phase of the contract should proceed simultaneously. Adequate power and water shall be made available at site for the construction. Construction manager takes the overall responsibility of the site.
Plant Commissioning:
The commissioning phase in a project is one were design, manufacturing, erection and quality assurance expertise are put to test. The commissioning team will be from manufacturer of the equipment, consultant and the company as discussed in the earlier section, staff identified to operate the plant will be involved in the commissioning phase is completed, a checklist shall designed to ensure that the plant has been properly installed with appropriate safety measures. The
35

commissioning team will follow the internal operating instructions. The plant shall be subjected to a performance test.
36

10 Operational Features
10.1 Factors Effecting Generation
Standard Test Conditions:
Solar modules produce dc electricity. The dc output of solar modules is rated by manufacturers under Standard Test Conditions (STC). These conditions are easily recreated in a factory, and allow for consistent comparisons of products, but need to be modified to estimate output under common outdoor operating conditions. STC conditions are: solar cell temperature = 25 0C; solar irradiance (intensity) = 1000 W/m2 (often referred to as peak sunlight intensity, comparable to clear summer noon time intensity); and solar spectrum as filtered by passing through 1.5 thickness of atmosphere (ASTM Standard Spectrum). A manufacturer may rate a particular solar module output at 100 Watts of power under STC, and call the product a “40-watt solar module.” This module will often have a production tolerance of +/-5% of the rating, which means that the module can produce 37 Watts and still be called a “40-watt module.” To be conservative, it is best to use the low end of the power output spectrum as a starting point (37 Watts for a 40-watt module).
Temperature:
This is defined by percentage drop in power output for every degree of temperature increase. It is the effect of temperature variation.
Dirt and dust:
Dirt and dust can accumulate on the solar module surface, blocking some of the sunlight and reducing output. A typical annual dust reduction factor to use is 93% or
37

0.93. So the “40- watt module,” operating with some accumulated dust may operate on average at about 79 Watts (37 Watts x 0.93 = 34 Watts).
Mismatch and wiring losses:
The maximum power output of the total PV array is always less than the sum of the maximum output of the individual modules. This difference is a result of slight inconsistencies in performance from one module to the next and is called module mismatch and amounts to at least a 2% loss in system power. Power is also lost to resistance in the system wiring. These losses should be kept to a minimum but it is difficult to keep these losses below 3% for the system. A reasonable reduction factor for these losses is 95% or 0.95.
DC to AC conversion losses:
The dc power generated by the solar module must be converted into common household ac power using an inverter. Some power is lost in the conversion process, and there are additional losses in the wires from the rooftop array down to the inverter and out to the house panel. Modern inverters commonly used in residential PV power systems have peak efficiencies of 92 -94% indicated by their manufacturers, but these again are measured under well-controlled factory conditions. Actual field conditions usually result in overall dc-to-ac conversion efficiencies of about 88-92%, with 90% or 0.90 a reasonable compromise. So, the “40-watt module” output, reduced by production tolerance, heat, dust, wiring, ac conversion, and other losses will translate into about 68 Watts of AC power delivered to the house panel during the middle of a clear day (40 Watts x 0.95 x 0.89 x 0.93 x 0.95 x 0.90 = 28 Watts).
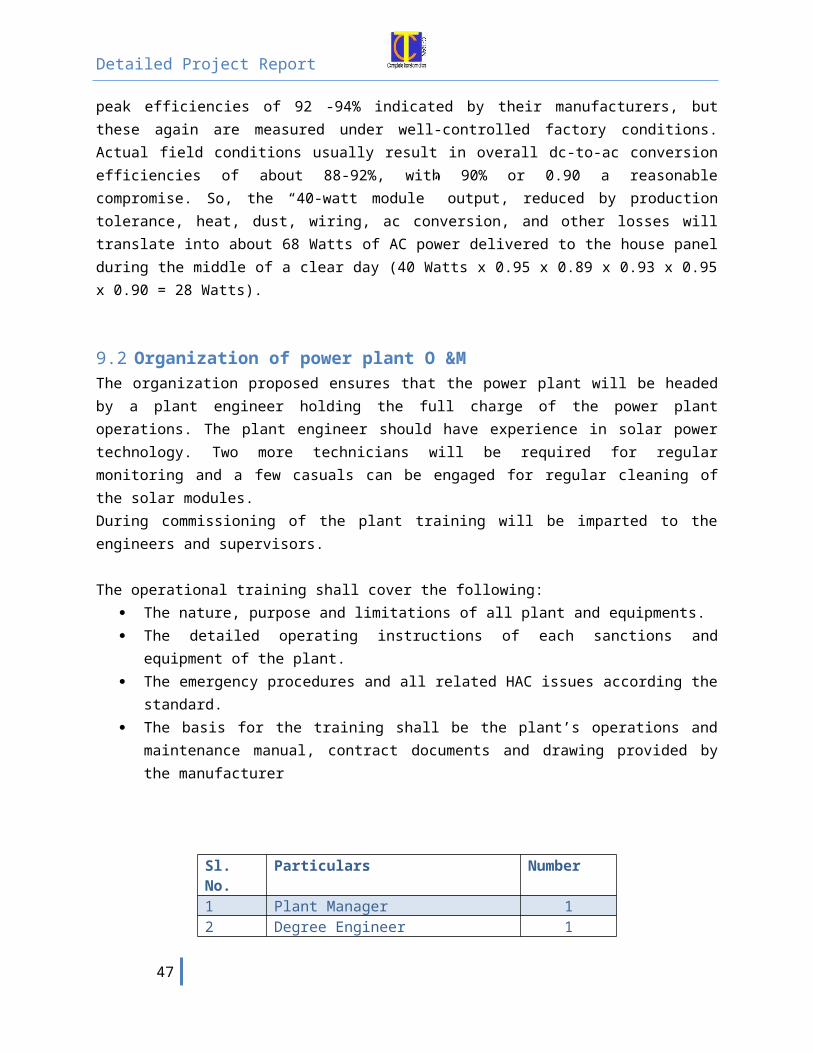
10.2 Organization of power plant O &MThe organization proposed ensures that the power plant will be headed by a plant engineer holding the full charge of the power plant operations. The plant engineer should have experience in solar power technology. Two more technicians will be required for regular monitoring and a few casuals can be engaged for regular cleaning of the solar modules.During commissioning of the plant training will be imparted to the engineers and supervisors.
The operational training shall cover the following: The nature, purpose and limitations of all plant and equipments. The detailed operating instructions of each sanctions and equipment of the
plant. The emergency procedures and all related HAC issues according the
standard.
38

The basis for the training shall be the plant’s operations and maintenance manual, contract documents and drawing provided by the manufacturer
Sl. No. Particulars Number
1 Plant Manager 12 Degree Engineer 13 Diploma Engineer 24 ITI - Technician 35 ITI - Supervisor 36 Accounts & Administration 17 Security & Service (Outsource) 1 Total 12
10.3 Protection of People and Equipment
The plant will work autonomously with a small amount of preventive maintenance. A monitoring system will advise if any corrective maintenance is needed.
Residues produced during construction will be disposed of in recycling centres. No toxic waste is produced. Sanitary container cabinets are foreseen.
During plant operation, no residues will be produced, except occasional breakdown of equipment, which will be recycled by the manufacturer or disposed of as during construction phase.
During the construction phase noise sources in all cases will be far from residential areas. In exploitation phase, the PV modules work completely noiseless. Each inverter will produce a noise level below 72dB.
Personnel protection is guaranteed by electrical separation between the grid and the PV generator via a grid transformer along with insulation monitoring of PV generator.
Further personnel protection is ensured with the overloading, over voltage and Reverse current protections in built in the central inverter.
39

11 Financial Analysis
11.1 Key Assumption
Sl. No. Particulars Data Unit 1 Project Size 5 MW
2 Project Life 25 Years
3 Debt : Equity 2.33
4 Project Cost 7,705.44
Rs. in Lakhs
5 Term Loan 5,368.37
Rs. in Lakhs
6 Rate of Interest on Term Loan 13.39% Per annum
7 Rate of Interest on Working Capital
12.89% Per annum
8 Loan Tenure 10 Years
9 Moratorium 0 Years
10 Tax Rate 33.99%
11 Tax Holidays (Sec 80IA Deduction)
0 Years
12 MAT Tax Rate 16.995%
13 Operation & Maintenance Cost 8.50 Rs. In Lakhs /MW
14 Escalation in O & M cost 5.72% Per annum
15 Insurance on WDV of Assets 0.00% Per annum
16 Inflation rate 5.72% Per annum
17 Power Sale Price 17.91 Rs. per kWh
18 Capacity Utilization Factor 19%
19 Number of Working days 365 Days per annum
20 Working Hours 24 Per day
21 1 MW Hour 1000 kWh
22 Degradation Factor 0.00% Per annum
23 Grid Emission factor 0.84 tCO2 / MWh
24 CER Price in EURO 12 Per CER
25 1 EURO 65 INR
26 Expenditure on CDM 10% of revenue
27 Annual Admin Expenses 4 Rs. in Lakhs
40

11.2 Project Cost
Rs. in Lakhs
Sl. No.
Description Amount Total Amount
1 Land & Land Development 60.00
a) Land 45.00
b) Land Development 15.00
2 Office Building 40.00
a) Building and Civil Construction 40.00
3 Plant & Machinery 7,500.00
a) Solar Modules (with junction box; w/o brackets)
7,500.00
4 Other Fixed Assets 40.00
a) Furniture & Fixture 20.00
b) Other Office Equipment 20.00
5 Preliminary & Pre-Operative Expenses
40.00
a) Company Incorporation 15.00
b) Pre-Operative Expenses 25.00
6 Contingency 750.00
7 Working Capital 25.44
a) (3 Months Operating Expenses) 25.44
Total Project Cost 7,705.44
11.3 Means of Finance
Sl. No. Particulars Rs. In Lakhs
1 Total Cost of Project 7,705.44
41

2 Debt : Equity Ratio 2.33
3 Promoters Contribution 2,311.63
4 Total Loan Fund 5,393.80
a) Working Capital 25.44
b) Term Loan 5,368.37
Total 7,705.44
42

11.4 Profitability Statement
11.4.1 Projections of Performance, Profitability and RepaymentRs. In Lakhs
Construction Period
Operational Period
Y0 Y1 Y2 Y3 Y4 Y5 Y6 Y7 Y8 Y9 Y10Power RevenueUnits Generated (MWh) 0 8322 8322 8322 8322 8322 8322 8322 8322 8322 8322Selling price per unit (Rs.) 0.00 18 18 18 18 18 18 18 18 18 18Sales Income without CDM - 1490 1490 1490 1490 1490 1490 1490 1490 1490 1490
CDM RevenueCER Generated (tCO2) 0 6990 6990 6990 6990 6990 6990 6990 6990 6990 6990CER Price in EURO 12 12 12 12 12 12 12 12 12 12CDM Revenue 0 55 55 55 55 55 55 55 55 55 55Total Revenue with CDM - 1545 1545 1545 1545 1545 1545 1545 1545 1545 1545
Without CDMAnnual CostOperation and Maintenance - 43 45 48 50 53 56 59 63 66 70
Administrative Expenses - 4 4 4 4 4 4 4 4 4 4Salary - 52 55 58 62 65 69 73 77 81 86Interest on Loan - 706 667 622 571 513 446 370 283 184 71Depreciation - 530 530 530 530 530 530 530 530 529 529Total Expenditure (without CDM)
- 1,335 1,301 1,262 1,217 1,165 1,105 1,036 957 865 760
Profit Before Tax Without CDM
156 190 229 274 326 386 455 534 625 730
Taxable Profit without CDM -5,321 -486 513 750 841 909 980 1,060 1,151 1,256
Income Tax - - - - - - - - - -Profit After Tax without CDM
156 190 229 274 326 386 455 534 625 730
With CDMExpenditure on CDM - 5 5 5 5 5 5 5 5 5 5Total Expenditure (with CDM)
- 1,340 1,306 1,267 1,222 1,170 1,110 1,041 962 871 766
Profit Before Tax With CDM 205 239 278 323 375 435 504 583 674 779
Add : Depreciation 530 530 530 530 530 530 530 530 529 529Less : Depreciation Income Tax
6,007 1,206 246 53 14 6 5 4 4 3
Taxable Profit with CDM -5,272 -437 562 799 890 958 1,029 1,109 1,200 1,305
Income Tax - - - - - - - - - -Profit After Tax with CDM 205 239 278 323 375 435 504 583 674 779

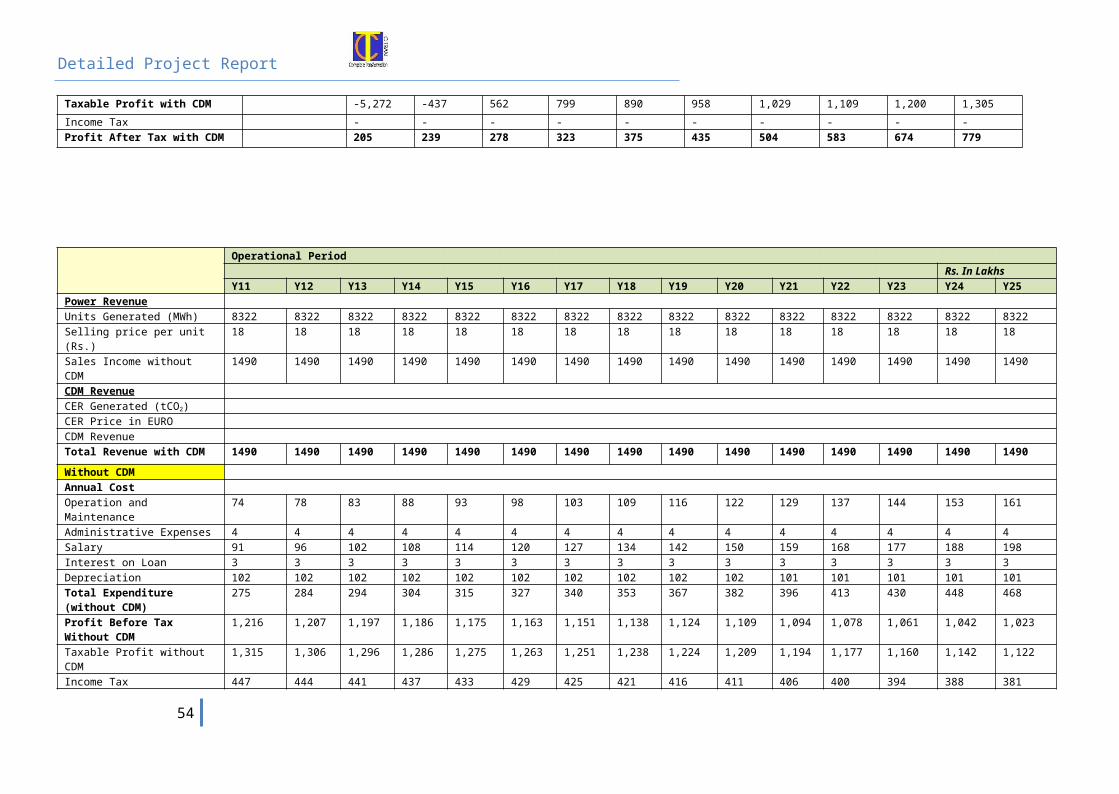
Operational PeriodRs. In Lakhs
Y11 Y12 Y13 Y14 Y15 Y16 Y17 Y18 Y19 Y20 Y21 Y22 Y23 Y24 Y25Power RevenueUnits Generated (MWh) 8322 8322 8322 8322 8322 8322 8322 8322 8322 8322 8322 8322 8322 8322 8322Selling price per unit (Rs.) 18 18 18 18 18 18 18 18 18 18 18 18 18 18 18Sales Income without CDM 1490 1490 1490 1490 1490 1490 1490 1490 1490 1490 1490 1490 1490 1490 1490
CDM RevenueCER Generated (tCO2)CER Price in EUROCDM RevenueTotal Revenue with CDM 1490 1490 1490 1490 1490 1490 1490 1490 1490 1490 1490 1490 1490 1490 1490
Without CDMAnnual CostOperation and Maintenance 74 78 83 88 93 98 103 109 116 122 129 137 144 153 161
Administrative Expenses 4 4 4 4 4 4 4 4 4 4 4 4 4 4 4Salary 91 96 102 108 114 120 127 134 142 150 159 168 177 188 198Interest on Loan 3 3 3 3 3 3 3 3 3 3 3 3 3 3 3Depreciation 102 102 102 102 102 102 102 102 102 102 101 101 101 101 101Total Expenditure (without CDM)
275 284 294 304 315 327 340 353 367 382 396 413 430 448 468
Profit Before Tax Without CDM
1,216 1,207 1,197 1,186 1,175 1,163 1,151 1,138 1,124 1,109 1,094 1,078 1,061 1,042 1,023
Taxable Profit without CDM 1,315 1,306 1,296 1,286 1,275 1,263 1,251 1,238 1,224 1,209 1,194 1,177 1,160 1,142 1,122
Income Tax 447 444 441 437 433 429 425 421 416 411 406 400 394 388 381Profit After Tax without CDM
769 763 756 749 742 734 726 717 708 698 689 678 666 654 641
With CDMExpenditure on CDM - - - - - - - - -Total Expenditure (with CDM)
275 284 294 304 315 327 340 353 367 382 396 413 430 448 468
Profit Before Tax With CDM
1,216 1,207 1,197 1,186 1,175 1,163 1,151 1,138 1,124 1,109 1,094 1,078 1,061 1,042 1,023
Add : Depreciation 102 102 102 102 102 102 102 102 102 102 101 101 101 101 101Less : Depreciation Income Tax
3 3 3 2 2 2 2 2 2 2 1 1 1 1 1
Taxable Profit with CDM 1,315 1,306 1,296 1,286 1,275 1,263 1,251 1,238 1,224 1,209 1,194 1,177 1,160 1,142 1,122
Income Tax 447 444 441 437 433 429 425 421 416 411 406 400 394 388 381Profit After Tax with CDM
769 763 756 749 742 734 726 717 708 698 689 678 666 654 641
44

11.4.2 Projected Cash FlowRs. In Lakhs
Inflow Y0 Y1 Y2 Y3 Y4 Y5 Y6 Y7 Y8 Y9 Y10
Equity Capital 2,312
Loan Fund 5,394
Operational Income 735 769 808 853 905 964 1,033
1,113
1,204
1,309
Total Cash Inflow 7,705
735
769
808 853 905 964 1,033
1,113
1,204
1,309
Outflow
Purchase of Assets 7,640
Preoperative Expenses 40Repayment of Term Loan
274 313 358 409 467 534 610 697 796 909
Total Cash Outflow 7,680
274
313
358 409 467 534 610 697 796 909
Net Inflow/(Outflow) 25 461
455
450 444 437 430 423 416 408 399
Cumulative Balance 25 486
942
1,391
1,835
2,272
2,703
3,126
3,542
3,949
4,349
Rs. In LakhsInflow Y11 Y12 Y13 Y14 Y15 Y16 Y17 Y18 Y19 Y20 Y21 Y22 Y23 Y24 Y25Equity CapitalLoan FundOperational Income 871 865 858 851 844 836 827 819 809 800 789 778 767 755 742Total Cash Inflow 871 865 858 851 844 836 827 819 809 800 789 778 767 755 742
OutflowPurchase of AssetsPreoperative
45

ExpensesRepayment of Term Loan
- - - - - - - - - - - - - - -
Total Cash Outflow - - - - - - - - -
Net Inflow/(Outflow)
871 865 858 851 844 836 827 819 809 800 789 778 767 755 742
Cumulative Balance
5,220
6,085
6,943
7,794
8,637
9,473
10,301
11,119
11,929
12,729
13,518
14,296
15,063
15,818
16,560
46
11.4.3 Projected Balance Sheet
Y0 Y1 Y2 Y3 Y4 Y5 Y6 Y7 Y8 Y9 Y10LiabilitiesCapitalEquity Capital 2,312 2,31
22,312 2,312 2,312 2,312 2,312 2,312 2,312 2,312 2,312
Reserve & Surplus - 205 444 721 1,044 1,419 1,854 2,357 2,940 3,615 4,394Loan FundTerm Loan 5,368 5,09
44,781 4,423 4,013 3,546 3,012 2,402 1,705 909 0
WC Loan 25 25 25 25 25 25 25 25 25 25 25Other Liability - - - - - - - - - - -Total 7,705 7,63
67,561 7,481 7,395 7,302 7,203 7,097 6,983 6,861 6,731
AssetsFixed AssetsGross Block 7,640 7,64
07,640 7,640 7,640 7,640 7,640 7,640 7,640 7,640 7,640
Depreciation - 530 1,060 1,590 2,120 2,650 3,180 3,709 4,239 4,768 5,298Net Block 7,640 7,11
06,580 6,050 5,520 4,990 4,460 3,931 3,401 2,872 2,342
Investment - - - - - - - - - - -Current AssetsCash & Bank Balance 25 486 942 1,391 1,835 2,272 2,703 3,126 3,542 3,949 4,349Other Current Assets 40 40 40 40 40 40 40 40 40 40 40Total 7,705 7,63
67,561 7,481 7,395 7,302 7,203 7,097 6,983 6,861 6,731
Rs. In Lakhs
Y11 Y12 Y13 Y14 Y15 Y16 Y17 Y18 Y19 Y20 Y21 Y22 Y23 Y24 Y25
Liabilities
47

Capital
Equity Capital 2,312
2,312 2,312 2,312 2,312 2,312 2,312 2,312 2,312 2,312 2,312 2,312 2,312 2,312 2,312
Reserve & Surplus 5,163
5,926 6,682 7,431 8,173 8,907 9,632 10,349 11,057 11,755 12,443 13,121 13,788 14,442 15,083
Loan Fund
Term Loan - - - - - - - - - - - - - - -
WC Loan 25 25 25 25 25 25 25 25 25 25 25 25 25 25 25
Other Liability - - - - - - - - - - - - - - -
Total 7,500
8,263 9,019 9,768 10,510 11,244 11,969 12,686 13,394 14,092 14,781 15,458 16,125 16,779 17,420
Assets
Fixed Assets
Gross Block 7,640
7,640 7,640 7,640 7,640 7,640 7,640 7,640 7,640 7,640 7,640 7,640 7,640 7,640 7,640
Depreciation 5,400
5,502 5,604 5,706 5,808 5,910 6,011 6,113 6,215 6,317 6,417 6,518 6,619 6,720 6,820
Net Block 2,240
2,138 2,036 1,934 1,832 1,730 1,629 1,527 1,425 1,323 1,223 1,122 1,021 920 820
Investment - - - - - - - - - - - - - - -
Current Assets
Cash & Bank Balance 5,220
6,085 6,943 7,794 8,637 9,473 10,301 11,119 11,929 12,729 13,518 14,296 15,063 15,818 16,560
Other Current Assets 40 40 40 40 40 40 40 40 40 40 40 40 40 40 40
Total 7,500
8,263 9,019 9,768 10,510 11,244 11,969 12,686 13,394 14,092 14,781 15,458 16,125 16,779 17,420
48

11.4.4 Interest and Repayment Schedule
Term Loan Rs. In Lakhs
Int. rate Y1 Y2 Y3 Y4 Y5 Y6 Y7 Y8 Y9 Y10
Opening Balance 5368 5094 4781 4423 4013 3546 3012 2402 1705 909
Loan Obtained 5368 0 0 0 0 0 0 0 0 0 0
Repayment 274 313 358 409 467 534 610 697 796 909
Closing Balance 5094 4781 4423 4013 3546 3012 2402 1705 909 0
Amount of Interest 13.39% 702 663 619 568 509 443 367 280 181 67
Rs. In Lakhs
Y1 Y2 Y3 Y4 Y5 Y6 Y7 Y8 Y9 Y10
Y11
Y12
Y13
Y14
Y15
Y16
Y17
Y18
Y19
Y20
Y21
Y22
Y23
Y24
Y25
Interest on Loan
706 667 622 571 513 446 370 283 184
71 3 3 3 3 3 3 3 3 3 3 3 3 3 3 3
49

11.5 Financial Analysis
11.5.1 Debt Service Coverage Ratio:
Rs. In Lakhs
With CDM Revenue Y0 Y1 Y2 Y3 Y4 Y5 Y6 Y7 Y8 Y9 Y10
Net Profit after Tax - 205 239 278 323 375 435 504 583 674 779
Add : Interest - 706 667 622 571 513 446 370 283 184 71
Add : Depreciation - 530 530 530 530 530 530 530 530 529 529
Cash Accrual - 1,441 1,435 1,430 1,424 1,417 1,410 1,403 1,396 1,388 1,379
Total Int & Repayment - 980 980 980 980 980 980 980 980 980 980
DSCR 1.47 1.46 1.46 1.45 1.45 1.44 1.43 1.42 1.42 1.41
Average DSCR with CDM 1.44
Without CDM Revenue Y0 Y1 Y2 Y3 Y4 Y5 Y6 Y7 Y8 Y9 Y10
Net Profit after Tax Y0 156 190 229 274 326 386 455 534 625 730
Add : Interest - 706 667 622 571 513 446 370 283 184 71
Add : Depreciation - 530 530 530 530 530 530 530 530 529 529
Cash Accrual - 1,392 1,386 1,381 1,375 1,368 1,361 1,354 1,347 1,339 1,330
Total Int & Repayment - 980 980 980 980 980 980 980 980 980 980
DSCR 1.42 1.41 1.41 1.40 1.40 1.39 1.38 1.37 1.37 1.36
Average DSCR without CDM 1.39
50

11.5.2 Internal Rate of Return:
With CDM Revenue Y0 Y1 Y2 Y3 Y4 Y5 Y6 Y7 Y8 Y9 Y10
Cash Inflow 0 461
455
450
444
437
430
423
416
408
399
Cash Outflow -2,312
-
-
-
-
-
-
-
-
-
-
Net Cash Flow -2,312
461
455
450
444
437
430
423
416
408
399
Cumulative Cash Flow -2,312
-1,851
-1,395
-946
-502
-65
366
789
1,205
1,612
2,012
With CDM Revenue Y11 Y12 Y13 Y14 Y15 Y16 Y17 Y18 Y19 Y20 Y21 Y22 Y23 Y24 Y25
Cash Inflow 871
865
858
851
844
836
827
819
809
800
789
778
767
755
742
Cash Outflow -
-
-
-
-
-
-
-
-
-
-
-
-
-
-
Net Cash Flow 871
865
858
851
844
836
827
819
809
800
789
778
767
755
742
Cumulative Cash Flow 2,883
3,747
4,606
5,457
6,300
7,136
7,964
8,782
9,592
10,392
11,181
11,959
12,726
13,481
14,223
PAY BACK PERIOD with CDM
Y6
IRR with CDM Revenue 21.35%
NPV @ 10% with CDM 2,052
Without CDM Revenue Y0 Y1 Y2 Y3 Y4 Y5 Y6 Y7 Y8 Y9 Y10
Cash Inflow 0
51

412 406 401 395 388 381 374 367 359 350 Cash Outflow -
2,312 -
-
-
-
-
-
-
-
-
-
Net Cash Flow -2,312
412
406
401
395
388
381
374
367
359
350
Cumulative Cash Flow -2,312
-1,900
-1,494
-1,093
-698
-310
71
445
812
1,171
1,521
Without CDM Revenue
Y11 Y12 Y13 Y14 Y15 Y16 Y17 Y18 Y19 Y20 Y21 Y22 Y23 Y24 Y25
Cash Inflow 871
865
858
851
844
836
827
819
809
800
789
778
767
755
742
Cash Outflow -
-
-
-
-
-
-
-
-
-
-
-
-
-
-
Net Cash Flow 871
865
858
851
844
836
827
819
809
800
789
778
767
755
742
Cumulative Cash Flow 2,392
3,257
4,115
4,966
5,810
6,645
7,473
8,292
9,101
9,901
10,690
11,469
12,236
12,990
13,732
PAY BACK PERIOD w/o CDM
Y6
IRR without CDM Revenue
19.78%
NPV @ 10% w/o CDM 1,778
52

12Project Contribution to the sustainable development
Direct Benefits:Experience & training with Grid Connected PV systems – Grid connected PV systems are becoming increasingly popular worldwide. As the cost of PV systems are approaching competitiveness with other conventional power, large scale use of solar PV power plants is envisaged in future. The first hand experience of engineers would help them to promote large scale use of solar projects in India. The power generated from the Solar Power Plant will help in meeting the demand due to expected growth of industry, utilizing existing transmission and distribution network and saving losses.
Benefits to electricity Department:
Voltage Support- the PV system will boost the voltage of grid electricity and prevent the voltage drop when large power is consumed by induction loads. The system will also supply power close to unity power factor thereby improving the grid quality and increasing its capacity. There will be savings in cost of voltage stabilization equipment such as shunt capacitors with controlled switches. In rural remote locations, at the end of the distribution systems where the voltages are known to be very low due to over loading and under sized grids, the solar power generating system would provide voltage support to the grid by feeding power during the day when peak day time loads cause the grid to overload.
Social Benefits:
This project can produce substantial reductions in green house gas emissions, particularly carbon dioxide. The country’s majority generation capacity is largely coal based and produces high quantity of carbon dioxide and other harmful gasses. If the untapped solar energy potential is realized, carbon dioxide and other toxic gas emissions can be lowered by significant quantity. Therefore, every kilowatt of solar energy produced has to be seen from this perspective and as a small but major step towards mitigation of carbon dioxide emission and subsequently combat climate change.
For a 5 MWp Solar PV power plant in the region of Orissa, it is estimated that there will be reduction in the emission of green house gases by approx. 6990 tonnes of CO2 per year. There will also be reduction in NOx, SOx, suspended particles and other volatile organic compounds. The use of solar energy can prevent damage to lungs and other serious health problems, reducing SMOG and acid rain.
The evil effects of climate change are briefly examined below to understand the long term social benefits:
a. Rising levels of green house gases (GHG’s predominantly carbon dioxide) are expected to cause climate change. By absorbing infrared radiation, these gasescontrol the flow of natural energy through the climate system. The climate has to adjust to the thickening blanket of GHG’s climate models predict that the global temperature will rise by about 1- 3.5 deg. C by the year 2100. It may be noted that this projected change is larger than any climate change experienced in the past.
b. The mean sea level is expected to rise 15- 95 cm by the year 2100, causing flooding of low lying areas and causing other damages. Forests, deserts and other unmanaged ecosystems would face new climatic stresses. Human society will face new risks and pressures. Food security is likely to be affected and some regions are likely to experience food shortages and hunger. Water resources will be affected as precipitation and evaporation pattern change around the world. Sea level rise and extreme weather events could damage physical infrastructure.
Sulphur emissions from coal and oil fired power stations produce clouds of microscopic particles that reflect sunlight back into space. This could cause acid rain.
54