DPAS II Systems-Updates and Refresher · Mathematics Grade 4 Tiered Approach 44 •Tiered Approach...
53
Goal Setting Summer 2017
Transcript of DPAS II Systems-Updates and Refresher · Mathematics Grade 4 Tiered Approach 44 •Tiered Approach...

Goal Setting
Summer 2017
Common Errors in the
Goal-Setting Process

Activity: Error Analysis
In what ways are these goals SMART?
1. Are the measures selected related to student success and from the
approved list of measures?
2. Is the form completed with all details and are goal statements clear?
3. Are targets high quality, rigorous, and appropriate based on the
baseline data and average growth or gains for the measure?
4. Do targets include a range of scores and account for variation?
3
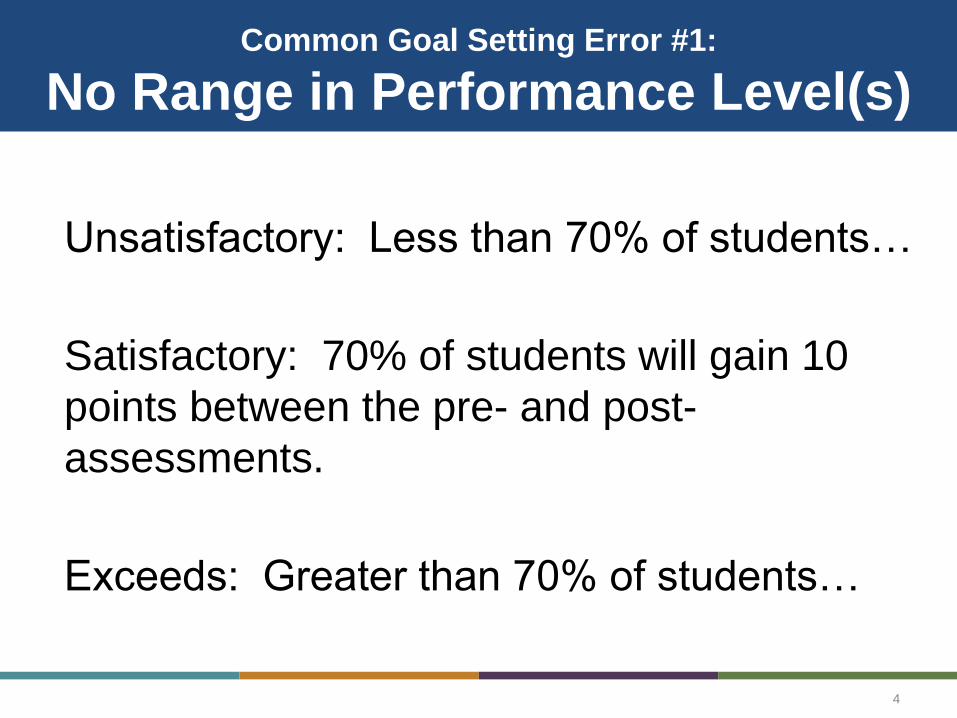
Common Goal Setting Error #1:
No Range in Performance Level(s)
Unsatisfactory: Less than 70% of students…
Satisfactory: 70% of students will gain 10
points between the pre- and post-
assessments.
Exceeds: Greater than 70% of students…
4
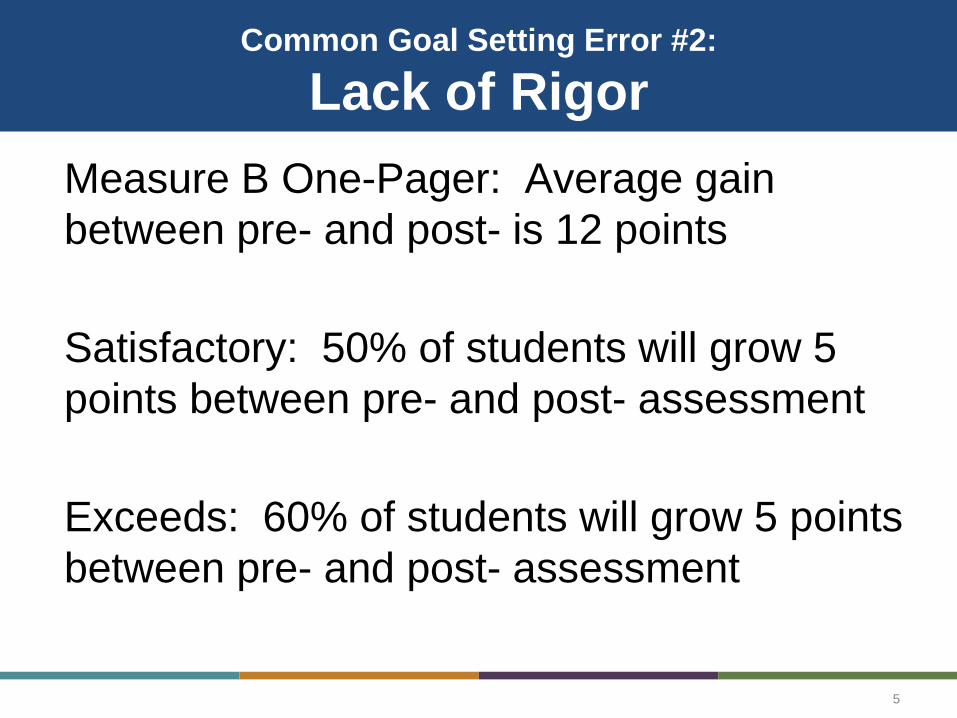
Common Goal Setting Error #2:
Lack of Rigor
Measure B One-Pager: Average gain
between pre- and post- is 12 points
Satisfactory: 50% of students will grow 5
points between pre- and post- assessment
Exceeds: 60% of students will grow 5 points
between pre- and post- assessment
5
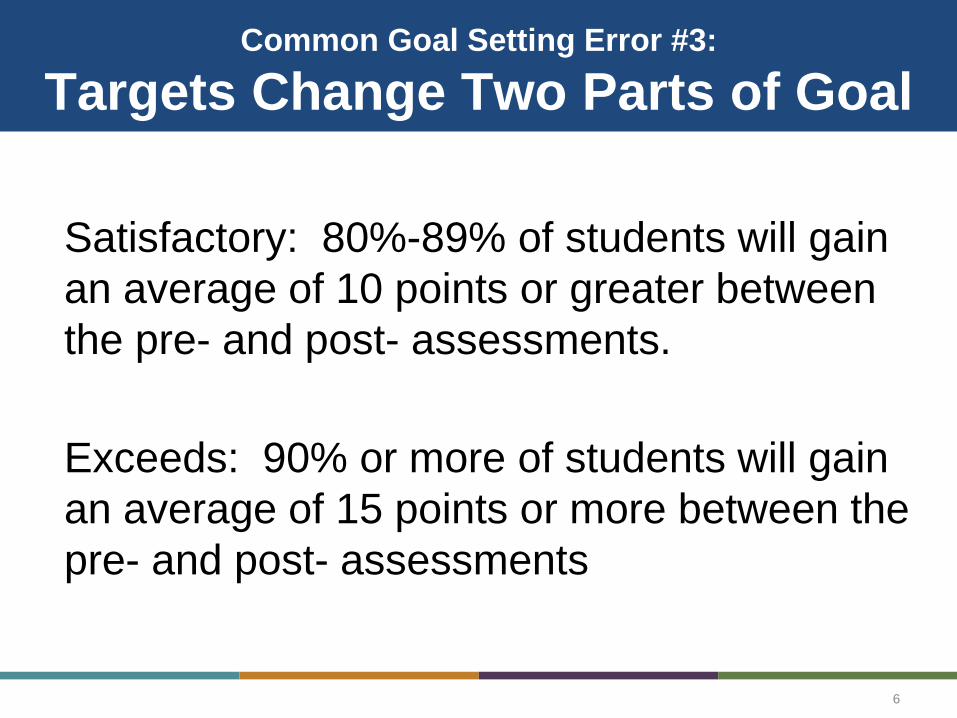
Common Goal Setting Error #3:
Targets Change Two Parts of Goal
Satisfactory: 80%-89% of students will gain
an average of 10 points or greater between
the pre- and post- assessments.
Exceeds: 90% or more of students will gain
an average of 15 points or more between the
pre- and post- assessments
6
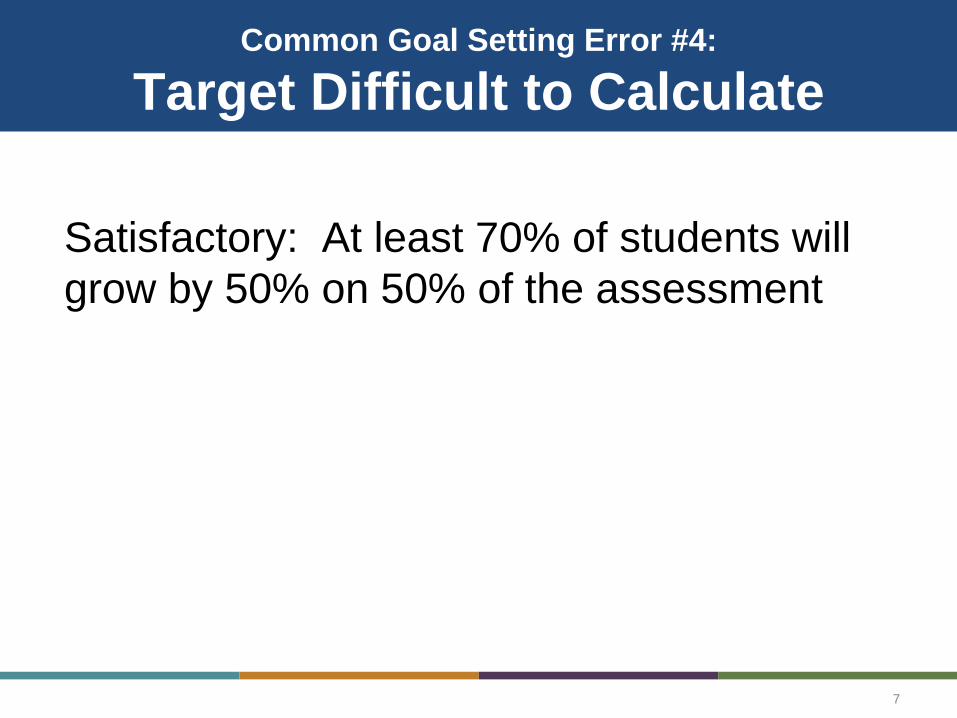
Common Goal Setting Error #4:
Target Difficult to Calculate
Satisfactory: At least 70% of students will
grow by 50% on 50% of the assessment
7
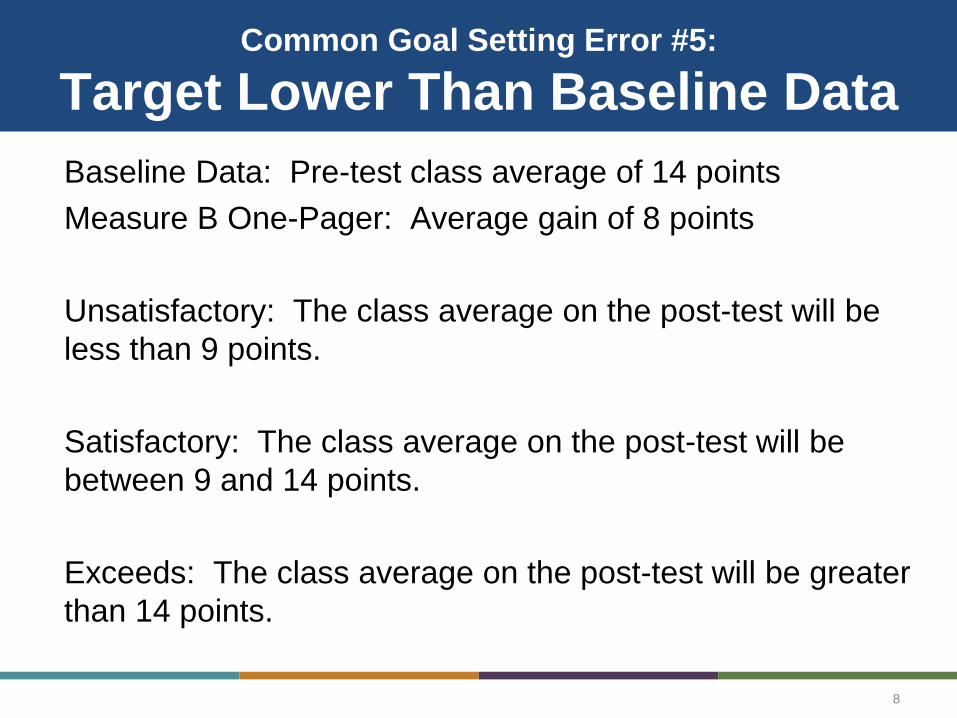
Common Goal Setting Error #5:
Target Lower Than Baseline Data
Baseline Data: Pre-test class average of 14 points
Measure B One-Pager: Average gain of 8 points
Unsatisfactory: The class average on the post-test will be
less than 9 points.
Satisfactory: The class average on the post-test will be
between 9 and 14 points.
Exceeds: The class average on the post-test will be greater
than 14 points.
8
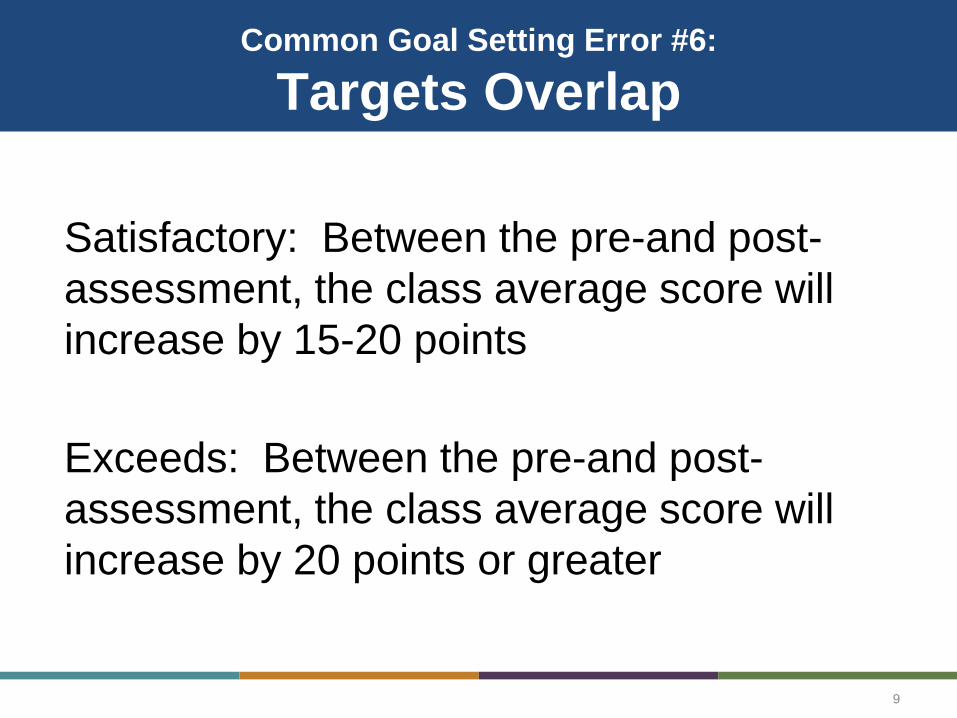
Common Goal Setting Error #6:
Targets Overlap
Satisfactory: Between the pre-and post-
assessment, the class average score will
increase by 15-20 points
Exceeds: Between the pre-and post-
assessment, the class average score will
increase by 20 points or greater
9
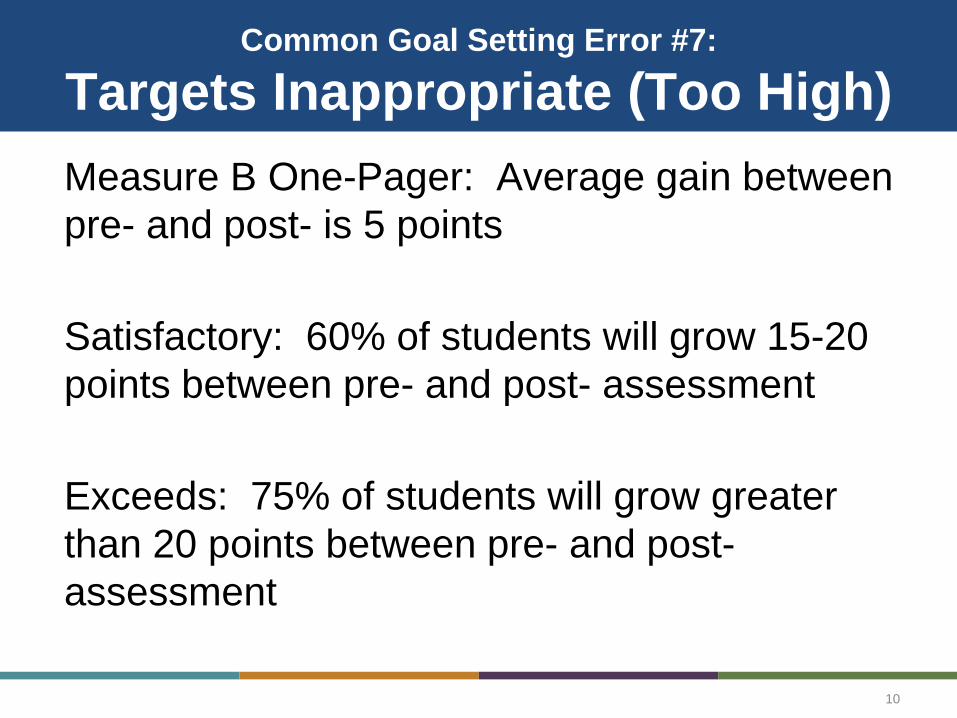
Common Goal Setting Error #7:
Targets Inappropriate (Too High)
Measure B One-Pager: Average gain between
pre- and post- is 5 points
Satisfactory: 60% of students will grow 15-20
points between pre- and post- assessment
Exceeds: 75% of students will grow greater
than 20 points between pre- and post-
assessment
10
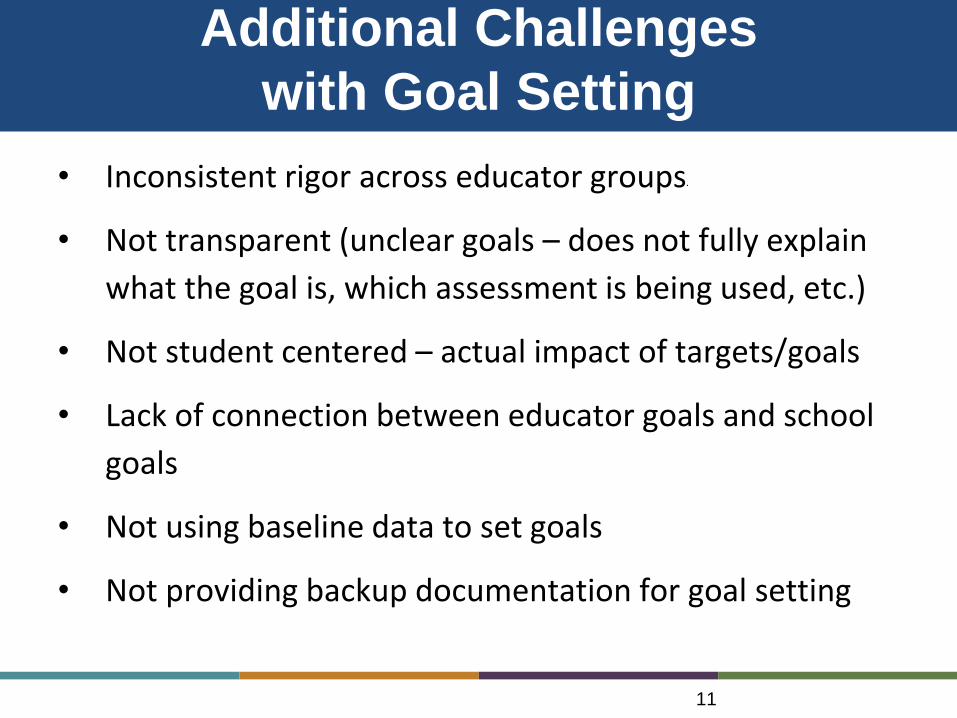
Additional Challenges
with Goal Setting
• Inconsistent rigor across educator groups•
• Not transparent (unclear goals – does not fully explain
what the goal is, which assessment is being used, etc.)
• Not student centered – actual impact of targets/goals
• Lack of connection between educator goals and school
goals
• Not using baseline data to set goals
• Not providing backup documentation for goal setting
11

Activity: Correct the
Common Errors
With your group, correct each of the 7
errors by re-writing the goal or target
statement.
12

Student Improvement Component
•Measure A – State Assessment for
reading and mathematics
•Measure B – Bank of Pre-Post
Assessments
•Measure C – Bank of DOE-approved
growth goals
13

What are Measure Bs?External
Assessments
• Recognized and identified by Delaware
educator groups
• Generally created by outside vendors
• Reviewed by an outside vendor prior to
approval
Internal
Assessments
• Developed by and for groups of
Delaware educators
• Reviewed by an outside vendor prior to
approval
Alternate
Assessments
• Developed and submitted by a District or
LEA
• Reviewed by an outside vendor prior to
approvalAn educator, with administrator approval, may choose to use any approved measure.
14
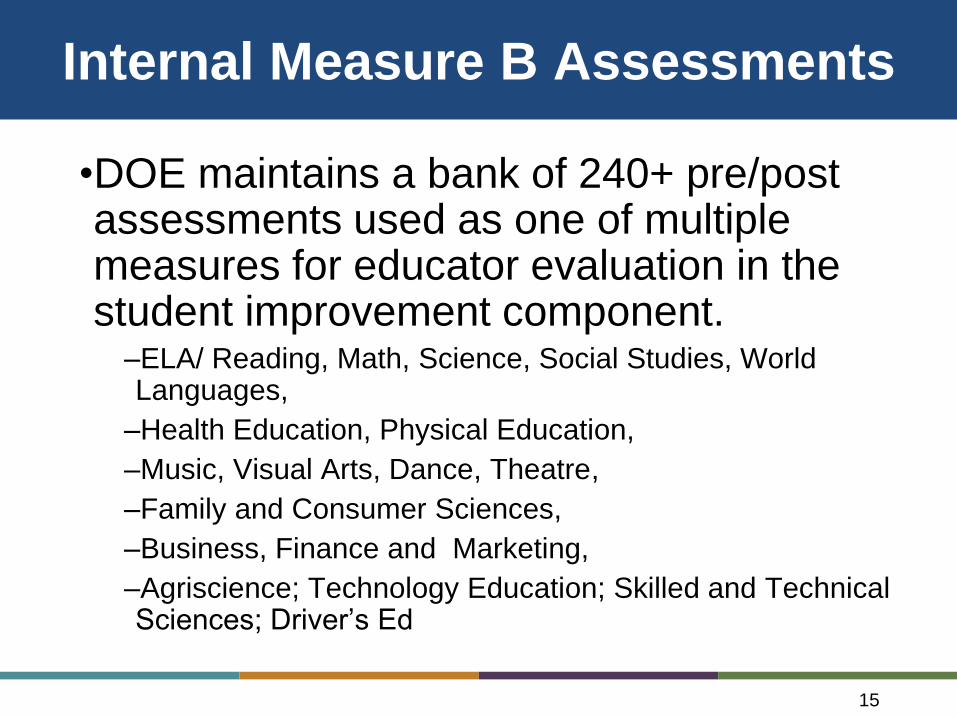
Internal Measure B Assessments
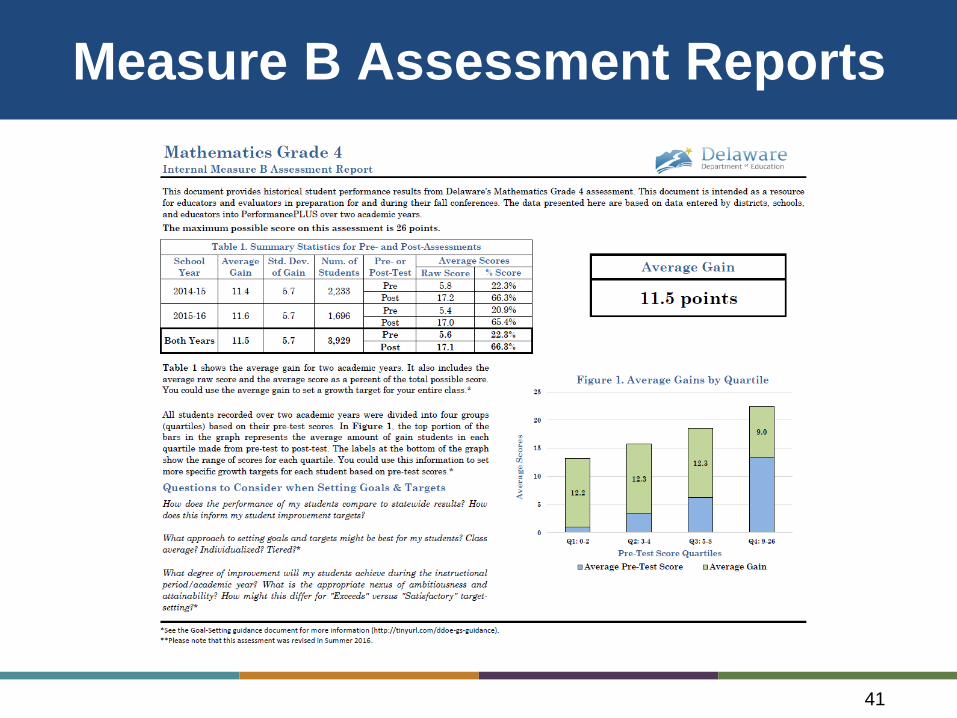
•DOE maintains a bank of 240+ pre/post assessments used as one of multiple measures for educator evaluation in the student improvement component.
–ELA/ Reading, Math, Science, Social Studies, World Languages,
–Health Education, Physical Education,
–Music, Visual Arts, Dance, Theatre,
–Family and Consumer Sciences,
–Business, Finance and Marketing,
–Agriscience; Technology Education; Skilled and Technical Sciences; Driver’s Ed
15
Internal Measure B Assessments
•Analyses of internal Measure B
assessment data (reliability, validity, &
item-level analyses)
•Goal-setting support
16

GOAL-SETTING
AND PERFORMANCE PLUS
17
PerformancePLUS Reports
18
The following reports are available for
Internal Measure B assessments:
–Assessment Scores Reports
–Item Analysis by Question
–Item Analysis by Student
–Item Analysis by Incorrect Responses
–Standards Analysis
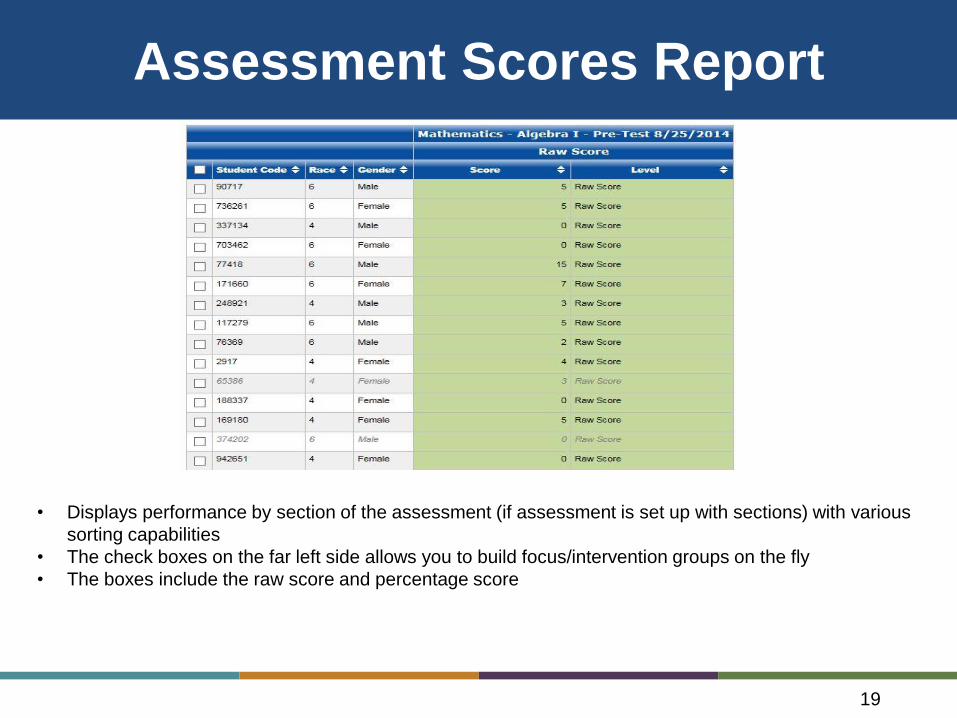
Assessment Scores Report
19
• Displays performance by section of the assessment (if assessment is set up with sections) with various
sorting capabilities
• The check boxes on the far left side allows you to build focus/intervention groups on the fly
• The boxes include the raw score and percentage score

Assessment Scores Report Options
20
• Options include – showing the students code, building, grade, teacher, class, race, and student group.
Choose to show scores, default levels, scores and default levels, assessment specific levels, or to show
scores and assessment specific levels.
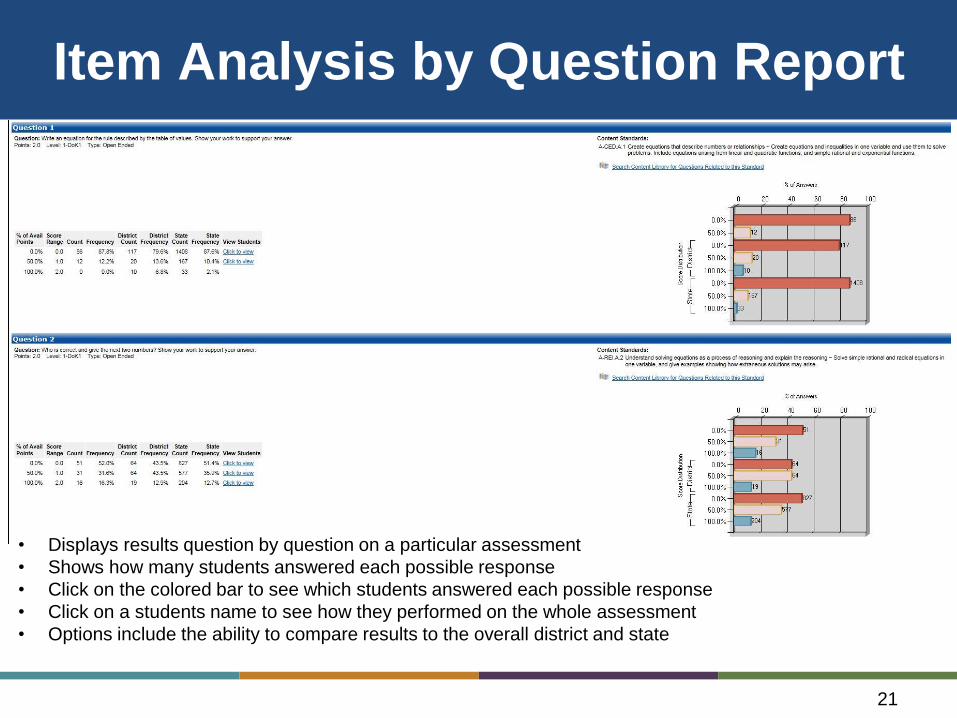
Item Analysis by Question Report
21
• Displays results question by question on a particular assessment
• Shows how many students answered each possible response
• Click on the colored bar to see which students answered each possible response
• Click on a students name to see how they performed on the whole assessment
• Options include the ability to compare results to the overall district and state

Item Analysis by Student Report
22
• View each student’s answer and sortable by column
• Color blocks indicate proficiency level
• The RED boxes indicate INCORRECT answers

Item Analysis by Student Report Options
23
• Options include – showing the students code, building, grade, teacher, class, race, and student group. Limit
questions by question type. Choose to see the scores by percentage or raw score. Display all answers or
just incorrect answers.
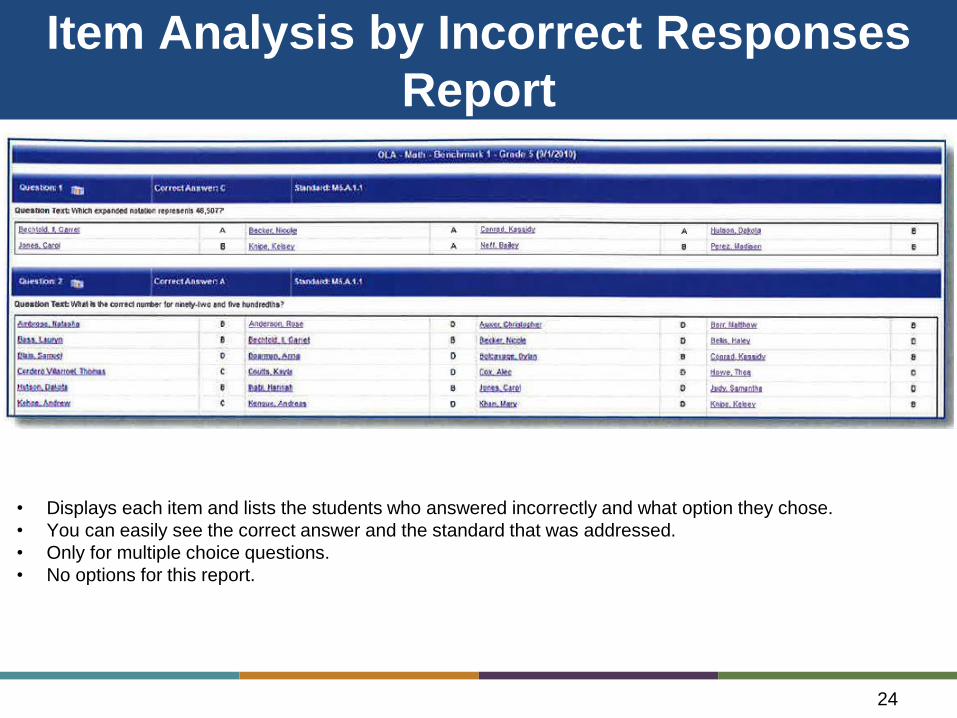
Item Analysis by Incorrect Responses
Report
24
• Displays each item and lists the students who answered incorrectly and what option they chose.
• You can easily see the correct answer and the standard that was addressed.
• Only for multiple choice questions.
• No options for this report.
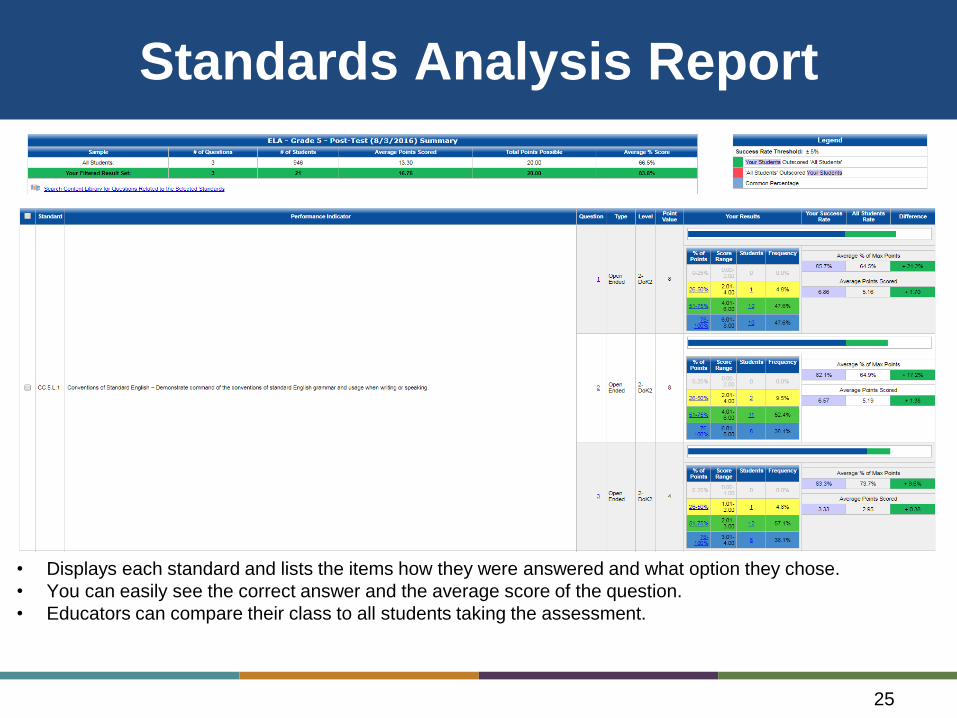
Standards Analysis Report
25
• Displays each standard and lists the items how they were answered and what option they chose.
• You can easily see the correct answer and the average score of the question.
• Educators can compare their class to all students taking the assessment.

LUNCH BREAK
26

GOAL-SETTING
SUPPORTS
27
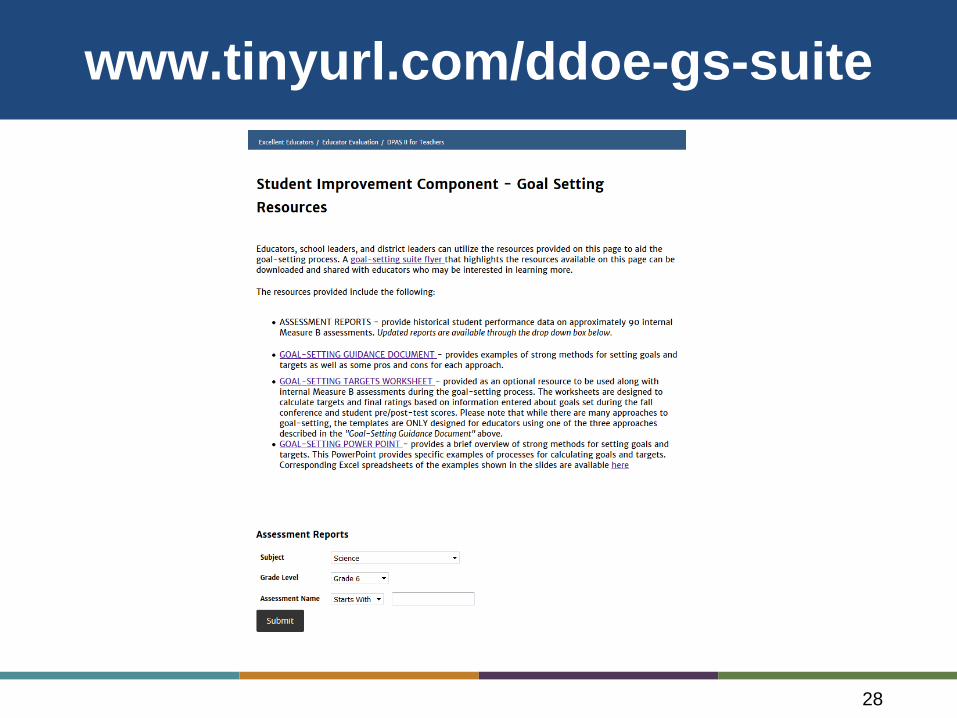
www.tinyurl.com/ddoe-gs-suite
28

Goal-Setting Guidance Document
29

Goal-Setting Excel Templates
Individualized Approach
30

Measure B Assessment Reports
31
GOAL-SETTING
WITH
MEASURE B DATA
32
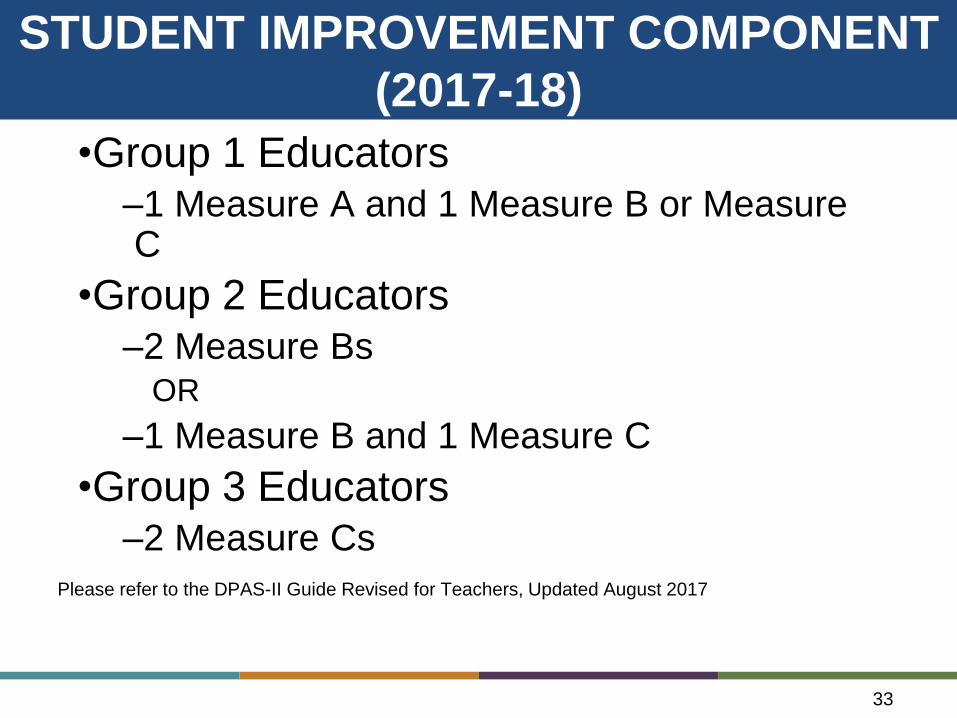
STUDENT IMPROVEMENT COMPONENT
(2017-18)
•Group 1 Educators–1 Measure A and 1 Measure B or Measure C
•Group 2 Educators–2 Measure Bs
OR
–1 Measure B and 1 Measure C
•Group 3 Educators–2 Measure Cs
33
Please refer to the DPAS-II Guide Revised for Teachers, Updated August 2017
How do you set goals?
34

Steps in Goal-Setting
Step 1: Gather and analyze base data
Step 2: Using available data, set ambitious
targets
Step 3: Calculate post-test results and
determine rating
35
Step 1: Gather and analyze baseline data
36
•Performance Plus reports
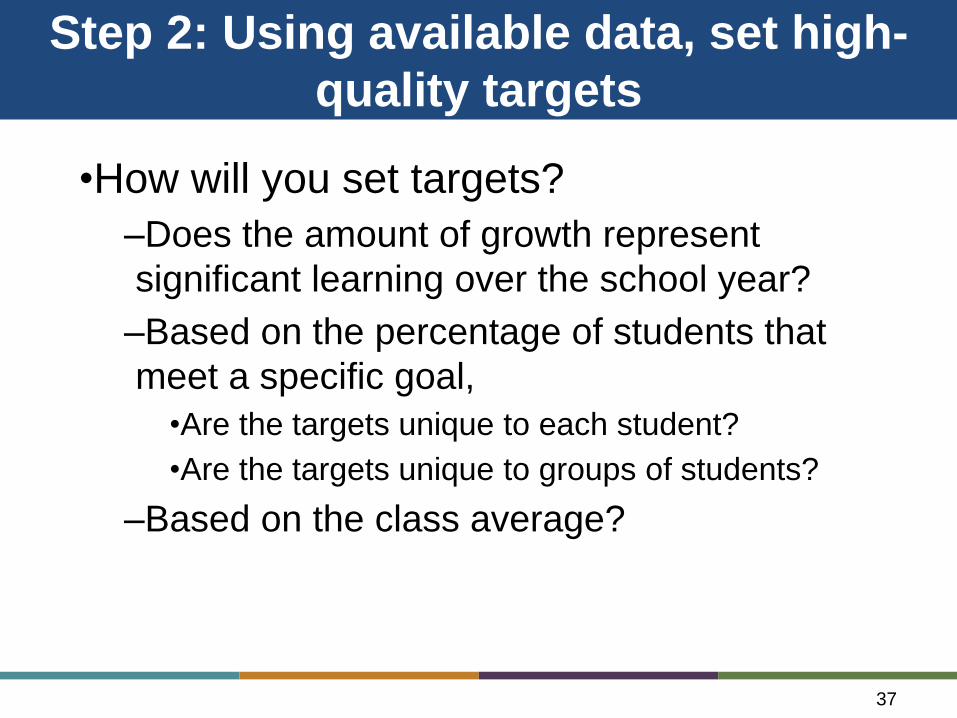
Step 2: Using available data, set high-
quality targets
•How will you set targets?
–Does the amount of growth represent
significant learning over the school year?
–Based on the percentage of students that
meet a specific goal,
•Are the targets unique to each student?
•Are the targets unique to groups of students?
–Based on the class average?
37
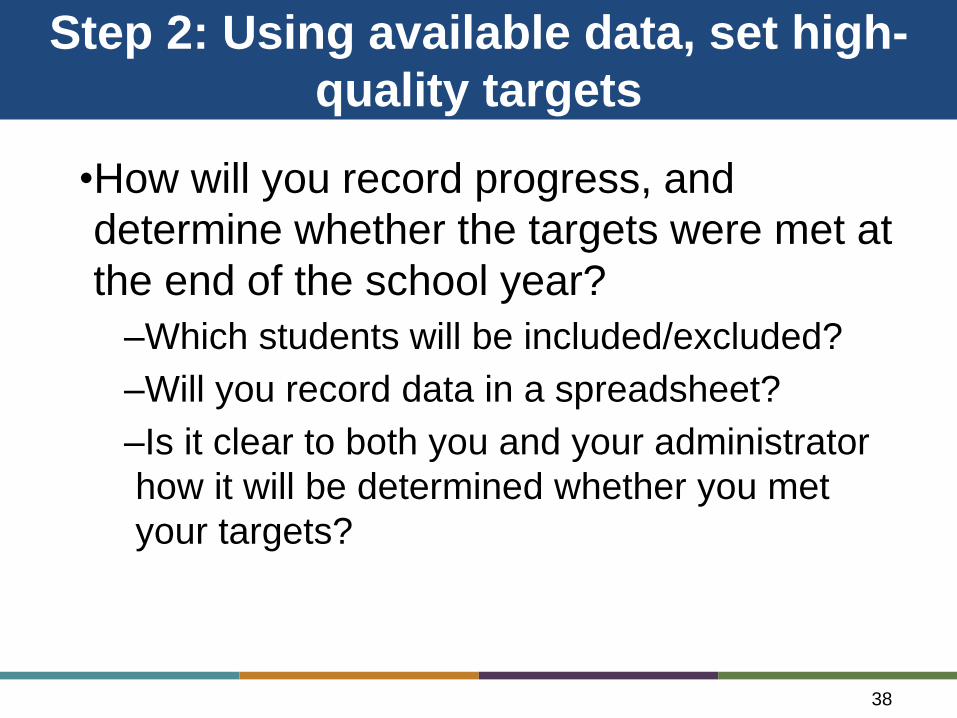
Step 2: Using available data, set high-
quality targets
•How will you record progress, and
determine whether the targets were met at
the end of the school year?
–Which students will be included/excluded?
–Will you record data in a spreadsheet?
–Is it clear to both you and your administrator
how it will be determined whether you met
your targets?
38
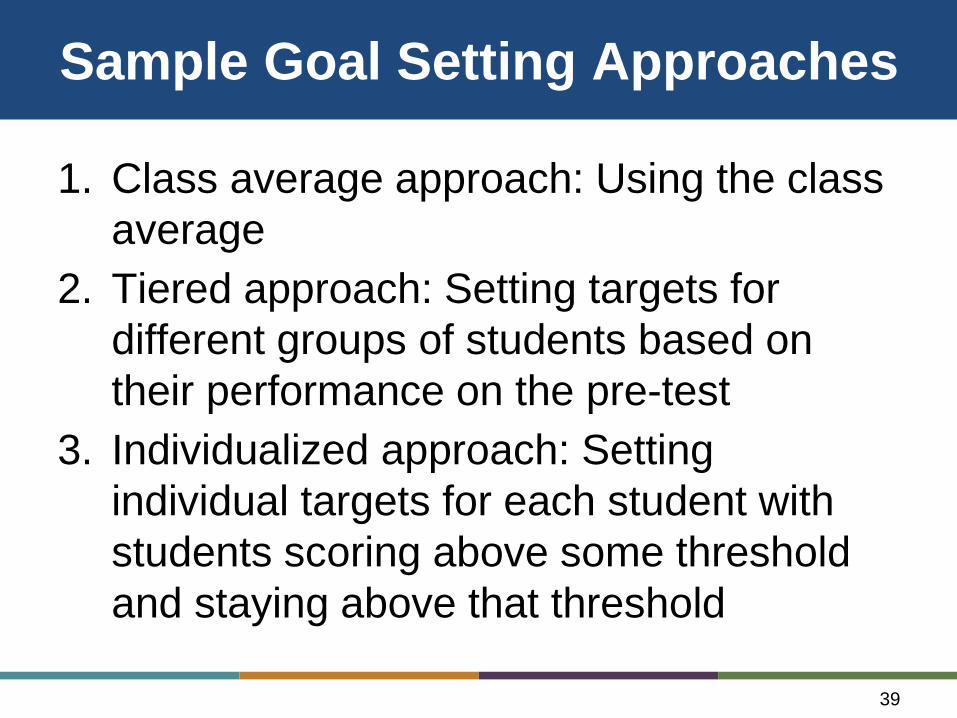
Sample Goal Setting Approaches
1. Class average approach: Using the class
average
2. Tiered approach: Setting targets for
different groups of students based on
their performance on the pre-test
3. Individualized approach: Setting
individual targets for each student with
students scoring above some threshold
and staying above that threshold
39

Sample Goal Setting Approaches
40
CLASS AVERAGE TIERED INDIVIDUALIZED
APPROACH APPROACH APPROACH
Q1: Growth target 1
Q1: Growth target 1
Q2: Growth target 2
Q2: Growth target 2
Q2: Growth target 2
Q4: Growth target 4
Q4: Growth target 4
Q3: Growth target 3
Q3: Growth target 3
Q3: Growth target 3
SAME GROWTH TARGET
SAME GROWTH TARGET
SAME GROWTH TARGET
SAME GROWTH TARGET
SAME GROWTH TARGET
SAME GROWTH TARGET
SAME GROWTH TARGET
SAME GROWTH TARGET
SAME GROWTH TARGET
SAME GROWTH TARGET
GROWTH TARGET 4
GROWTH TARGET 5
GROWTH TARGET 6
GROWTH TARGET 1
GROWTH TARGET 2
GROWTH TARGET 3
GROWTH TARGET 10
GROWTH TARGET 7
GROWTH TARGET 8
GROWTH TARGET 9
Measure B Assessment Reports
41

Mathematics Grade 4
Class Average Approach
•Class average approach:
–Class Pre-Test Average: ~6 points
–Historical State growth: 11.5 points
–Std. dev: ~ 6 points
Satisfactory Target: Class average on the
post-test will be between 17.5 and 23.5 points
Exceeds Target: Class average on the post-
test will be greater than 23.5 points
42

Class Average Approach
Pros Cons
43
• Relatively easy to
calculate and understand
• Less measurement error
than when targets are set
for individual students
• If educator has a high-
scoring class, may be
more difficult to set
rigorous goals
• There may be less focus
on individual student
progress

Mathematics Grade 4
Tiered Approach
44
•Tiered Approach–Pre-Test Scores
•Quartile 1: students with scores between 0 – 2 points
•Quartile 2: students with scores between 3 – 4 points
•Quartile 3: students with scores between 5 – 8 points
•Quartile 4: students with scores between 9 – 26 points
Goal: Students in Group 1 gain 12.2 points; Students in Group 2 gain 12.3 points; Students in Group 3 gain 12.3 points; Students in Group 4 gain 9.0 points
Satisfactory Target: 60% - 79% of students meet target
Exceeds Target: 80% or more of students meet target
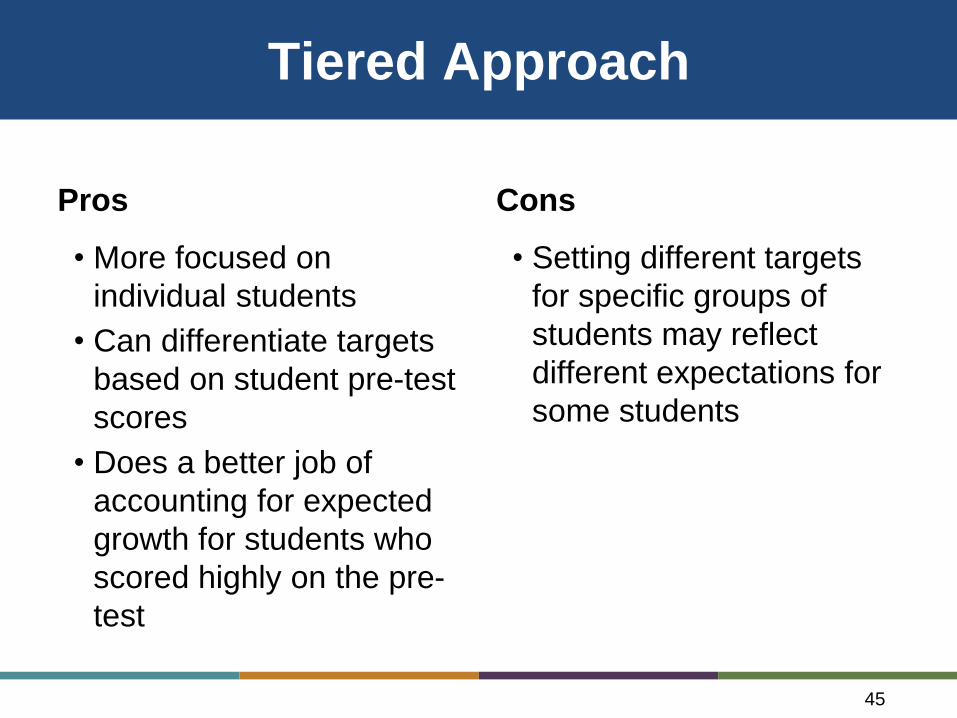
Tiered Approach
Pros Cons
45
• More focused on
individual students
• Can differentiate targets
based on student pre-test
scores
• Does a better job of
accounting for expected
growth for students who
scored highly on the pre-
test
• Setting different targets
for specific groups of
students may reflect
different expectations for
some students
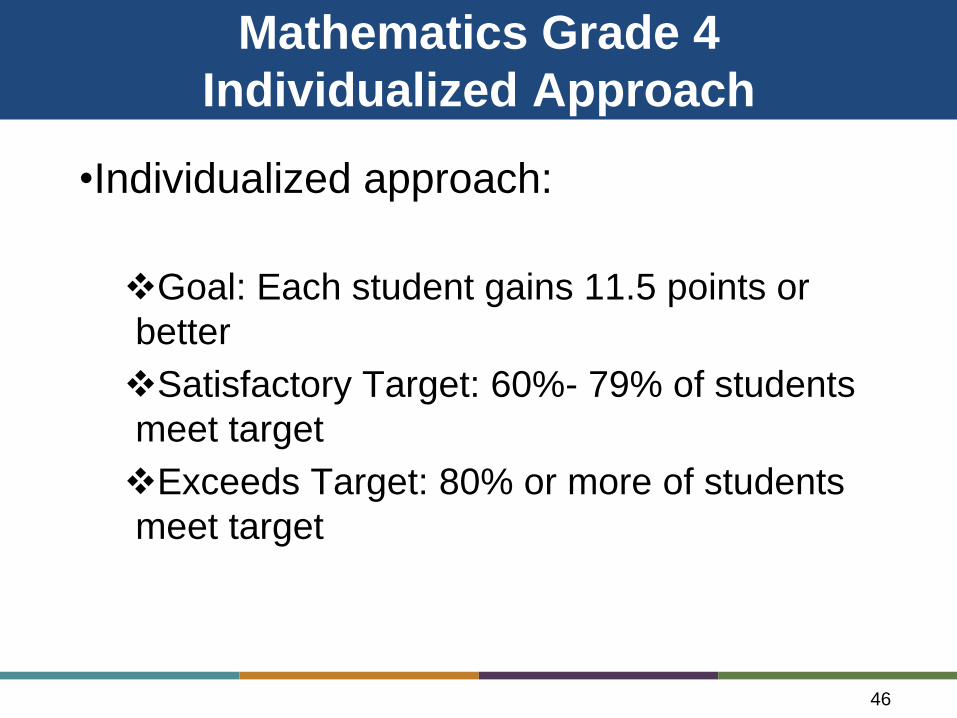
Mathematics Grade 4
Individualized Approach
•Individualized approach:
Goal: Each student gains 11.5 points or
better
Satisfactory Target: 60%- 79% of students
meet target
Exceeds Target: 80% or more of students
meet target
46

Individualized Approach
Pros Cons
47
• More focused on
individual student
• Some students may not
have much room to grow
on the assessment
• More calculation needed
• More measurement error
around test score for
each individual student
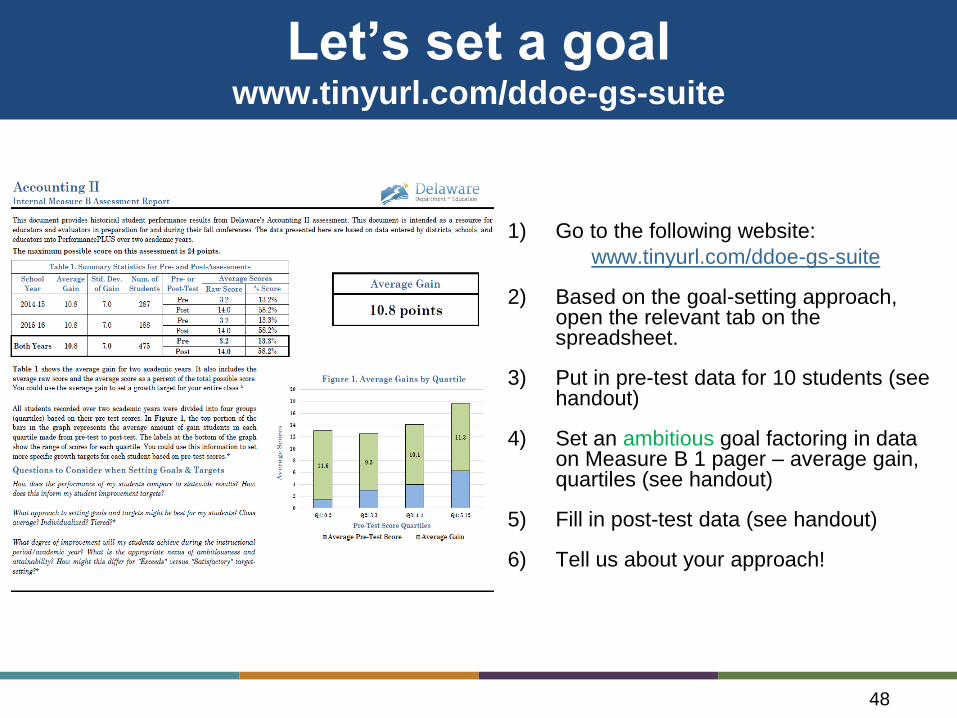
Let’s set a goalwww.tinyurl.com/ddoe-gs-suite
1) Go to the following website:
www.tinyurl.com/ddoe-gs-suite
2) Based on the goal-setting approach, open the relevant tab on the spreadsheet.
3) Put in pre-test data for 10 students (see handout)
4) Set an ambitious goal factoring in data on Measure B 1 pager – average gain, quartiles (see handout)
5) Fill in post-test data (see handout)
6) Tell us about your approach!
48
Step 3: Calculate Post-Test Results &
Determine Rating
49
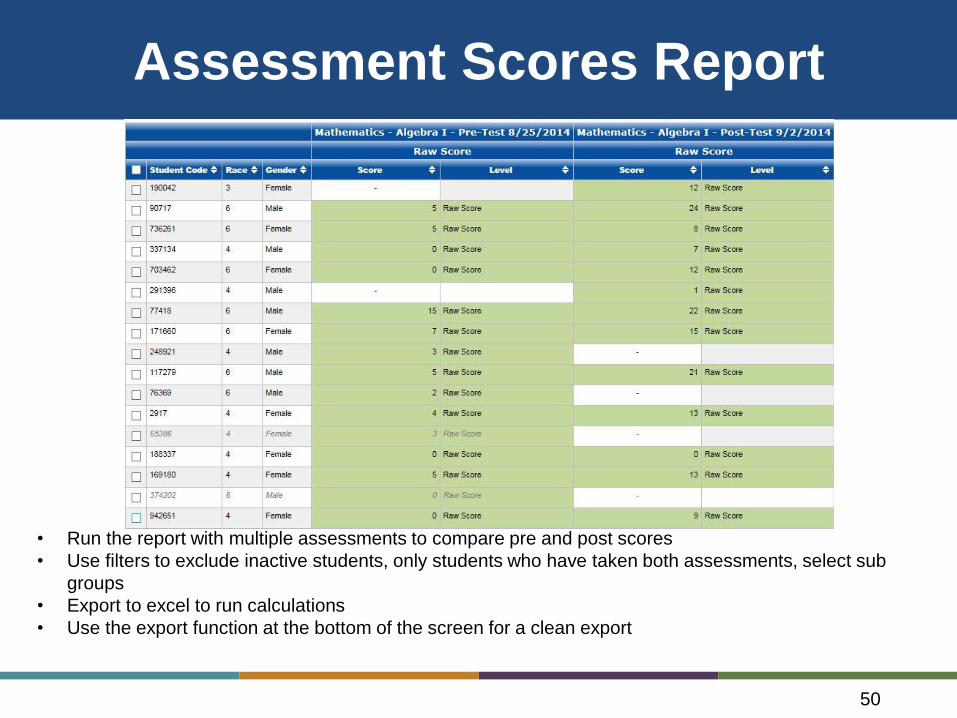
Assessment Scores Report
50
• Run the report with multiple assessments to compare pre and post scores
• Use filters to exclude inactive students, only students who have taken both assessments, select sub
groups
• Export to excel to run calculations
• Use the export function at the bottom of the screen for a clean export
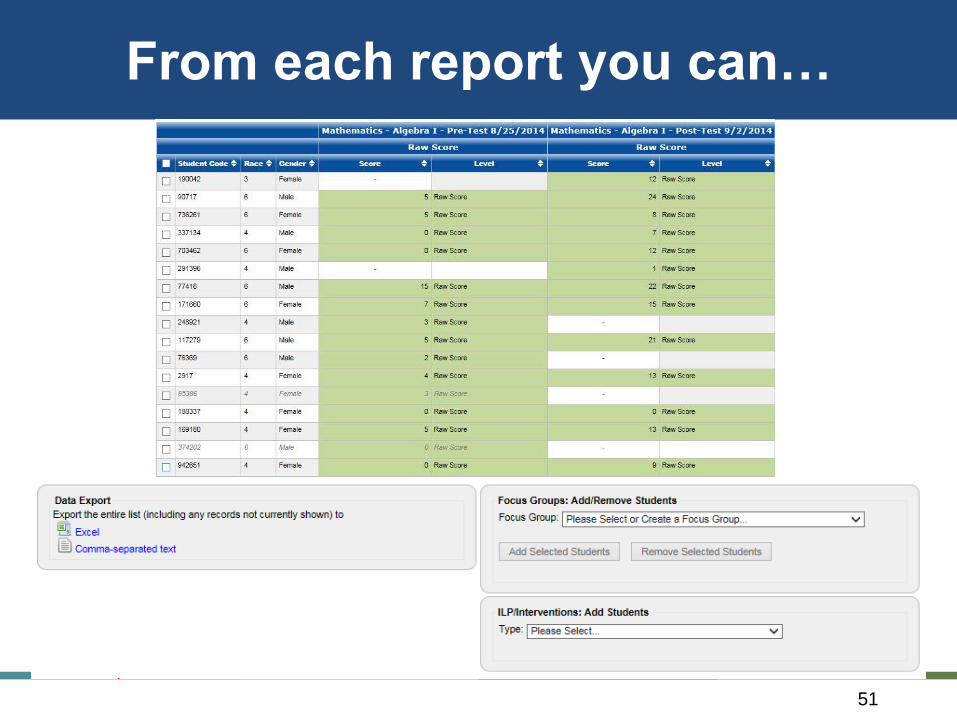
From each report you can…
51

52
Measure C Support Documents
Have you thought about………
Printing and maintaining a binder of all Measure C goal statements and standards for the current
Specialists working in your building.
Printing and maintaining a binder of all Measure C goal statements and standards for any subject area
of an educator in your building who may choose to use a Measure C.
Reviewing goal statements to find those that are most aligned the work that the specialists in your
building do with district and/or school-wide goals.
The current measurement tools used by those specialists that would support those goal statements
AND district and/or school-wide goals.
How the educator will collect and use baseline data.
What a rigorous growth goal might be for the different educators in your building.
How educators will represent the BOY and EOY year data to support their growth goals.
What strategies the educator might use to help meet their target
How and when the educator might monitor progress towards the target
Questions?
53
•Questions email:
–Seher Ahmad
•Questions about PerformancePLUS email:
–Brenda Dorrell