Downtown Investment Plan
33
Steamboat Springs Downtown Investment Plan Attachment 1
-
Upload
scott-franz -
Category
Documents
-
view
9 -
download
1
description
URA and TIF proposal from city of Steamboat Springs
Transcript of Downtown Investment Plan

Steamboat Springs Downtown Investment Plan
Attachment 1

Vision Statement
• The Downtown Investment Plan is about one thing:
Making a Great Place BetterMaking Downtown More AttractiveMaking Downtown SaferMaking Downtown a Great Place to InvestMaking Downtown a Better Place to do BusinessMaking Downtown an Even Better Place to VisitMaking Downtown a Great Place to Live

Vision Statement
How this is accomplished in the most fiscally effective manner:
Acting while interest rates and construction costs are lowActing while property values are low but risingCompleting efficiently as one coordinated projectCompleting with consistent design quality and appearance throughout Downtown

Downtown Projects Oak Pedestrian Lighting 375,000Oak Street Sidewalks (3rd 12th) 400,155Oak Street Curb & Gutter 90,125Intersections on Yampa (Bulb outs) 1,210,420Intersections on Yampa (Speed Tables) 689,025Side Street Sidewalks 718,725Side Street Curb & Gutter 161,875Promenade 271,560Promenade Curb & Gutter 91,980Promenade Crusher Fines 24,850Yampa Pedestrian Lighting 370,000Yampa Street Sidewalks (DT Side) 238,227Yampa Street Curb & Gutter (DT Side) 53,655Trash & Recycling (all areas) 316,0009th Street Park & Retrofit S&R Bldg 620,000
Eagle scout Park Restroom 480,000West Lincoln Park Restrooms 320,000Professional Services 405,000Utilty Undergrounding 600,000Contingency 800,000Floodway and Yampa Bank Improvements 590,000Asphalt/Concrete Capital Repairs 200,000Amphitheater Along Yampa (Stone Terracing) 195,000River Bank & Fence Enhancements (10th 12th) 40,000Benches/Seating (area wide) 52,500Bike Racks (area wide) 46,000
9,360,097$Financing Costs Interest (4% on 9.36M15yrs) 2,973,747Financing Costs Loan Fees 200,000
12,533,844
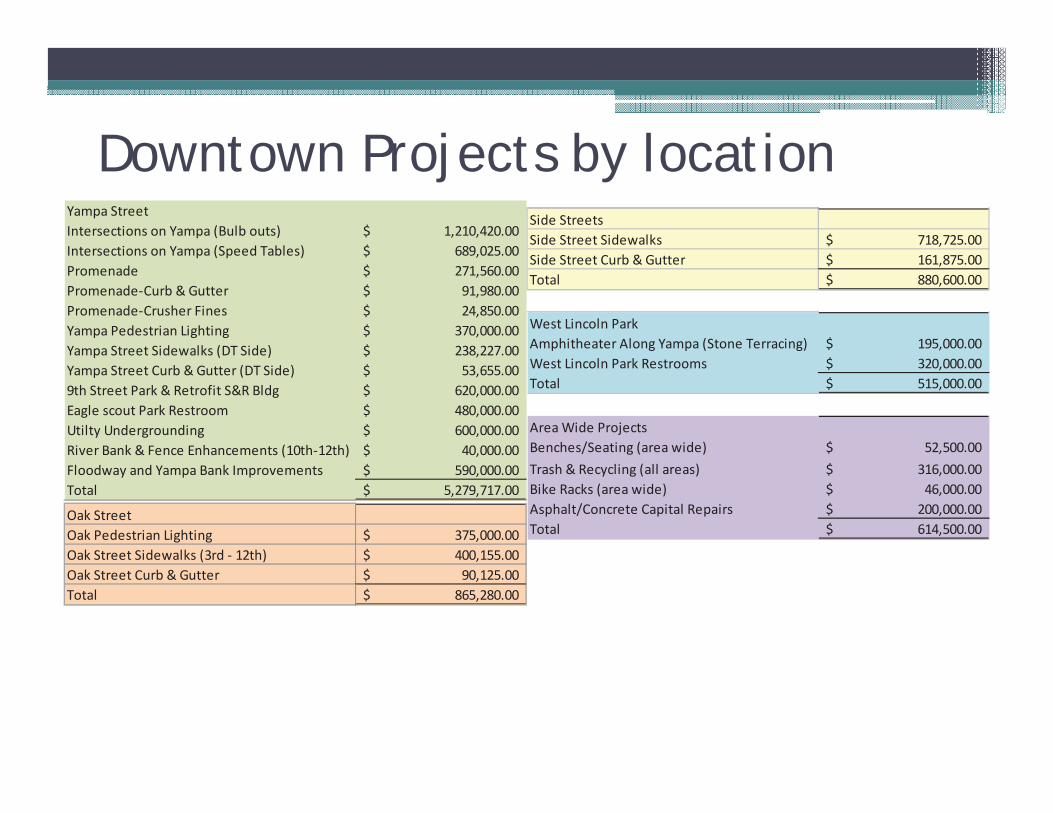
Downtown Projects by location Yampa StreetIntersections on Yampa (Bulb outs) 1,210,420.00$Intersections on Yampa (Speed Tables) 689,025.00$Promenade 271,560.00$Promenade Curb & Gutter 91,980.00$Promenade Crusher Fines 24,850.00$Yampa Pedestrian Lighting 370,000.00$Yampa Street Sidewalks (DT Side) 238,227.00$Yampa Street Curb & Gutter (DT Side) 53,655.00$9th Street Park & Retrofit S&R Bldg 620,000.00$Eagle scout Park Restroom 480,000.00$Utilty Undergrounding 600,000.00$River Bank & Fence Enhancements (10th 12th) 40,000.00$Floodway and Yampa Bank Improvements 590,000.00$Total 5,279,717.00$
Oak StreetOak Pedestrian Lighting 375,000.00$Oak Street Sidewalks (3rd 12th) 400,155.00$Oak Street Curb & Gutter 90,125.00$Total 865,280.00$
Side StreetsSide Street Sidewalks 718,725.00$Side Street Curb & Gutter 161,875.00$Total 880,600.00$
West Lincoln ParkAmphitheater Along Yampa (Stone Terracing) 195,000.00$West Lincoln Park Restrooms 320,000.00$Total 515,000.00$
AreaWide ProjectsBenches/Seating (area wide) 52,500.00$Trash & Recycling (all areas) 316,000.00$Bike Racks (area wide) 46,000.00$Asphalt/Concrete Capital Repairs 200,000.00$Total 614,500.00$

Goal #1
• Make a Great Place Better – Economic Vitality Depends on a Quality Experience
Make Downtown the best possible place to visit, live, work and investBuild upon recent public and private investments

Goal #1- Required Investment
• Prioritize support for quality public amenities –consistent design throughout downtown
• Including gathering places, river access, public restrooms, way-finding and public art
• Be open to public/private partnerships –including parking solutions

Goal #1- Measures of Success
• More feet on the street – pedestrian counts• Improved business retention, attraction and
private investment; i.e. sales growth

Goal #2
• Accelerate private investment:Bolster private sector confidence in public sector support for downtownRemove basic infrastructure costs as a disincentive to invest

Goal #2 – Required Investment
• Complete basic public infrastructure

Goal #2 Measures of Success
• Increased depth and breadth of private investment during current real estate cycle
• Improved retention, profitability and growth of existing downtown businesses
• Increased use and excise taxes from new construction

Goal #3
• Be fiscally prudent:Complete capital projects while cost of debt and construction is low - realize economies of scale Set tax baseline before property values rise and non-taxed properties move to tax rolls.

Goal #3 Required Investment
• Complete sidewalk and lighting master plan, and utilities projects in single focused effort.

Goal #3 Measures of Success
• Reduced capital project costs• Earlier sales and property tax growth to benefit
all entities• See increased value of City asset

Goal #4• Reduce public safety hazards due to
incomplete sidewalks and poor lighting on Oak, Yampa and some areas of cross streets.
Reduce pedestrian, vehicle and bike conflicts –especially in winter.

Goal #4 – Required Investment
• Complete system of sidewalks and pedestrian lighting throughout downtown interconnecting Oak, Lincoln, Yampa and all cross-streets.

Goal #4 – Measures of Success
• Improved access to and safe use of on-street parking throughout business district.
• Extend more pedestrian activity to underutilized blocks – ped counts

Goal #5
• Reduce risks and liabilitiesRemove core business locations from flood risk

Goal #5 – Required Investment
• Upgrade Butcherknife Creek culvert between Oak Street and the Yampa River

Goal #5 – Measure of Success
• Reduced flood insurance premiums for private property
• Improve community flood rating

Tools - Pros & Cons
• Capital Infrastructure Fund (CIP)• Certificates of Participation (COP)• Local Improvement District (LID)• General Obligation Bond (GO)• General Improvement District or Special
Improvement District (GID,SID)• Tax Increment Financing (TIF)• Continue Temporary Improvements

Use CIPPros Cons
No Financing Costs Large dollar amount
Broad scope Compete with other CIP projects for prioritization
Can complete 100% of projects Delays other CIP projects
Unlikely to have a project completed at one time - loss of design continuity and single project cost savings

COPPros Cons
Broad Scope Need to locate $9M of Capital for collateral
No extra cost associated with going to an election
No new revenue

LIDPros Cons
Can complete capital improvements Assessment of every adjacent property owner
Local Improvement DistrictOak Street Sidewalks (3rd 12th) 400,155.00$Side Street Sidewalks 718,725.00$Yampa Street Sidewalks (DT Side) 238,227.00$Total 1,357,107.00$

BondPros Cons
Can finance all or a portion of redevelopment projects
Property tax would be needed to service the debt ( property tax would expire upon full bond repayment)
Debt is currently relatively cheap
Grow economic activity through public investment
Grow economic activity through public investment/property value enhanced
Single project cost savings
Requires election Requires election

GID/SIDPros Cons
Can finance all or a portion of redevelopment projects
Property tax or assessment on a limited group – downtown properties
Scope of project can be flexible Would require establishing new district downtown
GID can finance maintenance
Requires vote of downtown electorate Requires vote of downtown electorate

Seasonal ImprovementsPros Cons
Affordable Does not enhance experience
Creates safer pedestrian environment Sends poor message to visitors
No improvement in infrastructure
One off expenses, not investments

TIFPros Cons
Community Investment (81% of project cost is City sales tax)
Perception of tax diversion
No new taxes Estimated growth can be influenced by multiple factors
Debt is currently relatively cheap
Grow economic activity through public investment/property value enhanced
Single project cost savings
Can finance all or a portion of redevelopment projects

This TIF• URA would enter into an agreement with every
taxing district limiting the property tax increment to $2.4 million
Once $2.4 million is reached, property tax would flow back to the districts
• $10.2M of incremental sales tax would flow to TIF • County and Education Fund Board sales tax would
not flow into TIF• Council has the ability to set parameters on the
projects and dollar amount spent using this tool• URA would enter into an agreement with the RE-2
School District to allow all property tax to flow if State financing should change

Questions

Examples• Pueblo – PURA reports a 4% increase in
property tax base in plan areas • Brighton – 2002-2012 $1.8 Million revenue
increase to taxing districts

Examples• GURA – Golden

Estimated Impacts