Downstream fining trends of gravel bar sediments: a case ...
14
Original Arcle 229 Holušová, A., Galia, T. (2020): Downstream fining trends of gravel bar sediments: a case study of Czech Carpathian rivers. AUC Geographica 55(2), 229–242 hps://doi.org/10.14712/23361980.2020.17 © 2020 The Authors. This is an open-access arcle distributed under the terms of the Creave Commons Aribuon License (hp://creavecommons.org/licenses/by/4.0). Downstream fining trends of gravel bar sediments: a case study of Czech Carpathian rivers Adriana Holušová * , Tomáš Galia University of Ostrava, Faculty of Science, Department of Physical Geography and Geoecology, Czechia * Corresponding author: [email protected] ABSTRACT This study examines downstream grain-size trends in gravel bars, a typical feature of natural gravel-bed rivers, from two neighbour- ing heavily channelized rivers: the Lubina River and the Ondřejnice River draining the Czech part of the Outer Western Carpathians. It aims to examine the effects of the grade control structures, significant tributaries, and lateral sediment inputs on the downstream fining trends. Addionally, the relaonship between the channel width and the grain sizes in bars was analysed, as well as the dep- osional trends in frontal, central and distal parts of the examined gravel bars. The Ondřejnice River has, in most cases, higher D50 and median values of grain size of bar sediment and a higher downstream reduc- on coefficient (D50 = 0.033 mm km −1 ; D84 = 0.036 mm km −1 ) than the Lubina River (D50 = 0.026 mm km −1 ; D84 = 0.032 mm km −1 ). These intense reducon trends in the grain size are oſten observed in single and mulple-threaded rivers in the Western Carpathi- ans. On both rivers, the predominant deposion of the highest D50 was detected in the central parts of the bars, and the wider channel widths oſten corresponded with finer sediment deposion in the Lubina River. The disrupon of the downstream fining corresponded in some cases with the frequent grade control structures. However, in most cases, the downstream fining trends were not affected. A tributary and adjacent hillslope area could be possibly linked to the disrupon of the downstream fining trend in the Ondřejnice River. KEYWORDS Carpathians; gravel bar; grain size; downstream fining; photo-granulometry Received: 22 May 2020 Accepted: 28 August 2020 Published online: 30 October 2020
Transcript of Downstream fining trends of gravel bar sediments: a case ...

Original Article 229
Holušová, A., Galia, T. (2020): Downstream fining trends of gravel bar sediments: a case study of Czech Carpathian rivers. AUC Geographica 55(2), 229–242https://doi.org/10.14712/23361980.2020.17© 2020 The Authors. This is an open-access article distributed under the terms of the Creative Commons Attribution License (http://creativecommons.org/licenses/by/4.0).
Downstream fining trends of gravel bar sediments: a case study of Czech Carpathian riversAdriana Holušová*, Tomáš Galia
University of Ostrava, Faculty of Science, Department of Physical Geography and Geoecology, Czechia* Corresponding author: [email protected]
ABSTRACTThis study examines downstream grain-size trends in gravel bars, a typical feature of natural gravel-bed rivers, from two neighbour-ing heavily channelized rivers: the Lubina River and the Ondřejnice River draining the Czech part of the Outer Western Carpathians. It aims to examine the effects of the grade control structures, significant tributaries, and lateral sediment inputs on the downstream fining trends. Additionally, the relationship between the channel width and the grain sizes in bars was analysed, as well as the dep-ositional trends in frontal, central and distal parts of the examined gravel bars.The Ondřejnice River has, in most cases, higher D50 and median values of grain size of bar sediment and a higher downstream reduc-tion coefficient (D50 = 0.033 mm km−1; D84 = 0.036 mm km−1) than the Lubina River (D50 = 0.026 mm km−1; D84 = 0.032 mm km−1). These intense reduction trends in the grain size are often observed in single and multiple-threaded rivers in the Western Carpathi-ans. On both rivers, the predominant deposition of the highest D50 was detected in the central parts of the bars, and the wider channel widths often corresponded with finer sediment deposition in the Lubina River. The disruption of the downstream fining corresponded in some cases with the frequent grade control structures. However, in most cases, the downstream fining trends were not affected. A tributary and adjacent hillslope area could be possibly linked to the disruption of the downstream fining trend in the Ondřejnice River.
KEYWORDSCarpathians; gravel bar; grain size; downstream fining; photo-granulometry
Received: 22 May 2020Accepted: 28 August 2020Published online: 30 October 2020

230 Adriana Holušová, Tomáš Galia
1. Introduction
Gravel bars form frequently in streams and consist of granularly diverse sediments. The planar size of the bar usually corresponds to the channel width (Wohl 2014). There are many types of bars, such as alternate bars or point bars, and they are most often catego-rized by the origin or location in the channel (Wohl 2014; Gordon 2004). Generally, a source of sediments and the frequency of its delivery into the stream as well as decreases in flow velocity and transport capac-ity are preconditions for the formation of a river bar.
The sources of sediment may be colluvial materi-al from adjacent hillslopes, incisions, lateral erosion, and tributaries (Wohl 2014). However, for sediment flux to enter the river channel is important the degree of connectivity in the river. Connectivity often refers to a certain level of connection in the river network or landscape where matter (including sediments), energy and biota is moved by fluxes. It exists in either longitudinal, lateral, or vertical dimension, and it is important in terms of the river responses to the human or natural disturbances. Therefore, maintain-ing or creating proper connectivity in rivers is crucial for the effectivity of river management. Specific inter-ventions or disturbances which can be either natu-ral (landslide, alluvial fan) or anthropogenic (dams, channelization, levees) often decrees connectivity in certain dimensions but can sometimes increase the connectivity in the other dimensions. For example, channelization decreases lateral connectivity but increases longitudinal connectivity (Wohl 2017). The barriers in the longitudinal river channel such as the grade control structures generally cause deposition of the finer sediment behind the structure (towards the upstream) while in the front are often observed coarser sediments due to the hungry water effect. This effect is when the river channel is lacking sedi-ment supply because of the grade control structure block. It also causes channel incision (Škarpich 2010).
The rate of sediment transport is greatly affect-ed not only by barriers but by channel morphology and its effect on flow resistance. Some studies deal-ing with estimating bedload transport in headwater streams presented that streams with lower sediment supply and transport have more developed bedforms and so the flow resistance. The streams with higher sediment supply showed less developed bedforms with lower flow resistance. (Galia and Hradecký 2014; Yager et al. 2007; Chiari and Rickenmann 2011).
The grain-size characteristics of gravel bars change throughout the longitudinal profile of the river depending on various factors. The main two factors include selective sorting during erosion, transport and depositional processes, and abrasion of individ-ual sediment grains, so that the volume of individual particles starts to decrease downstream – also known as Sternberg’s (1875) law (Gomez 2001). In contrast,
sediment influxes can interrupt the process of down-stream fining and lead to downstream coarsening, particularly in mountainous areas (Wohl 2014). These disruptions are often caused by alluvial sources such as tributaries, bank failures (Church and Keller-hals 1978; Dawson 1988; Knighton 1980; Rice 1998; Rice 1999) or terraces and alluvial fans (Rice 1998) or non-alluvial sources such as slope deformations – landslides, ravines (Rice and Church 1996; Surian 2002; Škarpich 2010; Škarpich 2019; Rice 1998). The sediment size in the river channel can also vary cor-responding to channel width changes. Wider channels are considered to contain granularly finer sediments, whereas narrower channels contain coarser sedi-ments (Rengers and Wohl 2007).
Differences in grain sizes within the planar area of individual bars are usually related to the type of bar or to the geomorphological regime of the stream. For example, in the case of braided rivers, there are very complex bars with many factors that influence the spatial distribution of grain-size fractions. How-ever, the general assumption is that most bars tend to deposit coarser sediments in the upper (frontal) part of the bar with gradual refinement towards the lower (distal) part of the bar (Smith 1974; Bluck 1982; Ash-worth and Ferguson 1986), as observed on alternat-ing or point bars (Jackson 1976; Pyrce and Ashmore 2005). Lateral sediment refinement from the outer to the inner bank (Bridge and Jarvis 1976; Parker and Andrews 1985) is also considered a specific predom-inant type of deposition at point bars. Vertical fining from the bottom of the bed towards the bar surface has also been documented (Smith 1974; Bluck 1982; Ashworth and Ferguson 1986). However, some stud-ies have demonstrated opposite trends, such as down-stream coarsening in partially reinforced layers (Lunt and Bridge 2004) or coarsening in the upper and bottom parts of the bar due to previous anthropo-genic channel modifications (Hradecký et al. 2019). In terms of different factors that cause changes in sedimentation across the bar surface, riparian vege-tation is considered significant (Edwards et al. 1999). It usually increases the roughness in streams, which results in reduced flow and deposition of finer frac-tions (Wohl 2014). Different types of pioneer riparian vegetation (herbs, shrubs, and trees) also have differ-ent functions on river sediment forms; herbaceous plants provide a suitable area for other species by trapping diaspores and stabilizing of fine sediments, and shrubs and trees provide micro-climate, shadow and mechanical resistance (Corenblit et al. 2009). As soon as the sediment is deposited in the bar zone, the roots of plants provide a certain degree of stabiliza-tion which may result on the creation of mid-channel bars or islands (Ikeda and Izumi 1990). Riparian veg-etation along the riverbanks is often a source for wood accumulation in the river channel. The wood can cre-ate barriers in terms of longitudinal connectivity and causes changes in morphology. Woody accumulations

Downstream fining trends of gravel bar sediments 231
are defining according to its size to large woody debris (LWD) including tree trunks and branches and fine woody debris (FWD; <0.03 m in diameter) which typically include twigs or wood chips (Borák 2018). The definitions of categories and metrics vary, e.g. some authors may define small woody debris (SWD) instead of FWD. According to some authors, the LWD is stated as a woody material with dimensions of 10 × 100 cm (Borák 2018; Kaczka 1999; Faustini and Jones 2003) or >0.1 m in diameter (Hawson et
al. 2012). When the LWD is oriented across the river channel, it has an effect of a barrier that decreases the energy and velocity of the river. This frequently caus-es sediments to deposit in front of the LWD (towards upstream) and immediately behind it downstream. Gravel bars with coarser sediments are found behind the woody accumulations, while the finer sediment tends to deposit in front of it (Borák 2018).
In this paper, we focused on downstream longi-tudinal changes in the grain sizes within gravel bars
Fig. 1 Map of two studied rivers in the position of coordinates.

232 Adriana Holušová, Tomáš Galia
(downstream fining and downstream coarsening) and the sediment disruption linkage; to material fluxes from possible sources (significant tributaries, adjacent hillslopes); and to the effect of grade control structures and local vegetation cover. Secondarily, we examined the trends in the grain size of the frontal, distal and central sections of individual gravel bars, as well as the relationship between channel width and corresponding sediment grain-size changes. The efforts of the study are to bring new insights to the otherwise well-known process of downstream fining and its disruption in the area of Western Flysch Car-pathians by assessing the possible sources of materi-al, longitudinal connectivity issues due to high river management, and local factors of vegetation cover on the gravel bars.
2. Methods
2.1 Study area
The Lubina and Ondřejnice Rivers (Figure 1) are sin-gle-threaded, meandering rivers and right-side tribu-taries of the Oder River flowing in the foothills of the Moravian-Silesian Beskids in the Czech Republic. The Lubina River springs on the northwestern slope of Radhošť Mountain at 740 m a.s.l. The catchment area is 195.89 km2 (CHI 2017), and the total length of the river reaches 36.3 km (Povodí Odry 2016). The mean annual discharge at the junction with the Oder River is 2.36 m3 s−1 (Štefáček 2008). The data of discharge and water level is from the gauging station situated at Petřvald (covers 165.18 km2 of the total area of the basin) on the left bank side (Figure 1) (CHI 2020). The 1-year discharge corresponds to 41.3 m3 s−1, 5-year discharge to 99.3 m3 s−1, 10-year discharge to 131 m3 s−1, 50-year discharge to 223 m3 s−1and 100-year discharge to 269 m3 s−1. The mean annual water level is 25 cm. The highest recorded water level (1997) reached 260 cm (CHI 2020). There are five sig-nificant tributaries with catchment areas greater than 10 km2: Bystrý creek, Lichnov creek, Tichávka creek, Kopřivnička creek and Trnávka creek.
The Ondřejnice River stems in the Moravian-Sile-sian foothills (Kříž 1995). The river springs near the village of Kozlovice on the western slope of the Ondře-jník Mountain at an elevation of 760 m a.s.l. The catch-ment area is 99.38 km2 (CHI 2017), and the length of the stream is 29.1 km (Povodí Odry 2016). The data of discharge and water level are from the gauging sta-tion (covers 41.09 km2 of the total area of the basin) situated in the Rychaltice (Figure 1). The mean annual discharge is 0.575 m3 s−1. The 1-year discharge corre-sponds to 15.4 m3 s−1, 5-year discharge to 37.6 m3 s−1, 10-year discharge to 50.1 m3 s−1 and 100-year dis-charge to 104 m3 s−1. The mean annual water level is 78 cm, and the highest recorded water level from 1966 reached 385 cm (CHI 2020). The right tributary
Košice creek is the only significant creek with a catch-ment area greater than 10 km2 (Povodí Odry 2016).
The relief of the upper parts of both catchments is formed by rugged uplands, extending north-wards from the territory of the Moravian-Silesian Beskids (with peaks exceeding 1200 m) and farther as flat highlands of Silesian-Moravian Foothills, e.g., the Štramberk Highlands with typical elevations of 450–500 m (Demek et al. 1965). The bedrock is formed by the Carpathian flysch rocks, and towards the mouths of the rivers, the bedrock is composed of much more complex lithological layers. The base is calcareous flysch from the Cretaceous period, espe-cially claystone and marlstone. Significant subsoil includes limestone cliffs from the Jurassic period near the Štramberk Highlands and mountain ridges of Mesozoic igneous rocks such as teschenite and pic-rites (Chlupáč et al. 2002). Near the river mouth to the Oder River, the relief of the catchments consists of a wide Oder floodplain with low terraces. The sub-soil consists mainly of Neogene sea clays in deeper layers and partially of Quaternary glaciofluvial sed-iments (GEOCR50 2015; Chlupáč et al. 2002) which are often covered with loess loam and slope material (Demek et al. 1965). A characteristic material of the studied bars is gravel derived from these flysch rocks (GEOCR50 2015).
In terms of river management, both rivers have been regulated roughly from the early 20th century. In the Lubina River, regulations included channel and bank stabilizations and an increase in channel capac-ity. Later, since the 1950s, more than 30 grade control structures have been implemented along almost the entire river course (except for the headwaters and most downstream parts near the confluence with the Oder) due to increasing infrastructure in the area (Figure 2). In the Ondřejnice River, most of the river regulations took place during the 1960s and 1980s, and in addition to channel capacity regulations, they included shifting of the channel. The river has more than 50 grade control structures and is regulated along more than 90% of its total length (Figure 2). Therefore, it is considered one of the rivers with the most interventions (Povodí Odry 2016).
2.2 Field work
Field measurements on both rivers took place in Feb-ruary 2019 during base flow conditions where the mean daily discharge during the days of field mea-surements varied from 1.88–2.28 m3 s−1 at the Lubi-na and from 0.54–0.78 m3 s−1 at the Ondřejnice (CHI 2020). Data were collected gradually from the river mouth of each river towards its headwaters. The rep-resentative grain sizes of the gravel bars were deter-mined by the photo-granulometry method, which consisted of collecting grain-size data with digital photos and then processing by the appropriate soft-ware (Digital Gravelometer). For surface grain-size
Downstream fining trends of gravel bar sediments 233
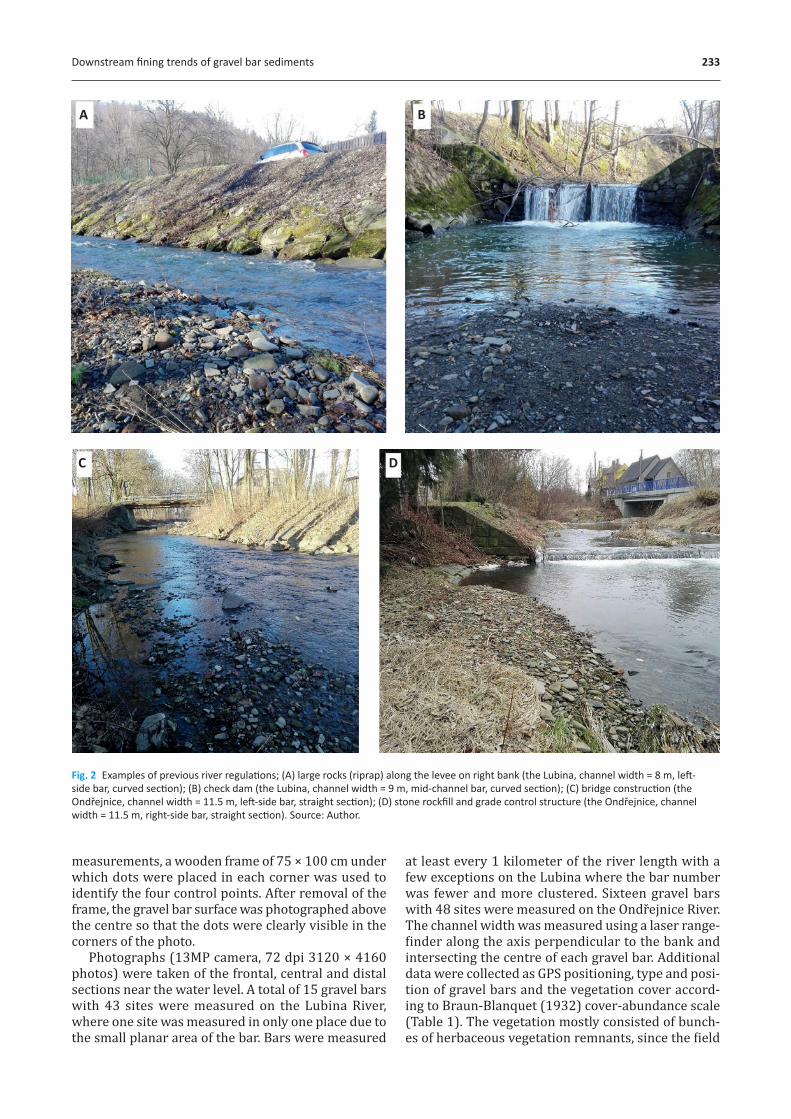
Fig. 2 Examples of previous river regulations; (A) large rocks (riprap) along the levee on right bank (the Lubina, channel width = 8 m, left-side bar, curved section); (B) check dam (the Lubina, channel width = 9 m, mid-channel bar, curved section); (C) bridge construction (the Ondřejnice, channel width = 11.5 m, left-side bar, straight section); (D) stone rockfill and grade control structure (the Ondřejnice, channel width = 11.5 m, right-side bar, straight section). Source: Author.
A B
C D
measurements, a wooden frame of 75 × 100 cm under which dots were placed in each corner was used to identify the four control points. After removal of the frame, the gravel bar surface was photographed above the centre so that the dots were clearly visible in the corners of the photo.
Photographs (13MP camera, 72 dpi 3120 × 4160 photos) were taken of the frontal, central and distal sections near the water level. A total of 15 gravel bars with 43 sites were measured on the Lubina River, where one site was measured in only one place due to the small planar area of the bar. Bars were measured
at least every 1 kilometer of the river length with a few exceptions on the Lubina where the bar number was fewer and more clustered. Sixteen gravel bars with 48 sites were measured on the Ondřejnice River. The channel width was measured using a laser range-finder along the axis perpendicular to the bank and intersecting the centre of each gravel bar. Additional data were collected as GPS positioning, type and posi-tion of gravel bars and the vegetation cover accord-ing to Braun-Blanquet (1932) cover-abundance scale (Table 1). The vegetation mostly consisted of bunch-es of herbaceous vegetation remnants, since the field

234 Adriana Holušová, Tomáš Galia
work took place in February. For a better understand-ing of the sediment grain-size disruptions and possi-ble links with fluxes of sediment, the relative position of the bars between grade control structures, adja-cent hillslopes areas and significant tributaries were mapped and observed in the field.
2.3 Data analysis
Photographs for photo-granulometry were further processed using the Digital Gravelometer software (version 1.0). This program is designed for process-ing digital photographs of fluvial sediments to ana-lyse their grain size and distribution on the surface (Graham 2005). This method is less time-consuming than other methods of grain-size data collection, such as the Wolman pebble count method (Wolman 1954), which requires manual collection and measurement
of sediments. In the Digital Gravelometer program, the “finer than” option was selected for the grain per-centile calculation, followed by the “Grid-by-number” option for the distribution calculation. The grain-size unit was millimetres, and the lower truncation was set to 8 mm for all images. From the analytical report data, the statistical value of the geometric sorting and the percentiles D16, D50 and D84 were used. The average values of the grain-size percentiles of the frontal, central and distal parts of the bars were used for graphs of the downstream trends of the rivers.
Correlation analysis was calculated between the channel width data and respective percentiles from all measured parts of gravel bars. All data were test-ed for normality by the Shapiro-Wilk test, and after-wards, the Spearman correlation coefficient (with sig-nificance level of 0.05) for selected data series of both rivers was calculated.
Fig. 3 The process of photo analysis in Digital Gravelometer software; (A) Grayscale; (B) Transformed; (C) Grains; (D) Watershed segmented grains; (E) Grains selected; (F) Grayscale image overlaid on grains selected. Images source: Digital Gravelometer software; Data source: author.
A B
C D
E F

Downstream fining trends of gravel bar sediments 235
Tab. 1 Basic information and collected data for individual gravel bars.
IDRiver
kilometerChannel
width (m)Position
in the channelFlow section
Vegetation cover (Braun-Blanquet)
Relative position before-after the *GCS (m)
L1 0.8 25.0 RB CS 2
L2 2.0 22.0 RB CS 3
L3 5.7 16.0 LB CS + 330–700
L4 11.6 17.5 RB CS 1 200–40
L5 12.7 16.0 LB CS 1 300–100
L6 13.5 15.5 RB CS 2 420–410
L7 18.0 24.5 RB CS 1 50–900
L8 18.1 22.0 RB CS 3 510–14
L9 19.9 27.0 LB CS 2 700–500
L10 25.0 16.5 RB SS 4 750–400
L11 30.0 6.5 LB SS + –400
L12 30.5 8.0 LB CS 4
L13 32.5 9.0 LB CS +
L14 33.7 8.0 RB CS 1 15–
L15 33.8 9.0 MB CS + –3
O1 0.5 15.0 LB CS 1
O2 0.9 13.0 LB CS 3
O3 1.3 11.0 LB SS 2 820–
O4 3.5 10.5 LB CS 2 1600–1500
O5 5.6 9.0 RB SS 4 680–660
O6 7.2 8.5 LB SS + 960–600
O7 9.0 8.5 RB SS 1 60–800
O8 11.3 11.0 RB SS 1 35–370
O9 12.5 13.0 LB CS 1 1700–320
O10 13.5 12.0 RB CS 2 570–100
O11 15.8 11.5 LB SS + 60–220
O12 16.9 12.5 RB SS 1 140–1400
O13 18.7 10.5 LB CS 1 –1600
O14 20.6 8.0 RB CS 3
O15 22.2 9.5 LB SS 2
O16 22.4 11.5 RB SS 3
O – The Ondřejnice River, L – The Lubina river, [MB] mid-channel bar, [RB] right-side bar, [LB] left-side bar, [CS] curve, [SS] straight, *GCS = grade control structures Source: Author
3. Results
The comparison of grain-size of D50 between the stud-ied rivers showed that the values were in most cases higher for the Ondřejnice River which is supported by median values for the frontal, central and distal parts of the bars (Table 2). Sorting values (Figure 4) ranged very similarly on both rivers: 0.65–1.32 Φ (Phi) on the Lubina River and 0.67–1.32 Φ on the Ondřejnice River, which according to Folk and Ward (1957) corresponds to moderately well sorted to poorly sorted sediment. The sorting of sediment on graph (Figure 4) showed a highly fluctuating trend in the Ondřejnice case while the Lubina showed a more
gradual downward trend from poorly sorted to mod-erately well sorted sediment towards the river mouth.
The graphs (Figures 5 and 6) show the trends of average values for the frontal, central and distal parts of the bars and respective channel widths along with information about the location of adjacent hillslopes areas (Štramberk Highlands), significant tributaries and grade control structures. The downstream trend of grain size in both rivers showed rather complex patterns (particularly in the Lubina River case), but gradually decreasing exponential trends represent-ing the downstream fining process were found for D50 and D84 in both rivers. The highest average val-ues were detected at river km 32 in the Lubina River

236 Adriana Holušová, Tomáš Galia
(D84 = 100.36) and at river km 19 in the Ondřejnice River (D84 = 95.52).
According to the exponential trends in D50 and D84, decreasing grain size for both rivers is rela-tively high and regular. For the Lubina River (stud-ied reach length is 33 km), the fining coefficient for D50 equals 0.026 mm km−1 (R2 = 0.70), and for D84, it equals 0.032 mm km−1 (R2 = 0.88). The results for the Ondřejnice River (studied reach length is 22 km) show even higher reduction as the fining coefficient for D50 equals 0.033 mm km−1 (R2 = 0.66) and for D84 is equal to 0.036 mm km−1 (R2 = 0.63).
The patterns of graph trends show some sud-den changes in grain sizes (discontinuities), which indicate various interventions to the channel. In the Lubina River, despite the numbers of significant trib-utaries (Figure 5), there is no visible link between the discontinuities and these possible sources of sedi-ment. In the Ondřejnice River, such discontinuities are more frequent, and they can be possibly caused by sediment supply from tributaries or slope-chan-nel coupling (Figure 6). The observed vegetation cover of the bars (Table 1) showed increased cover-age mainly in 18th, 25th and 30.5th river km in the Lubina and from 0.9th, 5.6th, 20.6th and 22.4th riv-er km in the Ondřejnice which may cause increased tendency to deposit finer fractions. When combined with graphs, it can explain some discontinuities, for example, there is a decrease in grain size in the gravel bar of 30.5th river km, where the coverage according
to Braun-Blanquet is class 4 (51–75%). However, in some cases, the grain-size on the respective gravel bars is higher which can be associate with sediment reinforcement by roots and higher flow rates. The final factor is the grade control structures which can cause decreased longitudinal connectivity. There is a very high number of check dam structures main-ly in the Lubina case. Approximately from the 30th to 24th river km and from 21st to 5th river km are dense sequences of check dams where only a few dis-continuities corresponded with increased grain-size of sediment (11.6th and 18th river km). The check dam sequences on the Ondřejnice (approx. 18th to
Tab. 2 The grain size of sediments (D50) and median values for studied parts of bars.
Lubina Ondřejnice
Riverkm
D50 Riverkm
D50
Frontal Central Distal Frontal Central Distal
33.8 24.7 31.3 31.2 22.4 29.4 50.5 43.4
33.7 40.9 48.8 62.5 22.2 33.9 39.2 42.4
32.5 43.9 52.9 62.7 20.6 45.9 52.0 40.4
30.5 19.1 40.3 30.6 18.7 42.8 44.2 42.0
30.0 44.2 41.4 37.9 16.9 35.2 48.8 39.8
25.0 47.2 39.0 35.4 15.8 28.9 24.7 31.6
19.9 27.6 26.2 33.6 13.5 30.8 35.8 27.4
18.1 28.0 31.3 25.4 12.5 26.3 29.7 26.4
18.0 29.2 17.2 17.6 11.3 34.7 34.4 26.1
13.5 21.3 22.4 19.4 9.0 26.2 27.1 23.1
12.7 21.0 18.7 21.8 7.2 37.6 34.7 33.2
11.6 23.8* 23.8* 23.8* 5.6 30.7 36.1 27.9
5.7 18.0 19.2 18.6 3.5 18.6 16.7 17.6
2.0 20.8 23.2 15.9 1.3 25.8 25.4 26.0
0.8 22.4 20.7 19.4 0.9 27.4 26.9 23.4
0.5 25.1 18.8 19.3
median 26.2 28.8 28.0 30.0 34.5 27.6
* The same value is due to the small planar area of the bar (only one sample photo). Source: Author
Fig. 4 Trends of sediment sorting (Folk-Ward) for both rivers. Source: Author.

Downstream fining trends of gravel bar sediments 237
15th river km and 14th to 10th river km) showed sim-ilarly only two cases of disruption of the downstream fining trend (11.3rd and 7.2nd river km) (Figure 6). In most cases, the area of sequenced check dams in the rivers did not affect the rapid downstream fining trends.
In the case of channel widths, similar tendencies can be observed on both rivers. Close the headwater areas, the widths are approximately 10 m. Thereaf-ter, channel widths start to increase, moderately on the Ondřejnice (11–13 m) and rapidly on the Lubina (16.5–24.5 m). From approximately river km 14 on the Lubina River and river km 10 on the Ondřejnice River, channel widths start to moderately decrease down-stream as the result of channel regulation works. Near the confluence with the Oder River, channel width values increase again (25 m for the Lubina; 15 m for the Ondřejnice). Overall, the channel widths range between 8 and 15 m on Ondřejnice and between 6.5 and 27 m on Lubina.
The distribution of the coarsest D50 within the three studied areas of the gravel bars (Table 3) shows relatively high spatial variation. On both rivers there exists a predominance for the coarsest sediments (D50) to deposit in the central parts of the gravel
bars. The coarsest D50 on the Lubina is equally fre-quent on distal and frontal parts of the bars. Compar-ing the results on the Ondřejnice, the distribution of the coarsest D50 also shows the most frequent depo-sition in the central parts, with a notable increasing frequency towards the upstream direction (Figure 7).
In contrast, in downstream parts of the river, coarse deposits are more frequent in the frontal parts of bars. The least frequent deposition of the highest D50 is observed in the distal part of the bars.
The correlation was tested between the channel width data and the percentiles from all parts of the
Fig. 5 The trend of grain size on gravel bars at the Lubina River. Source: Author.
Fig. 6 The trend of grain size on gravel bars at the Ondřejnice River. Source: Author.
Tab. 3 Comparison of the rivers; distribution of the highest D50 on gravel bars from the source to the river mouth.
Lubina river source → river mouth
D50*
Ondřejnice river source → river mouth
D50*
frontal bar central bar distal bar
* The highest value. Source: Author

238 Adriana Holušová, Tomáš Galia
gravel bars. These calculations were used to test the relationship between the channel width and the grain size of sediments (i.e., fining of sediments with increas-ing channel width). The negative trend is confirmed in most tested cases (Table 4). The correlation results for the Lubina show a significant negative correlation mostly in the central parts of the bars in all percen-tiles (D16 rs = −0.54; D50 rs = −0.61; D84 rs = −0.67) and partially in the distal parts in D50 (rs = −0.54) and D84 (rs = −0.70). The results for the Ondřejnice show only one significant correlation in frontal parts
and D16 percentiles (rs = −0.56). Although there is a single significant correlation in this river, most data show a tendency for a negative relationship.
4. Discussion
4.1 Trends and variations of the downstream fining process
The downstream fining process was studied in terms of Sternberg’s (1875) hypothesis of the exponential fining trend, and according to results from the stud-ied heavily regulated rivers, there are regular down-stream fining trends, particularly for the D84 per-centiles: fining coefficient = 0.032 mm km−1 for the Lubina and 0.036 mm km−1 for the Ondřejnice. The percentiles of D50 show similar results with slightly lower coefficients of determination: fining coefficient = 0.026 mm km−1 for the Lubina and 0.033 mm km−1 for the Ondřejnice. The downstream fining coefficient, as well as the D50 percentile values and median of grain-size of sediment on the bars, is in most stud-ied locations higher for the Ondřejnice River. These results are in accordance with those of other studies that observed more evident downstream reduction at the highest percentiles (Seal et al. 1997; Gomez et al. 2001). In general, the highest downstream reduction is often found in aggrading rivers, headwater streams or braided rivers (Galia et al. 2015; Bradley et al. 1972; Brierley and Hickin 1985; Dawson 1988; Pao-la and Seal 1995; Surian 2002), which is not the case for the rivers in this study. Our results also underline the rapid fining of bar sediments in the case of chan-nelized rivers. Similar values of the fining coefficient have been observed in some Poland rivers of West Carpathians such as the Soła River (fining coefficient = 0.032 mm km−1, study reach of 25 km) and Skawa River (fining coefficient = 0.036 mm km−1, study reach of 21 km) both with multiple and single channel pat-terns (Malarz 2004).
In the case of the identified discontinuities and their associated causes on the studied rivers, there are surprisingly different results for each river. The longer Lubina River has a higher number of signifi-cant tributaries; nonetheless, the tributaries do not
Tab. 4 Correlation between the channel width and grain-size percentiles.
Frontal Bar Central Bar Distal Bar
D16 D50 D84 D16 D50 D84 D16 D50 D84
Lubina rs/p-value
0.045 p = 0.874
−0.118 p = 0.680
−0.167 p = 0.553
−0.543 p = 0.036
−0.614 p = 0.015
−0.670 p = 0.006
−0.365 p = 0.180
−0.541 p = 0.037
−0.697 p = 0.004
Ondřejnice rs/p-value
−0.545 p = 0.029
−0.397 p = 0.128
−0.167 p = 0.536
−0.210 p = 0.435
−0.3203 p = 0.226
−0.278 p = 0.298
−0.24945 p = 0.352
−0.26421 p = 0.323
−0.24797 p = 0.354
negative significant/non-significant positive significant/non-significant
Source: Author
Fig. 7 Diagram of the simplified deposition trends of the coarsest D50 sediments in the studied rivers; (A) The Lubina (main type = point bars), near the river source are the most frequent the central and distal parts of the bars, in the middle of the river the frontal parts start to show more frequently, near the river mouth the central parts are the most frequent; (B) The Ondřejnice (main type = alternate bars), the central parts of the bars are the most frequent in the upstream section while the frontal parts of the bars are more frequent downstream. Source: Author.

Downstream fining trends of gravel bar sediments 239
contribute to any significant change in the gran size of the gravel bars. Tributaries can also act as sources of both coarse and fine sediment, where finer sediment may be carried away by the river almost immediately if the river tends to have higher flow rates than the tributary (Škarpich et al. 2013), which may be the case. On the other hand, the Ondřejnice River has only one significant tributary, which correspond with an increase in grain size in this locality downstream from river km 11. Another source of coarse material most likely originated from the hillslopes in contact with riverbanks within the area of the Štramberk High-lands (river km 19–22) where the grain-size starts to increase. Compared to the Ondřejnice, there is no evident association with any tributary or adjacent hillslopes in the Lubina.
The vegetation cover can be the factor for minor shifts in grain-size trends such is the decreased grain-size on the bar in the 30.5th river km in the Lubina. However, the vegetation cover can cause either the deposition of finer sediment or the stabilization of coarser bar sediment (Wohl 2004; Corenblit et al. 2009). Therefore, it is difficult to link the trends of grain-size to the studied bars, moreover, when other factors (downstream fining process, longitudinal con-nectivity) must be considered (McMahon et al. 2020). In terms of the longitudinal connectivity, the grade control structures (check dams) are often located in sequences on both rivers (the Lubina: 30th to 24th river km, 21st to 5th river km; the Ondřejnice: 18th to 15th river km, 14th to 10th river km) and they corresponded surprisingly well to rapid downstream fining trends with a few exceptions. Increased grain-size trends below the check dam were detected at the 11th and 7th river km on the Ondřejnice and the 11.6th and 18th (only for the coarsest fraction) riv-er km on the Lubina. These results correspond to the principle of disconnectivity caused by barriers in the river channel (Škarpich et al. 2010). The small num-ber of detected disconnections are most likely due to the natural lack of bars towards the headwater area as well as the total number of studied bars. Nevertheless, the data showed that in most areas the downstream fining is not affected by grade control structures. Nat-urally, there may exist other possible causes that are not investigated in this study such as local downward and lateral erosion or channel slope.
4.2 Trends in the deposition of sediments on the surfaces of gravel bars
The size-dependent deposition of the coarsest D50 percentiles within the gravel bar surface shows great variability throughout the Lubina and a more gradual change in the case of the Ondřejnice. Both rivers show the most frequent depositional tendency of the coars-est D50 in the central parts of the bars. Additionally, the results for the Ondřejnice show a clear trend of the most frequent deposition in the central parts of
the bars in the middle and upper river reaches and frequent deposition on the frontal parts in the down-stream river reach. The deposition of the finest D50 on the distal parts is consistent with a common pre-sumption that finer material tends to settle gradually behind the coarser sediment (Ashworth and Ferguson 1986; Bluck 1982; Smith 1974). The predominance of deposition of finer or coarser sediments in certain parts of the bars can be related to the different rough-ness conditions on the gravel bars, e.g., caused by growing vegetation (Li et al. 2014). However, there is no predominant type of deposition of D50 associated with the vegetation cover of the bars in the collect-ed data. In the Lubina case, there are also the central parts of the bars the most frequent (mainly in the downstream area). The frontal and distal parts of the gravel bars were equally frequent. However, the dep-osition tendency of the frontal parts is higher within the middle area of the river.
4.3 Trends in the deposition of bar sediments by channel width
The range of values for channel widths on the Ondře-jnice is much lower (8–15 m) than that on the Lubina, which shows very sudden changes from wide to nar-row channels. This variability is probably the effect of artificial structures such as check dams or bridg-es located in the river or other human interventions. Compared to the Ondřejnice, the river is regulated particularly with respect to channel width since it flows through many built-up areas, and the river is often channelized to constant width. The correlations between channel widths and grain sizes of sediments show very different results for each river. In the Lubi-na, significant negative correlations are recorded for 5 of 9 cases. These correlations are observed mainly in the central parts (D16 rs = −0.54; D50 rs = −0.61; D84 rs = −0.67) and in the distal parts of the bars (D50 rs = −0.54; D84 rs = −0.70). However, the Ondřejnice shows only one case of significant negative correla-tion in frontal parts (D16 rs = −0.5). These results indicate the existence of a strong negative relation-ship between the channel width and sediment grain size in the Lubina River, while Ondřejnice shows a weak negative relationship. Again, these results can be assigned to frequent river regulations, particularly in the Ondřejnice, and to the fact that such rivers tend to show higher variability of sediment size, frequently due to their many different sources (Škarpich 2010; Rice 1998; Rengers and Wohl 2007).
5. Conclusion
In this paper, we focused mainly on the downstream fining process, secondarily on the trends in grain siz-es deposition on the frontal, central and distal parts of the gravel bars and thirdly, on the relationship

240 Adriana Holušová, Tomáš Galia
between the grain-size of the bars and channel width variations in the two channelized gravel-bed rivers. Trends of downstream fining showed a relatively high reduction in grain size in both studied rivers, where reduction coefficients were comparable to values observed along some of the single and multi-ple threaded rivers in the Western Carpathians. The results showed that a rapid reduction in sediment size is often observed even on highly regulated rivers such as the Ondřejnice. We also observed the trend of deposition of finer sediment in wider channels in the case of the less regulated river while there was almost no relationship in the heavily regulated river. The predominant deposition of the coarsest sediment D50 on the gravel bars occurred on the central parts of the bars, in contrast with the general tendency of coarse sediment to be deposited on the frontal parts, as observed in natural streams. The disruption of the downstream fining trend corresponded with the grade control structures only in a few cases, probably due to the total number of studied gravel bars. In most cases, the downstream fining was not affected by check dams. The significant tributaries and adjacent hillslopes were suggested as the possible sources of disruption, however, only in the case of the Ondřejnice River. Compared to the Ondřejnice River, the Lubina River showed that despite the high number of signifi-cant tributaries, disruption did not necessarily occur.
References
Ashworth, P. J., Ferguson, R. I. (1989): Size-selective entrainment of bedload in gravel bed streams. Water Resources Research 25(4), 627–634, https://doi.org /10.1029/WR025i004p00627.
Ashworth, P. J., Ferguson, R. I. (1986): Inter-relationships of channel processes, changes and sediments in a proglacial braided river. Geografiska Annaler: Series A, Physical Geography 68(4), 361–371, https://doi.org/10.1080 /04353676.1986.11880186.
Bluck, B. J. (1982): Texture of gravel bars in braided streams. In Hey, R. D., Bathurst, J. C. and Thorne, C. R., editors, Gravel-bed rivers: fluvial processes, engineering and management, Chichester: Wiley, 339–355, https://doi.org/10.1002/esp.3290080619.
Borák, L. (2018): The quantity and attributes of woody accumulations in the Moravskoslezské Beskydy Mountains Streams, AUC Geographica 53(1), 20–35, https://doi.org/10.14712/23361980.2018.3.
Bradley, W. C., Fabnstock, R. K., Rowekamp, E. T. (1972): Coarse sediment transport by flood flows on Knik River, Alaska. Geological Society of America Bulletin 83, 1261–1284, https://doi.org/10.1130/0016-7606 (1972)83[1261:CSTBFF]2.0.CO;2.
Braun-Blanquet, J. (1932): Plant sociology (Transl. G. D. Fuller and H. S. Conrad). McGraw-Hill, New York, 539.
Bridge, J. S., Jarvis, J. (1976): Flow and sedimentary processes in the meandering river South Esk, Glen Cova, Scotland. Earth Surface Processes 1, 303–336, https://doi.org/10.1002/esp.3290010402.
Brierley, G. J., Hickin, E. J. (1985): The downstream gradation of particle sizes in the Squamish River, British Columbia. Earth Surfaces Processes and Landforms 10, 597–606, https://doi.org/10.1002/esp.3290100607.
Corenblit, D., Steiger, J., Gurnell, A. M., Tabacchi, E., Roques, L. (2009): Control of sediment dynamics by vegetation as a key function driving biogeomorphic succession within fluvial corridors. Earth Surface Processes and Landforms 34, 1790-1810, https:// doi.org/10.1002/esp.1876.
Dawson, M. (1988): Sediment size variation in a braided reach of the Sunwapta River, Alberta, Canada. Earth Surfaces Processes and Landforms 13, 599–618, https://doi.org/10.1002/esp.3290130705.
Demek, J., Mackovčin, P. (2006): Zeměpisný lexikon ČR: Hory a nížiny (2nd ed.). Agentura ochrany přírody a krajiny ČR, Brno.
Edwards, P. J., Kollmann, J., Gurnell, A. M., Petts, G. E., Tockner, K., Ward, J. V. (1999): A conceptual model of vegetation dynamics on gravel bars of a large Alpine river. Wetlands Ecology and Management 7, 141–153, https://doi.org/10.1023/A:1008411311774.
Faustini, J. M., Jones, J. A. (2003): Influence of large woody debris on channel morphology and dynamics in steep, boulder-rich mountain streams, western Cascades, Oregon. Geomorphology 51, 187–205, https://doi.org /10.1016/S0169-555X(02)00336-7.5901.
Folk, R. L., Ward, W. C. (1957): Brazos River Bar: A study in the significance of grain size parameters. Journal of Sedimentary Petrology 27, 3–26, http://dx.doi.org/10.1306/74D70646-2B21-11D7-8648000102C1865D.
Galia, T., Hradecký, J. (2014): Estimation of bedload transport in headwater streams using a numerical model (Moravskoslezké Beskydy Mts, Czech Republic). AUC Geographica 49(1), 21–31, https://doi.org /10.14712/23361980.2014.3.
Galia, T., Škarpich, V., Hradecký, J. (2015): Connectivity of the coarsest fraction in headwater channels: imprints of fluvial processes and debris-flow activity. Geografiska Annaler: Series A, Physical Geography 97(3), 437–452, https://doi.org/10.1111/geoa.12086.
GEOCR50 (2015): Praha: Česká geologická služba [cartographer]. Geologická mapa České republiky [map] 1 : 50 000. Retrieved from: https://mapy.geology.cz /geocr50/.
Graham, D. J., Reid, I., Rice, S. P. (2005): Automated Sizing of Coarse-Grained Sediments: Image-Processing Procedures. Mathematical Geology 37, 1–28, https:// doi.org/10.1007/s11004-005-8745-x.
Gomez, B., Rosser, B. J., Peacock, D. H., Hicks, D. M., Palmer, J. A. (2001): Downstream fining in a rapidly aggrading gravel bed river. Water Resources Research 37(6), 1813–1823, https://doi.org/10.1029/2001WR900007.
Gordon, D. N., Mcmahon, A. T., Finlayson, L. B., Gippel, J. Ch., Nathan, J. R. (2004): Stream Hydrology, An Introduction for Ecologist. Second Edition. John Wiley and Sons, Ltd., Chichester.
Heitmuller, F., Hudson, P. (2009): Downstream trends in sediment size and composition of channel-bed, bar, and bank deposits related to hydrologic and lithologic controls in the Llano River watershed, central Texas, USA. Geomorphology 112(3–4), 246–260, http://dx.doi .org/10.1016/j.geomorph.2009.06.010.
Downstream fining trends of gravel bar sediments 241
Howson, T. J., Robson, B. J., Matthews, T. G., Mitchell, B. D. (2012): Size and quantity of woody debris affects fish assemblages in a sediment-disturbed lowland river. Ecological Engineering 40, 144–152, https://doi.org /10.1016/j.ecoleng.2011.12.007.
Hradecký, J., Škarpich, V., Galia, T., Gurkovský, V., Vaverka, L. (2019): Štěrky, štěrky, štěrky… (ne)valící se kameny po Labi. Ochrana Přírody, 2.
CHI (2017): Czech Hydrometeorological Institute, Hydrological list of detailed catchment division of streams in the Czech Republic [PDF file]. Retrieved from: http://voda.chmi.cz/hr05/seznamy/hsp.pdf.
Chiari, M., Rickenmann, D. (2011): Back-calculation of bedload transport in steep channels with a numerical model. Earth Surface Processes and Landforms 36, 805–815, https://doi.org/10.1002/esp.2108.
Chlupáč, I., Brzobohatý, R., Kovanda, J., Stráník, Z. (2002): Geologická minulost České republiky. Academia, Praha.
Church, M., Kellerhals, R. (1978): On the statistics of grain size variation along a gravel river. Canadian Journal of Earth Sciences 15, 1151–1160, https://doi.org/10.1139 /e78-121.
Ikeda S., Izumi N. (1990): Width and depth of self-formed straight gravel rivers with bank vegetation. Water Resources Research 26, 2353–2364, https://doi.org /10.1029/WR026i010p02353.
Jackson, R. G., (1976): Largescale ripples of the lower Wabash River. Sedimentology 23, 593–623, https:// doi.org/10.1111/j.1365-3091.1976.tb00097.x.
Kaczka, R. (1999): Dynamics of production, movement and storage of coarse woody debris during the flood of the July 1997. Kamienice Lacka Valley, Beskidy Mts., Poland. 3rd Domodis workshop – Documentation of mountains disasters, Bucharest, 1–6.
Knighton, A. D. (1980): Longitudinal changes in size and sorting of stream-bed material in four English rivers. Geological Society of America bulletin 91, 55–62, https://doi.org/10.1130/0016-7606(1980)91<55: LCISAS>2.0.CO;2.
Kříž, V. (1995): Ochrana vod a vodní hospodářství Beskyd. Nadace Beskydy, Ostrava.
Li, Z., Wang, Z., Pan, B., Zhu, H., Li, W. (2014): The development mechanism of gravel bars in rivers. Quaternary International 336, 73–79, https://doi.org /10.1016/j.quaint.2013.12.039.
Lunt, I .A., Bridge, J. S., (2004): Evolution and deposits of a gravelly braid bar, Sagavanirktok River, Alaska. Sedimentology 51, 415–432, https://doi.org/10.1111 /j.1365-3091.2004.00628.x.
McMahon, J. M., Olley, J. M., Brooks, A. P., Smart, J. C. R., Stewart-Koster, B., Venables, W. N., Curwen, G., Kemp, J., Stewart, M., Saxton, N., Haddadchi, A., Stout, J. C. (2020): Vegetation and longitudinal coarse sediment connectivity affect the ability of ecosystem restoration to reduce riverbank erosion and turbidity in drinking water. Science of the Total Environment 707, https:// doi.org/10.1016/j.scitotenv.2019.135904.
Malarz, R. (2005). Effects of flood abrasion of the Carpathian alluvial gravels. Catena 64(1), 1–2, https://doi.org/10.1016/j.catena.2005.07.002.
Paola, C., Seal, R. (1995): Grain size patchiness as a cause of selective deposition and downstream fining, Water Resources Research 31(5), 1395–1407, https:// doi.org/10.1029/94WR02975.
Parker, G., Andrews, E.D. (1985): Sorting of bedload sediments by flow in meander bends. Water Resources Research 21(9), 1361–1373, https://doi.org/10.1029 /WR021i009p01361.
Povodí Odry (2016): Atlas hlavních vodních toků povodí Odry. Retrieved from: https://www.pod.cz/atlas_toku/.
Pyrce, R. S., Ashmore, P. E. (2005): Bedload path length and point bar development in gravel-bed river models. Sedimentology 52(4), 839–857, https://doi.org /10.1111/j.1365-3091.2005.00714.x.
Rengers, F., Wohl, E. (2007): Trends of grain sizes on gravel bars in the Rio Chagres, Panama. Geomorphology 83 (3–4), 282–293, https://doi.org/10.1016/j.geomorph .2006.02.019.
Rice, S. (1999): The nature and controls on downstream fining within sedimentary links. Journal of Sedimentary Research 69(1), 32–39, https://doi.org/10.2110/jsr .69.32.
Rice, S. (1998): Which tributaries disrupt downstream fining along gravel-bed rivers? Geomorphology 22, 39–56, https://doi.org/10.1016/S0169-555X (97)00052-4.
Rice, S., Church, M. (1996): Bed material texture on low order streams in the Queen Charlotte Islands, British Columbia. Earth Surface Processes and Landforms 21, 1–18, https://doi.org/10.1002/(SICI)1096 -9837(199601)21:1<1::AID-ESP506>3.0.CO;2-F.
Seal, R., Paola, C., Parker, G., Southard, J. B., Wilcock, P. R. (1997): Experiments on downstream fining of gravel. 1. Narrow-channel runs. Journal of Hydraulic Engineering 123(10), 874–884, https://doi.org /10.1061/(ASCE)0733-9429(1997)123:10(874).
Smith, N. D. (1974): Sedimentology and Bar Formation in the Upper Kicking Horse River, a Braided Outwash Stream. Journal of Geology 82(2), 205–223, https:// doi.org/10.1086/627959.
Sternberg, H. (1875): Untersuchungen über längen- und querprofil geschiebeführender Flüss. Z. Bauwesen 25, 483–506.
Surian, N. (2002): Downstream variation in grain size along an Alpine river: Analysis of controls and processes. Geomorphology 43(1–2), 137–149, https://doi.org /10.1016/S0169-555X(01)00127-1.
Škarpich, V., Galia, T., Ruman, S., Máčka, Z. (2019): Variations in bar material grain-size and hydraulic conditions of managed and re-naturalized reaches of the gravel-bed Bečva River (Czech Republic). Science of the Total Environment 649, 672–685, https://doi.org/10.1016 /j.scitotenv.2018.08.329.
Škarpich, V., Galia, T., Hradecký, J. (2013): Podmínky transportu a akumulace sedimentů v člověkem ovlivněných korytech beskydských toků: příkladová studie soutoku řeky Morávky a Mohelnice. Geologické výzkumy na Moravě a ve Slezsku 19(1–2), 53–58, https://doi.org/10.5817/GVMS2012-1-2-053.
Škarpich, V., Galia, T., Hradecký, J., Peč, J. (2010): Identifikace (dis)konektivit vodních toků za využití makrogranulometrické analýzy korytových sedimentů (Moravskoslezské Beskydy). Geologické výzkumy na Moravě a ve Slezsku 17(1–2), 199–204.
Štefáček, S. (2008): Encyklopedie vodních toků Čech, Moravy a Slezska. Baset, Praha.
Wistuba, M., Sady, A., Poręba, G. (2018): The impact of Wallachian settlement on relief and alluvia composition

242 Adriana Holušová, Tomáš Galia
in small valleys of the Carpathian Mts. (Czech Republic). Catena 160, 10–23, https://doi.org/10.1016/j.catena .2017.08.017.
Wohl, E. (2014): Rivers in the landscape, Science and Management. John Wiley and Sons, Ltd., Chichester.
Wohl, E. (2017): Connectivity in rivers. Progress in Physical Geography: Earth and Environment 41(3), 345–362, https://doi.org/10.1177/0309133317714972.
Wolman, M. G. (1954): A method of sampling of coarse river-bed material. Transaction of the American Geophysical Union 35, 951–956, https://doi.org /10.1029/TR035i006p00951.
Yager, E. M., Kirchner, J. W., Dietrich, W. E. (2007): Calculating bedload transport in steep boulder bed channels. Water Resources Research 43: W07418, https://doi.org/10.1029/2006WR005432.