Download presentation slides here -...
31
1 Download presentation slides here:
Transcript of Download presentation slides here -...

1
Download presentation slides here:
Investor Presentation
Advanced Info Service Plc.
February 2018
Ticker: ADVANC (SET)AVIFY (ADR)
Add AIS IR LINE@
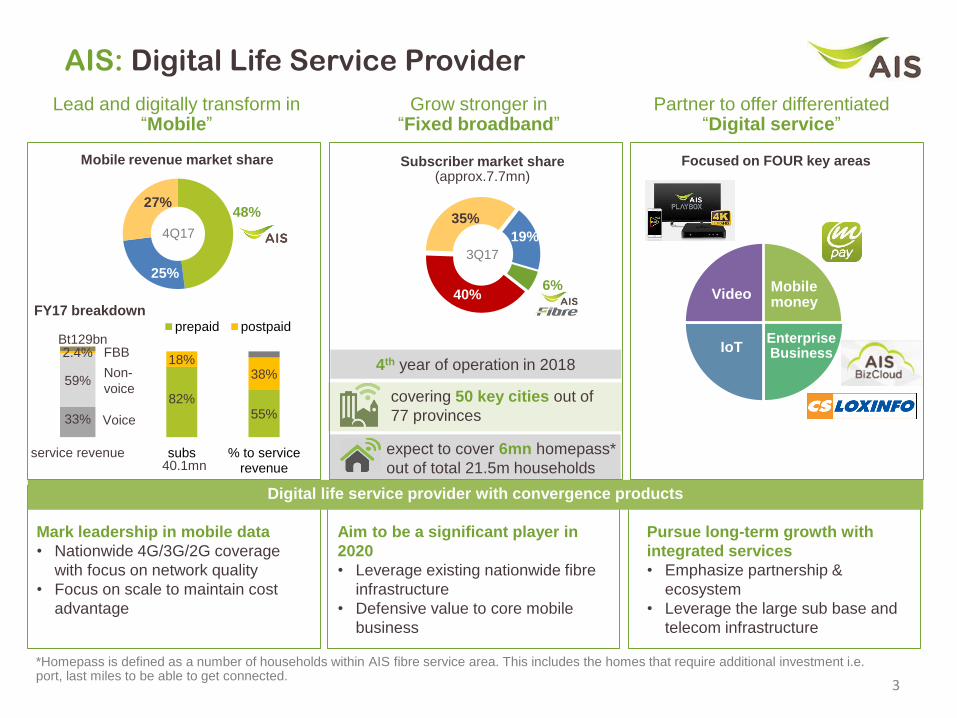
AIS: Digital Life Service Provider
Partner to offer differentiated “Digital service”
Lead and digitally transform in “Mobile”
Grow stronger in“Fixed broadband”
Aim to be a significant player in
2020
• Leverage existing nationwide fibre
infrastructure
• Defensive value to core mobile
business
4th year of operation in 2018
Mark leadership in mobile data
• Nationwide 4G/3G/2G coverage
with focus on network quality
• Focus on scale to maintain cost
advantage
Pursue long-term growth with
integrated services
• Emphasize partnership &
ecosystem
• Leverage the large sub base and
telecom infrastructure
3
Mobile money
IoT
Video
48%
25%
27%
4Q17
Mobile revenue market share
covering 50 key cities out of
77 provinces
expect to cover 6mn homepass*
out of total 21.5m households
Digital life service provider with convergence products
33%
59%
2.4%
service revenue
Bt129bn
Non-
voice
Voice
82%55%
18%38%
subs % to servicerevenue
prepaid postpaid
40.1mn
FY17 breakdown40%
35%
19%
6%
3Q17
*Homepass is defined as a number of households within AIS fibre service area. This includes the homes that require additional investment i.e. port, last miles to be able to get connected.
Subscriber market share(approx.7.7mn)
Focused on FOUR key areas
FBBEnterpriseBusiness
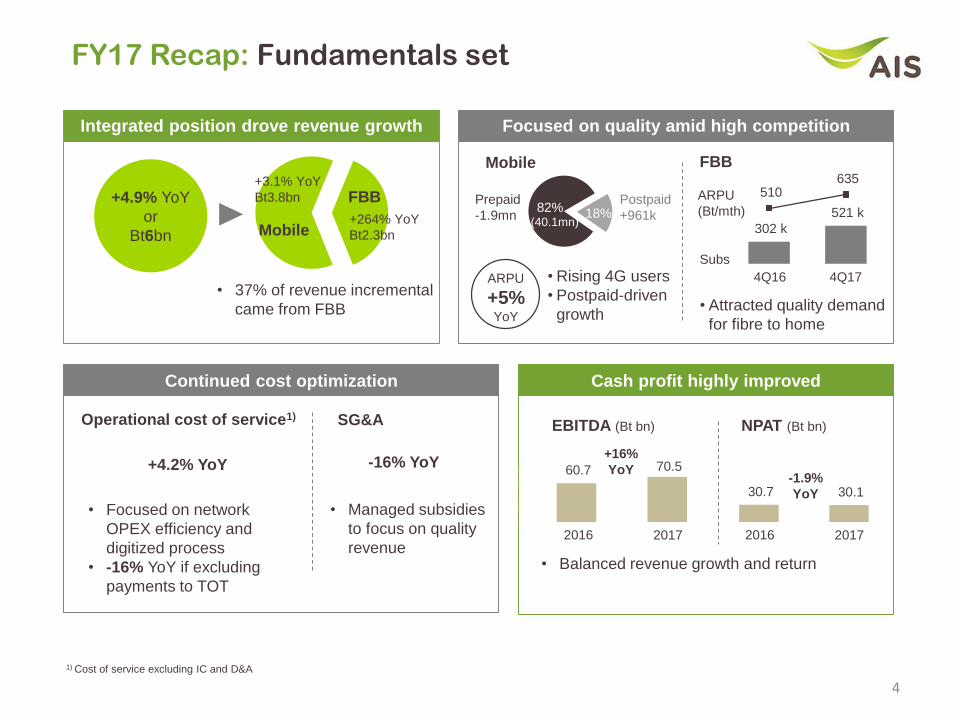
FY17 Recap: Fundamentals set
4
Integrated position drove revenue growth
+4.9% YoY
or
Bt6bn
• 37% of revenue incremental
came from FBB
+3.1% YoY
Bt3.8bn
+264% YoY
Bt2.3bnMobile
FBB
Focused on quality amid high competition
Mobile FBB
Postpaid
+961k18%82%Prepaid
-1.9mn(40.1mn)
302 k
521 k
510 635
-
200
400
600
800
-
200
400
600
800
1,000
1,200
Subs
4Q174Q16
ARPU
(Bt/mth)
Continued cost optimization
Operational cost of service1) SG&A
+4.2% YoY
1) Cost of service excluding IC and D&A
• Focused on network
OPEX efficiency and
digitized process
• -16% YoY if excluding
payments to TOT
-16% YoY
• Managed subsidies
to focus on quality
revenue
Cash profit highly improved
60.7 70.5
-
20.0
40.0
60.0
80.0
EBITDA (Bt bn)
20172016
+16%
YoY
30.7 30.1
20172016
-1.9%
YoY
NPAT (Bt bn)
• Balanced revenue growth and return
ARPU
+5% YoY
• Rising 4G users
• Postpaid-driven
growth• Attracted quality demand
for fibre to home
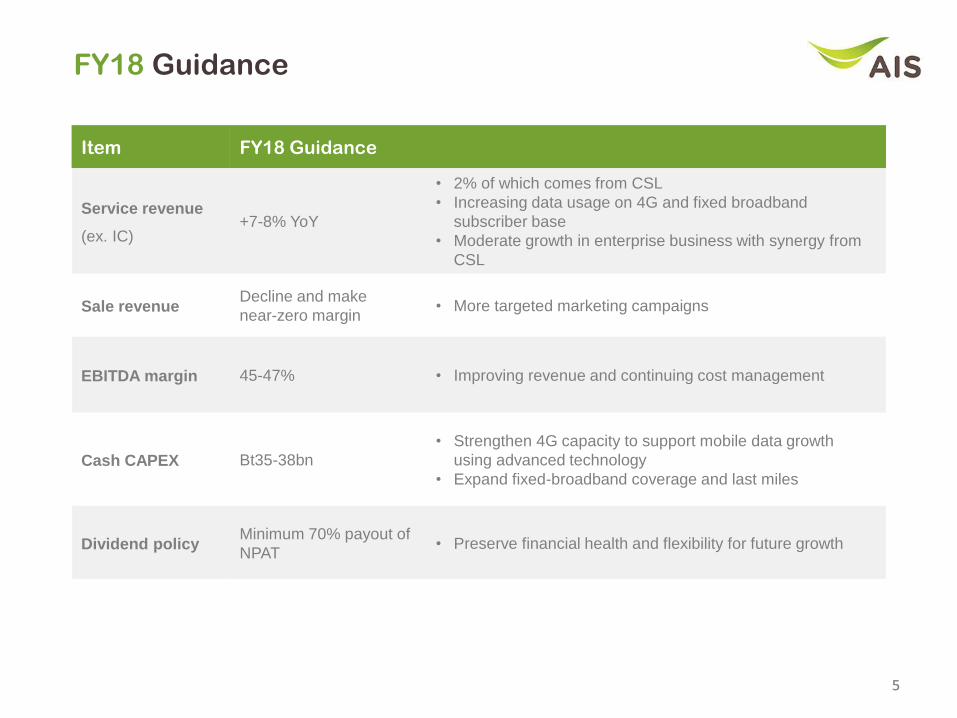
FY18 Guidance
Item FY18 Guidance
Service revenue
(ex. IC)+7-8% YoY
• 2% of which comes from CSL
• Increasing data usage on 4G and fixed broadband
subscriber base
• Moderate growth in enterprise business with synergy from
CSL
Sale revenueDecline and make
near-zero margin• More targeted marketing campaigns
EBITDA margin 45-47% • Improving revenue and continuing cost management
Cash CAPEX Bt35-38bn
• Strengthen 4G capacity to support mobile data growth
using advanced technology
• Expand fixed-broadband coverage and last miles
Dividend policyMinimum 70% payout of
NPAT• Preserve financial health and flexibility for future growth
55
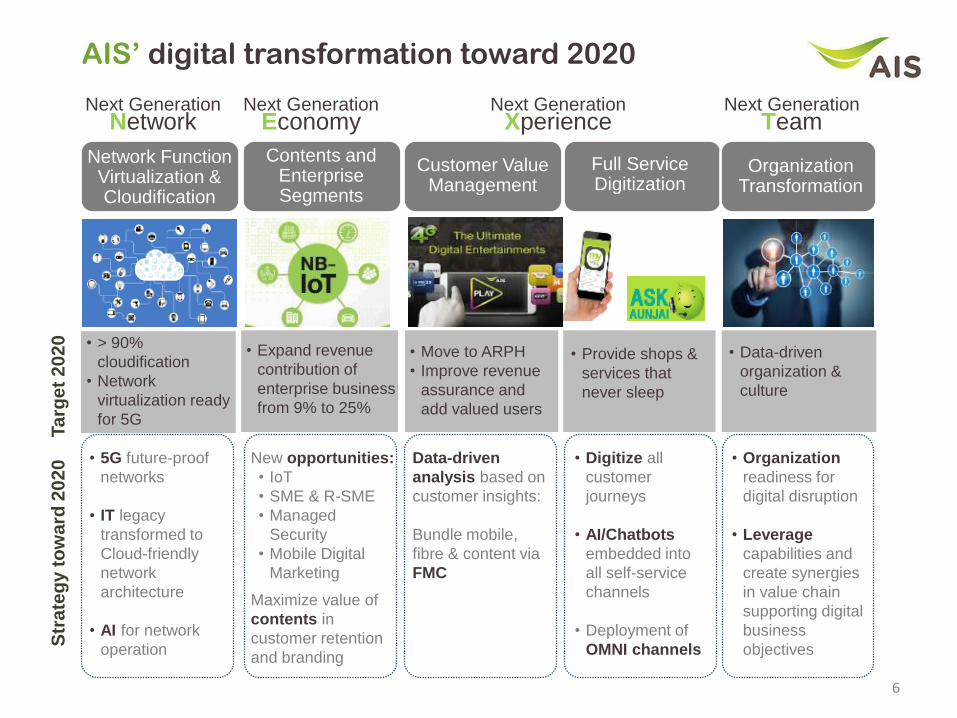
• > 90%
cloudification
• Network
virtualization ready
for 5G
AIS’ digital transformation toward 2020
• Digitize all
customer
journeys
• AI/Chatbots
embedded into
all self-service
channels
• Deployment of
OMNI channels
• 5G future-proof
networks
• IT legacy
transformed to
Cloud-friendly
network
architecture
• AI for network
operation
Data-driven
analysis based on
customer insights:
Bundle mobile,
fibre & content via
FMC
Network Function Virtualization & Cloudification
Customer Value Management
Full Service Digitization
Next Generation Network
New opportunities:
• IoT
• SME & R-SME
• Managed
Security
• Mobile Digital
Marketing
Maximize value of
contents in
customer retention
and branding
Contents and Enterprise Segments
Next Generation Economy
Next Generation Xperience
• Organization
readiness for
digital disruption
• Leverage
capabilities and
create synergies
in value chain
supporting digital
business
objectives
Organization Transformation
Next Generation Team
• Expand revenue
contribution of
enterprise business
from 9% to 25%
• Move to ARPH
• Improve revenue
assurance and
add valued users
• Provide shops &
services that
never sleep
• Data-driven
organization &
culture
Ta
rge
t 2
02
0S
tra
teg
y t
ow
ard
20
20
6
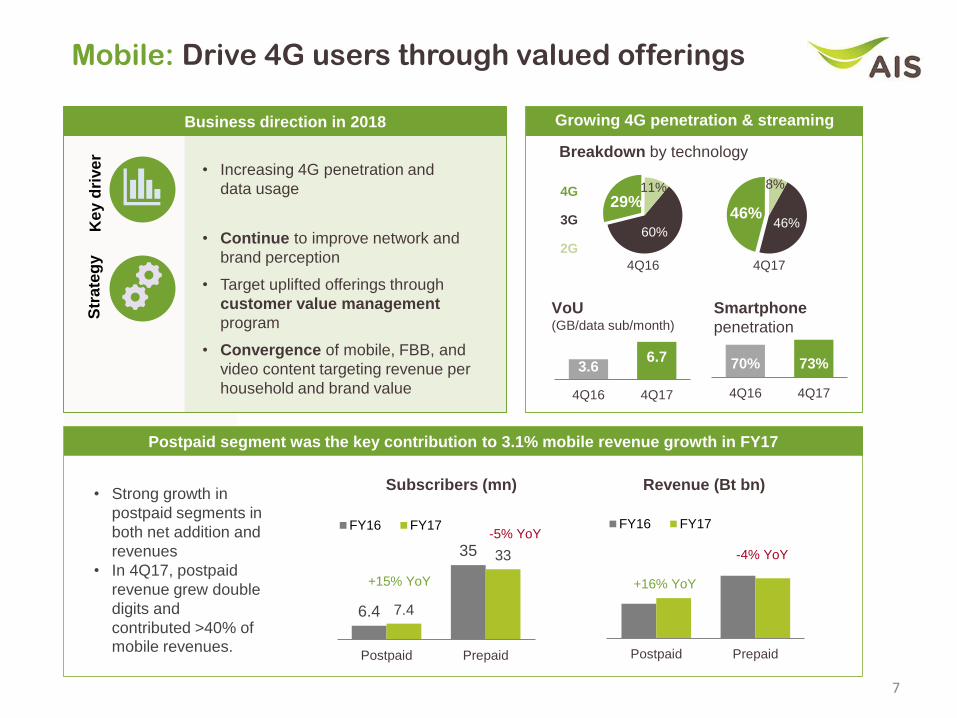
Mobile: Drive 4G users through valued offerings
7
Business direction in 2018
• Increasing 4G penetration and
data usage
Key d
rive
rS
tra
teg
y
• Continue to improve network and
brand perception
• Target uplifted offerings through
customer value management
program
• Convergence of mobile, FBB, and
video content targeting revenue per
household and brand value
3.6 6.7
4Q16 4Q17
Growing 4G penetration & streaming
6.4
35
7.4
33
Postpaid Prepaid
FY16 FY17
+15% YoY
-5% YoY
Postpaid Prepaid
FY16 FY17
Revenue (Bt bn)Subscribers (mn)
+16% YoY
-4% YoY
• Strong growth in
postpaid segments in
both net addition and
revenues
• In 4Q17, postpaid
revenue grew double
digits and
contributed >40% of mobile revenues.
Postpaid segment was the key contribution to 3.1% mobile revenue growth in FY17
VoU(GB/data sub/month)
46%46%
8%
Breakdown by technology
4Q17
60%
29%11%
4Q16
4G
3G
2G
70% 73%
4Q16 4Q17
Smartphone
penetration
Leading network quality and enhance brand perception
8
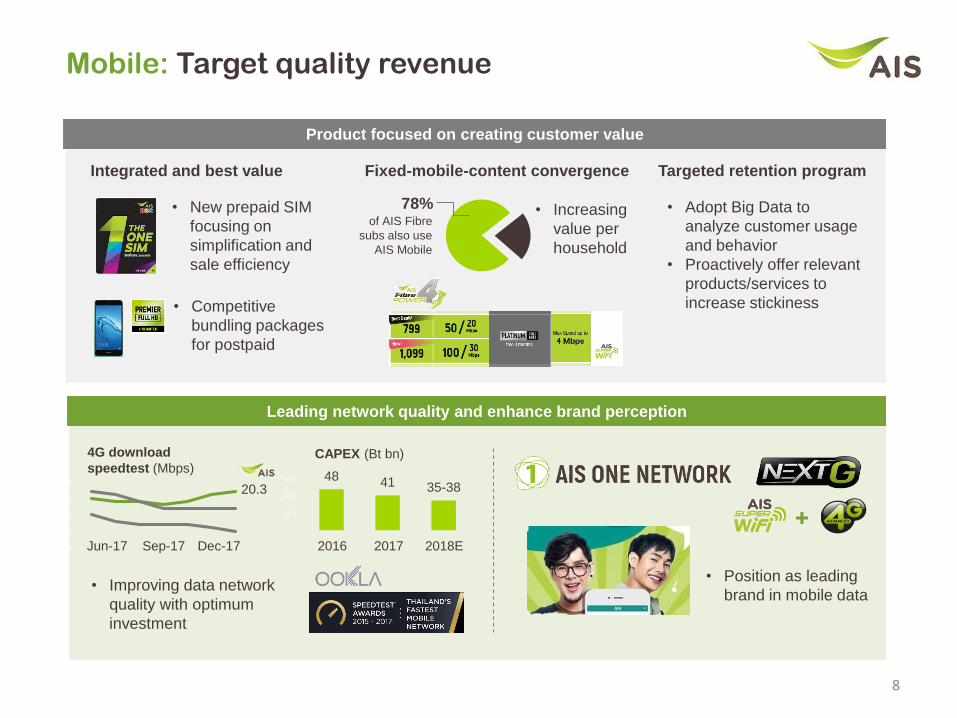
Mobile: Target quality revenue
Product focused on creating customer value
Integrated and best value Targeted retention program Fixed-mobile-content convergence
• Increasing
value per
household
of AIS Fibre
subs also use
AIS Mobile
78% • Adopt Big Data to
analyze customer usage
and behavior
• Proactively offer relevant
products/services to
increase stickiness
• New prepaid SIM
focusing on
simplification and
sale efficiency
48 41 35-38
-
20.0
40.0
60.0
CAPEX (Bt bn)
20172016 2018E
-
5.0
10.0
15.0
20.0
25.0
Sep-17Jun-17 Dec-17
4G download
speedtest (Mbps)
20.3
• Improving data network
quality with optimum
investment
• Competitive
bundling packages
for postpaid
• Position as leading
brand in mobile data
+
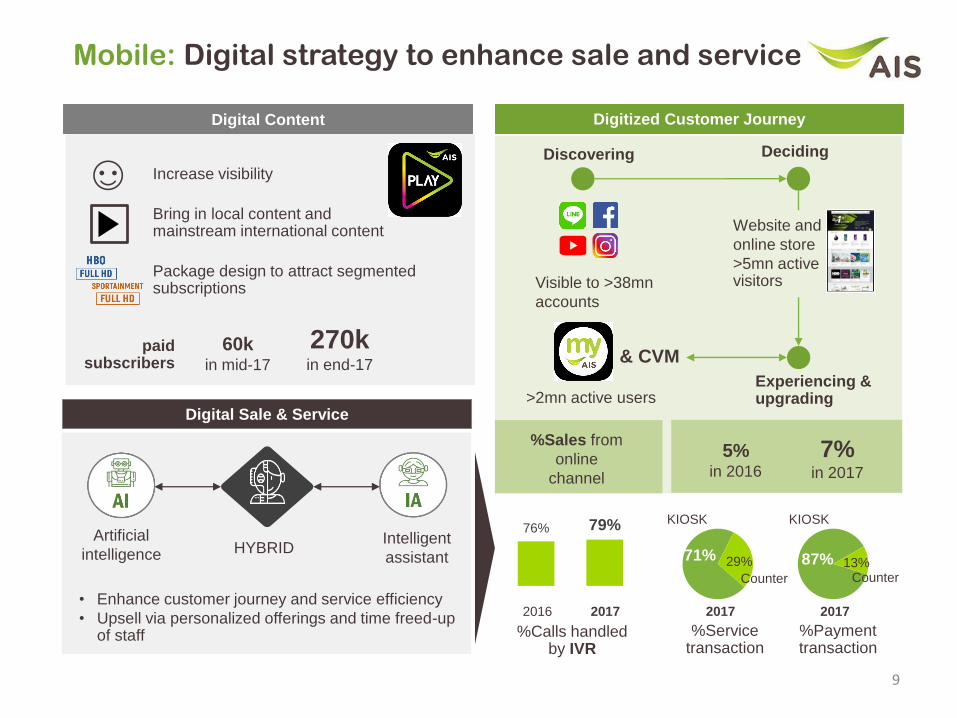
Mobile: Digital strategy to enhance sale and service
9
Digital Content Digitized Customer Journey
Digital Sale & Service
Increase visibility
Discovering Deciding
Experiencing & upgrading
Visible to >38mn
accounts
>2mn active users
& CVM
7%in 2017
5%in 2016
%Sales from
online
channel
Bring in local content and mainstream international content
Package design to attract segmented subscriptions
Website and
online store
>5mn active visitors
HYBRIDIntelligent
assistant
Artificial
intelligence
• Enhance customer journey and service efficiency
• Upsell via personalized offerings and time freed-up of staff
paid subscribers
270kin end-17
60kin mid-17
76% 79%
20172016
%Calls handled by IVR
71% 29% 87% 13%
%Service transaction
%Payment transaction
KIOSK KIOSK
Counter Counter
2017 2017
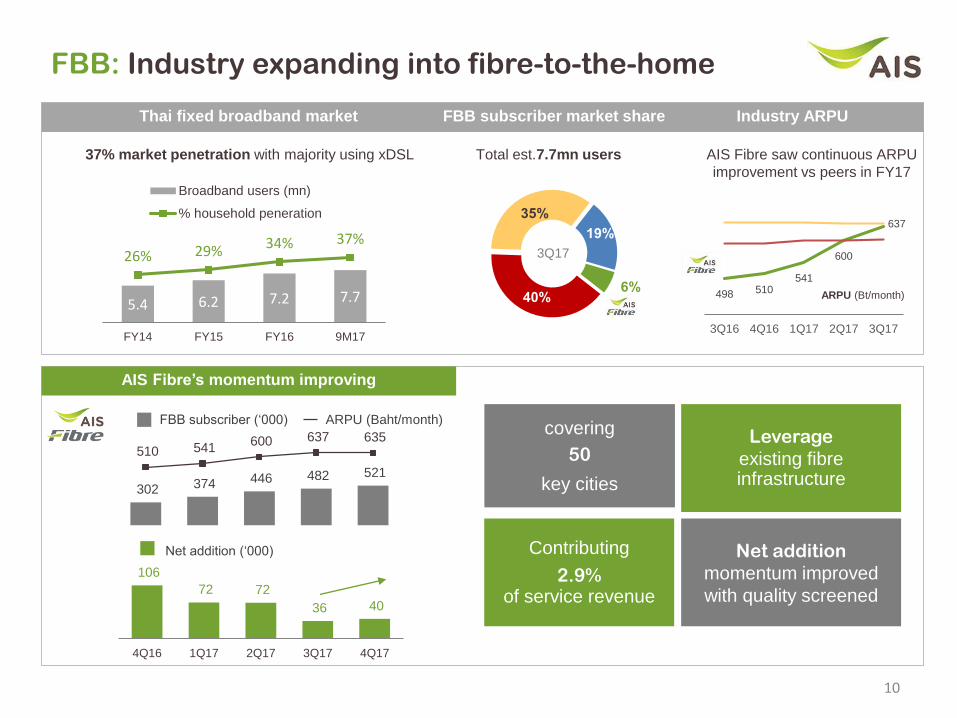
40%
35%
19%
6%
5.4 6.2 7.2 7.7
26% 29% 34% 37%
FY14 FY15 FY16 9M17
Broadband users (mn)
% household peneration
FBB: Industry expanding into fibre-to-the-home
Total est.7.7mn users
Thai fixed broadband market FBB subscriber market share Industry ARPU
AIS Fibre saw continuous ARPU
improvement vs peers in FY17
37% market penetration with majority using xDSL
3Q17
498 510541
600
637
3Q16 4Q16 1Q17 2Q17 3Q17
ARPU (Bt/month)
302 374 446 482 521
510 541 600 637 635
-
200
400
600
800
-
200
400
600
800
1,000
1,200
FBB subscriber (‘000) ARPU (Baht/month)
106
72 72
36 40
-
50
100
150
4Q16 1Q17 2Q17 3Q17 4Q17
Net addition (‘000)
covering
50
key cities
Leverage
existing fibre infrastructure
Net addition
momentum improved
with quality screened
Contributing
2.9%of service revenue
AIS Fibre’s momentum improving
10
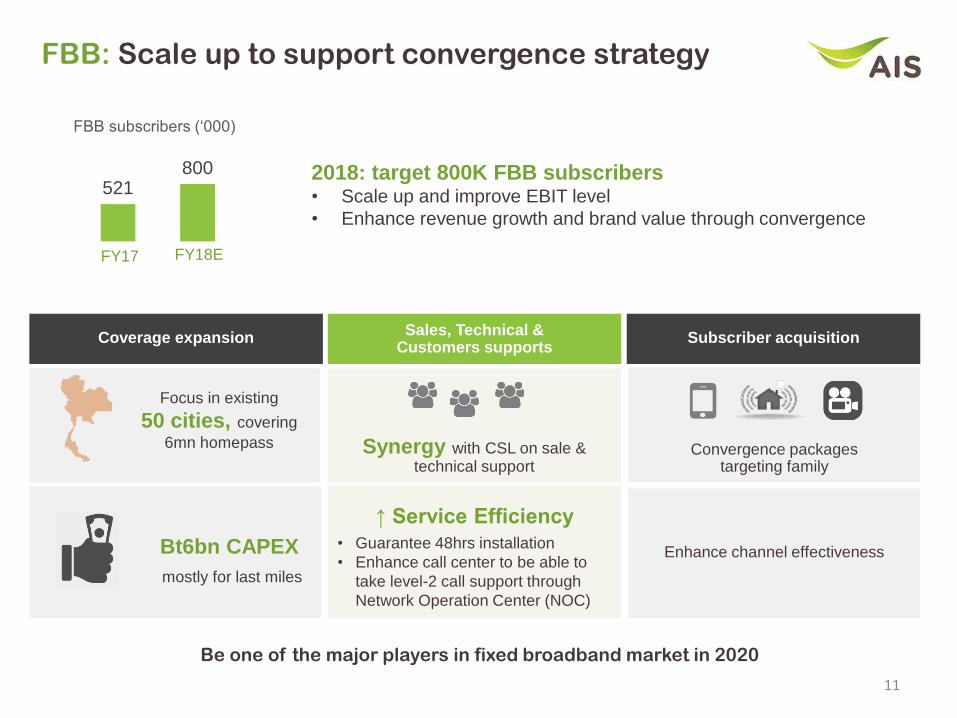
FBB: Scale up to support convergence strategy
11
Sales, Technical & Customers supports
Synergy with CSL on sale & technical support
↑ Service Efficiency
• Guarantee 48hrs installation
• Enhance call center to be able to
take level-2 call support through
Network Operation Center (NOC)
Coverage expansion Subscriber acquisition
Focus in existing
50 cities, covering
6mn homepass
Digital for Thai
mostly for last miles
Bt6bn CAPEX
Convergence packages targeting family
Enhance channel effectiveness
Be one of the major players in fixed broadband market in 2020
521800
FY17 FY18E
FBB subscribers (‘000)
2018: target 800K FBB subscribers• Scale up and improve EBIT level
• Enhance revenue growth and brand value through convergence
Bro
adband +
conte
nts
Pure
bro
adband
bro
adband +
conte
nts
+ m
obile
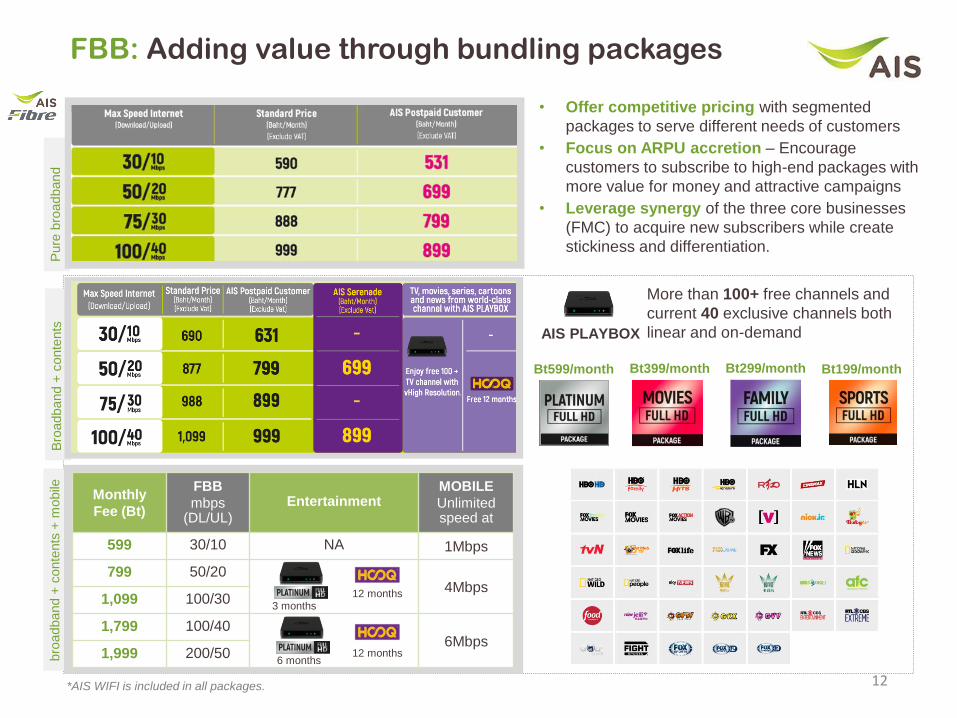
FBB: Adding value through bundling packages
12
• Offer competitive pricing with segmented
packages to serve different needs of customers
• Focus on ARPU accretion – Encourage
customers to subscribe to high-end packages with
more value for money and attractive campaigns
• Leverage synergy of the three core businesses
(FMC) to acquire new subscribers while create
stickiness and differentiation.
Monthly
Fee (Bt)
FBB
mbps(DL/UL)
EntertainmentMOBILE
Unlimited speed at
599 30/10 NA 1Mbps
799 50/204Mbps
1,099 100/30
1,799 100/406Mbps
1,999 200/50
12 months
12 months
3 months
6 months
More than 100+ free channels and
current 40 exclusive channels both
linear and on-demandAIS PLAYBOX
*AIS WIFI is included in all packages.
Bt599/month Bt399/month Bt299/month Bt199/month
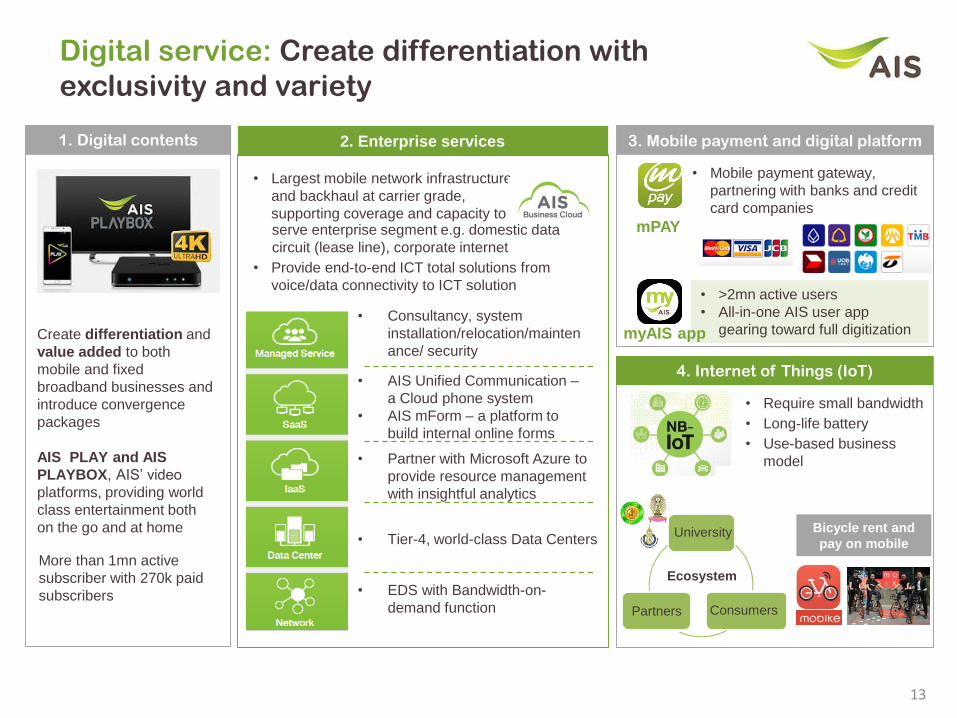
• Largest mobile network infrastructure
and backhaul at carrier grade,
supporting coverage and capacity to
13
Digital service: Create differentiation with
exclusivity and variety
4. Internet of Things (IoT)
• EDS with Bandwidth-on-
demand function
• Tier-4, world-class Data Centers
• Partner with Microsoft Azure to
provide resource management
with insightful analytics
• AIS Unified Communication –
a Cloud phone system
• AIS mForm – a platform to
build internal online forms
• Consultancy, system
installation/relocation/mainten
ance/ security
2. Enterprise services 3. Mobile payment and digital platform
mPAY
1. Digital contents
• Mobile payment gateway,
partnering with banks and credit
card companies
Create differentiation and
value added to both
mobile and fixed
broadband businesses and
introduce convergence
packages
AIS PLAY and AIS
PLAYBOX, AIS’ video
platforms, providing world
class entertainment both
on the go and at home
• >2mn active users
• All-in-one AIS user app
gearing toward full digitization myAIS app
• Require small bandwidth
• Long-life battery
• Use-based business
model
University
Partners Consumers
Ecosystem
Bicycle rent and
pay on mobile
serve enterprise segment e.g. domestic data
circuit (lease line), corporate internet
• Provide end-to-end ICT total solutions from
voice/data connectivity to ICT solution
More than 1mn active
subscriber with 270k paid
subscribers
En
terp
rise
se
rvic
es
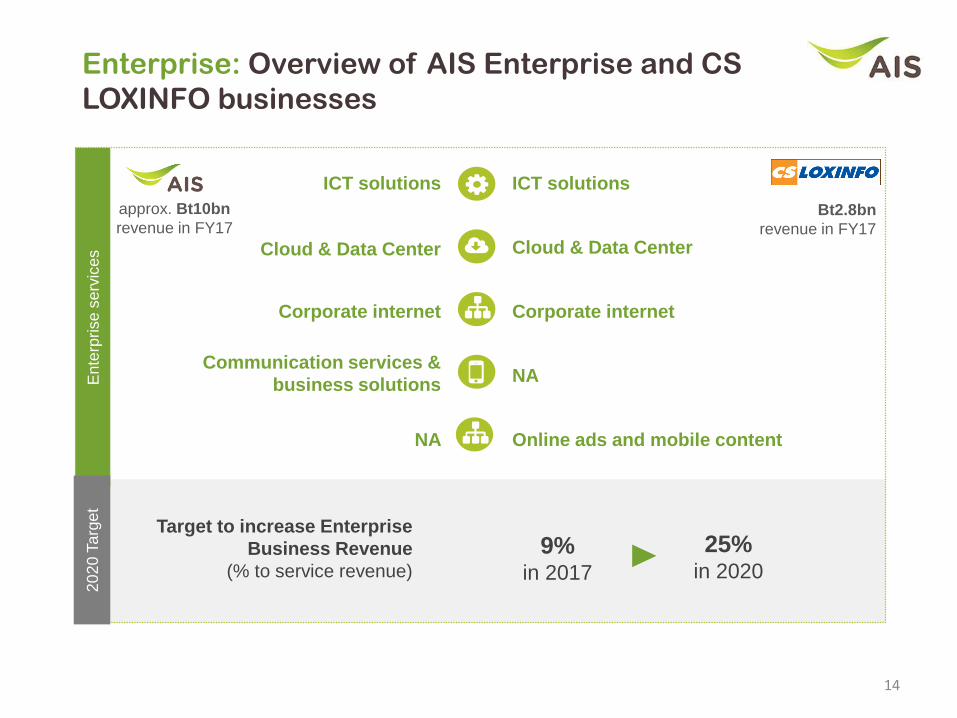
Enterprise: Overview of AIS Enterprise and CS
LOXINFO businesses
Cloud & Data Center
NA
ICT solutions
Cloud & Data Center
Communication services &
business solutions
ICT solutions
Corporate internet Corporate internet
NA Online ads and mobile content
Bt2.8bn
revenue in FY17
approx. Bt10bn
revenue in FY17
20
20
Ta
rge
t
14
Target to increase Enterprise
Business Revenue
(% to service revenue)
9%in 2017
25%in 2020
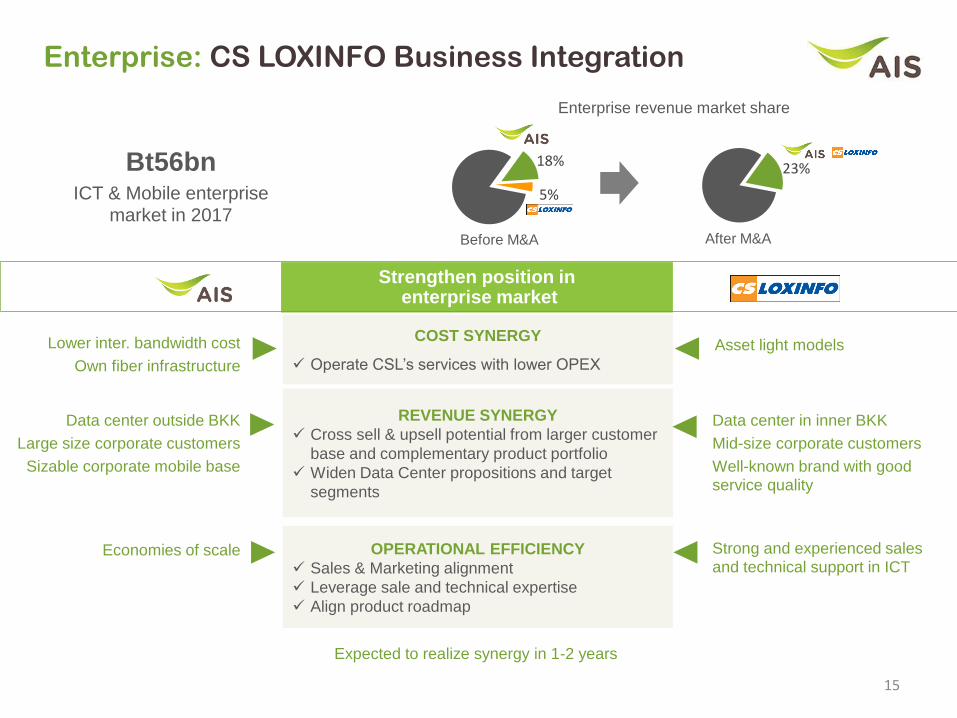
18%
5%
Enterprise: CS LOXINFO Business Integration
15
Strengthen position inenterprise market
COST SYNERGY
✓ Operate CSL’s services with lower OPEX
REVENUE SYNERGY
✓ Cross sell & upsell potential from larger customer
base and complementary product portfolio
✓ Widen Data Center propositions and target
segments
OPERATIONAL EFFICIENCY
✓ Sales & Marketing alignment
✓ Leverage sale and technical expertise
✓ Align product roadmap
Expected to realize synergy in 1-2 years
Asset light models
Data center outside BKK
Large size corporate customers
Sizable corporate mobile base
Data center in inner BKK
Mid-size corporate customers
Well-known brand with good service quality
Before M&A After M&A
Enterprise revenue market share
Bt56bnICT & Mobile enterprise
market in 2017
Lower inter. bandwidth cost
Own fiber infrastructure
Economies of scale Strong and experienced sales and technical support in ICT
23%
APPENDIX
16
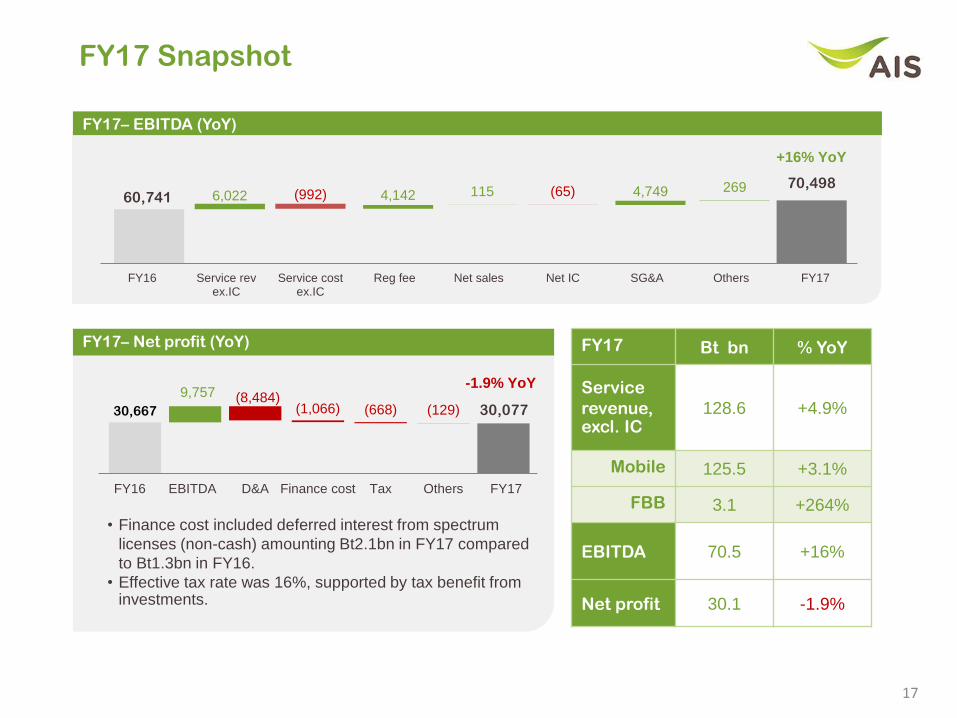
FY17 Snapshot
FY17 Bt bn % YoY
Service
revenue,excl. IC
128.6 +4.9%
Mobile 125.5 +3.1%
FBB 3.1 +264%
EBITDA 70.5 +16%
Net profit 30.1 -1.9%
17
FY17– EBITDA (YoY)
70,498(992) (65)6,022 4,142 115 4,749 269
60,741
FY16 Service revex.IC
Service costex.IC
Reg fee Net sales Net IC SG&A Others FY17
30,077(8,484)
(1,066) (668) (129)
9,757
30,667
FY16 EBITDA D&A Finance cost Tax Others FY17
+16% YoY
FY17– Net profit (YoY)
-1.9% YoY
• Finance cost included deferred interest from spectrum
licenses (non-cash) amounting Bt2.1bn in FY17 compared
to Bt1.3bn in FY16.
• Effective tax rate was 16%, supported by tax benefit from investments.
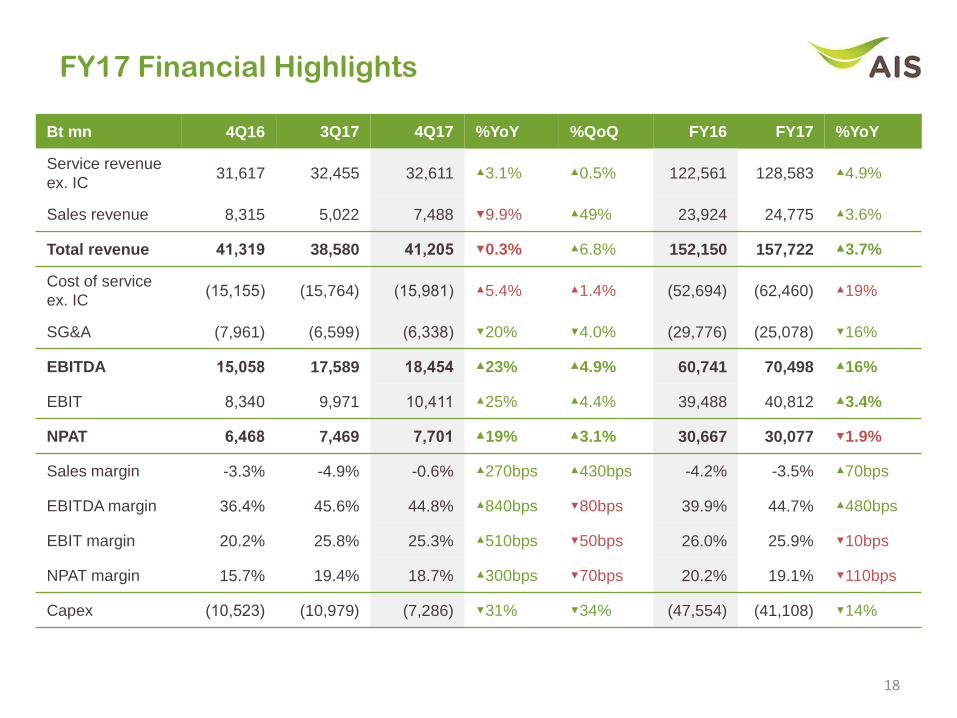
FY17 Financial Highlights
Bt mn 4Q16 3Q17 4Q17 %YoY %QoQ FY16 FY17 %YoY
Service revenue
ex. IC31,617 32,455 32,611 ▲3.1% ▲0.5% 122,561 128,583 ▲4.9%
Sales revenue 8,315 5,022 7,488 ▼9.9% ▲49% 23,924 24,775 ▲3.6%
Total revenue 41,319 38,580 41,205 ▼0.3% ▲6.8% 152,150 157,722 ▲3.7%
Cost of service
ex. IC(15,155) (15,764) (15,981) ▲5.4% ▲1.4% (52,694) (62,460) ▲19%
SG&A (7,961) (6,599) (6,338) ▼20% ▼4.0% (29,776) (25,078) ▼16%
EBITDA 15,058 17,589 18,454 ▲23% ▲4.9% 60,741 70,498 ▲16%
EBIT 8,340 9,971 10,411 ▲25% ▲4.4% 39,488 40,812 ▲3.4%
NPAT 6,468 7,469 7,701 ▲19% ▲3.1% 30,667 30,077 ▼1.9%
Sales margin -3.3% -4.9% -0.6% ▲270bps ▲430bps -4.2% -3.5% ▲70bps
EBITDA margin 36.4% 45.6% 44.8% ▲840bps ▼80bps 39.9% 44.7% ▲480bps
EBIT margin 20.2% 25.8% 25.3% ▲510bps ▼50bps 26.0% 25.9% ▼10bps
NPAT margin 15.7% 19.4% 18.7% ▲300bps ▼70bps 20.2% 19.1% ▼110bps
Capex (10,523) (10,979) (7,286) ▼31% ▼34% (47,554) (41,108) ▼14%
18
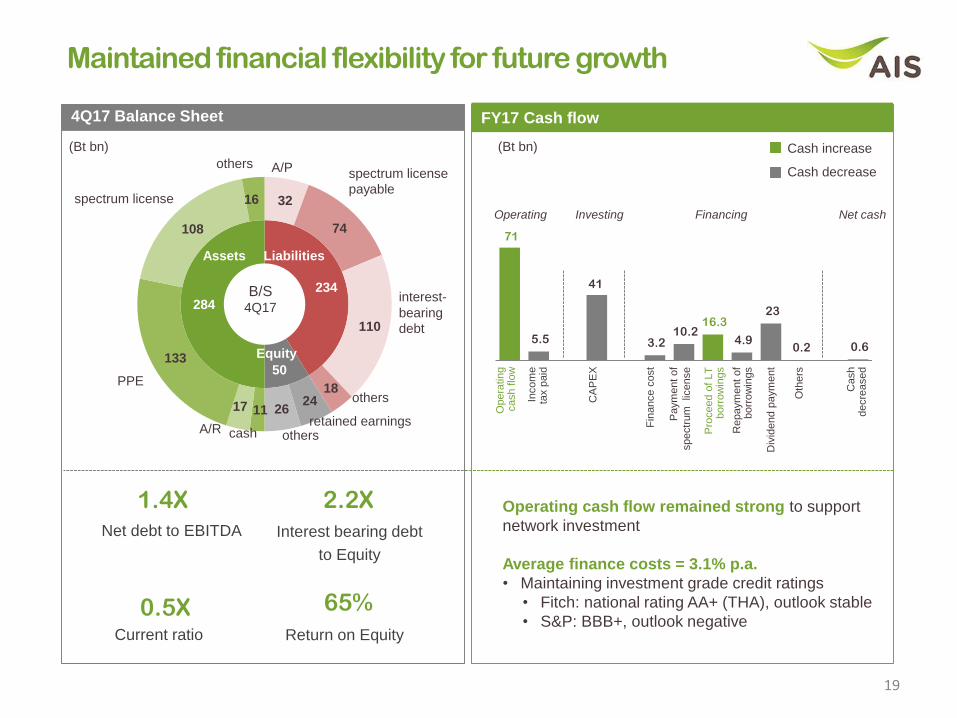
234
50
284
32
74
110
18 24
26 11 17
133
108
16
Assets Liabilities
Equity
cash
spectrum license
othersspectrum license
payable
interest-
bearing
debt
others
retained earningsothers
A/R
PPE
B/S4Q17
FY17 Cash flow 4Q17 Balance Sheet
A/P
Operating cash flow remained strong to support
network investment
Average finance costs = 3.1% p.a.
• Maintaining investment grade credit ratings
• Fitch: national rating AA+ (THA), outlook stable
• S&P: BBB+, outlook negative
Maintained financial flexibility for future growth
(Bt bn) (Bt bn)
71
5.5
41
3.2 10.2
16.3
4.9
23
0.2 0.6
Operating Investing Financing Net cash
Opera
tin
gcash flo
w
Incom
e
tax p
aid
CA
PE
X
Paym
ent of
spectr
um
lic
ense
Cash
decre
ased
Pro
ceed o
f LT
borr
ow
ings
Repaym
ent
of
borr
ow
ings
Fin
ance c
ost
Cash increase
Cash decrease
Div
idend p
aym
ent
1.4X 2.2X
0.5X 65%
Net debt to EBITDA Interest bearing debt
to Equity
Current ratio Return on Equity
Oth
ers
19
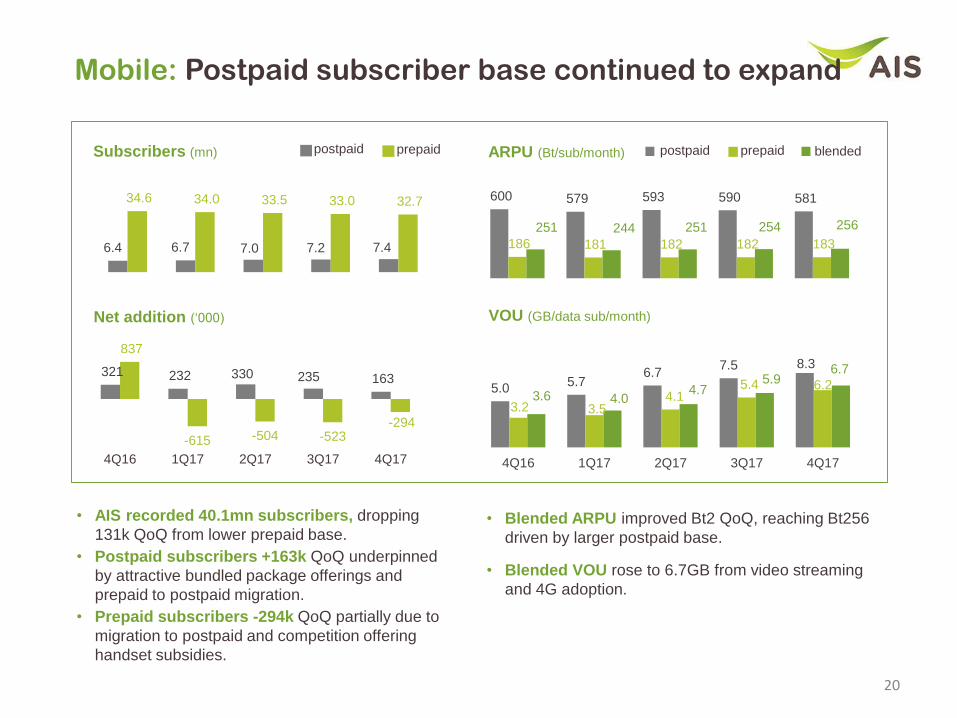
• AIS recorded 40.1mn subscribers, dropping
131k QoQ from lower prepaid base.
• Postpaid subscribers +163k QoQ underpinned
by attractive bundled package offerings and
prepaid to postpaid migration.
• Prepaid subscribers -294k QoQ partially due to
migration to postpaid and competition offering
handset subsidies.
Mobile: Postpaid subscriber base continued to expand
ARPU (Bt/sub/month)postpaid prepaidSubscribers (mn)
Net addition (‘000)
321 232 330 235 163
837
-615 -504 -523 -294
4Q16 1Q17 2Q17 3Q17 4Q17
6.4 6.7 7.0 7.2 7.4
34.6 34.0 33.5 33.0 32.7 600 579 593 590 581
186 181 182 182 183
251 244 251 254 256
• Blended ARPU improved Bt2 QoQ, reaching Bt256
driven by larger postpaid base.
• Blended VOU rose to 6.7GB from video streaming
and 4G adoption.
postpaid prepaid blended
5.05.7
6.77.5
3.2 3.54.1
5.4 6.23.6 4.0
4.75.9
6.7
4Q16 1Q17 2Q17 3Q17 4Q17
VOU (GB/data sub/month)
20
8.3
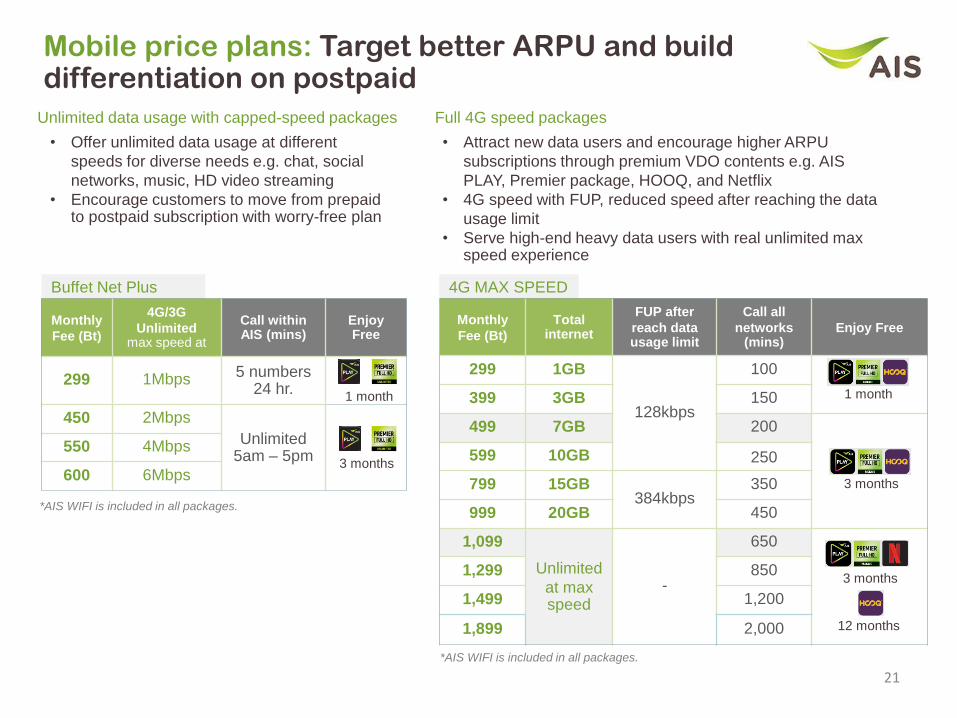
4G MAX SPEEDBuffet Net Plus
Mobile price plans: Target better ARPU and build differentiation on postpaid
21
Monthly
Fee (Bt)
4G/3G
Unlimitedmax speed at
Call within AIS (mins)
EnjoyFree
299 1Mbps5 numbers
24 hr.
450 2Mbps
Unlimited 5am – 5pm
550 4Mbps
600 6Mbps
1 month
• Offer unlimited data usage at different
speeds for diverse needs e.g. chat, social
networks, music, HD video streaming
• Encourage customers to move from prepaid to postpaid subscription with worry-free plan
Monthly
Fee (Bt)
Total internet
FUP after
reach data usage limit
Call all
networks (mins)
Enjoy Free
299 1GB
128kbps
100
399 3GB 150
499 7GB 200
599 10GB 250
799 15GB384kbps
350
999 20GB 450
1,099
Unlimited
at max speed
-
650
1,299 850
1,499 1,200
1,899 2,000
*AIS WIFI is included in all packages.
1 month
3 months
3 months
12 months
*AIS WIFI is included in all packages.
• Attract new data users and encourage higher ARPU
subscriptions through premium VDO contents e.g. AIS
PLAY, Premier package, HOOQ, and Netflix
• 4G speed with FUP, reduced speed after reaching the data
usage limit
• Serve high-end heavy data users with real unlimited max speed experience
Unlimited data usage with capped-speed packages Full 4G speed packages
3 months
22
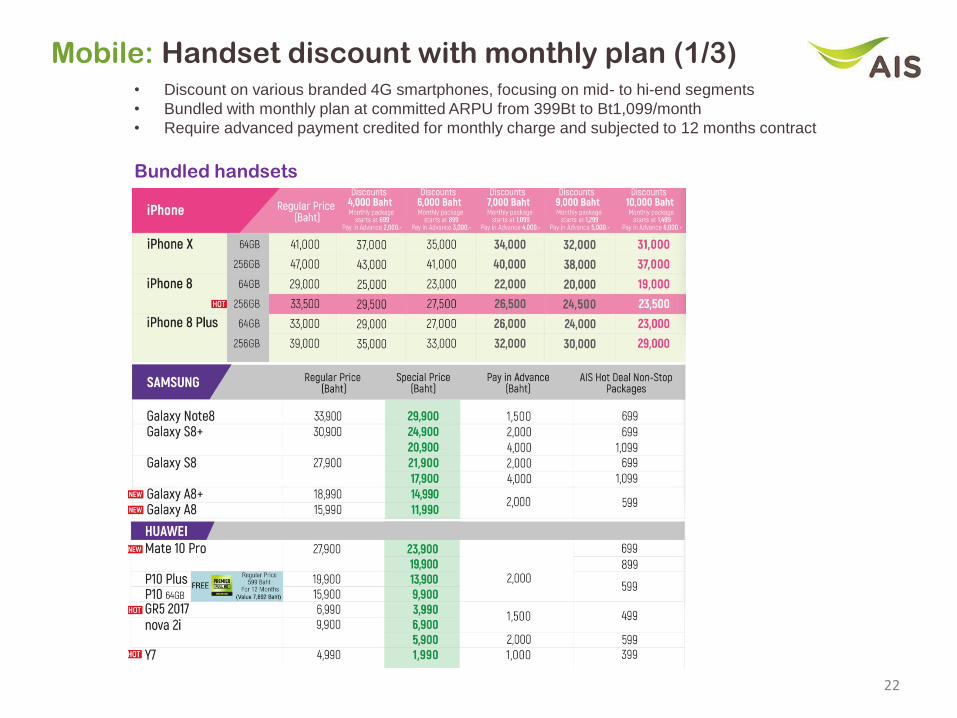
• Discount on various branded 4G smartphones, focusing on mid- to hi-end segments
• Bundled with monthly plan at committed ARPU from 399Bt to Bt1,099/month
• Require advanced payment credited for monthly charge and subjected to 12 months contract
Mobile: Handset discount with monthly plan (1/3)
Bundled handsets
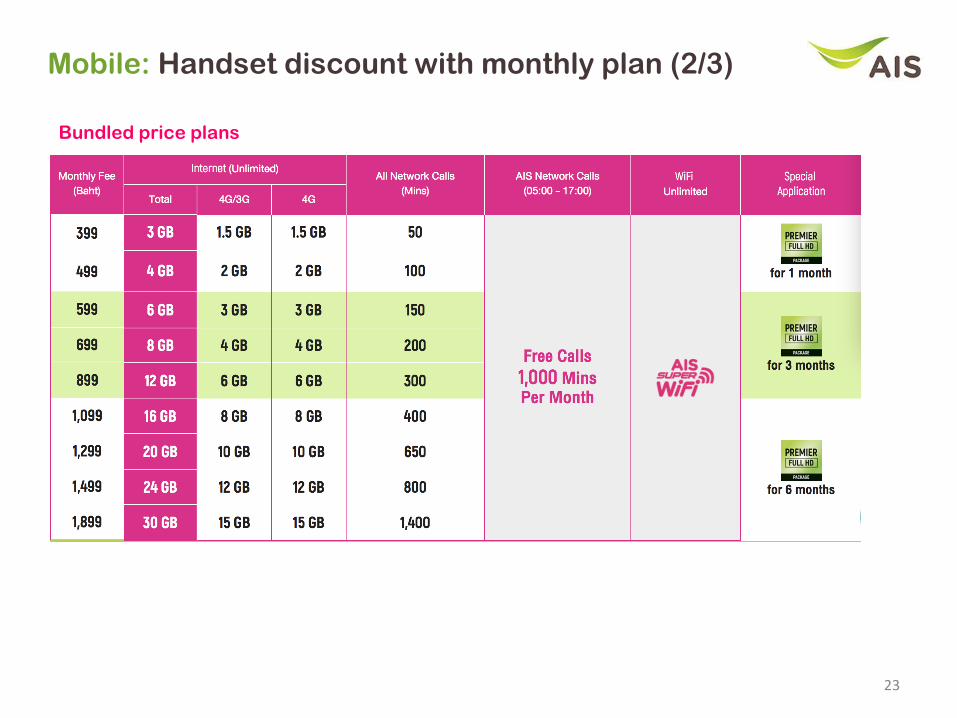
23
Mobile: Handset discount with monthly plan (2/3)
Bundled price plans
24
Monthly
Fee (Bt)
4G/3GNon-stop
Call all
network (min)
EnjoyFree
399199
3GB 150
499249
4GB 200
599499
6GB 250
799399
10GB 350
999499
14GB 500
1 month
3 months
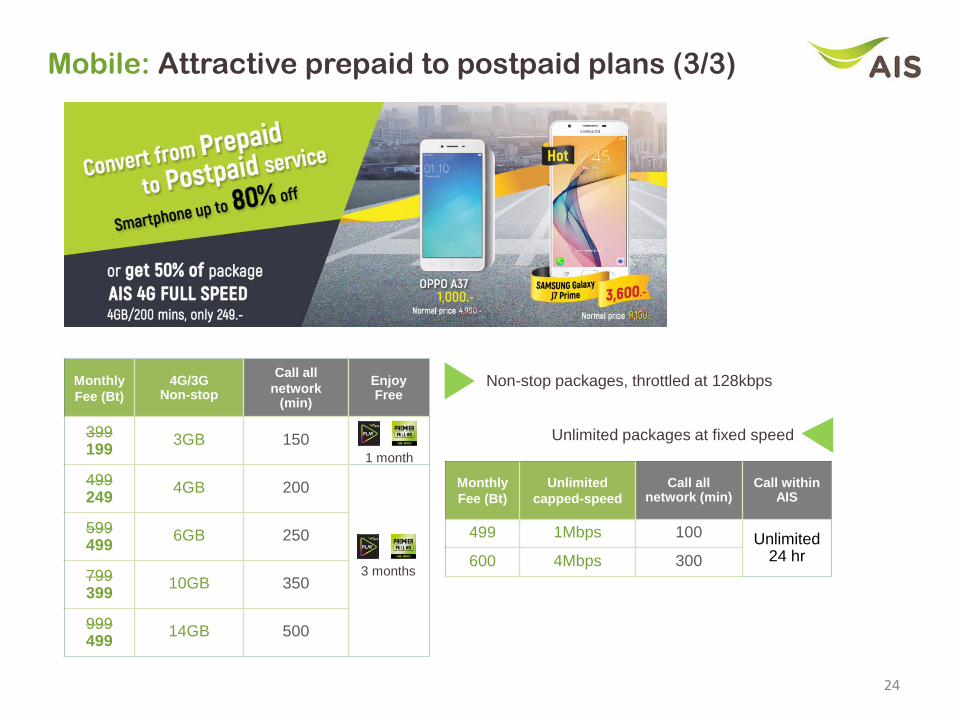
Mobile: Attractive prepaid to postpaid plans (3/3)
Monthly
Fee (Bt)
Unlimited
capped-speed
Call all network (min)
Call within AIS
499 1Mbps 100 Unlimited 24 hr600 4Mbps 300
Non-stop packages, throttled at 128kbps
Unlimited packages at fixed speed
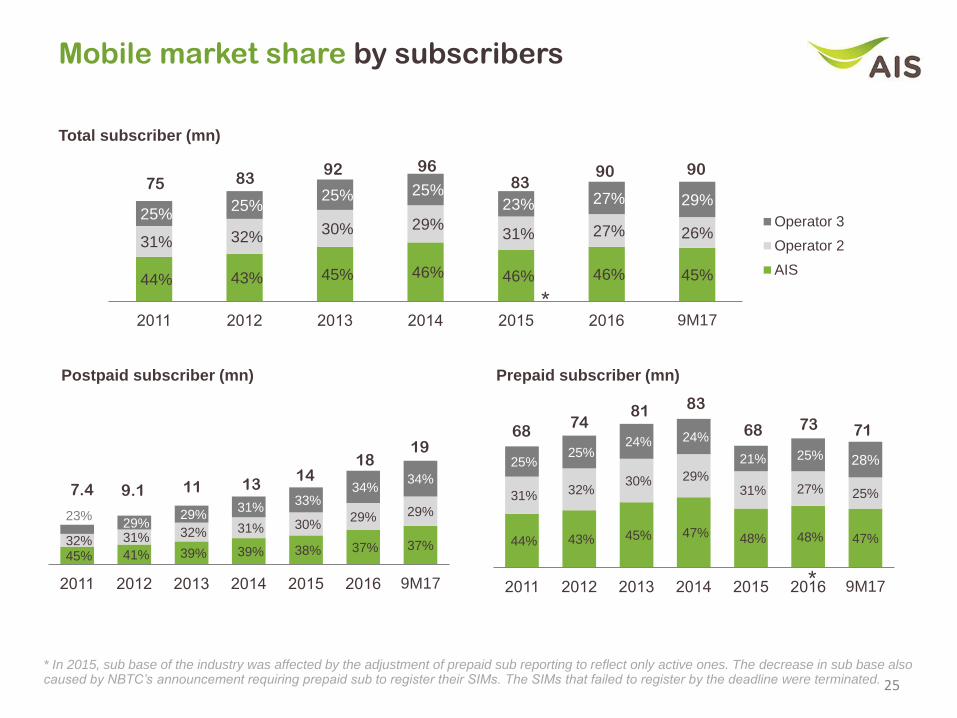
Mobile market share by subscribers
44% 43% 45% 46% 46% 46% 45%
31% 32%30% 29%
31% 27% 26%
25%25%
25% 25%23% 27% 29%
2011 2012 2013 2014 2015 2016 9M17
Operator 3
Operator 2
AIS
25
Total subscriber (mn)
45% 41% 39% 39% 38% 37% 37%32% 31% 32% 31% 30%29% 29%23%
29%29%
31%33%
34%34%
2011 2012 2013 2014 2015 2016 9M17
Postpaid subscriber (mn) Prepaid subscriber (mn)
44% 43% 45% 47% 48% 48% 47%
31% 32%30% 29%
31% 27% 25%
25%25%
24% 24%
21% 25% 28%
2011 2012 2013 2014 2015 2016 9M17
6874
81 83
68 73
7.4 9.1 11 1314
18
75 8392 96
8390
* In 2015, sub base of the industry was affected by the adjustment of prepaid sub reporting to reflect only active ones. The decrease in sub base also caused by NBTC’s announcement requiring prepaid sub to register their SIMs. The SIMs that failed to register by the deadline were terminated.
*
*
90
1971
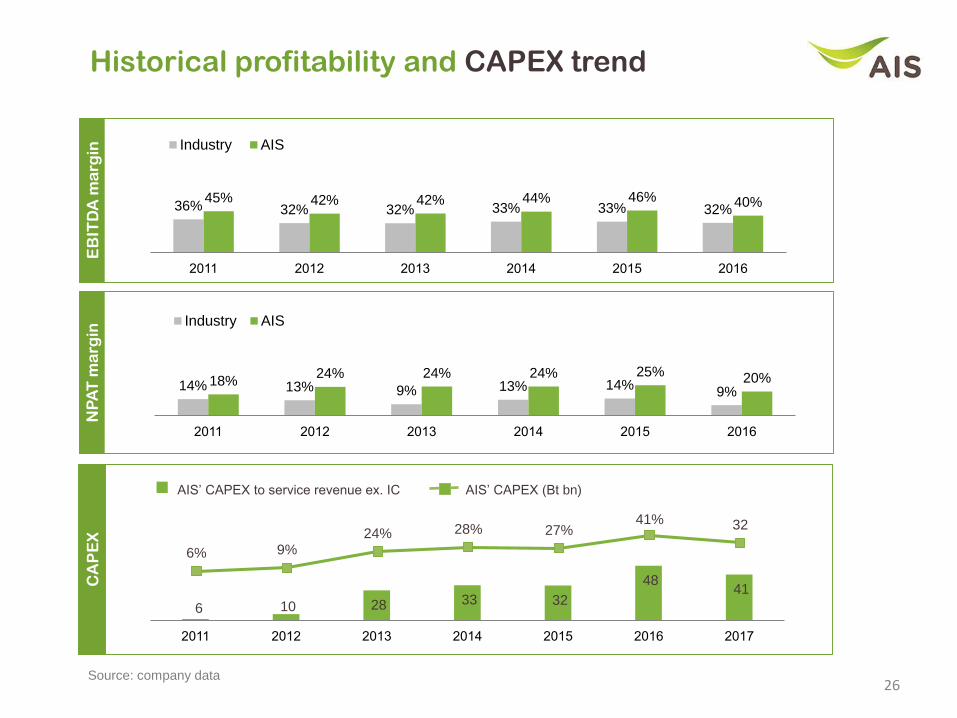
6 10 28 33 32
48 41
2011 2012 2013 2014 2015 2016 2017
6% 9%24% 28% 27%
41% 32
26
Historical profitability and CAPEX trend
36% 32% 32% 33% 33% 32%45% 42% 42% 44% 46% 40%
2011 2012 2013 2014 2015 2016
Industry AIS
14% 13% 9% 13% 14%9%
18%24% 24% 24% 25% 20%
2011 2012 2013 2014 2015 2016
Industry AIS
EB
ITD
A m
arg
inN
PA
T m
arg
inC
AP
EX
AIS’ CAPEX (Bt bn)AIS’ CAPEX to service revenue ex. IC
Source: company data
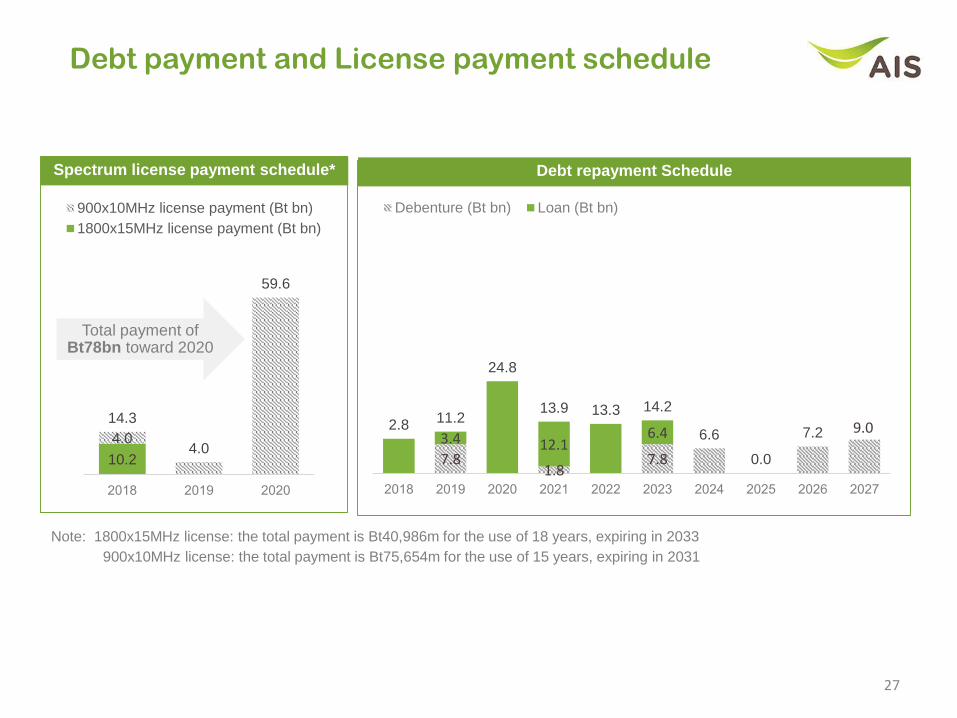
Debt payment and License payment schedule
27
10.2
4.0
14.3
4.0
59.6
2018 2019 2020
900x10MHz license payment (Bt bn)
1800x15MHz license payment (Bt bn)
Spectrum license payment schedule* Debt repayment Schedule
7.81.8
7.8
9.03.4 12.1
6.42.8
11.2
24.8
13.9 13.3 14.2
6.6
0.0
7.2
2018 2019 2020 2021 2022 2023 2024 2025 2026 2027
Debenture (Bt bn) Loan (Bt bn)
Total payment of Bt78bn toward 2020
Note: 1800x15MHz license: the total payment is Bt40,986m for the use of 18 years, expiring in 2033
900x10MHz license: the total payment is Bt75,654m for the use of 15 years, expiring in 2031
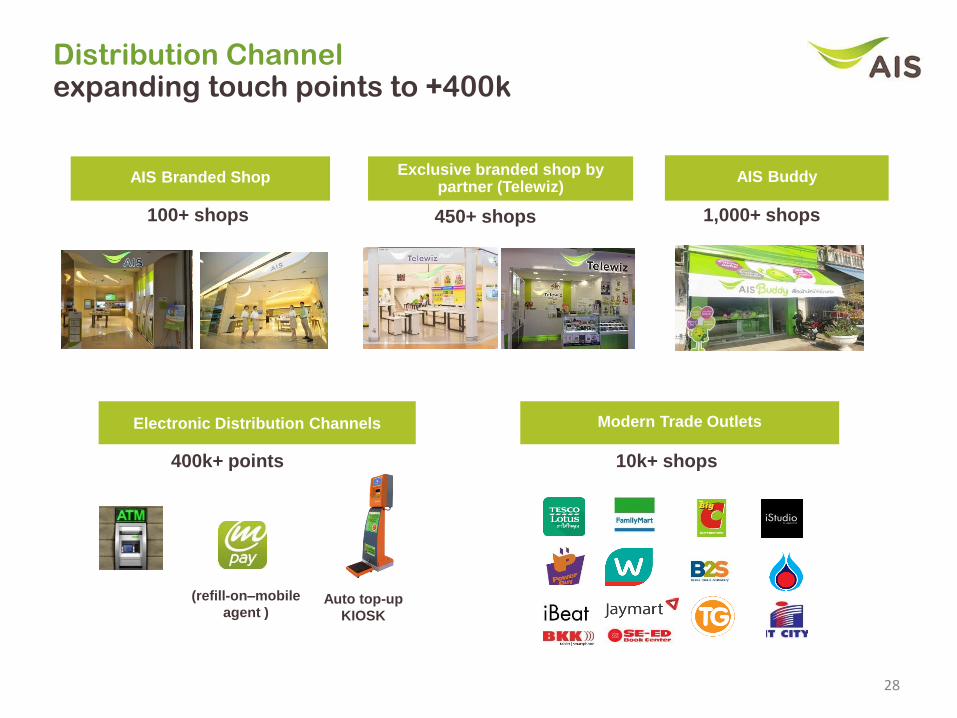
28
Distribution Channelexpanding touch points to +400k
AIS Branded ShopExclusive branded shop by
partner (Telewiz)
100+ shops
10k+ shops
450+ shops
AIS Buddy
1,000+ shops
Electronic Distribution Channels
400k+ points
Modern Trade Outlets
Auto top-up
KIOSK
(refill-on–mobile
agent )
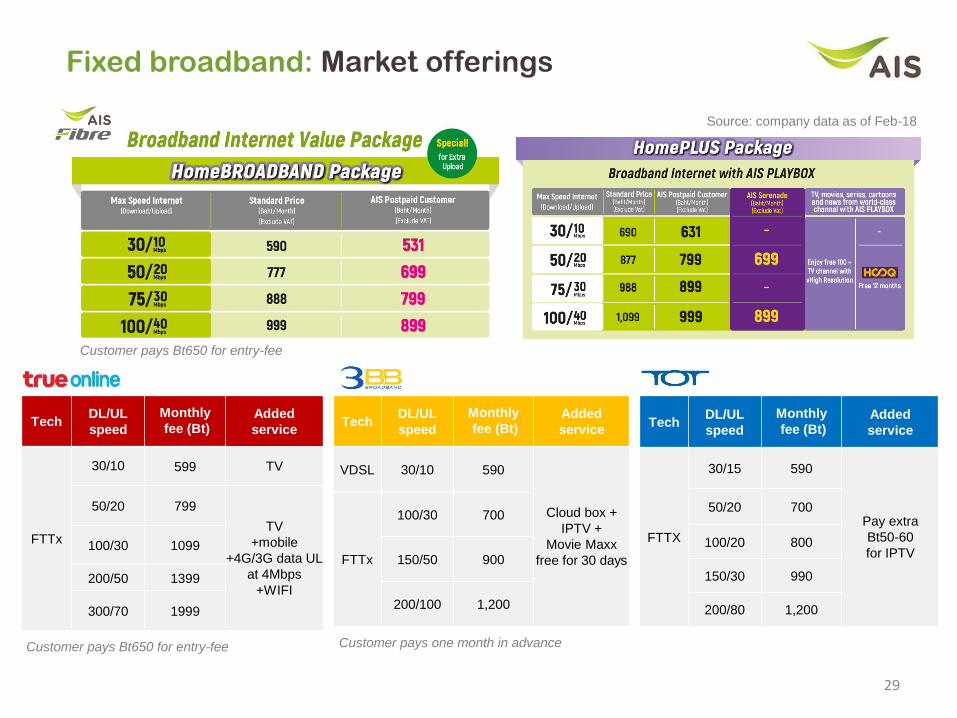
Fixed broadband: Market offerings
TechDL/UL
speed
Monthly
fee (Bt)Added
service
VDSL 30/10 590
Cloud box +
IPTV +
Movie Maxx
free for 30 daysFTTx
100/30 700
150/50 900
200/100 1,200
TechDL/UL
speed
Monthly
fee (Bt)Added
service
FTTx
30/10 599 TV
50/20 799
TV
+mobile
+4G/3G data UL
at 4Mbps
+WIFI
100/30 1099
200/50 1399
300/70 1999
Source: company data as of Feb-18
29
TechDL/UL
speed
Monthly
fee (Bt)Added
service
FTTX
30/15 590
Pay extra
Bt50-60
for IPTV
50/20 700
100/20 800
150/30 990
200/80 1,200
Customer pays one month in advanceCustomer pays Bt650 for entry-fee
Customer pays Bt650 for entry-fee
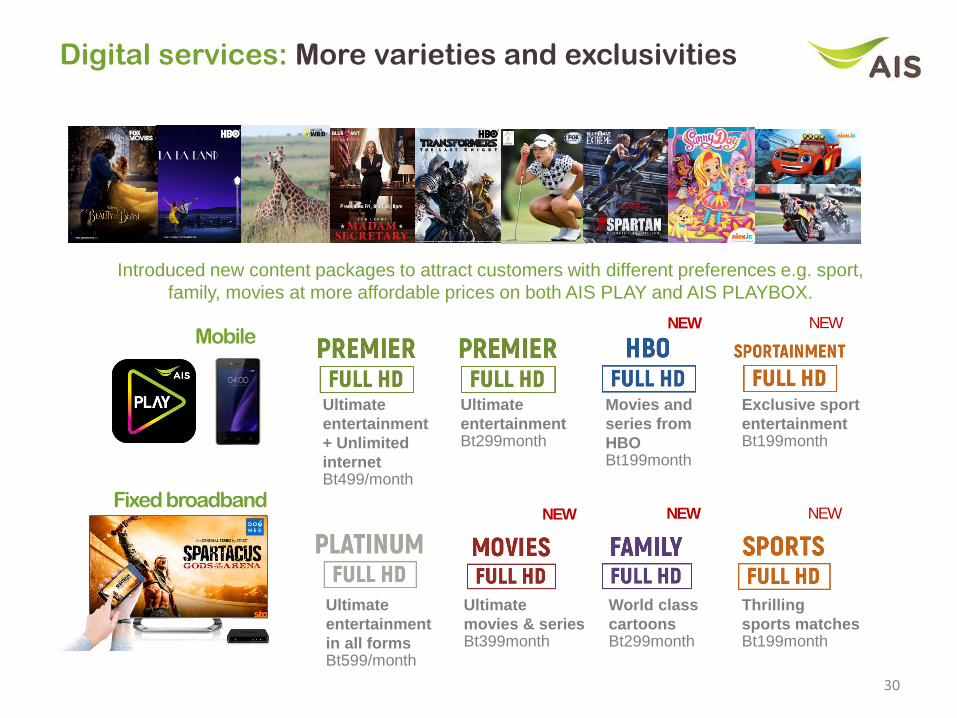
Digital services: More varieties and exclusivities
Introduced new content packages to attract customers with different preferences e.g. sport,
family, movies at more affordable prices on both AIS PLAY and AIS PLAYBOX.
Mobile
Fixed broadband
Ultimate
entertainment
in all forms Bt599/month
Ultimate
movies & seriesBt399month
World class
cartoonsBt299month
Thrilling
sports matchesBt199month
NEW NEW NEW
NEW NEW
Ultimate
entertainment
+ Unlimited
internet Bt499/month
Ultimate
entertainmentBt299month
Movies and
series from
HBOBt199month
Exclusive sport
entertainmentBt199month
30
Disclaimers
Contact us
IR website: http://investor.ais.co.th
Email: [email protected]
Tel: +662 029 3145
Some statements made in this material are forward-looking statements with the relevant assumptions, which are subject to various risks and uncertainties. These include
statements with respect to our corporate plans, strategies and beliefs and other statements that are not historical facts. These statements can be identified by the use of
forward-looking terminology such as “may”, “will”, “expect”, “anticipate”, “intend”, “estimate”, “continue” “plan” or other similar words.
The statements are based on our management’s assumptions and beliefs in light of the information currently available to us. These assumptions involve risks and
uncertainties which may cause the actual results, performance or achievements to be materially different from any future results, performance or achievements
expressed or implied by such forward-looking statements. Please note that the company and executives/staff do not control and cannot guarantee the relevance,
timeliness, or accuracy of these statements.