Download paper here.
38
Gerald R. Ford School Of Public Policy, University Of Michigan National Poverty Center Working Paper Series #03-7 September 2003 Single Mother Work And Poverty Under Welfare Reform: Are Policy Impacts Different In Rural Areas? Bruce Weber, Oregon State University Mark Edwards, Oregon State University Greg Duncan, Northwestern University This paper is available online at the National Poverty Center Working Paper Series index at: http://www.npc.umich.edu/publications/working_papers/ Any opinions, findings, conclusions, or recommendations expressed in this material are those of the author(s) and do not necessarily reflect the view of the National Poverty Center or any sponsoring agency
Transcript of Download paper here.
Gerald R. Ford School Of Public Policy, University Of Michigan
National Poverty Center Working Paper Series
#03-7
September 2003
Single Mother Work And Poverty Under Welfare Reform: Are Policy Impacts Different In Rural Areas?
Bruce Weber, Oregon State University Mark Edwards, Oregon State University Greg Duncan, Northwestern University
This paper is available online at the National Poverty Center Working Paper Series index at: http://www.npc.umich.edu/publications/working_papers/
Any opinions, findings, conclusions, or recommendations expressed in this material are those of the author(s) and do not necessarily reflect the view of the National Poverty Center or any sponsoring agency

0
JEL Classification Code: I38
SINGLE MOTHER WORK AND POVERTY UNDER WELFARE REFORM:
ARE POLICY IMPACTS DIFFERENT IN RURAL AREAS?
Bruce Weber
Oregon State University
Mark Edwards
Oregon State University
Greg Duncan
Northwestern University
Abstract
During the 1990s, employment increased and poverty declined for single mothers in
rural and urban areas. Our results suggest that, holding demographics constant, changes in
welfare and social policy during this decade contributed to employment increases—but not to
poverty reduction—for both rural and urban single mothers. If rural and urban demographics
had been the same, the policy changes would have increased employment and reduced poverty
more in rural areas. Without demographic controls, however, estimated policy impacts were no
better in rural places. This suggests that rural demographic changes limited the policy impact on
rural single-mother work and poverty.

SINGLE MOTHER WORK AND POVERTY UNDER WELFARE REFORM
1
SINGLE MOTHER WORK AND POVERTY UNDER WELFARE REFORM:
ARE POLICY IMPACTS DIFFERENT IN RURAL AREAS?
Bruce Weber
Oregon State University
Mark Edwards
Oregon State University
Greg Duncan
Northwestern University
INTRODUCTION
The implementation of the welfare reform law in 1996 and major expansions of tax
credits, child care subsidies and health care programs in the 1990s increased pressure, incentives
and supports for low income single mothers with children to enter the paid workforce. The rapid
reductions in welfare caseloads and the expectation that there would be opportunities for
revisions during reauthorization of the law in 2002 generated an impressive volume of studies
attempting to explain the outcomes of welfare reform and evaluate the effectiveness of various
policy choices in the new law [Schoeni and Blank, 2000; Blank, 2002]. Other changes in tax and
social policy have also drawn attention of researchers. Meyer and Rosenbaum [2000], for
example examine changes in tax policy, particularly the Earned Income Tax Credit, as well as
changes in child care and training programs.
Bruce Weber: Department of Agricultural and Resource Economics, Oregon State University,
Ballard Hall 213, Corvallis OR 97331-3601. PH: 541 737-1432. E-mail:
2
There are reasons to expect that the impacts of these policy changes may not be as
favorable in rurali areas as in urban areas. Unemployment and underemployment rates have
historically been higher in nonmetropolitan than metropolitan areasii, so the likelihood of getting
a job is lower [Economic Research Service, 1997; Findeis and Jensen, 1998; Mills, 2001]. Work
and family support services such as child care, transportation, health care and training are less
available and accessible in sparsely settled and remote places, so the difficulty in preparing for,
commuting to and keeping a job in rural areas is greater than in urban areas [Fletcher et al.,
2002] Average earnings have been lower in rural areas, so getting a job is less likely to move a
person out of poverty [Economic Research Service, 1997; Gibbs, 2001]. These differences may
be due to both the different characteristics of the labor forces and the different types of jobs
available in metro and nonmetro areas. Rural adults have lower average levels of formal
education than urban adults, for example, and employment in rural areas is more concentrated in
minimum wage and part-time jobs and more likely to involve routine work. Whatever the
reasons for the differences, it is at least plausible that the outcomes of the social policy changes
in the 1990s that moved more single mothers with children into the workforce and off of the
welfare rolls were not as favorable in rural as in urban places.
A number of studies have attempted to sort out the impacts of welfare reform in rural
versus urban areas [see Whitener et al., 2002 for a summary of some of these, and Duncan et al.,
2002 for some lessons learned]. To our knowledge, however, there has been no study that has
attempted to examine the differential rural/urban impacts of the social policy changes in the
1990s on employment and poverty outcomes for the target population of much of this
legislation: single mothers with children.
SINGLE MOTHER WORK AND POVERTY UNDER WELFARE REFORM
3
Our paper examines the impact of the changes in social policy of the 1990s on the
employment and poverty outcomes of single mothers with children in rural and urban areas. We
begin with brief reviews of the changes in social policy in the 1990s and of the literature on the
impacts of the changes, focusing on the literature examining rural and urban impacts. We then
outline a difference- in-difference approach to the analysis of this issue. While cognizant of the
limitations of this approach, we felt that it offered the best option for generating reliable
information about the impacts of this broad set of changes iii In the next section of the paper, we
describe the data, the subsamples of the 1989-1990 and 2000-2001 March Supplement to the
Current Population Survey comprised of single women between the ages of 18-54, with and
without children. We discuss the limitations of our study design and data. We then present the
findings of the difference- in-difference analysis, which looks for evidence of impact of social
policy on the employment and poverty of rural and urban single mothers with children. We are
particularly interested in whether these outcomes and impacts differ in rural versus urban places.
We conclude the paper with a discussion of what these results imply about the need for, and
focus of, place-based social policy.
SOCIAL POLICY CHANGES AFFECTING SINGLE MOTHERS WITH CHILDREN
IN THE 1990S
The 1990s produced significant changes in tax, welfare and other social policy that
increased the pressure on, and the incentives for, single mothers to work for pay. The most
important of these were:
• major expansions of the federal Earned Income Tax Credit (EITC) in 1991 and 1994, and
expansions of state EITCs,
4
• the welfare reform law of 1996, a major restructuring of the welfare law that replaced Aid to
Families with Dependent Children (AFDC) with Temporary Assistance to Needy Families
(TANF),
• increases in the federal minimum wage from $3.35 per hour in early 1990 to $5.15 in 1997,iv
• expansion of Medicaid eligibility (importantly, to all children in families with incomes
below the poverty line, and – for one year – to all women who left welfare for work) and
funding,
• changes in child care subsidies, the most important of which were the creation of a Child
Care and Development Block Grant out of a host of older programs, authority to use TANF
funds for child care, and expansion of the Child Care Tax Credit for lower middle income
familiesv.
Welfare reform ended the federal entitlement to cash assistance and provided a block
grant to states to fund the TANF program. Receipt of federally-funded assistance became
conditional on fulfilling work requirements and subject to time limits (a maximum lifetime limit
of 60 months). States are allowed to impose requirements that are more stringent than the
federal limits. As states reduced cash assistance, and as former recipients and those diverted
from the program entered the workforce, states expanded their expenditures on child care, health
care, transportation and training. These changes in the welfare law and the expanded work
supports, and the worker shortages experienced during the economic boom of the 1990s, led to
substantial increases in work and earnings among low income families, particularly those
headed by single mothers. As Blank notes,
Combined, these changes constitute a revolution in public assistance programs within the
United States over this past decade. Federal dollars available to support working low
SINGLE MOTHER WORK AND POVERTY UNDER WELFARE REFORM
5
income families increased from $11.0 billion in 1988 to $66.7 billion in 1999. Dollars
paid in cash welfare support to (largely nonworking) families headed by non-elderly,
non-disabled adults rose from $24 billion in 1988 to $27 billion in 1992, then fell to $13
billion by 1999 (all numbers in 2000 dollars). This suggests that the work incentives
imbedded in the public assistance system should have increased markedly over this
period: cash assistance became far less available, welfare recipients were pushed much
harder to find employment and leave the rolls, the returns to low wage work rose, and the
availability of work supports (child care and health insurance) increased to low income
families [Blank, 2002, p.1108].
RURAL AND URBAN DIFFERENCES IN WELFARE POLICY IMPACTS AND
OUTCOMES: A REVIEW OF SELECTED STUDIES
Since the passage of welfare reform in 1996, there has emerged an impressive body of
research evaluating the impact of this law and of the changes in social policy implemented
during the 1990s. Blank [2002] provides a summary and critique of this literature, focusing
particularly on econometric studies of impacts on caseloads, labor force participation, income,
poverty, economic well-being, marriage and fertility, and on experimental studies of the impact
of particular policy choices. Overall, these studies provide evidence that at least some of the
significant declines in welfare caseload and increases in labor force participation among less-
skilled mothers is due to the changes in the welfare and work support policy changes during the
past decade. Some of the studies also provide evidence that some programs appear to have
increased employment and reduced poverty. It is still too early to reach other than very
preliminary conclusions about the impact of these reforms on marriage and fertility.

6
Little of this literature has examined the extent to which these impacts are affected by
place of residence, by the circumstance of living in an urban or a rural area. The re are certainly
differences in opportunities to work, quality of jobs, and availability of work supports across the
rural-urban continuum, and therefore reason to wonder whether outcomes might be less
favorable in rural areas, as suggested in the introduction to this paper. A review of this literature
in Weber et al. [2001] suggests a number of conclusions about differences in welfare-policy
related outcomes in rural and urban areas:
• Declines in caseloads have generally been smaller in rural areas, and differences appear to
be related to differences in state policy.
• Evidence on rural and urban differences in employment outcomes is mixed, with
experimental evidence suggesting positive employment and earnings gains under welfare
reform in urban areas but not in rural areas.
• There is some reason to believe that the ameliorative effect of public assistance for single
mothers with children has declined since 1996, and that it has declined more in rural areas.
• For the most part, however, the impact of welfare reform on poverty was not very different
in rural and urban areas.
Previous studies of rural and urban differences have examined selected outcomes of the
changes in welfare policy and using data from the early years after the passage of the 1996
welfare law. vi By examining employment and poverty outcome indicators that address the
intensity of employment and the severity of poverty, and using more recent data, we attempt in
this paper to provide new and more compelling evidence on the hypothesis of rural-urban
differences in the impacts of welfare reform and social policy changes of the 1990s.
SINGLE MOTHER WORK AND POVERTY UNDER WELFARE REFORM
7
ESTIMATING IMPACTS OF SOCIAL POLICY: DIFFERENCE-IN-DIFFERENCE
ANALYSIS
“Estimating the overall effects of structural welfare reform of the type that has occurred
in the 1990s – that is, a reform that bundles together a number of significant changes in the
program whose joint impact is to change the basic nature of the welfare program(s) involved – is
perhaps the most challenging question for evaluators” [Moffit and Ver Ploeg, 1999 p. 63]. Of
the two methods (time series analysis and difference-in-difference analysis) most appropriate for
evaluating the overall effects of the package of social policy, we employ difference- in-
difference estimators, which compare changes in outcomes for a group expected to be affected
by the policy changes with changes in outcomes for those unlikely to be affected by the policy
changes. In our analysis we compare changes in work and poverty outcomes of single mothers
during the 1990s with changes in those same indicators for a comparison group that was
ineligible to participate in the major programs that changed: single women without children. In
the usual difference- in-difference analysis of welfare reform, one first computes changes in
outcomes (the “difference”) and then compares these differences between single mothers and
single women without children (the “difference-in-difference”). If one is further interested in
how these difference–in-differences compare between rural and urban areas, one then needs to
generate “difference- in-difference- in-difference” estimators. Are the “differences- in-
differences” between single mothers and single women without children different in rural and
urban areas? We follow the lead of McKernan et al. [2002] in estimating differences- in-
differences- in-differences.
A critical issue in assessing the validity of any nonexperimental method is the extent to
which the comparison group is believed to be similar to the group affected by the policy change.
“A key assumption in the method is that the evolution of outcomes of the groups affected by the
8
policy change (i.e. single mothers) would be the same as that of the comparison group in the
absence of the policy change. A major threat to the credibility of this method is that the two
groups are sufficiently different in their observed and unobserved characteristics (although
observed characteristics can be controlled for) that these differences, and not the policy
difference, account for the differences in outcomes” [Moffit and Ver Ploeg, 1999, p. 59]. How
good is the assumption that the changes in work and poverty of single mothers over the 1990s
would have been the same as that of single women without children if there had been no
changes in social policy in this decade? McKernan et al. [2002, p. 266] provide some evidence
that, for employment at least, the trends of single mothers and single women without children
are similar before welfare reform, implying that single women without children and single
mothers are comparable, at least with regard to changes in work behavior.
Another source of concern in using single women without children as a comparison
group for single mothers in welfare reform evaluation is that welfare policy changes under
TANF were intended to affect marriage and fertility decisions, and thus might affect whether a
single woman ended up in the treatment or the comparison group, or even whether a woman
ended up in our sample at all in 2000-2001 due to policy- induced marriage. Schoeni and Blank
[2000] for example, analyze changes in outcomes for all women 15-64 years old, citing
evidence that fertility and marital status are affected by welfare policy. They present results
separately for women with different education levels, with the idea that women with least
schooling are most likely to be affected by the welfare system.
Other researchers view the risks of focusing on single women as unimportant
[McKernan et al., 2002, p. 266; Meyer and Rosenbaum, 2001, p. 19]. Our primary analysis
examines single women only, although we consider the possibility of endogeneity of policy and
fertility in an alternative specification. There appears to be stronger evidence of effects of
SINGLE MOTHER WORK AND POVERTY UNDER WELFARE REFORM
9
welfare policy on fertility than on marriage, so we compare less educated and more educated
single women as a specification test that allows for the possibility of fertility effects.
DATA
We use data from the Current Population Survey (CPS), a monthly survey of about
50,000 U.S. households designed to be representative of the national population. The March
Supplement to the CPS obtains information about earnings, employment, welfare participation
and income, among other things. We use a subsample of the CPS that includes households
headed by single women 18-54 years old for two time periods: 1989-90 and 2000-2001. These
time periods bracket the major changes in social policy in the 1990s and, of particular
importance, include four years after the implementation of welfare reform in all the states in
1997. These two time periods also represent the same point in the business cycle: the last two
business cycle peaks were in 1990 (third quarter) and 2001(first quarter)vii.
The subsample of female-headed households is subdivided into those living in
metropolitan counties (“urban”) and those living in nonmetropolitan counties (“rural”). These
groups are further subdivided into those living with children under 18 (“mothers”) and those
with no children under 18 in the household (“childless women”) viii.
The rotation scheme of the CPS results in about half of the respondents in each March
survey having been respondents in the prior March Survey. Since we are using data from March
Supplements in successive years, we delete half of one year’s sample in order to insure that we
are not including some respondents twice. We include the entire sample for the first year of each
two-year period (1989 and 2000) and delete observations for the outgoing rotation in the second
year (1990 and 2001) since this cohort had been surveyed the previous year. The resulting

10
sample sizes are shown in Table 1 for each of the four subsamples of single women for each
time period. For 2000-01, there were 1,090 single mothers and 1,206 single childless women in
the rural sample and 4,502 single mothers and 6,125 single childless women in the urban
sample.
We examine public assistance and Earned Income Tax Credit receipt, employment and
poverty for these subsamples. In order to provide some context for the discussion of the impact
of the policy changes on work and poverty, we examine how receipt of welfare and amount of
welfare income changed over the period for single mothers. Welfare receipt is determined by
whether the respondent indicated that the family received any public assistance the previous
calendar year (the CPS’s FINCPAW variable). ix We also report the amount of public assistance
(FPAWVAL) for those single mothers who receive it.
The CPS income measure does not include any Earned Income Tax Credit (EITC)
received by the family and hence the computation of poverty status does not reflect EITC receipt
[Lichter and Jensen, 2002]. The significant increases in the EITC program over the 1990s makes
this a potentially important source of income for many single mother families. The CPS did not
collect information on the EITC before 1992, and so we are unable to determine from the CPS
the size of the changes in EITC payments over the period of our analysis. We do, however,
report the size of the EITC for 2000-2001 to provide some indication of its importance to single
mother families at the end of the decade.
We examine both employment status and intensity of employment. A respondent is
considered employed if she indicated that she was either “working” or “with job, not at work”.
This variable (ALFSR) measures labor force status as of the interview week. For those who are
employed, we examine intensity of employment using the CPS classification (A-WKSTA)

SINGLE MOTHER WORK AND POVERTY UNDER WELFARE REFORM
11
indicating current work status, full- time (if they usually worked more than 35 hours per week)
or part-time (those usually working 35 hours or less per week). We also consider whether they
worked a full year (40 or more weeks) the previous year (by recoding WEXP).
The various social policy changes examined in this paper were intended to reduce
economic hardship for single mother families with children. Perhaps the best single indicator of
the success of these policies would be evidence that the policies induced reductions in the
poverty rate for the target group. We examine both changes in the overall poverty rate for our
subgroups, and changes in the depth of poverty. In spite of its well-known limitations, we use
the official poverty rate as our poverty measurex. We also consider changes in the percent of
households that are in deep poverty (incomes below 50 percent of the poverty threshold),
poverty (0.5 to .99 of poverty threshold) and near poverty (1.0 to 1.5 of the poverty threshold).
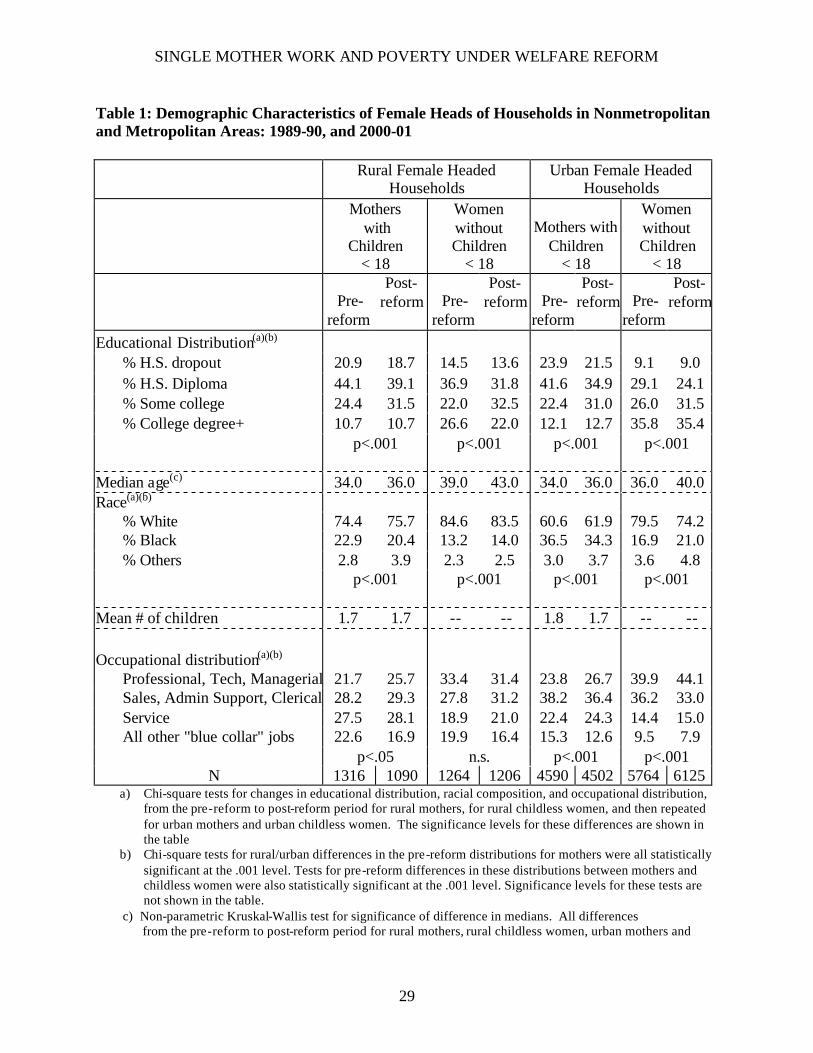
There appear to be some important differences in the demographic characteristics of
female headed households in metropolitan and nonmetropolitan areas that might affect the
impact of welfare reform and other social policies (Table 1). Rural female heads are more likely
to be white than urban female heads. Rural childless single female heads are more likely to have
dropped out of high school and less likely to have completed college.
Table 1 also shows some changes over the decade in these characteristics, including increased
levels of ‘some college’ and decreased levels of “high school dropout” for single mothers and
childless women, increases in average age of single mothers and childless women in sample xi,
and decreases in the proportions of single mothers who are black. For the most part the patterns
of change do not appear to differ between urban and rural areas.
Finally, and importantly, there are significant and large differences in demographic
characteristics between single mothers and childless single female household heads. Single
12
childless female heads are older, better educated and more likely to be white than single
mothers. We explore the possibility that demographic differences affect our results by
estimating probit models of employment and poverty that include demographic controls.
RESULTS: DIFFERENCE-IN-DIFFERENCE ANALYSIS WITH UNCONDITIONAL
PROBABILITIES
We first examine the changes in outcomes for single mothers in rural and urban areas
between 1989-90 (pre-reform) and 2000-01 (post-reform) by calculating the unconditional
probabilities of employment and poverty for rural and urban single female household heads with
children under 18 for each time period. Then we estimate differences- in-differences by
comparing these outcomes with those of rural and urban single female household heads without
children: Were these changes in rural and urban areas due to the effect of the social policy
changes? In the final section, we estimate the difference-in-differences- in-differences to answer
the question: Were the impacts of policy changes different in rural v. urban areas?
The Policy Effect: Women With vs. Women Without Children
Single mothers with children under 18 reduced their use of public assistance dramatically
during the 1990s: the percent of these mothers in rural areas receiving welfare declined from 31
to 15 percent. The percent of urban single mothers with children receiving welfare declined
from 33 to 15 percent. Those receiving welfare saw large declines in the amount of welfare
payments: the median rural welfare payment declined almost 50 percent in real terms from
$3,817 to $1,944, while the median urban welfare payment declined 39 percent, from $5,183 to
$3,160 (all dollar amounts in the paper are reported in 2000 dollars).
SINGLE MOTHER WORK AND POVERTY UNDER WELFARE REFORM
13
In 2000-01 single mothers reported significant use of the EITC: 63.7 percent of rural
single mothers and 58.0 percent of urban single mothers received Earned Income Tax Credit
payments. The median EITC payment for rural single mothers was $2,200, for urban mothers, it
was $2,066. The share of rural single mothers receiving EITC was four times the share receiving
welfare, and the median EITC payment was about 10 percent larger than the median welfare
payment in 2000-01.
We attempt to assess the extent to which the changes observed in single mother
outcomes are due to the changes in social and tax policy during the 1990s by comparing these
changes with those of a comparison group (single women without children under 18) that was
largely ineligible for most of the policies outlined in an earlier section of this paper. To the
extent that the assumptions underlying our analysis hold, difference- in-difference estimators
provide estimates of the effect of these policies on the employment and poverty outcomes of the
target population for most of these policies: single mothers with children. The differences
highlighted below are found in Table 2.
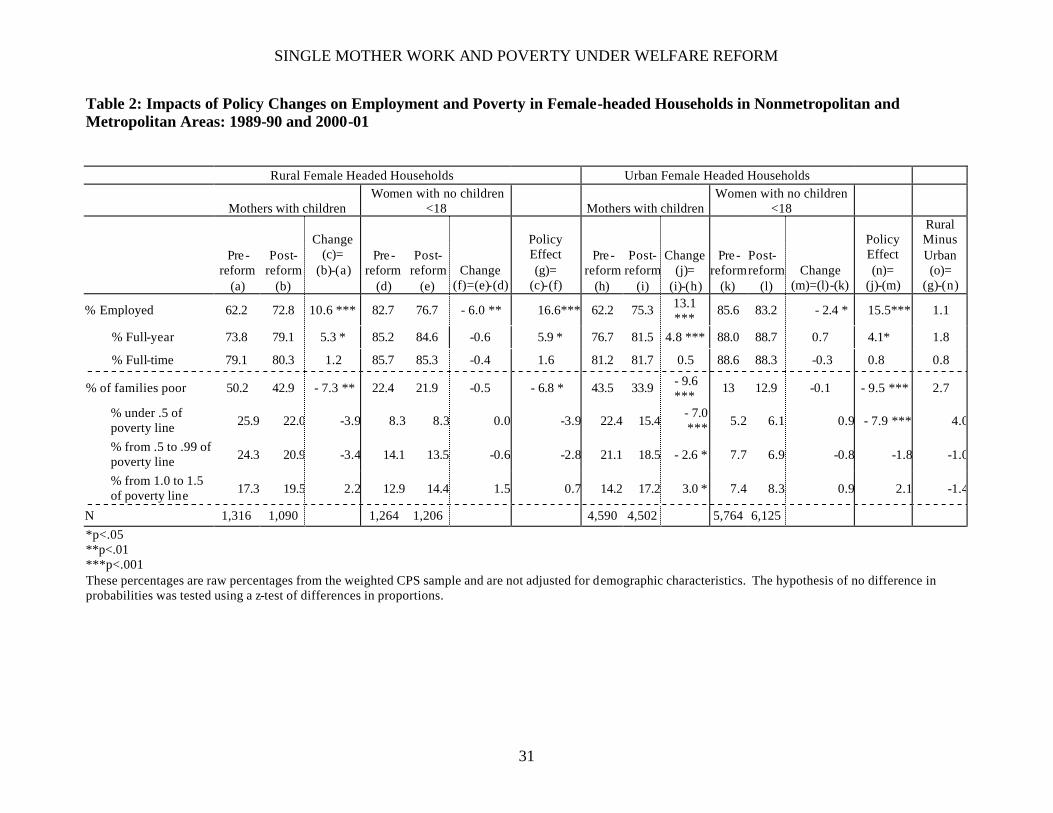
Employment. The 1990s saw increases in both work and full-year work among those
working for both urban and rural single mothers. The percent of rural single mothers employed
increased significantly (from 62 to 73 percent) during the decade, as did the percent of these
with full year work (from 74 to 79 percent) (Table 2). The percent of urban single mothers
employed increased significantly (from 62 to 75 percent) during the decade, as did the percent
of these with full year work (from 77 to 82 percent). However, full-time work did not increase
for either rural or urban single mothers.
The policy changes appear to have increased employment among both urban and rural
single mothers. The “policy effect” on employment is significant in both urban and rural areas:
14
rural single mother employment increased by 16.6 percentage points relative to their childless
counterparts and urban single mother employment increased by 15.5 percentage points relative
to their childless counterparts. We caution that the policy relevance of these differences rests on
the assumption that the observed declines in employment of women without children during the
1990s (-6.0 percentage points in rural areas and -2.4 percentage points in urban areas) would
have been observed for single mothers in the absence of the policy changes. It is possible that
our estimator overestimates the impact to the extent that the increase in single mother entry into
the labor force may have affected employment of childless women.
The policy changes also significantly increased the percent of employed single mothers
who worked full-year. Rural full year employment for single mothers increased by 5.9
percentage points and urban full-year employment increased by 4.1 percentage points because of
the policy changes.
The policy changes of the 1990s do not appear to have affected the share of working
single mothers who worked full-time in either rural or urban places: the share of working single
women who worked full- time did not change significantly for any of the groups of single
women.
Poverty . The 1990s also saw a significant reduction in poverty rates for both rural and
urban single mothers. The poverty rate appears to have declined for urban single mothers, more
than for rural single mothers. This decline was concentrated on those in deep poverty (those
whose incomes are below 50 percent of their poverty threshold): the rate of deep poverty in
urban areas declined by 7.0 percentage points from 22.4 percent to 15.4 percent. Rates of “near
poverty” (incomes between the poverty threshold and 150% of threshold) increased 3
percentage points for urban single mother families during the 1990s from 14.2 to 17.2 percent.

SINGLE MOTHER WORK AND POVERTY UNDER WELFARE REFORM
15
The impact of the social policy changes of the 1990s on single mother poverty was
substantial in both rural and urban areas. These changes reduced poverty by 6.8 percent in rural
areas and 9.5 percent in urban areas. And deep poverty was significantly reduced in urban areas:
the policy changes led to a 7.9 percentage point reduction in single mother deep poverty in
urban places.
Urban vs. Rural Policy Effect
Whether the policy impacts differed between rural and urban areas is indicated by the
figures in the right-most column of Table 2. Here the estimates of impact suggest similar
impacts of the policies of the 1990s: the slightly greater impacts on employment and full year
employment for rural than urban single mothers are not significantly different from one another.
The impact of these policies on poverty and deep poverty appear, however, to have been quite a
bit greater in urban areas than rural areas (poverty was reduced 2.7 percentage points more in
urban areas and deep poverty reduced 4 percentage points more), but these impacts are also
imprecisely estimated.
Our results from the unconditional difference- in-difference analysis are generally
consistent with those studies cited earlier in the paper, although our estimated impacts tend to be
larger because they are examined over a longer time period. Although earlier studies suggest
that caseload declines have been greater in urban areas, we find that welfare receipt has declined
greatly in both rural and urban areas (with no significant difference between urban and rural
declines). We find, like McKernan et al. [2002], that the impact of the policy changes on
employment is large in both urban and rural areas and that the rural urban difference is not
significant.. McKernan et al. estimate that policy changes between 1995-96 and 1998-99
increased the employment of rural and urban single mothers by 6.7 and 8.7 percentage points
16
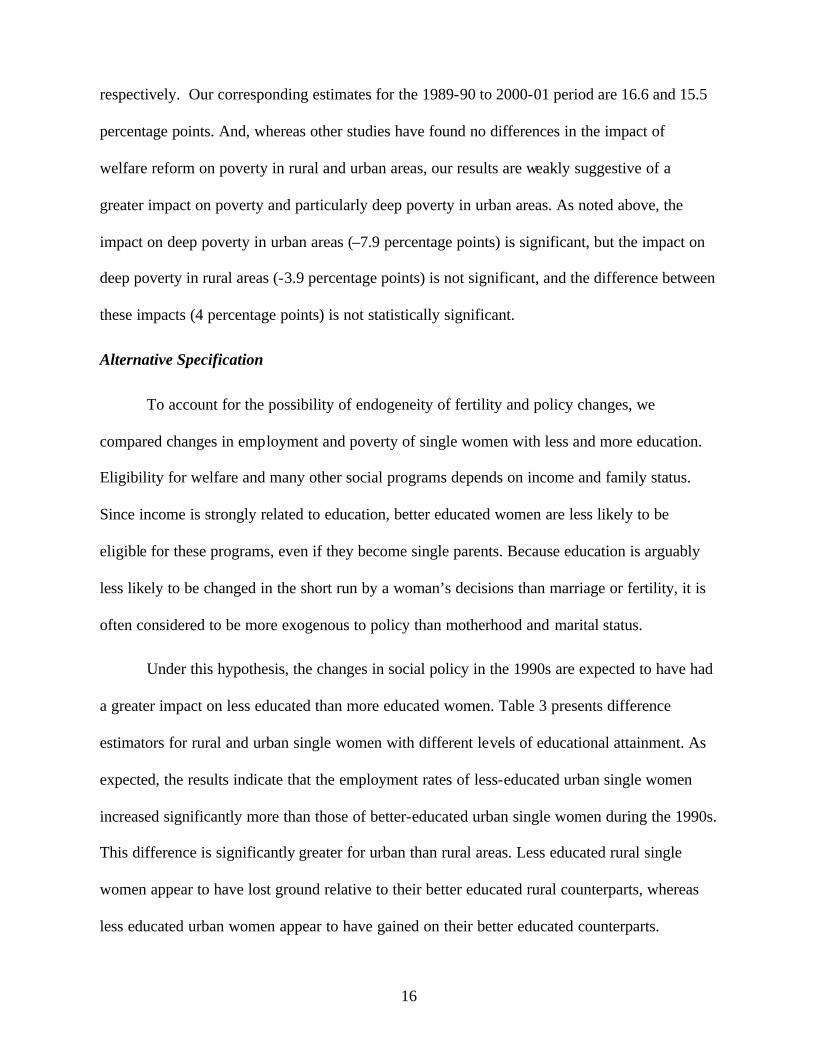
respectively. Our corresponding estimates for the 1989-90 to 2000-01 period are 16.6 and 15.5
percentage points. And, whereas other studies have found no differences in the impact of
welfare reform on poverty in rural and urban areas, our results are weakly suggestive of a
greater impact on poverty and particularly deep poverty in urban areas. As noted above, the
impact on deep poverty in urban areas (–7.9 percentage points) is significant, but the impact on
deep poverty in rural areas (-3.9 percentage points) is not significant, and the difference between
these impacts (4 percentage points) is not statistically significant.
Alternative Specification
To account for the possibility of endogeneity of fertility and policy changes, we
compared changes in employment and poverty of single women with less and more education.
Eligibility for welfare and many other social programs depends on income and family status.
Since income is strongly related to education, better educated women are less likely to be
eligible for these programs, even if they become single parents. Because education is arguably
less likely to be changed in the short run by a woman’s decisions than marriage or fertility, it is
often considered to be more exogenous to policy than motherhood and marital status.
Under this hypothesis, the changes in social policy in the 1990s are expected to have had
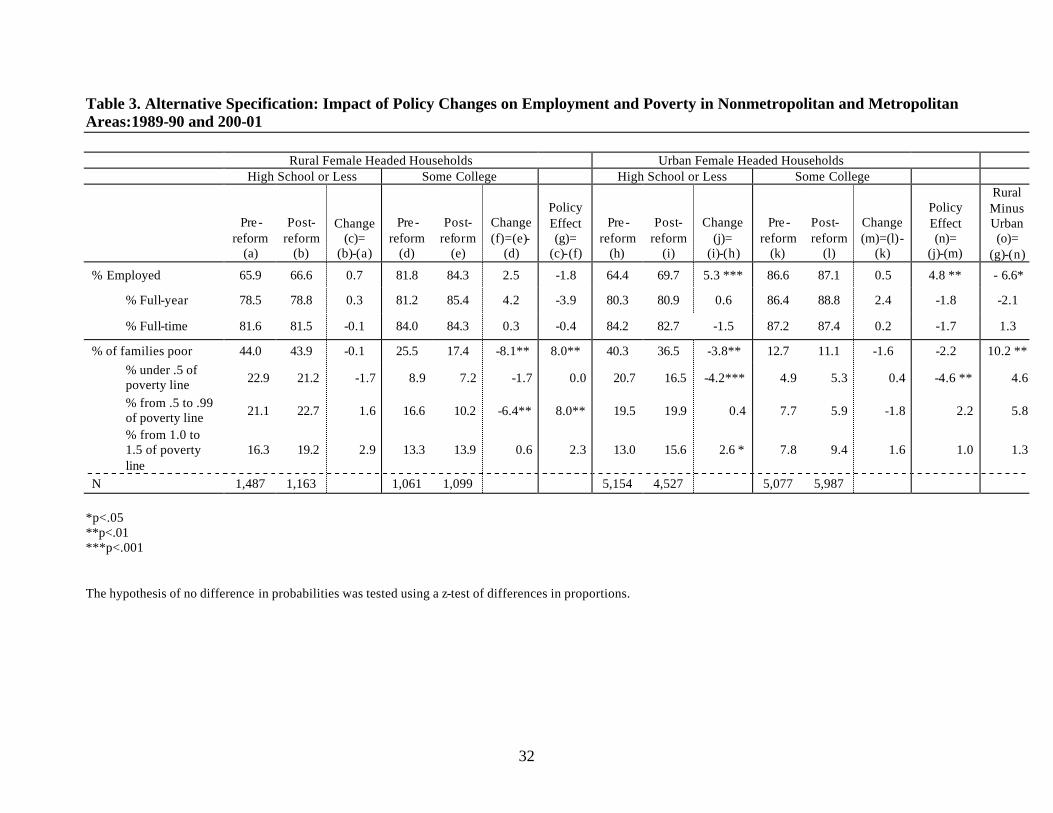
a greater impact on less educated than more educated women. Table 3 presents difference
estimators for rural and urban single women with different levels of educational attainment. As
expected, the results indicate that the employment rates of less-educated urban single women
increased significantly more than those of better-educated urban single women during the 1990s.
This difference is significantly greater for urban than rural areas. Less educated rural single
women appear to have lost ground relative to their better educated rural counterparts, whereas
less educated urban women appear to have gained on their better educated counterparts.
SINGLE MOTHER WORK AND POVERTY UNDER WELFARE REFORM
17
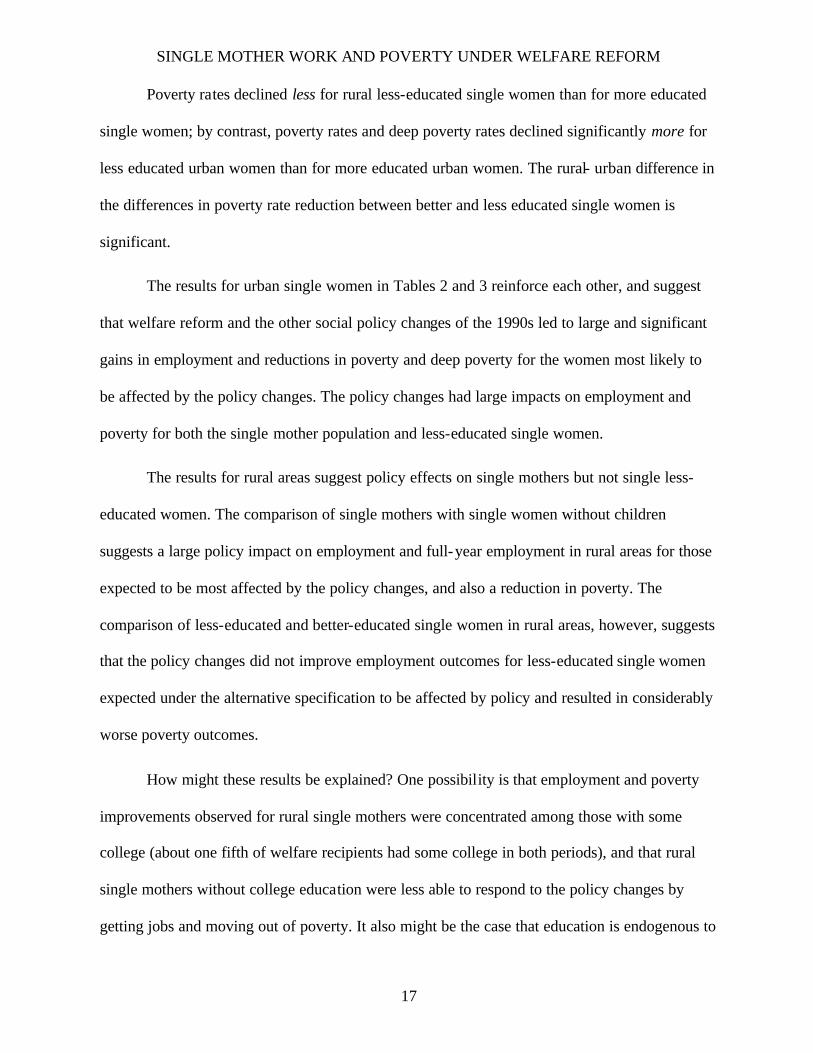
Poverty rates declined less for rural less-educated single women than for more educated
single women; by contrast, poverty rates and deep poverty rates declined significantly more for
less educated urban women than for more educated urban women. The rural- urban difference in
the differences in poverty rate reduction between better and less educated single women is
significant.
The results for urban single women in Tables 2 and 3 reinforce each other, and suggest
that welfare reform and the other social policy changes of the 1990s led to large and significant
gains in employment and reductions in poverty and deep poverty for the women most likely to
be affected by the policy changes. The policy changes had large impacts on employment and
poverty for both the single mother population and less-educated single women.
The results for rural areas suggest policy effects on single mothers but not single less-
educated women. The comparison of single mothers with single women without children
suggests a large policy impact on employment and full-year employment in rural areas for those
expected to be most affected by the policy changes, and also a reduction in poverty. The
comparison of less-educated and better-educated single women in rural areas, however, suggests
that the policy changes did not improve employment outcomes for less-educated single women
expected under the alternative specification to be affected by policy and resulted in considerably
worse poverty outcomes.
How might these results be explained? One possibility is that employment and poverty
improvements observed for rural single mothers were concentrated among those with some
college (about one fifth of welfare recipients had some college in both periods), and that rural
single mothers without college education were less able to respond to the policy changes by
getting jobs and moving out of poverty. It also might be the case that education is endogenous to

18
the policy change, and that policy- induced gains in education led to better poverty outcomes for
single women in rural areas (whether or not they had children). While possible, this explanation
of endogeneity of education and policy change seems less plausible than the explanation that
already better-educated single mothers benefited most from welfare reform. Whether changes in
educational attainment are endogenous or not, these changes might have had a greater impact on
poverty and employment outcomes for rural women than any changes in fertility, given rural
labor conditions.
The alternative specification rests on the assumption that better educated and less
educated single women would have had the same employment and poverty outcomes over the
1990s in the absence of the policy changes. In the end, this seems less convincing than the
assumption underlying the main specification that single mothers and childless women would
have had similar outcomes.
RESULTS: CONDITIONAL DIFFERENCE-IN-DIFFERENCE ANALYSIS
In this section of the paper, we investigate whether the differences in outcomes we
observed in the previous section might have been affected by the differences in demographic
characteristics among rural and urban single mothers and single females without children, and
changes in these characteristics during the 1990s.
In order to explore the extent to which any differences in demographic characteristics
among single women in rural and urban areas affect the findings of the difference- in-difference
analysis, we estimate a set of probit models that include a vector of demographic characteristics
along with the vector of binary variables indicating residence, the presence of children and time
period and their interactions. The employment model is:
Pr (E=1|x) = Φ (Xß)
SINGLE MOTHER WORK AND POVERTY UNDER WELFARE REFORM
19
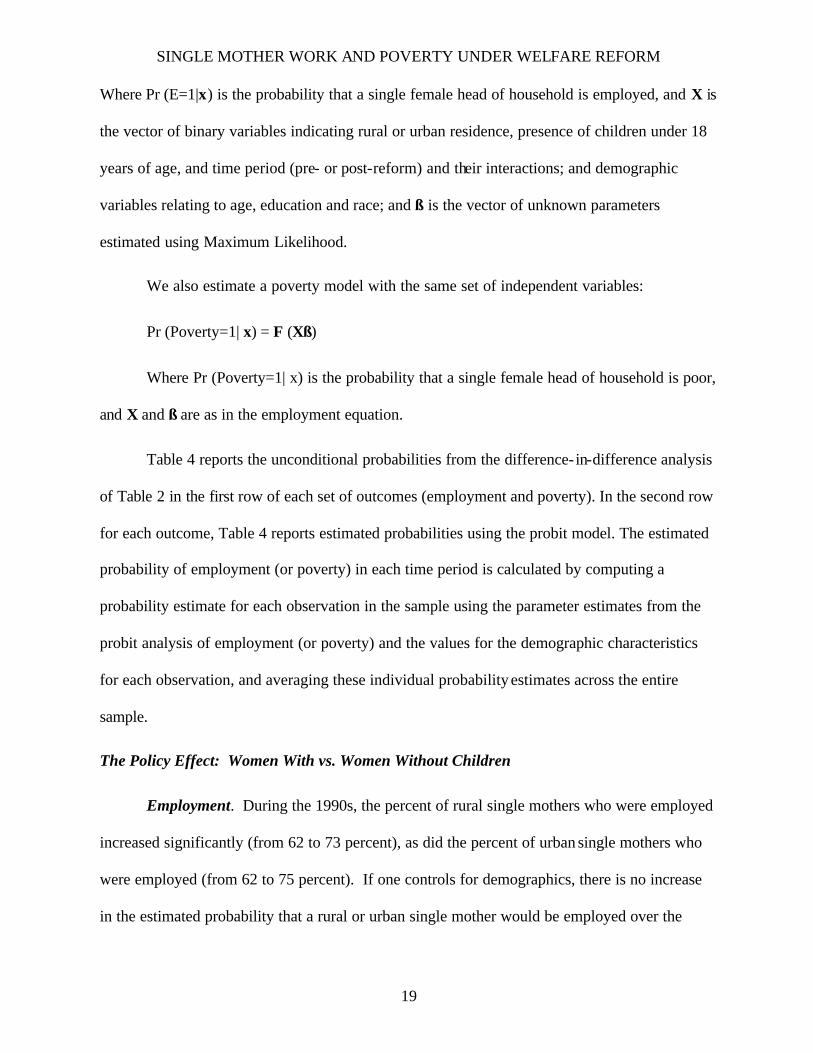
Where Pr (E=1|x) is the probability that a single female head of household is employed, and X is
the vector of binary variables indicating rural or urban residence, presence of children under 18
years of age, and time period (pre- or post-reform) and their interactions; and demographic
variables relating to age, education and race; and ß is the vector of unknown parameters
estimated using Maximum Likelihood.
We also estimate a poverty model with the same set of independent variables:
Pr (Poverty=1| x) = Φ (Xß)
Where Pr (Poverty=1| x) is the probability that a single female head of household is poor,
and X and ß are as in the employment equation.
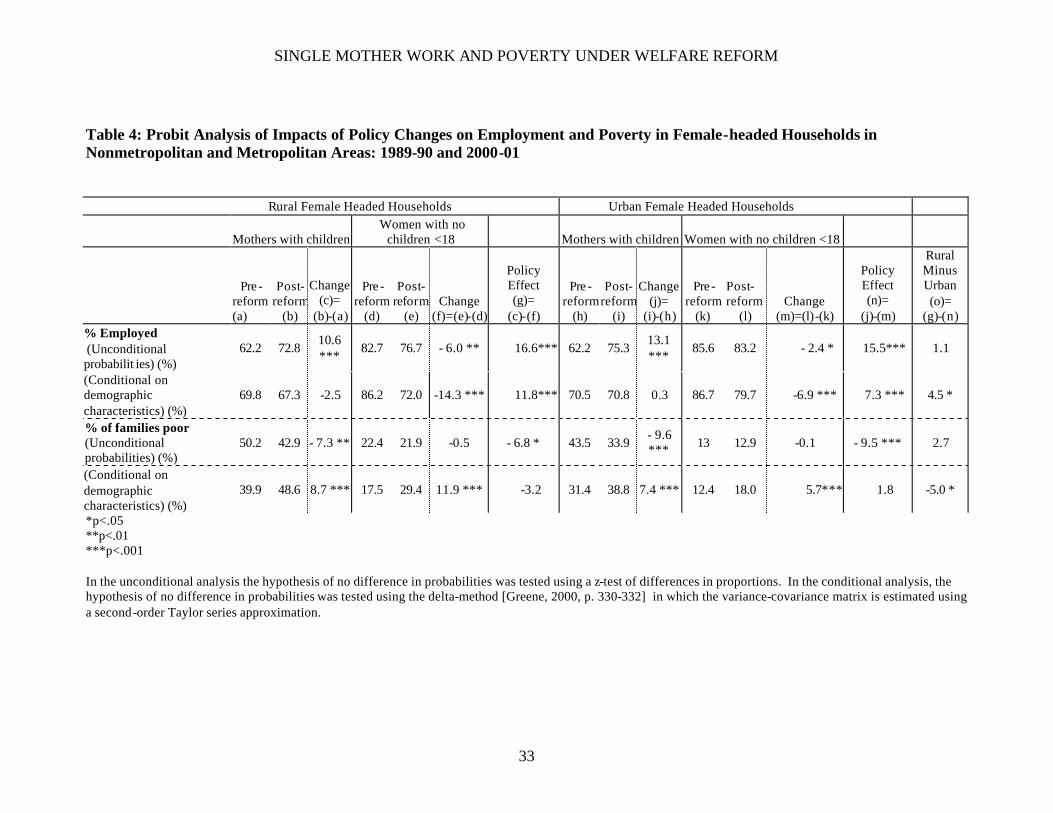
Table 4 reports the unconditional probabilities from the difference- in-difference analysis
of Table 2 in the first row of each set of outcomes (employment and poverty). In the second row
for each outcome, Table 4 reports estimated probabilities using the probit model. The estimated
probability of employment (or poverty) in each time period is calculated by computing a
probability estimate for each observation in the sample using the parameter estimates from the
probit analysis of employment (or poverty) and the values for the demographic characteristics
for each observation, and averaging these individual probability estimates across the entire
sample.
The Policy Effect: Women With vs. Women Without Children
Employment. During the 1990s, the percent of rural single mothers who were employed
increased significantly (from 62 to 73 percent), as did the percent of urban single mothers who
were employed (from 62 to 75 percent). If one controls for demographics, there is no increase
in the estimated probability that a rural or urban single mother would be employed over the
20
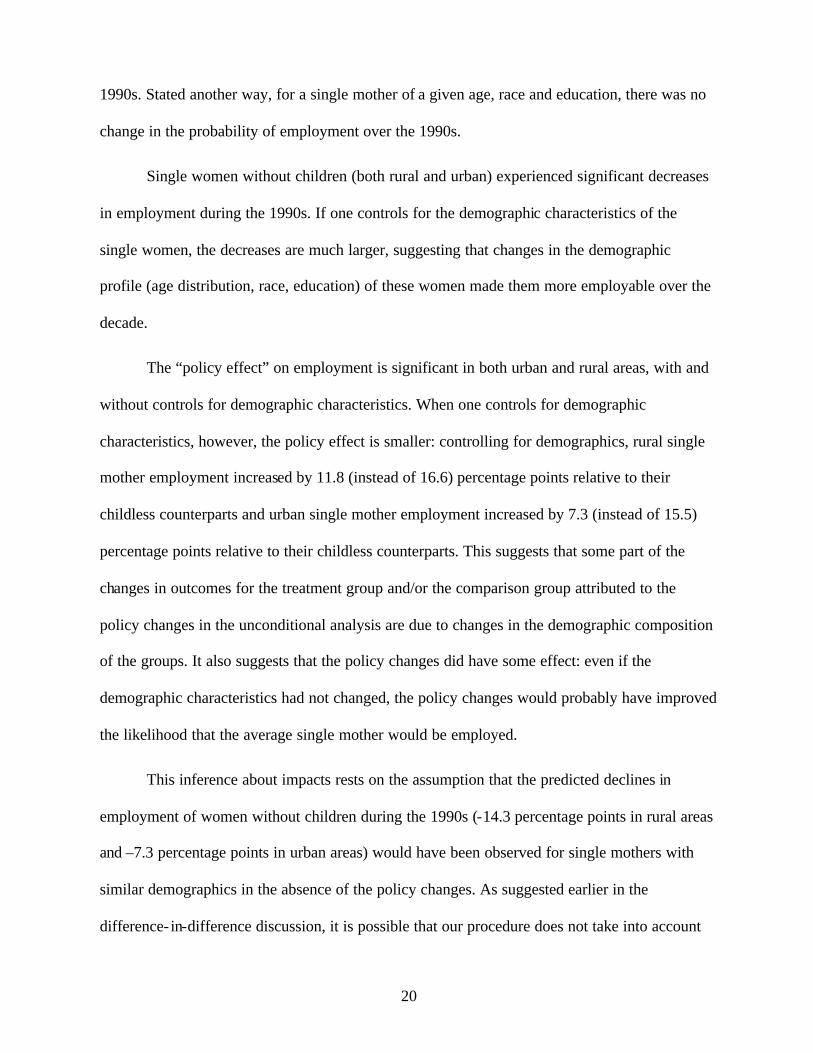
1990s. Stated another way, for a single mother of a given age, race and education, there was no
change in the probability of employment over the 1990s.
Single women without children (both rural and urban) experienced significant decreases
in employment during the 1990s. If one controls for the demographic characteristics of the
single women, the decreases are much larger, suggesting that changes in the demographic
profile (age distribution, race, education) of these women made them more employable over the
decade.
The “policy effect” on employment is significant in both urban and rural areas, with and
without controls for demographic characteristics. When one controls for demographic
characteristics, however, the policy effect is smaller: controlling for demographics, rural single
mother employment increased by 11.8 (instead of 16.6) percentage points relative to their
childless counterparts and urban single mother employment increased by 7.3 (instead of 15.5)
percentage points relative to their childless counterparts. This suggests that some part of the
changes in outcomes for the treatment group and/or the comparison group attributed to the
policy changes in the unconditional analysis are due to changes in the demographic composition
of the groups. It also suggests that the policy changes did have some effect: even if the
demographic characteristics had not changed, the policy changes would probably have improved
the likelihood that the average single mother would be employed.
This inference about impacts rests on the assumption that the predicted declines in
employment of women without children during the 1990s (-14.3 percentage points in rural areas
and –7.3 percentage points in urban areas) would have been observed for single mothers with
similar demographics in the absence of the policy changes. As suggested earlier in the
difference- in-difference discussion, it is possible that our procedure does not take into account
SINGLE MOTHER WORK AND POVERTY UNDER WELFARE REFORM
21
how single mother entry into the labor force may have affected employment of childless single
women.
Poverty. Poverty rates are higher in rural areas than in urban areas, both in the absence
of controls and when controlling for demographics. The unconditional difference results
indicated that during the 1990s there was a significant reduction in the poverty rate for both
urban and rural single mothers. The reduction for urban single mothers (-9.6 percentage points)
was slightly larger than that for rural single mothers (-7.3 percentage points). When
demographic characteristics are taken into account, however, predicted poverty rates increased
over the decade for single mothers – an increase of 8.7 percentage points for rural single
mothers and of 7.4 percentage points for urban single mothers. If the demographics of the
populations had not changed, poverty rates would have increased significantly. Single mother
poverty apparently went down in the 1990s because the characteristics of single mothers
changed over the decade in a way that improved their prospects for moving out of poverty.
When demographics are controlled for, predicted poverty rates also increased
significantly for single women without children. If there had been no changes in demographics,
poverty rates would have increased 11.9 percentage points for rural single women without
children and 5.7 percentage points for their urban counterparts. Observed poverty rates for
single women without children, however, did not change much between the early and late
1990s. This suggests that demographics for single women without children changed in a way
that facilitated movement out of poverty.
The unconditional difference- in-difference analysis suggested that the social policy
changes of the 1990s reduced single mother poverty by 6.8 percentage points in rural areas and
9.5 percentage points in urban areas, with both estimates statistically significant. When the
demographic characteristics are controlled for, however, the differences are not significantly

22
different from zero in either instance. If demographic characteristics had not changed (i.e.,
holding demographics constant), the social policy changes of the 1990s would have not have
reduced poverty.
Urban vs. Rural Policy Effect
Employment. While the unconditional difference- in-difference estimates suggested that
employment impacts of the policies of the 1990s were not significantly different from one
another in urban and rural areas, the conditional estimates from the probit analysis indicate that
the impacts of these policy changes on employment were significantly different in rural and
urban areas: the policy impact on employment was 4.5 percentage points higher in rural areas
than in urban areas. The policy changes of the 1990s would have increased the likelihood of
employment for single mothers with average demographic characteristics almost 5 percentage
points more in rural places than urban places.
Poverty. The unconditional difference-in-difference-in-difference estimates suggest
similar impacts of the policies of the 1990s in both rural and urban places: the impacts on
poverty for rural and urban single mothers are not significantly different from one another. The
probit analysis, however, finds a significant 5.0 percentage point difference in the impacts
between rural and urban areas: controlling for demographic characteristics, predicted poverty
rates in rural areas went down 5.0 percentage points more in rural than in urban areas. If
characteristics of the population had not changed during the 1990s in the way they did, the
policies would have reduced poverty 5 percentage points more in rural than in urban areas. That
the policy changes reduced observed poverty less in rural areas than in urban suggests that the
demographic changes in the urban areas were more favorable to poverty reduction than in the
rural areas.
SINGLE MOTHER WORK AND POVERTY UNDER WELFARE REFORM
23
WHAT HAVE WE LEARNED?
When demographic characteristics are controlled for, welfare reform and the other social
policy changes of the 1990s increased employment but did not reduce poverty. The predicted
impact on both employment and poverty is greater in rural than in urban areas. These policy
changes increased estimated employment probabilities by 11.8 percentage points in rural areas
and 7.3 percentage points in urban areas, and the 4.5 percentage point greater impact in rural
areas is significant.
The impacts of the policy changes on single mother poverty were not significantly
different from zero in either rural or urban areas: neither the 3.2 percentage point reduction in
rural areas nor the 1.8 percentage point increase in urban areas was statistically significant at the
.05 level. However, the 5.0 percentage point difference between rural and urban areas in the
impacts was significant. The policy changes reduced poverty 5 percentage points more in rural
areas, holding demographics constant.
The differences in results between the unconditional analysis and the analysis that
controlled for demographic characteristics suggest that some of the policy impacts inferred from
the analysis of unconditional differences-in-differences were due to demographic differences
among the populations rather than the changes in policy. Likewise, the lack of difference in
inferred policy impacts between rural and urban areas in the unconditional analysis appears to
be due to differences in demographic characteristics of single female heads in those two areas.
Given similar demographics, rural places would have seen greater employment and poverty
impacts from welfare reform than urban areas.
It does not appear that social policy changes in the 1990s, in and of themselves,
systematically disadvantaged rural areas. Yet employment and poverty impacts of these changes
24
were not significantly better for single mothers in rural areas: the estimated employment and
poverty impacts of the policy changes were not larger than than those for their urban
counterparts, if demographics are not controlled for. It appears that there are some differences in
personal characteristics, local labor market conditions, work barriers or availability of services
that make it more difficult for the social policy changes to move single mothers in rural areas
into employment and out of poverty. The evidence in this paper points to differences in age, race
and education as contributors to the differential impact on single mothers in rural and urban
places. Age and race are of course not alterable by public policy, but the barriers to work based
on discrimination against older and minority workers are addressed in public policy. Perhaps
more amenable to policy is improvement in educational attainment. Improving the educational
attainment of rural single mothers would increase their earning power and improve their life-
chances.
The fact that rural single mothers have higher rates of high school completion and some
college than their urban counterparts, however, points to differences in local labor markets and
local work barriers as contributing to the differential impacts. Some studies have addressed the
extent to which differences in local labor market conditions between rural and urban places play
a role in explaining differences in employment and poverty outcomes for rural and urban
workers. Mills [2001] finds that local economic conditions have relatively weak effects on
transition rates from unemployment to employment, although adjacency to metropolitan areas
improves these rates for rural workers. Davis and Weber [forthcoming] find evidence that the
effect of local job growth on employment outcomes may be stronger in urban than in rural areas.
Cotter [2002] in a multi- level analysis using 1990 Public Use Microdata Samples
(PUMS) data, concludes that both labor market characteristics and household characteristics are
important in explaining poverty. He concludes that “much of the difference in poverty [between
SINGLE MOTHER WORK AND POVERTY UNDER WELFARE REFORM
25
metro and nonmetro areas] is attributable to the context of nonmetropolitan areas rather than the
composition of nonmetropolitan Americans. Although labor market characteristics account for
more than half of the difference in poverty between metropolitan and nonmetropolitan areas,
residents of nonmetropolitan areas are still significantly more likely to be poor.” [p. 549].
The evidence presented here suggests that the social policies of the 1990s would have
worked better in rural than in urban areas if age, race and educational characteristics had been
the same. The fact that employment and poverty impacts were no t better in rural areas suggests
that there are differences between rural and urban areas, perhaps related to local labor market
conditions and availability of services as well as demographic characteristics, that affect these
outcomes. It would help in the design of policy to have a better understanding of how these
differences affect the employment and poverty outcomes for disadvantaged populations. The
PUMS data from the 2000 Census will provide a rich opportunity to pursue this research.
REFERENCES
Blank, R. M. Evaluating Welfare Reform in the United States. Journal of Economic Literature,
December 2002, 1105-1166.
Citro, C. F. and Michael, R. T. Measuring Poverty: A New Approach, Washington DC:
National Academy Press, 1995.
Cotter, D. A. Poor People in Poor Places: Local Opportunity Structures and Household Poverty.
Rural Sociology, December 2002, 534-555.
26
Davis, E. E. and Weber, B. A. How Much Does Local Job Growth Improve Employment
Outcomes of the Rural Working Poor? Review of Regional Studies, forthcoming.
Duncan, G., Whitener, L., and Weber, B. Lessons Learned: Welfare Reform and Food
Assistance in Rural America in Rural Dimensions of Welfare Reform, edited by B.
Weber, G. Duncan and L. Whitener. Kalamazoo MI: W.E. Upjohn Institute for
Employment Research, 2002.
Economic Research Service. Rural Conditions and Trends. 1997, 18-24.
Edwards, M. E. Education and Occupations: Re-examining the Conventional Wisdom about
Later First Births Among American Mothers. Sociological Forum, 2002, 423-443.
Greene, W. H. Econometric Analysis. Prentice Hall, Upper Saddle River, New Jersey, 2000.
Findeis, J. and Jensen, L. Employment Opportunities in Rural Areas: Implications for Poverty
in a Changing Policy Environment. American Journal of Agricultural Economics, 1998,
1000-1007.
Fletcher, C. N., Flora, J. L., Gaddis, B. J., Winter, M. and Litt, J. S. Small Towns and
Welfare Reform: Iowa Case Studies of Families and Communities, in Rural Dimensions
of Welfare Reform, edited by B. Weber, G. Duncan and L. Whitener. Kalamazoo MI:
W.E. Upjohn Institute for Employment Research, 2002.
Gibbs, R.. Nonmetro Labor Markets in the Era of Welfare Reform, Rural America, Fall 2001,
11-21.
Lichter, D. T. and Jensen, L. Rural America in Transition: Poverty and Welfare at the Turn of
the Twenty-First Century, in Rural Dimensions of Welfare Reform, edited by B. Weber,
SINGLE MOTHER WORK AND POVERTY UNDER WELFARE REFORM
27
G. Duncan and L. Whitener. Kalamazoo MI: W.E. Upjohn Institute for Employment
Research, 2002.
McKernan, S. M., Lerman, R., Pindus, N. and Valente, J. The Impact of Welfare Policy on
the Employment of Single Mothers Living in Rural and Urban Areas in Rural
Dimensions of Welfare Reform, edited by B. Weber, G. Duncan and L. Whitener.
Kalamazoo MI: W.E. Upjohn Institute for Employment Research, 2002.
Meyer, B. D. and Rosenbaum, D. T. Welfare, the Earned Income Tax Credit, and the Labor
Supply of Single Mothers. Quarterly Journal of Economics, 2001,1063-1114.
Mills, B. Are Spells of Unemployment Longer in Non-Metropolitan Areas: Non-Parametric and
Semi-Parametric Evidence. Journal of Regional Science, 2000, 697-718.
Mills, B. F. Unemployment Duration in Non-Metropolitan Labor Markets. Growth and Change,
Spring 2001, 174-192.
Moffitt, R. Program Evaluation With Nonexperimental Data. Evaluation Review, June 1991,
297-314.
Moffit, R. A. and Ver Ploeg, M. eds, Evaluating Welfare Reform: A Framework and Review of
Current Work, Panel on Data and Methods for Measuring the Effects of Changes in
Social Welfare Programs, Washington DC: National Academy Press, 1999.
Schoeni, R. F. and Blank, R. M. What Has Welfare Reform Accomplished? Impacts on
Welfare Participation, Employment, Income, Poverty, and Family Structure. National
Bureau of Economic Research Working Paper 7627. Cambridge MA: NBER, 2000.
Short, K., Garner, T., Johnson, D. and Doyle, P. Experimental Poverty Measures, 1990 to
1997. Current Population Reports P60-205, Washington DC, 1999.

28
Weber, B. A., Duncan, G. J. and Whitener, L. A.. Welfare Reform in Rural America: What
have We Learned? American Journal of Agricultural Economics, December, 2001,
1282-1292,
Whitener, L. A., Weber, B. A. and Duncan, G. J. As the Dust Settles: Welfare Reform and
Rural America, in Rural Dimensions of Welfare Reform, edited by B. Weber, G. Duncan
and L. Whitener. Kalamazoo MI: W.E. Upjohn Institute for Employment Research,
2002.
SINGLE MOTHER WORK AND POVERTY UNDER WELFARE REFORM
29
Table 1: Demographic Characteristics of Female Heads of Households in Nonmetropolitan and Metropolitan Areas: 1989-90, and 2000-01
Rural Female Headed
Households Urban Female Headed
Households
Mothers with
Children < 18
Women without Children
< 18
Mothers with Children
< 18
Women without Children
< 18
Pre-
reform
Post-reform
Pre-
reform
Post-reform
Pre-
reform
Post-reform
Pre-
reform
Post-reform
Educational Distribution(a)(b)
% H.S. dropout 20.9 18.7 14.5 13.6 23.9 21.5 9.1 9.0 % H.S. Diploma 44.1 39.1 36.9 31.8 41.6 34.9 29.1 24.1 % Some college 24.4 31.5 22.0 32.5 22.4 31.0 26.0 31.5 % College degree+ 10.7 10.7 26.6 22.0 12.1 12.7 35.8 35.4
p<.001
p<.001
p<.001
p<.001
Median age(c) 34.0 36.0 39.0 43.0 34.0 36.0 36.0 40.0 Race(a)(b)
% White 74.4 75.7 84.6 83.5 60.6 61.9 79.5 74.2 % Black 22.9 20.4 13.2 14.0 36.5 34.3 16.9 21.0 % Others 2.8 3.9 2.3 2.5 3.0 3.7 3.6 4.8
p<.001
p<.001
p<.001
p<.001
Mean # of children 1.7 1.7 -- -- 1.8 1.7 -- -- Occupational distribution(a)(b)
Professional, Tech, Managerial 21.7 25.7 33.4 31.4 23.8 26.7 39.9 44.1 Sales, Admin Support, Clerical 28.2 29.3 27.8 31.2 38.2 36.4 36.2 33.0 Service 27.5 28.1 18.9 21.0 22.4 24.3 14.4 15.0 All other "blue collar" jobs 22.6 16.9 19.9 16.4 15.3 12.6 9.5 7.9
p<.05 n.s. p<.001 p<.001 N 1316 1090 1264 1206 4590 4502 5764 6125
a) Chi-square tests for changes in educational distribution, racial composition, and occupational distribution, from the pre-reform to post-reform period for rural mothers, for rural childless women, and then repeated for urban mothers and urban childless women. The significance levels for these differences are shown in the table
b) Chi-square tests for rural/urban differences in the pre-reform distributions for mothers were all statistically significant at the .001 level. Tests for pre-reform differences in these distributions between mothers and childless women were also statistically significant at the .001 level. Significance levels for these tests are not shown in the table.
c) Non-parametric Kruskal-Wallis test for significance of difference in medians. All differences from the pre-reform to post-reform period for rural mothers, rural childless women, urban mothers and

30
urban childless women are significant at .001 level, as were pre-reform differences between rural and urban mothers, and pre-reform differences between mothers and childless women for both rural and urban areas.
SINGLE MOTHER WORK AND POVERTY UNDER WELFARE REFORM
31
Table 2: Impacts of Policy Changes on Employment and Poverty in Female-headed Households in Nonmetropolitan and Metropolitan Areas: 1989-90 and 2000-01 Rural Female Headed Households Urban Female Headed Households
Mothers with children Women with no children
<18 Mothers with children Women with no children
<18
Pre -reform
(a)
Post-reform
(b)
Change (c)=
(b)-(a)
Pre -reform
(d)
Post-reform
(e) Change
(f)=(e)-(d)
Policy Effect (g)=
(c)-(f)
Pre -reform
(h)
Post-reform
(i)
Change (j)=
(i)-(h)
Pre -reform
(k)
Post-reform
(l) Change
(m)=(l)-(k)
Policy Effect (n)=
(j)-(m)
Rural Minus Urban (o)=
(g)-(n)
% Employed 62.2 72.8 10.6 *** 82.7 76.7 - 6.0 ** 16.6*** 62.2 75.3 13.1 ***
85.6 83.2 - 2.4 * 15.5*** 1.1
% Full-year 73.8 79.1 5.3 * 85.2 84.6 -0.6 5.9 * 76.7 81.5 4.8 *** 88.0 88.7 0.7 4.1* 1.8
% Full-time 79.1 80.3 1.2 85.7 85.3 -0.4 1.6 81.2 81.7 0.5 88.6 88.3 -0.3 0.8 0.8
% of families poor 50.2 42.9 - 7.3 ** 22.4 21.9 -0.5 - 6.8 * 43.5 33.9 - 9.6 ***
13 12.9 -0.1 - 9.5 *** 2.7
% under .5 of poverty line 25.9 22.0 -3.9 8.3 8.3 0.0 -3.9 22.4 15.4
- 7.0 *** 5.2 6.1 0.9 - 7.9 *** 4.0
% from .5 to .99 of poverty line 24.3 20.9 -3.4 14.1 13.5 -0.6 -2.8 21.1 18.5 - 2.6 * 7.7 6.9 -0.8 -1.8 -1.0
% from 1.0 to 1.5 of poverty line 17.3 19.5 2.2 12.9 14.4 1.5 0.7 14.2 17.2 3.0 * 7.4 8.3 0.9 2.1 -1.4
N 1,316 1,090 1,264 1,206 4,590 4,502 5,764 6,125 *p<.05 **p<.01 ***p<.001 These percentages are raw percentages from the weighted CPS sample and are not adjusted for demographic characteristics. The hypothesis of no difference in probabilities was tested using a z-test of differences in proportions.
32
Table 3. Alternative Specification: Impact of Policy Changes on Employment and Poverty in Nonmetropolitan and Metropolitan Areas:1989-90 and 200-01
Rural Female Headed Households Urban Female Headed Households High School or Less Some College High School or Less Some College
Pre -reform
(a)
Post-reform
(b)
Change
(c)= (b)-(a)
Pre -reform
(d)
Post-reform
(e)
Change (f)=(e)-
(d)
Policy Effect (g)=
(c)-(f)
Pre -reform
(h)
Post-reform
(i)
Change (j)=
(i)-(h)
Pre -reform
(k)
Post-reform
(l)
Change (m)=(l)-
(k)
Policy Effect (n)=
(j)-(m)
Rural Minus Urban (o)=
(g)-(n)
% Employed 65.9 66.6 0.7 81.8 84.3 2.5 -1.8 64.4 69.7 5.3 *** 86.6 87.1 0.5 4.8 ** - 6.6*
% Full-year 78.5 78.8 0.3 81.2 85.4 4.2 -3.9 80.3 80.9 0.6 86.4 88.8 2.4 -1.8 -2.1
% Full-time 81.6 81.5 -0.1 84.0 84.3 0.3 -0.4 84.2 82.7 -1.5 87.2 87.4 0.2 -1.7 1.3
% of families poor 44.0 43.9 -0.1 25.5 17.4 -8.1** 8.0** 40.3 36.5 -3.8** 12.7 11.1 -1.6 -2.2 10.2 ** % under .5 of poverty line 22.9 21.2 -1.7 8.9 7.2 -1.7 0.0 20.7 16.5 -4.2*** 4.9 5.3 0.4 -4.6 ** 4.6
% from .5 to .99 of poverty line 21.1 22.7 1.6 16.6 10.2 -6.4** 8.0** 19.5 19.9 0.4 7.7 5.9 -1.8 2.2 5.8
% from 1.0 to 1.5 of poverty line
16.3 19.2 2.9 13.3 13.9 0.6 2.3 13.0 15.6 2.6 * 7.8 9.4 1.6 1.0 1.3
N 1,487 1,163 1,061 1,099 5,154 4,527 5,077 5,987 *p<.05 **p<.01 ***p<.001 The hypothesis of no difference in probabilities was tested using a z-test of differences in proportions.
SINGLE MOTHER WORK AND POVERTY UNDER WELFARE REFORM
33
Table 4: Probit Analysis of Impacts of Policy Changes on Employment and Poverty in Female-headed Households in Nonmetropolitan and Metropolitan Areas: 1989-90 and 2000-01 Rural Female Headed Households Urban Female Headed Households
Mothers with children Women with no
children <18 Mothers with children Women with no children <18
Pre -reform (a)
Post-reform
(b)
Change
(c)= (b)-(a)
Pre -reform
(d)
Post-reform
(e) Change
(f)=(e)-(d)
Policy Effect (g)=
(c)-(f)
Pre -reform
(h)
Post-reform
(i)
Change (j)=
(i)-(h)
Pre -reform
(k)
Post-reform
(l) Change
(m)=(l)-(k)
Policy Effect (n)=
(j)-(m)
Rural Minus Urban (o)=
(g)-(n) % Employed (Unconditional probabilit ies) (%)
62.2 72.8 10.6 ***
82.7 76.7 - 6.0 ** 16.6*** 62.2 75.3 13.1 ***
85.6 83.2 - 2.4 * 15.5*** 1.1
(Conditional on demographic characteristics) (%)
69.8 67.3 -2.5 86.2 72.0 -14.3 *** 11.8*** 70.5 70.8 0.3 86.7 79.7 -6.9 *** 7.3 *** 4.5 *
% of families poor (Unconditional probabilities) (%)
50.2 42.9 - 7.3 ** 22.4 21.9 -0.5 - 6.8 * 43.5 33.9 - 9.6 *** 13 12.9 -0.1 - 9.5 *** 2.7
(Conditional on demographic characteristics) (%)
39.9 48.6 8.7 *** 17.5 29.4 11.9 *** -3.2 31.4 38.8 7.4 *** 12.4 18.0 5.7*** 1.8 -5.0 *
*p<.05 **p<.01 ***p<.001 In the unconditional analysis the hypothesis of no difference in probabilities was tested using a z-test of differences in proportions. In the conditional analysis, the hypothesis of no difference in probabilities was tested using the delta-method [Greene, 2000, p. 330-332] in which the variance-covariance matrix is estimated using a second-order Taylor series approximation.
34
NOTES
An earlier version of this paper was presented at the annual meetings of the Eastern Economics
Association, February 21-23, 2003, New York, NY. We are grateful to Joe Kerkvliet, Ivan Hascic and
Alan Acock at Oregon State University and to Signe-Mary McKernan at Urban Institute for discussion of
research design and assistance with the econometrics. They bear no responsibility for errors in our
analysis or interpretation of results.
i The terms “rural” and “nonmetropolitan,” and “urban” and “metropolitan:,” are often used
interchangeably to refer to “nonmetropolitan” and “metropolitan” areas, respectively. We follow this
convention. The Office of Management and Budget has defined as “Metropolitan” those counties that
have a city of more than 50,000 people and/or have significant interdependence with a “core” city through
commuting. “Nonmetropolitan” counties are those that do not meet these criteria.
ii There was a period in the early 1990s when employment growth rate was lower and the unemployment
rate higher in metropolitan than in nonmetropolitan areas. See Gibbs [2001]. The reversal of rank of these
indicators in the early 1990s represented a distinct reversal of historic patterns. See Economic Research
[1997] and Mills [2001].
iii In selecting this approach, we considered the judgment of the National Research Council Panel on Data
and Methods for Measuring the Effects of Changes in Social Welfare Programs [Moffit and Ver Ploeg,
1999] that “difference in difference methods have some credibility, particularly for large system wide
changes” p. 61.
iv “By 2000, this left real minimum wages 10.8 percent above their levels in 1989” [Blank, 2002, p.6].

SINGLE MOTHER WORK AND POVERTY UNDER WELFARE REFORM
35
v See Blank [2002] for a fuller discussion of these changes.
vi The most recent data in Weber et al [2002] was for 1999.
vii See NBER website for dates of US business cycles: http://www.nber.org/cycles.html
viii “Childless” refers here to those who don’t have children under 18 in the home; these women may have
older children, even older children living with them. “Childless” here does not indicate anything about a
woman’s fertility history.
ix Public assistance as defined here includes money received from AFDC and TANF and other public
assistance programs such as General Assistance, Emergency Assistance, Cuban/Haitian Assistance and
Indian Assistance.
x “The official poverty income threshold (for families of various sizes) can be criticized on a number of
counts: it miscalculates family economies of scale (i.e., equivalence scales); it fails to take into account –
in-kind government transfers (e.g., food stamps); it does not account for geographical variations in cost of
living or consumption; it is based on family rather than household income; and it does not adjust for taxes
or other nonconsumption expenditures, such as child support payments [Citro and Michael, 1995; Short
et.al. 1999]” [Lichter and Jensen, 2002] Lichter and Jensen estimate an Adjusted Poverty Rate that
includes EITC payments in income, resulting in a lower poverty rate for both urban and rural areas.
xi Is the 2-year increase in median age of mothers surprising or out of the ordinary? We do not believe so
for two reasons. First, the mean age at first birth for American mothers in the 1980s and 1990s was
increasing at a rate of around 1.5 to 2.0 years per decade. Second, with the declining fertility rate, the
average age of those who were mothers would increase. So, women were becoming mothers at later ages,
36
and less often. Also, population age structure contributes to this picture, as observed by the trends in
childless women. By 2000, the birth dearth of the early 1970s (Gen X) has entered the 18-54 age range,
and hence a smaller fraction of 18-54 year olds are in the lower age brackets of that range. Thus, the 18-
54 cohort appears to age as the boomers comprise a large portion of that age bracket (in the upper reaches
of the 18-54 bracket) and the busters comprise a small fraction of the lower reaches of that 18-54 bracket
[See Edwards, 2002].