Download a PDF of this paper - Knight Geospatial Science Group
9
An Assessment of Reference Data Variability Using a "Virtual Field Reference Database" Ross S. Lunetta, John liames, Joseph Knight, Russell G. Congalton, and Thomas H. Mace Abstract A "Virtual Field Reference Database (VFRDB)" was developed using field measurement and digital imagery (camera) data collected at 999 sites in the Neuse River Basin, North Carolina. The VFmB was designed to support detailed assessments of remote-sensor-derived land-coverlland-use (LCLU) products by providing a robust database characterizing representative cover types throughout the study area. The sampling frame incorporated both systematic unaligned and stratified random design elements, to provide both an even distribution of points and sufficient intensification to account for rare classes. Numerous quality assurance procedures were developed and incorporated to ensure both data consistency and repeata- bility. lltvo independent interpreters assigned class labels corresponding to a hierarchical classification system based on field measurement and imagery data interpretation. Corres- pondence between interpreters was analyzed at multiple classification levels. The relatively high 91 percent overall correspondence of interpretations was attributable to the application of the VFRDB, providing a high quality source of measurement and imagery data to guide class assignments. Confusion documented for rangeland and forest classes was consistent with reported results for studies conducted in diverse biological locations. Results demonstrate the require- ment for reference data with known variability, to support the quantitative assessments of remote-sensor-derived LCLU products. Introduction and Background A thorough understanding of map accuracies is required to ade- quately evaluate remote-sensor-derived land-coverlland-use (LCLU) data for specific environmental applications. Commen- surate with the widespread availability of geographic informa- tion systems (GIS), there has been a proliferation of geospatial data integration applications (including remote-sensor-de- rived data), while the research community has initiated devel- opment of the next generation of spatially explicit GIS-based environmental models. Hence, the availability of high quality reference data is essential to support statistically rigorous accu- racy assessments of LCLU maps. The concept of a "Virtual Field Reference Database (VFRDB)" was developed to provide a robust source of reference data to support the quantitative eval- uation of LCLU maps. The introduction of classification errors to data integration andlor modeling analyses results in the propagation of error in the final integration product or throughout the entire modeling process (Lunetta et al., 1991). Errors may be propagated based on additive (Milazzo, 1980) or multiplicative (Stow et al., 1980) models and expressed as both categorical and geographic errors. The potential introduction and subsequent propagation of errors introduced from LCLU maps must be thoroughly un- derstood in order to assess the total error budget relative to the intended application. This paper focuses only on the charac- terization of categorical (classification)errors. The remote sens- ing community has long struggled to clearly articulate the true nature of what constitutes adequate "reference" data for the assessment of LCLU accuracies. Simply stated, the objective is to derive adequate reference data to evaluate individual class accuracies, typically through the application of multivariate statistical analvsis techniques [Congalton and Mead, 1983). - u However, a cokplete understanding of what actually consti- tutes adequate reference data has been elusive. For example, is it appropriate to use an independent classification product derived from the same, similar, or different imagery source? Is an aerial photograph based approach most appropriate? Are field data required to accomplish the assessment? Unfortunately, there is no single approach that is optimal or appropriate for all cases. Instead, the optimal approach must be designed to meet specific validation or assessment require- ments that coincide with specific information needs and data quality objectives for a particular application. Theoretically, an ideal reference data source is one that can be repetitively developed with low data variability. A quantitative validation using an independently derived LCLU map can be best realized when the reference data are acquired to correspond with the following criteria: the data coincide with the temporally relevant period of interest, spatial data resolution is commensurate with that of the data being evaluated, an unambiguous match between classification systems exists or can be obtained, and the variability of the reference data set has been characterized. If the reference map does not meet all the above criteria, it R.S. Lunetta and J. Iiames are with the U.S. Environmental may only be suitable for qualitative validation. Depending on Protection Research labor at or^* the intended application(s),a qualitative validation may be suf- Research Triangle Park, NC 27711 ([email protected]). ficient. However. if the data will be used for model ~arameter- J. Knight is with the Center for Earth Observation, North (2-0- ization or integration with other geospatial data to broduce an lina State University, Raleigh, NC 27695. R.G. Congalton is with the Department of Natural Resources, University of New Hampshire, Durham, NH 03824. T.H. Mace was with the U.S. Environmental Protection Agency, Office of Environmental Information, Research Triangle Park, NC 27711. He is presently with the U.S. National Aeronautics and Space Administration, Dryden Flight Research Center, Edwards, CA 93523. Photogrammetric Engineering & Remote Sensing Vol. 63, No. 6, June 2001, pp. 707-715. 0099-111210116706-707$3.0010 O 2001 American Society for Photogrammetry and Remote Sensing PHOTOGRAMMETRIC ENGINEERING & REMOTE SENSING /one 2001 707
Transcript of Download a PDF of this paper - Knight Geospatial Science Group

An Assessment of Reference Data Variability Using a "Virtual Field Reference Database"
Ross S. Lunetta, John liames, Joseph Knight, Russell G. Congalton, and Thomas H. Mace
Abstract A "Virtual Field Reference Database (VFRDB)" was developed using field measurement and digital imagery (camera) data collected at 999 sites in the Neuse River Basin, North Carolina. The V F m B was designed to support detailed assessments of remote-sensor-derived land-coverlland-use (LCLU) products by providing a robust database characterizing representative cover types throughout the study area. The sampling frame incorporated both systematic unaligned and stratified random design elements, to provide both an even distribution of points and sufficient intensification to account for rare classes. Numerous quality assurance procedures were developed and incorporated to ensure both data consistency and repeata- bility. lltvo independent interpreters assigned class labels corresponding to a hierarchical classification system based on field measurement and imagery data interpretation. Corres- pondence between interpreters was analyzed at multiple classification levels. The relatively high 91 percent overall correspondence of interpretations was attributable to the application of the VFRDB, providing a high quality source of measurement and imagery data to guide class assignments. Confusion documented for rangeland and forest classes was consistent with reported results for studies conducted in diverse biological locations. Results demonstrate the require- ment for reference data with known variability, to support the quantitative assessments of remote-sensor-derived LCLU products.
Introduction and Background A thorough understanding of map accuracies is required to ade- quately evaluate remote-sensor-derived land-coverlland-use (LCLU) data for specific environmental applications. Commen- surate with the widespread availability of geographic informa- tion systems (GIS), there has been a proliferation of geospatial data integration applications (including remote-sensor-de- rived data), while the research community has initiated devel- opment of the next generation of spatially explicit GIS-based environmental models. Hence, the availability of high quality reference data is essential to support statistically rigorous accu- racy assessments of LCLU maps. The concept of a "Virtual Field
Reference Database (VFRDB)" was developed to provide a robust source of reference data to support the quantitative eval- uation of LCLU maps.
The introduction of classification errors to data integration andlor modeling analyses results in the propagation of error in the final integration product or throughout the entire modeling process (Lunetta et al., 1991). Errors may be propagated based on additive (Milazzo, 1980) or multiplicative (Stow et al., 1980) models and expressed as both categorical and geographic errors. The potential introduction and subsequent propagation of errors introduced from LCLU maps must be thoroughly un- derstood in order to assess the total error budget relative to the intended application. This paper focuses only on the charac- terization of categorical (classification) errors. The remote sens- ing community has long struggled to clearly articulate the true nature of what constitutes adequate "reference" data for the assessment of LCLU accuracies. Simply stated, the objective is to derive adequate reference data to evaluate individual class accuracies, typically through the application of multivariate statistical analvsis techniques [Congalton and Mead, 1983). - u
However, a cokplete understanding of what actually consti- tutes adequate reference data has been elusive. For example, is it appropriate to use an independent classification product derived from the same, similar, or different imagery source? Is an aerial photograph based approach most appropriate? Are field data required to accomplish the assessment?
Unfortunately, there is no single approach that is optimal or appropriate for all cases. Instead, the optimal approach must be designed to meet specific validation or assessment require- ments that coincide with specific information needs and data quality objectives for a particular application. Theoretically, an ideal reference data source is one that can be repetitively developed with low data variability.
A quantitative validation using an independently derived LCLU map can be best realized when the reference data are acquired to correspond with the following criteria:
the data coincide with the temporally relevant period of interest, spatial data resolution is commensurate with that of the data being evaluated, an unambiguous match between classification systems exists or can be obtained, and the variability of the reference data set has been characterized.
If the reference map does not meet all the above criteria, it R.S. Lunetta and J. Iiames are with the U.S. Environmental may only be suitable for qualitative validation. Depending on Protection Research labor at or^* the intended application(s), a qualitative validation may be suf- Research Triangle Park, NC 27711 ([email protected]). ficient. However. if the data will be used for model ~arameter- J. Knight is with the Center for Earth Observation, North (2-0- ization or integration with other geospatial data to broduce an lina State University, Raleigh, NC 27695. R.G. Congalton is with the Department of Natural Resources, University of New Hampshire, Durham, NH 03824.
T.H. Mace was with the U.S. Environmental Protection Agency, Office of Environmental Information, Research Triangle Park, NC 27711. He is presently with the U.S. National Aeronautics and Space Administration, Dryden Flight Research Center, Edwards, CA 93523.
Photogrammetric Engineering & Remote Sensing Vol. 63, No. 6, June 2001, pp. 707-715.
0099-111210116706-707$3.0010 O 2001 American Society for Photogrammetry
and Remote Sensing
PHOTOGRAMMETRIC ENGINEERING & REMOTE SENSING /one 2001 707

output product requiring uncertainty characterization, a quanti- tative assessment of accuracy based on individual land-cover classes is typically required.
Interpreted aerial photographs have frequently been used as reference data to assess the accuracy of digitally processed LCLU maps from satellite imagery. A false assumption, often implicit in the reporting of results, is that photointerpretation results are completely accurate. To date, comparative studies evaluating the correspondence between field data and aerial photography interpretations have been extremely limited. Hilborn (1981) found a mean agreement of 80 percent among 145 interpreters in differentiating between deciduous and coniferous trees. Congalton et al. (1983) reported a 70 percent interclass correspondence between pasture, forest, and water. Correspondences associated with forested land-cover types ranged from 76 to 88 percent (Biging et al., 1991; Kadmon and Harari-Kremer, 1999). Also, accuracies associated with differ- entiating among conifer and deciduous species were very poor (Congalton and Mead, 1983). Differentiation of species types within plant communities is typically unattainable using aerial photographs alone (Lauer et al., 1970). Scepan et al. (1999) found an 80 percent agreement among two interpreters using Landsat Thematic Mapper (TM) and Systeme Probatoire de la Observation de la Terre (SPOT) HRV imagery. In general, reported results indicate the wide range of variability associated with interpreted aerial photography and higher resolution imagery.
This leads us to an important question that must be addressed. What represents adequate reference data and how accurate must it be? Does it really represent "truth"? There is obviously no simple answer to these questions. However, in general, the greater the flora species diversity, the greater the difficulty in establishing "truth." Congalton and Biging (1992) compared field transect measurements versus visual field calls to establish dominant tree species. With a total species diver- sity of six forest species, they reported an 85 percent overall correspondence between the field measurement and visual calls. They concluded that making visual calls of species domi- nance is relatively easy and accurate, except where many spe- cies occur simultaneously.
In the Neuse River basin we were confronted with the prob- lem of very high species diversity. To generate a reference data set with known variability, we developed a VFRDB to provide a versatile source of field measurement data. The goal of the VFRDB was to provide an independent source of in situ measure- ment data that could be applied to numerous classification sys- tems to provide a robust source of reference data to assess the accuracy of current LCLU maps. An additional objective was to provide a baseline data archive to support the long-term devel- opment and evaluation of remote sensor LCLU classification approaches, change detection methods, and accuracy assess- ment techniques.
Study Area The Neuse River Basin (NM) is contained entirely within the state boundaries of the state of North Carolina (Figure 1). The basin boundaries were delineated to correspond with the U.S Geological Survey (USGS) six-digit hydrologic unit code (H~c), code number 030202. The NRB is 14,582 km2 in area and con- tains 16,900 km of stream length (based on the 1:24,000-scale digital line graphs (DLGS)), of which 56 percent were first-order, 22 percent second-order, and 22 percent third- to eighth-order streams. Based on an analysis of the Multi-Resolution Land Characteristics (MRLC) land-cover data generated primarily from Landsat 5 Thematic Mapper (TM) 1991-1993 imagery (Vogelmann et al., 1998), cover types were determined to be approximately 42 percent forested, 30 percent agricultural, 18 percent wetland, 5 percent urban, 4 percent open water, and 1 percent barren.
The upper (northwestern) third of the basin is located in the Piedmont physiographic region and the remainder in the mid-Atlantic coastal plain region. The Piedmont portion of the basin is characterized by highly erodible clay soils, rolling topography with broad ridges, and sharply indented stream valleys, and low gradient streams composed of a series of slug- gish pools separated by riffles and occasional small rapids. In contrast, the coastal plain is characterized by flat terrain, "black- water streams," low-lying wetlands, and productive estuarine areas. Elevations within the NRB range from 276 meters in the western part of the basin to sea level at the confluence of the Neuse River with Pamlico Sound. The Sound represents the southern extent of the Albemarle-Pamlico Sound estuary sys- tem which is defined by a series of barrier islands known as the North Carolina's Outer Banks (NCDEM, 1993).
Methods The basic study approach was first to develop the V F ~ B and a modified Anderson et al. (1972) LCLU classification system for the NRB (Table 1). Then, we performed field data collections, followed by the LCLU interpretations using the VFRDB. For pur- poses of brevity, LCLU definitions are not provided here, but are available directly from the N R B - ~ R D B web site. Four major ele- ments contributed to the development of the NRB-VF~B. These included the development of (I) the sampling frame design, (2) field sampling protocols, (3) quality control (QC) and associated standard operation procedures (SOP), and (4) the database design.
Sampling Frame Design The sampling frame design for the N R B - W ~ B was based on two separate elements to provide adequate sampling points across the entire watershed. The design included both systematic unaligned samples based on the usGs Quarter Quadrangles (732 points), and stratified random samples based on the MRLC LCLU data (374 points). The systematic unaligned sampling element effectively provided an even distribution of points across the entire study area, but resulted in an under-sampling of rare classes. The stratified random design element provided for sample intensification of the less abundant classes through- out the watershed. Of the total 999 sampling sites, 545 sites were sampled in 1998 and the remaining 454 during the 1999 field sampling season.
Held Sampllng Protocol Field sampling was accomplished during May through Sep- tember of 1998 and 1999. Field crews navigated to sampling points using Global Positioning System (GPS) receivers oper- ating in real-time (satellite broadcast) differential corrected mode. Sampling point locations were located to within 2 1.0- meter accuracy to provide for future revisit capability. Circular plots with a radius of 36.5 meters were measured and flagged to provide 0.4-hectare plots corresponding to the Minimum Map- ping Unit (MMU) used for the development of satellite-imagery- derived LCLU maps. Additionally, sub-plots with a radius of 16.5 meters were established to provide a 0.1-hectare plot to support forest inventory measurements. Subsequent to plot delineation, field measurements were made corresponding to location and time, physical parameters, and biophysical measurements.
Location and lime
For each sampling point, data were recorded that included a unique site identification number that corresponded to the USGS 1:24,000-scale quadrangle map series, calendar date and time of observation, crew member names, and the original and actual sampling site X, Y coordinates. Differentiation between the original and actual coordinates was required because the
PHOTOORAMMnRlC ENGINEERING & REMOTE SENSING

3.0 Rangeland
4.0 Forest Land
5.0 Water
TABLE 1. NEUSE RIVER BASIN CATEGORIZATION SYSTEM
Level 1 Level 2 Level 3
1.0 Urban (% Impervious) 1.1 High Density (71-100%) 1.2 Medium Density (36-70%) 1.3 Low Density (10-35%)
2.0 Agricultural Land 2.1 Row Crops
6.0 Wetlands
7.0 Barren Land
8.0 UnknownlOther
A
\ - h 0 50 100 150 KILOMETERS
Figure 1. Neuse River Basin location map.
2.2 Pasture/Hay 2.3 Fallow Land 3.1 Deciduous Shrub 3.2 Evergreen Shrub 3.3 Mixed Shrub 3.4 Herbaceous (Grassland) 4.1 Deciduous Forest 4.2 Evergreen Forest 4.3 Mixed Forest 5.1 Streams, Rivers, and Canals 5.2 Lakes 5.3 Reservoirs 5.4 Estuaries 5.5 Ponds 6.1 Herbaceous 6.2 Woody 7.1 Non-vegetated 7.2 Transitional (Pioneer Vegetation)
2.1.1 Cotton 2.1.2 Corn 2.1.3 Soybeans 2.1.4 Tobacco 2.1.5 Vegetables 2.2.6. Other Row Crops 2.1.7. Wheat 2.1.8. Hay 2.1.9. Other Grains
protocol mandated the relocation of sampling sites under cer- tain circumstances. For example, if greater than 20 percent of the area within the original plot coordinates contained a com- pletely different LCLU type (i.e., forest and agricultural), then two sampling sites were established within each of the two cover types.
Physical Measurements
Measurements corresponding to physical parameters included slope, aspect, elevation, landform, percent cover of the predom- inate land-cover type, water regime, and soil moisture condi- tion (descriptive). Also, tree diameter at breast height (DBH)
PHOTOGRAMMETRIC ENGINEERING & REMOTE SENSING
and percent canopy cover were measured for each forested site. DBH was determined using direct measurement within the 0.1- hectare subplot, tree heights and slope were measured within subplots using a clinometer, and percent canopy was mea- sured along perpendicular transects using both the vertical tube (Ganey and Block, 1994) and hemispherical densiometer (Cook et al., 1995) techniques.
Biophysical Measurements
The suite of biophysical site measurements included general site descriptors such as ecological system type, general vegeta- tive cover type, successional state, and origin (i.e., natural or

man-made). Detailed inventories of ground cover, and shrubs, and under story tree and tree canopy constituents were deter- mined for each site, as appropriate. Both genus and species identifications were made in most cases.
Digital Photographic Documentation
A high-resolution (1040 by 840 pixels) natural color imagery series was acquired for each site. At a minimum, documenta- tion included a panoramic site documentation set of six images (Plate I). Also, a two-image canopy series and upldown stream image series were collected (Plate 2), as appropriate. Addition- ally, representative vegetation key graphics acquired from available sources were included in the database to aid users unfamiliar with NRB flora (Plate 2.).
Field Data Documentation
Field data sheets were designed to capture pertinent measure- ment and imagery (camera) data to document LCLU characteris- tics. The basis for paper field sheet(s) and complementary computer sheet(s) designs was to develop a duplicative record system for use by field interns and to provide sufficient data quality assurance to insure a high degree of quality control.
Site identification numbers were designed both to provide location data corresponding to the 1:24000-scale quadrangle series and to incorporate plot-specific stratification design ele- ment origins (i.e., systematic or stratified sampling design ele- ment). Both the original and field measured coordinates were recorded under one of three options corresponding to (1) non- split plots, (2) split plots, and (3) moved plots. General site descriptions and digital images were recorded along with a plot sketch to provide a detailed overview of the plot character- istics. Percent representative cover-type estimates facilitated
the evaluation of mixed plots. The standard field protocol was to only sample sites that exhibited 280 percent homogeneous land cover (the 80-20 rule). Height classes were chosen to delin- eate forests (>2 meters) from shrubs (<2 meters). Additional vegetative attributes entered for each crown class included spe- cies, DBH, relative abundance, layer density, and layer distribu- tion. Species were entered by common name using the U. S. Forest Service (USFS) species codes as detailed in the Forest Health Monitoring (FHM) program (USDA Forest Service, 1998).
Quality Assurance and Quality Control A high priority was placed on quality control (QC) during the development of the NRB-WRDB to provide quality assurance (QA) relative to data completeness, accuracy, and consistency between field crewmembers. QC elements included two weeks of combined classroom and field training, continuous evaluation of field methods and plant identifications throughout the field deployment, weekly independent confirmation of plant identi- fications, and independent review of field data forms and imag- ery. Classroom training included field safety, study protocols, field methods, instrument operation, computer data inputlout- put, and a local flora identification course. Field training involved the use of pre-documented sites, first to train the field crews, then to test and evaluate crew performance prior to field deployments. Continuous evaluations of crew performance were accomplished by rotating EPA training staff and a local flora expert among the field crews throughout the deployment. Inde- pendent species confirmations were made by forwarding a sub- set of field-collected samples to the herbarium at North Carolina State University for positive identification.
EPA scientists performed independent reviews of all field measurement and imagery data within a one-week period fol-
I
North, 0 degrees North- 45 degrees I
East, 135 degmes
I
South, 180 degrees Southwest, 225 degrees Northwest, 315 degrees
Plate 1. Digital panoramic photographic series for a representative upland forested riparian buffer zone sampling site in the Neuse River Basin of North Carolina.
PHOTOGRAMMETRIC ENGINEERING & REMOTE SENSING

Vegetative Canopy Photos Soecies
swamp A. Loblolly Pine
American Beech
Downs- photo ~ u l i p Poplar
Plate 2. Digital photographic series depicting forest canopy (only two of four illustrated), riparian buffer zone structure (upstream/downstream), and representative vegetation species keys for a representative forested riparian buffer zone sampling site in the Neuse Rlver Basin, North Carolina.
lowing data collections. Reviews included evaluations of the completeness of both measurement and imagery data, compari- son of field data sheets to computer data sheets for transcription accuracy, and visual inspection of field imagery to provide a qualitative assessment of quality. Sites with incomplete mea- surement data and/or poor quality imagery data were resched- uled for return visits within two weeks of the original collection effort. Data sheets to computer transcription errors were cor- rected in consultation with the appropriate field crews. Only when the data met all Qc requirements were site data entered into the database.
Database Design and Functlonallty The objectives of the NRB-VFRDB database development were to provide a geospatial database to support field measurement and imagery data input, archive, search, display, retrieval, and interpretation. EPA designed the system for use by both EPA sci- entists and the external scientific community via direct Internet access (http://www.epa.gov/nerlesdl/lcb/nrb/ VFRDBI).
Data Entry
The VFRDB was designed for both rapid and accurate data entry. Computer data forms used a sequence of tabbed pages to elimi- nate the need for scrolling through individual pages to view specific data fields. Also, the form interface was designed to minimize the use of point-and-click menus in favor of more
efficient keystroke navigation. Furthermore, several auto-cal- culation routines provided on-the-fly mathematical opera- tions. For example, percent canopy closure was calculated from both the densiometer and vertical tube measurements without user intervention.
Quality Control
The VFRDB provides several layers of data validation and error checking:
The electronic data forms have built-in data validation routines that function to prevent users from entering erroneous data. For example, the database checks the site coordinates entered to ensure that they are within the study area. Upon entering invalid data, the user was prompted to correct the information before the record could be saved. GIS software was used to provide locational QC. For example, the separation between the randomly generated coordinates and the actual measured coordinates was reviewed to ensure that the sampling was within an appropriate distance from the gen- erated location. Visual Basic scripts were designed to enforce consistent naming conventions and to consistently format digital photographs. When new photography was entered, the script performed a checked to ensure the proper site identification number, confor- mance with established naming conventions, and correct graph- ical input format. In addition to the above procedures, the database allows effec- tive manual QC checks through the simple tabbed display type. Similar information was grouped on the same pages for easy error identification and correction.
PHOTOGRAMMETRIC ENGINEERING & REMOTE SENSING

Classification Level
--- - -
Level of Agreement
- --
Percent Agreement
Sites with complete agreement Level 1.0 Classes 909 (n = 999) 91 Sites with complete agreement Modified Level 1.0 Classes 944 (n = 999) 94 Sites with complete agreement Level 2.0 Classes 870 (n = 909) 96 Sites with complete agreement Level 3.0 Classes 302 (n = 302) 100
- - - - - - - -- - - - - - -
Interpreter B Column Total Level of
Land-Cover/Use Classes Ur Ag Ra Fo Wa We Ba OIU Total (n) Agreement by Class
Urban or Built-up (Ur) 112 1 4 117 112/139 = 81% Agricultural Land (Ag) 7 322 6 14 1 1 6 357 3221360 = 89% Rangeland (Ra) 5 1 93 12 2 113 931141 = 66% Forest Land (Fo) 10 1 1 7 292 1 321 2921347 = 84% Water [Wa) 2 7 27/28 = 96% Wetland (We) 48 48 48/48 = 100% Barren Land (Ba) 1 14 15 14/16 = 88% Other/Unknown (O/U) 1 1 1/10 = 10%
Row Total (n) 134 325 1 2 1 318 28 48 15 10 999 Total Agreement 909/999 = 91%
Data Display and Distribution
In addition to the basic search and display capabilities, the NRB- WRDB has been ported to a webldatabase server for distribu- tion via the EPA Intranet. This implementation provided the fol- lowing capabilities:
Organized representation of project data-The user is able to view maps of sample point locations, categorized attribute data, and the site photographs using the simple tabular interface. Query processing-The user has the ability to query the data- base using user-defined parameters. For example, a summary of points, which fall within a specific county, or canopy closure data for all sites containing a loblolly pine overstory. Accessibility-The only requirement for database access and manipulation is a web browser. Any recent web browser will suffice-no "plug-in" modules are required.
Results A summary of the results of LCLU class assignments among two independent interpreters is presented in Table 2. Complete agreement between interpreters for Level 1.0 classes was obtained for 91 percent of the class assignments (n=999). Agreement increased slightly for Level 2.0 classes interpreta- tions to 94 percent (n=969). ~ ~ r e e m e n t among interpreiers for Level 3.0 class inter~retations was 100 ~ercent (n=302). How- ever, it should be ndted that Level 3 clisses were limited to only agricultural row crop classes. Soybeans (38 percent), corn (20 percent), cotton (18 percent), and tobacco (16 percent) dominated agricultural cover types, with only nominal repre- sentation of vegetable crops, wheat, hay, and other grains.
To determine specific sources of disagreement among interpreters, confusion matrices were constructed for Level 1.0,2.0, and 3.0 class assignments (Tables 3,4, and 5). Overall class assignment agreement for Level 1.0 was 91 percent, rang- ing from 100 to 66 percent agreement by class. The best per- forming class assignments were 100 percent agreement for wetland (n=48) and 96 percent for the water (n=28). Agricul- tural interpretations averaged 89 percent (n=360), urban 81 percent (n=139), rangeland 66 percent (n=141), forest 84 per- cent (n=347), and barren 88 percent (n=16) correspondence between interpreters. Urban class disagreement was attribut- able to confusion with forest (37 percent), rangeland (33 per- cent), and agricultural classes (30 percent). Minimal
agricultural disagreements were largely attributable to forest (40 percent), urban (21 percent), and rangeland (18 percent) classes. The poor agreement of 66 percent among interpreters for rangeland classes was primarily attributable to confusion with forest lands (60 percent), followed by urban (19 percent), and agriculture (15 percent). Forest disagreements were pri- marily attributable to confusion with rangeland (53 percent), followed by agriculture (27 percent), and urban (18 percent). Water was confused on one occasion with agricultural land (n=28). Barren land disagreements were equally distributed (50150) among rangeland and agricultural classes (n= 16).
Sources of disagreement attributable to Level 2.0 class dis- tinctions are presented in confusion matrix format in Tables 4a to 4g. Urban class assignments had an 85 percent interpretation correspondence (n=112). The primary sources of urban class disagreements were between the medium and low density and low density and manicured lawn classes. Agricultural class distinctions were in 98 percent agreement between row crop and pasture classes (n=322). Agreement among rangeland classes was 98 percent overall (n=93). The only source of dis- agreement among rangeland classes was between the mixed shrub and grassland classes. Forest classes had an 96 percent overall agreement (n=292). The majority of the forest class dis- agreement was attributable to confusion between deciduous and mixed forest classes. Water classes had a 96 percent agree- ment (n=27), with the only source of disagreement being between rivers and estuaries. Wetland classes were in 100 per- cent agreement (n=48). Barren classes were only 64 percent in agreement (n=14), with significant confusion between bare and transitional classes.
Level 3.0 class distinctions were only performed for agricultural classes (n=302) and displayed in Table 5 and doc- ument the complete (100 percent) agreement between inter- preters. Specific crop type classes included cotton (n = 55), corn (n = 61), soybeans (n = 114, tobacco (n = 48), vegetables (n = 7), other row crops (n = 5), wheat (n = 4), and hay (n = 8).
An overall agreement between interpreters of 91 percent for Level 1.0 classes indicates that the concept of a VFICDB can be applied to provide high quality reference data with known vari- ability for assessing the accuracy of LCLU products derived
PHOTOGRAMMETRIC ENGINEERING & REMOTE SENSING
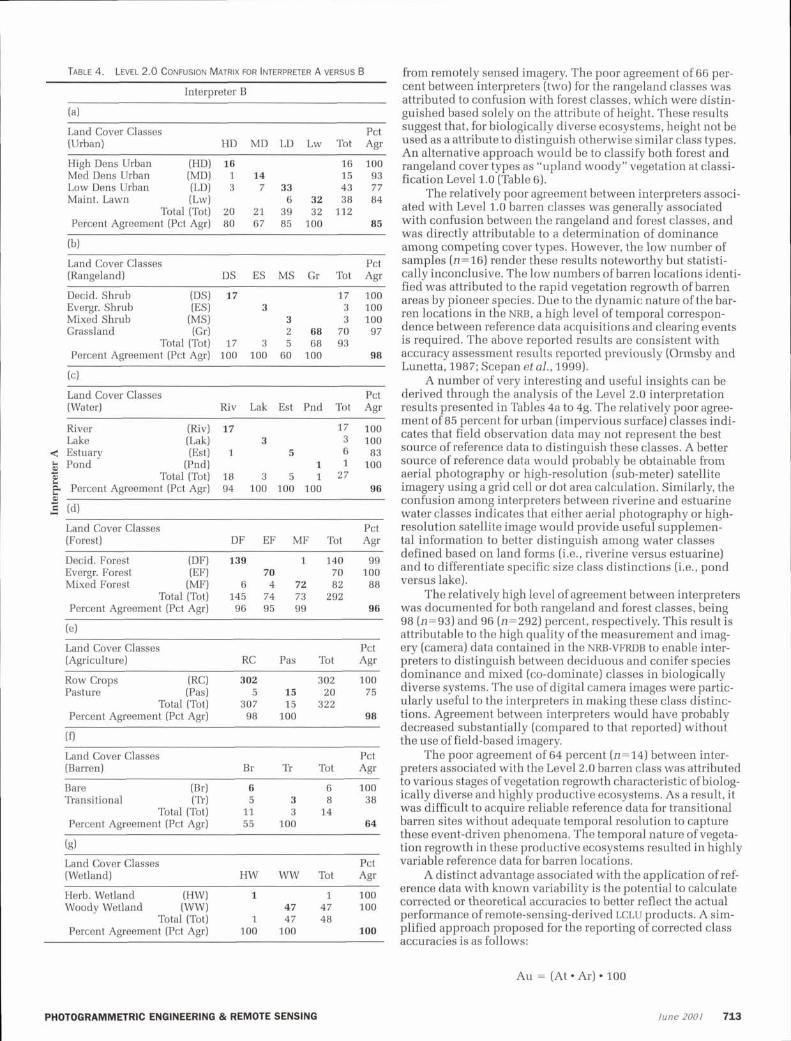
TABLE 4. LNEL 2.0 CONFUSION MATRIX FOR INTERPRETER A VERSUS B from remotely sensed imagery. The poor agreement of 66 per- Interpreter B cent between interpreters (two) for the rangeland classes was
attributed to confusion with forest classes, which were distin- (a1 guished based solely on the attribute of height. These results Land Cover Classes suggest that, for biologically diverse ecosystems, height not be (Urban) HD MD LD Lw Tot Agr used as a attribute to distinguish otherwise similar class types.
An alternative approach would be to classify both forest and High Dens Urban (HD) 16 16 100 rangeland cover types as "upland woody" vegetation at classi- Med Dens Urban (MD) 1 14 Low Dens Urban (LD) 3 7 33
l5 93 fication Level 1.0 (Table 6). 43 77
Maint. Lawn (Lw) The relatively poor agreement between interpreters associ- 32 38 84 ated with Level 1.0 barren classes was generally associated Total (Tot) 20 21 39 32 112
Percent Agreement (Pct Agr) 80 67 85 100 85 with confusion between the rangeland and forest classes, and was directly attributable to a determination of dominance
(bl
Land Cover Classes Pct (Rangeland) DS ES MS Gr Tot Agr
Decid. Shrub (DS) 17 17 100 Evergr. Shrub (ES) 3 3 100 Mixed Shrub (MS) 3 3 100 Grassland (Gd 2 68 70 97
Total(Tot) 17 3 5 68 93 Percent Agreement (Pct Agr) 100 100 60 100 98
Land Cover Classes Pct (Water) Riv Lak Est Pnd Tot Agr
River (Riv) 17 17 100 Lake (Lakl 3 3 100
< Estuary (Est) 1 5 6 83 * Pond 3 (Pnd) 1 1 loo
a Total(Tot) 18 3 5 1 27 Efi Percent Agreement (Pct Agr) 94 100 100 100 96
B (dl
Land Cover Classes Pct (Forest) DF EF MF Tot Agr
Decid. Forest (DF) 139 1 140 99 Evergr. Forest (EF) 70 70 100 Mixed Forest (MF) 6 4 72 82 88
Total (Tot) 145 74 73 292 Percent Agreement (Pct Agr) 96 95 99 96
Land Cover Classes Pct (Agriculture) RC Pas Tot Agr
Row Crops (RC) 302 302 100 Pasture (Pas) 5 15 20 75
Total (Tot) 307 15 322 Percent Agreement (Pct Agr) 98 100 98
(0 Land Cover Classes Pct (Barren) Br Tr Tot Agr
Bare (Brl 6 6 100 Transitional (n) 5 3 8 38
Total (Tot) 11 3 14 Percent Agreement (Pct Agr) 55 100 64
(gl Land Cover Classes Pct (Wetland) HW WW Tot Agr
Herb. Wetland (HW) 1 1 100 Woody Wetland (wwl 47 47 100
Total (Tot) 1 47 48 Percent Agreement (Pct Agr) 100 100 100
among competing cover types. However, the low number of samples (n=16) render these results noteworthy but statisti- cally inconclusive. The low numbers of barren locations identi- fied was attributed to the rapid vegetation regrowth of barren areas by pioneer species. Due to the dynamic nature of the bar- ren locations in the NRB, a high level of temporal correspon- dence between reference data acquisitions and clearing events is required. The above reported results are consistent with accuracy assessment results reported previously (Ormsby and Lunetta, 1987; Scepan eta]., 1999).
A number of very interesting and useful insights can be derived through the analysis of the Level 2.0 interpretation results presented in Tables 4a to 4g. The relatively poor agree- ment of 85 percent for urban (impervious surface) classes indi- cates that field observation data may not represent the best source of reference data to distinguish these classes. A better source of reference data would probably be obtainable from aerial photography or high-resolution (sub-meter) satellite imagery using a grid cell or dot area calculation. Similarly, the confusion among interpreters between riverine and estuarine water classes indicates that either aerial photography or high- resolution satellite image would provide useful supplemen- tal information to better distinguish among water classes defined based on land forms (i.e., riverine versus estuarine) and to differentiate specific size class distinctions (i.e., pond versus lake).
The relatively high level of agreement between interpreters was documented for both rangeland and forest classes, being 98 (n=93) and 96 (n=292) percent, respectively. This result is attributable to the high quality of the measurement and imag- ery (camera) data contained in the NRB-VFRDB to enable inter- preters to distinguish between deciduous and conifer species dominance and mixed (co-dominate) classes in biologically diverse systems. The use of digital camera images were partic- ularly useful to the interpreters in making these class distinc- tions. Agreement between interpreters would have probably decreased substantially (compared to that reported) without the use of field-based imagery.
The poor agreement of 64 percent (n=14) between inter- preters associated with the Level 2.0 barren class was attributed to various stages of vegetation regrowth characteristic of biolog- ically diverse and highly productive ecosystems. As a result, it was difficult to acquire reliable reference data for transitional barren sites without adequate temporal resolution to capture these event-driven phenomena. The temporal nature of vegeta- tion regrowth in these productive ecosystems resulted in highly variable reference data for barren locations.
A distinct advantage associated with the application of ref- erence data with known variability is the potential to calculate corrected or theoretical accuracies to better reflect the actual performance of remote-sensing-derived LCLU products. A sim- plified approach proposed for the reporting of corrected class accuracies is as follows:
Au = (At Ar) 100
PHOTOGRAMMETRIC ENGINEERING & REMOTE SENSING

TABLE 5. LEVEL 3.0 CONFUSION MATRIX FOR INTERPRETER A VERSUS B
Interpreter B Column Total Level of
Land-CoverlUse Classes Ct Cn Soy Tob Veg OR Wh Hay OG Total (n) Agreement by Class
Cotton (Ct) 55 4 Corn (Cn) 61 2 Soybeans (Soy) 114 g Tobacco (Tob) 48 & Vegetables (Veg)
Other Row Crop (OR) d Wheat (Wh) Hay Other Grain (OG) Row Total (n)
100% 100% 300% l0O0/o 100% 100% 100% 100% NI A
Total Agreement 3021302 = 100%
TABLE 6. MODIFIED LEVEL 1.0 CONFUSION MATRIX FOR INTERPRETER A VERSUS B
Land-CoverIUse Classes
Interpreter B Column Total Level of
Ur Ag WV HV Wa We Ba OIU Total(n) Agreementbyclass
Urban or Built-up (Ur) 74 1 Agricultural Land (Ag) 6 302 2 4 1 6 Woody Vegetation (WV) 9 354 6 2 Herbaceous Vegetation (HV) 9 5 2 123 1 water (wa) 28 d Wetland (We) 48 Barren Land (Ba) 1 14 OtherIUnknown [OIU)
Row Total (n) 98 308 359 133 28 48 15 10 999 Total Agreement 9441999 = 94%
where Au is the uncorrected land-cover accuracy, At is the the- oretical accuracy predicted land cover, and Ar is the accuracy of reference land-cover data.
This approach assumes that error is equally distributed between the predicted land cover and the reference data. How- ever, the assumption of complete data independence is not valid due to spatial correlation inherent with landscape struc- ture, thereby violating the assumption of data independence (Congalton, 1988). Therefore, the overall accuracy should be reported as a accuracy range, reporting both the measured and calculated theoretical values. The advantage of this approach is that the variability of the reference data is accounted for in the accuracy assessment process and provides a better repre- sentation of the true accuracy range associated with the LCLU product reported.
Conclusions Past assessments of the accuracies associated with remote- sensing-based LCLU classifications have largely been qualita- tive. However, as these products are increasingly being inte- grated with other geospatial data and used as modeling inputs, quantitative accuracy assessments may be required to support the calculation of uncertainties associated with data integra- tion products and modeling outputs. If aerial photography or high-resolution satellite imagery is to be used as reference data to support a quantitative accuracy of satellite-derived LCLU maps, a thorough characterization of the variability associated with interpretations should be established. One possible approach is to institute a subset of reference data evaluation sites to provide detailed field reference data that would firmly establish linkages with the landscape resource(s) of interest. This approach would be analogous to the concept of image interpretation keys (Loelke et al., 1983).
Absolute "ground reference" is an illusive goal that is diffi- cult (if not impossible) to achieve when dealing with biologi- cally diverse ecosystems. The ultimate objective is to minimize the variability associated with the reference data to the maxi- mum extent possible to best accomplish a statistically rigorous assessment of LCLU products. The results of this study demon- strate clearly the value of field-based measurement and digital image (camera) data to support the development of reference data of known variability for quantitative assessment of LCLU classification results. The information provided to interpreters from the combination of field measurement and imagery data were adequate to support development of a reference data set with known variability, at multiple classification levels. Simi- lar approaches using a multistage approach incorporating high- resolution (i.e., sub-meter) remote sensing imagery may be fea- sible to establish the interpretation variability associated with reference data set development.
Application of the NRB-VFRDB provided a means to assess the appropriateness of a classification system for the study area prior to the LCLU classification process. In this study, the identi- fication of ambiguous classes facilitated a refinement of the classification systems prior to remote sensing analysis to pro- vide a better correspondence between the classification system and measurable LCLU conditions as they existed within the Neuse River Basin of North Carolina (Table 6). This optimiza- tion of the classification scheme further reduced the variability associated with the reference data and in theory should mini- mize the need to collapse classes subsequent to remote sensing data analysis. The NRB-VFRDB can also be applied repeatedly using alternative classification systems to assess their appro- priateness. Owing to the high level of geopositional accuracy associated with field sampling sites, precise relocation of sites is possible for future repeat measurements to support future
PHOTOGRAMMETRIC ENGINEERING 81 REMOTE SENSING

LCLU change detection methods development, testing, and evaluation.
Acknowledgments The authors would like to acknowledge Mr. Malcolm Wilkins for his technical support to field crews over the duration of this study. Thanks are also extended to Dr. Jayantha Ediriwickrema for his technical assistance in sampling frame development. A special note of thanks is extended to the fine efforts of the Envi- ronmental Careers Organization interns who served as field crewmembers in support of this study. They included Betsy Albright, Daniel Burgos, Ashton Horne, Kristin Kulow, Robin Morris, Craig Morton, Mike Obryon, Naomi Patterson, Gabriela Rarnirez, and Joseph Schwartz. The U.S. Environmental Pro- tection Agency funded and conducted the research described in this paper. It has been subject to the Agency's programmatic review and has been approved for publication. Mention of any trade names or commercial products does not constitute endorsement or recommendation for use.
Anderson, J.R., E.E. Hardy, J.R. Roach, and R.E. Witmer, 1976. A Land Use and Land Cover Classification System for Use with Remote Sensor Data, Geological Survey Circular 671, U.S. Geological Sur- vey, Washington, D.C., 16 p.
Biging, G.S., R.G. Congalton, and E.C. Murphy, 1991. A comparison of photointrerpretation and ground measurements of forest struc- ture, Proceedings of the American Society for Photogrammetry and Remote Sensing Annual Conference, 23-29 March, Balti- more, Maryland, 3:6-15.
Cook, J.G., T.W. Stutzman, W.B. Clinton, K.A. Brenner, and L.L. Irwin, 1995. Spherical densiometers produce biased estimates of forest canopy cover, Wildlife Society Bulletin, 23(4):711-717.
Congalton, R.G., 1988. Using spatial autocorrelation analysis to explore errors in maps generated from remotely sensed data, Photogmm- metric Engineering 6 Remote Sensing, 54(5):587-592.
Congalton, R.G., and G.S. Biging, 1992. A pilot study evaluating ground reference data collection efforts for use in forest inventory, Photo- gmmmetric Engineering 6. Remote Sensing, 58(12):1669-1671.
Congalton, R.G., and R.A. Mead, 1983. A quantitative method to test for consistency and correctness in photointerpretation, Photo- grammetric Engineering & Remote Sensing, 49(1):69-74.
Ganey, J.L., and W.M. Block, 1994. A comparison of two techniques for measuring canopy closure, Western Journal of Applied For- estry, 9(1):21-23.
Hilborn, W.H., 1981. Evaluation of forest inventory classification in airphoto interpretation, Zn-Place Resource Inventories: Principals and Pmctices (Thomas B. Brann, Editor), Proceedings of a National Workshop, 09-14 August, University of Maine, Orono, Maine, pp. 170-175.
Kadmon, R., and R. Harari-Kremer, 1999. Studying long-term vegeta- tion dynamics using digital processing of historical aerial photo- graphs, Remote Sensing of Environment, 68(2):164-176.
Lauer, D.T., C.M. Hay, and A.S. Benson, 1970. Quantitative Evaluation of Multiband Photographic Techniques, Final Report for the Earth Observation Division, Manned Spacecraft Center, NASA, Contract NO. NAS9-9577, 110 p.
Loelkes, G.L., J t , G.E. Howard, Jc, E.L. Schwertz, Jr., P.D. Lampert, and S.W. Miller, 1983. Land UselLand Cover and Environmental Photointerpretation Keys, U.S. Geological Survey Bulletin 1600, U.S. Government Printing Office, Washington, D.C., 142 p.
Lunetta, R.S., R.G. Congalton, L.K. Fenstermaker, J.R. Jensen, K.C. McGwire, and L.R. Tinney, 1991. Remote sensing geographic information system data integration: Error sources and research issues, Photogrammetric Enginering & Remote Sensing, 57(6):677-687.
Milazzo, V.A., 1980. A Review and Evaluation of Alternatives for Updating U.S. Geological Survey Land Use and Land Cover Maps, U.S. Geological Survey Circular 826, U.S. Geological Survey, Res- ton, Virginia, 19 p.
NCDEM (North Carolina Division of Environmental Management), 1993. Neuse River Basin: Water Quality Management Plan, Raleigh, North Carolina, 140 p. + Appendices.
Ormsby, J.P., and R.S. Lunetta, 1987. Whitetailed deer food availability maps from thematic mapper data, Photogrammetric Engineering & Remote Sensing, 53(11):1585-1589.
Scepan, J., G. Menz, and M.C. Hansen, 1999. The DISCover validation image interpretation process, Photogrammetric Engineering 6. Remote Sensing, 65(9):1075-1081.
Stow, D.A., L.R. 'Ifnney, and J.E. Estes, 1980. Determining land use/ land cover change statistics from Landsat: A study of prime agricultural land, Proceedings of the 14th International Sympo- sium on Remote Sensing of the Environment, 123-30 April], Ann Arbor, Michigan, pp. 1227-1237.
USDA (United Stated Department of Agriculture) Forest Service, 1998. Forest Health Monitoring 1998 Field Methods Guide, USDA Forest Service, National Forest Health Monitoring Program, Research Tri- angle Park, North Carolina, 361 p. + Appendices.
Vogehann, J.E., T. Sohl, and S.M. Howard, 1996. Regional character- ization of land cover using multiple sources of data, Photogmm- metric Enginering & Remote Sensing, 64(1):45-57.
(Received 24 April 2000; accepted 03 August 2000; revised 05 Septem- ber 2000)
S SALE ANY SET O F 12 ISSUES ............................. $85 TO ORDER, CONTACT% For USA Addresses (postage included) ASPRS Distribution Center Non-USA Addresses A d d $35 for postage PO Box 305, Annapolis Junction, MD 20701-0305
RESOURCE '2000 ---- ----- -- ----------- -------- ----- -- $10 301 -61 7-781 2; 301 -206-9789 (fax), [email protected]
VISA, Mastercard, and Arner~can Express are accepted ANY 2000 SPECIAL ISSUE ......................... $20
OTHER SINGLE ISSUES ............................... $7 Add $3.00 postage per issue for Non-USA addresses. GST b charged to residents of Canada only (GST #135193065) Tax 1s calcu- lated at 7% ~(subtotal + sh~pp~ng charges)
Availability: 1993 - 2000
Out of Print: January 1998, October & December 1997; June 1996; January 1994; March, July, August, September, & October 1993
F
PHOTOGRAMMETRIC ENGINEERING & REMOTE SENSING