Download (9MB) - City Research Online - City University
313
Chadist, Patrapa (2012). Factors underlying companies response to supply chain disruption: a grounded theory approach. (Unpublished Doctoral thesis, City University London) City Research Online Original citation: Chadist, Patrapa (2012). Factors underlying companies response to supply chain disruption: a grounded theory approach. (Unpublished Doctoral thesis, City University London) Permanent City Research Online URL: http://openaccess.city.ac.uk/1254/ Copyright & reuse City University London has developed City Research Online so that its users may access the research outputs of City University London's staff. Copyright © and Moral Rights for this paper are retained by the individual author(s) and/ or other copyright holders. All material in City Research Online is checked for eligibility for copyright before being made available in the live archive. URLs from City Research Online may be freely distributed and linked to from other web pages. Versions of research The version in City Research Online may differ from the final published version. Users are advised to check the Permanent City Research Online URL above for the status of the paper. Enquiries If you have any enquiries about any aspect of City Research Online, or if you wish to make contact with the author(s) of this paper, please email the team at [email protected] .
Transcript of Download (9MB) - City Research Online - City University

Chadist, Patrapa (2012). Factors underlying companies response to supply chain disruption: a
grounded theory approach. (Unpublished Doctoral thesis, City University London)
City Research Online
Original citation: Chadist, Patrapa (2012). Factors underlying companies response to supply
chain disruption: a grounded theory approach. (Unpublished Doctoral thesis, City University
London)
Permanent City Research Online URL: http://openaccess.city.ac.uk/1254/
Copyright & reuse
City University London has developed City Research Online so that its users may access the
research outputs of City University London's staff. Copyright © and Moral Rights for this paper are
retained by the individual author(s) and/ or other copyright holders. All material in City Research
Online is checked for eligibility for copyright before being made available in the live archive. URLs
from City Research Online may be freely distributed and linked to from other web pages.
Versions of research
The version in City Research Online may differ from the final published version. Users are advised
to check the Permanent City Research Online URL above for the status of the paper.
Enquiries
If you have any enquiries about any aspect of City Research Online, or if you wish to make contact
with the author(s) of this paper, please email the team at [email protected].

Factors Underlying Companies Response to Supply Chain Disruption:
A Grounded Theory Approach
Patrapa Chadist
A thesis submitted in partial fulfilment of the requirements for the degree of
Doctor of Philosophy in Management
Submitted to:
Cass Business School, City University
May 2012

2
Table of Contents
TABLE OF CONTENTS 2
LIST OF FIGURES 6
LIST OF TABLES 7
ACKNOWLEDGEMENT 8
ABSTRACT 9
CHAPTER 1: Introduction 10
1.1 Research Background 10
1.2 The General Problem Area 12
1.3 Aim of the Research 13
1.4 Potential Contribution 13
1.5 Structure of the Report 14
Chapter 2: Literature Review & Research Question 17
2.1 Risk and Risk Management 17
2.1.1 Risk 17
2.1.2 Risk and Uncertainty 20
2.1.3 Risk Management 20
2.2 Business Continuity 23
2.3 Crisis Management 24
2.4 Risk and Supply Chain Management 25
2.4.1 Supply Chain Management 25
2.4.2 Supply Chain Risk 28
2.4.3 Type of Supply Chain Risk 30
2.4.4 Supply Chain Risk Sources 32
2.4.5 Supply Chain Disruption 36
2.4.6 Supply Chain Vulnerability 38
2.4.7 Supply Chain Risk Management 39
2.5 Time Based Management and Response 42
2.6 Existing Theories 44
2.6.1 Normal Accident Theory 44
2.6.2 High Reliability Theory 45
2.6.3 Transaction Cost Theory 46
2.6.4 Agency Theory 47
2.7 Research Gap 48
2.8 Research Question 51
2.9 Research Framework 52

3
CHAPTER 3: Methodology 58
3.1 Grounded Theory Methodology 58
3.2 Grounded Theory and Qualitative Research 60
3.3 Grounded Theory and Abductive Research 64
3.3.1 Abduction within Grounded Theory Approach 66
3.3.2 Different Proponents of Grounded Theory Building Process 68
3.4 Glossary of Grounded Theory 72
3.5 Case-Based Research and Grounded Theory 73
3.6 Step-by-Step Guide to Grounded Theory in this Research 76
CHAPTER 4: PHARMA H1N1 Influenza Pandemic 102
4.1 Introduction 102
4.2 Company Overview 103
4.3 Background of the H1N1 2009 Influenza Pandemic 113
4.4 Companies and Parties Involved 121
4.5 Timeline of the Disruption 129
CHAPTER 4: Findings - PHARMA Response during the H1N1 Influenza Pandemic 137
5.1 The Disruption 140
5.2 Overview of PHARMA Response 145
5.3 Coding and Categorisation of PHARMA Data 153
5.4 Response Time and Preliminary Core Categories 185
CHAPTER 6: Validation with Disruption at BP Deepwater Horizon 191
6.1 Company Overview 192
6.2 Background of BP Deepwater Horizon Oil Spill 192
6.3 Companies and Parties Involved 201
6.4 Timeline of the Disruption 202
6.5 Handling of Disruption by BP 207
6.5.1 Assessment of Causes 207
6.5.2 Overview of BP Response 209
6.5.3 Coding and Categorisation of Data from BP Deepwater Horizon 214
6.5.4 Response Time at BP Deepwater Horizon 224
CHAPTER 7: Validation with Disruption at BP Texas City 229
7.1 Company Overview 229
7.2 Background of BP Texas City Refinery Explosion 230
7.3 Companies and Parties Involved 230
7.4 Timeline of the Disruption 234

4
7.5 Handling of Disruption by BP 237
7.5.1 Assessment of Causes 237
7.5.2 Overview of BP Response 238
7.5.3 Coding and Categorisation of Data from BP Texas City 239
7.5.4 Response Time at BP Texas City 245
CHAPTER 8: The Emergent Theory 249
8.1 Introduction 249
8.2 Integrating Categories and Their Properties 249
8.3 Factors Underlying Response Time 251
8.4 Preparation 252
8.4.1 Develop Advanced Warning System 253
8.4.2 Conduct Stress Testing 253
8.4.3 Develop Scenario Plan and Modelling Capability 254
8.4.4 Leverage Preparedness Plan 255
8.4.5 Implement Training 256
8.5 Partnership 256
8.5.1 Establish Frequent Communication with Supply Chain Partners 257
8.5.2 Establish Relationship with Governments and Agencies 257
8.5.3 Establish Relationship with Business Partners 258
8.5.4 Establish Relationship with Competitors 258
8.6 Organisation 259
8.6.1 Create Integrated Response Team 259
8.6.2 Shorten Lines of Communications within the Organisation 260
8.6.3 Establish Learning from Past Events and During the Events 260
8.6.4 Clarify Roles and Responsibilities 261
8.7 Reserve 261
8.7.1 Assure Management Capacity and Employee Capacity 262
8.7.2 Increase (Production) Capacity 263
8.7.3 Develop Product or Solution Extension 263
8.7.4 Acquire Additional Suppliers 264
8.7.5 Increase Flexibility 264
8.7.6 Increase Inventory 264
8.8 Core Categories in Related to the 3-D Framework 265

5
CHAPTER 9: Conclusion 273
9.1 Research conclusion 273
9.2 Implications of the research 274
9.2.1 Theoretical implications 274
9.2.2 Managerial implications 275
9.3 Limitations of the Study and Future Work 279
BIBLIOGRAPHY 282
APPENDICES 297
Appendix 1: Acronyms PHARMA Case 297
Appendix 2: Acronyms BP Deepwater Horizon 298
Appendix 3: Timeline of BP Deepwater Horizon Oil Spill 299
Appendix 4: Acronyms BP Texas Case 309

6
List of Figures
Figure 1: The Process of Risk Assessment 22
Figure 2: The Risk Management Process 22
Figure 3: Supply Chain Management 28
Figure 4: Classification of Disruption Risk 53
Figure 5: Time Dimensions in Time-Based Risk Management Framework 55
Figure 6: The Effect of Reducing Response Lead Time 56
Figure 7: The Research Conceptual Framework 57
Figure 8: The Purely Deductive and Inductive Research Process 65
Figure 9: The Abductive Research Process Applied in This Research 67
Figure 10: Data Analysis Process in This Research 86
Figure 11: PHARMA Risk Management and Compliance Framework 108
Figure 12: PHARMA's Basic Approach to Supply Chain Risk Management 108
Figure 13: Process Map 110
Figure 14: Risk Analysis Matrix Before and After Mitigation and Contingency Plan 111
Figure 15: Business Continuity Planning Model 112
Figure 16: Number of Laboratory Confirmed Cases as of 22 June 2009 121
Figure 17: WHO Pandemic Influenza Phases 123
Figure 18: Timeline of PHARMA Response to the 2009 H1N1 Pandemic 152
Figure 19: An Overview of the Codes, Sub-Categories and Potential Core Categories 155
Figure 19a: A Structure of the Category "Preparation" and Its Sub-Categories and Codes 155
Figure 19b: A Structure of the Category "Partnership" and Its Sub-Categories and Codes 155
Figure 19c: A Structure of the Category "Organisation" and Its Sub-Categories and Codes 156
Figure 19d: A Structure of the Category "Reserve" and Its Sub-Categories and Codes 156
Figure 20: Manufacturing and Supply Chain (MSC) Pandemic Management Organisation Chart 167
Figure 21: Communication Lines during the Initial Response of H1N1 Outbreak 170
Figure 22: Revised Communication Lines During the H1N1 Outbreak 170
Figure 23: Nicole Supply Chain 174
Figure 24: Production Load Balancing Strategy 176
Figure 25: Published, Improved & Upside Weekly Nicole Output 180
Figure 26: Finding thus Far from PHARMA Case 190
Figure 27: Timeline of BP Response to Deepwater Horizon Oil Spill 206
Figure 28: Timeline of BP Response to the Refinery Explosion in Texas City 236
Figure 29: An Overview of the Core Categories and Sub-Categories Following Completion of the
Analysis of Three Cases 250
Figure 30: Factors Underlying Companies' Response to Supply Chain Disruption 252
Figure 31: Rule of Thumb for Tailored Risk Management 262

7
List of Tables
Table 1: Definition of Risk Management 21
Table 2: The Risk Management Process 23
Table 3: Review of Literature Related to Supply Chain Disruption 38
Table 4: Risk Management Strategy 40
Table 5: Definition Used in the Research 57
Table 6: Positivist, Hermeneutic and Grounded Theory Assumptions 63
Table 7: The Method of Deduction, Induction and Abduction 66
Table 8: Data Analysis: Strauss and Glaser Compared 68
Table 9: Grounded Theory Steps Outlined by Different Authors 71
Table 10: Glossary of Grounded Theory Terms 73
Table 11: What Grounded Theory Is and What It Is Not 76
Table 12: The Difference between the Glaserian and Straussian Approaches to Grounded Theory 77
Table 13: The Process of Building Grounded Theory in This Study 79
Table 14: Final Interview Protocol 83
Table 15: Data Sources, Data Collection Methods and Data Contents from PHARMA 84
Table 16: An Example of Developing Categories 87
Table 17: An Example of Basic Form of Generic Relationship of Axial Coding in This Study 90
Table 18: Data Sources, Data Collection Methods and Data Contents from BP 98
Table 19: A Fact Sheet of Three Disruptions 100
Table 20: Similarities and Differences of Three Disruptions 101
Table 21: Significant Risk Facing PHARMA 107
Table 22: Five by Five Matrix - Likelihood and Impact Scoring 111
Table 23: A Range of Content for Risk Register 111
Table 24: WHO Pandemic Influenza Phase Descriptions and Actions in Each Phase 125
Table 25: Timeline of the 2009 H1N1 Pandemic 135
Table 26: Application of Grounded Theory Methodology in This Study 139
Table 27: PHARMA Manufacturing Sites and Locations 172
Table 28: A Summary of the Findings from PHARMA in Relation to Response Time 188
Table 29: Examples of Decisions that Increased Risk at Macondo while Potentially Saving Time 215
Table 30: A Summary of Finding from BP Deepwater Horizon 228
Table 31: Timeline of BP Refinery Explosion in Texas City 235
Table 32: A Summary of the Findings from BP Texas City Case 248
Table 33: A Summary of Findings from Three Settings in Related to 3-D Framework 268
Table 34: A Summary of Examples from Three Settings 272
Table 35: Timeline of BP Deepwater Horizon Oil Spill 308

8
Acknowledgement
It would have not been possible to write this doctoral thesis without the help and
support of the kind people around me.
First and foremost, I would like to express my deepest and sincere gratitude to my
supervisor, Professor ManMohan Sodhi, for his exceptional guidance, time,
encouragement, patience and continuous support. Without him, this thesis would
not have been finalised. One could not wish for a more understanding, helpful and
motivated supervisor.
I also would like to show my gratitude to Dr. Son, Byung-Gak for his advice along
my PhD journey. It has been an honour to be his first Ph.D. student; my thanks
also to Professor Gianvito Lanzolla and Professor Michael Bourlakis for their
valuable recommendations.
In addition, I would like to thank "YOU" - all my friends and PhD colleagues - for
your support in all different ways.
Finally, I would like to thank my wonderful family for their boundless support from
afar and Rolf Huber for nearly unlimited patience and bountiful advice.

9
Abstract
A wide range of recent man-made and natural disasters has demonstrated the
importance of managing disruption risk in global supply chains. This research
argues that supply chain disruptions are, de facto, unavoidable and consequently all
complex supply chains can be considered inherently risky. This research focuses on
a relatively unexplored issue in supply chain risk management, asking and answering
the question of how companies specifically use time to respond to catastrophic
events of low probability but high impact. Linking faster response lead-time with
reduced impact, the goal is to identify and explore the underlying factors of
managing disruption risk by answering how companies respond to supply chain
disruptions. In reducing total response time by detecting the event, designing
solutions, and deploying a recovery plan sooner after a disruption, the company can
reduce the impact of disruption risk.
The research uses Grounded Theory methodology to extend an emerging
framework on time-based supply chain risk management. Empirical data is used
from a range of sources including interviews and corporate publications from the
events faced by global pharmaceutical manufacturer during a pandemic in 2009.
The emerging categories of possible factors in response time are further developed
using data from the events surrounding the worst maritime oil spill in history in
2010 under the management responsibility of the Exploration and Production
(Upstream) division of a global energy company and from an industrial accident in
2005 in the Refining and Marketing division of the same firm.
The research identifies four categories of factors that companies can focus on to
reduce response time in the face of catastrophic events of low probability and high
impact: organisational structure, preparation, partnership and reserve. The research derives
new insights, presented as four propositions that relate the response time in
managing supply chain disruption to negative or potentially positive impact.

10
Chapter 1 Introduction
1.1 Research Background
Supply chain risk is the probability of incurring a loss within the supply chain that is
related to the logistics activities in companies’ flows of material and information
(Ritchie & Brindley, 2007).
Although awareness is increasing among practitioners and researchers, the concepts
of supply chain vulnerability and its managerial counterpart, supply chain risk
management (SCRM), are still in their infancy (Christopher et al., 2002). A number
of researchers suggest that supply chain exposure to risk has increased in recent
decades due to higher demand, globalisation of markets, market saturation and
increased competition as well as shorter product life cycles. AMR Research found
that more than 42% of the surveyed companies managed more than five different
supply chains in 2006, mainly due to the need to produce multiple products for
multiple markets. These developments have led to higher exposure to risks in the
supply chain of global firms (Christopher et al., 2002). Supply chains must adapt to
these forces to stay competitive but at the same time will thereby increase their
exposure to different forms of risk (Christopher et al., 2002; Faisal et al, 2006;
Hallikas et al., 2002; Handfield & Nichols, 1999; Sodhi & Tang, 2009).
Initiatives in supply chain optimisation – such as minimising stock – can exacerbate
the likelihood or impact of unanticipated events, for example, sharp increase in
demand, production or supply-side failure. Moreover, mitigation strategies
addressing one type of risk can have an adverse affect on another type of risk to the
supply chain (Chopra & Sodhi, 2004). This suggests managers must find a balanced
approach between their strategies for supply chain management and for supply
chain risk management.
Failure to manage supply chain risks effectively can have a major impact on an
organisation (Mitchell, 1995). The negative impact is not only from financial loss
but also reduction in product quality, delivery delays, damage to property and
equipment, and loss of reputation among customers, suppliers and the public

11
(Cousins et al., 2004). As Hendricks and Singhal (2003, 2005) documented, not only
can the failure to manage supply chain risks effectively lead to a sharp drop in an
organisation’s share price, which can be slow to recover, it can also generate conflict
amongst the organisation’s stakeholders.
There are many unexpected and unpredictable disruptions in the last few years that
highlight the vulnerability of supply chains. Ericsson lost GBP 240 Million in 2000
due to fire at a supplier’s semiconductor plant in Albuquerque, New Mexico and
the lack of alternative supply channels. Apple lost a significant number of orders
following supply interruptions due to an earthquake in Taiwan in 1999. Land Rover
laid off 1,400 workers after their supplier became insolvent in 2001. The
longshoremen’s strike in California in 2002, and the outbreak of SARS in 2003, and
‘triple play’ disaster of earthquake, tsunami and nuclear crisis in northern Japan in
April 2011 are further examples of events that paralysed supply chain flows. The
impacts of such disruptions can be catastrophic. Disruption is inherently difficult
or impossible to predict, whether due to man-made causes such as terrorism (World
Trade Center attack in 2011), military action (Kuwait in 1990) or natural events
such as hurricane (Katrina, destroying New Orleans in 2005) and disease (UK foot
and mouth disease in 2001 and 2007 and recently the H1N1 Influenza pandemic in
2009) and have the power to disrupt or cause uncertainty in supply chains (Elliott,
2005; Peck & Juttner, 2002).
A disruption to supplies in one country can quickly spread through an entire global
supply chain (Harland et al., 2003). There is evidence that economic, political and
social developments over the past decade appear to be increasing the risk of supply
chain disruptions as supply chains are getting longer and more complex and are
involving more partners due to the increase in global sourcing (Hendricks &
Singhal, 2005). A case in point is the sharp increase in world oil prices as a
consequence of the disruption of US oil production brought about by hurricane
Katrina (Elliott, 2005). Supply chain disruption can potentially be very costly, and
Rice and Caniato (2003) stated that the financial impact of a supply chain disruption
is difficult to predict.
The importance of supply chain risk management has been recognised by
organisations and researchers because of the short-term effects (negative publicity,
low consumer confidence, loss in market share) and long-term effects (stock prices

12
and equity risk) (Sodhi & Tang, 2009; Hendricks & Singhal, 2005). Seeing risk as an
important issue in the supply chain, Harland et al. (2004) recommend that supply
chain risk management should focus on positioning the organisation to try to avoid
such events and to develop strategies to manage the impact of them should
avoidance not be possible. If the supply chain risks can be effectively and efficiently
managed, considerable benefits can accrue not only to companies and their
shareholders but also to their suppliers and their end customers.
1.2 The General Problem Area
The concept of supply chain risk management emerged in the early 1980s. Kraljic
published one of the first articles in this field entitled ‘Purchasing must become
supply management’ in 1983 (Paulsson, 2004). As the field supply chain risk
management is even today still in the development stage, most literature focuses on
explaining the importance of supply chain risk management, defining what supply
chain risk is, what are the sources of supply chain risk and how to manage risk.
Notably, there is no unified theory or framework defined on how organisations can
manage supply chain disruption risk. In a complex business environment,
unfavourable surprises and unexpected events are not just an exception but have
become the norm (Ansoff, 1975; Perrow, 1984). Nevertheless, recent studies have
revealed a lack of implementation of supply chain risk management (Juttner, 2005;
Mitroff & Alpaslan, 2003). Moreover, the literature on supply chain risk is quite
limited due in part to ambiguous taxonomy. Many publications attempt to clarify
the definition of relevant terms in the area of applied risk management and security
(Craighead et al., 2007; Harland, Brenchley & Walker, 2003; Ritchie & Brindley,
2007).
In the past several years, researchers have developed a number of different models
to manage supply chain risks (Christopher, 2002; Chopra & Sodhi, 2004; Lee, 2004;
Sheffi, 2005; and Tang, 2006), using a range of ideas and techniques to identify,
analyse and mitigate the effects of disruption. Focus on risk has led to suggest a
new approach to supply chain strategy which goes beyond, for example, cost
reduction and time-based competition, to address product characteristics,
production and distribution strategies, and a partnership approach to suppliers and
customers (Chopra & Sodhi, 2004; Tang, 2006a). These strategies can be more

13
effective, and executed with lower negative impact, when deployed using time
focussed risk management. This also suggests that early warning before an event, or
the escalation of a disruption, can contribute to a more effective handling of
catastrophic events.
1.3 Aim of the Research
Overall the goal is to contribute to theory building of supply chain risk management
resulting in a framework and propositions for further study. Using a risk framework
and the outcome of the research, the aim is to support general theory and
specifically prescribe an approach to management of risk that explicitly incorporates
the role of time. This could serve as the basis for further field validation and can
also be assessed for the impact on theory building in related fields of supply chain
risk management.
The specific goal is to understand companies’ response to disruption. I seek to
analyse, outline and categorise possible factors that underlie response. These are
summarised as a set of propositions for further study, which can explore and
validate specific drivers of event detection and response.
1.4 Potential Contribution
The contribution of this study is in providing a deeper understanding of the factors
that organisations can manage to reduce the impact of disruption risk. By explicitly
addressing the role of time reducing the impact of disruption, this contributes to the
development of an integrated framework of supply chain risk management
incorporating total supply chain cost, time and risk.
This research also adds to the existing literature on supply chain risk management
by empirically exploring the ways in which the components of time create value for
managing supply chain risk based on time-based risk management concept.

14
1.5 Structure of the Report
Chapter 1 – provides background information regarding supply chain risk
management in order to set the scene for the study and gives an overview of the
thesis.
Chapter 2 – presents an overview of relevant research on risk and risk
management, business continuity, crisis management, risk and supply chain
management, time-based management and theoretical approaches behind the
research. The chapter aims to review the emerging knowledge of supply chain risk
management and supply chain disruption to identify a research gap to be addressed
by this study. Finally, the research gap, research questions and emerging conceptual
framework on time-based risk management (Sodhi & Tang, 2009) are addressed.
The framework is used to argue that if a firm can shorten its response time by
deploying a recovery plan soon after a disruption, the firm can reduce the impact of
the disruption by way of faster recovery. The time-based framework provides the
structure and a lens with which to organize the data analysis, consistent with the
methodology described in the next chapter.
Chapter 3 – provides an overview of the relevant research methodology for this
study, Grounded Theory, along with perspectives in the literature in its evolution
and options in application. This methodology is well suited for qualitative data
analysis based on contemporary events. In this study, a Straussian approach to
Grounded Theory is taken, which lends itself to the time-based risk management
framework as a starting point for data collection and analysis. The methodology
used can be viewed as abductive, building and validating the initial emerging
structures derived from the initial study with data taken from subsequent sources.
The three major data sources used in this study are presented in the following
chapters along with the initial and revised findings.
For each event under study here, the causal relationship of decisions taken prior to
the disruption and the event itself are investigated, with a particular focus on how
the firms detected and responded to the event. Data is then analysed by coding
through summarisation, reduced to group similar codes in major categories and
finally synthesised to a set of propositions on factors underlying disruption
response.

15
Chapter 4 – provides an introduction and background of the first exploratory case,
that of a global pharmaceutical company (referred to in this study as PHARMA)
during the H1N1 Influenza Pandemic in 2009. The novel Influenza strain, H1N1,
commonly known as swine flu, had fast transmission but unknown mortality at the
outset, resulting in a dramatic spike in demand for PHARMA’s antiviral and related
medicines. PHARMA’s handling of the Influenza pandemic declared in April 2009
is reviewed by an analysis of interviews of key management, company internal and
public documentation.
Chapter 5 – provides a detailed analysis of the qualitative data using Grounded
Theory obtained from PHARMA. Data was taken from interviews, team
conference calls and meetings, during the event, corporate reports and plans before
and after the pandemic. Open coding was used to code and group similar actions
and description of factors that companies should focus on to reduce response time.
The four potential categories of factors that underlie the firm time-based response
to handing such an events were discovered: Preparation (warning, stress test,
modelling, planning and training), Partnership (external communication,
relationship with competitors, government, agencies and business partners),
Organisation (teamwork, internal communication, roles and responsibilities and
learning), and Reserve (employee capacity, production capacity, supplier capacity,
product design and solution design).
Chapter 6 – presents the first stage of the constant comparative analysis by looking
in depth at how the BP Upstream division, its contractual suppliers and various
government agencies responded to the Deepwater Horizon oil spill in the Gulf of
Mexico in 2010.
Chapter 7 – describing the background and the analysis from BP Refining and
Marketing divisions’ handling of a fatal explosion at their Texas City Refinery in
2005, in which 15 workers were killed and 180 injured, resulting in an extensive
review of BP and industry operations.
These two additional disruption events from BP serve to validate the initial
categories and codes developed in PHARMA.

16
Chapter 8 – presents the confirmed core categories in detail. It discusses how the
core categories, their properties (sub-categories), and links between categories were
integrated. It also provides an explanation as to how these four categories affected
response speed. Finally, it illustrates how these four categories in related with time-
based risk management framework. The findings show that the presence – or lack
of – these factors can have an impact on the response speed for the effective
management of disruption. By giving examples of what actions the companies took
at each stage shows that these factors can help the company reduce detection time,
design time, and deploy time.
Chapter 9 – presents the conclusions of the study and four propositions that relate
the response time in managing supply chain disruptions to have a negative or
potentially positive impact. The propositions augment the existing knowledge
related to response and support hypothesis testing for further research in the field
of supply chain risk management. This concludes with a perspective of the
implications of these findings from a theoretical and managerial view, along with
the limitations of the study and recommendations for future research in the area.
Chapter 2 Literature Review & Research Question
2.1 Risk and Risk Management
2.1.1 Risk
The first known theoretical contribution to understanding risk was made by Blaise
Pascal and Pierre de Fermat, who in the 17th century studied gambling from a
mathematical perspective (Frosdick, 1997). Development of probability theory
followed, based substantially on their initial mathematical work (Bernstein, 1996).
For approximately the next 200 years, risk management continues to be mostly
applied to gambling.
The insurance industry was the first to embrace risk management (Moore, 1983),
which was then followed by a broader use across various industries and corporate
functions in the mid-20th century (Grose, 1992; Snider, 1991). For example, risk
management was applied to purchasing by Robinson et al. (1967) and their
development of the Buy Grid model. More recently, transaction cost economics
developed by Williamson (1979) highlighted the relationship between transaction
cost risks and degree of uncertainty in the customer and supplier interaction, as
increased dependency on a supplier could cause a supplier to act opportunistically
by increasing prices. According to Moore (1983), risk consists of two basic
components, namely the range of outcomes and the likelihood distribution of these
outcomes. In Williamson’s work, transaction cost economics is closely linked to
Moore’s definition of risk, exemplified by the supplier/customer relationship where,
for example, a loosely controlled contractual relationship will have the tendency to
increase opportunistic behaviour.
According to Zsidisin (2003), the concept of risk has been the subject of extensive
studies in numerous business settings, such as managerial decision making (March
& Shapira, 1987; Yates & Stone, 1992; Shapira 1995), strategy (Ruefli et al., 1999;
Sitkin & Pablo, 1992), operations (Newman et al., 1993; Pagell & Krause, 1999),

18
accounting (Ash-ton, 1998; Baucus et al., 1993), finance (Ho & Pike, 1992; Chow &
Denning, 1994) and distribution (Celly & Frazier, 1996).
Risk is not only about outcomes and likelihood of occurrences, but also about
choices and behaviour when facing these (Bernstein 1996). The choices made in a
supplier/ customer relationship and the level of integration can be mutually
rewarding (Burnes & Dale, 1998; Burnes & New, 1996; Womack et al., 1990)
however they can also be risky if opportunistic behaviour takes over (Cousins et al.,
2004). Therefore risk – and the choices made when facing risk – comprises the fear
of losing and the hope of gaining (Moore, 1983). Within organisations and their
management practices, the negative aspects of risk have however been dominant
(Hood & Young, 2005; March & Shapira, 1987).
The Royal Society (1992) defines risk as ‘a combination of the probability, or
frequency, of occurrence of a defined hazard and the magnitude of the
consequences of the occurrence’, which is similar to Rowe (1980), Lowrance (1980)
and Simon et al., (1997) definition that defined risk is a measure of the probability
of unwanted negative consequence to arise from a specific event.
Sitkin and Pablo (1992, p.10) reflect this in their generalised definition of risk as
being ‘the extent to which there is uncertainty about whether potentially significant
and/or disappointing outcomes of decision will be realized.’
Most definitions of risk encompass three common elements: (1) the likelihood of
occurrence of a particular event or outcome; (2) consequences of the particular
event or outcome occurring; and (3) the exposure or causal pathway leading to the
event (MacCrimmon & Wehrung, 1986).
The first element of risk is the likelihood of occurrence, also called probability that
can be measured in objective or subjective terms. Two schools of thought regarding
risk likelihood or probability are found in the literature. In one view, risk can be
treated scientifically as an observable, measurable factor (Lupton, 1999). From an
objective perspective, risk is tangible and static in its form. It can be evaluated and
analysed by using statistical methods and tools applied to known quantifiable data
(Covello & Merkhofer, 1993). Others argue that risk is perceptive, subject to social
context and interpretation with sensitivities determined by socio-political and

19
historical factors (Bernstein, 1996; Frosdick, 1997; Moore, 1983; Spira & Page,
2002; Yates & Stone, 1992).
Yates and Stone (1992:p.5), for example, see the argument that risk must be treated
as subjective as it involves ‘an interaction between the alternative and the risk taker.’
They maintain that the nature of any potential loss, its significance and the
estimated chance of its occurring, are personal to the individuals concerned, for
example the result of risk-taking can be perceived as positive by some but negative
by others. Since the likelihood and consequences are specific to the individuals,
where each can benefit or lose according to their own context and hence perceive
risk individually, risk must be subjective. Risk is not, therefore according to Yates
and Stone, an objective factor in decision making.
Thomas Bayes, an English clergyman and mathematician, took a similar view. He
viewed risk as a product of perceptions: ‘probability is a number of expressing a
state of knowledge or degree of belief that depends on the information, experience
and theories of the individual who assigns it’ (Covello, 1993: p.209). This
perspective therefore requires information that is unrelated to the available data.
When applying an objective view of risk, the evaluation of probability will be
subject to fitting the real world into mathematical concepts and statistical methods
(Vesely, 1984). This may result in a somewhat artificial interpretation of the real
world to be matched with the structure and constraints of mathematical and
theoretical models. But also the subjective view generates its specific challenges,
namely that the risk and probability evaluation will be subject to the assumptions of
the analyst and the interpretation of information. Hence analysts will typically arrive
at different conclusions to the same information.
The second element of risk is the consequence of the particular event or outcome,
which should not simply be regarded as only negative, since ‘the essence of risk
taking is the potential opportunity to produce positive outcomes’ (Blume, 1971).
The causal pathway is the third element of risk, which is an understanding of the
sources, cause and nature of factors that in turn influence the likelihood, nature and
scale of consequences, whether positive or negative.

20
2.1.2 Risk and Uncertainty
In 1921, Knight established an important distinction between risk and uncertainty.
From his book Risk, Uncertainty and Profit, situations displaying risk are those
where decision-makers are faced with unknown outcomes but with known
probability distributions before the event. In his view, risks can be anticipated and
priced in competitive markets; therefore associated profits are competed away. Risk
is measurable in the sense that estimates can be made of the probabilities of the
outcome. On the other hand, uncertainty concerns the unforeseeable elements in
markets, and by definition those elements are not fully priced or factored into a
firm’s decision. It is not quantifiable and the probabilities of the possible outcome
are not known.
Slack and Lewis (2001) describe ‘uncertainty as a key driver of risk but argue that
managers are able to measure and change their exposure to risk through the
development of prevention, mitigation and recovery strategies. Whilst these do not
eliminate uncertainty, they do enable managers to reduce the risks which might arise
from uncertainty.’
Knight (1921) viewed the superior source of profit to be random beyond the
control of companies however Schoemaker (2002, p.12) argued, ‘uncertainty might
indeed create opportunities as the firm can be favoured by chance and organisations
can be designed to profit from uncertainty through superior anticipation, flexible
strategies, and dynamic monitoring.’ Therefore, in summary risk can be measurable
and manageable while uncertainty cannot.
2.1.3 Risk Management
The International Organisation for Standardisation (ISO) defined risk management
in ISO31000: 2009 as ‘coordinated activities to direct and control an organisation
with regard to risk.’ A list of risk management definition by numerous authors is
presented in Table 1.
Risk management has become a main part of many organisational activities and its
main aim is to help all other management activities achieve the organisation’s aims
directly and efficiently (Tchankova, 2002).
21
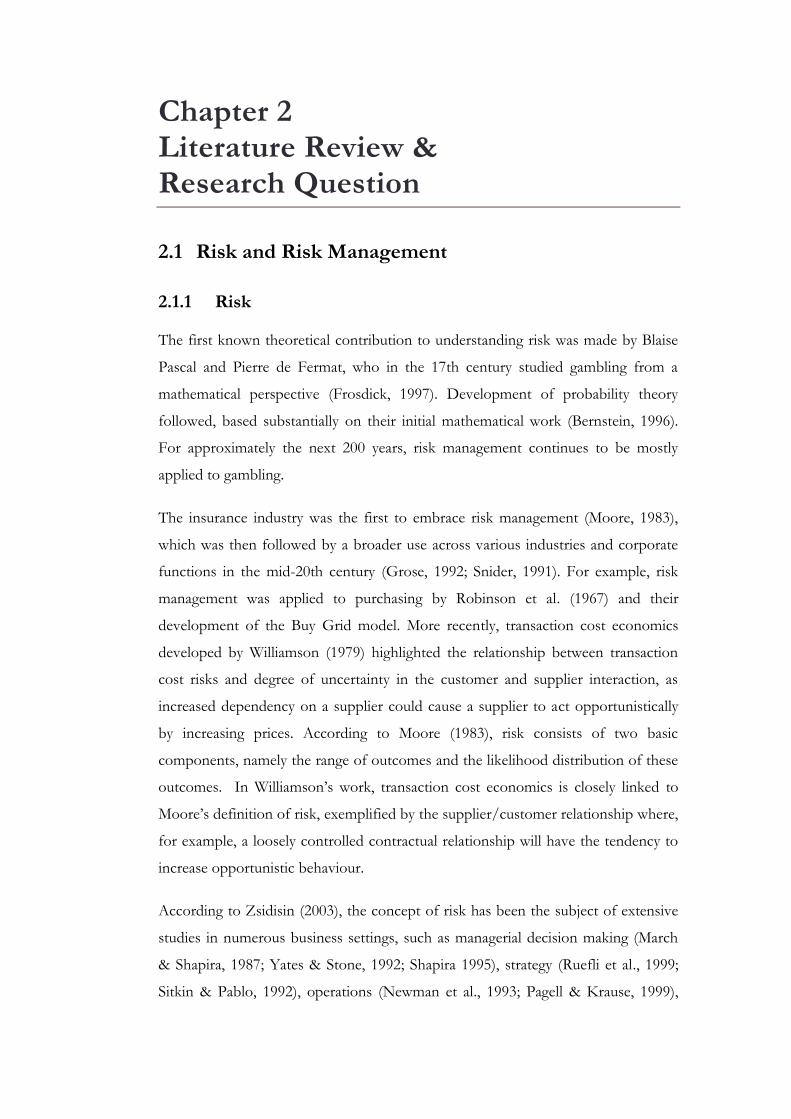
The actual process of risk management normally begins by assessing two factors:
first, the likelihood of specific events occurring, and second, the consequences
should the events actually occur (Cox & Townsend, 1998). Between academics
there is a general consensus on the phases of the process of managing risk, whereas
each phase or step sometimes is coined differently. A review of the literature by
White (1995) suggests that the process of risk assessment in Figure 1 usually
consists of three stages: (1) risk identification – determining all risk factors that are
likely to occur on a project (2) risk analysis – understanding the likelihood and
extent of the most significant risks and (3) risk evaluation – deciding on the most
appropriate management response for each risk and which party is most
appropriate to manage each of the risks identified.
The risk management process in ISO 31000 is illustrated in Figure 2, comprising of
five key activities: communication and consultation, establishing context, risk
assessment, risk treatment and monitoring and review (Table 2).
Year Authors Definition
1989 Dickson (1989) The identification, analysis and control of those risks, which can threaten the assets, or earning capacity of an enterprise.
1992 The Royal Society The making and implementing of decisions regarding risks and their subsequent implementation, and flows from risk estimation and risk evaluation. It focused on understanding risks and mitigating the impact of risks by reducing the likelihood of their occurrence and/or the avoidance of their consequences. To manage risk means to avoid, reduce, transfer or share risk.
1995 The British Standards Institution
The process whereby decisions are made to accept a known or assessed risk and/or the implementation of actions to reduce the consequences or probability of occurrence.
2000 Fone and Young
A general management function that seeks to assess and address risks in the context of the overall aims of the organisations.
Table 1: Definition of Risk Management

22
Figure 1: The Process of Risk Assessment
Source: White (1995)
Figure 2: The Risk Management Process
Source: ISO 3100: 2009
Risk Assessment
Risk identification
Risk analysis
Risk evaluation
Establishing context
Risk treatment
Ris
k t
reatm
ent
Co
mm
un
icati
on
an
d c
on
sult
ati
on

23
Key activities Description
Communication and consultation
Engaging internal and external stakeholders throughout the risk management process.
Establishing context
Setting parameters or boundaries around the organisation’s risk appetite and risk management activities. The results of this context are risk management policy, processes, methods and reporting processes.
Risk assessment Overall process of identifying, analysing and evaluating risks. Risk identification is a process of finding, recognising and describing risks. Identification techniques including brainstorming, work breakdown analysis, and expert facilitation. Risk analysis is a process to comprehend the nature of risk and to determine the level of risk. It considers possible causes, sources, likelihood and consequences to establish the inherent risk. Risk evaluation is a process of comparing the results of risk analysis with risk criteria to determine whether the risk and/or its magnitude are acceptable or tolerable.
Risk treatment Process to modify risk. Risk treatment can involve avoiding the risk by deciding not to start or continue with the activity that gives rise to the risk, taking or increasing risk in order to pursue an opportunity, removing the risk source or changing the likelihood.
Monitoring and review Process of continual checking, supervising, critically observing or determining the status in order to identify change from the performance level required or expected, keeping the risk management framework relevant to the changing needs of the organisation and external influences.
Table 2: The Risk Management Process
Source: Adapted from ISO 3100:2009
2.2 Business Continuity
The disciplines of risk management and business continuity management (BCM)
share similarities, but there are important differences found in the general
consensus among practitioners. Whereas risk management has the primary focus on
assessing and managing known risks, BCM has been developed primarily by
practitioners to minimise the effects of unanticipated events on the firm’s ability to
meet customer requirements (Zsidisin et al., 2005). It is also focussed on keeping
the business going and mitigating consequences no matter the type of event or risk
that occurs with a possible negative impact on business activities (Hiles & Barnes,
2001).
Business continuity management is defined as ‘…the development of strategies,
plans and actions which provide protection or alternative modes of operation for
those activities or business processes which, if they were to be interrupted, might
otherwise bring about a seriously damaging or potentially fatal loss to the enterprise
(Hiles & Barnes, 2001).

24
According to CMI (2002), BCM includes crisis management (the overall process to
manage an incident), disaster recovery (recovery of critical systems, applications,
data and networks), business recovery (recovery of critical business processes) and
contingency planning (recovery from impact external to the organisation).
There is, as mentioned an overlap between risk management and BCM but the
definitions are being debated and one group of practitioners argues that risk
management is a part of BCM whereas another claims the opposite. A third group
claims that they are indeed distinct from each other. The consensus seems however
to be that risk management is about responding to specific identified risks, while
BCM is about responding to unknown risks and events.
Waters (2007) divided the process in BCM into six main steps: initiate the process
of BCM; define the requirements of BCM and develop a strategy to achieve them;
identify the risks and assess their probability and impact; prepare the business
continuity plan; implement the business continuity plan; monitor and control the
business continuity plan.
According to Christopher et al. (2002), the UK government is demanding that BCM
processes are established across all departments and agencies following the terrorist
attacks on the World Trade Center on September 11, 2001. Regulators also place
demands on industry to establish effective risk management, specifically those risks
which cannot be eliminated. There is also an acceptance that many of these risks are
inherent within the supply networks. Accordingly, BCM can be considered as an
effective tool in assisting in the management of these risks.
2.3 Crisis Management
A related field, Crisis Management, is covered by a number of academic authors in
an extensive body of theory and literature (Elliott & Smith, 1993; Hazarika, 1987;
Quarantelli, 1998; Reason, 1997; Smith, 1990).
In the organisational literature, crisis is defined as follows: ‘an organisational crisis is
a low-probability, high-impact event that threatens the viability of the organisation
and is characterised by ambiguity of cause, effect, and means of resolution, as well
as by a belief that decisions must be made swiftly’ (Pearson & Clair, 1998 p.60).

25
The process of crisis management is often seen by some organisations in terms of
the process of business continuity management (Elliott et al., 2002) and, as such,
has a focus on the development of contingency plans to cope with a range of ‘crisis’
scenarios.
According to Smith (2005), the term ‘crisis management’ may itself be problematic
as it could be seen to overemphasise the processes of contingency planning and
business continuity. However, the ‘crisis’ literature can be seen to encompass work
that is concerned with the prevention of crises as well as with the contingency
responses that organisations can make to the threat of such risks. Thus, a definition
of crisis depends on the context in which it is being used and the researcher’s
discipline (Preble, 1997).
Fink (1986, p.15) suggests that planning to avoid a crisis ‘… is the art of removing
much of the risk and uncertainty to allow you to achieve more control over your
own destiny’. According to Fink (1986, p.20-28), a crisis consists of four stages: (1)
Prodromal [forerunning] crisis stage – the early warning stage when the organisation
gets a first glimpse of the potential of the crisis to come; (2) Acute crisis stage –
begins once the damage has begun; (3) Chronic crisis stage – begins when the
organisation tries to recover from the crisis, identify its vulnerabilities and learn
from the failures and success of its response; and (4) Crisis resolution stage – begins
when the organisation comes back to normality and resumes full functionality.
Effective crisis planning aims at identifying the early warning signals for the crisis,
even if occasionally the prodrome may be oblique and much harder to recognise, or
is evident but no action is taken (Paraskevas, 2006).
2.4 Risk and Supply Chain Management
2.4.1 Supply Chain Management
It is clearly stated that logistics management is a part of supply chain management
(SCM) from a definition of logistics modified by the Council of Logistics
Management (1998) ‘Logistics is that part of the supply chain process that plans,
implements, and controls the efficient, effective flow and storage of goods, services,
and related information from the point of origin to the point of consumption in
order to meet customers’ requirements.’

26
The concept of supply chain management has been increasingly discussed among
logistics practitioners and researchers since the mid-1980s (e.g. Houlihan, 1985;
Jones & Riley, 1985) and lately companies have also started to work according to its
principles. The term SCM first appeared in 1982, according to a literature review by
Cooper et al. (1997). Since the early 1990s, SCM has been distinguished in academic
studies from logistics management as focus has shifted from inventory reduction in
the single firm to total network and inter-firm optimisation. Throughout the
research literature there are two distinctive views on defining SCM. The first view
extends the definition of traditional logistics management beyond single enterprise
boundaries and the original focus on material movement. This view on SCM, found
in many early logistics management textbooks, emphasises that ‘operational
effectiveness’ is the key to competitive advantage (Bowersox et al., 1996).
Swaminathan et al. (1996) defined SCM as managing ‘a network of autonomous or
semi-autonomous business entities collectively responsible for procurement,
manufacturing and distribution activities associated with one or more families of
related products.’
On the other hand, the second view on defining SCM is from the wider perspective
of integrated business processes and strategic management of the complete set of
activities and organisations and their links, such as communication. This view of
SCM was suggested by Porter (1985), in which linking different functions could
create ‘value’. In his view, value is added by improving information and control,
coordinating related activities, and optimising total costs across multiple activities to
reduce enterprise transaction costs rather than sub-optimising logistics or other
functions. In line with Porter, Cooper et al. (1998) note that ‘for companies to
survive and prosper, they will need to operate their supply chains as extended
enterprises with relationships which embrace business processes, from material
extraction to consumption.’
Reinforcing this definition of SCM, Greis et al. (1997) defined SCM as ‘an
integrated group of strategically aligned organisations in the supply chain, focused
on specific market opportunities. This idea of extended enterprise is based on
mutual benefit which requires co-operation and collaboration among partners.’

27
This evolution in the definition of SCM has two primary drivers, according to
Cooper et al. (1997): First is the shift toward process-oriented business
management in place of the functional view of the organisation. Second, as
mentioned earlier, is the significant difference in the perception of SCM as having a
broader management scope than only logistics.
The second view of SCM definition carries more weight on strategic management
and marketing perspective than the first view, which makes it widely accepted
among researchers. According to Christopher (1992), a key characteristic of supply
chain management is the coordination of activities between these interdependent
organisations. He defines SCM from the above perspective as ‘the management of
upstream and downstream relationships with suppliers and customers in order to
create enhanced value in the final market place at less cost to the supply chain as a
whole.’ Giunipero et al. (1996) defined SCM thus: ‘in its broadest contest SCM is a
strategic management tool used to enhance overall customer satisfaction that is
intended to improve a firm’s competitiveness and profitability.’ By the same token,
Mentzer et al. (2001) defined SCM as ‘the systemic, strategic coordination of the
traditional business functions and the tactics across these business functions within
the supply chain, for the purpose of improving the long-term performance of the
individual companies and the supply chain as a whole.’
Given the definitions above, for the purposes of this research, the definition of
Supply Chain Management by Tang (2005) is as follows: ‘Supply chain management
is the management of material, information and financial flows through a network
of organisations (i.e. suppliers, manufacturers, logistics providers, wholesalers,
distributors, retailers) that aims to produce and deliver products or services for the
consumers. It includes the coordination and collaboration of processes and
activities across different functions such as marketing, sales, production, product
design, procurement, logistics, finance, and information technology within the
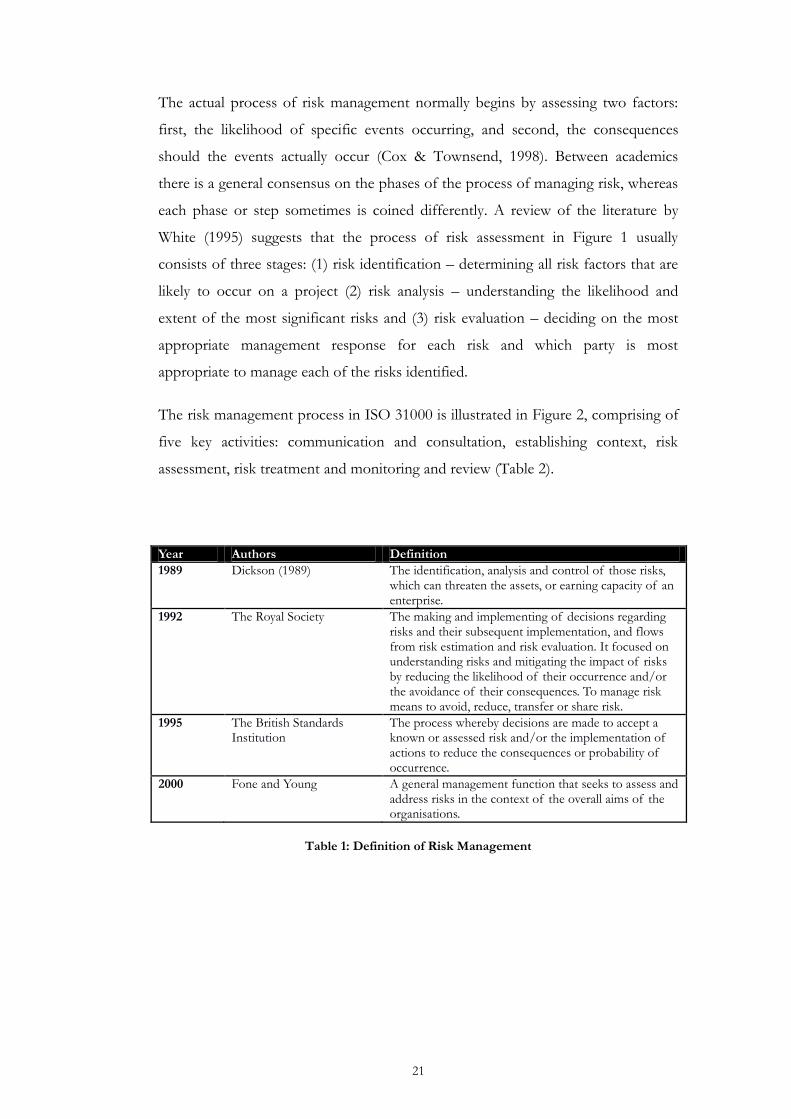
network of organisations’ (Tang, 2005). Figure 3shows the overall picture of supply
chain flows.
28
Figure 3: Supply Chain Management
According to Lambert and Cooper (2000) and Mentzer et al. (2001), a key
component for Supply Chain Management is to share both risks and rewards
between members of the supply chain.
2.4.2 Supply Chain Risk
Risky events intrinsically make the global supply chain and logistic network
vulnerable. In the 1980s, the risk was said to be created by the inter-connected
material flows, information and funds in the network of firms (Kraljic, 1983;
Treleven, 1988). It was recently that the phenomenon triggered interest from many
scholars and practitioners. An increasing amount of literature (e.g., Ritter, Barrett &
Wilson, 2007; Sheffi, 2005; Zsidisin & Ritchie, 2009) provides case studies relating
to the events that caused disruption of supply chain, logistics networks, and
transportation and operations. Also, many publications propose best practices and
risk management concepts that could help a company create more robust supply
chains, logistics networks, and transportation operations.
There are two major factors underlying these increasing interests in the topic. First,
the risk of unexpected adverse events with which firms must cope is increasing in
terms of frequency, intensity and diversity (Coleman, 2006; Helferich & Cook,
2002). The potential for supply chain disruption as well as its magnitude has
increased (Elkins et al., 2005) as shown in the crises and disasters which happened

29
in the past ten years such as the terrorist attack on the World Trade Center in 2001,
Hurricane Katrina in 2005, the swine flu pandemic in 2009, and the earthquake and
tsunami in Japan in 2011. These disasters reveal that many supply chain networks
have a low level of preparedness and therefore force logistics managers to
reconsider their supply chain security and risk management processes.
Second, the business model of modern supply chains, logistics networks, and
transportation operations can increase the impact from unexpected adverse events
to companies. For example, the logistic service provider industry has changed
remarkably over the past 15 years. Increasing competition, globalisation of markets,
and expansion of international trade have put more pressure on individual
companies to increase collaboration with their supply chain partners. This makes
supply chains more complex and also increases the level of dependency between
supply chain entities. As a result, it increases the level of threat in supply chains to
adverse events that could happen to any entity in supply chains (Kleindorfer & van
Wassenhove, 2004; Sarathy, 2006). This idea is supported by literature in
organisational science which states that companies have a greater tendency to be
affected by accidents and disruptions because of their complex, tightly coupled, and
technology-oriented processes (Lin et al., 2006).
Supply chain risk is predominantly used in both the literature on supply disruption
as well as general concepts of various events, situations, potential threats, or
uncertainties. Authors from different areas use the term risk to refer to different
issues when addressing different audiences. Wagner and Bode (2009) commented
that there is no right or wrong definition; there is just a more or less appropriate
definition for each specific situation. The definition of risk can generally be
interpreted in two ways: (1) risk as both danger and opportunity, and (2) risk as
danger only (Mitchell, 1995).
The first notion sees risk as variability around the mean of a measure (Arrow, 1965).
Therefore, there is both downside and upside potential.
In contrast, the second notion only perceives the downside potential of risk. The
definitions of risk in most dictionaries will also see risk as having only negative
consequences. In addition, many empirical studies find that this notion is more

30
consistent with perception as the majority of people tend to perceive solely the
negative potential of risk (March & Shapira, 1987).
These two general views on risk have been discussed and applied when authors
defined the term ‘supply chain risk’. While Juttner, Peck and Christopher (2003)
defined supply chain risk following the first notion of definition of risk, Harland,
Brenchley and Walker (2003) defined supply chain risk as associated with the
chance of undesired consequence such as danger, damage, injury and loss.
According to the literature in the area, perceiving risk as purely negative is most
suitable to the business reality. The consequences can be either indirect or direct,
and can provide major or minor performance objectives (Bode et al., 2007).
Despite the lack of a generally accepted definition of risks in the supply chain (Baird
& Thomas, 1990, p.26), March and Shapira (1987) put forward that risk is defined
as ‘variation in the distribution of possible outcomes, their likelihoods and their
subjective values’. In the supply chain, the primary driver of risk centres on the
disruption of the flow of information, materials, products and capital. These flows
are interdependent and by definition extend beyond the boundaries of a single firm.
To be effective, any approach to risk management in the supply chain must take
into consideration the performance of these key management processes in a
network of organisational entities. This approach acknowledges that objectives may
not be aligned and therefore risk management should incorporate persuasion,
negotiation and bargaining and reflect the mutual dependencies within and between
organisational entities.
Supply chain risk is the probability of incurring a loss within a supply chain that is
related to the logistics activities in companies’ flow of material and information
(Ritchie & Brindley, 2007). Likewise, Zsidisin (2005) defined supply chain risk as
the potential occurrence of an accident or failure to seize opportunities with
inbound supply in which the outcome results in a financial loss for the firm.
2.4.3 Type of Supply Chain Risk
Many frameworks for supply chain risk are found in the literature. According to
Tang and Tomlin (2007), supply chain risks are categorised into six types: supply
risks, process risks, demand risks, intellectual property risks, behavioural risks and
political/social risks. Chopra and Sodhi (2004) extend this to nine categories of risk:

31
delays, systems, forecast, intellectual property, procurement, receivables, inventory,
capacity and disruptions. Cousins et al. (2004) have a simpler model, suggesting that
companies are exposed to two main types of supply chain: ‘technological risk’ –
over-reliance on a single or limited source of a product, process or technology; and
‘strategic risk’ – over-reliance on a single or limited number of suppliers.
Other suggested categories of risk included environmental, demand and supply,
process and control risks (Mason-Jones & Towill, 1998), and supply market,
supplier, regulatory and supply strategy risks (Minahan, 2005). Johnson (2001)
divides supply chain risks into supply risks (e.g. capacity limitations, currency
fluctuations and supply disruptions) and demand risks (e.g. seasonal imbalance,
volatility of fads, new products). Merna and Smith (1999) also give an extensive list
of supply chain risks, which are strategic, natural, political, economic, physical,
supply, market, transport, products, operations, financial, information, organisation,
management, planning, human, technical, criminal, safety, environment and local
permits.
Christopher et al. (2002) classified risks in supply chains into two different types:
supply chain risks and external risks. ‘Supply chain risks’ arise from interaction
between organisations along the chain. Such supply chain risks result from a lack of
visibility, lack of ownership, chaos, just-in-time practice and inaccurate forecasting.
On the other hand, ‘external risks’ arise from environmental uncertainties. Such
risks include disruptions caused by strikes, terrorism and natural catastrophes. Thus,
external risks are ‘risks to the various links in the supply chains’ (Souter, 2000).
Although both have independent sources, simultaneous occurrence of both risks
and the interactions between them intensifies damage to the supply chain.
Mason-Jones and Towill (1998) refine this model by describing the three categories:
(1) Internal risks are inherent or arise directly from management decisions, or arise
from operations within the organisation such as delays and breakdown; (2) Supply
chain risks that arise from the interactions between members of the supply chain,
external to the organisation, but within the supply chain, such as risk from suppliers
or consumers; (3) Risks external to the supply chain that arise from interactions
with its environment such as natural disaster, legislation pressure groups, wars, etc.

32
Waters (2007) stated that internal risks are generally less dramatic: ‘Internal risks are
the risks to operations that managers can control while the external risks are outside
manager control. So managers cannot change the risk, but they can design
operations that work as efficiently as possible within a risky environment.’
2.4.4 Supply Chain Risk Sources
The sources of supply chain risks are many, as different links of a supply chain are
exposed to different types of risk. Faisal et al. (2006) pointed out that in ‘a quest to
become more agile and lean, organisations are becoming more dependent on
outside support which also adds to the overall risk vulnerability.’
A study conducted by Cranfield University for the UK government (2002) defined
supply chain vulnerability as ‘an exposure to serious disturbance, arising from risks
within the supply chain as well as from risks external to the supply chain.’
According to Christopher (1992), a number of factors that contribute to supply
chain vulnerability are due to a focus on efficiency rather than effectiveness, the
globalisation of supply chains, focussed factories and centralised distribution, the
trend toward outsourcing, reduction in the supplier base, volatility of demand, lack
of transparency and control procedures. Supply chains must adapt to these forces to
stay competitive but at the same time increase their exposure to different forms of
risk (Sodhi & Tang, 2009).
This is also supported by Hallikas et al. (2002) and Handfield and Nichols (1999),
who state that we are living in an era of rapid change in product markets and
technologies, and increasing customer expectations in terms of better products,
quicker response time and lower prices.
The nature of supply chain disruption is diverse because it can occur from both
inside or outside a supply chain, and its magnitude, attributes, and effect can vary
greatly. Many scholars have tried to classify supply chain disruption in the form of
taxonomies/typologies with the objective to distinguish between supply chain
disruptions from other types of undesirable events in business (e.g., Calvinato,
2004; Chopra & Sodhi, 2004; Christopher & Peck, 2004; Norrman & Lindroth,
2004; Svensson, 2000). The categories of supply chain disruption are also called
supply chain risk sources, as they are known sources and probabilities of supply

33
chain disruptions. Since different risk sources need different risk management
activities, understanding the categories and nature of supply chain disruption is
essential.
There are many classifications of supply chain disruptions proposed by different
authors. For example, Svensson (2000) classified supply chain risk sources as
quantitative and qualitative, Juttner (2005) proposed three types – supply, demand,
and environmental, whereas Manuj and Mentzer (2008) delineated eight types –
supply, operational, demand, security, macro, policy, competitive, and resource.
Wagner and Bode (2009) reviewed other authors’ classifications and summarised
that supply chain risk sources have five categories: demand side; supply side;
regulatory, legal, and bureaucratic; infrastructure; and catastrophic. This
classification is generated from an empirical study of industrial firms and logistics
services across Austria, Switzerland, and Germany (Wagner & Bode, 2010) The first
two sources focus on risk sources that are internal to supply chain while the later
three are risk sources that can also be external to supply chain. Various sources of
supply chain risk are examined as follows:
Demand Side Risk
Downstream supply chain operations can cause supply chain disruption. This
includes disruptions in product distribution to the end-customer caused, for
example, by the strike of truck drivers (McKinnon, 2006), as well as the uncertainty
of customer demand due to poor co-ordination in the supply chain and mismatch
between a firm’s projection and actual demands of customers. Demand side risk
can create obsolescence of stock, shortage, and poor customer service due to
unavailable product. Although addressing demand side risk is said to be an essential
discipline of supply chain management, it is still present as a major risk source for
many companies. In 2001, for example, the lack of communication among
downstream supply chain partners forced Cisco Systems, which is a global
manufacturer of communications equipment, to write off GBP 1.5 Billion in
inventory (Spekman & Davis, 2004).

34
Supply Side Risk
A company should manage the risk of their supplier portfolio in order to minimise
the risk from disruptions caused by supply side (Kraljic, 1983) especially when a
company strongly relies on external sources for critical materials. The upstream side
of a firm’s supply chain can be a major source of supply chain disruption. These
disruptions can be caused by suppliers, supplier relationships and networks, and
purchasing activities. Additionally, such risks include production capacity
constraints on the supply market, supplier business risks, change in technology and
product design, and quality problems (Zsidisin, Panelli & Upton, 2000).
Supplier business risks are related to the discontinuity of suppliers that could cause
the interruption or termination of the buyer–supplier relationship such as suppliers’
financial problems, bankruptcy, insolvency, or consequences of supplier default
(Wagner, Bode & Koziol, 2009). Suppliers’ financial default or a supplier going out
of business can cause serious problems to a buying firm such as in the case of Land
Rover whose only supplier of chassis frames for its Discovery model, UPF
Thompson, unexpectedly went bankrupt in 2001. It cost Land Rover GBP 35
Million to resume production (Lester, 2002). This type of disruption can also occur
when the supplier is vertically integrated with a customer firm’s competitors; the
relationship may be automatically forced to be terminated (Chopra & Sodhi, 2004).
In addition, when the switching cost for the buying company is high, the
opportunistic behaviour of suppliers can be a source of supply side risk (Wagner &
Johnson, 2004; Spekman & Davis, 2004). Finally, poor quality products or services
of suppliers can also trigger a domino effect on goods or services delivered to the
end customer (Zsidisin et al., 2000).
Regulatory, Legal, and Bureaucratic Risk
The regulatory, legal and bureaucratic risk is the legal enforceability and execution
of laws, regulations, or policies that have an impact on the supply chain. The
frequency and degree of changes in these rules can be the source of supply chain
risk because a sudden change in these rules may lead to the violations of laws, or
regulations.

35
Although little attention has been paid to supply chain risk from regulatory and
legal issue, in many countries these factors have significant effect in setting up and
operating supply chains. Hendricks and Singhal (2003) pointed out that the actions
of authorities can create severe supply chain disruptions because it can affect the
firm’s ability to obtain permission to set up or operate a supply chain, as well as
trade barriers such as embargoes, tariffs, local content constraints, or import/export
quotas. Wagner and Bode (2008) conducted interviews and found that the major
risk for inbound logistics in Russia is customs clearance. This is due to changing
requirements regarding shipping documentation, possible time loss, standstill fees,
as well as the unpredictable behaviour of customs authorities in Russia. As a result,
many importing companies are forced to avoid the problem by using expensive
customs brokers to assist the clearance process. Firms are facing more complex
supply chains due to environmental legislation in many other countries, leading to
an increase in supply chain costs.
Infrastructure Risk
Infrastructure risk refers to the risk occurring from a firm’s infrastructure
underlying its supply chain operations. This includes accidents caused by both
human issue and technical problems related to the area of supply chain security
such as machine breakdowns, equipment malfunction, disruption of electricity or
water supply, labour strike, and vandalism (Chopra & Sodhi, 2004; Lee & Wolfe,
2003; Spekman & Davis, 2004). Firms have become increasingly dependent on
information technology (IT) as well; therefore, IT-related problems can significantly
affect supply chain management. These problems include hardware failures or
software bugs, as well as problems created by human actions such as malicious
software, or cyber-attacks. In addition, the Enterprise Resource Planning (ERP)
systems, which allow a company’s suppliers and customers to have direct access to
databases and internal processes, can increase the chance of IT-related threats.
Catastrophic Risk
These events include natural disasters, epidemics, terrorist attacks, civil unrest, and
socio-political instability (Kleindorfer & Saad, 2005; Martha & Subbakrishna, 2002;
Swaminathan, 2003). Natural disasters such as tsunamis, earthquakes, hurricanes,
and floods can be a severe threat to transportation systems and production facilities.

36
Due to the globalisation of markets and global-spanning of supply chain operations,
local disasters have an increasingly indirect global consequence. Since 2001, there
had been growing interest in the destructive impact from terrorism on companies’
supply chains (Rice & Tenney, 2007; Sheffi, 2011) because it affects supply chains
either directly in causing damage to logistics infrastructure as well as indirectly due
to, for example, events such as port closures.
2.4.5 Supply Chain Disruption
The terms supply chain risk and supply chain disruption are generally used
interchangeably. However, the definition of the term supply chain disruption has
not been made explicit in the literature. Terms such as error, accident, hazard,
operational failure, operational crisis, and disturbance have been used in the same
context. Table 3 provides an overview of recent publications discussing supply
chain disruption.
The literature on disaster research has spanned many fields such as marketing,
management, organisational behaviour, psychology, sociology, political science and
engineering (Pearson & Clair, 1998). As a result, the term organisational crisis and
its attributive dimensions have various definitions (Hermann, 1963; Kovoor-Misra,
Clair & Bettenhausen, 2001; Milburn, Schuler & Watman, 1983; Pearson & Clair,
1998). However, most of the definitions have agreed that organisation disruption
consists of (1) an unforeseen triggering event, and (2) a consequential situation
(Bilings, Milburn & Schaalman, 1980; Hermann, 1963; Kovoor-Mistra et al., 2001).
According to this, supply chain disruption is also said to comprise two components:
(1) a triggering event which is an unexpected event that appears in the supply chain
or its environment and causes the consequential situation; (2) a consequential
situation which is the exceptional event that makes a company unable to pursue
their normal business operation (Wagner & Bode, 2009).
What makes a supply chain disruption differ from risk is that a supply chain
disruption is an obvious situation. Supply chain disruption is more closely related to
organisational crisis, which needs immediate attention (Reilly, 1987) because the
impact of the disruption is usually a function of time (Hermann, 1963). It can be
distinguished by uncertainty of its cause, effect, and means of solution (Pearson &
Clair, 1998). More importantly, it should be noted that supply chain disruption is

37
said to occur only if the involved actors identify the situation as unusual. Wagner
and Bode (2009) said that because organisational response is triggered by actors’
perceptions, not by fact, this made the nature of supply chain disruption very
subjective. As a result, it is difficult to distinguish a supply chain disruption’s
beginning and ending.
Authors Research Focus
Applequist, Pekny & Reklaitis (2000)
Develops a metric for evaluating supply chain projects with significant risk. The measure quantifies a risk premium used to measure return and risk on an investment in comparison with other investments.
Johnson (2001) Enumerates lessons learned from manage supply chain risk in the toy industry. Risk mitigation techniques are presented in terms of managing demand and managing supply.
Sheffi (2001) Discusses supply chain investments and re-organisation needed to prepare for terror attacks in terms of the challenges of dealing with the aftermath of a terror attack and managing supply chains with increase uncertainty.
Mitroff & Alpasan (2003) Presents recommendations for proactive preparation if internal attacks.
Rice & Caniato (2003)
Discusses the need for security and resilience in supply-chained ideas to develop more secure and resilient supply chains.
Zsidisin & Ellram (2003)
Considers the influences of inbound supply chain risk and techniques to al within these risks based on the results of a survey.
Cavianato (2004)
Focuses on logistics risk in a supply chain and discusses the broadening definition of risk.
Chopra & Sodhi (2004) Presents a high level categorisation of supply chain risks and their drivers with recommendations to improve risk preparedness.
Sinha, Whitman & Malzhan (2004)
Develops a methodology to mitigate risk in an aerospace supply chain based on a five-step IDEF0 model.
Zsidisin, Ellram, Carter & Cavinato (2004)
Presents findings of an empirical study on how purchasing organisations assess risk.
Hallikas, Karvonen, Pulkkinen, Virolainen & Tuomimen
Discusses a general risk management process for supplier networks.
Kleindorfer & Sadd (2005) Develops a conceptual framework for managing supply chain disruption risk that includes the tasks of specification, assessment, and mitigation.
Peck (2005) Presents a framework for understanding supply chain vulnerability and a discussion if the drivers if vulnerability.
Sheffi & Rice (2005)
Discusses the stages of a disruption and provides high-level recommendations for improving flexibility in the supply chain.
Zsidisin, Melnyk & Ragatz (2005)
Discusses the use of business continuity to manage purchasing and supply risk.
Sodhi (2005) Presents two risk measures (demand-at-risk and inventory-at-risk) and two linear programming models to be used together to manage demand and inventory risk in consumer electronics supply chain.
Tomlin (2006) Develop a supply chain model to investigate mitigation and contingency strategies and recommends when to use them based on firm with a single product and the option of two suppliers: one that is unreliable and the other that is reliable but more expensive.
Craigbead et al. (2007)
Present propositions that supply chain characteristics - density, complexity and node criticality and supply chain mitigation capabilities - recovery and warning affected the severity of supply chain disruption.

38
Authors Research Focus
Sodhi & Tang (2009) Present time-based risk mitigation concept. With this concept could enable companies to reduce impact of supply chain disruption.
Bode & Wagner (2010) Present a framework for understanding the frequency of supply chain disruptions is a function of certain supply chain characteristics.
Table 3: Review of Literature Related to Supply Chain Disruption
Source: Adapted from Craighead et al. (2007)
Craighead et al. (2007) explicitly use the term ‘supply chain disruption’ to refer to
‘unplanned and unanticipated events that disrupt the normal flow of goods within a
supply chain, exposing the firms within the supply chain to operational and
financial risks’, (citing Svensson, 2000; Hendriks & Singhal, 2003; Kelindorfer &
Saad, 2005; Stauffer 2003). Craighead et al. goes on to discuss two risk mitigation
capabilities: (1) recovery capability which is defined as the activities in the supply
chain to restore normal product flow, and (2) warning capability which refers to the
ability of a supply chain participant to detect a pending or realised disruption and
disseminate pertinent information about the event to relevant supply chain partners.
In addition, they state that supply chain design characteristics such as density,
complexity and node criticality can be expected to be positively related to supply
chain disruption severity.
2.4.6 Supply Chain Vulnerability
The type of supply chain disruption and its magnitude alone are not the only
determinants of the harm caused by supply chain disruption. The outcome of the
disruption is also determined by the response capacity, and the susceptibility of
supply chains is also significantly relevant to the harm and loss caused by supply
chain disruptions.
Despite attempts to define and offer approaches to manage supply chain
vulnerability, the concept is still considered to be unclear and insufficiently
understood (Juttner et al., 2003; Peck, 2005). Christopher and Peck (2004) defined
the term as ‘an exposure to serious disturbance’ (p.3). Bernes and Oloruntoba
(2005) defined vulnerability as ‘a susceptibility or predisposition to … loss because
of existing organisational or functional practice or conditions’ (p.519). Svenson
(2000, 2002) stated that supply chain vulnerability is constructed of atomistic
vulnerability, which is limited to a part of the supply chain such as a single firm, and
holistic vulnerability, which covers the entire supply chain. Wagner and Bode’s

39
(2009) definition of vulnerability is quite similar to Bernes and Oloruntoba’s (2005);
they described vulnerability as ‘a function of certain supply chain characteristics
which make the focal firm sensitive to disruptions’ (p. 15) and explained that it can
be, for example, a firm’s mechanism that moderates the consequences of a supply
chain disruption occurring in a firm. Therefore, supply chain vulnerability can be
seen as the ability of a firm to absorb the supply chain disruption effects. The
factors that could increase the degree and impact of supply chain disruption are
aspects such as dependence on suppliers and clients (Wagner & Bode, 2006), supply
chain complexity, supply chain density, node criticality (Blackhurst,
Rungtusanatham & Handfield, 2007), sloppy management (Turner, 1994), eroded
safety procedures (Reason, 1990), and complex technical systems or organisational
processes (Perrow, 1984).
2.4.7 Supply Chain Risk Management
The concept of supply chain risk management was adapted from general business
risk management concepts (Khan &Burnes, 2007; McCormack, 2008; Ritchie &
Brindley, 2007), which aimed to ‘eliminate, reduce, and generally control pure risks’
(Waring & Glemdon, 1998:p3). The process of general risk management contains
(1) risk identification; (2) risk assessment, which includes analysis of the impact and
probability of the identified risk; (3) risk treatment; and (4) risk monitoring. If the
amount of remaining risk after the risk management process is in line with a firm’s
procedure, the level of risk is considered optimal. When applying this concept to a
supply chain context, the third stage referring to the practice and measure of risk
treatment has to be made specific to the context of supply chain, therefore it can be
considered as supply chain risk management (Tang, 2006).
According to Norrman and Lindroth (2002), ‘supply chain risk management is to
collaborate with partners in a supply chain, applying risk management process tools
to deal with risks and uncertainties caused by, or impacting on, logistics related
activities or resources.’
Christopher (2002), defined supply chain risk management (SCRM) as ‘the
management of supply chain risks through coordination or collaboration among the
supply chain partners so as to ensure profitability and continuity.’ He pointed out
the four objectives of supply chain risk management. First, maintain the supply and

40
continuous availability of product. Second, decrease the supply chain’s ability to
cope with disruptions in the supply of products if necessary. Third, avoid possible
domino effects throughout the chain. Last, make the supply chain more resilient to
disruption.
Management of supply chain risks has over the years seen a myriad of approaches
with different focus. Most approaches can however be grouped into the two broad
categories of relationship management (Puto et al., 1985) and strategic/proactive
purchasing (Smeltzer & Siferd, 1998). These two categories do, to some extent,
overlap.
Puto et al. (1985) and Mitchell (1995) identify supplier relationship development as
an important risk-reducing strategy, which includes loyalty to existing suppliers, the
characteristics of the buying situation and the buyer’s perception of the
procurement problem. In addition, Zsidisin et al. (2000) and Zsidisin (2003) also
support the importance of relationship management by advocating that partnership
formation; strategic alliances and supplier development and performance systems
are all activities that reduce risk.
Approaches Authors
Purchasing partnerships Ellram (1991a, b) Multiple sources of supply VS single sourcing
Treleven and Schweikhart (1988), Kraljic (1983) and Zsidisin (2003)
Supplier quality/ auditing/ certification programmes
Smeltzer and Siferd (1998), Newman et al. (1993) and Zsidisin (2003)
Supplier improvement programmes Smeltzer and Siferd (1998) Closer working relationships with suppliers
Zsidisin et al. (2000), Zsidisin and Ellram (2003) and Eisenhardt (1989)
Communication and early involvement of suppliers in strategic decisions
Krause (1999)
Buffer Newman et al(1993) Strategic alliances Zsidisin et al (2000) Risk sharing/ knowledge transfer Eisenhardt (1989), Zsidisin et al. (2000) and Krause (1999) Focus on core competence Zsidisin et al (2000) Product differentiation Lonsdale (1999) Entrepreneurial/ risk taking March and Shapira (1987) and Lonsdale (1999) Proactive supply management Smeltzer and Siferd (1998) and Kraljic (1983)
Table 4: Risk Management Strategy
Source: Khan &Burnes (2007)
Eisenhardt (1989) as well as Zsidisin and Ellram (2003) argue that agency theory
can be applied to reduce supply chain risks, mostly via co-operation with the aim to
create joint benefits and reduction of conflicts. In that context, improved

41
information sharing, where the aim is to create knowledge, will reduce the risk of
opportunistic behaviour.
The category of strategic/proactive purchasing aims at overseeing the whole supply
chain. This approach is less intimate than the relationship management approach,
but the scope is also much wider. Monitoring and auditing of supply chain partners
and their standards is a key activity in reducing risk, according to Smeltzer and
Siferd (1998) and Newman et al. (1993). Mitchell (1995) and Zsidisin et al. (2000)
advocate the use of multiple sourcing. Contrasting this view, Lonsdale (1999)
favours increasing the variety of products rather than choosing multiple sourcing as
a means of reducing risk.
As described above, there are different categories and approaches to managing
supply chain risk. The field has however not matured, which can be seen in the
broad range of conflicting views. For example, among the most commonly
accepted risk reduction approaches are single sourcing and building long-term
partnerships (Treleven & Schweikhart, 1988). On the other hand, single sourcing
can lead to over-dependence on one supply source and increasing vulnerability to
opportunism (Zsidisin, 2003; Kraljic, 1983). And the same wide range of views is
expressed when it comes to the effectiveness of building long-term relationships.
One group of academics advocate that it does reduce supply chain risk (Zsidisin,
2003; Eisenhardt, 1989; Ellram, 1991a; Ellram, 1991b), whereas another group
argues against this approach (Smeltzer & Siferd, 1998; Pilling & Zhang, 1992;
Lonsdale, 1999).
Mitchell (1995) sees that one explanation for the lack of maturity in the field is that
the very different views of supply chain risk management are by nature situational.
Newman et al. (1993) provide a case in point, which is the use of buffers. In the
short run the use of buffers can be effective in reducing risk but in the long run risk
may increase as it is expensive and creates production inefficiencies as well as
increasing the risk of creating outdate stocks.
General risk management is a discipline that is fairly developed, especially in the
financial field. It is however striking that general risk management literature as well
as the associated tools and techniques have not found their way into how supply

42
chain risk management is being approached (Cousins et al., 2004; Kraljic, 1983;
Robinson et al., 1967; Williamson, 1975; Williamson, 1979).
Further development of theoretical and practical supply chain risk management
appears to be possible, especially if the research agenda focuses on the following
three areas. First, supply chain risk management should take into account the work
that has been done within general risk management and in particular within
financial risk management. Second, supply chain risk management needs to be more
firmly rooted in understanding how companies actually do manage supply chain risk
and why they do it in a chosen way. Third, based on research into the two previous
topics, improved theory and models of supply chain risk management can be
developed.
Supply chain management faces the challenge of balancing risk profile and cost
minimisation. Risk can probably not be completely eliminated but it can in most
cases be reduced significantly. The risks in the supply chains can often be mitigated
if companies can understand the variables having an impact on risk management in
the supply chains. Some of the variables that enable risk mitigation are information
sharing, aligning incentives, risk sharing and corporate social responsibility (Chopra
& Sodhi, 2004; Speckman & Davis, 2004; Faisal et al., 2006).
2.5 Time Based Management and Response
The importance of time as a competitive parameter has over the last two decades
made its way into the literature addressing how to compete effectively. Time based
competition is essentially about compressing time of the important activities of the
firm, i.e. responding to customer needs, introducing new products faster than
competitors, reducing time in the production and delivery process, and by doing so
a significant competitive advantage can be established (Stalk, 1988; Stalk &Hout
1990; Blackburn, 1991).
One of the main reasons for the emergence of time-based competition is that
customers feel increasingly time starved, providing a major opportunity for
companies that can exploit time as a competitive parameter (Tucker, 1991). In his
work Tucker viewed time as a major driving force of change.

43
A number of companies are today categorised by competing on time and the
characteristics are that they employ structurally different methods to manufacturing
and product innovation and development (Stalk, 1988; Stalk & Hout, 1990;
Blackburn, 1991), they think of themselves as part of an integrated system of
suppliers and customers (Stalk & Hout, 1990) and they create more information
that is also shared more openly and rapidly with important stakeholders.
The benefits of successful time-based competition are similar to those of most
other successful competitive strategies, namely increase in productivity, ability to
command a price premium, ability to gain market share, high customer loyalty and
the ability and willingness to cannibalise own products (Stalk, 1988; Stalk, 1990;
Blackburn, 1991; Daniels & Essaides, 1993).
Time-based competition can be seen as a managerial focal point that guides the
decisions and directs the company towards time-sensitive customer segments by
merging principles of traditional strategic schools of thought with flexible and lean
manufacturing principles.
The literature on time-based competition in combination with supply chain
management appears, however, to be very limited and thus provides for a research
agenda that takes this important aspect into account.
There are nevertheless scientific models, such as the epidemic model and fire
model, as well as anecdotal evidence to support a conjecture that the magnitude of
the problem triggered by the event increases exponentially over time.
The simple form of epidemic model is the ‘Exponential Model’ by Thomas Robert
Malthus (1766–1834). This model can be explained as follows:
Let I(t) be the number of people infected at time t. In this case, the rate of infection
can be defined by the differential equation: dI(t)/dt = kI(t), where the parameter
k>0. This differential equation yields: I(t) = I0ekt, where I0 is the number of people
infected at time 0. Therefore, the number of people infected grows exponentially
overtime.
A similar model is a fire model called the ‘Elliptical Fire Spread Model’ presented by
Arora and Boera (2005). They assumed that the area burned is taken to be elliptical

44
in shape with the point of ignition at one of the foci. By assuming that the fire is
spread linearly over time along a two-dimensional space, they show that the total
area burned grows as a squared function of time elapsed since the start of the fire.
Thus, the total area burned grows exponentially over time.
2.6 Existing Theories
2.6.1 Normal Accident Theory
The normal accident theory (NAT) was proposed by Charles Perrow with the
objective of explaining the reason that makes socio-technical system fail based on
the analysis of the US nuclear power plant near-disaster (Perrow, 1984). The theory
suggested that the probability of occurrence and the severity of systems accidents
are determined by two system characteristics:
The first characteristic is ‘interactive complexity of the system’: a supply chain is a
socio-technical system, which Simon (1962) explained is a complex system because
there are many elements interacting in a non-simple way, making it more difficult to
manage and control. According to NAT, complexity becomes dangerous when the
interactions among the components of the system are nonlinear because nonlinear
interaction leads to unpredictable event sequences. Many small failures can interact
and produce unexpected, unfamiliar events.
The second characteristic is ‘tight coupling of the elements in the system’: the
systems, which contain interrelated components that have time-dependent
processes, possible substitutions, and minimal slack or buffer, are tightly coupled
systems (Galbraith, 1973; Perrow, 1984). Although tight coupling systems generally
have higher efficiency and performance standards, loosely coupled supply chains are
able to absorb environmental changes, failures, or unexpected system behaviours.
In tightly coupled systems, a change in one component may trigger a fast and strong
change in other components in a kind of domino effect. Thus disruptions can
spread rapidly through the system.
According to this, a system with high levels of interactive complexity and high
levels of tight coupling is vulnerable to accidents because when the two
characteristics are combined, it becomes impossible to predict and protect the ways

45
in which the system could fail. The accidents are hence inevitable; it can be
concluded that in such systems, accidents are normal.
NAT stated that supply chains with a high degree of interactive complexity and
tight coupling have higher frequency of supply chain disruption. However, some
literature (Hopkins, 1999; Wolf, 2001) argues that the level of tight coupling is
difficult to subject to empirical test.
There is no consensus on the definition of supply chain complexity. There are two
dimensions of supply chain complexity, which are information processing and
technology (Vachon & Klassen, 2002). Choi and Krause (2006) assumed that supply
chain complexity has three drivers: (1) the quantity of suppliers, (2) the diversity
among the suppliers, and (3) the inter-relationships among the suppliers. According
to literature in organisational design, there are three dimensions of complexity:
vertical complexity, horizontal complexity and spatial complexity (Daft, 2006).
These can be applied to the context of supply chain. Vertical complexity can refer
to the number of tiers in the upstream supply chain. Horizontal complexity refers to
the number of suppliers. Spatial complexity can refer to the geographical dispersion
of the supply base (Choi, Dooley & Rungtusanatham, 2001; Choi & Hong, 2002;
Vachon & Klassen, 2002). It can be summarised that these three dimensions
amplify the complexity of supply chain and, therefore, increase the uncertainty and
diminish transparency, which lead to higher exposure to supply chain disruptions
(Choi & Krause, 2006).
2.6.2 High Reliability Theory
Rijpma (2003) pointed out that Perrow’s (1984) NAT can be overly pessimistic in
concluding that accidents are inevitable in systems with interactive complexity and
tight coupling. High reliability theory argues that the likelihood of normal accidents
can be reduced by organisational and structural precautions (Roberts, 1990). The
theory examines the characteristic of organisations that show strong ability in
dealing with unexpected events and concludes that although organisations may have
interactive complexity and tight coupling in the supply chain, they can be successful
if they possess the characteristics of highly reliable organisations.
The empirical test of high reliability theory is not very precise nor consistent. For
example, redundancy was suggested to help organisations buffer the impact of

46
unexpected situations and reduce mistakes (Roberts, 1990). In contrast, redundancy
was also found to backfire in some critical situations (Sagan, 2004). Another
recommendation was that the right training should be able to reduce the impact of
crisis situations. However, other studies argue that training can also diminish
flexibility, which results in an organisation’s lower ability to respond to crisis
situations (Price, 1977).
Therefore, Bode and Wagner (2010) suggested that the focus should be made on
the characteristics that have been repeatedly accepted to enhance reliability such as
decentralised decision making (Roberts, Stout & Halpern, 1994). When the supply
chain is decentralised, the information and decisions regarding the supply chain are
generated closer to the suppliers, making the organisation able to respond to
warning signals and disruptions better (Bode & Wagner, 2010).
2.6.3 Transaction Cost Theory
In essence deals with the basic question of how to organize economic activity:
should activities be based within the hierarchy or should activity outcomes be
obtained through the open market? Coase (1937) explained that transaction costs
are incurred from activities in the open market and in particular related to cost of
searching and finding information, bargaining and decision costs and policing and
enforcement costs. Insights from the transaction cost perspective are suitable for
making decision about governance and understanding motives of other partners.
In this study, the goal is to understand the speed of response in Detection, Design,
and Deployment. Presuming the supply chain transactions cross the firms internal
(divisional, cross functional) and external boundaries (suppliers, customers,
logistics), risks may be present and transaction cost theory suggests that such
differential costs, of whatever nature, could be factored into a model of risk
response.
If, for example, events that lead to catastrophic failure are less visible, that is, take
longer or are more expensive to Detect, then a Transaction Cost theory may suggest
a different organization boundary will be more robust. At a minimum, greater focus
on such external relationships will be beneficial; the classic example of Nokia versus
Ericsson could be studied from this perspective. Both firms outsourced chip
production of common, key component – typical in an environment of rapid

47
change, tremendous specialization and large investment – to Philips Electronics.
Nokia proactively sought information on the status of the Philips factory after a
small but devastating fire; Ericsson relied on the information it was given. Such an
event within either firm, it could be surmised, would be better communicated and
result in a different risk / response pattern.
Other differences, for example in engineering or management culture, internal
versus external to the firm can also have an impact on the Design or Deployment
time in reacting to an event. Transaction Cost theory potentially provides an
additional dimension to time response. In this study, one could consider this
dimension as a starting point for exploratory questions or to assure completeness of
the data, may explicitly identify participants whose role or expertise provide insight
from across the organizational boundaries.
2.6.4 Agency Theory
Agency theory deals with how relationships are organized when it is based on a
principal-agent type of transaction (Eisenhardt; 1989), and enables control and
coordination via highlighting the importance of monitoring and creating incentives
(Child et al., 1998). Especially within knowledge-based economies there is evidence
of a theory related to increasing returns (Arthur; 1989). Arthur’s main point was
that “if technological ecologies are the basic unit of strategy in the knowledge-based
world, players compete by building webs… that amplify positive feedback to the
base technology”.
In economics, the principal-agent problem treats the difficulties that arise under
conditions of incomplete and asymmetric information when a principal hires an
agent. There are two problems arising. The first is the agency problem that occurs
when (a) the desires or goals of the principal and agent conflict and (b) it is difficult
or expensive for the principle to verify what the agent is actually doing. The
problem here is that the principal cannot verify that the agent has behaved
appropriately. The second is the problem of risk sharing that arises when the
principal and agent have different attitudes towards risk. The problem here is that
the principle and the agent may prefer different actions because of the different risk
preferences (Eisenhardt, 1989).

48
Risks in supply chain become more obvious when viewed using agency theory. For
example, the supplier (agent) of a critical component make take a less-robust, cost-
minimizing approach to manufacturing in order to win a procurement contract,
however leaving its customer (principal) disproportionately exposed should a
manufacturing disruption occur. Information sharing between and agent and
principle become a key objective of the principle; this can be extended to consider
the time / risk relationship for supply chain.
Agency theory may also provide additional insight in the management of disruption
in the supply chain. Information asymmetry can distort the perception of risk or
potential consequence of disruption, in particular where asymmetric and non-linear
financial or other impact is faced by participating firms. For example, where a very
large, well-funded firm has outsourced a particular task to a much smaller partner,
collapse of the common supply chain could leave the larger partner liable to greater
litigation and penalties, even if the smaller firm were contractually and in practise
the responsible party. Conflicting incentives on production speed versus quality
may motivate a firm to withhold crucial information if such information is only
revealed – potentially through catastrophic failure – at a much later stage.
Counterfeit aircraft components, for example, have been root cause of several air
disasters, when such components were sold and installed by a subcontractor to the
airline at high profit long before the accident occurs. In this study, agency theory
could potentially provide an additional research guide for understanding the
perception of catastrophic risk and the resulting management systems in terms of
the time-based framework. This additional dimension requires saturation of
concepts, which may be visible at a contractual level between firms, however, rather
than within the management perspective of individual participants, which are the
focus of data collection here. Agency theory could be applied to test, in future
research, to the propositions developed in this study.
2.7 Research Gap
The literature in supply chain risk has proposed a number of different approaches
to the management of supply chain risk (Chopra & Sodhi, 2004; Christopher &
Peck, 2004; Elkins et al., 2005; Lee & Wolfe, 2003; Martha & Subbakrishna, 2002;
Rice & Caniato, 2003). While Kleindorfer and van Wassenhove (2004) propose that
supply chain risk management activities comprise supply-demand coordination

49
activities and activities for managing disruption risks, Tang (2006) proposes that the
management of supply chain risk should focus on four areas: supply management,
demand management, product management, and information management. Wagner
and Bode (2009) propose a different approach to supply chain risk management by
stating that the management should focus on cause-oriented measures (the
prevention or elimination of supply chain disruption) and effect-oriented measures
(the attempt to reduce the impacts from supply chain disruptions when they occur).
Further, certain existing supply chain risk management literature has focused on
prescribing effective recovery plans for reducing the impact of disruption after an
event occurs (Christopher, 2002; Chopra & Sodhi, 2004; Lee, 2004; Sheffi, 2005;
and Tang, 2006). Sodhi and Tang (2008) argue that these strategies can improve
recovery if the firm can deploy their strategies during or soon after the event
occurs.
Literature in other fields of scientific research has documented the role of time as a
surrogate measure of the impact of a disruption, for example in the spread of
disease or forest fire (Richads, 1995; Janssens, 2000; Arora & Boer (2005).
Specifically, the impact of a natural disruption tends to initially increase
exponentially with time and then eventually taper off.
In addition to these natural disruption models, there are hazard analysis reports
related to supply chain management showing that the magnitude of problems
associated with many hazards (fire, terrorism, earthquake, etc.) tend to grow super
linearly over time (Anderson et al., 2002).
The time-based paradigm was first highlighted explicitly in the supply chain
management literature in the late 1980s by Stalk (1988) who noted that traditional
manufacturing focussed on achieving low production cost through the utilisation of
low-cost labour. Attention then shifted to specialisation and exploiting production
competency. Time-based competition emerged as the competitive paradigm during
the 1990s, which mandates a strategy of customer responsiveness and rapid new
product introduction, along with competitive quality and cost. The essence of time-
based competition involves compressing time in every phase of the product
creation and delivery cycle. The claim is made that in today’s business, only time-

50
based firms will be able to meet such customer demands and respond quickly to
changing consumers’ needs (Stalk, 1988; Stalk & Hout 1990; Blackburn, 1991).
As discussed in the literature review, time plays a vital role in logistics and
operations research. There is much existing time-based literature in traditional
production/ operations management research such as time-to-market, just-in-time
manufacturing, product innovation, role time in customer service and satisfaction,
etc. Yet one issue that remains relatively unexplored is time in risk management
perspective – namely, how companies leverage time in managing disruption risk.
Thus, a research gap exists in addressing how time-based risk management can be
used as a strategy to response supply chain disruption by reducing the impact of
disruption risk in the supply chain.
This research therefore is concerned with the external risk that arises from
disruptions to normal activities. It is also known as ‘disruption risk’, which refers to
the major disruptions caused by natural and man-made disasters such as
earthquakes, floods, hurricanes, outbreaks of disease, price rises, strikes, problems
with trading wars, terrorist attacks or economic disruptions, and financial
irregularities such as currency evaluation (Sodhi, 2004; Tang, 2005; Kleindorfer &
Saad, 2005; Waters, 2007).
The business impact associated with disruption risks is harmful, costly and greater
than others. This research argues that supply chain disruptions are unavoidable and,
as a consequence, that all supply chains are inherently risky; accordingly, companies
should seek to respond faster to a disruption in their supply chain.
Sodhi, Son and Tang (2012) have argued that the supply chain risk literature has
understudied response as following:
Definition gap: there is not enough agreement on the nature of supply chain risk.
Process gap: between (1) identification (2) assessment (3) mitigation and (4)
response, there has been proportionally much less attention on response, whether
to operational risks or to disruptions (catastrophic risks)
Methodology gap: empirical research in the OM literature is proportionally less
represented in the literature on supply chain risk

51
Specifically, firms need to identify the factors in the speed of response in order to
prepare and act faster in the management supply chain disruption. In this research,
disruption risk is being the potential of an unplanned, internal or external event of
low probability but high impact that occurs in the supply chain. This unplanned
event creates sudden, sharp, and significant impact on the ability of supply to meet
demand, resulting in major disadvantage or potential loss for the firm.
2.8 Research Question
As introduced in Chapter 1, this research seeks to fill the gaps in the supply chain
risk management by conducting an empirical study to explore how global
companies manage response time to minimise the impact of disruption on the
supply chain. The primary research question is
‘What factors underlie companies response to supply chain disruption?’
Underlying the theory that greater response speed can reduce the impact of
disruption, I presume a model where impact increases hyper linearly over time until
some point where material damage to the firm and its environment has occurred.
This can include among other things the impact on internal human life and
resources, systems and supply chain, and financial loss, also external factors such as
customer defection, reputation, and regulatory and legal action against the firm.
Motivated by Sodhi & Tang (2009), I considered response as detection, design and
deployment.
Therefore, in order to answer the primarily research question, the following aspects
are considered in each case:
How did the company respond to supply chain disruption?
How did the company detect and communicate information about the
disruption and what did the company do to reduce detection time?
How did the company design and select possible solutions to address the
disruption and what did the company do to reduce design time?
How did the company deploy their selected solutions? What did the company
do to reduce the deployment time?

52
2.9 Research Framework
Supply chain disruption can be costly and damaging to the firm. Costs can be
measured in financial metrics such as drop in market capitalisation (Hendricks &
Singhal, 2003a; Kilgore, 2004), but also in terms of lost reputation, deteriorating
competitive position, increased or restrictive regulation, loss of internal capacity and
so forth, with wide-ranging impact across the organisation and its supply chain.
As stated by Perrow (1984) in his widely referenced work on Normal Accident
Theory, accidents become inevitable if a system exhibits: (1) interactive complexity
and (2) tight coupling. Linear interaction leads to a predictable and comprehensible
sequence of events, while non-linear interactions (interactively complexity) lead to
unexpected event sequences. Herbert A. Simon (1962) characterised a complex
system as being ‘made up of a large number of parts that interact in a non-simple
way’. From this perspective, supply chains can be viewed as complex and according
to some theories such as normal accident theory, disruption is inevitable.
Certain characteristics of the supply chain (density, complexity, node interactivity)
are stated in some literature to have a positive correlation with the severity of
supply chain disruption (Craighead et al., 2007). Other definitions of supply chain
complexity in the literature include Choi and Hong (2002), who consider vertical
complexity, horizontal complexity, and spatial complexity in terms of parallel,
sequential span and geographic disperse supply chain stages. Vachon and Klassen
(2002) looked at complexity in terms of information processing and technology.
Choi and Krause (2006) illustrate a different approach focussing primarily on supply
complexity: (1) the number of suppliers, (2) the differentiation among the suppliers,
and (3) the inter-relationship among the suppliers in the supply base.
As stated in earlier in section 2.6.1 and section 2.6.2, the proponents of High
Reliability Theory view Normal Accident Theory as too ‘pessimistic’, and believe
that appropriate design can reduce or even eliminate system and supply chain
failure. They state that redundancy of unreliable components, decentralised
decision-making, ‘culture of reliability’, training, and learning from previous
accidents can reduce or eliminate failure (Rijpma, 2003; Roberts, 1990; Sagan, 2004;
Price, 1977).

53
Bode and Wagner (2010) test the complexity proposition that Craighead et al.
(2007) propose and confirm that the degree of supply chain complexity influences
the occurrence and magnitude of supply chain disruption. They also find that
Normal Accident Theory and High Reliability Theory seem to be meaningful
theories for understanding the causes of supply chain disruption. Faster product
and technology life cycles, increased use of manufacturing, distribution, and
logistics partners, greater customer expectation and regulatory complexity are
resulting in more complex and longer supply network relationships, which make the
supply chain more complex. In addition, due to the globalisation of markets and
supply chain operations, local events increasingly have indirect global repercussions.
Certain types of risks – of human or natural origin – remain difficult if not
impossible to predict in frequency, magnitude or both; events in Northern Japan
triggered by an offshore earthquake in 2011 provide ample evidence of local impact
on global supply chain operations.
Global supply chains are by nature unavoidably complex and de facto vulnerable to
disruption. In this research I consider an intersection of probability and impact, and
leverage a time-based risk management framework (Sodhi & Tang, 2009) to better
address disruption through faster response.
At a high level, supply chain risk = probability (of an event) x business Impact (or
severity) of the event (Brindley, 2004).
Figure 4: Classification of Disruption Risk
Figure 4 shows a straightforward risk matrix measured on two dimensions – ‘the
impact of risk’ and ‘likelihood of risk occurring’. Probability can be further
High Impact Low Likelihood
D
High Impact High Likelihood
C
Low Impact Low Likelihood
A
Low Impact High Likelihood
B
Impact of Risk
Likelihood of Risk Occurring

54
understood to be low frequency (for example, from the ‘millennium bug’ in
software systems from two-digit date recording in the transition from the year 1999
to 2000) and/or low likelihood (natural events, terrorist attack, failure from obscure
or complex interdependency internal to a system). Impact can be further
understood in terms of high-impact of known magnitude (for example, due to 72
hour closing of US airspace in September 1999) or high-impact of unknown
magnitude (for example, ongoing nuclear crisis in Japan during early 2011).
Most companies develop plans to protect against recurring, low impact risks in their
supply chains. Many, however, all but ignore high-impact, low-likelihood risks. For
instance, a supplier with quality problems represents a common, recurrent
disruption. Without much effort, the customer can demand improvement or find a
substitute. In contrast, in regions where earthquakes are rare, preparedness to
prevent major disruption may be weak or uneven. This research will focus on Box
D – high impact but low likelihood – where risk management must seek to mitigate
the losses due to high-impact events in the supply chain. It is also important to
minimise exposure in general to such events, which is mainly done by designing
appropriate structures and a robust business/operating model. Such high-impact
events of high likelihood (Box C) – the drivers for which can be identified – are
typically addressed in the design of the supply chain. High-impact events with low
likelihood (Box D) or unknown origin – referred to here as catastrophic events that
can cause supply chain disruption – cannot be easily avoided due to their
unpredictable nature and unpredictable locus in the supply chain as well as
potentially prohibitively high cost of detection and avoidance.
This research extends a framework on time-based risk management whose premise
is that faster response to disruption in the supply chain will reduce impact. Figure 5
illustrates the framework along a time dimension to structure the research. This
framework for time-based risk management is developed by Sodhi and Tang (2008).
They state that this approach has been used assessed with ‘anecdotal examples of
companies rather than detailed case studies’. I will extend the approach through
analysis of data from three contemporary events in details in order to study the
importance of time in established risk management processes.
In the 3D framework, elapsed time can be divided into three stages, which Sodhi
and Tang (2008) abbreviate as 3D. The 3D framework divides a company’s

55
response lead-time (R1) into three sequential components – the first component is
‘Detect’ (D1), which is defined as the time between the moment an event has
occurred and the time at which the firm recognises the fact that the event has
occurred. The second component is ‘Design’ (D2), which is defined as the time
between the detection of an event and the time at which a specific recovery plan is
designed. The third component is ‘Deploy’ (D3), which corresponds to the time
between the design of the recovery plan and the time at which the firm has
deployed the solution. After deployment, the time it takes to effectively restore the
supply chain operation is denoted the recovery lead-time (R2).
Figure 5: Time Dimensions in Time-Based Risk Management Framework
Source: Sodhi & Tang (2009)
According to Sodhi and Tang (2008), faster deployment of a recovery plan via
shortening the response lead-time R1 can enable a firm to reduce supply chain risk
significantly. Figure 6 shows the effect when reducing R1; the magnitude of the
problem caused by the disruption is smaller. It is also plausible that the recovery
lead-time (R2) is shortened because the recovery plan is deployed sooner. Thus, the
response lead-time (R1) is essential for managing supply chain disruption.
Various risk management models ascribe increased vulnerability of a supply chain to
its characteristics, such as density or interactivity between supply chain nodes. Sodhi
and Tang (2008) goes further and illustrates interrelationship between risk
mitigation strategies, where one risk mitigation strategy addressing certain risk types
can in fact increase vulnerability to another.
DETECT (D1)
DESIGN (D2)
DEPLOY (D3)
RECOVERY LEAD-TIME
R1 = Response time R2 = Recovery time
An event occurs The firm is aware of the
occurrences Deploy Solutions Supply chain operation
is recovered
The firm has
design one or
more solution(s)

56
Figure 6: The Effect of Reducing Response Lead Time
Source: Sodhi & Tang (2009)
Adapting a complexity model of supply chain risk (Criaghead et al., 2007) and time-
based risk management framework (Sodhi & Tang, 2008), I illustrate an overall
framework for this research. The research conceptual framework is provided in
Figure 7, highlighting elements of analysis in bold. The three elements of response
time in this framework are assumed to drive increased an impact of supply chain
disruption. The goal of the research is to understand how companies view and use
detection time, design time and deploy time in order to respond to supply chain
disruptions. The identification and characterization of the factors underlying the
response time from empirical analysis of the real-life cases are the primary
contribution of this research. These are indicated as F1, F2, F..., Fn in Figure 7 –
The research conceptual framework. Table 5 shows definitions used in this research
to support case analysis.
Impact reduction
Responsible Lead Time reduction
R2 = Recovery Lead Time R1 = D1+D2+D3
Response Lead Time
An Event Occurs
Deployment of a recovery plan
Time

57
Figure 7: The Research Conceptual Framework
Term Definition
Disruption Risk The potential of an unplanned, internal or external event of low probability but high impact that occurs in the supply chain. Such an unplanned event could create sudden, sharp, and significant impact on the ability of supply to meet demand, resulting in major disadvantage or potential loss for the firm.
Supply Chain Disruption Unplanned events that may occur in the supply chain, which might affect the normal or expected flow of materials and components (Adapted from Svensson, 2000; Hendricks & Singhal, 2003; Kleindorfer & Saad, 2005; Craighead et al., 2007).
Response Lead Time The elapsed time between detection of an event and substantial implementation of an appropriate response (Sodhi & Tang, 2009).
Detection Time Elapsed time between the occurrence of an event and the moment a firm recognises the occurrence of – or the initial impact of – the event (Sodhi & Tang, 2009).
Design Time Duration between detection of an event and definition of possible solutions, based on existing concepts and methods or new solutions, which can restore normal supply chain operations (Adapted from Sodhi & Tang, 2009).
Deploy Time Duration between start and completed implementation of a selected solution that is successful in significantly restoring supply chain operations (Sodhi & Tang, 2009).
Supply chain characteristics
Strategic and operational structure of the supply chain, including strategies for efficiency and speed as well as strategies for risk management. (Craighead et al., 2007; Bode & Wagner, 2010).
Recovery time Total duration between an event and the return of the supply chain to normal and planned flow of products (Sodhi & Tang, 2009).
Recovery capabilities Recovery capability or the interactions of supply chain entities and the corresponding coordination of supply chain resources to return the supply chain to a normal and planned level of product flow (Craighead et al., 2007).
Table 5: Definition Used in the Research

58
Chapter 3 Methodology
This study employs classic Grounded Theory methodology (Glaser & Strauss, 1967;
Glaser, 1978, 1992, 1998, 2001, 2003, 2005; Strauss and Corbin, 1990). As a
research strategy, Grounded Theory is well suited for exploration and study of
unstructured natural phenomena through extensive and iterative data collection and
analysis.
3.1 Grounded Theory Methodology
Glaser and Strauss introduced Grounded Theory in their seminal book “The
Discovery of Grounded Theory”, published in 1967. Their approach to qualitative
analysis was developed during an observational field study of nurses and hospital
staff on their work with near-death patients. Strauss and Corbin (1990, p.24) later
provided a succinct definition:
“A qualitative research method that uses a systematised set of procedures to develop and inductively derive Grounded Theory about a phenomenon.”
Strauss & Corbin (1990, p.24)
Creswell (2002, p.439) further defines Grounded Theory as a “systematic,
qualitative process used to generate a theory that explains, at a broad conceptual
level, a process, an action, or interaction above a substantive topic.”
The objective is to develop an account of a phenomenon that identifies the major
constructs - in Grounded Theory terms ‘categories’, their relationships, context and
process, providing a theory of the phenomenon which goes further than just a
descriptive account (Morse & Richards, 2002; Becker, 1993). This allows one to
“organise many ideas from analysis of the data” (Strauss, 1967, p.23). Strauss and
Corbin (1990, p.24) emphasized the need to develop theory “that was faithful to
and illuminated the area under study.”
Theories derived in this approach may also relate to existing theories, and are not
necessarily developed in isolation. This allows Grounded Theory to be used to
extend and explore current understanding of the phenomenon. In this study, a

59
time-based risk management framework provides the context and lens through
which the mechanisms of risk management are to be discovered.
Strauss (1967, p.22-23) summarised Grounded Theory procedures as the systematic
analysis of documents, interview notes, or filed notes by continually coding and
comparing data that produced a “well constructed theory.” Viewed this way, the
theory is inductively derived from the phenomenon under study. The data collected
and analysis are intrinsically linked with the derived theory. Unlike other scientific
methods, in which the researcher collects data to test an existing theory, Grounded
Theory allows the theory to emerge directly from qualitative data. In this sense, the
emergent theory is ‘grounded’ in the data. As Strauss and Corbin (1994, p.274)
noted, “the major difference between this methodology and other approaches to
qualitative research was its emphasis upon theory development,” and not on the
descriptive or narrative aspects of qualitative analysis.
Grounded Theory is structured from three basic elements: concepts, categories and
propositions. Concepts are the most basic component of Grounded Theory.
Theory development is based on these units of analysis, not directly from the
underlying data. In a definition of concepts used by Corbin and Strauss (1990),
these are “words that stand for groups or classes of objects, events, and actions that
share some major common property(ies), though the property(ies) can vary
dimensionally.” They emphasize the conceptualization of data:
“Theories can’t be built with actual incidents or activities as observed or reported; that is, from “raw data.” The incidents, events, happenings are taken as, or analysed as, potential indicators or phenomena, which are thereby given conceptual labels. If a respondent says to the researcher, “Each data I spread my activities over the morning, resting between shaving and bathing,” the researcher might label this phenomenon as “pacing.” As the researcher encounters other incidents, and when after comparison to the first, they appear to resemble the same phenomena, then these, too, can be labelled as “pacing,” Only by comparing incidents and naming like phenomena with the same term can the theorist accumulate the basic units for theory.”
Corbin and Strauss (1990, p.7)
Categories – or themes - of related concepts form the second element of Grounded
Theory. Corbin and Strauss (1990) defined categories as a “higher-level concepts
under which analysts group lower-level concepts according to shared properties.
They represent relevant phenomena and enable the analyst to reduce and combine
data.” Thus:

60
“They (categories) are generated through the same analytic process of making comparisons to highlights similarities and differences that is used to produce lower level concepts. Categories are the “cornerstones” of developing theory. They provide the means by which the theory can be integrated. We can show how the grouping of concepts forms categories by continuing with the example presented above. In addition to the concept of “pacing,” the analyst might generate the concepts of “self-medicating,” “resting,” and “watching one’s diet.” While coding, the analyst may note that, although these concepts are different in form, they seem to represent activities directed toward a similar process: keeping an illness under control. They could be grouped under a more abstract heading, the category: “Self Strategies for Controlling Illness”
Corbin and Strauss (1990, p.7)
Propositions make up the third component of Grounded Theory, which serve to
express the relationships between a category and its concepts and between
categories. In the original paper, these where originally referred to as ‘hypotheses’
(Glaser and Strauss, 1967). As Whetten (1989, p.42) pointed out, ‘propositions’
involve conceptual relationships, whereas ‘hypotheses’ suppose quantifiable
relationships. Accordingly, the term propositions is chosen here, given the
conceptual nature of the conceptual relationship which are evident but not be
directly measurable.
Concepts, categories and propositions are developed iteratively, as new data is
incorporated and the emerging theory adapted and refined. Unlike other
methodologies, Grounded Theory does not engage in the linear testing of an
existing theory, in contrast, it is:
“…Inductively derived from the study of the phenomenon it represents. That is, discovered, developed, and provisionally verified through systematic data collection and analysis of data pertaining to that phenomenon. Therefore, data collection, analysis, and theory should stand in reciprocal relationship with each other. One does not begin with a theory, and then prove it. Rather, one begins with an area of study and what is relevant to that area is allowed to emerge.
(Strauss and Corbin, 1990, p.23.)
3.2 Grounded Theory and Qualitative Research
Grounded Theory has its roots in two philosophical schools of thought, namely
logical positivism and pragmatism. Influential until the late 1970’s, positivism is
based on the application of formal logic to underpin an empirical understanding of
the world, where scientific truths are verifiable claims. Pragmatism (from the Greek

61
‘pragma’ meaning ‘act’ or ‘deed’) describes the process in which theory can be
extracted from practise and applied back, resulting in ‘intelligent practice’.
Combining these philosophies, Glaser and Strauss (1967) defined qualitative
research using techniques such as: “Simultaneous data collection and analysis
coding, creating categories for data, comparative analysis of data, theory
development during data collection and analysis, detailed categories, establish
properties for categories, and identify relationships between categories, theoretical
sampling to make research more robust and literature review written after data
analysis instead of drive the research.”
Using this approach, Grounded Theory, according to Strauss and Corbin (1990,
p.19), qualitative research can ‘uncover and understand what lies behind
phenomenon about which little is known’. Their work provided greater
philosophical credibility to qualitative research, in contrast to methodology relying,
for example, on quantitative methods such as statistical sampling. Selecting between
qualitative and quantitative research methods has been stated as one of the most
challenging decisions for researchers in the early stage of their research, with a
simple but logical answer to this suggested by Ellarms (1996): ‘it all depends on the
researcher’s skill and the nature of the research question.’ Grounded Theory is a
general method of analysis that accepts qualitative, quantitative, and hybrid data
collection from surveys, experiments, and case studies (Glaser, 1978).
Since research in logistics and supply chain management is a relatively new
discipline, there are few well-established research templates in the field. Mentzer et
al. (1995) also said ‘there is little to guide logistics research in how to adopt a
rigorous research process that manifests theory development.’ Therefore, they
proposed a logistics research framework within the positivist approach, which
offers a comprehensive perspective on the logistics research process.
The logistics research framework presented by Mentzer and Kahn is a continuous
process that integrates three research stages which are: (1) idea generation to
substantive justification, (2) theory construction to methodology and (3)
methodology to conclusions and future research.

62
Grant (2001) stated that Mentzer’s logistics research framework (1995) ‘is consistent
with the nature of positivist and quantitative enquiry that consists of idea
generation, literature review, hypothesis formulation, data collection and analysis,
and discussion.’ Thus, it is appropriate when descriptive or causal research is
undertaken.
In the period after they created the concept of Grounded Theory, numerous
publications sought to further investigate the underlying philosophical foundation
and procedures used in Grounded Theory (Glaser, 1978, 1992; Glaser and Strauss,
1968; Straus and Corbin, 1990; Wester and Peters, 2004). Strauss joined with
Corbin in the 1990s to support use of predetermined categories in Grounded
Theory and address issues in validity and reliability of theory development.
While Strauss & Glaser (1967) evidently used logical positivism in the development
of Grounded Theory, others argued that the assumptions and methods were more
closely related to hermeneutics (Parker, L.D. and Roffey, B. (1993) and Laws, K.
and McLeod, R. (2004). Hermeneutics is the study and theory of interpretation,
typically applied to areas of social research of written, spoken and non-verbal
communication in religion, literature and law.
Babbie (2001) contrasts hermeneutics in social sciences as “interpreting social life
by mentally taking on the circumstances, views and feelings of the participants”,
describing Grounded Theory simply as “a term used in reference to the creation of
theory based on observation more than education”. Strauss and Corbin (1990)
implicitly acknowledged the hermeneutic and phenomenological foundations of
Grounded Theory when they stated:
“Data collection, analysis and theory stand in reciprocal relationship with one another. One does not begin with a theory, and then prove it. Rather, one begins with an area of study and what is relevant to that area of study is allowed to emerged.”
Strauss and Corbin (1990, p.23)
Table 6 show the sets out the key distinctions between logical positivism,
hermeneutics, and Grounded Theory.
More recently, Charmaz (2006) argued that Grounded Theory should use an
interpretivist approach, referring to her method as the ‘constructivist’ Grounded

63
Theory model. Positivist and interpretive work can co-exist, the former seeking to
understand social relationships, in this case the managerial and operative context of
risk management, the latter seeking to understand the social mechanisms that
underpin tailored approaches to risk understanding and risk management in the
specific cases used for this study. ‘It seeks to describe many perceived realities that
cannot be known a priori because they are time- and context-specific. Thus,
research is actually an emergent process. As perceived realities change, the research
design adapts … the interpretivists conduct research in a natural, changing
environment’ (Hudson et al., 1988). Charmaz’ interpretivist approach allows
Grounded Theory methodology to have greater flexibility, particularly relevant here
when observation of the PHARMA and events are made as the situations evolve.
Positivism Hermeneutics Grounded Theory Defines the world as objects
Resists objectification Accounts for processes that can change the coded ‘meaning’ of observed phenomena.
Objectification seeks explanation
Seeks understanding Seeks understanding based on interrelationships between conditions, meaning and action
Objectification seeks dissection and reduction
Seeks respect for the whole Avoids reductionism b using conditional matrices and transactional systems
Truth is to be found in “agreement” by verification
“Truth” is revealed phenomenological
“Truth” is approximated by the researchers creative engagement with systematic, interactive data collection, analysis and validation process.
“Meaning” is to be found in closed definitions
“Meaning” is to be found through interpretation that allows future layers of interpretation
“Meaning” is found through interpretation that allows future levels and categories of interpretation and “explanation”
Table 6: Positivist, Hermeneutic and Grounded Theory Assumptions
Source: Parker, L.D. & Roffey, B. (1993)
To summarize, Grounded Theory methodology has three major design patterns:
1. Systematic design (Strauss and Corbin, 1998): In systematic design,
propositions are developed through a sequence of data collection, coding,
and the visual representation of categories that group and relate codes. This
enables construction of a specific set of verifiable set propositions from pre-
existing vantage point based on qualitative data.

64
2. Emerging design (Glaser, 1992): In emerging design, the relationship
between categories is emphasized and explored by the researcher, with very
open approach to theory development.
3. Constructivist approach (Charmaz, 1990, 2000, 2006): The constructivist
approach emphasizes the meaning and interpretation of data by the
participants and the researcher, allowing subjective view of events and their
relationships specific to the situations and data sets under study.
3.3 Grounded Theory and Abductive Research
In general, there is a lack of formal discussion on research approaches in logistics
literature. The central approaches in Western research traditions have been those of
deduction and induction (Kirkeby, 1990). The deductive research follows a
conscious direction from a general law to a specific case (Andreewsky and Bourcier,
2000; Taylor et al., 2002).
According to Arlbjorn and Halldorsson (2002), deductive research is suitable for
testing existing theories, not creating new science, whilst the inductive research
approach moves from a specific case or a collection of observation to general law
or from fact to theory. Accordingly, inductive research is generally appropriate in
developing new theories. Figure 8 compares deductive and inductive research
process.
C.S. Pierce introduced the concept of abduction as a method of deriving a theory
from underlying facts and observations (Cunningham, 1998, p.833). Abduction is
often referred to in the literature with the same meaning as ‘reduction’ (Emery and
Emery, 1997). As one of main proponents of Pragmatism, his defining work on
abduction takes a key role in this methodology. Distinct from deduction and
induction, abduction is focussed on the iterative interpretation of data to derive
explanations for the observed facts. Abduction applies derived propositions to the
observed facts ‘tending to make them applicable in any way to other circumstances
than those under which they are observed’ (Peirce, 1955, p.150), in other words, an
inference starting with observed facts and linking logically backward to potential
cause.

65
Figure 8: The Purely Deductive and Inductive Research Process
Sources: Kovacs and Spens (2005)
According to Cunningham (1998, p.833-4), abduction is the appropriate method for
making sense of new (or unfamiliar) situations. Abduction is essential to
development of reasoning, in that ‘all thought would be totally impossible in a
universe in which abduction was not expectable’ Bateson (2002, p.134), in one view.
The differences between induction, deduction, and abduction is classically
illustrated in Table 7 with simple hypothetical example, that of a bag of beans, white
or black, provided by Shank (1998, p.847):
Purely deductive research process
Part
of
the
rese
arc
h
Part
of
the
rese
arc
h
Em
pir
ical
T
heo
reti
cal
Em
pir
ical
Th
eore
tica
l(1) Theoretical framework (from prior literature)
(2) Theoretical conclusions (hypotheses H/propositions P reached through logic)
(3) Final conclusions (corroboration/abandoning theory); acception/discarding H/P
(3) Testing of conclusions
Purely inductive research process
(0) Existing theoretical knowledge from prior research
(2) (Final) theoretical conclusions (framework)
(1) Real-life observations

Deduction
Rule [It is true that] All the beans from this bag are white Case [We know that] These beans are from this bag Result [Certainly, it is true that] These beans are white
Induction
Rule [We know that] These beans are from this bag
Result [We have observed that] These beans are white
Rule [Probably, then] All the beans from this bag are white
Abduction
Result [We have the experience that] The beans are white [but this experience lacks any real meaning for us].
Rule [The claim that] All the beans from this bag are white [is meaningful in this setting].
Case [Therefore, it is both plausible and meaningful to hypothesize that] These beans are from this bag.
Table 7: The Method of Deduction, Induction and Abduction
Source: Shank (1998, p.847)
3.3.1 Abduction within Grounded Theory Approach
Within the Grounded Theory approach, the importance of abduction has been
recognised by Coffey and Atkinson (1996, p.155) stating that ‘abductive reasoning’
lies at the heart of ‘grounded theorising.’ Furthermore, they state that:
“Our important ideas are not ‘in’ the data, and however hard we work, we will not find those ideas simply by scrutinising our data ever more obsessively. We need to work at analysis and theorising, and we need to do the intellectual, imaginative work of ideas in parallel to the other tasks of data management.”
Coffey and Atkinson (1996, p.155)
Thus, abduction is a type of inference that operates bottom up: individual facts are
collected and connected together in order to develop hypotheses. An observed
phenomena is the starting point (Coffey and Atkinson, 1996), which at first pass
suggests the exclusion of formal theory Coffey and Atkinson (1996, p.157) allow for
formal theory in this approach
…We can also recognise that theories usefully can be thought of as heuristic tools. In other words, we use concepts, theories and ideas constructively and creatively…Regularities in data – whether of form or content – must be associated with ideas that go beyond those data themselves.
Coffey and Atkinson (1996, p.157)
As pointed out earlier, much of the logistics research has a positivist approach and
has been criticised for lack of focus on theory development (Stock, 1997; Kovacs
&Spens, 2005). Kovacs and Spens (2005) proposed that an abductive research

67
process (Figure 9) is an appropriate tool to further theory development in business
logistic research. The abductive approach resonates with the fact that significant
advances in science typically follow neither a pattern of pure deduction nor of pure
induction (Kirkeby, 1990; Taylor et al., 2002).
Figure 9: The Abductive Research Process Applied in This Research
Source: Adapted from Dubois and Gadde (2002) and Kovacs and Spens (2005)
The abductive approach leads to new insight about existing phenomena by
examining these from a new perspective. This way of creating knowledge is found
in logistics research that borrows theories from other scientific fields (Arlbjorn and
Halldorsson, 2002; Stock, 1997). In addition, abduction works through interpreting
or re-contextualising individual phenomena within a contextual framework, and
aims to understand something in a new way, from the perspective of a new
conceptual framework (Danermark, 2001; Dubois & Gadde, 2002).
It has been shown that case studies commonly use abductive reasoning (Alvesson &
Skoldberg, 1994; Dubois & Gadde, 2002). Rather than focusing on generalisations
and/or their specific manifestations only, the abductive approach is concerned with
the particularities of specific situations that deviate from the general structure of
such kinds of situations (Danermark, 2001). As such, it helps to determine which
aspects of a situation in the case studies are generalisable and which only pertain to
the specific situation itself.
Following Hudson (1988), this research on how companies respond to supply chain
disruption can be seen in a ‘natural and changing environment’, with events
unfolding during course of the study.
The abductive research process based on the ideas of Dubois and Gadde (2002)
and Kovacs and Spens (2005) is appropriate because it leads to simultaneous data
Theoretical part
Empirical
part
Prior theoretical knowledge- Define problem
Develop conceptual frame of reference
Collect empirical
data
Revise framework
of reference
Analyse empirical
data
Theory suggestion -Develop framework, hypotheses, propositions
–
–
Application of
conclusion

68
collection, theory development and theory-building elements, precisely the
approach taken in this study.
3.3.2 Different Proponents of Grounded Theory Building
Process
Grounded Theory is a research method that operates almost in a reverse fashion
from traditional research. Rather than beginning with a hypothesis, the first step is
data collection, through variety methods. From the collected data, key points are
marked with a series of codes extracted from the text. The codes are grouped into
similar ‘concepts’ in order to make them more workable. From these concepts,
‘categories’ are formed, which are the basis for the creation of a ‘theory’. This
process contradicts the traditional model of research, where the researcher chooses
a theoretical framework, and only then applies this model to the phenomenon to be
studied (Alan, 2003).
Table 8 shows the different between two schools of thought – Strauss and Corbin
(1998) and Glaser (1978) – specifically in data analysis phase.
Strauss and Corbin (1990) Glaser (1978)
Initial coding Open Coding Use of analytic technique
Substantive coding Data dependent
Intermediate phase Axial coding Reduction and clustering of categories (paradigm model)
Continuous with previous phase Comparisons, with focus on data, become more abstract, categories refitted, emerging frameworks.
Final development Selective coding Detailed development of categories, selection of core, integration of categories
Theoretical Refitting and refinement of categories which integrate around emerging core
Theory Detailed and dense process fully described
Parsimony, scope and modifiability
Table 8: Data Analysis: Strauss and Glaser Compared
Source: Heath and Cowley (2004)
The Ground Theory steps outline by different authors is illustrated in. In general
the process of Grounded Theory often starts with researcher decide if a Grounded
Theory is a best addresses to the research problem, identify a process to study and
seek and access to the data. Then conduct theoretical sampling and code data by
using selective coding to develop theory. Once the research has emergent theory
then they have to validate the theory before writing a Grounded Theory research
report.

Technique 1 Technique 2 Technique 3 Technique 4 Technique 5
Strauss and Corbin (1990) Glaser (1978) Odis E. Simmons (2003) Naresh R.Pandit (1996) Randall and Mello (2011) Phase 0: Preparation Phase 0: Preparation Phase 0: Preparation
Minimising preconceptions. No preliminary literature review. General research topic, but no predetermined research ‘problem’
Phase 0: Research design Step 1: Review of technical literature (definition of research question, definition of priori constructs) Step 2: Selecting cases (focuses efforts on theoretical useful cases not random sampling)
Phase 0: Research problem and opening research question
Phase 1: Data collection Collecting data via interviews, observations, videos, documents, drawings, diaries, memoirs, newspapers, biographies, historical documents, autobiographies, and other sources not listed here.
Phase 1: Data collection Collecting data by intensive interviews often combined with participant observation. But, any type of data can be used including quantitative.
Phase 1: Data collection Collecting data by intensive interviews, participant observation or from secondary sources.
Phase 1: Data collection Step 3: Developing rigorous data collection protocol - create case study database, empty multiple data collection methods, qualitative and quantitative data) Step 4: Entering the field – overlap data collection and analysis, flexible and opportunistic data collection methods. Step 5: Data ordering – arraying events chronologically to facilitate easier data analysis.
Phase 1: Data collection initial coding Initial pilot interview is developed and an archival review is conducted
Phase 2: Data analysis ‘Open coding’ – use of analytic technique ‘Axial coding’ – reduction and clustering of categories (paradigm model) Final development stage is ‘Selective coding’ – detailed development of categories, selection of core, integration of categories Theory stage is detailed and dense process fully described
Phase 2: Data analysis ‘Substantive coding’ –data dependent ‘Continuous with previous phase’ – comparison, with focus on data, become more abstract, categories refitted, emerging frameworks ‘Theoretical’ – refitting and refinement of categories with integrate around emerging core Theory stage is parsimony, scope and modifiability
Phase 2: Data analysis Relating data to ideas, the ideas to other ideas. ‘Substantive coding’- Summarising empirical substance ‘Open coding ‘- coding for anything and everything ‘Selective coding’ – occurring when core variable and major dimensions and properties have been discovered ‘Theoretical coding’ – conceptualizing how the substantive codes may relate to each other as ‘hypotheses’ to be integrated into the theory
Phase 2: Data analysis Step 6: Data relating to the first case ‘Open coding’ – develop concepts, categories and properties ‘Axial coding’ – develop connections between a category and its sub-categories ‘Selective coding’ – all forms of coding enhance internal validity Step 7: Theoretical sampling – literal and theoretical replication across case (go to step 2 until theoretical saturation) Step 8: Reaching closure – Theoretical saturation when possible
Phase 2: Initial memos raise codes to tentative categories
Phase 3: Memoing Writing records of analysis
Phase 3: Memoing Memos are theoretical notes about the data and the
Phase 3: Memoing Memos are the theorizing write-up of ideas about codes and their
Phase 3: Literature comparison Step 9: Compare emergent theory with extant literature
Phase 3: Data collection focused coding

70
conceptual connection between relationships. Comparisons with conflicting with frameworks to Technique 1 Technique 2 Technique 3 Technique 4 Technique 5
categories. The memo process runs parallel with the coding and analysis process to capture the research’s emergent ideation of substantive and theoretical codes and categories.
improve construct definitions, and therefore internal validity Comparisons with similar frameworks to improve external validity by establishing the domain to which the study’s finding can be generalised
Phase 4: Theoretical sampling Data collection based on concepts that appear to be relevant to the evolving story line
Phase 4: Theoretical sampling Process of data collection for generating theory whereby the analyst jointly collects, codes, and analyses his data and decides what data to collect next and where to find them in order to develop his theory as it emerges.
Phase 4: Sorting and theoretical outline Conceptual sorting of memos into an outline of the emergent theory, showing relationship between concepts (not data sorting).
Phase 4: Write up your theory Phase 4: Memos refine conceptual categories
Phase 5: Constant comparison Comparing incident with incidents in order to classify data is not difficult to comprehend.
Phase 5: Constant comparison Comparing incidents applicable to each category Integrating categories and their properties Delimiting the theory Writing the theory
Phase 5: Write up your theory Phase 5: Theoretical sampling of hypothesized relationships
Phase 6: Theoretical saturation The point in analysis when all categories are well developed in terms of properties, dimensions, and variations. Further data gathering and analysis add little new to the conceptualization, though variations can always be discovered.
Phase 6: Theoretical saturation The point where no additional data are being found
Phase 6: Sorting memos, Theoretical coding, Adopting categories
Phase 7: Write up your theory Phase 7: Write up your theory Phase 7: Integrating
memos diagram concepts, Saturation
Phase 8: Emerge Theory
Phase 9: Further
theoretical sampling if needed

71
Table 9: Grounded Theory Steps Outlined by Different Authors

72
3.4 Glossary of Grounded Theory
Grounded Theory has evolved over the last 40 years; below is a short glossary of
key terms used for this study shown in Table 10.
Term Definition
Axial coding Process by which categories are related to subcategories at the level of properties and dimensions. This type of coding consists of intense analysis done around one category a time, in terms of the Strauss and Corbin paradigm items (e.g., coding, actions/interactions, and consequences).
Basic social processes (BSP’s)
One type of core category, often best visualized when the category involved multiple concepts linked together in a larger social process – all BSP’s are or involve core variables, but not all core variables are or are part of BSP’s. The primary distinction between the two is that BSP’s are processural – they have two or more clear emergent stages in a temporal sense.
Coding paradigm Analytic tool Strauss and Corbin devised to help integrate structure with process. When using the paradigm one codes for core phenomena, conditions, actions/interactions, and the consequences of those actions/interactions.
Categories Abstract, higher order concepts under which other concepts can be grouped through an underlying shared uniformity. Categories name patterns in the data. They have analytic power because they can be used to explain and predict behaviour in a phenomenon.
Categories Abstract, higher order concepts under which other concepts can be grouped through an underlying, shared uniformity. Categories name patterns in the data. They have analytic power because they can be used to explain and predict behaviour in a phenomenon.
Coding families Sets of interrelated theoretical codes. For example, the “cultural family” includes social norms, social values, social beliefs, and social sentiments.
Conditions Term used in Grounded Theory to refer to context. Sets of events that create the situations, issues, and problems within which a phenomenon is manifest and help explain the behaviour of individuals or groups. Types of conditions include casual, intervening, and contextual conditions.
Conceptual ordering Organisation of data into categories according to their properties and dimensions.
Conditional matrix A diagram used to track or contemplates the various levels of influence on a phenomenon as well as the implications on those levels of the phenomenon.
Constant comparison Investigation of similarities and differences across incidents recorded in the data. A technique used to generate concepts and their properties based on repeated patterns of behaviour. Comparisons are made within and across data sources.
Core category Central category of the phenomenon about which the theory is concerned. May not necessarily be a category originally sought at the beginning of the research study. Explains the majority of the behaviour in a phenomenon.
Dimension Range along which properties of a category vary. Used to provide parameters for the purpose of comparison between categories.
Formal theory Theory that is developed for a conceptual area of inquiry at a high level of generality (scope). Formal theory develops through the generalisation and modification of substantive theory as it is applied to different areas of inquiry.
Process Sequences of evolving action/interaction taking place over time and that are related to changes in structural conditions.
Properties General or specific characteristics or attributes of a category, which allow a category to e defined and given meaning.

73
Term Definition
Selective coding To delimit coding to only those variables that relate to the core variable that has emerged from the study. The analyst links related and subordinate categories to a core category in sufficiently significant way to assist in the formulation of theory.
Structure Social conditional context in which a phenomenon is located. Social structure creates the context for action and interaction, and as such is inexorably linked to process.
Substantive theory Theory that is specific to time and place. May eventually be extended to a formal theory if becomes supported across multiple contexts.
Theoretical memos Written ideas of the researcher concerning codes and their inter-relationships within a phenomenon.
Theoretical sampling Process of data where the analyst collects, codes, and analyses data and decides what data to collect next and where to find them based entirely upon the emergent theory.
Theoretical saturation Point at which no new information appears to emerge during coding and subsequent data collection; i.e., when no new properties, conditions and so on can be attributed to a category.
Theoretical sensitivity Researcher’s knowledge, understanding, and skill, which foster the generation of categories and properties and increase the ability to relate them to emergent theoretical codes.
Table 10: Glossary of Grounded Theory Terms
Source: Mello and Flint (2009)
3.5 Case-Based Research and Grounded Theory
This study uses Grounded Theory methodology with data from three cases. The
benefits and context in which this methodology can be used in combination with
case research are discussed below.
Case-based research has consistently been one of the most powerful research
methods in operations management, particularly in the development of new theory
(Voss et al., 2002). Eisenhardt (1989) also argues that case studies are especially
helpful when building theories or frameworks.
According to Yin (2003) and Mukherjee et al. (2000), exploratory case study is
particularly useful when there is uncertainty in the definition of constructs. Since
the purpose of this research is to describe and learn from current management
practice and applies the case methodology to actual events in business life, case
study was an appropriate way to provide data to Grounded Theory methodology
because ‘a case study is an empirical enquiry that (1) investigates a contemporary
phenomenon within its real life context, especially when (2) the boundaries between
phenomenon and context are not clearly evident’ (Yin, 2003, p.13).

74
This is confirmed as well by Eisenhardt (1989) who argues that using case data to
build Grounded Theory has major strengths as follow:
1. Theory building from case studies is likely to produce novel theory; this is
so because ‘creative insight often arises from juxtaposition of contradictory
or paradoxical evidence’ (Eisenhardt, 1989, p.546). The constant
comparative method of real-world data inevitably reveals conflicts with
dogmatic, rigid thinking, forcing the researcher to review inherent bias and
adapt his thinking (p. 546).
2. The emergent theory ‘is likely to be testable with constructs that can be
readily measured and hypotheses that can be proven false’ (Eisenhardt,
1989, p.547). Due to the close connection between theory and data, it is
more likely that the theory can be tested and expanded by subsequent
studies.
3. The ‘resultant theory is likely to be empirically valid’ (Eisenhardt, 1989,
p.547). Validity is maintained from the start through the constant
comparison of data with emergent theory. ‘This closeness can lead to an
intimate sense of things’ that ‘often produce theory which closely mirrors
reality’ (Eisenhardt, 1989, p.547).
Stuart et al. (2002) also suggest that case studies are an appropriate research
methodology to map the field of supply chain management, as they allow
identification and description of critical variables. Moreover, case studies should not
be seen as a methodology appropriate only to understand the preliminary stages of
theory development but also to provide a means of refutation of, or extension to,
existing concepts because of their observation richness (Stuart et al., 2002).
Case research and Grounded Theory are consistent in a number of dimensions.
Data from these studies are obtained from real-world, natural settings; the emergent
theory is derived from actual managerial practice. The abductive nature of
Grounded Theory methodology allows exploration of ‘how’ concepts are linked,
supporting the development of causal relationships. Lastly, these support
exploration of issues in an area that has not been extensively studied before. As

75
discussed earlier, the role of time in management of catastrophic risk in supply
chain is minimally covered by existing research.
Grounded Theory moves beyond descriptive case research toward development of
theoretic constructs and propositional relationships (Charmaz, 2006). As she points
out, this analytical method supports investigation of social processes and structure.
The effectiveness and efficiency therefore depends on the availability and richness
of data from observing human activity (Charmaz, 2006).
When using Grounded Theory methodology with data derived from case research,
utmost care must be considered to ensure that principle of case study research do
not distort true emergence for the theory generation (Glaser, 1998, pp.40-2). For
example, Yin (1994, p.28) states theory development prior to the collection of any
case study data is an essential step in doing case studies.’ This statement, perfectly
valid for some case study research, contravenes a key principle of Grounded
Theory. Therefore, it is advised that when combining case study and Grounded
Theory, the researcher must clearly specify which methodology is driving the
investigation. Advancement of a supply chain management theoretical structure
requires an aggregate approach based upon inductive techniques. Grounded Theory
provides an inductive method for creating aggregate level theory through in-depth
investigations within and across organisation (Charmaz, 2006; Glaser, 1992; Glaser
& Strauss, 1967).
In addition, supply chain research often involves phenomena with complexity. I
believe that grounded theory approach is an appropriate choice of methodology for
this study because it makes the findings more robust and possibly makes it easier to
detect similarities and differences.
Grounded Theory also emphasises gaining deep insights into social phenomena that
are problematic for the people involved. Though deep immersion in the daily
worlds of supply chain managers and gaining access to their thoughts, feeling and
behaviours as they go and about solving the problems they encounter, researchers
can gain insights into social aspects of supply chain management that other
methodologies are less likely to tap into. Such insights are imperative in furthering
our understanding of supply chain management phenomena and in developing
useful theories (Randall, Wesley and Mello John E., 2006).

76
It is helpful to consider what Grounded Theory is and what it is not (Table 11) What Grounded Theory is … What Grounded Theory is NOT …
Constant comparison & theoretical sampling - Collection of data and analysis go hand-in-
hand - What data to collect next depends on the
theory constructed thus far Study of inter-subjective experience
- More suited to efforts to understand how actors construct meaning out of inter-subjective experience (Suddaby, 2006)
‘Everything is data’
Theory testing with a case study Theory building with ‘raw data’ An excuse to avoid reading up on the extant
literature A study of the actors’ “inner lives” Content analysis through word counts A formulaic approaches to data (or to data
gathering) A descriptive account
Table 11: What Grounded Theory Is and What It Is Not
3.6 Step-by-Step Guide to Grounded Theory in this
Research
Previously I have shown the differing approaches in theory building presented by
several researchers. In this study, I have chosen the process based on Strauss and
Corbin (1990), specifically in the data analysis phase employing an abductive
approach.
All the interpretations of Grounded Theory methodology, the Strauss and Corbin
(1990) approach was chosen for several reasons:
1. The focus of this study is on managerial decision-making. As stated by
Lehmann, the Straussian approach is more effective for studies of
individuals than research involving organisations, political systems, or
technical issues (Lehmann, 2001a, p.9).
2. Strauss permits the notion of initiating the study with a general idea or
framework of concepts in place, e.g. the 3D framework, while Glaser
believes that an ‘empty mind’ should be the starting point to avoid bias and
prejudice which might mask potential concepts and categories.
3. The approach Strauss takes can used structured questioning, leading to a
more focus emergence and development of propositions; Glaser’s approach
presumes that theory should emerge entirely from the study.

77
Differences between the two approaches of Strauss and of Glaser are summarized
below in Table 12.
GLASERIAN STRAUSSIAN Beginning with general wonderment (an empty mind)
Having a general idea of where to begin
Emerging theory, with neutral questions Forcing the theory, with structured questions Development of a conceptual theory Conceptual description (description of
situations) Theoretical sensitivity (the ability to perceive variables and relationships) comes from immersion in the data
Theoretical sensitivity comes from methods and tools
The theory is grounded in the data The theory is interpreted by an observer The credibility of the theory, or verification, is derived from its grounding in the data
The credibility of the theory comes from the rigour of the method
A basic social process should be identified Basic social processes need not be identified The researcher is passive, exhibiting disciplined restraint
The researcher is active
Data reveals the theory Data is structured to reveal the theory Coding is less rigorous, a constant comparison of incident to incident, with neutral questions and categories and properties evolving. Take care not to ‘over-conceptualise’, identify key points.
Coding is more rigorous and defined by technique. The nature of making comparisons varies with the coding technique. Labels are carefully crafted at the time. Codes are derived from ‘micro-analysis, which consists of analysis data word-by-word’.
Two coding phases or types, simple (fracture the data then conceptually group it) and substantive (open or selective, to produce categories and properties)
Three type of coding, open (identifying, naming, categorising and describing phenomena), axial (the process of relating codes to each other) and selective (choosing a core category and relating other categories to that)
Regarded by some as the only ‘true’ Grounded Theory method
Regarded by some as a form of qualitative data analysis (QDA)
Table 12: The Difference between the Glaserian and Straussian Approaches to Grounded Theory
Onion (2006)
Table 13 depicts this Grounded Theory process, emphasizing the constant
comparison process which considers and compares the multiple concepts articulate
by study participants to those concepts derived from theoretical memos, memos
recorded during analysis, documents, and relevant literature and online sources. I
selected three cases for study to seek theoretical similarities and differences in order
to develop the higher order concepts, which explain behaviours and response
(Gephart 2004; Glaser 1978).

78
Four analytic (and not strictly sequential) phases of Grounded Theory building were
identified in this study: research design, data collection, data ordering, data analysis,
literature comparison and write up. Within these phases, ten procedures or steps
were followed. These phases and steps were evaluated against four research quality
criteria: construct validity, internal validity, external validity and reliability.
Briefly, construct validity is enhanced by establishing clearly specified operation
procedures. Internal validity is enhanced by establishing causal relationships
whereby certain conditions are shown to lead to other conditions, as distinguished
from spurious relationships. In this sense, internal validity addresses the credibility
or “truth value” of the study’s findings. External validity requires establishing clearly
the domain to which to study’s findings can be generalised. Here, reference is made
to analytic and not statistical generalisation and requires generalising a particular set
of findings to some broader theory and not broader population. Finally, reliability
requires demonstrating that the operations of a study – such as data collection
procedures – can be – repeated with the same result.

79
Table 13: The Process of Building Grounded Theory in This Study
Description Output
Ph
ase
1
Res
earc
h de
sign
Step 1 Preparation Minimizing preconceptions and preliminary literature review, define general research topic but no predetermined research problem.
General research problem & opening research questions
Step 2 Case selection Selecting the case – theoretical selection, not random sampling.
Case(s)
Ph
ase
2
Dat
a co
llect
ion
and
data
or
deri
ng
Step 3 Develop rigorous data collection protocol
Deviating real-life observation, interview, lecture, seminar, expert group meeting, newspaper, article, internet, mail, field notes or note taking.
Step 4 Entering the field
Overlap data collection and analysis to speeds analysis and reveals helpful adjustments to data collection.
Step 5 Data ordering Arraying events chronologically to facilitate easier data analysis.
Ph
ase
3
Dat
a an
alys
is
Step 6 Analysis data Open coding Axial coding Selective coding Memoing
Analysis data relating to the first case by coding Develop concepts, categories and properties Develop connections between a category and its subcategories Integrate categories to build theoretical framework. All forms of coding enhance internal validity. Theorizing write-up of ideas about codes and their relationships.
Emerging core categories Properties, Sub-categories
Step 7 Theoretical Sampling
Deciding what data to collect next and where to find that data in order to develop the theory as it emerges. Literal and theoretical replication across cases - keep going back to step 2, this process continues until no new properties or dimension are emerging.
Step 8 Constant comparison
Comparing incident with incidents for similarities and differences in order to classify data is not difficult to comprehend.
Step 9 Theoretical Saturation
Reaching closure when further data gathering and analysis add little new to the conceptualization.
Saturated core categories
Step 10 Theoretical sorting memos Theoretical coding
Conceptual sorting of memos into an outline of the emergent theory, showing relationship between concepts. Defining hypotheses or proposition, suggesting new theory in final conclusion
Hypothesis, proposition – Emergent Theory
Ph
ase
4
Lit
erat
ure
com
pari
son
and
wri
te u
p
Step 11 Integrating the literature
Compare emergent theory with extent literature (comparisons with conflicting/similar frameworks).
Step 12 Validation your theory
Checking whether your new theory fit, relevance, workability and modifiability.
Step 13 Write up your theory
Writing research report

80
PHASE 1: Research Design
Step 1 – Preparation
The first step is in designing the research program, defining the overarching
methodology and scope of study. Easterby and Smith define research design as:
“…The overall configuration of a piece of research: what kind of evidence is gathered from where, and how such evidence is interpreted in order to provide good answers to the basic research questions(s).”
Easterby – Smith et al. (1990, p.21)
Definition of the basic research question, as stated in the introduction to this study,
is the first step in Grounded Theory. The scope must be narrow enough to provide
focus and feasibility; the scope must be broad enough to allow flexibility as the
study evolves and support discovery of unanticipated concepts. Existing supply
chain risk management literature, however limited, provides an initial structure and
scope (as per Charmaz, 2006; Glaser, 1992; Glaser 1998). For this perspective, the
literature focuses, but does not constrain, or presuppose, the direction of the
investigation. Here, I am using 3-D time framework developed by Sodhi and Tang
(2008) to focus the research design.
Step 2 – Case Selection
After basic research questions have been generated and the research is scoped and
focused, the second step is in case selection and identification of the starting case.
Cases (the principal units of data in this research) were selected to fulfil
requirements of theoretical sampling:
The process of data collecting for generating theory whereby the analyst jointly collects, codes, and analyses his data and decides what data to collect next and where to find them, in order to develop his theory as it emerges.
Glaser and Strauss (1967, p.45)
Accordingly,
Unlike the sampling done in quantitative investigations, theoretical sampling cannot be planned before embarking on a Grounded Theory study. The specific sampling decisions evolve during the research process itself.
Strauss and Corbin (1990, p.192)

81
Yin (1994) suggested three principles of data collection that can help deal with the
problems of establishing the construct validity and reliability of the case study
evidence. These principles are (1) use of multiple sources of evidence (evidence
from two or more sources, but converging on the same set of facts or findings); (2)
creation a case study database (a formal assembly of evidence distinct from the final
case study report), along the lines of the Straussian approach; and (3) maintain a
chain of evidence in order to increase the reliability of the information in a case
study (explicit links between the questions asked, the data collected, and the
conclusions drawn). Grounded Theory is consistent with these principles.
The context for my investigation is PHARMA’s handling of the H1N1 Influenza
pandemic declared on 11 June 2009, with analysis of first-hand interviews of key
management, company internal documents and publically available news and
additional documentation from key players. The novel Influenza strain, H1N1,
commonly known as swine flu, had fast transmission but unknown mortality at the
outset, resulting in a dramatic spike in demand for PHARMA’s antiviral and related
medicines.
PHASE 2: Data Collection and Data Ordering
Step 3 – Develop Rigorous Data Collection Protocol
In this step, a data collection protocol is developed employing multiple data
collection methods to establish the cases database. In Grounded Theory
methodology, both of qualitative and quantitative data can be used. Data can come
from (1) collecting observations of the area directly from the events under study (2)
accessing public or private records of various types (e.g. news report, survey,
government or organisation document, online sources, etc. (3) interviewing
individuals or participating in group discussion, face to face or remotely (e.g.
telephone, text chat) or asynchronously such as with email (Glaser, 1964 and
Glaser, 2008).
For the PHARMA case, selected as the primary case, data was gathered through
company visits from 2009 to 2010. Triangulation was used to ensure research
reliability by obtaining the same piece of information from different sources: semi-
structured interviews, internal documents, direct observation (McCutcheon and
Meredith, 1993) and media. A semi-structured interview tool was developed to

82
collect data on the three above-mentioned dimensions. No fixed vocabulary was
used to ask questions, assuring that the conversation developed at its own pace
(Sutton and Callahan, 1987). I followed Yin’s (1994) and Eisenhardt’s (1989)
suggestion of executing the case study by conducting interviews, face to face or via
telephone, with key informants from different divisions along the PHARMA supply
chain.
To ensure broad dimensionality in the data as suggested by Glaser and Strauss,
1967; Glaser, 1992, 1978; Charmaz, 2006), I engaged line managers, employees,
supervisors and executives at multiple levels in the supply chain, while also cutting
across functionally by interviewing R&D and manufacturing management
At this step, an initial pilot interview is typically developed, and an archival review is
conducted to ensure the target participants represent a sufficiently rich with the
phenomena under study.
Step 4 – Entering the Field
The step initiating field research include preparation work such as selecting and
appropriate company sites and groups to interview, identifying participants and
obtaining access to key documents, contacting participants and gaining their
consent.
I used the interview protocol as show in Table 14 to conduct semi-structured
telephone interviews with high-level site directors, sending them the planned
interview questions in advance. The first goal of each interview was to understand
their perception on supply chain risk and supply chain disruptions. The questions
also explored their view on whether the company was aware of vulnerabilities in the
supply chain and how they leveraged time in their management of supply chain
disruptions.
I then conducted semi-structured face-to-face interviews with senior supply chain
managers and executives. This used the time-based risk management framework
(Sodhi & Tang, 2009) to understand how PHARMA and its executives viewed and
used time to respond to the H1N1 Influenza pandemic. The interview questions
submitted to the executives are shown also in Table 14.

83
Apart from face-to-face and interview, data was collected from direct observation,
participant-observation (meeting and conference calls) and archival records and
documentation both from internal sources (presentations, reports) and external
sources (internet, news, press released). The data source, data collection methods
and data content of PHARMA are summarised in Table 15.
Aspects Questions
Supply chain design What are general design principles of the global supply chain of the company?
Risk management strategy
What risk mitigation policies and strategies are in place today? o What governance has been established to: o Manage update of disruption catalogue (risk map) o Review contingency plans o Monitor occurrence of disruptions, and finally o Initiate and carry out contingency plans?
How are contingency plans being tested and how often? Can you describe any previous significant disruptions to the supply
chain that the company experienced? What internal disruptions have PHARMA experienced and what
were the lessons learned? Current event How did the company become aware, and in retrospect were there
any warning signs? How does the firm prepare for this type of risk? How is the occurrence of a disruption detected and communicated
to initiate contingency plans? What was the initial impact of the current event? What contingency plans does PHARMA have to manage major
supply chain disruptions for the Hematol product line? Who is responsible for the plan and execution? What changes in the products, supply chain or other approach did
the company consider to respond to the event? What was the role of time in determining the response of the
supply chain disruption? How quickly could the actions enable the company to meet the
supply chain objectives? Time-Based Risk Management
Does company explicitly set time targets or metrics for measuring response speed in handling the pandemic?
What was the role of time in managing the response? Does company think that by shortening detection time, solution
design lead-time and solution deployment time it can reduce supply chain impact or gain greater advantage?
Learning from the event What went well in responding to the event? What could have been done better?
Table 14: Final Interview Protocol

84
PHARMA
Data Source Data Collection Methods Data Content
Key Informants
Semi-structured telephone and face-to-face interviews with: Manufacturing and Supply BCP
lead Division BCP Lead(s) Environment, Health and Safety
Head Process Owner Primary Procurement Manager Manufacturing Strategy
Manager(s) Project Manager(s) Primary Logistics Manager(s) Site Logistics Head(s) Site Production Head(s) Site Head(s) R&D Manufacturing Manager (s)
Telephone Interview Perceived probability and impact of
potentially severe disruption. Preparation and testing of business
continuity plans. Decision making process during a
disruption. Experience from previous supply
chain events. Face to Face Interview Steps taken to organise and initiate
first response. Mechanisms used to accelerate
creation, evaluation and deployment of possible solutions.
Strategies to communicate and coordinate the status of the situation and the organisational response.
Lessons learned and incorporated in risk management strategies after the event with regard to reaction speed.
Archival Records
Presentations by: Chief Executive Officer Value Stream Leader,
Manufacturing and Supply Pandemic Lead
Manufacturing and Supply BCP lead
Manufacturing Strategy Manager(s)
Project Manager(s) Site Logistics Head(s) Global Quality Assurance(s)
Global procurement process and
strategy Risk management process H1N1 Influenza pandemic executive
review
Table 15: Data Sources, Data Collection Methods and Data Contents from PHARMA
Step 5 – Data Ordering
The fifth step involves data ordering. Yin (1989, p.119) suggested to array events
chronologically to facilitate analysis, an obvious dimension for this study on time
response time:
“The arraying of events into a chronology permits the investigator to determine causal events over time, because the basic sequence of a cause and its effect cannot be temporally inverted. However, unlike the more general time-series approaches, the chronology is likely to cover many different types of variables and not to be limited to a single independent or dependent variable”
Yin (1989, p.119)

85
In this study, a timeline was created to visualise the sequence of events and the
response to these events.
PHASE 3: Data Analysis
Step 6 – Initial Data Analysis
Coding and Categorising Data
After data was collected and collated, an initial categorization was made to identify
common concepts. Three sequential types of coding are used in the Straussian
approach to Grounded Theory, namely open coding, axial coding and selective
coding, where the output of one is the input to the next in a non-iterative fashion.
This research process is summarised in Figure 10 with a definition of each step in
the process and how this is implemented in the study.
Open Coding
The first step, open coding, is the initial analysis stage that deals with identification,
naming, labelling, description and categorization of phenomena suggested by the
data. Glaser (1978) coined the term by characterizing the process as ‘running the
data open’, meaning the extraction of categories and properties from the underlying
data. The output of labelling and categorization are concepts, forming the basic
element used in Grounded Theory.
Open coding is implemented by memoing, in which notes are recorded of the
interpretation of the data. Basic questions are asked on key attributes, such as
where, how, who, when. This forms the initial stage of constant comparative
analysis. Specific data is compared with the partial or complete data set, to express
similarities and differences for purposes of categorization and labelling (Glaser,
1992; Glaser Strauss, 1967).

86
Figure 10: Data Analysis Process in This Research
In this step, data is coded in multiple ways (Glaser 1978), from smaller elements –
word-by-word – or larger elements, such as complete narratives. Patterns can
hereby emerge without bias, unrestricted by preconceived ideas and critically,
‘grounding’ the patterns directly in the underlying data.
As the open coding process continues, codes are grouped into categories and
subcategories (Glaser 1992). The categories group codes and concepts with similar
properties. The researcher may begin to identify a major concept that underlies all
observation, and propose this as a core category. A core category encompasses the

87
variations of data across the complete study, and can be used to explain the
behaviour and actions of participants.
Open coding therefore provides the overall theme, core categories and
subcategories in which the coded data can be structured. This is used for further
data collection or ‘theoretical sampling’, which is used to make the structure more
robust. In this study, interview text was labelled and used to guide subsequent data
collection and interviews. Approximately 200 codes were identified through open
coding. Some codes are more descriptive in nature, and in other instances repetitive;
these would be collapsed into a subcategory after additional theoretical sampling.
Table 16 shows an example of developing categories from concepts in this study.
By grouping concepts into categories, the number of elements needed to express
the structure of analysis can be made more manageable. In this case, Box 1
provides an overview of how concepts were integrated into higher-level categories.
For example, various concepts could be identified as supporting the create integrated
response team, whereas other could be identified as supporting the category of establish
frequent communication with supply chain partners.
Category Concepts Preparation Alarm, Delay, Information, Modelling, Monitoring, Notification, Scenario
Planning, Testing, Training, Validation Partnership Agencies, Communication, Competition, Expertise, Government, Industry
Corporation, Partners, Press, Publicity Organisation Communication frequency, Education, Experience, Learning, Roles,
Responsibilities, Structure, Team
Table 16: An Example of Developing Categories
Axial Coding
In the next stage, axial coding is used to structure the categories and sub-categories
along one or more properties and dimensions to make the relationships between
the codes explicit and provider greater coherence to the initial analysis (Strauss and
Corbin (1990, 1998; Strauss, 1987).

88
Box 1: Examples of open coding generated from PHARMA case
“No one organisation or country, or ground, can meet the pandemic challenge alone. All
partners…must work together to put in place a robust and effective global response”.
My initial coding for this excerpt was coordination with international agencies. This excerpt later
recorded as establish frequent communication with supply chain partners. (a code that emerged as a sub-core
category in my emergent theory. In this case, establish frequent communication emerged as a
property of creates integrated response team.
Another excerpt, “We are talking to them about a range of issues, trying to understand exactly
what this new virus is, exactly how the WHO and CDC believe this may develop so we can
response to their need more quickly and efficiently.” Initial coding was coordination with international
agencies; later re-coded as establish frequent communication with supply chain partners.
Another example from data collection in PHARMA and open coding was, “We created an online
electronic database for information sharing. These include risk management plans and our strategic
plan”. Initial coding for this except was Establish online team room for document sharing which also later
re-coded as Create integrated response team.
A further example, “…during the first three months of the pandemic, we were held on a daily basis
meeting with site directors and supply chain managers…” Initial coding was create frequent
communication with site directors; later re-coded as create integrated response team.
Strauss (1987, p.64) sees axial coding as building “a dense texture of relationship
around the ‘axis’ of a category.” This would be typically support identification of a
major category, as the variation in the data and therefore codes can be expressed
along a dimension in axial coding. Creswell states the objective to be sorting,
synthesis and organizing the potentially large amount of data, allowing the codes to
be ‘reassembled’ in new ways. Links between categories and their subcategories and
relationships among them become visible (Strauss and Corbin, 1998). By re-
integrating the concepts which emerged from open coding, axial coding can begin
to provide answers such as ‘who, where, when, why, what impact, etc.’ They
suggested using scientific terms to make the links between categories more visible,
emphasizing causal relationships as part of an overall framework. This has the
following elements: (1) “causal conditions” – the context in which the phenomena
was observed, and events leading up to the phenomena (2) “actions / interactions”
– the way that participants responded to events or reacted to problems and (3)

89
“consequences” – the intentional or unintentional outcome or impact of the actions
taken. Strauss and Corbin document the conditions for (1) with questions such as
“why, where, for what reason, when” etc. (2) Action/interactions are answered by
knowing who and how something was done. Lastly (3) Consequences are
determined by answering questions of ‘what happens or what impact’.
Looking back at their original study in 1967 which looked at how nurses dealt with
near death patients, axial coding showed that the main concept under study was
‘pain’, the causal condition was ‘arthritis’, the ‘action’ was ‘taking drugs’, and the
consequence was ‘pain relief’.
Table 17 illustrates the conditions, actions and consequence of several examples in
this study, showing the link between categories and subcategories and illustrating
how these are related.
For example, A, B, C, D and E are the outcome from the open coding stage, each
dealing with how communication can affect response time after supply chain
disruption. The examples A, B, C, D relate to external communication, therefore
they fall into the core category of ‘partnership’. While E also deals with
communication for same objective, it falls into ‘organisation’ category as an internal
issue.
Selective Coding
In the next stage, output from axial coding is used for selective coding; where the
core categories representing the main phenomena under study are explicitly
identified and other (sub-) categories are placed in relation to create an integrated
theoretical scheme.
The focus is usually on a limited number of categories, which seem to best
encapsulate the major aspects of the phenomena under study. Once the core
category(ies) has been identified, it is used to guide incremental data collection and
further theoretical sampling (Glaser 1978). Similar to open coding, selective coding
uses a process of constant comparison, considering the (dis)-similarities of new data
to existing categories and properties of categories.

90
In contrast, however, to open coding which uses substantive codes (i.e. original data
such as quotes or statements from the participants in their own words and
language), selective coding uses analytical and abstract codes leading to conceptual
labels for categories. (Glaser 1978).
Example(s) A B C D E
Pattern recognition
Coordination Coordination Coordination Coordination Coordination
The phenomenon of interest
Communication Communication Communication Communication Communication
The causal conditions
Need to understand and control external suppliers
Government plays major role in policy and demand
Public and press have a vital role in responding to crisis
Internal agencies need?
Organisation want desire for business
The action strategy
Establish direct line of communication with external suppliers
Proactive contact with governments to anticipate orders and allocate stock proportional to need
Increase frequency of press and public communications
Coordination with international agencies e.g. CDC and WHO
Modify organisation hierarchy to shorten lines of communication
The consequence
Improved speed and reduce risk, reduce deploy response time
Improved understand of order, reduce design and deploy response time
Lower risk, reduce design and deploy response time
Improved understanding of external parties, reduce detection, deploy and deploy response time
Reduced design response time and deploy response time.
The sub-core category
Establish frequent communications with supply chain partners
Establish frequent communications with supply chain partners
Establish frequent communications with supply chain partners
Establish frequent communications with supply chain partners
Shorten lines of communications within the organisation
The core category
Partnership Partnership Partnership Partnership Organisation
Table 17: An Example of Basic Form of Generic Relationship of Axial Coding in This Study
Selecting coding allows filtering and codification of the data, which are likely to be
most relevant to the emerging concepts. Only selective data is needed, for example
specific sections of an interview transcript needed to explore existing codes.
Interview questions and data collection techniques can be continuously refined to
focus on the objective of theoretical saturation of the existing conceptual structure.

91
Memoing
One of the important stages in ascribing meaning to the coding is a technique
referred to as memoing, central to the coding process: ‘the theorising write-up of
ideas about codes and their relationship as they strike the analyst while coding’
(Glaser, 1978, p.83). Glaser emphasized that the memoing process is essential in
Grounded Theory:
“The writing of theoretical memos is the core stage in the process of generating Grounded Theory. If the researcher skip this stage by going directly to sorting or writing up, after coding, she is not doing Grounded Theory”.
Glaser (1978, p.83)
As a theoretical framework begins to emerge in axial coding and reinforced in
selective coding, memos are used to document hypothesized relationships between
concepts, and provide evidence for how these relationships were developed by
Charmaz (2006).
The basic goal of memoing is “to develop ideas with complete conceptual freedom”
(Holton, 2007), without restriction, hence produced throughout the coding process
and development of the ultimate theoretical framework. During process of
comparison and conceptualisation, memos document the theoretical foundation
relating codes to underlying data (Glaser, 1978; Urquhar, 2001). Memos provide
intellectual freedom, flexibility, and enhance creativity in developing the overall
framework. Stated by Holton, they are also a key to further data collection, coding,
and analysis in selective coding (Holton, 2007). Box 3 shows a few examples of
theoretical memos from this study.
Step 7 – Theoretical Sampling
In theoretical sample, the emerging theory is used as a guide on where and how to
collect and coding additional data. Holton (2007) recommends:
The decisions concerning initial collection of data, further collection cannot be planned in advance of the emerging theory. Instead the researcher can only discover where next to collect data by first coding the initial data and then looking for comparison groups by which to saturate the emerging codes and their properties. By identifying emerging gaps in the theory, the researcher will be guided as where and how to collect the next sources of data.
Holton (2007)

92
As categories emerge from data in PHARMA case, I then chose to sample data
from BP Deepwater Horizon and BP Texas Refinery cases, which could strengthen
my emerging theory in defining the properties of the categories, and revalidate the
relationship of core categories and sub-categories derived from initial analysis. The
data sources of these two cases were determined in step 2.
Step 8 – Constant Comparison
Constant comparison is an analytic process of comparing different pieces of data
for similarities and differences against a growing set of abstracted data. This process
is essential for testing emerging concepts but also addressing the risk of bias from
the researchers inherent starting perspective and limitations in conceptualization.
The process evolves from the initial coding of interviews and data, to hypothesizing
a relationship based upon one set of interviews or data from other sources), and
then testing those relationships interpretation of follow-on data collection
(Charmaz, 2006; Glaser and Strauss, 1967).
This emphasizes consistency and relevance of concepts derived from multiple data
sources. Considering the commonality and variance between these three cases (e.g.
global firms but different industries), this is of importance to assure stability of the
emerging theory in further study. Constant comparison also helps enrich the
properties and scope of the emerging categories.
In this study, this process continues from open coding to selective coding. The
initial coding, which I had from the first case - PHARMA, leads to new interviews.
During this process, my conceptual categories are refined. Constant comparison
continued until the core and related categories were sufficiently saturated and
further coding and constant comparison produced no meaningful further concepts.

93
Box 3: Examples of memos
During this study I have written over hundreds memos capturing the conceptual and methodological
development of my theory. These memos ranged in length from a few lines to a page. In early
memos I may record my hypotheses that ‘preparation’ and ‘organisation’ were categories and have
closed relations. While another memo might question if “integrated response team” belong in
partnership or organisation category. Another memo might query if organisation thinks time is
important factor in general and can it lead to the better way in their mitigation plan? The following
offers a few samples of memos written in conjunction with the category, Preparation.
Memo 1: Because of organisation optimisation in PHARMA (‘Agile’ programme), people who were
explicitly named as a role in the pandemic response team are no longer in the same position.
PHARMA resolved this problem afterward by defining a generic role of participation in the response
structure. This was incorporated in revised and updated roles and responsibilities and document in a
RACI diagram.
Memo 2: From an interview with a PHARMA logistic manager, the pandemic event seems to be
more than ever in the public eye and daily reports of pandemic death as headlines across the world.
Memo 3: After re-reading fieldnotes from interviews with a plant manager, PHARMA has put
additional reserves in place. Within a few weeks, they are able to secure all the ingredients, sourcing
globally and immediately ramping up production. This reminds me of the contrast between Nokia
and Ericsson in their response to the event of a fire at a Philips semiconductor factory. Ericsson
decided to let the delay take its course, while the Nokia supply chain manager monitored the
situation closely and immediately implemented contingency plans (securing components used to
make chips for mobile phone from other suppliers) which resulted in more effective response.
Memo 4: The first call that was made by the site director in BP was the first action by BP to
instructor second in command to inform the Washington BP base lobbyist of the event. It is parallel
to PHARMA proactive establish direct communication with government and international agencies
such as WHO in the same topic. It stands in contrast to the public perception that BP was hiding
information in the early days of the Deepwater Horizon Oil Spill disaster.
Step 9 – Theoretical Saturation
After the repeated visit and interviews at PHARMA, the marginal improvement to
the theoretical framework was small. As found Martin and Turner (1986, p.149),
they said, “by the time three of four sets of data have been analysed, the majority of
useful concepts will have been discovered”.

94
Step 10 – Theoretical Sorting Memos and Theoretical Coding
Theoretical Sorting Memos
Theoretical sorting of memos is a key to formulating the theory for presentation or
writing (Glaser, 1992). Glaser said it starts to put the data previously analysed
during open coding into a theoretical framework. During the sorting process
connections are made between categories and properties. For example, memos
concerning condition affecting the phenomenon can be sorted together to help
bring to surface similarity in incidents (or consequences) based on comparable
condition.
Theoretical Coding
Theoretical coding occurs when core categories have become saturated. Theoretical
codes conceptualised the interrelation of substantive codes by generating
hypotheses to be integrated into theory. Theoretical coded emerged from open
coding and theoretical memos. The results
Theoretical sorting of memos is a key to formulating the theory for presentation or
writing (Glaser, 1992). Glaser said it starts to put the data previously analysed
during open coding into a theoretical framework. During the sorting process
connections are made between categories and properties. For example, memos
concerning condition affecting the phenomenon can be sorted together to help
bring to surface similarity in incidents (or consequences) based on comparable
condition.
Theoretical codes conceptualised the interrelation of substantive codes by
generating hypotheses to be integrated into theory. Theoretical coded emerged
from open coding and theoretical memos.
In this study, having achieved theoretical saturation of my core concept and related
categories, I proceeded to review, hand sort, and integrate those memos related to
the core, its properties, and related categories. As I began to sort (read) memos and
look for relationship between the various concepts, theoretical codes began to
emerge. I formalised and systematised the findings into propositions that explained

95
what factors underlie response times. The emergent theory, which is the outcome
of this study, will be explained in detail in Chapter 7– findings of the research.
PHASE 4: Literature comparison and write up
Step 11 – Literature comparison
The eleventh step is to compare the emerged theory with the existing literature and
assess similarities and differences with a view on how such arise. Eisenhardt (1989,
p.545) states:
“Overall, trying the emergent theory to existing literature enhances the internal validity, generalizability, and theoretical level of the theory building from case study research…because the findings often rest on a very limited number of cases.”
Eisenhardt (1989, p.545)
As discussed earlier, literature on risk management in supply chain is relatively
limited in scope and depth. Nevertheless, reading the relevant literature increases
sensitivity to concepts – at the same time keeping in mind the ‘open approach’,
which seeks to avoid bias.
For example, in my study, the literature review which are relevant to the main
category and the emerging theory such as supply chain disruption, supply chain risk
management, time-based management, supply chain partnership raised the
theoretical level and help to improved construct definition, as suggested by
Eisenhardt (1989).
Step 12 – Validation the theory
From the nature of the Grounded Theory process, validity is essentially inherent
but validation can check whether the new theory has ‘fit’, ‘relevance’, ‘workability’
and ‘modifiability’.
By fit, an evaluation is made on how well the concepts represent the observed
phenomena, as outcome to rigorous application of constant comparison of multiple
events contributing to the representation of a concept.

96
By relevance, a view is formed on how meaningful the concepts are to participants
or to the cohort they represent. Certainly, the concepts identified here can be
readily tested in further work against other industries – there is no scarcity of cases
of supply chain disruption.
By workability, the applicability of concepts across a range of scenarios is
understood. As the inputs are phenomena from real-world situations, which express
considerable variability, the workability of theory and concept structure is critical to
make the work meaningful.
With modifiability, the theory can be extended and adapted when new insight is
generated through comparison with further data. This validation in the study is
explained more in the closing chapter – ‘Conclusion.’ - of the study.
To validate my constructs (categories) and the relationships I looked at two
disruption at BP the oil company. The disruption at BP Upstream, which
experienced a catastrophic oil containment event in 2010, was selected. After a
sequence of design changes by BP and missed warnings by its contracting partners,
the Deepwater Horizon drilling platform lost control of the 15,000-foot deep
exploration well at Macondo Prospect in the Gulf of Mexico. An eruption of oil
and gas on the rig exploded, killing 11 and destroying the platform, starting a three-
month effort to cap the well and the largest oil spill in American waters. Estimates
of damage climbed exponentially; BP faced possible collapse, a lengthy moratorium
on offshore drilling shutdown the industry and penalties of GBP 20 Billion where
filed against BP and its partners.
The second disruption is from the BP company was selected, exploring the
background, cause and response to an explosion at its Texas City refinery in which
15 workers were killed and 180 injured, resulting in an extensive review of BP and
refining industry operations. BP has paid out more than GBP 1.2 Billion in
compensation by late 2010.
For the BP Deepwater Horizon and BP Texas City cases, data were collected from
secondary sources, as access to direct interviews was constrained by ongoing
investigations and litigation. Data was collected from official government sources as
well as from print news media, company reports and on the Internet. Data and

97
reports used here are from the US government (National Commission report to the
President, Department of Energy, Department of Justice, and the Department of
the Interior) and BP internal and public reports. Data included sworn testimony by
direct participants in the events from formal and judicial investigations; these are in
the public record. The data source, data collection methods and data content of BP
are explained in Table 18.
The three disruptions are shown in Table 19 and the similarities and differences of
these three cases are shown in Table 20 in order to underpin the relevance of the
cases to the research objectives.
Step 13 – Writing the report
Writing of the report is the concluding step of the process. The key objective is to
make the relationships explicit and clear, where relevant through graphical
representation of the core categories, subcategories and contributing foundation of
codes and observations.

98
BP Deepwater Horizon Data Source & Collection Methods Data Content Reported by BP – Internal BP Investigation National Commission on the BP
Deepwater Horizon oil spill and offshore drilling
President, Global Business Lines and Chief Health, Safety and Environmental Officer Halliburton
The Joint United States Coast Guard/ The Bureau of Ocean Energy Management
Energy Policy Research Foundation U.S. Department of Homeland Security,
United States Coast Guard Congress of the United States Det Norske Veritas (DNV)
From the company and external investigation reports. Industry and organisational background
contributing to the event. Factual sequence and likely root cause of
the disruption. Assessment of initial and ongoing response
including corrective and preventative steps taken by the company.
Perspective on environmental and external impact.
Audio transcripts From company and external websites. Perceived cause and impact of the
disruption, as experienced during the event. External perception of liability and
consequences to the firm.
BP Texas City Data Source & Collection Methods Data Content Reported by BP – Internal BP Investigation U.S. Chemical Safety and Hazard
Investigation Board Environmental Protection Agency U.S. Occupational Safety and Health
Administration Texas Commission on Environmental
Quality The BP U.S. Refineries Independent
Safety Review Panel
From the company and external investigation reports. Industry and organisational background
contributing to the event. Factual sequence and likely root cause of
the disruption. Assessment of initial and ongoing response
including corrective and preventative steps taken by the company.
Perspective on environmental and external impact.
From company and external websites. Perceived cause and impact of the
disruption, as experienced during the event. External perception of liability and
consequences for the firm.
Table 18: Data Sources, Data Collection Methods and Data Contents from BP

99
Case PHARMA Response to 2009 H1N1 Pandemic BP Deepwater Horizon Oil Spill, 2010 BP Texas City Refinery Fire, 2005 Notification of the event
On 24 April 2009, the WHO announced an outbreak of H1N1 virus in Mexico and the United States.
On 25 April 2009, the WHO called the flu pandemic problem “a public health emergency of international concern.”
On 11 June 2009, the WHO declared the first global Influenza pandemic in 41 years.
On 10 August 2010, The WHO declared pandemic is over. The world has now entered the “post pandemic period”.
On 20 April 2010, an explosion on the BP-leased Deepwater Horizon Gulf of Mexico platform exploded.
On 23 April 2005, several explosions and a fire occurred during start up of the isomerization unit at the BP in Texas City. The explosions occurred when a distillation tower flooded with hydrocarbons and was over pressurized, causing a geyser-like release from the “blowdown drum” vent stack.
Impact of event WHO reported laboratory confirmed cases of pandemic Influenza H1N1 2009, including over 18036 deaths.
CDC estimated an average of 57 million people have been infected with H1N1 and an average 257,000 cases resulted in hospitalizations.
Pandemic Influenza risk triggers other across the company e.g. regulatory controls, sales and market regulations, global political and economic conditions etc.
Effect on several supply chains (Nicole, Hematol, consumer products, antibiotic etc.)
Potential loss of revenue, reputation, R&D investment (GBP 3.2 Billion) and market position.
11 workers were killed and many injured.
4.9 million barrels of spilled in the Gulf. Moratorium on drilling in the Gulf for
six months and extensive new regulations.
BP fines estimated at USD 20 – 40 Billion.
15 Workers were killed and 180 other were injured.
Impacted on the World oil market - world oil prices jumped to USD 61 a barrel on the day after an explosion, raised concerns about energy supplies toward the end of 2005.
BP refineries were investigated and BP was fined numerous times by OSHA.
BP has paid out more than GBP 1.3 Billion in compensation.
Description of the risks
Lack of stock availability to meet demand in the market. Unable to produce business or medically critical products. Loss of life; absentee on worker. Strike in France & Shut down of the plant Mexico Reputation risk.
Largest accidental marine oil spill in the history of the petroleum industry.
Environmental. Loss of life. Loss of reputation risk. Fines. Litigation. Right to drill. Government contracts (e.g. Pentagon)
As the third largest refinery in the US, disruption risk can have effect on the global oil supply petroleum.
Loss of life. Fines. Litigation.

100
Table 19: A Fact Sheet of Three Disruptions
Case PHARMA Response to 2009 H1N1 Pandemic BP Deepwater Horizon Oil Spill, 2010 BP Texas City Refinery Fire, 2005 Examples of Action taken/ insights solution
Ramp up production to 24/7. Recruiting contingency workers. Redesign supply chain – shifting manufacturing capacity. Develop production extension. Accelerate approval process for existing products. Accelerate vaccine development. Simplify packaging for easier in high volume production.
Setup Central command / incident management team.
Modelling of impact. Develop and attempt portfolio of well-
control solutions like top kill, containment dome, and relief well.
Develop and attempt oil recovery and oil spill techniques.
Create spill-response company with competitors.
Create organization analysis (Fatal accident investigation report)
Engineering and plant analysis. Simulation and modeling of impact. Culture and safety review.
Parties Involved Suppliers & distributors. Primary, secondary and third party manufacturing. Government & International authorities. Press and public communication. Consumers/patients.
Transocean – drilling rig operator. Halliburton – cement contractor. Federal, state and local governments. The Bureau of Energy (BOEMRE) Coast Guard. Industry partners and competitors.
Environmental Protection Agency. U.S. Occupational Safety and Health
Administration. Texas Commission on Environmental
Quality, Internal BP investigation. Texas City citizens. Plant workers and management.
Issues encountered
Establish framework or pandemic management organization.
Preparedness plan in place but not in use – out of date, lack of clarify role & responsibilities.
Problems in line of communications. Highly variable and uncertain demand.
Missed early warning signs. Long delay between detection and
countermeasures. Poor simulation modeling resulted in
massive over investment of certain oil spill remedies.
No process and procedures in place for handling Deepwater oil spills.
Many parties involved in legal issues.
Missed early warning signs. Not learning from past events. Documents are is out of date since
merger of BP with Amoco. Policies are ignored / plant layout is
unsafe. Failed alarms. No effective notification system.

101
Description
Similarities Challenges in distinguishing disruptive events from normal events. Organisational ‘apathy’ regarding potentially disruptive risks. Communications barriers during and after event. Initial ‘chaos’ during first phase as awareness of the event builds. Surge in widespread demand for information. Exponential acceleration of impact when business-as-usual control
mechanisms failed to isolate the disruption (‘shape’) Balance between general fear of greater impact and need to manage
perception of the event (control panic). Global supply chains and organisation. Multi-player / multi-geography Complex supply chain / systems. Significant impact to the organisation locally and globally. Potential of catastrophic impact outside the organisation / industry. Fast response required. Long-term recovery cycle. Aspect of government regulation and reputation risk. Political interests during later phases of the disruption and in long-term
‘learning’ process. Differences Speed and absolute duration of the event.
Scale of the permanent impact after the event. Upside and downside opportunity. Scale of potential impact on human lives (15 killed, 180 injured in BP
approximately 18,000 swine flu deaths, 11 people killed in BP oil spill -
Table 20: Similarities and Differences of Three Disruptions

102
Chapter 4 PHARMA H1N1 Influenza Pandemic
4.1 Introduction
Influenza and other pandemics are infrequent but can have a dramatic impact on
health for a large population. In previous generations, millions died in multiple
waves of Influenza outbreaks in a relatively short period. Although most humans
and animals suffer only mild symptoms, some variants are highly contagious or,
such as the recent avian flu, deadly.
Uncertainty about the deadliness and spread of illness makes it difficult to predict
the impact of an epidemic or pandemic, and with infrequent occurrences, planning
for such a global outbreak is a challenging exercise.
A major pharmaceutical firm such as PHARMA (one of top five pharmaceutical
companies in the world in term of revenue) must act quickly to protect its supply
chain. A local or widespread outbreak can disrupt production and logistics for
critical medicines relied upon by specific groups of patients, and obviously hamper
the broader response for the production of Influenza medicines.
Fast and convenient travel in recent times has accelerated the spread of Influenza
between countries and continents;; however, better modelling, science and
communication present an opportunity to detect earlier, coordinate more effectively
and respond faster. PHARMA plays a key role in minimising the humanitarian
impact of such occurrences, at the same time there is a potential upside revenue
opportunity that can reward years of investment in antiviral medicines.
Even so, there is always the risk of over-reacting to potential outbreaks, as seemed
evident during the 'false alarm' epidemic in 1973 in the US, which led to
unprecedented government involvement in vaccinating a large percentage of the
population, despite only a handful of deaths early in that outbreak. Managing the
critical supply, sales and political relationships is challenging when governments are
regulators and influencers as well as important customers. According to Wolfgang
Wodarg, head of health at the Council of Europe, the makers of flu drugs and

103
vaccines influenced the decision of the World Health Organisation (WHO) to
declare a pandemic. Talking after the 2009 swine flu pandemic, Wodarg said, “This
led to the pharmaceutical firms ensuring 'enormous gains', while countries,
including the UK, 'squandered' their meagre health budgets, with millions being
vaccinated against a relatively mild disease1.”
In this chapter explained how PHARMA deal with unexpected/adverse events and
the risk of disruption to PHARMA supply chain. It focuses on PHARMA’s
approach to supply chain risk management, in particular, discussing in depth, its
planning and preparation for flu pandemic, the production of Nicole Influenza
treatment, vaccine and the significant investment in PHARMA.
4.2 Company Overview
PHARMA is one of the world’s leading research-based pharmaceutical and
healthcare companies, and is “committed to improving the quality of human life by
enabling people to do more, feel better and live longer”. With a firm foundation in
science, PHARMA discovers, manufactures and distributes vaccines, prescription
medicines and consumer health products. Headquartered in the UK, PHARMA
employs over 100,000 people in 117 countries and the pharmaceutical group
includes 108 plants located in 41 different countries.
In 2000 two leading pharmaceutical companies merged to form PHARMA. After
mergers and acquisitions PHARMA had a 7% share of the global pharmaceutical
market, accounted for 26% of all vaccines sales and 17% of all anti-infective2.
According to PHARMA released 2009 annual reports, PHARMA was the fourth
largest pharmaceutical company worldwide by revenue with sales of GBP 28.4
Billion. Of that, sales in the care and pharmaceutical business were GBP 23.7
Billion (of which vaccines sales were GBP 3.7 Billion) and consumer healthcare
sales were GBP 4.7 Billion.
1 Macrae, F. (2010) 2 Oxfam (2001)

104
PHARMA Products
PHARMA is known as a leader in respiratory central nervous system, AIDS/HIV
and anti-infective research. The company's products are divided into three main
areas: prescription medication, vaccines and consumer healthcare.
1. Prescription Medication (GBP 27.3 Billion)
The bulk of PHARMA’s revenues come from the sale of prescription medications.
PHARMA has medications in many different therapeutic categories, including
cardiovascular, respiratory and the central nervous system. Some of its most
important prescription products are:
Hematol/Enatol (GBP 5 Billion): This product is a long-acting bronchodilator,
meaning it opens up a patient's air passage through an anti-inflammatory taken
through an inhaler. Hematol/Enatol is approved to treat asthma and chronic
obstructive pulmonary disease. In 2004, it was estimated that approximately 20
million Americans (between 5 and 10%) have asthma. There is clearly a large
market for treatments. Although there are no indications that the number of
cases of asthma is growing, there has been no marked decrease either.
Hematol/Enatol is the highest selling respiratory product worldwide; it is a main
driver for the strong growth in PHARMA’s revenue.
Seria (GBP 771 Million): This product is metabolic product for the treatment of
diabetes. It is used to level insulin levels and is effective at mitigating type II
diabetes.
Antivirals (GBP 4.2 Billion): PHARMA’s antivirals treatments include an Herpes
treatment, HIV treatment, and Nicole Influenza treatment. In 2009, the total
antiviral sales grew by 12%.
2. Vaccines (GBP 3.7 Billion)
PHARMA is dominant in the vaccine market, supplying approximately one-quarter
of all vaccines worldwide. Its vaccines are used to immunise a wide range of
ailments including hepatitis (hepatitis A and hepatitis B), meningitis, Influenza and
various childhood illnesses.

105
3. Consumer Healthcare (GBP 4.7 Billion)
PHARMA's consumer healthcare products include over-the-counter medications,
nutritional supplements and oral care products. Some of the major products include
a well-known toothpaste brand, toothpaste specifically for sensitive teeth, gastro-
intestinal ailments and products to help users quit smoking. The portfolio includes a
well-known product in a line of glucose energy and sports drinks of which sales
rose 7 % to GBP382 Million in 2009.
PHARMA Supply Chain
The Manufacturing and Supply Chain (MSC) is responsible for PHARMA’s supply
chain quality, performance and customer service. MSC supports the commercial
ambitions of PHARMA by delivering quality medicines and consumer products to
patients and customers around the world. More than 29,000 people work in MSC
across PHARMA in a network of 77 sites in 33 countries.
The scale of manufacturing in PHARMA is large, with the manufacture of over
four billion packs per year in 28,000 different presentations including tablets,
creams and ointments, inhalers, injections, liquids and sterile solutions supplied to
more than 150 markets. As stated in the PHARMA annual report 2009, MSC spent
over GBP 3.7 Billion on production in 2009.
PHARMA's supply chain is complex with over 75,000 suppliers worldwide. These
range from major strategic relationships with suppliers that manufacture active
pharmaceutical ingredients (APIs), intermediates, raw materials and packaging for
PHARMA medicines through to local contracts for goods or services such as office
equipment, cleaning and security. According to the 2008 annual report, PHARMA
operates a procurement operation that spends over GBP 2 Billion annually with
external suppliers. Importantly, PHARMA takes specific steps to protect its supply
chain from disruption, as reviewed below.
PHARMA Risk Management
PHARMA is committed to having an effective risk management process across all
business units. This enables management to operate a risk-based approach to
establishing internal control systems to effectively mitigate or control significant

106
risks. PHARMA's risk management approach can be categorised into two levels:
corporate level and business unit level.
Corporate Level
According to PHARMA's Corporate and Social Responsibility Report 2009, an
internal control framework ( Figure 11) integrates ethics and compliance with the
day-to-day management of the group. This framework supports line management in
the identification and mitigation of significant risks, among which are potential
compliance failures.
The framework includes the Risk Oversight and Compliance Council (ROCC), as
well as sector and other business unit risk management and compliance boards. The
ROCC is chaired by PHARMA’s corporate compliance officer and it includes
several corporate executive team (CET) members and heads of department with
internal control risk management, assurance, audit, and compliance responsibilities.
The ROCC reports to the audit committee of the PHARMA Board and the CEO,
and will also report to the CET. The reporting line to the audit committee provides
a mechanism for the executive management if irregularities are identified.
PHARMA's Risk Management and Legal Compliance Policy further clarify the roles
and responsibilities of people in the company's internal control framework. CET
members are formally responsible for establishing an appropriate risk management
structure within their business units to identify and mitigate significant risks.
PHARMA continues to improve its risk management process. The ROCC meets
regularly to review and assess significant risks and mitigation plans, providing an
oversight of internal controls to ensure compliance with applicable laws, regulations
and internal PHARMA policies.
“Each business unit must review significant risks at least once a year and include identifying operational risks, legal compliance risks and risks to the achievement of strategic goals and objectives. This ensures that significant risks connected with changes in management direction and the external environment is identified. Business units are corporate functions are required to present annually to the ROCC and Audit and Risk Committee detailing risk management and compliance approach, provide a balanced assessment of the status of internal controls over key risks, and highlight any significant compliance issues."
PHARMA Corporate Responsibilities Report (2010)

107
Table 21 shows the most significant risks facing PHARMA are listed below based
on the annual CET risk workshop in 2009.
Business Unit Level (Manufacture and Supply Chain Level)
Risk management is an essential component of PHARMA's system of internal
control and governance and is regarded as good management practice throughout
its business. PHARMA states a need for a systematic, standardised and effective
approach to risk management to ensure that responsibilities for managing risks are
clearly stated, understood and accepted as well as to ensure that the business
objectives are achieved. This can also establish appropriate mechanisms for
communication, reporting and the escalation of risk.
PHARMA’s basic approach to supply chain risk management is a five-step process
(Figure 12). The risk management process includes risk identification, risk
assessment, risk analysis, risk treatment and risk monitoring.
Significant risks facing PHARMA
1. Risk that R&D will not deliver commercially successful products. 2. Patent infringement litigation. 3. Potential changes in intellectual property laws and regulations. 4. Weakness of intellectual property protection in certain countries. 5. Risk of substantial adverse outcome of litigation and government investigations. 6. Product liability litigation. 7. Anti-trust litigation. 8. Sales and market regulations. 9. Third party competition. 10. Governmental and payer controls. 11. Regulatory controls. 12. Risk of interruption of product supply. 13. Risk of concentration of sales to wholesalers. 14. Global political and economic conditions. 15. Taxation and treasury. 16. Pandemic Influenza. 17. Environmental liabilities. 18. Accounting standards. 19. Failure of third party providers. 20. Protection of electronic information and asserts. 21. Alliances and acquisitions. 22. Attraction and retention.
Table 21: Significant Risk Facing PHARMA
Source: PHARMA Corporate Responsibility Report (2009)

108
Figure 11: PHARMA Risk Management and Compliance Framework
Source: PHARMA corporate responsibility report, 2009
Figure 12: PHARMA's Basic Approach to Supply Chain Risk Management
Source: PHARMA
Audit Committee PHARMA Board Corporate Social
Responsibility Committee
Risk Oversight and Compliance Council (ROCC)
Business Unit or Functional Risk Management and Compliance Boards
Business and Functional Groups
Potential Risks and Risk-Generating Activities and Functions
Business and Function Heads
PHARMA Risk Management & Compliance Framework
CEO
CET

109
MSC defines the risk management requirements regarding identifying, accessing,
prioritising, mitigating, monitoring and communicating risks. MSC and global
functions must incorporate the process steps, decisions and approval points shown
in the risk management process map in (Figure 13).
I. Define the risk management organisation for the risk assessment area.
The activities and areas in which this risk management process operates in MSC
is known as the risk assessment area and defined by senior executive
management.
II. Identify, record and prioritise scored risks
The risk identification processes consider past and present events in addition to
potential future events or changes that could occur within the risk assessment
area. Initially, PHARMA identifies and analyses its supply chain risks by
mapping the supply chain, looking at suppliers as well as products and services.
PHARMA distinguishes between five levels of the probability of an event
occurring Table 22.
III. Design, confirm and approve risk mitigation plan
At this stage, the approved mitigation plan must be included in the risk register
as well as mitigated consequence (score), mitigated likelihood (score), mitigated
index value and escalation. A risk register or risk analysis that is used for
identifying, analysing and managing risk contains are shown in Table 23. The
risk score is calculated by multiplying the impact by the likelihood: I (impact) x
L (likelihood) = R (risk score)
PHARMA categorises overall risk score and recommends response in four
levels (Figure 14).
Ensure mitigation and contingency remain valid (score 1–2).
Consider further mitigation or contingency (score 3–4).
Increase mitigation or strengthen contingency (score 6–10).
Increase mitigation and strengthen contingency (score 12–16).

110
IV. Implement, monitor and complete risk mitigation plans.
At this stage, a mitigation plan owner starts the implementation of the risk
mitigation plan and defines the key milestones for the measurement of the
delivery of the plan to be monitored in the risk register. However, the risk
owner determines the appropriate frequency for the review of the risk
mitigation plan based on the severity of the risk and timing of key milestones.
V. Governance and maintain
There is a defined process for reporting, communicating and escalating risks
including the communication of the plan's progress for review and approval. At
the end of this stage, the risk register must be maintained and reviewed by the
risk team annually.
Figure 13: Process Map
Source: PHARMA

111
Category Product Quality and Compliance Environment, Health and Safety Business
Patients and customer Company and shareholder Regulators
Injuries or illness potential Environmental impact
Cost Supply Reputation
Likelihood Score 1-Rare 2 - Unlikely 3-Possibly 4-Likely 5-Almost
certain
Frequency: How often might/ does it happen?
Once in 50 years Every 5-10 years Every 1-5 years One or more times per year
Significant number of times per year
Impact Score 1-Insignificant 2-Minor 3- Moderate 4- Major 5- Catastrophic
Table 22: Five by Five Matrix - Likelihood and Impact Scoring
Source: PHARMA
Risk Register
1. A description of risk. 2. A consequence if this event actually occurs. 3. A probability of its occurrence (score). 4. An impact (score) 5. Raw risk score (score). 6. Mitigation plan (how to reduce the probability of an event occurring). 7. Contingency plan (action to be taken to reduce impact should it occur). 8. Mitigated likelihood score (a score of probability after mitigation). 9. Mitigated consequence score (a score of supply chain impact after contingency). 10. Mitigated index value (new overall risk score). 11. Risk team owner. 12. Escalation.
Table 23: A Range of Content for Risk Register
Source: PHARMA
Figure 14: Risk Analysis Matrix Before and After Mitigation and Contingency Plan
Source: PHARMA

112
Manufacturing Site Business Contingency Plan
Business continuity plans (BCPs) at PHARMA are part of a formal planning
process to identify the potential impact of significant unplanned adverse events on
critical business processes and assets and to formulate viable strategies and plans to
minimise the impact on business continuity for the organisation following a
significant business interruption.
BCP focus on developing contingency and recovery plans that minimise the impact
of an event, rather than the threats and causes of the event. The BCP in Figure 15 is
a balanced, ongoing, coordinated programme of strategies, plans and procedures
that provide the ability to manage and ensure the ready availability of enterprise-
wide critical resources in response to disaster or unplanned interruptions.
Figure 15: Business Continuity Planning Model
Source: PHARMA
Business Unit – must ensure that BCPs exist for all critical processes.
Continuity Planning – a subset of continuity planning that ensures that an adequate
recovery strategy is in place to restore minimum essential service and systems in the
event of a significant disruption.
SLA (1) – Service Level Agreements (SLA) or contracts should be developed and
agreed between the business and the unit that confirms, in measurable terms, the
recovery service that the unit will provide to ensure critical processes remain
uninterrupted in the event of a disaster.
Business
Unit Business
Unit
IT and Other
Service
Provider
Continuity Planning
Business Continuity Planning
Annual Reviews
Periodic Live Test

113
SLA (2) - must be established to ensure adequate recovery capabilities for service
that are operated by IT internal or external service providers.
IT and other services providers – a service level agreement or contract developed to
confirm, in measurable terms, the recovery services that will be provided to ensure
critical applications and services remain uninterrupted in the event of a disaster.
Annual Reviews – continuity plans are reviewed annually to ensure they are kept
up-to-date and accurate.
Periodic Live Testing and joint live testing - performed on continuity plan to ensure
that the plans will work in the event of a disaster.
Logistics Pandemic Business Continuity Plan
The logistics pandemic business continuity plan is based, in part, on the WHO
national preparedness plan. It defines the roles and activities of MSC and the supply
chain pandemic management team, which will be formed in the event of an
Influenza pandemic being declared. In addition, it states the responsibilities and
describes the methods and sequence for performing the Influenza pandemic
logistics process.
This process document forms a central part of the overall MSC activities as outlined
in the formal MSC preparedness plan. It aims to ensure that, in the event of a
pandemic, medically critical products from PHARMA will continue to be supplied,
defined business critical products will continue to be supplied, the number and
duration of stock-outs and the impact on sales will be minimised and manufacturing
site BCPs are aligned to this process plan. In addition, its aim is to mitigate the
negative effects of the pandemic and maintain business operation as efficiently as
possible.
4.3 Background of the H1N1 2009 Influenza Pandemic
History of the Influenza Pandemic
It is generally agreed that three pandemics of Influenza occurred in the 20th
century: in 1918, 1957 and 1968. The latter two pandemics together are thought to
have caused between one million and four million deaths. They were in the era of

114
modern virology and as such have been the most thoroughly studied. All three have
been informally identified by their presumed sites of origin as Spanish, Asian and
Hong Kong Influenza, respectively. They are now known to represent three
different antigenic subtypes of the Influenza A virus: H1N1, H2N2, and H3N2,
respectively.
The 'Spanish flu' outbreak in 1918 is thought to have infected up to one-third of the
world's population and caused 20 to 50 million deaths from 1918 to 1919. It
occurred in three waves, beginning with a first spring wave in 1918 that was mild, a
severe second wave quickly followed by a milder third wave in early 1919. This
pandemic is estimated to have had an overall case fatality rate of approximately 2%
of infected persons.
Not classified as true pandemics are three notable epidemics: (1) a 'Pseudo-
pandemic' in 1947 with low death rates, (2) an epidemic in 1977 that was a
pandemic in children and (3) an abortive epidemic of swine flu in 1976 that was
feared to have pandemic potential. Major Influenza epidemics show no predictable
periodicity and all differ from one another in impact.
Current theory suggests that the basic genetic structure that varies according to
origin (e.g. strains of aviary or porcine origin) will evolve through mutation and
genetic reassortment in mild forms (antigenic 'drift') or significant forms (antigenic
'shift'). The latter was presumed to typically be followed by a pandemic, because the
population at large was effectively not immunised as they might have been from
previous mild transmissions of similar Influenza strains.
History of the Avian Flu
Influenza A virus subtype H5N1, or simply H5N1, is a subtype of the Influenza A
virus that can cause illness in humans and many other animal species. In birds this
virus can cause a wide spectrum of manifestations, ranging from mild illness to
rapidly fatal disease. Avian Influenza A virus strains are classified as low pathogenic
(associated with mild disease) and highly pathogenic (HPAI; associated with severe
illness and high mortality). A bird-adapted strain of H5N1, called HPAI A, was
cause of H5N1 flu, commonly known as avian Influenza or bird flu.

115
Avian Influenza A (H5N1) first came to attention worldwide in 1997, following a
massive outbreak in poultry flocks in Hong Kong. Another brief outbreak occurred
in February 2003 in Asia, Africa, the Pacific, Europe and the Near East. Limited
person-to-person transmission kept this bird flu strain from causing a pandemic,
although experts continued to closely monitor bird flu cases.
Avian Influenza viruses do not usually infect humans; however, several instances of
human infections and outbreaks of avian Influenza have been reported since 1997.
In 2003, Influenza A (H7N7) infections occurred among persons who handled
affected poultry and their families in the Netherlands during an outbreak of avian
flu among poultry. More than 80 cases of H7N7 illness were reported with
symptoms ranging from eye infections (conjunctivitis) to severe respiratory disease
(pneumonia). One patient, a veterinarian who had visited an H7N7 flu-affected
farm, subsequently died.
Although there was evidence of limited person-to-person spread of infection,
sustained human-to-human transmission did not occur in the previous outbreaks of
avian Influenza. It is believed that most cases of avian Influenza infection in
humans resulted from contact with infected poultry or contaminated surfaces.
According to the UN Food and Agriculture Organization (FAO) Avian Influenza
Disease Emergency Situation Update in 2008, H5N1 pathogenicity was continuing
to gradually rise in endemic areas but the avian Influenza disease situation in farmed
birds was being held in check by vaccination. Eleven outbreaks of H5N1 were
reported worldwide in June 2008 in five countries (China, Egypt, Indonesia,
Pakistan and Vietnam) compared with 65 outbreaks in June 2006 and 55 in June
2007. The "global HPAI situation can be said to have improved markedly in the
first half of 2008 but cases of HPAI are still underestimated and underreported in
many countries because of limitations in country disease surveillance systems3."
On December 21 2009, the WHO confirmed 447 human cases, which resulted in
263 deaths.
3 Food and Agriculture Organisation (2010)

116
Severe acute respiratory syndrome (SARS) was first reported in Asia in February
2003, causing severe respiratory illnesses in 8,098 people worldwide. Before the
SARS outbreak was contained in July 2003, 774 people died. However, avian
Influenza and SARS are entirely different disease entities caused by completely
different viruses, although some of the symptoms are the same.
The 2009 H1N1 Influenza Pandemic
In April 2009, a novel Influenza virus strain began to spread around the world. The
WHO referred to the virus as Influenza A (H1N1), whereas the CDC and other
Administration officials referred to it as 2009 H1N1 flu. Public reports referred to
the virus as 'swine flu', which reflected the dominant genetic makeup of the
unknown disease. Throughout this report, this event will be referred to as the
‘H1N1 pandemic’ is a highly contagious acute respiratory disease of pigs, caused by
one of several swine Influenza A viruses. Morbidity tends to be high and mortality
low (1–4%). The virus is spread among pigs by aerosols, direct and indirect contact,
and asymptomatic carrier pigs (e.g. animals that do not appear to be infected).
Outbreaks in pigs occur year round, with an increased incidence in the autumn and
winter in temperate zones. Many countries routinely vaccinate swine populations
against swine Influenza.
The WHO formally investigated and explained how the disease emerged: pigs can
be infected by avian (bird), human, and swine (pig) Influenza (flu) viruses. When flu
viruses from different species infect pigs simultaneously, the viruses can reassort
(swap genes) and new viruses that are a mix of swine, human or avian flu viruses
can emerge. This type of reassortment has already happened in pigs; avian and
human genes have been circulating among swine in the United States since 1998.
This type of reassortment can also occur in humans. The currently circulating
Influenza A (H1N1) virus is such a reassortment, composed of genes of swine,
avian and human origin. This particular combination had not been seen in humans
or in swine. The origin of this reassortment, and when and where it happened, is
not known. This virus is now being transmitted from human to human in a
sustained manner.
Swine Influenza viruses are most commonly of the H1N1 subtype, but other
subtypes are also circulating in pigs (e.g., H1N2, H3N1, H3N2). Pigs can also be

117
infected with avian Influenza viruses and human seasonal Influenza viruses as well
as swine Influenza viruses. The H3N2 swine virus was thought to have been
originally introduced into pigs by humans. Pigs can be infected with more than one
virus type at a time, which can allow the genes from these viruses to mix.
According to the US Centres for Disease Control and Prevention (CDC), the first
large-scale outbreak was registered in Mexico in late March 2009, resulting in an
effective shutdown of Mexico City. Although the illness caused was typically mild
and similar to common seasonal flu, patients with underlying health issues were at
risk and the global spread during June triggered a major response by governments
and pharmaceutical companies.
Although many illnesses are successfully and predictably treated by modern
medicines, rapidly communicable diseases can overwhelm the medical profession
and exhaust the availability of an affordable remedy. Historical and recent examples
are many and severe, of both highly contagious diseases such as the bubonic plague
or tuberculosis as well as the broader category of infectious diseases such as HIV.
This study examines the response of a major pharmaceutical in the face of the
global outbreak of H1N1 Influenza virus, where the eventual outcome was
unknown at the time that major investments in and strategic decisions about its
supply chain had to be made.
In June 2009, H1N1 reached pandemic levels. The WHO declared a pandemic on
11 June 2009, which was the first flu pandemic in 40 years. On the day of the
announcement, 74 countries and territories had reported laboratory confirmed
infections. Official reports stated that there had been nearly 30,000 cases globally
and 141 deaths, with figures rising daily.
As of June 22 2009, the WHO confirmed more than 50,000 human cases of H1N1
in more than 80 countries and territories, including 231 deaths (Figure 6). It is
important to note that more people than officially reported may have contracted
H1N1; the number of cases shown in the WHO report reflected only cases
confirmed by laboratory testing and reported to the WHO by foreign health
authorities. By this date, most countries had since confirmed infections from the
new virus.

118
The virus strain does not seem to be as lethal as was H5N1 avian Influenza, which
re-emerged in 2005, but it is slightly more lethal than seasonal flu. Although the
virus has been characterised as a pandemic, researchers could not initially predict
how virulent the virus would ultimately become. The FAO, the World Organization
for Animal Health (OIE) and the WHO agreed that there was a risk of contracting
the virus from consuming well-cooked pork or pork products. The WHO asserted
that imposing travel restrictions would minimally affect the spread of the virus, but
would be highly disruptive to the global community. Nevertheless, local authorities
shutdown Mexico City for five days and imposed wide-ranging restrictions over
weeks in an attempt to slow the spread of the H1N1 virus.
The globalisation of the pharmaceutical industry has had an impact beyond the core
corporate aim of managing profitability; in an industry where investment costs in
research are huge and few drugs reach ‘blockbuster’ profitability status. Other
aspects such as public policy, public perception, intellectual property rights and
competition can affect efficient supply chain operations for the pharmaceutical
industry. After the pandemic declaration by the WHO, PHARMA experienced a
sudden increase in demand for its Nicole product, one of just two commonly
available treatments in the market along with a competitors product, referred to
here as Abaco. PHARMA is the only company licensed to make Nicole; however, it
was increasingly feared during the first stages of the swine flu pandemic that the
higher end of demand estimates for Nicole might not be met.
Therefore, in this study, I look at the role of time on PHARMA's response to the
2009 Influenza pandemic and the impact it had on a range of risk management and
supply chain management policies. As one of the largest global pharmaceutical
development and manufacturing firms, PHARMA has a particularly important role
in addressing the health challenges posed by viral pandemics. Like other
pharmaceuticals, PHARMA's sourcing and manufacturing strategy is global and
complex, with a broad range of commodity and high-value products including life-
critical medicines. Selling in markets and to governments worldwide, PHARMA is
exposed to demand-side fluctuation and influence that make forecasting and stock
allocation a complex process.

119
Available Treatments and Vaccines for 2009 H1N1 Influenza
According to the WHO, most people who have contracted H1N1 have experienced
Influenza-like symptoms, such as a sore throat, cough, runny nose, fever, malaise,
headache and joint/muscle pain, and recovered without antiviral treatment. Drugs
provided to H1N1 patients may reduce the symptoms and duration of illness, just
as they do for seasonal Influenza. They also may contribute to preventing severe
disease and death. The strain of H1N1 circulating the globe was a new virus, and
only a small number of people with the infection have been treated for it with
antiviral drugs.
The strain of H1N1 is treatable with two antiviral drugs, Osolia (brand name Abaco
marketed by PHARMA’s competitor and Xtazo (brand name Nicole) marketed by
PHARMA. The WHO has maintained a global stockpile of approximately five
million adult treatment courses of Abaco, which were donated by manufacturers
and sponsoring governments. This stockpile was initiated after the onset of H5N1
bird flu outbreaks. The WHO had already distributed some of the treatments
through its regional offices and distributed another three million treatment courses
from its stockpile to developing countries in the first months of the pandemic.
At the beginning of the H1N1 outbreak, there was no available vaccine against the
current strain of H1N1, although the CDC, the WHO and others were working on
developing one. Scientific evidence, although incomplete, suggested that the then
available seasonal Influenza vaccines would offer no protection against H1N1. The
WHO and CDC prepared vaccine candidate viruses and estimated that once the
strain had been modified, it would take between five and six months to mass
produce a vaccine against H1N1. Once a vaccine had been developed, the WHO
estimated that one to two billion vaccine doses could be produced annually. Five
major pharmaceutical companies have since developed these flu vaccines. One of
these companies announced that it would donate 100 million doses to the WHO
for distribution to poor countries in need. PHARMA also reportedly planned to
donate 50 million doses to the WHO.
Nicole Dry Powder Inhaler
Nicole inhalation powder contains the active pharmaceutical ingredient called
Xtazo, which is a type of medicine called a neuraminidase inhibitor. It is used to

120
treat and prevent infection with the Influenza virus. Nicole is marketed by
PHARMA competes with Abaco which is a product contains the API called Osolia
from ISSA.
PHARMA has adapted two technologies for delivering the Nicole drug. The first
technology uses a dry powder inhaler with the Nicole inhalation powder packed in
blisters on a circular foil disk. From a patient perspective, the multi-dose format is
convenient but more expensive to manufacture. The second technology is capsule-
based, in which the drug is delivered in a single application form using a capsule to
be inserted by the patient in the inhaler device.
Nicole can minimise the impact of the virus when taken by the patient within 72
hours of exposure. Nicole is an alternative treatment from Abaco; however, using
an inhaler for treatment is less convenient compared with Abaco, which is taken in
tablet form. Nicole is also understood to be more expensive to manufacture than
Abaco.
Most countries have built stockpiles of antiviral medication consisting of
approximately 80% of Abaco and 20% of Nicole. Both products have advantages
and disadvantages.
According to the WHO, Abaco was working against the strains of the new H1N1
flu but some health experts expressed concerns that it might be less effective than
Nicole was, since there had been widespread reports in the past year of resistance to
Abaco by seasonal flu. The swine Influenza A (H1N1) viruses that had been
detected in humans in the US and Mexico in 2009 were also resistant to
Amantadine and Rimantadine.
Clinical tests had confirmed that 2009 H1N1 pandemic virus were sensitive to
inhibitors of neuraminidase such as Abaco and Nicole. As said by CDC, Nicole was
the preferred medication for all circulating subtypes of the Influenza virus at that
time. As a result Nicole has typically been used to diversify and add to government
stockpiles of Osolia (Abaco).
Following the outbreak, PHARMA contacted governments around the world to
ascertain demand for Nicole and put in place a series of measures to raise
production levels. PHARMA expected to be able to increase its annual production

121
capacity of Nicole to 190 million treatment courses by the end of 2009. This new
capacity is three times more than PHARMA’s previous maximum capacity of 60
million treatment courses.
Figure 16: Number of Laboratory Confirmed Cases as of 22 June 2009
Source: World Health Organisation (2009)
4.4 Companies and Parties Involved
A range of national and international agencies are involved the response to a
possible pandemic.
World Health Organisation (WHO)
The World Health Organisation is the directing and coordinating authority for
health within the United Nations system. It is responsible for providing leadership
on global health matters, shaping the health research agenda, setting norms and
standards, articulating evidence-based policy options, providing technical support to
countries and monitoring and assessing health trends. The headquarters of WHO is
located in Geneva, Switzerland.

122
WHO Pandemic Phases
The phases of pandemic alert (Figure 17) are defined and managed by the World
Health Organisation. They were first developed in 1999. It is applicable globally and
provides a framework to aid countries in pandemic preparedness and response
planning. The use of a six-phased approach has been developed to facilitate
incorporation of new recommendations into existing national plans.
To facilitate planning at national and global levels, Phases 1 to 3 correlate with
preparedness, including capacity development and response planning activities;
Phases 4 to 6 clearly signal the need for response and mitigation effects and have
been grouped to include common action points.
In addition, the time after the first pandemic wave has been elaborated into post
peak and post pandemic periods. When making a change to the global phase, WHO
considers all available information to assess if the criteria for a new phase have been
met.
In May 2009, there was vigorous debate about whether WHO should maintain its
pandemic Influenza phase system, which reflects the spread of the virus and
transmission patterns rather than the severity. Some argued that WHO should
develop an alert system that is based on severity. Supporters of this idea asserted
that the public might not understand that widespread death may not occur at the
highest pandemic phase level. Critics of the systems, including some European
leaders, warned that if WHO raised the pandemic threat level to Phase 6, panic
might ensue and considerable economic and social disruptions may occur. Other
health experts maintained that cases of sustained human-to-human transmission of
H1N1 at that time in Japan justified raising the pandemic threat level to Phase 6.
On 11 June 2009, WHO raised the 2009 pandemic phase level from Phase 5 to
Phase 6. When announcing her decision, WHO Director General Margaret Chan
underscored that the shift did not reflect a change in severity. WHO also released a
pandemic Influenza preparedness and response guide that was updated and
replaced its 2005 guide. Among other changes, the update “retained the six-phase
structure, but regrouped and redefined the phases to more accurately reflect
pandemic risk and the epidemiological situation based upon observable

123
phenomena4.” The update also outlined steps governments should take in planning
and preparing for an epidemic (Table 24).
Figure 17: WHO Pandemic Influenza Phases
Source: WHO pandemic preparedness and response plan (2009)
By their nature, Influenza viruses circulate continuously among animals, especially
birds. Even though such viruses might theoretically develop into pandemic viruses,
by definition, in Phase one no viruses circulating among animals have been reported
to cause infections in humans.
Phase two, an animal Influenza virus circulating among domesticated or wild
animals is known to have caused infection in humans, and is therefore considered a
potential pandemic threat.
Phase three, an animal or human-animal Influenza reassortant virus has caused
sporadic cases or small clusters of disease in people, but has not resulted in human-
to-human transmission sufficient to sustain community-level outbreaks. Limited
human-to-human transmission may occur under some circumstances, for example,
when there is close contact between an infected person and an unprotected
caregiver. However, limited transmission under such restricted circumstances does
4 Salaam-Blyther, T. (2009)
PANDEMIC INFLUENZA PHASES
TIME
Phases 1 – 3
Phase 4
Phases 5-6/ Pandemic
Post PeakPost
Pandemic
Predominantly animal
infections; few human
infections
Sustained human to
human transmission
Widespread human
infection
Possibility of recurrent
events
Disease activity at seasonal
levels

124
not indicate that the virus has gained the level of transmissibility among humans
necessary to cause a pandemic.
Phase four is characterised by verified human-to-human transmission of an animal
or human-animal Influenza reassortant virus able to cause “community-level
outbreaks.” The ability to cause sustained disease outbreaks in a community marks a
significant upwards shift in the risk for a pandemic. Any country that suspects or
has verified such an event is asked to urgently consult with WHO so that the
situation can be jointly assessed and a decision made by the affected country if
implementation of a rapid pandemic containment operation is warranted. Phase
four indicates a significant increase in risk of a pandemic but does not necessarily
mean that a pandemic is a forgone conclusion.
Phase five is characterised by human-to-human spread of the virus into at least two
countries in one WHO region. While most countries will not be affected at this
stage, the declaration of Phase 5 is a strong signal that a pandemic is imminent and
that the time to finalise the organisation, communication, and implementation of
the planned mitigation measures is short.
Phase six, the pandemic phase, is characterised by community level outbreaks in at
least one other country in a different WHO region in addition to the criteria defined
in Phase five. Designation of this phase indicates that a global pandemic is under
way.

125
Table 24: WHO Pandemic Influenza Phase Descriptions and Actions in Each Phase
Source: WHO pandemic Influenza preparedness and response, guidance document (2009)
Phase Estimated probability of pandemic
Description Main Actions in Affected Countries
Main Action in Not-Yet Affected Countries
Phase 1 Uncertain No animal Influenza virus circulating among animals has been reported to cause infection in humans.
Producing, implementing, exercising, and harmonizing national response plans with national emergency preparedness and response plans.
Phase 2 Uncertain An animal Influenza virus circulating among domesticated or wild animals is known to have caused infection in humans and is therefore considered a specific potential pandemic treat.
Producing, implementing, exercising, and harmonizing national response plans with national emergency preparedness and response plans.
Phase 3 Uncertain An animal or human-animal Influenza reassortant virus has caused sporadic causes or small clusters of disease in people, but has not resulted in human-to-human transmission sufficient to sustain community-level outbreaks.
Producing, implementing, exercising, and harmonizing national response plans with national emergency preparedness and response plans.
Phase 4 Medium to high
Human-to-human transmission of an animal or human-animal Influenza reassortant virus able to sustain community-level outbreaks has been verified.
Rapid containment
Readiness for pandemic response
Phase 5 High to certain
The same identified virus has caused sustained community level outbreaks in two or more countries in one WHO region.
Pandemic response: Each country to implement actions as called for in their national plans.
Readiness for imminent response
Phase 6 Pandemic in progress
In addition to the criteria defined in Phase 5, the same virus has caused sustained community level outbreaks in at least one other country in another WHO region.
Pandemic response: Each country to implement actions as called for in their national plans.
Readiness for imminent response
Post-peak period
Levels of pandemic Influenza in most countries with adequate surveillance have dropped below peak levels.
Evaluation of response; response; recovery; preparation for possible second wave.
Readiness for imminent response
Possible new wave
Levels of pandemic Influenza activity in most countries with adequate surveillance rising again.
Response Readiness for imminent response
Post-pandemic period
Levels of Influenza activity have returned to the levels seen for seasonal Influenza in most countries with adequate surveillance.
Evaluation of response; revision of plans;
Readiness for imminent response

126
During the post-peak period, pandemic disease levels in most countries with
adequate surveillance will have dropped below peak observed levels. The post-peak
period signifies that pandemic activity appears to be decreasing; however, it is
uncertain if additional waves will occur and countries will need to be prepared for a
second wave.
Previous pandemics have been characterised by waves of activity spread over
months. Once the level of disease activity drops, a critical communications task of
WHO will be to balance this information with the possibility of another wave.
Pandemic waves can be separated by months and an immediate “at-ease” signal
may be premature.
In the post-pandemic period, Influenza disease activity will have returned to levels
normally seen for seasonal Influenza. It is expected that the pandemic virus will
behave as a seasonal Influenza A virus. At this stage, WHO advises that surveillance
be maintained and pandemic preparedness and response plans are updated
accordingly. An intensive phase of recovery and evaluation may be required.
The Role of National Pandemic Preparedness Plan
The WHO has developed a range of recommendations for responding to the threat
of a pandemic. The strategic actions are designed to reduce likelihood of infection,
enable early warning systems, contain or delay spread at the source of the outbreak,
and reduce mortality, social and economic disruption. The guidelines are revised
periodically and the last update was issued in late 2008.
Many countries have adopted and tailored the recommendations for creating their
national pandemic preparedness plans. These typically include measures such as the
stockpiling of antivirals and pre-pandemic vaccines to be used immediately when a
pandemic is declared. Governments also have implemented Advanced Purchase
Agreements (APAs) with local and global pharmaceuticals for acquiring the
vaccines specific to the pandemic Influenza strain once they become available.
Additional stockpiles of related medicines and medical supplies have been
implemented, for example for antibiotics and personal protective equipment. Actual
deployment of the preparedness plans, however, and varies widely across countries,

127
according a recent report by the UN System Influenza Coordinator and World
Bank issued in 20085.
Centres for Diseases Control and Prevention (CDC)
The CDC is an agency of the United States within the Department of Health and
Human Services. Its focus is on health promotion, prevention and preparedness to
address infectious diseases, injuries, workplace hazards, disabilities and health
threats. The agency works with local, state and international governments to
provide a system of health surveillance and monitoring, with personnel stationed
throughout the United States and in more than 25 countries. The CDC maintains
detailed health statistics and has in depth data and experience on the epidemics and
pandemics that affected the US during the last 100 years.
The Food and Drug Administration (FDA)
The FDA is an agency with the Federal Department of Health and Human Services.
The mission of the FDA is to protect public health by assuring the efficacy, safety
and security of human and veterinary drugs, biological products, medical devices,
also the food supply, cosmetics and materials with radioactive properties. The
agency is the primary regulatory body controlling the manufacturing, marketing and
distribution of tobacco products.
The FDA also seeks to improve public health through fostering industry innovation
that can make food and medicines safer, more effective, and more affordable. It
also provides science-based information the public on medicines and nutrition to
improve health.
The World Organisation for Animal Health (OIE)
The OIE is an international intergovernmental organisation founded in 1924 with
headquarters in Paris, France. It represents a total of 178 Member Countries and
Territories and acts as the primary intergovernmental organization responsible for
improving animal health.
5 PHARMA (2009), Pandemic Preparedness, Global Public Policy Issues, March 2009.

128
The Food and Agriculture Organisation of the United Nation (FAO)
The FAO is a specialised agency of the United Nations that leads international
efforts to combat hunger. It provides a forum for developed and developing
countries to formulate and debate policy and negotiate agreements on improving
agriculture, forestry and fisheries practices. Avian Influenza and other infectious
diseases form a significant part of the FAO agenda.
U.S. Agencies for International Development (USAID)
The United States Agency for International Development (USAID) is the United
States federal government agency primarily responsible for administering civilian
foreign aid. Its history is based on the Marshall Program after World War II and the
Truman Administration’s Point Four program. The agency itself was created by
executive order of President John F. Kennedy to implement development assistance
programs in the areas authorized by the Congress in the Foreign Assistance Act of
1961. An independent federal agency, USAID receives overall foreign policy
guidance from the United States Secretary of State and seeks to "extend a helping
hand to those people overseas struggling to make a better life, recover from a
disaster or striving to live in a free and democratic country6." It operates in Sub-
Saharan Africa; Asia and the Near East, Latin America and the Caribbean, Europe
and Eurasia.
US Federal Government First Response to H1N1 Influenza Pandemic
On 1 May 2009, the US Agency for International Development (USAID)
established the Pandemic Influenza Response Management Team – composed of
its Bureaus of Global Health and Democracy, Conflict and Humanitarian
Assistance – to coordinate the US humanitarian response to the H1N1 outbreak.
As of 18 May 2009, the US had provided more than USD 16 Million to assist
countries responding to H1N1 outbreaks. Primarily the CDC and USAID
conducted global responses by US agencies to H1N1, although the US Department
of Defence also provided some support to global aid. The CDC sent experts to
Latin America and the Caribbean to help countries there strengthen laboratory
6 USAID, Available from http://www.usaid.gov/about_usaid/

129
capacity and train health experts. The US Department of Health and Human
Service sent 400,000 treatment courses to Mexico, accounting for less than 1% of
the total American stockpile.
Investments made by the US and other stakeholders to prepare for a possible
Influenza pandemic and to monitor the spread of other infectious diseases were
applied to the most recent global response to H1N1. Although health experts have
made considerable gains against the disease, questions remained. Some health
experts were concerned that poorer countries would not have the capacity to
sufficiently monitor and respond to H1N1. Others warned that H1N1 transmission
might accelerate in winter. Questions remained about whether the disease could
change or undergo reassortant, particularly in countries simultaneously contending
with H5N1 bird flu cases (such as Egypt, Vietnam and Indonesia). The deadly
nature of bird flu could be catastrophic when combined with a strain supporting
faster transmission.
As of late June 2009, with the exception of the UK and Australia, all human deaths
from H1N1 had occurred in the Americas. Approximately 87% of all deaths
occurred in Mexico (49%) and the US (38%).
The Health Protection Agency (HPA)
The HPA plays a leading role in providing an integrated approach to protecting
health in the United Kingdom, in particular against infectious diseases and
preventing harm and reducing impact when hazards involving chemicals, poison or
radiation occur.
4.5 Timeline of the Disruption
On 21 April 2009, the CDC reported that two children in California had recovered
from a unique Influenza strain, which contained gene segments from swine flu
viruses. The children had not been in contact with pigs. Two days later, the CDC
reported five more H1N1 cases, three in California and two in Texas.
On 23 April 2009,human cases of the new swine flu Influenza A H1N1 virus were
officially confirmed in Mexico and the US. Officials issued orders to close schools
in Mexico City and begin a process of limiting public crowds. The CDC held its
first media briefing on H1N1 swine flu.

130
On 24 April 2009, the WHO announced an outbreak of H1N1 virus in Mexico and
the US. Mexico’s health ministry announced that a new strain of Influenza was
affecting the country, with just over 1,000 suspected cases. The Mexican
government also announced that it was closing schools and cancelling public
gatherings such as sporting events and concerts in Mexico City and surrounding
states until 6 May 2009. For example, football fans were forced to watch televised
games from the Aztec Stadium, which normally houses more than 105,000
spectators.
On 27 April 2009, the WHO raised its alert level to Phase 4.It announced that
health officials in Canada and Spain had reported human cases with no deaths. The
first two confirmed UK cases of pandemic Influenza were reported in a couple who
had returned to Scotland from Mexico. In the UK, ministers met for the first time
under the chairmanship of the then Secretary of State for Health.
On 29 April 2009, the WHO announced it was raising its alert level from phase 4 to
5. The first case in England - a schoolchild in Devon, was announced. The child’s
school was the first to be closed. Gordon Brown, the Prime Minister, announced to
the House of Commons that the stockpile of antivirals would be increased from
33.5 million to 50 million (covering 80% of the population).
On 11 June 2009, the WHO Director raised the pandemic alert level from Phase 5
to the highest level 6. This triggered advanced purchase agreements for vaccines,
which were in place between a number of governments and global and local
pharmaceutical firms. Dr. Chan characterised the virus as 'moderately severe',
although she warned the virus could become increasing virulent at anytime. Dr.
Chan emphasised that the shift reflected the spread of the disease rather than a
change in virulence.
As of 22 June 2009, the WHO confirmed more than 50,000 human cases of H1N1
in more than 80 countries and territories, including 231 deaths. On 15 September
2009, FDA approved H1N1 vaccines developed by major pharmaceutical
companies.
On 10 August 2010, WHO declared pandemic to be over and the world had
entered the “post-pandemic period”.

131
A full timeline of the H1N1 2009 Influenza pandemic is shown in Table 25.
Date The 2009 H1N1 Pandemic 2005 PHARMA Corporate Executive Team (CET) approves a global pandemic policy and plans
to address threat of Influenza.
2005-2009 PHARMA countries site/ functions develop individual pandemic preparedness plans addressing local needs and issues.
2006 PHARMA granted license to China to manufacture and sell Xtazo (API of Nicole) in China, Indonesia, Thailand, Vietnam and all least developing countries (LDCs)
March 2009 First reports of a novel flu virus in Mexico
28 March 2009 Earliest onset date of swine flu reaching the United States, according to the CDC. 21 April 2009 CDC reported that two children in California had recovered from a unique Influenza
strain, which contained gene segments from swine flu viruses. The children had not contact with pigs. Two days later, CDC reported five more H1N1 cases, three in California and two in Texas.
23 April 2009 CDC holds its first media briefing on H1N1 swine flu. Human cases of new swine flu Influenza A H1N1 virus were officially confirmed in Mexico and
the United States. Officials issue orders to close school in Mexico City, beginning a process of limiting public crowds. Three major soccer games around Mexico City close stadium gates to all fans the weekend of 25-26 April 2009, with games broadcast on television. Stadium closures continue through 2-3 May 2009.
24 April 2009 * This study defined this point of time as ‘the event’ in analysis.
The World Health Organisation (WHO) announced an outbreak of H1N1 virus in Mexico and the USA. PHARMA acknowledged swine flu cases that occurred in Mexico.
Mexico’s Health Ministry announced that a new strain of Influenza was affecting the country, with just over 1,000 suspected cases. The Mexican government also announced that it was closing schools and cancelling public gatherings such as sporting events and concerts in Mexico City and surrounding states through 6 May 2009, which was subsequently to all schools throughout the country.
25 April 2009 Director of WHO -Dr. Margaret Chan calls the flu problem “a public health emergency of international concern” PHARMA set up ‘Emergency Supply Chain Planning Nicole Ramp Up Plan Meeting’ with objective to ensure the supply chain is operating at maximum capacity.
26 April 2009 Health authorities step up vigilance measures around the world. PHARMA, Value Stream Leader appointed by President of Manufacture and Supply Chain (MSC) to be a head of Manufacturing and Supply Lead in responding to 2009 H1N1 outbreak.
27 April 2009 The WHO level to 4 having confirmed human-to-human transmission able to cause 'community-level outbreaks'. "Phase 4 indicates a significant increase in risk of a pandemic but does not necessarily mean that a pandemic is a forgone conclusion," says the organization. PHARMA created Pandemic Management Organisation Chart PHARMA increased frequency of the ‘MSC Executive Team Meeting’ to provide governance and guidance, now daily PHARMA setup ‘Crisis Management Team Meeting’ to bring the various workstations together to gain overview of pandemic. PHARMA increased frequency of the ‘Corporate Executive Team Meeting’, now daily.
Canada reports six cases of swine flu and Spain reports one. In the United States 40 people have flu confirmed. In Mexico 26 cases are confirmed, with 7 deaths resulting. Estimates for the true number of deaths hover around 80. First three cases are confirmed in Europe. In UK, the first two confirmed UK cases of pandemic Influenza were reported in a couple that had returned to Scotland from Mexico. Ministers met for the first time in the UK’s Civil Contingencies Committee (CCC), under the chairmanship of the then Secretary of State for Health. At that stage the information emerging from Mexico was worrying: there had been a total of 149 deaths from 878 reported cases (of which only 18 deaths were as yet confirmed to be H1N1). The UK Foreign & Commonwealth Office (FCO) advised against all but essential travel to Mexico.
28 April 2009 PHARMA Pandemic Rationing Team was set up. PHARMA distribute antiviral medicines to Mexico. The first cases in the Middle East. Seven countries are now reporting cases of H1N1 swine flu: the United States, Mexico, Canada,
New Zealand, the United Kingdom, Israel and Spain. 29 April 2009 The WHO raise pandemic lever alert to Phase 5, “a strong signal that a pandemic is
imminent”. First swine-flu death outside Mexico reported as a baby dies in Texas. The WHO confirmed seven
more cases in Canada; bring the total number to 13 cases.
Gordon Brown, the Prime Minister of United Kingdom announced to the House of Commons that the stockpile of antivirals would be increased from 33.5 million to 50 million (covering 80% of the UK populations). The first case in England was announced. The child’s school in Devon became the fist school

132
Date The 2009 H1N1 Pandemic to be closed.
30 April 2009 CEO of PHARMA gave the first speech to employees about H1N1 Outbreak. PHARMA start to ramp up Nicole production. “We already restarted manufacturing this week,
and it will grow every week over the next few weeks and months.” WHO adopts the term “Influenza A (H1N1)” after veterinary experts point out that the virus is not occurring among pigs. There had been 91 confirmed cases in the USA, with one confirmed death, while in Mexico there were 730 suspected cases, 26 confirmed cases and 7 deaths. At this point the virus appeared to be mild and self-limiting outside Mexico; the outbreak seemed likely to be less severe overall than the 1918-19 pandemic, although it had the potential to be worse than the pandemics of 1958 and 1968. In UK, ministers decided that there was no need, at that point, to advise the public against attending mass gatherings, to restrict domestic transport or to recommend mass closures of schools. Individual schools would take decisions in consultation with the Health Protection Agency (HPA) and the health protection services in devolved countries. Proposals to extend the sickness certification period to 14 days during a pandemic in order to reduce the strain on GPs were agreed in principle, but it was decided that there was no need to implement them at the current time. The H1N1 information campaign was rolled out on television, radio and in print media, with a booklet in preparation for household delivery. The Swine Flu Information Line was put into operation in United Kingdom. Austria, Switzerland and the Netherlands join the countries with confirmed cases. The agency also announces it would refer to the virus not as swine flu but as Influenza A (H1N1).
1 May 2009 The European regulators approved PHARMA antiviral facemask that the company had developed over the last two years. As of this morning, 331 cases of H1N1 have been reported in 11 countries. According to the worst outbreaks are still in Mexico (156 cases and nine deaths) and the United States (109 cases and one death). Started to conduct semi-structured face-to-face interviews with senior supply chain managers and executives.
2 May 2009 The virus makes its appearance in Asia. China (Hong Kong special administrative region), Costa Rica, Denmark, France, and the Republic
of Korea join the list. Total cases reported to the WHO are now at 658 in 16 countries. Canadian authorities announce that H1N1 has been detected in a swineherd in Alberta. The pigs
likely caught the virus from a Canadian who had recently visited Mexico, making this the first known case of human-to-animal transmission.
3 May 2009 Ireland and Italy each report one case. 898 cases are now reported. 4 May 2009 Colombia joins the club. There are now 985 cases in 20 countries. Mexico is up to 25 deaths, but
officials there say the disease seems to be on the decline. 5 May 2009 Mexico's H1N1 shutdown should begin to ease, with restaurants and cafes set to reopen. The latest say the virus has now spread to 21 countries. Mexico has reported 590 cases and 25
deaths while the United States has reported 286 cases and one death. However, the Texas Department of State Health Services has confirmed a second person has died in the United States. The DSHS says a woman with "chronic underlying health conditions" died earlier this week. The following countries have reported cases but no deaths: Austria, Canada, China (Hong Kong Special Administrative Region), Costa Rica, Colombia, Denmark, El Salvador, France, Germany, Ireland, Israel, Italy, Netherlands, New Zealand, Portugal, Republic of Korea, Spain, Switzerland and the United Kingdom.
MSC Pandemic Organisation Chart was created in order to explain which product line should be covered during the outbreak of H1N1.
6 May 2009 WHO swine flu cases in Sweden and Guatemala. 7 May 2009 Worldwide-confirmed cases are reported to be 2,371. 8 May 2009 Brazil reports four cases, bringing the number of affected countries to 25. Deaths now stand at 44
worldwide, with 2,500 confirmed cases. Most newly reported cases in new areas, the WHO says, come from travellers returning from affected areas. The CDC reports that hospitalization rates in the US are coming down, to 3.5%, as testing expands to include milder cases. The Harvard School of Public Health releases a poll in which 83% of Americans polled say they are satisfied with the waypublic health officials have managed the outbreak. Still, 48% of parents with children in school think they or a family member will come down with H1N1 in the next year.
11 May 2009 The WHO has swine flu deaths in Canada and Costa Rica, bringing the total number of countries where fatalities have occurred to four. Mexico has reported 48 deaths and the United States three. Worldwide, 30 countries have officially reported 4694 cases.
A modelling study in Science suggests that the virus spreads at a rate comparable to that of previous Influenza pandemics.
12 May 2009 The CDC that it is seeing some severe complications in cases of H1N1 in pregnant women, including one death in the US.
13 May 2009 As of this morning, 33 countries have reported 5,728 cases of H1N1 to the WHO. 18 May 2009 The day it that 8,829 H1N1 cases have been reported in 40 countries, the WHO has cautioned

133
Date The 2009 H1N1 Pandemic against complacency. “This virus may have given us a grace period, but we do not know how long this grace period will last, “WHO director general “No once can say whether this is just the calm before the storm.” However, the pandemic alert level is still at five today, one level below a full pandemic.
20 May 2009 WHO says that H1N1 has officially contaminated 10,243 in 41 countries and killed 80 people worldwide.
22 May 2009 Australia raises its alert level to 'Contain', even as the Mexican government relaxes its restrictions in Mexico City.
27 May 2009 A New England Journal of Medical article, in response to suggestions that the WHO evaluate its criteria for moving to Phase 6 and declaring a pandemic, that "the global extent of a pandemic should be described objectively and should be just one factor in decisions about how to respond."
31 May 2009 PHARMA received approval of Nicole Capsule Inhaler 1 June 2009 The FDA has approved PHARMA antiviral facemask for use in the United States.
June opens with 17,410 cases reported in 62 countries, including newbie’s like the Bahamas and Estonia. The death toll in Mexico stands at 97. In the US there are or have been cases in all 50 states, including 17 deaths, according to the CDC.MedImmune, a biotechnology firm in Gaithersburg, Maryland, wins a USD 90 million contract from the federal government to begin developing a live attenuated vaccine for H1N1.
2 June 2009 The WHO says it is closer to moving its pandemic alert status to Phase 6, which would denote official global pandemic status.
3 June 2009 H1N1 has reached Africa. The WHO has a case in Egypt. Cases in Australia stand at 501, the largest number outside of the Americas. A report Euro surveillance estimates a reproduction number for the virus – the average number of secondary cases generated by a single primary case – of 2.3 in Japan, higher than estimates from elsewhere. The CDC’s Morbidity and Mortality Weekly Report suggests that the outbreak in Mexico may have peaked in the late April.
8 June 2009 The WHO adds a death in the Dominican Republic to its list, bringing the number of countries that have reported deaths to six.
9 June 2009 The WHO reports that Inuit communities in Canada may be particularly hard-hit. It continues to face questions as to why a full-blown pandemic has not been declared.
11 June 2009 Pandemic is declared! WHO Director – General Margaret Chan raised the pandemic alert level from Phrase 5 to Phase 6, which is the highest level. The world is a full-blown Influenza pandemic for the first time in 41 years. This triggered the advance-purchase agreements for vaccine. Dr. Chan characterised the virus as ‘moderately severe’, though she warned the virus could become increasing virulent at anytime. Dr. Chan emphasised that the shift reflected the spread of the disease but not signal a change in virulence.
14 June 2009 The first swine flu death in Europe has been reported. A woman in Scotland who died with H1N1 had "underlying health conditions", according to the Scottish government. This is the first death outside the American continent.
19 June 2009 South Africa confirms its first case of swine flu - officially marking the disease's spread into sub-Saharan Africa.
22 June 2009 Chinese state news source Xinhua reports tests have begun on the first H1N1 vaccine developed in the country.
24 June 2009 Argentinian authorities report that a pig at a pig farm in Buenos Aires province has tested positive for the novel H1N1 strain, making it only the second known swine infection outside of Canada.
29 June 2009 Denmark reports the first case of resistance to Abaco, considered to be the most effective treatment for the flu by the WHO. The virus continues to spread throughout the world with 11,000 new cases in three days.
2 July 2009 Japan’s health ministry reports that it too has detected a case of Abaco resistant H1N1. The UK moves its swine flu response from ‘containment’ to ‘treatment’. ‘Our national focus should be on treating the increasing numbers affected by swine flu,” says health minister Andy Burnham.
8 July 2009 WHO says the three incidences of drug resistant H1N1 to date are "sporadic cases" of resistance. "At this time, there is no evidence to indicate the development of widespread antiviral resistance among pandemic H1N1 viruses."
16 July 2009 WHO changes reporting requirements for H1N1 and abandons issuing global tables with numbers of confirmed cases for all countries. It notes that the increasing number of cases "is making it extremely difficult, if not impossible, for countries to try and confirm them through laboratory testing".
17 July 2009 The WHO says that the swine flu pandemic is moving around the globe at an “unprecedented” speed.
22 July 2009 PHARMA distributed antiviral medicines to all UK employees. PHARMA confirmed that it had contracts in place to supply 195 million doses of its pandemic (H1N1) 2009 adjuvanted Influenza vaccine and had a variety of agreements in place with the US Government to supply pandemic products worth USD 250 million. Since that date, nine government contracts have been signed for a further 96 million doses of the vaccine. This now brings the total number of doses ordered for PHARMA’s adjuvanted vaccine to 291 million. Two Australian companies say they have started human trials of their swine flu vaccines.
28 July 2009 The death of a 22-year-old university student in South Africa marks the first death in sub-Saharan

134
Date The 2009 H1N1 Pandemic Africa. Confirmation of H1N1 as the cause comes 3 August.
29 July 2009 Researchers from the US Centers for Disease Control and Prevention warn that pregnant women "might be at increased risk for complications from pandemic H1N1"
31 July 2009 PHARMA had executive after action review meeting
3 August 2009 India confirms first death from H1N1, the victim being a 14-year old girl in the city of Pune. 14 August 2009 PHARMA commenced the clinical development programme for its adjuvanted pandemic
vaccines. 21 August 2009 Healthy victims of swine flu should not routinely be given antiviral drugs, the World Health
Organization. The total UK death is 60. 10 September 2009
Two papers published in the New England Journal of Medicine show two new vaccines against H1N1 are likely to be effective after just one dose. "The obvious advantage of a one-dose schedule is that, in the current time of vaccine scarcity, it doubles the number of people who may be vaccinated with a fixed amount of vaccine," writes Kathleen Neuzil, of PATH, in an accompanying editorial. "On the basis of these data, it would be appropriate to begin vaccination with the use of one dose of the usual antigen content."
15 September2009 FDA approves four H1N1 vaccines, from major pharmaceutical companies. 25 September 2009
European Committee for Medicinal Production for Human Use (CHMP) has issued a positive opinion and recommends approval of PHARMA’s candidate pandemic adjuvanted vaccine.
30 September 2009
Australia begins mass H1N1 vaccinations.
1 October 2009 The four health ministers in the United Kingdom heard that the PHARMA vaccine had been licensed for those over six months and for pregnant women. Ministers agreed to double existing ECMO capacity in line with broader policy on critical care capacity.
8 October 2009 The JCVI reconfirmed its previous advice of 7 August concerning the priority groups for vaccination. Once all those in the priority groups had been offered vaccination, it should be offered to the healthy population. The JCVI advised that a single dose of (the PHARMA H1N1 adjuvant vaccine) should generally be sufficient for those aged 10 and above, although two doses would be required for the immunocompromised and those below 10 years would require two half-doses of vaccine. While PHARMA’s rivals vaccines required two doses for treatment in all groups.
18 October 2009 This week Mongolia, Rwanda, and Sao Tome and Principe issue first reports of H1N1 and Iceland, Sudan, and Trinidad and Tobago reported their first deaths.
21 October 2009 In UK, vaccination program begins: front-line healthcare workers and their patients who fall into at-risk categories.
25 October 2009 This week: vaccinations get underway in many European countries. 29 October 2009 The total UK deaths are 137. 30 October 2009 Strategic Advisory Group of Experts (SAGE) on Immunization issues vaccination advice to the
WHO, including use of a single dose of vaccine in adults and adolescents and use of any licensed vaccine for pregnant women. 27 October 2009: Russian media reports the country's first H1N1 deaths. PHARMA distributed the first vaccine to their employees; PHARMA biological and MSC staffs only.
1 November 20 09 WHO reports that more than 199 countries and overseas territories have laboratory confirmed cases of H1N1, with over 6,000-recorded deaths.
10 November 2009
US FDA approved PHARMA’s pandemic H1N1 adjuvanted vaccine. PHARMA announced to donate 50 million doses of its adjuvanted pandemic H1N1 Influenza to WHO for distributing to developing countries.
19 November 2009
China says it has dispatched monitoring teams to 12 regions after a high profile doctor suggested some cases of H1N1 might be being deliberately not reported. After around 65 million people have been vaccinated, the WHO says H1N1 vaccines appear to have an "excellent safety profile". None of the deaths investigated in those vaccinated have found a direct link to vaccination.
23 November 2009
PHARMA H1N1 vaccines have been distributed to countries globally for use in government-initiated vaccine programmed.
8 December 09 A review in the BMJ warns that there is insufficient evidence for or against using neuraminidase inhibitors (Nicole and Abaco) for preventing Influenza complications. An accompanying editorial says, "The review and a linked investigation undertaken jointly by the BMJ and Channel 4 News cast doubt not only on the effectiveness and safety of Osolia (API of Abaco) but on the system by which drugs are evaluated, regulated, and promoted."
27 December2009 The WHO says over than 208 countries, territories and communities have reported H1N1 cases, including "at least" 12,220 deaths.
2 January 2010 China's ministry of health confirms there have been 659 deaths from H1N1 in the country as of 2 January. A spokesman warns of "the danger of an explosion of outbreaks in some places".
14 January 2010 The four health ministers agreed to suspend deliveries of the PHARMA H1N1 adjuvanted vaccine from 16 January and to enter into negotiations with the supplier over terminating the contract. A variety of options were considered for managing the pandemic flu vaccine stockpile, including donating or selling vaccines to pharmacies, private companies or other countries.
26 January 2010 The WHO defends itself against allegations it overhyped the dangers of H1N1 under pressure from vaccine manufacturers at a hearing of the Council of Europe's health committee.

135
Date The 2009 H1N1 Pandemic
"Let me state clearly for the record. The Influenza pandemic policies and responses recommended and taken by WHO were not improperly influenced by the pharmaceutical industry," says Keiji Fukuda.
18 March 2010 342 deaths in England related to H1N1 had been recorded 69 in Scotland, 28 in Wales and 18 in Northern Ireland, giving a UK total of 457.
1 April 2010 Antiviral medicines were no longer available from national stockpile, and antiviral collection points in England were closed. The Swine Flu Information Line also closed, and treatment of people with flu-like symptom returned to business as usual, with people advised to contact their GP.
10 August2010 The WHO declared pandemic is over. The world has now entered the “post-pandemic period”.
11 April 2011 PHARMA welcomes key agreement coordinated by the WHO on a framework to support global preparedness for a future Influenza pandemic.
Table 25: Timeline of the 2009 H1N1 Pandemic
Source: Adapted from PHARMA report
UK and the H1N1 Influenza pandemic
The virus reached the UK in April 2009.The first cases were confirmed on 27 April
2009 in passengers returning from Mexico. As mentioned above, the government
began closing schools after the first case of person-to-person transmission within
the UK was announced on 1 May 2009. The first death attributed to H1N1 in the
UK occurred in Scotland (reported on 14 June 2009).
The UK had been preparing for Influenza pandemic for some time. The possibility
of the emergence of an avian virus such as H5N1 was of particular concern and
provided a reason for the UK government to stockpile antiviral medicine.
The arrangements of the UK’s current central government crisis management had
been in place since 2002 and had been tested in various crises and exercises. The
pre-pandemic planning, set out in Pandemic Flu: A National Framework for
Responding to an Influenza Pandemic, ensured that many decisions had already
been made in principle prior to the pandemic and that key personnel had the
opportunity to work together. The Department of Health and the Cabinet Office
jointly published this plan in November 2007 and it formed the basis for the 2009
pandemic response.
On 29 April 2009, the Prime Minister announced to the House of Commons that
the stockpile of antivirals would be increased from 33.5 million to 50 million
(covering 80% of the population).
After a slow start, the virus spread rapidly in the UK during July 2009, with new
cases peaking at 110,000 in the last week of that month, according to the Health
Protection Agency's modelling estimate, but declining sharply in the first week of

136
August 2009. Cases fell progressively down to 3,000 in the first week of September
2009, and then began to rise again. The decline in cases during the summer had
been predicted, but a large surge was expected in the autumn to coincide with the
normal flu season. New cases rose to 84,000 for October, well below the summer's
peak and then declined during November.

137
Chapter 4 Findings: PHARMA Response during the H1N1 Influenza Pandemic
This chapter examines the response of a major pharmaceutical in the face of the
global outbreak of H1N1 Influenza virus, where the eventual outcome was
unknown and major investments and strategic decisions about its supply chain had
to be made. The challenges faced by PHARMA are discussed including financial
and product pricing issues. PHARMA’s response is outlined, structured along the
dimension of the 3D time-based framework.
The initial coding and categorization is of the PHARMA data is then presented,
from open, axial and selective coding stages of analysis. The process of constant
comparison was employed to confirm preliminary categories. The goal was first to
compare selected data to each other to gauge similarity and dissimilarity, and to then
compare additionally to potential categories, assessing whether the data was
consistent or inconsistent with the initial coding structure consisting of
approximately 110 codes.
Theoretical saturation of the core categories and related concepts was done through
new interviews and questions to the original participants. Through a process of
theoretical sorting, memos from the data were related and integrated to the
emerging structure. Theoretical codes, and patterns relating the codes and the
factors of the company response in dealing with disruption, are described.
Finally, the four preliminary core categories and 18 subcategories of response time
are described, which will be validated with the BP disruptions as is described in the
subsequent chapters.
Table 26 below illustrates application of Grounded Theory methodology in this
study

138
Phase Description This study Output
Ph
ase
1
Res
earc
h de
sign
Step 1 Preparation Preliminary literature review: Time-Based Management and Response - Time Based Risk Management Framework (Sodhi & Tang, 2009).
General research problem – What factors underlie companies’ time response to supply chain disruption?
Step 2 Case selection Selected PHARMA for a study of their response to H1N1 Pandemic. Chose two disruptions from BP to validate the finding from PHARMA.
1. PHARMA 2. BP Deepwater Horizon 3. BP Texas City
Ph
ase
2
Dat
a co
llect
ion
and
data
or
deri
ng
Step 3 Develop rigorous data collection protocol
Data gathering from: semi-structured telephone and face-to-face interviews, direct observation, participant-observation (meeting and conference calls), archival records and documentation from internal (report, presentation) and external sources (news, press).
Interview guides and inventory of available data sources.
Step 4 Entering the field Data gathering through company visit. Interviews with senior supply chain managers and executives.
Transcripts and data.
Step 5 Data ordering Arraying events and information chronologically to facilitate easier data analysis.
Collated data.
Ph
ase
3
Dat
a an
alys
is
Step 6 Analysis data Open coding Axial coding Selective coding Memoing
Developed concepts from PHARMA data through coding. Preliminary core categories were established. Relationship between categories and subcategories were developed. Core categories were integrated to build theoretical framework. Write-up of ideas about codes and their relationships; this is an on going process from data analysis through completion of the study.
Approximately 110 codes, 18 subcategories and preliminary 4 core categories were established. Memos.

139
Table 26: Application of Grounded Theory Methodology in This Study
Phase Description This study Output
Ph
ase
3
Dat
a an
alys
is
Step 7 Theoretical Sampling
Determine where to find additional data to develop the emergent theory. Re-interview original participants and complete additional interviews until no new properties or aspects could be identified.
Defined scope and saturation of categories.
Step 8 Constant comparison
Compare new to previous interviews and compare events to other sources of information for similarities and differences.
Step 9 Theoretical Saturation
Saturation is reach when further data gathering and analysis from PHARMA added little to the conceptualisation.
Saturated core categories 1. Preparation 2. Partnership 3. Organisation 4. Reserve
Step 10 Theoretical sorting memos Theoretical coding
Memos, which have been written since data analysis phase, were sorted theoretically and four propositions are derived from the findings.
Four propositions and Emergent Theory
Ph
ase
4
Lit
erat
ure
com
pari
son
an
d w
rite
up
Step 11 Integrating the literature
Compare emergent theory with extant literature (comparisons with conflicting or similar frameworks)
Step 12 Validation of theory Validation the emergent theory using two disruptions from BP: Deepwater Horizon Oil Spill and BP Texas Refinery Explosion. Iteration back to step 2 for data collection and data analysis to check theoretical fit, relevance, workability and modifiability.
Confirmed core categories – Factors underlying response time.
Step 13 Write up of theory Writing research report. This document.

140
5.1 The Disruption
Prior to the 2009 Influenza outbreak, the World Health Organization evaluated the
growing probability that a major flu pandemic could be approaching. The previous
pandemic occurred in 1968. WHO Director Margaret Chan assessed that Influenza
pandemic to be a unique type of event7. It is “impossible to anticipate when the
next pandemic might occur or how severe its consequences might be…on average,
three pandemics per century have been documented since the 16thcentrury,
occurring at intervals of 10-50 years8." The World Bank estimated that a new flu
pandemic could kill more than 70 million worldwide with worst-case fatalities up to
260 million (Osterholm, 2005)9. For every death, many more would suffer from
mild or severe symptoms. The direct and indirect effect on the population could
trigger a major recession of the global economy costing more than USD 3 Trillion.
Lower global domestic productivity would drop by 4.8 percent, a result of lower
tourism, transportation and retail sales as well lower productivity and employee
absenteeism 10 . In this context, PHARMA's response played a crucial role in
reducing the impact of a possible pandemic.
Pandemics are by nature unpredictable but also unavoidable. Transmission rates
and virulence of the Influenza strains vary greatly, from the widespread seasonal flu
to the historical Spanish flu in 1918 that killed over 50 million people. Hence
declaration of a pandemic put PHARMA in a challenging situation: not only was its
production of medically and business critical drugs potentially at risk, but the world
would be watching closely how such a market-leading (and profitable) corporation
met the exploding demands for antiviral medicines.
Based on PHARMA Corporate Executive Team workshop in 2009, Influenza
pandemic was thought to be one of the most significant risks facing PHARMA
(Table 2). On its five-by-five risk matrix, PHARMA scored the likelihood of a
pandemic as ‘2’ two – ‘unlikely to happen’ (every 5-10 years) and impact of it as ‘5’
five – catastrophic. PHARMA uses a conservative approach, selecting a higher
7 Margaret Chan, DG WHO address to the Pacific Health Summit, Seattle, Washington, 13 June 2007 8 In-Pharma (2006) 9 Osterholm, M.T. (2005) 10 Burins et al, (2008)

141
matrix input where the best estimate falls into a range overlapping two possibilities.
Multiplying the two inputs on the PHARMA risk scale gave a total score of ten,
which put the recommended response at level three – increase mitigation or
strengthen the contingency plans.
The manufacturing and supply BCP leader concurred: the company is not able to
reduce the likelihood of a pandemic and must focus on reducing the impact of the
event through its contingency plans.
“So the mitigation plan can’t reduce the frequency of the event ... But by designing the supply chain, we can reduce the impact. And we can probably reduce that impact from a catastrophic event to a moderate event. The contingency plan introduces how we set our supply chains up to be flexible, how we had business continuity plans for every other site, .how we issue antivirals to staff. These were all our contingency plans to reduce that effect from catastrophic. And the whole pandemic crisis management was a way of controlling that event.”
Manufacturing and Supply BCP Lead
An Influenza pandemic could trigger risks across of PHARMA internally as well as
externally. Mitigating one risk can end up exacerbating another risk in some
business area (Chopra and Sodhi, 2004):
“The pandemic triggered all those risks. Risk that R&D will not deliver a commercially successful product - this involved our new product in capsule inhaler device, weakness of intellectual property protection in certain countries which was challenge in the emerging market, sales and market regulations, regulatory controls, risk of interruption of product supply and global political and economics conditions.”
Manufacturing and Supply BCP Lead
Given the evolving situation, the first challenge was to understand what factors
drove WHO to declare a pandemic so quickly, or more importantly, what that
meant in actual opportunity, risk and required decision making for swift response.
Swine-flu impact on world health was catastrophic in the worst-case scenarios; at
the same time, early scientific review hinted at a milder form of Influenza. Potential
evolution of the strain during the next flu season, as well as possible resistance to
PHARMAs antiviral treatments, meant vigilance was required and supply chain
response had to be managed under considerable uncertainty.
PHARMA had immediate supply challenges as the company had recently stopped
API production and was reducing secondary packaging as the rate of commercial
orders was dropping in the first quarter 2009. Demand rose dramatically after April

142
27th as governments reviewed their preparedness plans and placed forecasted
abnormal demand on the two suppliers of H1N1 antivirals.
“With sudden increased demand from many countries, there was clearly not enough product available. Annual demand typically means 60 million treatment doses, and PHARMA had only three million devices on hand since we have stopped production. Within a day, the government asked for an immediate additional 32 million additional doses, which we would normally take six months of production.”
Manufacturing Strategy Manager
Allocation of limited stock was as much a political process as commercial –
governments and press can create reputation risk irrespective of the ethical
commitments PHARMA fulfils.
Expansion of capacity required evaluation of a broad portfolio of techniques:
expanding too soon created investment risk, with millions of Pounds of cost taken
on to prepare for rapid ramp-up in production. Expanding too late meant missing
commercial opportunity but also put lives – tens of thousands of lives – at risk.
Expanding production too broadly using internal capacity created production risk
on other critical drugs; external expansion through licensing could create
downstream intellectual property and marketing challenges in growth markets.
Underlying these challenging supply circumstances, there are pressures on
compliance and quality standards. PHARMA has a well-established quality
management system, high compliance standards and culture. These standards are
fundamental to the PHARMA culture and maintained throughout the supply chain
expansion.
Apart from production sites, PHARMA faced challenges in terms of assuring
continuity of the internal organization and external suppliers. Protection of
employees – medically and in terms of ability to adapt to changing requirements and
be able to continue to work – was critical. Clarity of communication and decision-
making was also important, as PHARMA has to respond to this situation quickly.
As well as restarting and expanding Nicole supply capability, PHARMA had to look
at other business critical products, e.g. large revenue generating products.
PHARMA must consider its business objectives, along with supporting global
humanitarian response. PHARMA also needed to closely look at assuring
production and distribution of 32 medically critical products. These were defined as

143
products that are critical to patient survival that are made uniquely by PHARMA: it
could be fatal if the product was not available and PHARMA must assure that
sufficient stock is locally available.
For example, Hematol is a business critical product: it generates significant revenue
to PHARMA.
“Not only do we need to restart, maximise and expand Nicole production and develop and manufacture the Vaccine but this must be achieved not at the expense of other business critical and medically critical products to protect the lives of millions of patients who rely on these products and protect the ongoing financial security of the company.”
Manufacturing and Supply BCP Lead
PHARMA culture is risk averse, having built capacity, triple sourcing and resilience
into its Nicole Supply Chain as part of supply chain risk mitigation. The company
also sees itself as excellent in responding to crisis situations in the view of the
Manufacturing and Supply BCP:
“As well as our approach to risk management we thrive on reacting to crisis situations. This is where our values of empowerment and collaboration come to the fore and the whole organisation aligns itself to support the challenge.”
Manufacturing and Supply BCP
Financial Challenge
PHARMA invested substantially in R&D in preparing for Influenza pandemic and
in this 2009 pandemic, PHARMA publically committed itself to support the
governments and international authorities.
These risks and challenges in facing the H1N1 Influenza presented PHARMA with
a unique opportunity; today PHARMA sees itself better positioned to react far
more quickly in the likely, but unpredictable, even of the next pandemic.
Financial risk in the pharmaceutical industry is significant in terms of both the long-
term investment required and the possible failure to capture revenue or market
share from events such as the Influenza pandemic.

144
“The company has spent USD 2.5 Billion over the last seven years preparing for this situation. PHARMA has been planning for a pandemic for three-and-a-half years and has spent more than GBP 1 Billion to ensure its factories could crank up production at short notice.”
CEO of PHARMA
This investment in the Nicole supply chain and R&D must be matched by an
appropriate return, which in turn can have an impact on prioritisation and pricing.
PHARMA sales are publicly reported with and without pandemic products. In the
first six months, PHARMA's global revenue grew by only 1% without this category;
however, it was boosted 6% (GBP 14.4 Billion) in the April–June quarter between
2009 and 2010. The majority of this sales increase in Q1 was because of Nicole and
the H1N1 vaccine.
PHARMA is a commercial organisation, however, it must also respect perceived
ethical constraints; as a global pharmaceutical company, public trust is essential and
production decisions are based on factors in addition to profitability. Investment
policy in Influenza-related medicines can affect large populations as well as small
numbers of patients needing critical, immediate care, such as in intravenous
formulations: “ We committed significant money and resources into developing an
intravenous (IV) dose form, but we'll only sell 5000 doses. We'll save the lives of
5000 people and we won't make any money on it. But if you were desperately in
hospital ….So this will save people from dying.”
According to a BMJ article in 2010 (340L 2385), the CEO of PHARMA denied
accusations that the company profiteered during the swine flu crisis. Last year,
PHARMA made a pre-tax profit of more than GBP 8.5 Billion.
Pricing Challenge
PHARMA manufactures a portfolio of antiviral medicines and related medical
supplies. As such, its pricing policy extends across the portfolio. Pricing policy on
preventative vaccines developed after the start of the outbreak attracted particular
attention. In an interview on the BBC’s World Have Your Say programme on 26
April 2010, the CEO denied that the company had "charged the whole world" for a
vaccine that may not have been necessary.

145
"PHARMA charged a very reasonable price for the swine flu vaccination, the same price we charge for regular seasonal flu. We did not charge a special crisis price."
Manufacture Strategy Managers
Nevertheless, the revenue opportunity presented by the pandemic response was
significant. According to the Guardian newspaper on 10 January 2010, the swine flu
boosted PHARMA's revenues by GBP 1 Billion. CEO stated that the “company
has worked hard to come up with a vaccine and that it would be foolish to deny
that events like these aren’t good for business.”
CEO of PHARMA said that the company had been there when it was needed by
governments around the world to help them cover their risks of swine flu and the
products that PHARMA had supplied will help with future crises.
"More importantly, the medicines and vaccinations that we have manufactured and sold are able to be held in stockpiles. For example, the Nicole flu treatment has a shelf life of seven years so governments now have that in stock for future use, and even our vaccine has a technology which will allow at least a piece of that vaccine to be used against other potential flu strains in the future."
CEO of PHARMA
Among others, PHARMA used two mechanisms to manage both commitments to
customers and supply chain capacity, namely price and stock allocation. Early in the
response to the crisis, when Nicole orders exceeded stock by a factor of 20, a
mechanism for prioritisation was developed for stock allocation. Nicole pricing
policy also has political visibility: accordingly, richer countries were charged higher
prices than were poorer countries. Reports of individual consumer pricing showed
the same differential mechanism existed within certain markets.
5.2 Overview of PHARMA Response
In dealing with H1N1 pandemic, PHARMA faced the interdependence of a wide
range of issues: production, supply chain constraints, commercial objectives,
licensing, external supplier, product design but also politics and speculation on the
spread and severity of the pandemic itself. Underlying these issues is the need for
speed in response – all aspects were changing quickly and were unpredictable;
PHARMA had to respond quickly to changing conditions to contain the risk, to
serve an urgent and unmet patient need and to capture the revenue opportunity.

146
Following Sodhi & Tang (2009), I consider the respond in terms of
D1 – Detection of the event
D2 – Design of a solution, and
D3 – Deployment of the solution in response.
D1 - Detection of the Event
In the late March 2009, Mexico began to register cases of a stronger than normal
Influenza virus in Mexico City. On 21 April 2009, the Centers for Disease Control
and Prevention (CDC) also reported that two cases of febrile respiratory illness in
children in southern California had been caused by infection with genetically similar
swine Influenza A (H1N1) virus. The viruses contained a unique combination of
gene segments that had not been reported previously among swine or human
Influenza viruses in the United States or elsewhere.
The outbreak became visible to PHARMA on 24 April 2009 after being reported on
various newswires and the WHO officially announced the outbreak of H1N1 virus
in Mexico and the USA.
PHARMA was able detect the event and had their first steps in place in a short time
after the event occurred. Two elements which helped PHARMA detect the event
early were first, having a good monitoring system and second, by regularly
conducting preparedness and stress testing.
D2 – Design of a Solution
PHARMA took immediately action to respond to the declaration of the outbreak
by the WHO. Numbers of step has been implemented to organise its internal and
external responses to the outbreak and eventual pandemic. At the outset, the flu
outbreak was seen to have a potentially dramatic impact on the ability of PHARMA
to manufacture critical medicines as well as strong reason to ramp up the
production and distribution of antivirals.
The first initial steps that PHARMA design to respond to the event are: increase the
frequency of senior executive governance meetings, assess the existing pandemic
preparedness plan, establish an integrated response team and create a new

147
organization chart to reflect emergency roles and responsibilities. This enabled
PHARMA to then quickly move toward design and assessment of appropriate
supply chain response in antivirals and related medicines.
The next step in PHARMA's response addressed the challenges of rapid supply
chain for the antivirals and related medical supplies that help treat the symptoms of
an existing infection. This is the focus of the PHARMA case study in this paper.
Once the H1N1 strain was identified and isolated, PHARMA was able to adapt its
Influenza-related portfolio of preventative vaccines and vaccine production
technology. Research by government, industry and academic continues to pursue
development of vaccines that can fit a broader range of Influenza strains and can be
put more rapidly into production.
At the first indication of a new Influenza strain, PHARMA executives quickly took
action to prepare for a possible pandemic. Such events were seen as rare but quite
possible, even probable over time. The potential impact was entirely uncertain in
both the speed with which it spread and its mortality. Preparedness plans, which the
company had in place, were based upon WHO guidance about the spread and
mortality of the pandemic. Events proved to be very different from this original
guidance. The first reported cases were severe and the upper estimates of scientific
community and popular press on mortality called for urgent action. Press reports
predicted tens of thousands of deaths in the UK alone during the summer of 2009.
Given the uncertainty, PHARMA prepared its organization to better make and
execute informed decisions, adding scientific know-how and other disciplines to a
purpose-built Pandemic response team. The activation of previously prepared
pandemic response plans required an update of communications as well as role and
responsibilities, given the organizational and staffing changes from recent fine-
tuning of regular supply chain operations. Daily monitoring by PHARMA
executives and supply chain managers allowed decision making to closely track the
evolving pandemic storyline. Frequent communication with employees and internal
sites across the globe as well as government agencies and the press allowed
PHARMA to maintain the confidence of its workforce and the public that were
both hungry for information on what was an essentially unpredictable situation.

148
With governance for crisis response in place, PHARMA could begin to address the
sudden flood of requests for antivirals from governments around the world. Key
medicines were in limited production and stockpiles of antivirals were a fraction of
what was requested. A proportional response was developed to best allocate
existing stock and new production, reflecting the urgency based on growing case
information and input from health and other governmental organizations. A fair,
tiered pricing structure was developed as well to reflect the ability of a country to
afford the necessary medicines. PHARMA was, in the words of one supply chain
executive, ‘not a charity’, but ‘would never say ‘no’ where lives were at stake’.
PHARMA produces a wide portfolio of critical medicines and other drugs;
employee health and labour availability was at risk and could affect not only the
pandemic response but overall supply chain performance. Plans were made for
absentee rates that could exceed 50%. Accordingly, PHARMA took steps to assure
management was focussed in country and that employees had access to antivirals as
soon as was deemed necessary.
PHARMA had to consider a broad range of existing and new techniques for
meeting the sudden demand, and preparing for a much higher requirement should a
second pandemic wave hit in the Northern Hemisphere autumn flu season.
Primary capacity was shifted and expanded in a balanced manner from other large-
volume, critical drugs across multiple production sites to reduce the secondary risks
from the dramatic spike in antiviral production. Moving to round-the-clock
production was possible with external, temporary staff taking on less-skilled steps
and carefully allocating internal skills. With additional key supplies and materials put
in place, PHARMA could move to dramatically higher monthly production in just
12 weeks from the sudden declaration of the pandemic.
“After the outbreak in April, we are beginning to receive orders from governments again, and we will start engaging with those governments on what the supply and delivery schedules can look like for Nicole…A tremendous amount of work is being done on Nicole in terms of ramping up our short-term production capability, and the MSC has worked ceaselessly in the last week on this issue.”
Demand Operation Manager
Additional options were explored to accelerate ramp up and maximise production
including postponement of country-specific product packaging configuration,

149
essentially a ‘vanilla pack’ that was easier to produce and ship globally. By shifting
production between sites, moving to round-the-clock shifts, and various other
supply chain improvements, production of Nicole could be increased from a
maximum annual capacity of 60 million doses to 90 million. Government approval
of a new, simpler dose delivery format – already designed and ready for
manufacture – was accelerated by having pandemic contingency plans in place in
agreement with key health authorities. Voluntary licensing for manufacturing in
China allowed PHARMA to expand the global supply capability with a single dose
delivery device to meet a predicted increase in demand from emerging market
countries where there was a potentially huge patient base. With the new delivery
format, PHARMA could attain a 300% increase for a total capacity of 190 million
doses. PHARMA was able to quickly bring additional pandemic healthcare supplies
such as an antiviral mask to limit the spread of the infection and meet the increased
demand of other medicines triggered by Influenza cases.
PHARMA was able to assure rapid response at all stages of a pandemic, able to
deploy antivirals and ‘pre-pandemic’ vaccines that can be deployed early before a
fully matched, new vaccine becomes available. The new Influenza strain was shown
to have some resistance to competitors’ drugs, increasing the opportunity to
PHARMA and reinforcing its potentially critical role in the pandemic if the strain
evolved further resistance. Its response had to reflect changing insight and evolving
government policy in major markets:
"Pandemics by their nature are unpredictable and we recognise that governments’ needs are changing. We are committed to finding solutions for governments changing their immunisation programmes and to fulfilling recent new orders."
CEO of PHARMA
Ultimately the mortality was lower and while the Influenza strain sadly claimed the
lives of more than 45,000 worldwide – and continued to be responsible for deaths
each week, PHARMA was able to rapidly meet the overall demand for antivirals
and later for flu vaccines. What was, in fact, a real crisis facing its supply chain, was
at the same time a unique opportunity to tailor and expanding existing strategies
and decision making structures in the likely but unpredictable event of future
pandemics. It was finally “Good for PHARMA”, contributing to its profit and
reputation as a leading global manufacturer.

150
D3 – Deployment of the Solution
PHARMA had a number of production solutions in place but not yet activated.
After the event occurred, PHARMA was able to update, tailor and quickly
implement pre-existing plans, shortening design lead-time and assuring faster
deployment. In the following discussion, the preparation is reviewed relative to its
impact on deployment lead-time.
The timeline of the pandemic response is shown in Figure 18. In this study, the date
24 April 2009 is defined as ‘the disruption event’ for purpose of analysis. (See also
the detailed of the event in Table 25 in Chapter 4.)

151
Timeline of PHARMA Response to the H1N1 2009 Pandemic

152
Figure 18: Timeline of PHARMA Response to the 2009 H1N1 Pandemic

153
5.3 Coding and Categorisation of PHARMA Data
This section reports on the analysis of the data collected from interviews, internal
documents, direct observation and media in PHARMA case using the Grounded
Theory method. It illustrates on how PHARMA solved the challenges mentioned in
section 4.6 in detail by leveraging contingency plans and enhancing the company’s
performance by its response. Analysis was performed a systematic and iterative
approach with constant comparison of data, as described in Methodology (Chapter
3).
In addition to the process of coding, interviews were recorded and summarised.
Those interviews, which could be taped, were transcribed verbatim. For interviews
in which the recording device was not allowed, interview notes and memos were
written from memory. In conjunction with a constant comparative method of data
analysis in keeping with Grounded Theory method, the process of constant
comparative analysis was continually rechecked and memos were written
throughout the research to assist with theory development.
Dissimilar data was not discarded as it was significant in the analysis and was used
where similar and dissimilar data appeared as separate codes within categories. Later
in the study this data was also used to identify properties of categories and links
between sub-categories and core categories.
During analysis of the second and subsequent interviews, the data was constantly
compared with the prior interviews to highlight the similarities and difference
response to the events and areas of interest. Similar data is grouped together to
form codes. Codes were grouped into analytic concept or categories according to
Charmaz (2006). Though the analytic questions, based on the time-based response
framework, provided some initial ideas for categories, these ideas were not imposed
on the data. The categorisation of codes required careful consideration and proved
to be conceptually complex. Ideas were interconnected with people’s statement and
documents, frequently, had multiple meaning that could be categorised in a range of
ways.

154
Using the 3-D Framework by Sodhi & Tang (2009): D1- detection of the pandemic
by PHARMA, D2 – design and evaluation of possible supply chain and D3 –
solution deployment across the organisation, helped to locate and determine the
relevance and importance of the study, provided direction for theory development
and connected the study to disciplinary practice. Of course, the real-world response
does not fall into simple linear progression – solution design, for example, typically
encompass development of a portfolio of possible initiatives, which overlap in
deployment.
The following section is a discussion of codes I created from PHARMA data
(Figure 19). The analysis looks at the steps the company, took as well
recommendations made after the event, where significant lack of capability or
action is believed to have hindered the company in its response. Approximately 110
codes were identified and revised in the PHARMA setting. Codes were identified as
the words, concepts and phrases with similar intent. The codes are enumerated
below along with selected underlying source data. At this point, some codes overlap
in some aspects, as certain concepts can be coded in multiple ways. Eighteen
subcategories were developed as follow:
1. Warning 2. Stress test
3. Modeling 4. Planning
5. Training 6. External communication
7. Relationship with competitors 8. Relationship with governments and agencies
9. Relationship with business partners 10. Teamwork
11. Internal communication 12. Roles and responsibilities
13. Learning 14. Employee capacity
15. Production capacity 16. Supplier capacity
17. Product design 18. Solution design

155
Figure 19A-D shows an overview of codes, sub-categories and potential four core
categories following completion of the analysis of PHARMA data. Subcategories of
the core categories represent tailored approaches taken by the firm, that is, the are
the action patterns that express the implementation of activities to address a specific
risk management strategy. For example, sub categories of ‘reserve’ are: assure
management and employee capacity, increase production capacity, develop product or solution
extensions, acquire additional suppliers, increase flexibility, and increase inventory. Axial coding
indicates a relationship between the sub-categories, for example in time sequence,
prioritization, and interdependency.
Figure 19: An Overview of the Codes, Sub-Categories and Potential Core Categories

156
Figure 19A: A Structure of the Category "PREPARATION" and Its Sub-Categories and Codes
Figure 19B: A Structure of the Category "PARTNERSHIP" and Its Sub-Categories and Codes

157
Figure 19C: A Structure of the Category "ORGANISATION" and Its Sub-Categories and Codes
Figure 19D: A Structure of the Category "RESERVE" and Its Sub-Categories and Codes

158
Warning - Develop advanced warning system Example: Assign staff to monitor the information and process flow
Codes: Information, Monitoring, Notification, Speed and Timing
PHARMA monitors production of its key suppliers as well as its own inventory at
the manufacturing sites. The company has dedicated staffs that monitor the
information flow (demand forecasts, production schedule, inventory level, quality)
and process flow constantly; thus, when the Influenza outbreak occurred,
management was able to get a clear overview immediately and design solutions
accordingly. The monitoring system helps PHARMA reduce detection time D1 and
reduce design lead-time D2.
Prior to the start of the event, PHARMA had put in place and tested several aspects
of its response to a pandemic. Potential issues due to rationing of stock were
identified and policies were put in place. Testing was performed on the procedures;
however, the dependencies made this an apparently complex process.
“We have written procedures on how we would ration in the event of a pandemic. We potentially have to run rationing across many products not just Nicole as potentially our global production capability across 72 sites and all our products could have been compromised if staff were absent through contracting the disease. The timescales, impact and scenarios were very complicated and it proved impossible to test all scenarios. A selection of probable scenarios were chosen and tested.”
Manufacturing and Supply BCP
What was not anticipated, however, was the speed with which measures would have
to be implemented. Virulence and transmission rates of viruses such as H1N1 tend
to follow certain patterns and timings. In this case, the unknown impact of the virus
led the WHO to escalate the issue in a very short period: “The WHO guidance was
saying it was going to take four to six weeks (to move from Phase 4 to 5); in fact it
went in 24 hours."
The speed of this response by the WHO put PHARMA in unchartered territory, in
particular initiating a global response when the initial outbreak was still confined to
Mexico: “Phase 5, in our old flu pandemic procedures, meant we would issue
antivirals to all staff in all locations across the world. We would put in measures to
limit social risks, we would stop travel, we would activate all these plans to move
stock from all these sites, from Singapore to our secondary sites, and then to move
stocks from our sites into the market to try to push material down the supply chain.

159
And of course, we don't really need to do this, because we only have an outbreak in
Mexico.”
Stress Test - Conduct stress testing
Example: Pandemic stress testing annually (July)
Codes: Testing, Validation and Verification
According to the PHARMA pandemic preparedness plan, the company also creates
and rehearses different scenarios for pandemic events once each year around July.
As, the H1N1 pandemic broke out before the scheduled test in 2009, the previous
‘pandemic stress test’ was run nearly one year before events unfolded.
Modelling - Develop scenario plan and modelling capacity
Example: Modelling the second wave of pandemic to estimate demand of antiviral
medicines.
Codes: Modelling, Prediction, Scenario planning, Simulation and Valuation
PHARMA had developed a planning scenario in order to estimate the demand of
medicines and how to ramp up production in order to handle the second wave of
Influenza cases, which as predicted to occur during October 2009 at the onset of
the winter flu season in the northern hemisphere.
Planning - Leverage site pandemic preparedness plan
Example: Assessment and update site pandemic preparedness plan
Codes: Documentation, Plan and Procedures
PHARMA has a site Pandemic Preparedness Plan to protect the health and safety
of site personnel, protect site assets and preserve its ability to provide essential
medicines to the market in case a pandemic occurs. MSC develops a common site
Pandemic Preparedness Plan that is for adapted for each site. These plans include
the Business Continuity Plan, Plant Manager Emergency Response Plan and Site
Crisis Management Plan.

160
The Pandemic Preparedness Plan is arranged in sections corresponding to the
WHO pandemic alert system. It describes in detail the tasks to be performed at
each site. At each stage of the incident, this plan is used by site directors and the
Crisis Management Team (CMT) to establish, review and execute procedures to
manage the impact of flu pandemic on the workforce. It also describes actions,
triggers and communications within and between the sites, the regional CMT and
PHARMA Corporate functions in the WHO Phases 3, Phase 4, Phase 5 and Phase
6 of a pandemic. The pandemic preparedness plan has been prepared in line with
PHARMA's global principles.
Although PHARMA had these existing plans in place, some documents were found
to be out-of date, having been written between 2006 and 2008. Key persons
identified in the plans were no longer responsible for the tasks addressed therein,
due in part to changes that are typical for large organizations. . The generic
preparedness plan, which was to be deployed in the event of a major event, was last
updated in 2008. Thus, PHARMA’s first solution design task was to update and
refine the pandemic preparedness plan:
“We activated all our business continuity plans and our pandemic preparedness plan for the entire organisation across the world. There was a gap between the documented procedures and what staff members were actually doing. The preparedness documents were from 2006; Sites used them as a basis for their initial response at the end of April . An instruction was sent to all site directors to update their plans based on a best practice example within 2 weeks of the outbreak.”
Director of Supply Chain Planning
The new pandemic preparedness plan was issued to the manufacturing sites across
the world. The roles and responsibilities in the plan were tightened up, listing the
contact details by job role and title instead of name to assure clear ownership of
responsibility irrespective of staff changes.
Having a base line Pandemic Preparedness Plan in place accelerated PHARMA’s
response to the event in design and deployment process.

161
Training - Implement training
Example: Assure skill availability for managing risk by training
Codes: Education, Skills and Training
PHARMA assure skill availability for managing risk by implementing training of
management staff and sufficient skill for replacement to maintain understanding
how to manage risk in case there is an absence of experienced staff.
“For key roles in the CMT and key positions in the supply chains, BCP and Pandemic preparedness plans now require deputies to be identified and trained in case in any future event key staff contract the disease and are absent from work."
Manufacturing and Supply BCP Lead
External communication – Establish frequent communications
Example: Create frequent communication with governments, agencies and business
partners.
Codes: Communication, Communication frequency, Direct contact, Information, Real-time,
Reputation and Trust
PHARMA increase frequency of press and public communication when there was
the outbreak. This is in order to keep the public inform what they are doing and
show that company has aware of the issue and need to response to the public need
to save people life as soon as possible. In addition, this is to get real-time
information so that the company can response to the event better.
“Information flow is crucial. We need real-time information with all parties that involved in this pandemic is really important to respond better.”
Manufacturing Strategy Manager
Example: Increase frequency of press and public communication
Codes Communication, Communication frequency, Compliance, Press, Publicity, Relationship and
Review
Public perception is also important in the highly visible response to a possible
pandemic. Governments drive the sale of the majority of Influenza medicine
directly through tenders or indirectly through medical advisory bodies such as the
CDC and participate in the funding of research.

162
The pharmaceutical industry plays a crucial role in the health and well being of the
global population; pharmaceutical firms typically attract the direct scrutiny of the
press. For PHARMA, the press and public communication are seen to have an
important role and the company could not delay its response, as it would give the
company negative image.
“Our mission statement is built around improving the quality of human life. Given the importance of our brand in the market, we operate and communicate with press to maintain our strong reputation.”
Manufacturing Strategy Manager
Relationship – Establish relationship with governments, agencies and supply
chain partners.
Example: Coordinate with governments, agencies and business partners
Codes: Agencies (local and international), Cooperation, Compliance, Expertise, Government,
Industry, Press, Publicity, Relationship and Review
In the event of pandemic, establishing relationship with partners such as
governments and international agencies is critical:
“No one organisation or country, or group, can meet the pandemic challenge alone. All partners – multilateral organisations such as UN, developed countries, developing countries, public-private partnerships and industry – must work together to put in place a robust and effective global response.”
Global Public Policy Issue PHARMA’s Position (2009)
To respond to the Influenza outbreak efficiently, PHARMA closely monitored the
situation and proactively contacted relevant organisations and health authorities
around the world – including the WHO, the CDC and the Department of Health
and Human Service in the US and the European Centre for Disease Prevention and
Control – to gain a better understanding of the support and response needed.
Frequent communications and direct line of communication with its partners
benefits PHARMA in terms improving forecasting accuracy:
“We are talking to them about a range of issues, trying to understand exactly what this new virus is, exactly how the WHO and CDC believe this may develop so we can response to their need more quickly and efficiently.”
CEO of PHARMA

163
In term of its relationship with governments, PHARMA had been working to
supply antivirals for use in a pandemic situation since the global spread of avian
Influenza (H5N1) in 2003.PHARMAwas committed to supporting governments
worldwide. This commitment included addressing the needs of developing
countries and their concerns about timely and affordable access to medical
interventions.
According to PHARMA's annual report 2008, sales Nicole fell 80% reflecting fewer
government orders for pre-pandemic stockpiling. PHARMA stopped receiving
orders for Nicole three months before the start of the pandemic. No production
was planned for 2009.
“With no additional orders from governments, PHARMA had stopped Nicole production some three months before the start of the pandemic. No production was planned for 2009. At that time, PHARMA's commercial position was that no additional production would be planned without firm orders from governments.”
Manufacturing Strategy Manager
Once PHARMA acknowledged the outbreak, the company has contacted
governments around the world to ascertain demand for Nicole, including those
countries most affected by the virus, such as Mexico and the United States.
Proactive contact with government helps PHARMA in managing the limited
existing stocks of Nicole and anticipating demand of Nicole to determine
appropriate solutions to raise Nicole production levels.
“PHARMA established contact with local governments via the country managers to confirm the timing and estimate of required capacity and priority. Pandemics by their nature are unpredictable and we recognise that governments’ needs change. We are committed to finding solutions for governments changing their immunisation programmes and to fulfilling recent new orders.”
CEO of PHARMA
Example: Proactive contact with governments to anticipate orders and allocate
stock proportional to need
Codes: Allocation, coordination, government, proactive, stock
When the outbreak occurred, PHARMA faced an immediate challenge in allocation
of existing stock. At that time PHARMA has only 6 million treatment packs
available. The company prioritised orders to governments and was working with
them closely to determine the best mechanisms for distribution of this antiviral

164
treatment through either public or commercial routes as well as to allocate stock
proportional to the need of the governments.
Political pressure was a factor in the initial response. For example, a PHARMA
senior vice president demanded 200,000 packs of Nicole for country ‘C’ – ISSA
(PHARMA’s competitor) had apparently promised to deliver an equivalent number
of doses of Abaco. The government insisted they needed the full amount
immediately. However, country ‘C’ was not considered by PHARMA to be a
priority destination for several reasons. First, it did not have an Influenza outbreak.
Second, they had not placed a firm order for which they would have to take
delivery; in other words, if PHARMA produced a Nicole package, they would have
to commit to payment. Four hours after the demand was made, country ‘C’
cancelled its order.
By the end of April, it was clear that the impact of the H1N1 outbreak affect the
organisation across a range of areas, including organisation and communication,
finance and product development.
Regarding to stock allocation in coordination with government, it became urgent
for PHARMA to understand the commercial priority in terms of who would be
allocated product, and country managers were asked to talk to their governments to
understand the potential demand. By the second week of the outbreak, PHARMA
created a map of outbreak areas and determined the priority of locations to be
supplied with Nicole.
PHARMA needed absolute clarity from the commercial team on who was to be
supplied based on the medical need. Therefore, the rationing team had to develop
clear guidelines. The rationing process was refined during the pandemic response to
meet ethical and corporate objectives. As stated by director of supply chain
planning, a hierarchy of priorities was defined as follow:
First: countries with a confirmed outbreak, which had deaths and had placed a firm order such as Mexico. Second: confirmed outbreak, no deaths, but countries that wanted to place a firm order such as Paraguay. Third: confirmed outbreak, no deaths, but hadn't placed firm orders. Fourth: no outbreak, no deaths, but firm orders. And fifth: no outbreak, no deaths, and no firm order.
Director of Supply Chain Planning

165
For example, after the WHO rapidly increased the level of alert, without a definitive
assessment of the pathology of H1N1, PHARMA evaluated and initiated a
'proportional response' that sought to more appropriately balance perceived with
actual risks. By developing a system of fair, proportional response, PHARMA could
accelerate delivery of medicines to populations with the most urgent need. The
approach was developed as one of the first solutions to meet rapidly increasing
demand, and serves as a template for general response during a pandemic.
Example: Establish relationship with experts in the industry
Codes: Expertise, Industry and Relationship
PHARMA also coordinated with experts by bringing scientists and doctors onto the
team to advise on the WHO guidelines for pandemic alert levels and interpret the
various other sources of information. This was seen as a turning point for MSC in
its initial handling of a potential crisis for PHARMA.
Teamwork – Create integrated response team
Example: Create frequent communication with site directors
Codes: Communication, Cross functional, Frequency, Leadership and Meeting
Once PHARMA acknowledge the event, three responses were set up with the MSC
executive and the central executive teams the following days. The first was to run an
emergency supply chain planning meeting for Nicole. This meeting was previously
run monthly but a meeting was held immediately to provide an accurate assessment
of our stockpiles of API, raw materials and intermediates and finished goods,
ongoing production and commercial commitments. The second response is MSC
executive meeting, which aims to provide governance and guidance in the supply
chain. The frequency of this meeting was increased from monthly to weekly then to
daily as the situation became clearer. The third response was to establish a crisis
management team comprised of key operational staff across the PHARMA
business with the aim to provide overall governance and guidance focus on three
areas: (1) finding solutions to meet the order for 32 million doses of Nicole; (2)
putting into action initiatives across the supply chain to protect the business; and (3)
determining how the company could move from its existing capacity of Nicole to a
production dose capacity a factor of three times per annum greater in the event of

166
pandemic. This much higher estimate was considered possible during the second
wave of Influenza cases, which could come during October 2009 at the onset of the
winter flu season in the northern hemisphere.
PHARMA created a frequency communication with site directors. During the first
three months of the event, these meetings were held on a daily basis. There was
clear delegation and empowerment of the Crisis Management team allowing faster
and more responsive decision making during the design phase to ramp up and
expand production.
In addition to the responses in the MSC the whole of the PHARMA business
responded including daily meetings of the CET attended by the CEO of PHARMA
Communication to all employees in every country was a key objective from the
CET in order to communicate the response and changes in a very dynamic and
evolving situation.
“I am absolutely committed to ensuring that we communicate with the organisation as we develop the response. This may mean that you get a daily update from the CET on the decision and direction we are taking. It may also mean that we have to change the direction that we set on one day very soon afterwards because this is a fast moving situation and I ask for your understanding in that situation if it occurs.”
CEO of PHARMA
Example: Establish integrated response team called ‘Crisis Management Team’
Codes: Team
In order to reduce design and deploy time, PHARMA also created integrated
response team called MSC Crisis Management Team (CMT). The President of the
MSC appointed the value stream leader as manufacturing and supply pandemic lead
to bring together the disciplines across supply chain needed to identify possible
solutions to respond to the event. PHARMA’s existing pandemic procedures were
reviewed immediately after the event. They found the existing response plans were
a good basis, but needed to be expanded to cover all products, not just antivirals.
Example: Crate pandemic management organisation chart
Codes: Cross-functional, hierarchy and structure
Apart from create CMT, based on the identified gaps PHARMA also created a new
Manufacture and Supply Chain (MSC) pandemic management organisation chart

167
(Figure 20) this organisation chart was used as a core organisation setup during the
response to help MSC executives communicate and understand which product lines
could be affected. The pandemic organisation chart provides clarity of roles and
responsibilities through out the distributed supply chain organization.
As part of this CMT, a sub team was set up to address the potential impact of the
Influenza on multiple supply chains, initially thought to be unrelated. Continuity of
the supply of critical medicines was vital to patients as well as to PHARMA’s
corporate mission.
Figure 20: Manufacturing and Supply Chain (MSC) Pandemic Management Organisation Chart
Source: PHARMA
Moreover, a pandemic creates additional demand for a broad range of medical and
health-related products. Asthma patients, for example, are more susceptible to
Influenza infection. PHARMA had to consider additional areas such as respiratory,
antibiotics (demand for antibiotics was also predicted to increase because of
weakness in the body caused by the Influenza virus can trigger secondary bacterial
infections), consumer health (antiviral facemask), business-critical products and
external supply in which demand would increase in the face of a pandemic.
MSC Pandemic Management Team
MSC Executive Team
Centre of Excellence
Incident Management Team (IMT)
Coordinator
Communications Employee Health and Performance
(EH+P) MSC / BCP
Pandemic Supply Chain Team
Nicole Team
Respiratory Antibiotics Consumer
Health
Medically Critical
Products
Business Critical
Product
External Supply

168
The newly created sub team reported to MSC pandemic management team who
reported, in turn, on a daily basis to the MSC executive team during the outbreak.
Example: Established online team room for document sharing and set up a war
room at headquarter
Codes: Communication, Team room and War room
PHARMA established a control room for the purpose of agreeing strategy and
directing global operations during the pandemic to develop and execute a crisis
response plan. The room was conveniently located at its global headquarters where
members of the crisis management team and MSC pandemic management team had
easily access. To aid in the process, valuable visual information such as budget and
timetables, demand forecasts, production plans and project information are
available as charts in the control room.
PHARMA also created an online electronic database for information such as risk
management plans, strategic plan, BCP, etc. With uninterrupted access, this helped
managers worldwide to get the documents faster for implementation and
deployment. The focus of the document sharing was on project management in
deployment, and had proven useful during the solution design phase as well.
Internal communication – Shorten lines of communication within the
organisation
Example: Modify organisation hierarchy to shorten lines of communication
Communication, Frequency, Hierarchy and Structure
Communications emerged as a key issue in the response to the pandemic. In the
words of one executive:
“There was an initial problem with lines of communication. An immediate lesson was that greater communication was required to give the sites better guidance, and therefore a communication team was established.”
Manufacturing Strategy Manager

169
Another executive added:
“Normal lines of Communication were used initially during the response but these proved inadequate and not responsive enough. Amended communication channels were put in place aligned to the role responsibilities during the response phases.
Manufacturing and Supply BCP Lead
Consistency of communication was vital. Under normal conditions, PHARMA had
both formal and informal channels of communication that existed side-by-side.
Additional management teams were put in place without – in retrospect – having
been aligned to handle appropriately the scope and route of communications.
Inconsistent communication resulted in considerable 'noise'.
One executive explained,
“When PHARMA gets in a situation like this, PHARMA changed the formal network. They put in bodies that would communicate on the pandemic, bypassing some of the normal communication channels. So, that created a lot of noise, because we are expecting those channels to communicate, but we're getting those channels communicating. So if you run a site, instead of getting information from one channel, you have four.”
Director of Supply Chain Planning
Figure 21 shows communication lines during the response of H1N1 outbreak. It
illustrated that the sites were getting different messages from a number of different
sources; Employee Health Management (HRM) executives, the Incident
Management Team (about many topics, including personnel issues, the distribution
of antivirals and the stages and levels of the pandemic and reactions.), the Senior
Vice President (SVP) (about the pandemic response e.g. moving stock) and from
the Crisis Management Team (CMT).
This structure prevented PHARMA from being able to communicate effectively;
accordingly, restructuring the communications channel was a key design objective.
PHAMA shorten the line of communication by proposed that the CMT would be
responsible for communicating all issues during the pandemic (Figure 22).
Ownership and authority were also under pressure. For example, management staff
outside the MSC and not based in the United Kingdom, who believed they held risk
management responsibility, had remained peripheral to the activities of the
response, yet later pushed to be part of the executive review process.

170
Figure 21: Communication Lines during the Initial Response of H1N1 Outbreak
Figure 22: Revised Communication Lines During the H1N1 Outbreak
CET
Pandemic
IMT
SVP
CMT
SITES
EHM
MSC
CET = Corporate Executive Team MSC = Manufacture and Supply Chain IMT = Incident Management Team CMT = Crisis Management Team SVP = Senior Vice President EHM = Employee Health Management
CET Pandemic
MSC Pandemic
SITES
MSC Executives
CET = Corporate Executive Team MSC = Manufacture and Supply Chain

171
Roles and Responsibilities – Clarity of roles and responsibilities
Example: Revised and updated roles and responsibilities as formally documented in
RACI diagram.
Codes: Hierarchy, Responsibility, Role and Structure
To clarify individual/departmental roles and responsibilities, PHARMA revised and
updated their logistics pandemic BCP, site pandemic preparedness plan and ‘RACI’
diagram.
RACI diagram captures four roles, specifically for Responsible (those participants,
management or employees, internal or external, who are to do actually assigned
tasks), Accountable (those ultimately will be held accountable for the completion of
the tasks), Consult (whose input or opinions should be sought) and Inform (those
that should be kept up-to-date on progress and status of the work).
RACI is a technique for identifying functional areas, key activities, and decision
points where confusion may exist. This approach enables PHARMA management
team to actively participate in the process of systematically describing, decisions that
have to be made, activities that must be implemented, and to clarify the
responsibilities in relation to those activities and decisions. By formally identifying
accountabilities, the pandemic management team south to improve
communications across MSC.
Learning - Establish learning from past events and during the events
Example: Learning from past epidemics
Codes: Experience, Knowledge, Learning from the past, Learning during the event and Skills
Prior to the H1N1 Pandemic, events such as the H5N1 Avian Flu provided insight
into the evolution and transmission of Influenza strains. However, this affected
primarily animals (birds in this case), with relatively few incidents of human fatality.

172
“We have learnt from previous outbreaks, although bird flu was less severe than this and confined for the most part to aviary death. But since then we have been focussing on developing our antiviral medicines…the thing with bird flu, and it was less severe, in that it was killing birds. In some areas there were problems, where there was very close proximity between people and birds such as in China. But the transmission from birds to humans isn't so easy. Swine flu is different. Transmission from pigs to humans has happened and of course transmission from humans to humans.
Site Logistics Head
With additional experience from the H1N1 response, it could respond significantly
faster: what used to take weeks now takes just days to deploy.
“We have learned a lot, we are in a much better state of response now in case that ever happened again. We understand our vulnerability and we can respond faster . . .I have the feeling we responded better than most companies. We certainly responded increasing our supply chain capacity very well. No one would produce that portfolio. We didn't have that product six months ago, we didn't have a vaccine, we didn't have Nicole capsule inhaler, we didn't have an IV product. That development has been unprecedented.
Director of Supply Chain Planning
Production capacity – Increase capacity
Example: Ramp up production to increase capacity of Nicole
Codes: Capacity, Inventory, Product and Stock
In the event of a major pandemic, PHARMA would invest heavily in increasing
supply chain capacity to help governments and other customer organisations.
Significant investments would need to be made internally for antiviral drugs such as
Nicole but also for an H1N1 vaccine and potentially external suppliers who could
help PHARMA meet demand.
Before discussing how PHARMA increase antiviral capacity to meet up demand
during pandemic, I would like two explain a structure of two important supply
chains: Nicole and Hematol. Table 27 below shows PHARMA manufacturing sites
and locations.
Manufacturing Site Location Site A United Kingdom Site B United Kingdom (Scotland) Site C France Site D United States Site E Australia Site F Singapore
Table 27: PHARMA Manufacturing Sites and Locations

173
Hematol Supply Chain
Hematol is one of PHARMA’s biggest revenue-generating products. It contains two
active ingredients, Fancrose and Salmora. Two primary sites manufacture the APIs
for Fancrose and Salmora. The APIs are micronised at PHARMA in France (Site C)
and the United Kingdom (Site A) and secondary dry powder inhaler product is
manufactured and packed at sites in United Kingdom (Site A), United States (Site
D) and France (Site C).
Nicole Supply Chain
Nicole is a medicine for the treatment of Influenza and for reducing the chance of
getting flu in community and household settings. It belongs to a group of medicines
called neuraminidase inhibitors. These medications attack the Influenza virus and
prevent it from spreading through the body. Nicole treats the cause of Influenza at
its source, rather than simply masking the symptoms. Nicole is delivered via
inhalation using a dry powder inhaler, a PHARMA proprietary device for delivering
medicines.
The API of Nicole is called Xtazo. There are three suppliers of raw material
intermediates to primary site in United Kingdom (Site B): a PHARMA internal
supplier in United Kingdom along with the third-party supplier sites in Italy and
Belgium.
Figure 23 illustrates the Nicole supply chain. The primary manufacturing site is
responsible for the production of the API contained within the medications. This
normally involves either chemical synthesis and separation stages to build up the
complex molecules involved, or fermentation and product recovery and purification
in the case of biochemical process. In the Nicole supply chain, this process happens
at PHARMA's manufacturing site in the United Kingdom (Site B).
The secondary manufacturing site is responsible for taking the API produced at the
primary site and micronising and adding 'excipient' (pharmacologically inert)
material along with further processing, quality control and packaging to produce the
finished dry powder inhaler products.

174
For Nicole secondary production, the API is micronised at secondary site in France
(Site C). The product is then blended, filled, assembled and packed at secondary
sites in France (Site C), Australia (Site E) and United States (Site D).
PHARMA stated in its corporate commitment to make flu pandemic medicines
affordable and broadly available and further mentions its production capacity as a
key part of its corporate responsibility. The company championed ethical values and
doing the right things for society. Presenting the critical role of its supply chain
vital, the CEO stated that:
“We need stay focused on the main job, which is to ensure that important PHARMA medicines continue to be developed, manufactured and distributed to patients who need them. They will need them more than ever in the event of further healthcare crisis.”
CEO of PHARMA
Figure 23: Nicole Supply Chain
Starting from effectively halted production, PHARMA expected to achieve its target
of producing Nicole at the much higher rate of output within 12 to 14 weeks after
the outbreak.
"That will take a few weeks. But be rest assured, we are already manufacturing Nicole this week, and it will grow every week over the next few weeks and months."
CEO of PHARMA
Site B UK
Site C France
PACKING MICRONISATION
SECONDARY SITE PRIMARY SITE
SUPPLIERS
Site C France
Site C France
Global Market
Site E Australia
Site D USA
Italy
UK
Belgium
MANUFACTURING MARKET

175
The challenge to the MSC team was to design a solution to go from zero
production to maximum production and then expand production by a further 50%
in as short a time as possible. The main question that was raised was summarised by
one interviewee:
“How quickly we could move from other duties back onto Nicole, how we then had to start the filling operation, then there is an assembly operation, then a packing operation…time was our constraint and we knew that we had to design a solution as soon as possible.”
Site Production Head
Example: Leverage production load balancing by reducing load of production on
some sites while increase production of Nicole site
Codes: Capacity, Inventory, Labour reallocation, Product and Stock
PHARMA correctly predicted an increase in demand for medication to treat
respiratory ailments such as Hematol. The PHARMA Project manager explained:
“People who have asthma are likely to be more easily affected by the Influenza
virus. A viral chest infection can trigger an asthma attack. These people are more
vulnerable and hence more likely to take asthma medicine, driving up the demand
for Hematol.”
There were two main reasons why PHARMA was concerned about the impact on
demand for this product. First, Hematol is a medically critical product, which means
its availability can mean life or death for some or all of its users. An impact on the
supply of this product could result in the loss of company reputation and/or
customer loyalty. Second, Hematol is one the company's main products, which
generates GBP 4Billion per year. Any reduction in the production could have a
significant financial impact.
When the pandemic was declared, employees working on Hematol manufacturing
at Site D (United States) were needed for Nicole production. Production output of
Hematol was scaled back at site D and global demand was sustained by taking up
the capacity shortfall at Site B, which did not make Nicole. This load balancing
flexibility was designed in when the supply chains for Nicole and Hematol were
configured. Site B was asked to produce five million disks of Hematol a month,
which was considerably more than they had ever produced. Six months before the

176
pandemic; Site B had moved from 24 hour /7 days-per-week shifts to 24/5 shifts,
and now they were going back to 24/7.
To increase the capacity of the Nicole dry powder inhaler device, PHARMA had to
reallocate the capacity of Hematol production in each manufacturing site. Decisions
were made for each site to:
Maximise Hematol production at Site B (United Kingdom).
Maximise Nicole production at Site E (Australia)
Maximise Hematol and Nicole production at Site D (United States).
Maximise Hematol and Nicole production at Site C (France). Although Nicole and
Hematol do not share the same supply chain, they share some common resources
as mentioned earlier. Therefore they were able to divert resources (e.g. labour
resources), which is one of PHARMA’s risk mitigation strategies. Figure 24 shows
how PHARMA used production load balancing to both maximize production of
Nicole and assure multi-site production of both Nicole and Hematol.
Figure 24: Production Load Balancing Strategy
Nicole Capacity Site E
Australia Site C France
Site D USA
Recruiting temporary workers
Hemtol Capacity (115 million)
Site A UK
(45 m. to 55 m.)
Site C
France (40 m. to 35 m.)
Site D
USA (30 m. to 25 m.)
Transferring permanent
workers
Production load balancing 5 Million
5 Million

177
Production capacity – Financial investment and R&D
Example: Multi-billion dollar investments in R&D, manufacturing capacity, and also
short-term tactics to increase production capacity.
Codes: Budget, Capacity, Financial investment, Product, Product extension and R&D
PHARMA has been conducting R&D of vaccines since 1997 to enable
governments to protect their populations in the event of an outbreak. More than
GBP 2 Billion has been invested in developing technologies to respond to an
Influenza pandemic by increasing capacity at its vaccine and antiviral manufacturing
sites. Supply chain investment during the past three-and-a-half years to 2009 was
more than GBP 1 Billion and aimed to improve production response at short
notice. “We don’t know how big this deal is going to be, but no one can say we
aren’t ready,” claimed CEO of PHARMA at the outbreak of the H1N1 flu.
Significant tactical investments for Nicole production were made during the initial
response without any assurance of a return, “The sums of money we were investing
were huge; we made a decision to put over GBP 100 Million to expand capacity,
not knowing if we would recover our costs.” Investments in R&D as well as
manufacturing were considerable, measuring in the billions of dollars (1988,1989),
with an estimated 60% of the total manufacturing costs for the Influenza vaccine
fixed (HHS, 1998).
Employee capacity – Assure employee capacity
Example: Recruiting contingency workers to cover peak period and move to 24/7
shifts for greater production in existing site (Nicole)
Codes: Capacity, Employee, Employee readiness and Labour reallocation
PHARMA also putting extra shifts on, recruited temporary external staff, also
transfer of experienced production labour who previously made Hematol in Site C
and Site D, and maximizing Hematol production in Site A.
“Although Site A does not produce Nicole at all, but All staff responded urgently knowing that by making more Hematol they were helping maximise Nicole as well.”
Site Production Head

178
“This is a part of our supply chain integrity, in that we have multiple plants to do this, multiple plants to do that. But obviously, we don’t have people just waiting around manufacture if we don’t have demand. So as we went lost orders for Nicole a year ago, we released our staffs, we mothballed those facilities -we wouldn’t keep that cost . . . now the demand is peak, so we have to get the lines running, we would have to re-recruit temporary worker to build the capacity, but at the same time we have to have experienced workers who know the production operation well.”
Manufacturing and Supply BCP Lead
Supply chains that can share resources, such as experienced and temporary external
labour and facilities helped PHARMA rapidly ramp up capacity of Nicole quicker
but also sustained the production of Hematol. To solve this, PHARMA using
production load-balancing strategy to cascade production, reducing impact on the
Hematol supply chain.
“It allows you to deploy quicker for Nicole but also impacts production of Hematol because they share the same common resources such as warehouse and labour. That’s why they need load balancing to cascade the impact from one to other.”
Manufacturing and Supply BCP Lead
Employee capacity – Assure management capacity
Example: Distribute H1N1 antiviral medicine to employee and lockdown managers
in country and restrict travel
Codes: Capacity, Employee readiness, Protection and Safety
After PHARMA acknowledged the outbreak, the CEO of PHARMA instructed all
country managers to physically stay in their countries so that they could better focus
on local business unit issues and assure their supply and distribution chains would
run effectively. All non-essential travel to Mexico was halted. The CEO guidance to
employee was ‘to remain calm and carry on’ with their work to make sure patients
would continue to have access to critical medicines.
The protection of PHARMA employees was an important objective in the initial
stages of the response. In the face of the infection, employee health was protected
by distributing the company’s own H1N1 antiviral medicine to employees according
to Employee Health and Preparedness Plan. The key objective of this plan is to
collate information required by the centre to assure the antiviral storage, allocation
and delivery of pre-pandemic and pandemic vaccines for employees.

179
Product design – Develop product extension
Example: Having easier-to-manufacture Nicole capsule inhaler product design in
place and ready to produce
Codes: Capacity, Product, Product extension and R&D
PHARMA achieved new capacity by increasing production levels of Nicole dry
powder inhaler from 60 million treatment courses to 90 million and building new
capacity to produce 100 million treatment courses a year of Nicole capsule inhaler.
Another stream of increasing the capacity of Nicole was through alternative dose
forms for antivirals. A few years prior to the swine flu pandemic, PHARMA
developed a capsule inhaler device. This delivery format was slightly more difficult
to use from a patient perspective. The patient has to load the device with every
capsule, and then breathe in the medicine for dose delivery:
“The advantage of the Nicole capsule inhaler form is that PHARMA manufacturing has capsule capability at six of the PHARMA sites. So, the project team was formed to develop this product and to look at how we will carry out emergency registration with regulatory governmental authority and then spend the money for industrial analysis to validate so that we can have 100 million Nicole capsule inhaler capacity in place in about five months time; as it is predicted that the second wave will come in around October 2009.”
Manufacturing Strategy Manager
By having new dose delivery mechanism, such as the Nicole capsule inhal)er,
developed before the outbreak helped PHARMA save design lead time and ramp
up production much faster. Figure 25 shows capacity of Nicole production in
percentage.
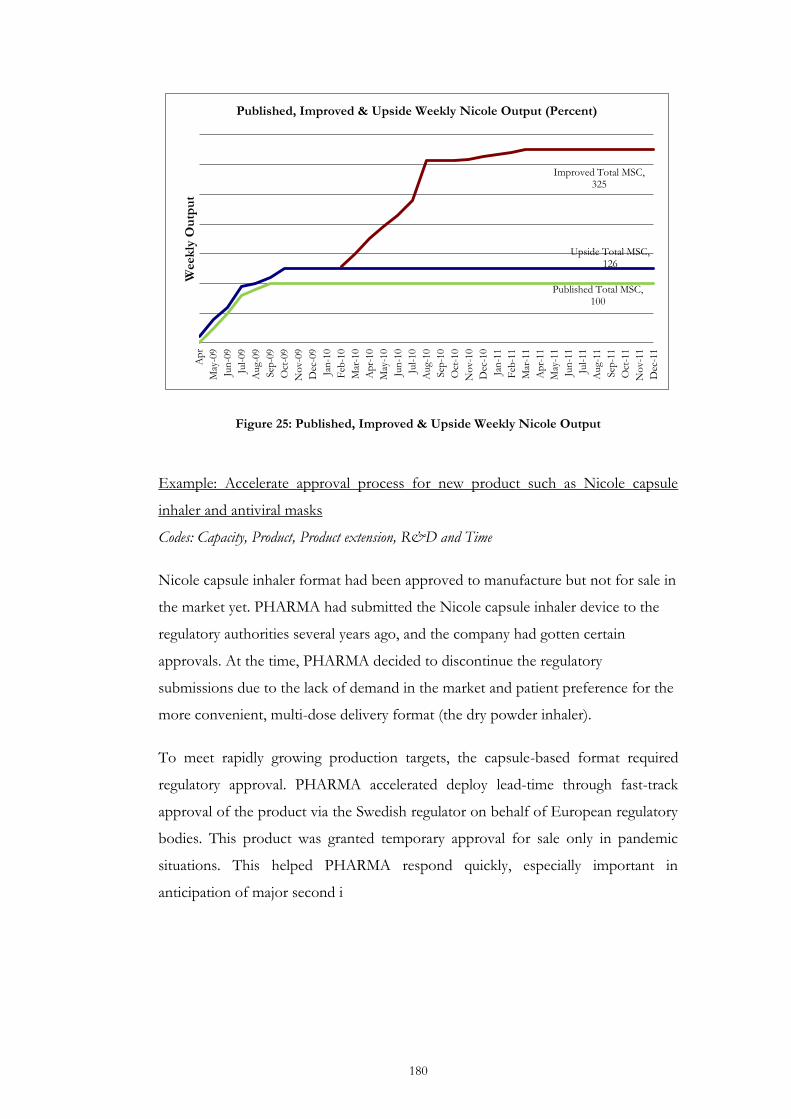
180
Figure 25: Published, Improved & Upside Weekly Nicole Output
Example: Accelerate approval process for new product such as Nicole capsule
inhaler and antiviral masks
Codes: Capacity, Product, Product extension, R&D and Time
Nicole capsule inhaler format had been approved to manufacture but not for sale in
the market yet. PHARMA had submitted the Nicole capsule inhaler device to the
regulatory authorities several years ago, and the company had gotten certain
approvals. At the time, PHARMA decided to discontinue the regulatory
submissions due to the lack of demand in the market and patient preference for the
more convenient, multi-dose delivery format (the dry powder inhaler).
To meet rapidly growing production targets, the capsule-based format required
regulatory approval. PHARMA accelerated deploy lead-time through fast-track
approval of the product via the Swedish regulator on behalf of European regulatory
bodies. This product was granted temporary approval for sale only in pandemic
situations. This helped PHARMA respond quickly, especially important in
anticipation of major second i
Published Total MSC, 100
Upside Total MSC, 126
Improved Total MSC, 325
Apr
May
-09
Jun-
09
Jul-
09
Aug
-09
Sep-
09
Oct
-09
Nov
-09
Dec
-09
Jan-
10
Feb
-10
Mar
-10
Apr
-10
May
-10
Jun-
10
Jul-
10
Aug
-10
Sep-
10
Oct
-10
Nov
-10
Dec
-10
Jan-
11
Feb
-11
Mar
-11
Apr
-11
May
-11
Jun-
11
Jul-
11
Aug
-11
Sep-
11
Oct
-11
Nov
-11
Dec
-11
Wee
kly
Ou
tpu
t
Published, Improved & Upside Weekly Nicole Output (Percent)
181
Influenza wave in the Northern Hemisphere, which could begin in October -
December 2009.
Normally the fast track scheme can take approximately six months. Some products
take two to three years to review, for example, due to extensive and complex
clinical trial data. As this product had proven clinical results and the same active
ingredients as the previously approved Nicole dry powder inhaler; the regulatory
authorities also understood the urgency:
“In the pandemic, we had to go back, dig out all the regulatory information on the Nicole capsule and resubmit our application. We then had to fast-track it through the regulatory bodies . . . normally, at the regulatory authorities, their fast track scheme is six months but they understood the urgency of this and the world is in a potential pandemic. They were reviewing and approving this quicker. Also we try to point out that this is the same product with Nicole dry powder inhaler, just in a new single dose device. The regulatory authorities understood the situation and accelerated their response without compromising their standards. So all we had to do is show that we could administer it therapeutically...”
Manufacturing and Supply BCP Lead
The availability of existing product definition greatly shortens the deploy lead-time
for new solutions. PHARMA hoped to profit from its existing disposable respirator,
a specially fitted type of facemask, which has an antiviral coating. The company was
able to accelerate government approval for a related antiviral facemask adapted for
the H1N1 virus
“ ... The antiviral facemask has been approved for use in Europe and certain international markets and last month was approved for occupational use in the United States by the FDA…"
CEO of PHARMA
Supplier capacity – Acquire additional suppliers
Example: Granting a production licence to a Chinese manufacture
Codes: Capacity, Product, Product licensing and Intellectual property
Another way to increase capacity of Nicole was through licensing production.
PHARMA committed to engage in voluntary license discussions with other
companies willing to manufacture and supply a Nicole product for use in
developing countries. Other companies would not be able to make Nicole in dry
powder inhaler format because the delivery device is relatively complicated, but they
could more readily adopt the capsule inhaler format.

182
Two years ago, PHARMA had given a voluntary license to a Chinese company to
manufacture flu drug. The company in China has the right to manufacture and sell
Xtazo in China, Indonesia, Thailand, Vietnam and all least developed countries
(LDCs).
“PHARMA is doing everything we can to prepare for a global Influenza pandemic including expanding production of Nicole and developing a pandemic vaccine . . . this agreement with Chinese company is intended to expand available suppliers of Xtazo in areas of the word that may be on the front line of a possible Influenza pandemic.”i
President of the company's pharmaceutical operations
Three main reasons that Nicole capsule inhaler is a ‘good fit’ for granting license
are: easy to manufacture, leverage the existing drug approval documentation made
several years earlier, and it was suitable for licensing to third-party from an
intellectual property perspective.
Having a pre-existing licensing arrangement with Chinese manufacture shortened
the search and implementation for external. It was seen as a good solution to
responding for handling increase demand since China given the high volume
needed for such a large population.
“There are a number of companies that we would give voluntary license to make this product. However, they would not be able to make dry powder inhaler because that is a complicated device that needs sophisticated manufacturing and technical expertise . . . Instead they could make Nicole capsule because that uses a relatively simple technology available to pharmaceutical manufacturers globally. And that meant we could grant Nicole capsule inhaler license into countries such as China.”
Manufacturing and Supply BCP Lead
PHARMA also needed to control the quality of external suppliers to match that of
its internal manufacturing capacity so that all applicable quality, safety and efficacy
standards are maintained.
“PHARMA also investigated the company who had been doing development work on this product and within those companies at the end of the day we want to investigate giving a license to them so they can produce these products to satisfy demand volume… Governments can issue compulsory licences to other companies but these licences would require significant technical assistance in order to manufacture the product and scale up within the demanding timelines of the pandemic. In addition key raw materials for manufacturing and packaging of Nicole are in short supply due to the PHARMA expansion and the suppliers are constrained due to the unprecedented demand.”
Manufacturing and Supply BCP Lead

183
Supplier capacity – Increase raw material and inventory
Example: Increase raw material by securing all available active pharmaceutical
ingredients (API) from the suppliers
Codes: Capacity, Inventory, Outsourcing, Sourcing and Stock
PHARMA identified a series of additional projects to increase capacity. First,
PHARMA had to increase the capacity of suppliers; second, it had to increase the
capacity of its secondary factories and then the production capacity of the APIs.
This meant buying more materials, which implied an immediate (and risky) initial
financial outlay. PHARMA purchased raw materials and components to produce a
significant volume over the period of several months.
“We are also beginning to increase our bulk raw material manufacturing plans for Nicole to assure we have enough raw bulk material in the future.”
Manufacturing Strategy Manager
Example: Increase strategic stock of micronised ingredients
Codes: Capacity, Ingredient, and Stock
For shared equipment with finite capacity, such as the microniser, PHARMA’s
supply risk mitigation strategy is to build strategic stock and hold high levels of
micronised material. With micronized material in warehouse, PHARMA can start
manufacturing the product quicker, albeit at a potentially higher work-in-process
relative to competitors.
“We had built a lot of strategic capacity in micronising. We hold high levels of micronised materials in our supply chain as part of the manufacturing strategy for common products.”
Manufacturing and Supply BCP Lead
Solution design – Increase flexibility
Example: Implement generic packaging (vanilla pack) instead of market specific
packaging and using multi-language labelling
Codes: Flexibility, Label and Packaging
Additional options were explored including postponement or delaying the last stage
of country-specific product packaging configuration, ‘vanilla pack’ or ‘generic pack’

184
A straightforward simplification of the packaging of Nicole would help speed-up
production, using a supply chain method referred to as ‘postponement’. In this
approach, customer- or market-specific configuration is delayed, to better pool
supply chain capacity in production and distribution.
There two types of packaging. A ‘market specific’ pack is uniquely labelled with in
languages specific to country an order and containing country-specific regulatory
information. Approval of packaging – even details on graphics, logos and text,
forms a key part of the regulatory review. The other called ‘generic pack’ or ‘vanilla
pack’ is typically labelled in multiple languages such as English, French and Spanish.
In the event of pandemic, local language and regulatory information on the
medicine could be limited to a locally produced insert.
“Having vanilla pack wouldn't increase our capacity, but it would allow us to chop and change to make as much as possible and ship as much as possible. Initially there was some resistance from countries wanting their own pack but once the global benefits of flexibility were understood and regulators approved the generic pack the market specific requests decreased”
Manufacturing Strategy Manager
In the urgency to receive product, governments initially accepted the ‘vanilla pack’
but later insisted on country-specific packaging, reflecting the sensitivities of public
consumers and need to confidence during the widely publicized pandemic.
“For example, PHARMA had product that was packaged for Japan and Japan then cancelled the order; at the same time one of the outbreaks was in another country. This country wanted the product within two weeks; PHARMA said we could supply the product to you but only in Japanese packaging (market specific label). The country accepted the Japanese order only for four weeks later to reverse their decision and request a market specific pack.”.
Manufacturing Strategy Manager
The same approach was used for the Nicole capsule inhaler; PHARMA used multi-
language labelling instead of country-specific labels in order to maximise production
during the pandemic outbreak.

185
Example: Sharing common resources
Codes: Flexibility, Manufacturing, Resources and Warehouse
The Nicole and Hematol supply chains are unique. These are two different supply
chains – they are co-dependent on certain resources such as the microniser
machine; others machine such as filling and packaging equipment is separate.
However, they do share he same machine, labour, resources, quality assurance and
warehouse etc. Resource sharing enhances supply chain flexibility in adapting for
redesign (new) supply chain design during pandemic and be able to deploy
manufacture production faster.
5.4 Response Time and Preliminary Core Categories
After an initial period of confusion in the aftermath of the sudden pandemic
declaration, the actions initiated across a broad range of areas were ultimately
effective in PHARMA’s response. Communication and decision-making – aided by
daily and weekly review meetings – meant a number of tasks could be quickly
delegated to the sites and country management.
“No formal targets exist for response time, but there is a general expectation that all Corporate Incident management teams, CMT and BCP teams would be established and operating within 24 hours after the WHO communicated the event.”
Manufacturing and Supply BCP Lead
The rapid spread of the virus suggested that the protection of employees was
critical in many locations; the distribution of antivirals to staff was prepared in
advance of the eventual rollout.
The expected seasonal evolution of the pandemic set the urgency and timing of
various options to respond. In the Northern Hemisphere, flu infection rates peak
typically in January, with the earliest onset in October; such a possible second wave
was feared to be far worse, as in it was in previous pandemics, than what actually
occurred.
PHARMA responded rapidly to the outbreak, successfully leveraging plans and
investments in antivirals accumulated during the previous decade. Out-of-date
documents, changes in staffing and somewhat chaotic communication were quickly
rectified and brought under the control of a single pandemic response team:

186
"Flexibility, visibility of supply chain and a clear plan are essential to the smooth running of a response to an emergency."
Site Production Head
Decreasing the cycle time in decision-making assisted PHARMA in adjusting its
solution strategy as product demand evolved:
"PHARMA prides itself on it's ability to respond in a crisis and "changing the clock speed" is a phrase common in these circumstances This means monthly business processes are then run weekly, weekly processes run daily and daily activities run hourly and staff are dedicated to the response and their day jobs suspended or delegated in order to shorten this response time."
Manufacturing and Supply BCP Lead
Immediate demands for medicines from a limited stock were addressed through a
rationing system and this helped provide a proportionate response to changing
requirements. The rapid increase in the production of antivirals and related
products was possible through new formulation and packaging, with the eventual
formulation and accelerated production of a set of targeted vaccines.
Target production capacity was achieved for specific products, e.g. Nicole powder
formulation, the Nicole capsule inhaler formulation and importantly for the H1N1
vaccine, over a period of several months with full capacity reached by the end of
2009.
“Time plays a key role to ensure more product is made and distributed and more patients are treated. In the pandemic response, Nicole production was restarted and output doubled within 6 months, new dose forms where developed, approved by regulators, supply chains and suppliers extended, a vaccine was available in an unprecedented timescale in 6 months.”
Manufacturing and Supply BCP Lead
These solutions were each effectively incremental changes to existing mechanisms,
feasible and sufficient as none of the worst-case scenarios materialised (e.g. closure
of multiple active ingredient production facilities or long-term closure of regional
transport). A formal review of the steps taken at the end of the first wave, e.g. July
2009, was supplemented by monthly tracking of further corrective and preventative
actions to assure a greater level of preparedness going forward.
By August 2010, the WHO observed that new cases of swine flu followed a more
typical seasonal flu pattern and with declining numbers of new cases and declared
the pandemic to be over. In 2011, people were still catching the H1N1 swine flu in

187
the UK, although it was at the lowest level since the virus first appeared it is current
form. The WHO estimates that there have been at least 16,813 deaths from swine
flu around the world – 457 in the UK. Since the outbreak in Mexico, estimates
varied widely and initial worst-case scenarios envisioned significant health and
economic impacts on large populations globally.
PHARMA’s fast response is also seen to have improved its competitive position:
“We have learned a lot, we are in a much better state of response now in case that ever happened again. We understand our vulnerability and we can respond faster . . .I have the feeling we responded better than most companies. To increase capacity by 50% then up to 300%, develop and approve new dose forms, develop a vaccine took the efforts of thousands of people in this organisation.”
Manufacturing and Supply BCP Lead
Table 28 shows examples of actions that PHARMA took in responding to the
H1N1 pandemic and affected of those actions on detection time (D1), design lead-
time (D2) and deploy lead-time (D3).
Tailored approaches Examples of PHARMA Response to H1N1 Pandemic
D1 D2 D3
Develop advanced warning system
Assigned staff to monitor the information and process flow.
Conduct stress testing Pandemic stress testing each year (July).
Develop scenario plan and modelling capability
Modelling the second wave of pandemic to estimate demand of medicines.
Leverage preparedness plan Assessment and update site pandemic preparedness plan.
Implement training Assure skill availability for managing risk.
Establish frequent communications with supply chain partners
Coordination with international agencies e.g. CDC and WHO.
Proactive contact with governments to anticipate orders and allocate stock proportional to need.
Increase frequency of press and public communications.
Establish direct line of communication with external suppliers.
Create integrated response team
Create pandemic management organisation chart.
Established integrated response team called “Crisis Management Team”.
Create frequent communication with site directors.
Set up a War room at headquarters. Established online team room for
document sharing.

188
Table 28: A Summary of the Findings from PHARMA in Relation to Response Time
The search for a core category or categories begins from the outset with data
collection. Codes and then categories emerge and are compared. The objective of
the research using Grounded Theory is to generate theory “that accounts for the
patterns of behaviour which is relevant and problematic for those involved’ (Glaser,
1978. P.93). In order to achieve this goal, the researcher must discover the core
Tailored approaches Examples of PHARMA Response to H1N1 Pandemic
D1 D2 D3Shorten lines of communications within the organisation
Modify organisation hierarchy to shorten lines of communication.
Clarify roles and responsibilities
Revised logistics pandemic BCP and site pandemic preparedness plan.
Revised and updated roles and responsibilities as formally documented in RACI diagram.
Establish learning from past events and during the events
Learning from past epidemics (e.g. H5N1 Avian Flu).
Assure management and employee capacity
Distribute H1N1 antiviral medicines to employees.
Lockdown managers in-country and restrict travel to at-risk areas (Mexico).
Recruiting contingency workers to cover peak period and move to 24/7 shifts for greater production capacity in existing sites (Nicole).
Increase capacity Reallocate labour resources to increase capacity of Nicole.
Leverage production load balancing by reducing load of production on some sites while increase production on main sites.
Develop product or solution extensions
Having easier-to-manufacture Nicole capsule inhaler product design in place and ready to produce.
Accelerate approval process for new products e.g. Nicole capsule inhaler and antiviral masks.
Acquire additional suppliers Granting a production licence to a Chinese manufacturer.
Increase flexibility Using generic pack (vanilla pack) instead of market specific packaging.
Shift shared Hematol manufacturing capacity to Nicole. Shared same machine, labour, resources, warehouse, quality insurance etc.
Increase inventory Increase raw material by securing all available active pharmaceutical ingredients (API) from the suppliers.
Increase strategic stock of micronised ingredients.

189
categories and delimit the investigation around it. This categorization is the crucial
point for the theory; sub categories relate to it, and it accounts for most of the
variation in pattern and behaviour. The core category or categories ‘have the prime
function of integration the theory and rendering the theory dense and saturated as
the relationships increase’ (Glaser, 1978, p.93).
According to Glaser (1978, p.95-97) research is looking for core category(ies) that
explains the main concern or problem for the participants. He identifies the main
criteria for core category selection as follows, where core category(ies) should:
Central to as many other categories as possible, accounting for the majority
of observed behaviours.
Found throughout the data as a recurring concept, becoming more central
to related categories through evolution of the research.
Require more data than others to become saturated; that is, encompasses a
broader range of data relative to other (sub) categories. Saturation “occurs
when the data yields no new information for a category.” (Glaser, 1978,
p.95-97)
Should have visible and meaningful links to other categories.
Have validity and relevance to observed behaviours throughout the study.
Alternate core category(ies) should be sought if only a limited duration of
the study can be interpreted using the potential core category(ies) should be
flexible and broad enough to encompass the emerging relationships
between categories as they develop.
The core category should also be a part of the problem itself. Therefore the
core category should, in part, explain itself and its own variations.
Should be a central part of the area under study, explaining its own role and
encompassing variations on the concepts it represents.
In this study, the core pattern was managing supply chain risk by reducing response
time, in which the firm undertook a series of activities to address risk in meeting
supply chain demands in the event of low probability and high impact disruption.
This chapter provided a detailed description of how open coding was used to
constantly compare and analyse data from the PHAMA case. It explored the codes,

190
subcategories and preliminary categories that emerged from the interview data and
other sources. The codes explained how PHARMA leverages time in responding to
the pandemic. As a result of analysis of the data, four preliminary categories were
identified. These four distinct but interrelated core categories in responding to
disruption are:
1. Preparation
2. Partnership
3. Organisation
4. Reserve
Figure 26: Finding thus Far from PHARMA Case
At this stage, it is too early in the analysis to confirm these categories. Further
sampling and continued constant comparison of additional data is required to
achieve theoretical saturation of this construct. The findings so far provide a
preliminary answer to identification and initial characterization of the factors as was
set out above (Figure 26).
Further coding from additional cases reveal more detailed characteristics of the
identified subcategories after the PHARMA case. Additional subcategories are
discovered in the incremental data, for example, in the BP Deepwater Horizon
event. Cooperation with competitors, for example, was shown as a critical
approach, which was not evident in the strategy taken by PHARMA.

191
Chapter 6 Validation with Disruption at BP Deepwater Horizon
The following chapter expands on the preliminary categories that were outlined in
Chapter 5. This will be achieved by analysis of additional qualitative data collected
through secondary sources of two additional cases. Through constant comparison
with data from BP Deepwater Horizon and BP Texas City events, this process will
assist in validating if the four categories are core to understanding the time-based
response framework. Theoretical sampling and further coding will enable the
properties of the preliminary categories and subcategories as well as the links
between them to be identified, as presented in Chapter 8 - Findings.
The BP events came under intense public scrutiny for a number of reasons, most
obviously due to the dramatic impact of the explosions that killed scores of
workers. The immediate and long-term environmental damage drew government
criticism; in turn politicians themselves were under fire for their lack of
responsiveness and ultimately held responsible for creating the underlying
conditions in industry which could allow such events to occur. Litigation followed,
as can be expected for a major disruption involving firms along a global supply
chain operating in the United States. This put a large amount of testimony into the
public record. Delivered under oath, this verbatim material provides a rich source
of data. The events, background and consequences were extensively documented
through various government and industry investigations, along with the reports
from BP itself.
It is not the aim to repeat this material nor to assess culpability, though a clear focus
in the available material seeks to assign blame. Through Ground Theory
methodology, the handling of these events serve to strengthen and detail the
concepts emerging from PHARMA, where additional concepts extend the core
categories and additional codes provider greater depth and applicability. A short
summary on the background of the Deepwater Horizon disaster is provided below.

192
6.1 Company Overview
BP is a major international oil and gas company headquartered in London, United
Kingdom. The company was founded in 1909 as the Anglo-Persian Oil Company,
later Anglo-Iranian Oil Company, and was predominantly focussed on exploration
and production in various countries in the Middle East. The AIOC became the
British Petroleum Company in 1954, and expanded worldwide with investments in
Alaska and the North Sea.
Extensive nationalization of assets in Iran and Libya and elsewhere during the
1970s forced the company to seek new sources of energy, often through
cooperation with competitors like Shell and acquisitions of Amoco and Arco in the
United States in 1988.
In 2001, the company was renamed BP plc. to reflect its total energy strategy
('Beyond Petroleum') and global operations, remaining headquartered in London.
Today BP plc. is one of the world's largest energy companies, with extensive
downstream distribution to retail customers and businesses across the globe. The
BP Upstream division holds more than 500 lease blocks in the Gulf of Mexico and
is the largest producer of oil and gas in the Gulf of Mexico.
6.2 Background of BP Deepwater Horizon Oil Spill
On the morning of Tuesday, April 20, working in calm waters in the Gulf of
Mexico, engineers were confident of finally completing a challenging, much delayed
exploration well in the Mississippi Canyon, Block 252. The area was dubbed
Macondo, after the ill-fated town in Gabriel García Márquez book “One Hundred
Years of Solitude”. BP plc planned on drilling the first well in 100 days11.
Though a leader in exploration, BP had little experience in the specific rock
formation under Block 252 but was optimistic about finding significant
hydrocarbon reserves at the Macondo Prospect. Looking to save time and expense
for eventual production, offshore engineers at BP designed the exploration well to
make it 'production ready'.
11 OSC - Oil Spill Commission (2011c)

193
The crew was working to securing the bottom of the well with specially formulated
cement which would allow the massive Deepwater Horizon exploration rig to
'temporarily abandon' the location. Normal exploitation could be continued at a
later date with a cheaper rig, and allowing Deepwater Horizon to being work at new
locations in the Gulf.
At 5:45 AM on the 20th of April, a cementing engineer from Halliburton Company,
subcontracting to BP, sent e-mail from the rig to his colleagues in Houston a few
hundred miles away. Despite some initial concerns, the work looked done: “We
have completed the job and it went well.12”
Deep water drilling – more than 1000 feet below the sea level in current (2011)
terms – is a complex endeavour, operating at the edge of engineering experience
with extreme pressures, high temperatures and in remote waters. Maintaining the
delicate hydrostatic balance of oil and gas pressure below with a column of heavy
drilling 'mud' requires geology, experience, engineering and coordination.
Conditions at sea level in the Gulf can change dramatically during the hurricane
season; in fact, the Macondo well was started by an earlier Transocean drilling ship,
Marianas, that had to be towed back for repairs after Hurricane Ida some five
months earlier. The Deepwater Horizon had already suffered a stuck drill pipe at
Macondo at more than 12,000 foot depth on March 8 when the fragile stone
formation collapsed, forcing a design revision and drilling around the abandoned
lower segment of the original bore hole13. By mid-April, the well was already six
weeks late, with original projections of USD 96 million expected to overrun by
USD 58 million14.
Deepwater Horizon was one of the most sophisticated drill ships in the Gulf of
Mexico, built in at a cost of USD 350 Million and operated by the largest offshore
drilling fleet company, Transocean. The rig was on a long-term lease to BP with
daily services fees of some USD 1 Million15. The safety record of Deepwater Horizon
was generally good, with no major health and safety incidents in seven years. Two
senior BP executives - company men drilling parlance - and two Transocean senior
12 OSC - Oil Spill Commission (2011a) 13 BP. 2010c. Deepwater horizon accident investigation report 14 OSC - Oil Spill Commission (2011a) 15 OSC - Oil Spill Commission (2011c)

194
managers – arrived on the rig that morning in April 20, 2010 for a one-day
'management visibility tour' and would congratulate the team on seven years of
drilling with no major incidents16.
Preparing the well for temporary abandonment, the drill team was testing the
integrity of the 15,000 feet deep well, coordinating with specialist firms such as
Halliburton and visiting BP engineers. The design of the well, formulations of
concrete and mud, and techniques for securing it were specific to the geologic
'formation' and intense, specific conditions found during drilling. The engineers
had to resolving differences of opinion in the approach, and were reviewing
conflicting results from the various 'negative pressure' and 'positive pressure' tests.
At 21.30 PM that night, a massive geyser of sea water and drilling mud erupted and
began to rain down on the rig and onto nearby support ship, covering the deck in
the thick mucous-like synthetic drilling compound. Moments later, a hiss of highly
compressed gas was audible. Loss of well control or ‘blow-out’ is one of the
primary risks in drilling on sea or land, and extremely fast response is needed to
avoid disaster. The drill pusher and mudrakers working on the drilling floor
scrambled to take action.
At 21.41 PM, the rig shook with the first of several massive explosions. 11 crew
members were killed in the blast. Most of the able and injured crew could escape by
lifeboat – or jumping directly seventy feet into the oily and burning Gulf waters
below. Some 27 hours later, the rig sank to the sea floor 5000 feet under the
surface.
Over the next 92 days, BP would attempt a range of techniques to stop the flow of
oil into the Gulf – originally thought to be minimal then 5000 barrels per day,
ultimately known to be 10 times greater. The resulting oil spill reached hundreds of
miles of coastline and covered vast surface and subsurface area. BP and its
subcontractors faced billion-dollar litigation, on top of the USD 11.8 Billion that BP
has already paid out by the end of 2010.
16 OSC - Oil Spill Commission (2011a)

195
This was the beginning of the most expensive and damaging oil spills in American
waters to date with more than 4.9 million barrels discharged into the Gulf waters.
The public and industry scrutiny on this catastrophe was unparalleled, with impact
beyond the critical energy supply chain that powers the American and international
economy. In this case we look at the context and likely causes of the event, with a
focus on how BP and its partners sought to accelerate their response to the crisis.
The United States was estimated to consume more than 18 million barrels of oil per
day during 2011. The energy supply chain is critical to the national and global
economy. To secure current and future hydrocarbon supplies, private industry has
moved to new frontiers, drilling offshore to extreme depths and employing new
techniques to extract energy sources from the ground. The wells in the Macondo
Prospect are among the deepest, starting at 5000 feet below sea level and going
some 13,400 feet into Miocene geologic layer that traps extensive oil reserves in the
waves of salt and clay below much of the Gulf of Mexico.
The network of companies serving the Gulf of Mexico is complex, with many
contracting parties for specialized services in marine geophysical surveying, offshore
engineering and construction, transportation, diving and mobile drilling17. Due the
exceptionally high cost of exploration and development, leading firms often shared
costs of drilling, production and transportation 18 . According to a National
Petroleum Council study, “This 'buy versus build' strategy resulted in a significant
reduction in the number of skilled people within operating companies who
understood development and deployment19”.
Time pressure in this industry is considerable: “Project profitability depended on
how soon production could be brought online. Drilling vessels were contracted on
day-rates, increasing time pressures. Production processes were highly
interdependent: delay on one place could cause delays elsewhere.20”
17 OSC - Oil Spill Commission (2011a) 18 OSC - Oil Spill Commission (2011a) 19 OSC - Oil Spill Commission (2011a) 20 OSC - Oil Spill Commission (2011a)

196
In 1985, an Office of Technology Assessment study of the Arctic and Deepwater
oil drilling identified “a need for new approaches to preventing work-related injuries
and fatalities in coping with new hazards in the hostile Arctic and Deepwater
frontiers.” It also presciently warned of the glaring deficiencies in safety oversight
offshore, observing, “there is no regulatory requirement for the submission of
integrated safety plans which address technical, managerial and other aspects of
offshore safety operations21”.
The offshore drilling business is expensive and dangerous. Since 2001, the Gulf of
Mexico workforce – 35,000 people, working on 90 big drilling rigs and 3500
production platforms – had suffered 1,550 injuries, 60 deaths, and 948 fires and
explosions22. Nevertheless, oil production in the Gulf is a vital part of the economy
and considered generally safe for the environment; as stated by President Obama
on 2 April 2010 on a speech in North Carolina, three weeks before the disaster,
“Oil rigs today generally don't cause spills23”.
Macondo Prospect, Mississippi Canyon Block 252
The Gulf of Mexico accounts for 90% of offshore drilling in the U.S. by volume
and contributes approximately one third of all U.S. oil production. BP acquired the
lease for Block 252 in 2008, and was approved by MMS to drill the first of two
wells on May 29, 200924.
The well was started ('spudded') by Marianas on 6 October 2009. After reaching a
well bore depth of 9,090 feet, the rig was badly damaged by Hurricane Ida and had
work had to be re-started by Deepwater Horizon in February 201025.
During drilling, the team faced seven 'lost returns' events, in which the pressure
from drilling fluid fractures the surrounding formation and the fluid flows into the
rock. While this is not unusual, the events were frequent and at varying depths,
prompting BP engineers in Houston to halt the drilling at 18,630 feet –
21 OSC - Oil Spill Commission (2011a) 22 OSC - Oil Spill Commission (2011a) 23 The Whitehouse (2010) 24 OSC - Oil Spill Commission (2011c) 25 OSC - Oil Spill Commission (2011c)

197
approximately 1,400 feet short of the original target. Because of the fragile state of
the well, additional tests and precautions are required.
“John Guide explained after the incident that losing returns ‘was the No. 1 risk.’ He and the other BP engineers worried that if their cementing procedure placed too much pressure on the geologic formation below, it might trigger another lost-returns event similar to the one on April 9.”
BP had to choose a well abandonment procedure that would balance the risk of
'lost returns' due to the fragile formation with possibility of losing well control.
To prepare a well for cementing, a mechanism known as the 'float valve' is
introduced at the bottom segment ('the reamer shoe'). This has a pressure-sensitive
mechanical device which changes from a two-way valve – allowing flow down and
up through the pipe – to a one-way system. This conversion helps prevent mud
from contaminating the cement.
The drill team had difficulty converting the valve (reversing its direction), and in
multiple attempts, increased pump pressure on the ninth attempt to 3,142 psi – four
times the design specification. There was the possibility that conversion did not
occur due to obstruction of the very bottom of the well, the tip of the reamer shoe.
To test that the obstruction, perhaps cuttings or debris, was pushed out, and the
float collar converted, the crew would have needed to run at least 6 barrels of mud
per minute and observe the comparable return; they did not run this test. Another
possibility was that the high pressure forced the ball through the float tube, leaving
it in place and leaving a bi-directional path through the float collar. If so, this could
cause contamination of the cement.
The process for temporary abandonment typically requires setting of a cement plug
some distance down into the well and a lock-down sleeve at the seafloor, allowing
the BOP and riser to be removed. After several iterations through the well design,
BP engineering planned to put the concrete plug at 3000 feet below the mudline.
1. Run the drill pipe into the well to 8,376 feet, 3300 feet below the mudline.
2. Displace the mud in the well with 3300 feet of seawater, pushing the mud
into the riser above the BOP.

198
3. Perform a negative pressure test; to assure the concrete plug at the
bottom could hold the hydrocarbon under pressure without substantial
downward pressure from drilling mud
4. Displace the mud in the riser with seawater.
5. Set a cement plug at 8,376 feet.
6. Set a lockdown sleeve.
This phase would leave only the cement at the bottom reamer shoe to stop
hydrocarbon flow up into well; the BOP could act as backup only if someone on
the rig activated it early enough should the cement fail. This could require
significant reaction speed from the operating crew, at the same time they were
working with the complex mud displacement process from the riser.
This procedure allowed BP to set lock-down sleeve last, but required the upper
cement barrier to be significantly deeper than was typical. Preferring to set cement
in seawater, this left 8,376 feet of mud displace with much lighter seawater before
any secondary barrier was in place. The procedure was developed at the last minute
without performing any risk analysis. BP had changed the procedure a number of
times in the two weeks prior to these final steps.
The plan on the 12 April did not include a negative pressure test, and had the
cement plug set at 6,000 feet below sea level. On 14 April, BP sent a revised plan
to MMS for approval, which included a negative pressure test, but required setting
the cement plug in drilling mud before seawater displacement. On 15 April, BP
changed the plan again, deciding to perform the negative pressure test before
setting the cement plug. On April 16, BP sent the plan to MMS, which was
approved in less than 90 minutes26.
The plan changed one more time, on the day of the blowout. BP sent the Macondo
team on the rig a revised plan, different to the one approved by MMS. In this final
plan, the negative pressure test would be combined with displacement of mud in
the riser with seawater27.
26 OSC - Oil Spill Commission (2011c) 27 OSC - Oil Spill Commission (2011c)

199
Explosion and Oil Spill
Along with 11 deaths that occurred within minutes of the blast, 54 workers on the
Deepwater Horizon were injured – some critically. Powerless after the first explosion,
which destroyed its engine rooms, the burning rig drifted 1600 meters, listing
heavily, before sinking to the seafloor 27 hours after the initial explosion.
By then an estimated 1500 meters of the riser connecting the rig to the wellhead lay
crumpled on the sea floor. An oil slick from the initial destruction of the rig was
visible for kilometres, but first impressions from the surface led the Coast guard
and BP to assume that the well had been sealed during the emergency: No oil
leaking into the Gulf.
This would soon prove not be the case: Coast Guard officials on Saturday
estimated that as much as 1,000 barrels of oil is escaping each day from the well
head on the ocean floor.”
On April 28th, Coast Guard Adm. Mary E. Landry quoted a scientist from the
National Oceanic and Atmospheric Administration who had concluded that oil is
leaking at the rate of 5,000 barrels a day, not 1,000 as had been estimated. “It
appears to have been calculated using a method that is specifically not
recommended for major oil spills.”
On April 30th, the WSJ reported that “Ian MacDonald, professor of oceanography
at Florida State University who specializes in tracking ocean oil seeps from satellite
imagery” had concluded the “oil spill could be leaking at a rate of 25,000 barrels a
day, five times the government’s current estimate”.
On May 4th, Doug Suttles, an executive with BP Plc on Wednesday said the well
could gush at 60,000 barrels per day if all the equipment on the sea floor restricting
the current flow were removed during certain repair procedures.
If the existing Blow-Out Preventer (BOP) and all the equipment were removed, it
could get up to that rate.
Oil Spill Commission, 2010b: Congestions al testimony

200
By May 14th, the amount of oil spilling into the Gulf of Mexico may be at least 10
times the size of official estimates, according to an exclusive analysis conducted for
NPR.
BP has said repeatedly “that there is no reliable way to measure the oil spill in the
Gulf of Mexico by looking at the oil gushing out of the pipe.”
Steven Wereley, an associate professor of mechanical engineering at Purdue
University, analysed videotape of the seafloor gusher using a technique called
particle image velocimetry. A computer program tracks particles and calculates how
fast they are moving. Wereley put the BP video of the gusher into his computer. He
made a few simple calculations and came up with an astonishing value for the rate
of the oil spill: 70,000 barrels a day — much higher than the official estimate of
5,000 barrels a day.
On 14th May, BP spokeswoman Rebecca Bernhard said the company is standing by
the 5,000-barrel figure. “We look at the fact that it’s coming out of the riser (pipe)
in several ways. We look at it from satellite imagery, over flight observations and
on-the-water observations.”
Carol Browner, director of the White House Office of Energy and Climate Change
Policy noted that BP had a “vested financial interest” in downplaying the size of the
leak, speaking to CBS news on “Face the Nation” that BP “ . . . will ultimately pay a
fine based on those rates . . .
Representative Ed Markey of Massachusetts, head of the House Energy and
Environment subcommittee, agreed that the company “had a stake in low-balling
the number right from the very beginning.”
Noting that BP has consistently provided information that proved to be wrong,
Markey said he had “no confidence whatsoever in BP.”
“The public needs to know the answers to very basic questions: How much oil is
leaking into the Gulf and how much oil can be expected to end up on our shores
and our ocean environment?” Markey said in a letter to BP. “I am concerned that
an underestimation of the flow may be impeding the ability to solve the leak and
handle management of the disaster.”

201
Retrospective estimates of the oil leak from the first day of the disaster stand at
approximately 62,000 barrels, slowing to 54,000 barrels per day by the time the well
was finally capped. This figure is an order of magnitude higher than the original
estimates, for a total spill of some 4.9 million barrels, making it by far the worst
open sea oil spill in US waters.
6.3 Companies and Parties Involved
Transocean
Transocean is one of the leading offshore drilling companies. It owned some of
the most capable drilling rigs in the industry, setting records for offshore drilling
depth.
According to BP's Patrick O'Bryan, the Deepwater Horizon was “the best performing
rig that we had in our fleet and in the Gulf of Mexico and I believe it was one of the
top performing rigs in all the BP floater fleets from the standpoint of safety and
drilling performance28”. While there were several thousand hours of outstanding
maintenance issues to be scheduled29, the rig was seen as a workhorse capable of
handling some of the most complex operations.
Halliburton
Halliburton is one of the world’s largest oil field services providers and owns
several other oil field services companies, including Baroid and Sperry Drilling.
Halliburton designed and pumped the cement for all of the casing strings in the
Macondo well.
The Minerals Management Service (MMS)
The Minerals Management Service (renamed on 18 June 2010 to the Bureau of
Ocean Energy Management, Regulation and Enforcement, or Bureau of Ocean
Energy (BOE))
28 OSC - Oil Spill Commission (2011a) 29 OSC - Oil Spill Commission (2011a)

202
The Department of the Interior’s (DOI), Bureau of Ocean Energy Management,
Regulation and Enforcement (BOEMRE), is the federal agency responsible for
overseeing the safe and environmentally responsible development of energy and
mineral resources on the Outer Continental Shelf.
The Bureau is led by a Director appointed by the DOI Secretary. The Director is
supported by senior executives who manage national programs, policy, and budget
in Washington, DC (headquarters) and three regional directors responsible for
management and program implementation.
The BOEMRE’s Offshore Energy & Minerals Management (OEMM) offices
contend with all aspects of offshore federal leasing and renewable energy projects.
The OEMM's work includes the preparation and administration of regular offshore
oil and gas lease sales. Additionally, BOEMRE is responsible for conducting
supporting research and documentation leading up to each lease sale.
The OCS is a significant source of oil and gas for the Nation’s energy supply. The
approximately 43 million leased OCS acres generally accounts for about 15 percent
of America’s domestic natural gas production and about 27 percent of America’s
domestic oil production. The BOEMRE’s oversight and regulatory framework
ensure production and drilling are done in an environmentally responsible manner,
and done safely.
In addition to BP, Transocean and Halliburton, a number of other subcontractors
to BP and individuals were “parties of interest”, and participated in further
investigation and eventual litigation. These companies included: Cameron
(equipment manufacturer of the BOP), M I Swaco (subcontractor to Halliburton),
Anadarko Petroleum, MOEX USA Corp.
6.4 Timeline of the Disruption
The timeline of the pandemic response is shown in
Figure 27. In this study, the date 20 April 2009 at 19:55 is defined as ‘the event’ for
purposes of analysis because at this point in time the lost of well control became
inevitable. (See also the detailed of timeline according to BP Deepwater Horizon
Accident Investigation Report in Appendix 3.)

203
Timeline of BP Response to Deepwater Horizon Oil Spill

204

205

206
Figure 27: Timeline of BP Response to Deepwater Horizon Oil Spill

207
6.5 Handling of Disruption by BP
BP committed itself to sharing the lessons learned within the energy industry and
the wider community. It created an internal investigation team, led by BP’s head of
safety and operations, immediately after the explosion inviting the expertise of more
than 50 technical and other specialists.
The findings below are based publically available reports and testimony under oath
from the internal investigation from BP and the various agencies:
The Deepwater Horizon Joint Investigation, a combined effort of the US Coast
Guard Marine Board of Inquiry and the US Department of Interior, Bureau of
Offshore Energy Management Regulation and Enforcement.
The National Commission on the BP Deepwater Horizon Oil Spill and
Offshore Drilling, also known as the Presidential Commission. This
commission was created by President Obama on 22 May 2010 as an
independent, non-partisan entity to thorough investigate and assess the causes,
responsibilities, immediate and long-term response.
The National Academy of Engineering.
The US Chemical Safety Board.
The US Congress.
The US Department of Justice.
The US Securities and Exchange Commission.
The US Coast Guard.
6.5.1 Assessment of Causes
From a geological perspective, each well is unique. The structure of the rock
formation, depth and pressure of the layers containing hydrocarbons, compositions
of those reserves and of course the drilling location make each drilling operation a
unique process. Well blow-outs, in which the drilling or production platform loses
control over well pressure, present a major risk and while difficult to predict, are
typically preceded by early warning signs. The most obvious objective of the team is
to understand the conditions, engineer accordingly and closely monitor conditions.

208
Once the event occurs, pressure can rise explosively as the gas and oil travel
upward. Fast response is critical to ‘shut-in’ the well or diverts the hydrocarbons
away from any ignition sources, equipment and workers. Seconds and minutes
count: the tremendous volume of gas can quickly engulf a large area; the explosion
that ripped through the Deepwater Horizon killed the drill team instantly but also
destroyed equipment that was could have helped re-seal the well. Designing the
safety mechanisms for surviving such a blast is a major challenge.
Once the rig was essentially abandoned and lost, the race against time began to
permanently ‘kill’ the well. Oil was leaking at an unknown rate – five kilometers
down – from multiple locations. Getting consistent information was difficult at
those depths, information that the public and government demanded. The public
and government lost confidence in BP’s ability to handle the crisis as estimates on
the rate of oil spill increased. Threat of extensive government sanctions against BP
created shareholder concern as well. BP Upstream and its partners struggled to
adapt known mechanisms for well-control to the harsh deepwater conditions. The
only permanent, but not entirely reliable solution, would be drilling a relief well – in
fact, two well, should one fail. Shorter-term engineering efforts were attempted and
failed. Worst-case scenarios were reviewed in the Unified Command’s various
technical teams; public and academic input – solicited by BP – went to extreme
measures, even use of nuclear explosion to seal the well.
As the oil spread was carried by currents, it threatened the coast areas and marine
life. Oil recovery and spill control mechanisms were put in place – though little new
technical advancement had been made since recovery efforts 20 years earlier.
Political pressure on coastal protection triggered investment – and hence financial
compensation due from BP – on measure that proved ineffective.
Legal and criminal investigation was immediately initiated; placing restrictions on
the way information could be retrieved and published. BP faces on-going litigation,
which could dramatically increase its exposure. The impact of the event will be felt
by BP and the environment long after the oil stopped flowing into the Gulf of
Mexico.

209
6.5.2 Overview of BP Response
Within a week of the explosion, BP embarked on what would become a massive
effort to generate containment options, either by adapting shallow-water technology
to the Deepwater environment, or by designing entirely new devices.
Even after the blowout during efforts to contain the spill BP continued to
demonstrate overconfidence: “The government saw its pushback as essential
because BP would not, on its own, consider the full range of possibilities.
According to one senior government official, before the increased supervision, BP
‘hoped for the best, planned for the best, expected the best.’”
“Though willing to fund and carry out the response, BP had no available, tested technique to stop a Deepwater blowout other than the months-long process of drilling a relief well.”
Oil Spill Commission, 2010b: Congestions al testimony
BP's response plan revealed how ill-equipped the firm was in dealing with such a
crisis. BP had named Peter Lutz as a wildlife expert on whom it would rely; he had
died several years before BP submitted its plan to the MMS. BP listed seals and
walruses as two species of concern in case of an oil spill in the Gulf; these species
never see Gulf waters. And a link in the plan that purported to go to the Marine
Spill Response Corporation website actually led to a Japanese entertainment site.
The response has required the development of extensive systems, procedures and
organizational capabilities to adapt to changing and unique conditions. As the
Deepwater Horizon spill continued despite efforts at the wellhead, the response
effort progressed, expanded, and took on not just new tasks and directions but new
personnel and resources. As a result, from source to shore, existing systems were
evolved and expanded and new ones developed to advance workflow, improve
coordination, focus efforts and manage risks. The adoption of these systems will
ensure the ability to respond more rapidly at scale with a clear direction as to
personnel, resource and organizational needs.

210
Early-Warning Signs
The original well at Macondo was started by the Transocean Marianas, but halted due
to damage from Hurricane Ivan. This highlighted the challenging environments
and importantly set the schedule back by many weeks, creating significant time
pressure on BP management and the subcontracting support companies.
Transocean chose a 'condition based' inspection and maintenance schedule, in
contrast to Inspection status of the BOP. Cameron specified that the BOP should
be disassembled and inspected every 3 to 5 years; this was not implemented by
Transocean or BP.
Lost drill. The well collapsed at 12000 feet, and had to be drilled again
circumventing the collapsed well section. While this is not uncommon, the fragile
nature of the formation was demonstrated and merits additional precaution.
Disagreement in the drill team and BP on well design, in particular on use of
centralizers30.
Several changes to well design which were very rapidly approved by clearly
overburdened MME engineering in the New Orleans South office31.
Excessive pressure (x4) to convert the flow valves. The manufacturer states that the
maximum pressure was 260 psi to convert the valves (e.g. change the reversal of
flow, so that cement could flow and would not be pushed back into the drill pipe).
The metering indicated x4 times greater after several attempts – engineers
interpreted the data 'optimistically' assuming a 'bladder effect' (reserved pressure)
could cause the anomaly.
30 OSC - Oil Spill Commission (2011a) 31 OSC - Oil Spill Commission (2011a)
211
Halliburton cement formulation. In testing during April 2010, cement engineers
found it very difficult to create a nitrogen gas-rich mix that would set at the
pressures and time required. No information to this effect was passed to the rig.
Later tests by Chevron after the accident with comparable materials showed the
cement formulation was generally unstable.
Negative pressure test left inconclusive results. The drill team used the kill-line
pressure to indicate the cement was sealed properly against high well pressure.
Increasing pressure in the well after negative pressure testing was concluded. The
rig crew was busy with replacing some 8300 feet of drilling mud with seawater to set
a high-level cement plug. The returned mud was assessed to detect hydrocarbon
('sheen test'); no oil was visible at that moment. This was a 'kick indicator’;
showing that the well had been comprised and gas or oil was entering the well bore.
A driller, assistant driller, or mudlogger watching the Sperry-Sun monitors screen
could have seen it.
At 21.40 PM, Mud erupted on to the rig in a geyser, raining down on the drilling
platform and the nearby support ship32. Sometime between 21.40 and 21.43 PM,
mud overflowed onto the rig floor, shot up to the top of the derrick, and poured
down onto the main deck33.
Gas could be heard rushing out of the well with the mud in a high-pitched hiss for
some minutes. Gas alarms were turned off in the drilling area, and only went off
when gas was detected in a very wide area covering the rig, seconds before the first
explosion.
Conclusions of BP and External Investigations
With recovery and analysis of the BOP, and extensive simulation and analysis, the
technical sequence Macondo blow-out and oil spill is essentially complete. A
sequence of management and operational decisions, along with failure of multiple
technical elements prevented the crew of avoiding the disaster at multiple instances.
32 OSC - Oil Spill Commission (2011c) 33 OSC - Oil Spill Commission (2011c)

212
The National Commission’s report to the President quoted the Board that
investigated the loss of the Columbia space shuttle, “Complex systems almost
always fail in complex ways.”
BP's investigation emphasized the complexity of the environment: The team did
not identify any single action or inaction that caused this accident. Rather, a
complex and interlinked series of mechanical failures, human judgements,
engineering design, operational implementation and team interfaces came together
to allow the initiation and escalation of the accident. Multiple companies, work
teams and circumstances were involved over time34.”
Nevertheless, the Commission’s report found that the accident was caused by “the
cumulative risk that resulted from these decisions and actions was both
unreasonably large and avoidable 35 ” and “could have been prevented 36 ”.
Specifically, the commission concludes “BP’s fundamental mistake was its
failure…to exercise special caution (and, accordingly, to direct its contractors to be
especially vigilant) before relying on the primary cement as a barrier to hydrocarbon
flow37.”
Response to the spill was also hampered by years of underinvestment. “Investments
in safety, containment, and response equipment and practices failed to keep pace
with the rapid move into Deepwater drilling38.”
34 BP (2010) 35 OSC - Oil Spill Commission (2011a) 36 OSC - Oil Spill Commission (2011a) 37 OSC - Oil Spill Commission (2011a) 38 OSC - Oil Spill Commission (2011a)

213
Additional findings from BP investigation are:
Well Design
BP’s decision to choose a well design consisting of a long string production casing instead of a liner led to a higher risk of cement failure.
BP installed only six centralizers on the production casing instead of the recommended 21 centralizers. Furthermore, BP neglected to inform Halliburton of the number of centralizers installed.
BP replaced 3,300 feet of heavy drilling mud with lighter seawater and this put unnecessary stress on the cement job.
Risk assessment
BP made multiple changes to the temporary abandonment procedures in the weeks prior to the blow out but the changes did not go through any sort of formal risk assessment or review process.
Monitoring
When the BP and Transocean staff on the rig noted an anomalous pressure reading while attempting to convert float valves they concluded that the pressure gauge they had been relying on was broken. “BP’s team appears not to have seriously examined why it had to apply over four times the 750 psi design pressure to convert the float valves.”
In the minutes prior to the blowout the Transocean crew failed to notice an increase in pressure in the well—they failed to recognize that a natural gas kick was occurring until it was too late and the blowout was uncontrollable.
The Commission cites a lack of automated alarms in the displays used to monitor well pressures as a contributing factor.
Training
Failure of the Deepwater Horizon’s Blow-out Preventer, possibly due to poor
maintenance, was a major contributing factor in the blowout.
Training of key engineering and rig personnel was inadequate.
Communication
There was a lack of communication within BP - for instance between offshore and
onshore staff and poor communication between BP and its contractors.
Information was compartmentalized and not fully shared.

214
6.5.3 Coding and Categorisation of Data from BP Deepwater
Horizon
Warning – Develop advance warning system
Examples:
Manage distractions during well pressure monitoring (which inhibited early
detection).
Implement gas detection systems for early warning (drill floor level alarm was
turned off).
Provide shift change information from night to day shift (missing on the
morning of event)
Assure usability (Driller's display screen was difficult to interpret; pressure
anomaly went unnoticed).
Provide on-shore real time monitoring facility.
Codes: monitoring, training, roles, preparation, warning, real-time and remote
The Deepwater Horizon had a number of alarm systems installed, including one to
alert the crew to presence of potentially explosive gas. The alarms on the rig floor
had both visual and sound indicators. However, according to Mike Williams, some
were turned off (inhibited, in his words) “the explanation I got was that they did
not want people woke up at 3:00 o'clock in the morning due to false alarms”
referring to instruction from the Offshore Installation Manager. Had the alarm
system been active in key areas, the Emergency Disconnect Sequence would have
shutdown the equipment at risk, and alerted the crew to presence of gas in
dangerous areas.
Andrea Fleytas was the Transocean DPO on duty in charge of the alarm panel at
the time of the blowout. After feeling a first jolt and noticing multiple combustible
gas alarms sounding throughout the rig, she did not immediately hit the general
alarm. At the time, she received a call from the engine control room asking what
was going on but did not instruct them to shut down the engines despite the
multiple combustible gas alarms sounding throughout the rest of the rig. Fleytas
said in her testimony, when asked why she hesitated “It was a lot to take in. There

215
was a lot going on.” Fleytas said that Transocean provided no formal training or
simulations on how to respond to combustible gas alarms.
Decision
Was There A Less Risky Alternative Available?
Less Time Than
Alternative? Decision Maker
Not waiting for more centralisers of preferred design
Yes Saved Time BP on shore
Not waiting for foam stability test results and/or redesigning slurry
Yes Saved Time
Not running cement evaluation log Yes Saved Time BP on shore Using spacer made from combined lost circulation materials to avoid disposal issues
Yes Saved Time BP on shore
Displacing mud from riser before setting surface cement plug
Yes Unclear BP on shore
Setting surface cement plug 3,000 feet below mud line in seawater
Yes Unclear BP on shore
(Approved by MMS) Not installing additional physical barriers during temporary abandonment procedure
Yes Saved Time BP on shore
Not performing further well integrity diagnostics in light of troubling and unexplained negative pressure test results
Yes Saved Time BP (and perhaps
Transocean) on Rig
By passing pits and conducting other simultaneous operators during displacement
Yes Saved Time Transocean (and
perhaps BP) on Rig
Table 29: Examples of Decisions that Increased Risk at Macondo while Potentially Saving Time
Source: OSC-Oil Spill Comission (2010c)
Stress testing – Conduct stress test
Examples
Testing prior to deployment of equipment (e.g. BOP was not tested).
Testing for stability (Positive and negative pressure tests of well integrity).
Verification of inputs (Incorrectly interpreted cement testing during formulation
by Halliburton)
Codes: testing, modelling and verification
BP contracted a number of tests to be performed by Halliburton, the contractor
responsible for cement formulation and pumping, and the Transocean crew that
would run a set of positive and negative pressure test.
To prevent oil and gas from escaping an exploration or abandoned well, and assure
stability of product wells, cement is used to reinforce the well. Specially formulated

216
cement slurry is used according to the characteristics of the well such as pressure,
temperature, depth and surrounding fluids.
Cement slurry requires testing on shore prior to use. Because the pressure and
temperature at the bottom of a well can significantly alter the strength and curing
rate of a given cement mix - and because storing cement on a rig can alter its
chemical composition over time - companies like Halliburton normally fly cement
samples from the rig back to a laboratory shortly before pumping a job to make
sure the cement will work under the conditions in the well. The laboratory conducts
a number of tests to evaluate the slurry’s viscosity and flow characteristics, the rate
at which it will cure, and its eventual compressive strength.
On February 10, soon after the Deepwater Horizon began work on the well,
Halliburton laboratory personnel ran a series of pilot tests on the cement blend
stored on the Deepwater Horizon that Halliburton planned to use at Macondo.
Halliburton sent the laboratory report to BP on March 8 as an attachment to an e-
mail in which he discussed his recommended plan for cementing an earlier
Macondo casing string.
According to the Commission, experienced cement engineers would immediately
see that the February foam slurry design was unstable. Halliburton did not
comment on the evidence of the cement slurry’s instability, and there is no evidence
that BP examined the foam stability data in the report at all. It appears that
Halliburton never reported the results of the earlier February test to BP.
Halliburton conducted another round of tests in mid-April, just before pumping the
final cement job. By then, the BP team had given Halliburton more accurate
information about the temperatures and pressures at the bottom of the Macondo
well, and Halliburton had progressed further with its cementing plan. Using this
information, the laboratory personnel conducted several tests, including a foam
stability test, starting on approximately April 13. The first test Halliburton
conducted showed once again that the cement slurry would be unstable. The
Commission does not believe that Halliburton ever reported this information to
BP. Instead, it appears that Halliburton personnel subsequently ran a second foam
stability test, this time doubling the pre-test conditioning time to three hours.

217
Negative Pressure test
“The negative-pressure test was accepted although well integrity had not been
established. The Transocean rig crew and BP well site leaders reached the incorrect
view that the test was successful and that well integrity had been established. ” .
Not all agreed, including Whelan Weeler, an experienced drilling engineer badly in
injured in the blow-out. “Wheeler was “convinced that something wasn’t right,”
recalled Christopher Pleasant, a subsea supervisor. Wheeler couldn’t believe the
explanations he was hearing. But his shift was up.
Failure to run final tests
During the rig's daily 19.30 operations conference call to BP in Houston, engineer
Morel discussed the good news that the final cement job at the bottom of the
Macondo well was successful. To ensure the job did not have any problems, a
three-man Schumberger team was scheduled to fly out to the rig later that day, able
to perform a suite of tests to examine the well's new bottom cement seal. According
to the BP team's plan, if the cementing went smoothly, as it had, they could skip
Schlumberger's cement evaluation, saving time and the USD 128,000 fee.
Blow Out Preventer (BOP)
Through a review of rig audit findings and maintenance records, the investigation
team found indications of potential weaknesses in the testing regime and
maintenance management system for the BOP. In fact, the Commission identified
many areas where BP saved time or money by avoiding test procedures.
Training – Implement training
Examples
Educate staff on failure modes (Blow out prevention school for key engineers).
Provide online information resources (Online electronic bulletins and document
databases).
Codes: training, learning, communication and teamroom
Influx of high-pressure oil and gas was not recognized until hydrocarbons were in
the riser, connecting the well with the rig. With the negative-pressure test having

218
been accepted, the well was returned to an overbalanced condition, preventing
further influx into the wellbore. Later, as part of normal operations to temporarily
abandon the well, heavy drilling mud was again replaced with seawater, under
balancing the well. Over time, this allowed hydrocarbons to flow up through the
production casing and passed the BOP. Indications of influx with an increase in
drill pipe pressure are discernable in real-time data from approximately 40 minutes
before the rig crew took action to control the well. The rig crew’s first apparent well
control actions occurred after hydrocarbons were rapidly flowing to the surface.
The rig crew did not recognize the influx and did not act to control the well until
hydrocarbons had passed through the BOP and into the riser.
Well control response actions failed to regain control of the well. The first well
control actions were to close the BOP and diverter, routing the fluids exiting the
riser to the Deepwater Horizon mud gas separator (MGS) system rather than to the
overboard diverter line. If fluids had been diverted overboard, rather than to the
MGS, there may have been more time to respond, and the consequences of the
accident may have been reduced. The float collar used in the cementing process
did not initially operate as intended and required 9 attempts with higher than usual
pressures to function properly. Moreover, the float test performed after cementing
may not have been definitive, leading to concern that there may have been
contamination of the cement due to density differences between the cement and the
drilling mud.
Teamwork – Create integrated response team
Examples
Establish integrated response team (BP and related parties setup a response
team known as the ‘Unified Command”).
Establish investigation team (BP set up an internal investigation team).
Codes: investigation, cross-functional, learning, war-room and communication
BP created an integrated response team called ‘Unified Command’. This command
structure was established to manage the response to the disaster. It subsumed the
spill's "responsible party" (in this case, BP) with federal and state officials in a single
organization. The Coast Guard established its Unified Area Command -

219
headquarters for the regional spill response—on April 23 in Robert, Louisiana, later
moving it to New Orleans.
Learning – Learning from previous events
Examples
Investigate root cause.
Establish forums to accumulate and manage learning.
Codes: investigation, learning, root cause, external, industry, expert, litigation and criminal
A number of formal bodies were established or involved in capturing the lessons
learned from the event, with documentation in the public domain including:
National Commission on BP Deepwater Horizon Oil Spill Offshore Drilling.
Chief Counsel's Report.
Coast Guard ISPR and BOEMRE Joint Investigation
DNV BPO Report on key equipment
Department of Justice Investigation on potential criminal liability.
These investigations provided input to investigation of potential criminal liability.
Upon reading the BP internal report, Richard Sears, the Commission’s Chief
Scientific and Engineering Advisor, commented “it appeared that for BP the
accident happened at 9:49 p.m., on April 20; whereas in some ways, the blowout
began in early 2009 when they initially designed the well.”
As the largest of the off-shore exploration and drilling companies, both BP and
Transocean had access to a wealth of experience – successes and challenges – from
which to learn. Nevertheless, previous events had occurred and while investigation
was performed, the lessons were not necessarily made sufficiently visible to
otherwise trained personnel on the Deepwater Horizon.
For example, a set of incidents occurred at the Grangemouth Complex, Scotland,
one of Europe’s largest refineries that process a significant percentage of North Sea
oil. Three separate incidents – Power failure on 29th May, a steam rupture on the 7th
of June, and fire in a Catalytic Cracker Unit on 10th June 2000 did not cause loss of
life, but highlighted important lessons and resulted in BP being fined some GBP
1M. The report highlights that “BP Group and Complex Management did not

220
detect and intervene early enough on deteriorating performance” as stated in the
Grangemouth executive report.
More broadly, it stated “Major accident hazards should be actively managed to
allow control and reduction of risks. Control of major accident hazards requires a
specific focus on process safety management over and above conventional safety
management.”
Also in the North Sea, the BP Forties Alpha production platform was flooded with
methane when a gas line ruptured. Unlike the calm conditions that contributed to
gas formation on the Horizon, wind moved gas from the Forties Alpha and no
ignition source was present. BP admitted breaking the law by allowing pipes to
corrode on the Forties Alpha and paid a USD 290,000 fine.”
Other platforms were not as lucky. Occidental Petroleum's Piper Alpha exploded
and sank, with 167 fatalities. Common contributing factors included inadequate
safety assurance, worker training, and evacuation procedures. Poor communication
and confusion about lines of authority amplified the death toll in at least two of the
accidents.
The Commission also cited Transocean’s failure to communicate lessons from an
earlier near-blowout in the North Sea some months earlier. The crew of the
Deepwater Horizon was not aware of this event nor the safety lessons gained from
it. On December 23, 2009, gas entered the riser while the North Sea rig was
displacing a well with seawater during a completion operation. Following similar
procedures to the Deepwater Horizon team, the crew had already run a negative
pressure test on the lone static barrier between the pay zone and the rig and deemed
it successful. The tested barrier failed during displacement. Hydrocarbons flowed
into the well, and mud spewed from the rig floor. Unlike at Macondo, the crew was
able to shut in the well before a blowout occurred but not until nearly one metric
ton of oil-based mud had spilled into the ocean. The incident cost Transocean 11
days of additional work and more than GBP 5 Million.
The Macondo Prospect was referred to as the “well from hell”, as stated by Natalie
Roshto in congressional testimony, due to similarities to a unsuccessful, ultimately
abandoned well known as Devil's Tower that share many characteristics. Ms.

221
Roshto was quoting her husband Shane Roshto, an experienced toolpusher who
died during the explosion. Shane Roshto told her "Mother nature just doesn't want
to be drilled here39" some weeks before the accident occurred. The BP drilling
engineer responsible for the well design echoed that sentiment, sending an email on
14 April “this has been nightmare well which has everyone all over the place.40”
External communication – Establish frequent communications with partners
Examples
Improve communication with key suppliers (e.g. Halliburton communication of
cement test results was incomplete).
Increase frequency of press and public communications-daily press briefings.
Use Real-time video camera feed (‘spillcam)’.
Participate in formal testimony (Congressional hearings after the event.)
Create new one-to-many networking systems (Radio relay network for
thousands of ships and team to coordinate response)
Invite external experts (academic, industry) to assist in design.
Codes: communication, partner, frequency, testing, verification, public, press, frequency, real-time,
video, investigation, coordination, expert and industry
Halliburton, the cementing contractor, advised BP to install numerous devices to
make sure the pipe was cantered in the well before pumping cement, according to
Halliburton documents, provided to congressional investigators and seen by the
Journal. Otherwise, the cement might develop small channels that gas could
squeeze through.
Relationship with Competitors – Established relationship with competitors
Examples
Outsource tasks before or after event (Chevron for cement testing).
Add capacity from competitors (Shell help BP adding capacity by provides ships
for clean up).
39 Oil Spill News (2010) 40 Keim (2010)

222
Create industry group to increase capacity, reserve and experience (Marine Well
Company formed after event to facilitate recovery and reduce cost of reserve).
Codes: competitor, capacity, industry and reserve
The Vessels of Opportunity program was a way for BP to provide some income to
local residents outside of a formal claims process. Through the program, BP
employed private vessels to conduct response efforts such as skimming, booming,
and transporting supplies. Vessels of opportunity made between USD 1,200 and
USD 3,000 per day, depending on the size of the boat. Individual crewmembers
made USD 200 for an eight-hour day.
In response, the State of Louisiana began its own program, as did several local
governments. The Unified Command struggled to coordinate this floating militia of
independent vessels and to give them useful response tasks. Having hundreds of
vessels look for oil did not contribute significantly to the response, because aircraft
were more effective at spotting oil. Placing boom requires skill and training, and
responders differed in their judgements of how much the vessels contributed.
Marine Well Containment Co. is a new organisation; it was formed after the
Deepwater Horizon even in 2010 by some of the largest firms operating in the Gulf
of Mexico including ExxonMobil, Chevron, ConocoPhillips, Shell and eventually
BP. The not-for-profit organization is tasked with bringing together expertise and
systems for addressing a range of blowout and spill scenarios. The initial
investment to construct new subsea and modular process equipment is expected to
be approximately USD 1 Billion, in a large part based on the techniques developed
during the Macondo disaster.
Employee capacity - Assure management and employee capacity
Examples
Protect staff (Rig was quickly abandoned to avoid further casualty)
Leverage staff for immediate response (Rig personnel who survived the blast
were pressed into fire-fighting duty).
Assure safety of all employees (Search for survivors for about 27 hours).
Codes: capacity, employee, reserve

223
Production capacity – Increase capacity by improving recovery capacity
Examples
Add recovery capacity (Extend recovery and oil burning with additional support
ships and rigs).
Source new type of capacity (Hire and re-purpose fishing vessels unable to
operate, solving capacity and political pressures through commercial partnership
with those affected by the spill).
Replicate core production capacity (Employ Transocean rigs for drilling relief
wells)
Source capacity widely (Leasing of clean-up from across the industry world-
wide, e.g. Q4000 ship).
Codes: capacity, sourcing, flexibility
Product design – Develop new products by implement most robust solution
Examples
Implement solution with highest assurance to succeed (Initiate Relief well
drilling as soon as feasible).
Codes: speed, risk
Increase flexibility – Improve operational scope of scare equipment
Examples
Redesign equipment for faster deployment across different use-cases (more
flexible rig and seafloor equipment to reduce points of failure and costly re-
tooling).
Codes: design, flexibility, speed

224
6.5.4 Response Time at BP Deepwater Horizon
D1 - Detection of the Event
According to an extensive set of interviews by BP internal investigation, the
national commission and in congressional hearing after the event and the
monitoring data accumulated offshore, there were numerous signs prior to the well-
blow out when BP and its partners could have anticipated the event and initiated
mitigation action.
While earlier detection may not have enabled the team to avoid loss of well control
– maintenance and testing of equipment did not assure all preventative systems
were working – faster reaction could have enabled more appropriate steps.
D2 – Design of a Solution
BP was in the process of reorganizing its management structure at the time of the
blowout to clarify reporting relationships for engineers. The reorganization
complicated the task of identifying the precise lines of authority and areas of
responsibility, both at the time of and in the months leading up to the blowout. In
addition, because of the reorganization, many of the managers overseeing the
Macondo team had only a few months of experience in their respective positions at
the time of the blowout.
Internal Organisation
At the beginning of April, BP conducted a major reorganization of its exploration
business unit, including the BP Macondo team, creating separate reporting
structures for engineering and operations. The reorganization also led to questions
about authority and accountability.
In March, for example, operations to control the well after a kick led to
disagreements between BP’s managers on the Macondo team. BP engineering team
leader David Sims wrote BP well team leader John Guide: “We cannot fight about
every decision.... I will hand this well over to you in the morning and then you will
be able to do whatever you want.”

225
Internal and External Expertise
BP did not always use its internal technical experts effectively. “Yeah, well no one
told us what the actual decision was, so we thought y‘all were going with the
liner....” BP is now developing standards on how to consult internal experts and
hiring more cementing experts.
Every stage of the exploration and production cycle in hydrocarbon energy industry
involves a significant number of parties, who in turn will often source individual
engineers and workers on a contracting basis.
In addition to sharing real time information to the BP Houston centre, a number of
other mechanisms were used to communicate between teams including email.
D3 – Deployment of the Solution
According to the Rand Corporation, “Remedies must be designed and tested to
work under the actual operating conditions. This is the biggest lesson from the
Deepwater Horizon spill. All of the remedies fielded during the first 40 days of the
spill were not effective because they had not been tested or proven to work in
deepwater drilling conditions.”
In managing the oil spill, following the failure of the top kill, BP engineers turned
away from attempting to shut the well in, for fear that instability in the well could
lead to an "underground blowout," with oil and gas flowing into the ocean from
many points on the sea floor. This would make containment nearly impossible, at
least until the completion of a relief well. Thus, in the aftermath of the top kill, BP
and the government focused on trying to collect the oil, with the relief wells still
providing the most likely avenue for killing the well altogether.
It became increasingly clear in the weeks after the explosion that neither BP, its
industry partners nor the government had the experience and resources to quickly
deal with an oil spill on the scale of the Macondo disaster.
The Commission identified three gaps in the government’s existing response
capacity: (1) the failure to plan effectively for a large-scale, difficult-to-contain spill
in the deepwater environment or potentially in the Arctic; (2) the difficulty of
coordinating with state and local government officials to deliver an effective

226
response; and (3) a lack of information and understanding concerning the efficacy
of specific response measures, such as dispersants and berms.
BP had a team ready to proceed with new collection tools almost immediately. On
May 29, the company and the government announced that BP would attempt to cut
off the portion of the riser still attached to the top of the BOP and install a
collection device - the "top hat" - which would then be connected via a new riser to
the Discoverer Enterprise above. By June 8, the Discoverer Enterprise was collecting
nearly 15,000 barrels of oil per day.
BP also developed a system to bring oil and gas to the surface through the choke
line on the BOP. BP outfitted the Q4000, a vessel involved in the top-kill effort,
with collection equipment, including oil and gas burner imported from France.
After it became operational on June 16, the Q4000 system was able to process and
burn up to 10,000 barrels of oil per day.
On occasion, BP was overly optimistic about the percentage of the oil it could
remove or collect, with officials saying that the approach would allow for the
collection of the "vast majority" of oil. But when the Q4000 came online in mid-
June, the two vessels' joint capacity of 25,000 barrels per day was still insufficient.
Not all mechanisms proved effective, and some were used primarily for political
reasons.
Financial and Legal Impact
The oil spill may prove to be one of the costliest industrial accidents ever.
A USD 20 Billion fund known as the Gulf Coast Claims Facility, was created by BP
under the direction of the US Federal Government to cover costs related to
environmental damage, personal injury, clean-up and lost earnings by affected Gulf
Coast businesses. By the end of 2010, the fund had paid out USD 2.7 Billion to
address nearly 168,000 claims.
In the weeks following the blow-out, BP's share price dropped from USD 60.57 to
a low of USD 27.02 on 25 June 2010, wiping 100 Billon from its market
capitalisation (NYSE). The share price recovered to USD 47.41 (10 March 2011),

227
with downstream prices reaching historic highs as political turbulence disrupted
activities in oil-producing countries in the Middle East.
BP faces, in the view of some experts, 20 years of litigation. The US Federal
government is suing for USD 21 Billion in fines, and has consolidated all criminal
investigations under the Deepwater Horizon Task Force. Citigroup estimated at
that time that an additional USD 6 Billion in lawsuits could be filed.
In 2011, BP plc. announced it would be selling substantial refinery capacity (Texas
City, Carson City), for an anticipated USD 5 Billion, to help offset expected pay-out
from the disaster. Table 30 shows a summary of finding from BP Deepwater
Horizon in related to the 3-D framework.
Tailored approaches Examples from BP Response to Deepwater Horizon Oil Spill
D1 D2 D3
Develop advanced warning system
Well pressure monitoring: distractions while working prevented early detection.
Gas detection systems for early warning (example: drill floor level was alarm was turned off)
Lack of shift change information from night to day shift.
Driller’s display screen (Sperry-Sun) difficult to interpret, e.g. (pressure anomaly unnoticed)
No on-shore real-time monitoring facility.
Conduct stress testing Engineering tests prior to deployment of equipment (example: BOP was not tested).
Positive-pressure tests of well integrity. Negative-pressure test of well integrity. Cement testing during formulation by Halliburton.
Develop scenario plan and modelling capability
Model of gas flow and explosion on the rig. Cement model software at Halliburton Independent testing of cement formulation by Chevron
and CSI. OLGA software well-flow modelling. Simultaneous Operations using storyboarding to
coordinate operations after the event. Oil spill modelling after the event. Forensic study of BOP after it was retrieved from the
sea floor (flow modelling, finite element modelling).
Leverage preparedness plan
Blow-out procedures during well completion. Rig abandonment procedures.
Implement training Blow out prevention school for key engineers Online electronic bulletins and document databases.
Establish frequent communications with supply chain partners
Improve communication with key suppliers: e.g. Halliburton communication of cement test results was incomplete.
Increased frequency of press and public communications-daily press briefings.
Real-time video camera feed (‘spillcam)’. Congressional hearings after the event. Radio relay network for thousands of ships and team to
coordinate response. Invite external experts (academic, industry) to assist in
design.

228
Table 30: A Summary of Finding from BP Deepwater Horizon
Tailored approaches Examples from BP Response to Deepwater Horizon Oil Spill
D1 D2 D3Establish relationship with competitors
Outsourcing key tasks (Halliburton, Chevron, etc.) before and after event.
Shell help BP adding capacity by provides ships for clean up.
Marine Well Company formed after event to facilitate recovery and reduce cost of reserve.
Create integrated response team
BP internal investigation team. Established integrated response team called “Unified
Command”.
Establish learning from past events and during the events
BP investigation team on root-cause and possible mitigation.
National Commission on BP Deepwater Horizon Oil Spill Offshore Drilling
Chief Counsel’s Report Coast Guard ISPR and BOEMRE Joint Investigation DNV BPO Report on key equipment. Department of Justice Investigation on potential
criminal liability.
Assure management and employee capacity
Rig was abandoned relatively quickly to avoid further casualty.
Leverage rig personnel in immediate fire-fighting operations.
Extensively staffed 27 hours search for survivors.
Increase capacity Oil recovery and burning facilities put in place to reduce impact of spill.
Hire wide group of existing fishing vessels to assist in recovery (‘Vessels of Opportunity’)
Develop product or solution extensions
Initiate Relief Well drilling immediately. Develop new design solutions in place (Top Hat, Oil
Boom, Artificial Barrier, Top Kill, Skimmers, Junk Shot, BOP activation)
Acquire additional suppliers
Relief well drilling using capacity from Transocean. Leasing of clean-up equipment from across the
industry.
Increase flexibility Design of rigs for multiple operations (exploration, drilling, production on both gas and oil)
Increase inventory Deploy remotely operated vehicle (ROV) with more flexible tooling

229
Chapter 7 Validation with Disruption at BP Texas City
7.1 Company Overview
BP Products North America Inc. is part of BP plc with headquarters in London,
England. In 2005, it was the third largest energy company and fourth largest
company by revenue of any kind. The Texas City refinery, where the explosion
occurred, was BP's largest oil refinery with thirty process units spread over 1,200
acres and 1,600 permanent employees. There were approximately 800 additional
contractor staffs are on site for significant turnaround work at the time of the
incident. Prior to 1999, Amoco owned the refinery. BP merged with Amoco in
1999 for GBP 67 Billion and BP subsequently took over operation of the plant. It
was the largest corporate acquisition ever41.
The plant processes over 430,000 barrels of crude oil a day and produce about 11
million gallons of gasoline a day. The refinery also produces jet fuels, diesel fuels
and chemical feedstocks. It is one of five BP refineries in North America, produces
30 percent of BP's North American gas supply and 3 percent of the U.S. supply
(2005) 42 . About 31,000 people live within a three-mile radius of the refinery,
according to Census data.
The refinery ranks as the eighth largest polluter in the state of Texas (disregarding
March 23, 2005 explosion). It released 5.1 million pounds of pollutants in 2002,
according to the latest data, including some chemicals that are known carcinogens
and cause other serious health effects.
Texas City is also the site of the worst industrial accident in U.S. history. In 1947, a
fire aboard a ship at the Texas City docks triggered a massive explosion that killed
576 people and left fires burning in the city for days.
41 CBS (2007) 42 OSHA (2005)

230
7.2 Background of BP Texas City Refinery Explosion
At 13.20 PM on March 23, 2005, a series of explosions occurred at the BP Texas
City refinery during the restarting of a hydrocarbon isomerization unit. Fifteen BP
employees and contractors were killed and 180 others were injured. Many of the
victims were in or around work trailers located near an atmospheric vent stack, in
violation of safety regulations. The explosions occurred when a distillation tower
flooded with hydrocarbons and was over pressurized, causing a geyser-like release
from the vent stack. The event triggered an extensive review of management and
operational practices in BP and the refining industry.
7.3 Companies and Parties Involved
After the shock of the explosion, the site was secured and four agencies team were
established to immediately determine the causes of the explosion on 24 March
2005. An overview of the investigations is presented below.
United States Chemical Safety and Hazard Investigation Board (CSB)
The U.S. Chemical Safety and Hazard Investigation Board, also known as the
Chemical Safety Board or CSB, is a U.S. federal agency charged with investigating
industrial chemical accidents. Headquartered in Washington, DC, the agency's
board members are appointed by the President and confirmed by the Senate. The
CSB conducts root cause investigations of chemical accidents at fixed industrial
facilities, looking into all possible causes of chemical accidents, ranging from
equipment failure to safety management.
The scope of the investigation
The board conducted the broadest investigation of the plant explosion, initially
estimated to take at least a year. It was not restricted just to determining BP
compliance with state or federal regulations. It interviewed witnesses and employees
independently of other federal agencies. "We look at the whole issue of
management systems, root causes, and we come up with recommendations," said
chemical safety board member John Bresland. The board held one public meeting
halfway through the investigation, and another at the conclusion. The Board does
not assess fines, but can recommend them to other federal agencies.

231
Conduct of the investigation
Investigators from the CSB arrived at the facility on the morning of March 24,
2005. During the investigation, the CSB reviewed over 30,000 documents;
conducted 370 interviews; tested instruments; and assessed damage to equipment
and structures in the refinery and surrounding community. Electronic data from the
computerized control system and process information from five years of previous
startups were also examined. The CSB investigation team was supplemented by
experts in blast damage assessment, vapour cloud modelling, pressure relief system
design, distillation process dynamics, instrument control and reliability, and human
factors.
The results of the agency’s investigation
Two years after the tragedy in BP’s Texas plant, on March 20th, 2007, the CSB
published its Final Investigation Report consisting of incident overview, analysis of
safety system deficiencies in unit startups, incident investigation system deficiencies,
other safety system problems and also analysis of BP’s safety culture, description of
root and contributing causes of BP’s safety problems and recommendations for
future improvement..
Environmental Protection Agency (EPA)
The Environmental Protection Agency (EPA) is an agency of the federal
government of the United States charged with protecting human health and with
safeguarding the natural environment: air, water, and land. The EPA began
operation on December 2, 1970, established by President Richard Nixon.
The scope of the investigation
The EPA was charged with determining whether the explosion or fire released
hazardous material into the environment. The agency began air monitoring at the
plant and up to four miles away in surrounding communities, and one-half mile
downwind of the site. No dangerous chemicals were detected..
United States Occupational Safety and Health Administration (OSHA)
The United States Occupational Safety and Health Administration is the agency of
the United States Department of Labor.

232
The OSHA mission is to assure the safety and health of America's workers by
setting and enforcing workplace standards. Most American workers come under
OSHA jurisdiction. Investigators first secure the scene of a chemical plant accident,
interview employees and management and then look at the operation of the plant
and maintenance of equipment prior to the accident. By law, the team has up to six
months to complete its investigation.
The results of the agency’s investigation
On September 22nd 2005 OSHA and BP reached the agreement following OSHA’s
investigation of the accident. Under terms of the settlement, BP Marketing agreed
to:
Pay USD 21,361,500 in penalties and abate all hazards for which it was cited.
Complete a review of the ISOM unit to determine how it can be operated safely
and alert OSHA if and when a decision is made to start up the unit in the
future; retain a firm with expertise in process safety management (PSM),
including pressure relief systems, safety instrumented systems, human factor
analysis and performing process safety audits, to conduct a refinery-wide
comprehensive audit and analysis of the company's PSM systems.
Hire an expert to assess and report on communication within and between
management, supervisors, and authorized employee representatives and non-
management employees and the impact of the communication on
implementation of safety practices and procedures.
Submit to OSHA and BP Products' authorized employee representative, every
six months for three years, logs of occupational injuries and illnesses ("OSHA
300 Logs") and all incident reports related to PSM issues.
Notify the OSHA area office of any incident or injury at the Texas City facility that
results in an employee losing one or more workdays during the same three-year
period.

233
Texas Commission on Environmental Quality (TCEQ)
Texas Commission on Environmental Quality or TCEQ is the state's
environmental control agency, operates the most extensive pollution-monitoring
network in the country. It works with the federal EPA to measure whether harmful
agents were released by the accident. A spokesman for the state agency said that
their monitoring has not detected any dangerous emissions. Runoff from the water
and foam used to fight the fire was contained within the facility and did not enter
the storm drains, said spokesman Terry Clauson. The agency also inspected for
compliance with permits at the time of the explosion.
The results of the agency’s investigation
The 2005 annual average benzene concentrations reported near the Texas City Ball
Park site (1.06 ppbv), and BP-sponsored site (2.70 ppbv) are above the long-term,
health-based ESL of 1 ppbv. The comparison of the 2005 and 2004 annual average
concentrations indicated an increase at both sites, with an approximate 35%
increase at the BP-sponsored site. An evaluation of source identification near the
BP-sponsored site was performed using the hourly autoGC data from the BP-
sponsored site (see attachment 4.) indicates that higher benzene concentrations
were associated with winds blowing from the south. The 2005 annual averages
reported near both the BP-sponsored site and the Texas City Ball Park site were
attributed to frequent episodes of elevated benzene concentrations stemming from
an onsite explosion on March 21st, 2005 and a power outage due to Hurricane Rita
on October 3, 2005.
BP Internal Investigation
A BP group executive was assigned to lead the initial investigation and another
three individual from outside of the Refining business were formed to the team.
They took over the evidences gathering on March 26, 2005.
The preliminary investigation was performed over five weeks at the BP Texas City.
The investigation included the broadest evidences collection, visiting the incident
site, reviewing whole documents, interview the witnesses, tested instruments and
assessed damage on equipment and structures of refinery and surrounding
community. Photographs were taken as supporting documents on the investigation.
234
Electronic data from computerized control system and process information from
five years of previous start-ups were also examined. Chemical analysis and trial also
taken place and collected as part of the investigation.
All preliminary evidences gathered have been shared with four agencies team for
further investigation. The main outstanding work of publication of the report was
from:
Various process samples analysis.
Process instrument and equipment testing, such as relief valves.
Internal inspection of the Raffinate Splitter and Blowdown Drum and Stack.
Process and explosion modelling.
7.4 Timeline of the Disruption
A summary timeline of BP response to refinery explosion in Texas is shown in
Figure 28. Timeline of BP Response to the Refinery Explosion in Texas City. In
this study, the date 23 March 2005 is defined as ‘the event’ for purposes of analysis.
A full timeline of BP refinery explosion is shown in Table 31. (See also Appendix 5)

235
Date Time Events
21 February 2005 Raffinate splitter section of the ISOM unit is shut down; the 12-hour consecutive day
shift schedule begins.
26 February2005 Operators try to open/close the pressure control (3-pound) valve from the control
board; valve is unresponsive.
10 March 05 A revised work order to replace leaking isolation valves is added to the list of
turnaround work so that the level transmitter can be fixed.
22 March 2005
Operators again try to open/close the 3-pound valve from the control board, but valve is unresponsive. Supervisor A tells instrument technicians to stop checking the critical alarms because the unit is starting up and there is not enough time to complete the checks.
23 March 2005
2.15 AM The Night Lead Operator begins filling the tower with raffinate feed from the satellite control room.
3.09 AM
* This study defined this
point of time as ‘the event’ in analysis.
The tower high level alarm sounds when the level in the tower reaches 7.6 ft in the tower (72% on the transmitter). The redundant high level alarm switch does not sound when the tower level reaches 7.9 ft (78% on transmitter). The Night Lead Operator fills the tower, stopping when the transmitter reads 99%, which should have been 8.95 ft (2.7 m) in the tower, but is actually 13.3 ft (4 m).
5.00 AM The Night Lead Operator leaves the refinery a little over an hour before his scheduled shift leave time.
6.06 AM The Day Board Operator arrives at the refinery. 6.23 AM The Night Board Operator leaves the refinery. 7.15 AM Supervisor A arrives for his shift. 9.27 AM Operators open 8-inch NPS chain valve to remove nitrogen; the pressure in the tower
drops to near 0 psig (0 kPa). A verbal miscommunication occurs between operations personnel regarding feed-routing instructions.
9.40 AM The Day Board Operator opens the tower level control valve to 70% output for 3 minutes, then closes the valve.
9.51 AM Start-up of the raffinate unit recommences and the tower begins receiving more feed from the ARU. The Day Board Operator observes a 97% transmitter reading (which should have been an 8.85 ft, or 2.7 m, tower level) when he starts circulation.
9.55 AM Two burners are lit in the raffinate furnace. 10.47 AM Supervisor A leaves the refinery due to a family emergency; no supervisor or
technically trained personnel replaces him. 11.16 AM Two additional burners in the furnace are lit; the level transmitter reads 93%, which
should have been a tower level of 8.65 ft (2.6 m); but is actually 67 ft. (20 m). 11.50 AM Fuel to the furnace is increased; the actual tower level is 98 ft, but the transmitter
reads 88% (8.4 ft.; 2.6 m). 12.41 PM The tower's pressure rises to 33 psig (228 kPa); operators reduce pressure by opening
the 8-inch NPS chain valve. 12.42 PM. Fuel gas to the furnace is reduced; the actual tower level is 140 ft (43 m), but
transmitter reads 80% (8 ft; 2.4 m). 12.42 PM The Day Board Operator opens the tower level control valve to 15% output, then
tries several times to increase output over the next 15 min. 12.45 PM Approximately 25 people attend a safety meeting in the main control room until
~13.10 PM. 12.59 PM Heavy raffinate flow out of the unit finally begins. 13.02 PM Heavy raffinate flow out of the tower matches the flow of raffinate into the unit. 13.04 PM The actual level in the tower is 158 ft (48 m) but transmitter reading has declined to
78% (a level of 7.9 ft; 2.4 m). 13.11 PM Supervisor A and Lead Operator talk; Supervisor suggests opening a bypass valve to
relieve tower pressure. 13.14 PM Hydrocarbon flows out of the tower into overhead piping; tower pressure spikes to
63 psig (434 kPa); all three-relief valves open. The Board Operator begins troubleshooting the pressure spike; he notices the drum alarm had not sounded, so he resumes moves to reduce pressure believing there is a residual buildup of non-combustibles in the tower.
13.15 PM Fuel gas to the furnace is reduced. 13.16 PM The Board Operator fully opens the heavy raffinate level control valve. 13.17 PM The overhead reflux pump is started by outside operators. 13.19.59
PM The Day Lead Operator shuts off fuel gas to the furnace from the satellite control room.
13.20.04 PM
Vapour cloud ignites and explodes.
Table 31: Timeline of BP Refinery Explosion in Texas City

236
Timeline of BP Response to the Refinery Explosion in Texas City
Figure 28: Timeline of BP Response to the Refinery Explosion in Texas City

237
7.5 Handling of Disruption by BP
7.5.1 Assessment of Causes
Recovery from the Texas City disaster presented BP with significant challenges on a
number of levels and on a range of time scales.
Its first response was focussed on assuring the safety of employees and contractors,
and to contain the fires that continued to burn at the plant. The immediate loss of
life was tragic but limited, with the last body recovered the same day under rubble
and the majority of injured treated. The Texas City facility was large and only
partially closed.
Notably, the first phone call by the on-site management after the event was made to
a BP lobbyist in Washington, even before the site manager and the local executive
team were notified. Clearly, reputation risk was triggered by the event, in the
context of previous BP environmental and safety issues.
Process safety was also of immediate concern. The facilities were in an unknown
condition with an unknown volume of hydrocarbon discharged into the sewers and
atmosphere. Immediately, all non-essential personnel were restricted, and changes
were implemented to address the close proximity of trailers and meeting rooms to
process equipment.
BP faced litigation from the environmental damage and loss of life. BP was already
one of the largest polluters in Texas, and the event would increase by many factors
the volume of toxic chemicals in the air over the nearby population. It was essential
to secure all paper and electronic records and information that would be needed for
internal and external investigation.
BP had to understand not only the mechanics of the event but also the cultural,
policy and business factors that made the event possible. Four factors were
identified in the Internal BP investigation report – ‘Fatal accident investigation
report’ which was finished on 9 December 2009:
238
Loss of containment.
Raffinate Splitter Start-up Procedures and application of knowledge and skills.
Control of Work and Trailer Siting.
Design and Engineering of the Blowdown stack.
The failure to take emergency action resulted in loss of containment of
hydrocarbons, leading to the explosion. The inappropriate siting of work trailers
close to the blowdown stack put hundreds of employees and contractors at grave
risk. Had a warning been sounded, more could have escaped serious harm. Well-
understood system design and engineering would have reduced the risks of such an
event occurring, had recommended changes been implemented.
Longer term, BP faced a challenge in changing its management culture and policies,
not only to avoid such events, but also to respond faster when catastrophic failure
occurs.
7.5.2 Overview of BP Response
BP launched and completed the internal investigation that cooperated with other
agencies that carried out their own investigations. As stated in the BP’s statement
on CSB’s final investigation report, BP produced to CSB over 6,300,000 pages of
documents and made over 300 witnesses available for CSB interviews. More
importantly, BP created an Independent Panel, to assess process safety management
and safety culture (proper operation of equipment and handling of hazardous
materials) at BP’s US refineries. The Independent Panel undertook investigations,
and issued their report in January 2007. According to Panel’s findings, BP gained
false confidence in its safety culture before the blast as the result of effort put in
providing personal safety (meaning preventing workers’ falls or slips). This finding
is stated as opposed to CSB’s conclusion that the safety lapses had been clearly
linked to the budget costs in the 1999.
In the June 2007 BP, prompted by the Panel, appointed an independent monitor
whose task is to oversee safety improvements. For this position, Duane Wilson, a
retired vice president of refining, marketing, supply and transportation for
ConocoPhillips was chosen.

239
BP also reached an agreement with OSHA. Under terms of the settlement BP
agreed to fulfil six requirements (among them: to pay more than USD 21 Million in
penalties, complete a review of the ISOM unit, retain a firm with expertise in PSM,
hire an expert to assess and report on communication within and between
management, supervisors, and authorized employee representatives and non-
management employees and the impact of the communication on implementation
of safety practices and procedures, submit to OSHA and BP Products' authorized
employee representative, every six months for three years, logs of occupational
injuries and illnesses, notify the OSHA area office of any incident or injury at the
Texas City facility that results in an employee losing one or more workdays during
the same three-year period43.
7.5.3 Coding and Categorisation of Data from BP Texas City
Warning – Early warning before the event
Examples
Assure function of alarm system (High-level alarm sounded two minutes late
when much higher liquid level was received).
Visually inspect equipment (Broken physical sight equipment was present).
Alert worker population (No general alarm sounded, instead radio reports and
shouting to notify workers in the area).
Testing of alarms, which had not been done as required by standard operating
procedures.
Code: timing, warning, alarm, training, maintenance, monitoring, communication, verification,
testing
Before the explosion and the fire in March 23, 2005, BP had long history of safety
incidents, as follows, with 23 workers were killed in the 30 years prior to the ISOM
event.
In March 2004 there was a blast and fire at a BP refinery in Texas City, about 35
miles southeast of Houston. That explosion forced the evacuation of the plant for
43 OSHA (2005)

240
several hours, but no one was injured. The Occupational Safety and Health
Administration fined the refinery USD 63,000 in that blast after finding what it
called serious safety violations, including problems with the emergency shutdown
system and employee training. OSHA also fined the refinery this month for safety
violations after two employees were burned to death by superheated water in
September.
In August 2000, a fire erupted in a cooker unit at the plant, then known as BP
Amoco oil refinery. About 20 workers escaped without injury.
The fire caused extensive damage to a unit used to make dry by products of the
gasoline refining process and turn them into coke — a hard, coal-like substance
sold and used for fuel in industrial furnaces.
In 1992, the Occupational Safety and Health Administration cited BP predecessor
Amoco Oil Co. for using equipment, including a splitter — the same type of
machinery at the centre of the current investigation — in a manner "that allowed
toxic gases to vent to the atmosphere ... thus exposing employees to flammable or
toxic gases." The four-month investigation was part of a broader initiative launched
by OSHA after a string of fires at industrial facilities44.
In 1993, Amoco Oil Co. agreed to pay USD 20 million in damages to the family of
a worker who died after an April 1992 explosion at the Texas City plant.
In July 1995, an explosion rocked the Texas City facility. No one was seriously
injured though at least 105 people were taken to local hospitals with breathing
problems and burning eyes. The incident happened after oil began leaking from a
catalytic cracker, which produces gasoline components from oil.
44 Houston Chronicle (2005)

241
Modelling – Develop scenario plan and modelling capability
Examples
Model key process lows (Gas flow modelling).
Perform major risk analysis (Major accident risk analysis performed in 2003,
however using limited scope and only generic industry data).
Codes: modelling, analysis and learning
Other types of testing either failed or were not implemented. Simulation for
training on disaster management was not available to the process operators. In its
place, so-called ‘gun drills’ – verbal discussions of hazardous operations – were
inconsistently used; either technique was recommended in 2001 but not in evidence
in 2003 and 2004.
Other types of systems testing was postponed or eliminated. The level indicators,
for example, were not calibrated for the typical or extreme liquid temperature
conditions: when the splitter was full and at the high temperature (300 degrees), it
would read 78% - it should have been adjusted or training provided to indicate
100%. The datasheet, which would have been used for calibration, was more than
30 years old and never updated. Physical sight glass, which would normally allow
visual inspection of fluid levels, were too dirty for use and could not be removed
until leaking valves were repaired. These levels were important for calibration of
other instruments and alarms. The same leaks prevented testing of the alarms that
failed. Finally, the blowdown drum high level alarm which failed to sound was
found to have material wear and would not have sounded – giving crucial 2 minutes
to evacuate the area. The test procedures used by BP were simpler than those
recommended by the manufacturer, and would not have revealed the malfunction
(Goettsche, 2005).
Process, knowledge, mechanical and systems testing of the production environment
could have contributed to avoidance or earlier detection of the incident. Focus on
reducing employee fatality and injuries from previous accidents contributed to a
false sense of improvement in the robustness of the site; reduction in training and
testing budgets left a significant risk of catastrophic failure.

242
Internal communication – Shorten lines of communication
Example: BP created a new communication structure for safety related issues.
Codes: communication and safety
Lack of communication contributed directly to the accident and delayed awareness
of the growing risk. Specifically, operations personnel on the 23rd of March failed to
communicate firstly, the required routing of products from the raffinate splitter and
secondly, the degree to which the splitter was filled. Normally this information is
conveyed from management and supervisors and between operations shifts during
hand-over. With the lack of emphasis on communications by BP management, this
critical information was not recorded in any logbook or passed on when the day
shift arrived. The need for clearly defined roles and responsibilities regarding
communications is cited by the CSB, in particular during time so of sensitive
operations and changes of personnel.
Often near misses and early warning signs foreshadow serious accidents, as noted
by the CCPS in its ‘Guidelines for Investigating Chemical Process Incidents (1992).
Further, the CSB report cites James Reason on the organizational causes of
accidents, who states that effective safety culture, relies on the organization being
informed (Reason, 1997). BP Texas City had many incidents that went unrecorded
and unreported – site risk management, issued before the March explosion, was
that “the site was not reporting all incidents in fear of consequences.”
Extensive organization changes after the Amoco merger, and continued re-
organization since, had a negative impact on the vertical communications within the
BP group. Important findings on safety, for example, were not communicated to
executives. BP's outgoing refining chief testified in a deposition in 2006 that he
first learned of serious safety concerns at the company's Texas City refinery in
March 2005, after the event.

243
Modelling – Develop scenario planning
Example: Provide business planning on major risks
Codes: business planning, risk, disruption, forecasting
Manzoni also was shown a January 2005 business plan that stated among key risks,
Texas City "kills someone in the next 12-18 months." Manzoni said part of business
planning was to articulate risks. "It is not a prediction. It is a planning
mechanism45".
Employee capacity – Increase employee capacity
Examples
Increase employee shifts to 12 hours.
Manage safety of employees (in this case, reduced physical safety buffer by
placing personnel close to production equipment).
Codes: capacity, distraction, layout, labour reallocation
Ever stricter profitability targets reduced investment in physical plant and staff over
the years. This also led to inadvertent reduction of safety zones, e.g. the siting of
trailers close to high-volume hydrocarbon production. Similarly, lax control of the
work environment led to overloaded staff – ‘stepped up’ employees and contractors
took on multiple roles without additional training. Shifts ran 12 hours on a regular
basis during the shut-down and start-up phase around the time of the accident,
leading to employee fatigue. In the control room, where numerous visual
distractions were evident and phone calls took place during monitoring, operators
could not easily detect anomalies nor react quickly. Recommendations were based
by the CSB to improve this labour ‘reserve’ – running staff until failure was no
more safe than running equipment to failure, as was the BP practise.
45 Houston Chronicle (2007)

244
Relationship with governments
Example: Management of relationship with regulatory bodies (EPA, OSHA)
Codes: government, regulation, relationship
BP has been in the radar of various agencies on environmental and employee
protection. As mentioned earlier, the very first management action at Texas City
was a phone call to its lobbyist in Washington.
Teamwork – Create integrated response team
Example: Creation of cross-function investigation team within BP in first 24 hours.
Codes: team, investigation and cross-functional
Within 24 hours, BP formed an investigation team with participation from
executives, permanent and hourly workers, and its subcontractors. As stated in the
BP’s statement on CSB’s final investigation report, BP produced to CSB over
6,300,000 pages of documents and made over 300 witnesses available for CSB
interviews. BP created an Independent Panel, to assess process safety management
and safety culture (proper operation of equipment and handling of hazardous
materials) at BP’s US refineries. The Independent Panel undertook investigations,
and issued their report in January, 2007. According to Panel’s findings, BP gained
false confidence in its safety culture before the blast as the result of effort put in
providing personal safety (meaning preventing workers’ falls or slips). This finding
is stated as opposed to CSB’s conclusion that the safety lapses had been clearly
linked to the budget costs in the 1999.
The Chemical Safety Board expanded on this work and provided a much more
critical external view in its final report 24 months after the event. Because of delays
by BP in implementing early recommendations, the CSB expanded its investigation
and later a new committee chaired was formed. This panel review refinery safety
across five BP sites, and its findings echoed the CSB.

245
Planning – Leverage preparedness by update procedures
Example: Updated procedures were implemented (Staff did not follow standard
shutdown or emergency procedures).
Codes: procedures, training, emergency
As is discussed in the response, both prevention and mitigation procedures were
not adequately updated or followed in this event.
Implement Training – Provide training on detection and response
Example:
Provide employee training on leading indicators.
Leverage external resources (Trained local fire fighting personnel and
ambulance services).
BP Texas City implemented and updated training programs on leading indicators to
detect anomalies as well as training to external parties in the event of major
disruption.
7.5.4 Response Time at BP Texas City
D1 - Detection of the event
Since the Amoco merger, Texas City plant managers faced strict targets on
maintenance investment. Targets were set on improving capital performance, to the
extent that local management fought to reverse some of the scheduled cuts.
The reduction in maintenance was visible at a technical level, with faulty alarm
systems, reduced training, even simple visible liquid level indicators on key
equipment being ‘blackened’ and unreadable already for years. BP debated the
inadequate level of investment; the fact remains that equipment was faulty and
process status difficult to verify. Investment in physical plant has a parallel
requirement for human capital and equivalent shortfall; though the operating team
was fully staffed at the time of the accident, key-operating personnel had minimal
training or experience.

246
D2 – Design of a Solution
All the disaster, in the words of one BP executive, ‘was years in the making’, the
process failure took hours and the explosion occurred literally in seconds. Without
adequate warning, little could be done at the moment to avoid full scale destruction
of much of the unit. To find a longer-term solution to avoid impact of the same
underlying causes, intensive investigation was warranted. It was one of the worst
industry accidents in the country; the risk of repeating such an event in a critical
energy supply chain had to be reduced.
D3 – Deployment of the Solution
Speaking to a conference on process safety, BP Senior VP John Mogford related
what they saw as key causes and lessons from the event:
“Firstly, over the years the working environment had eroded to one characterized
by resistance to change and lack of trust, motivation and purpose. Expectations
around supervisory and management behaviour were unclear. Rules were not
followed consistently. Individuals felt disempowered from suggesting or initiating
improvements.
Secondly, process safety, operations performance and systematic risk reduction
priorities had not been set nor consistently reinforced by management. Safety
lessons from other parts of BP were not acted on.
The changes in site layout were made permanent, increasing the safety margin
through greater work area. ‘Hot’ work – where high temperatures are involved,
such as from welding, were also separated and controlled during critical periods.
In summary, BP found critical importance in the following recommendations:
Real-time management awareness of activities taking place.
Capturing the right metrics on process safety.
Up-to-date and implemented procedures.
Two-way communications.

247
Investigating process incidents and loss of containment incidents and
documenting all incidents thoroughly.
Sharing what is learned.
Training programs.
Keeping non-essential personnel out of process areas.
BP was investigated by OSHA a number of times after 2005, and due to continued
violation was fined a record USD 87M in 2009: “The U.S. Department of Labor's
Occupational Safety and Health Administration (OSHA) today announced it is
issuing USD 87 Million in proposed penalties to BP Products North America Inc.
for the company's failure to correct potential hazards faced by employees. The fine
is the largest in OSHA's history. The prior largest total penalty, USD 21 Million,
was issued in 2005, also against BP.” (OSHA)
BP also reached an agreement with OSHA. Under terms of the settlement BP
agreed to fulfil six requirements (among them: paying USD 21 Million in penalties,
complete a review of the ISOM unit, retain a firm with expertise in PSM, hire an
expert to assess and report on communication within and between management,
supervisors, and authorized employee representatives and non-management
employees and the impact of the communication on implementation of safety
practices and procedures, submit to OSHA and BP Products' authorized employee
representative, every six months for three years, logs of occupational injuries and
illnesses, notify the OSHA area office of any incident or injury at the Texas City
facility that results in an employee losing one or more workdays during the same
three-year period46).
In the June 2007 BP, prompted by the Panel, appointed an independent monitor
whose task is to oversee safety improvements. For this position, Duane Wilson, a
retired vice president of refining, marketing, supply and transportation for
ConocoPhillips was chosen.
46 OSHA (2005)

248
A Summary of the findings in related to the 3-D framework from Texas City case in
shown in Table 32.
Table 32: A Summary of the Findings from BP Texas City Case
Tailored approaches Examples from BP Texas Refinery Explosion D1 D2 D3 Develop advanced warning system
Failed alarm systems, e.g. high-level alarm sounded two minutes late when much higher liquid level was received.
Broken physical sight equipment for visual inspection. No general alarm sounded, instead radio reports and
shouting to notify workers in the area. Alarms not tested prior as required by standard
operating procedures.
Conduct stress testing No approval of facilities layout (dangerous positioning of trailers).
Lack of process review during sensitive shut down / start up phases.
Develop scenario plan and modelling capability
Gas flow modelling. Major Accident Risk analysis performed in 2003,
however using limited scope and generic industry data.
Leverage preparedness plan
Standard shutdown procedures. Standard emergency procedures.
Implement training Employee training on leading indicators to sense possible disruptions.
Local trained emergency response services from Texas City fire and ambulance services.
Establish frequent communications with supply chain partners
Participation in congressional hearings. Baker panel on BP refinery safety to review
implementation of recommended changes. CSB investigations on root-cause and management
background to the event. EPA investigations on adherence to regulation and
environmental impact. OSHA investigations on root-cause and employees
safety.
Create integrated response team
Creation of cross-functional investigation team within BP in first 24 hours.
Shorten lines of communications within the organisation
BP created a new communication structure for safety related issues.
Establish learning from past events and during the events
Independent panel to determine critical factors. Updated physical site layout recommendations. Numerous recommendations on engineering, process,
management, training.
Assure management and employee capacity
Improved safety procedures for employees. Improved control over dangerous (‘hot’) work areas and
general operations during sensitive start-up and shutdown sequence.
Increase capacity Improved staffing to reduce employee fatigue and improve alertness and response speed.
Reduce distractions in control room. Allocate time to complete testing. Geographic reserve – greater spacing of activities for
improved Simultaneous Operations, e.g. trailer siting.
Develop product or solution extensions
Changes in system design (e.g. removing out-of-date blowout preventor).

249
Chapter 8 The Emergent Theory
8.1 Introduction
This chapter addresses the findings of the study after all data have been coded,
categories identified, the properties and the links between categories established and
the emerging theory has been delimited. A detailed explanation of the core concepts
and related categories is provided here.
8.2 Integrating Categories and Their Properties
During the open, axial and selective coding of data from interviews and data other
sources in three cases, properties of and links between the categories and sub-
categories became explicit. At this stage of analysis, the focus is on integrating the
core categories with their sub-categories and creating suitable definition to be
applicable beyond the current data sources.
Based on this approach, four major factors can be shown to have an impact on the
time in which organizations can respond to catastrophic risk in the supply chain are:
Preparation, Partnership, Organization, and Reserve (Figure 29). The findings show
that the presence – or lack of – these factors can have a major influence on the
response speed for the effective management of disruption.
These factors can require significant investments and trade-offs in resource
allocation, and have – as discussed – varying impact during the typical phases of
response.. An evaluation of return on investment before, during and after a
catastrophic event is evident in the approach taken by each firm. Some tailored
approaches used by the firms showed interaction between multiple factors: reserve
capacity can be both internal to the organization, as in the mothballed Nicole
production lines at PHARMA, or externally with partners, as in the oil recovery
ships from Shell, a traditional competitor to BP. Such external partnerships, for
example, reduce the cost of holding or internally pooling reserve capacity.

250
Figure 29: An Overview of the Core Categories and Sub-Categories Following Completion of the Analysis of Three Cases
251
8.3 Factors Underlying Response Time
As the primary outcome of the study, sub-categories derived and confirmed from
the cases are depicted in Figure 30 illustrating the tailored approach each
organization took to contribute to the four factors (Preparation, Partnership,
Organization, Reserve), which underlie response time.
Preparation includes approaches implemented prior to the event such as creating
advance-warning systems; stress testing, scenario planning and modelling and
training. Partnership includes management of the external relationships to improve
response time, such as suppliers and customers, but also other influences and even
competitors. Organization covers the steps taken in coordination, communication,
roles and responsibilities, and learning within the border of the firm. Reserve covers
the full complement of resources, attributes of supply chain resources, and
techniques to improve capacity in a timely fashion, such as flexibility, inventory,
management and employee capacity and product or production line extensions.
Each factor has a positive effect on the firm’s ability to reduce response time; this in
turn reduces the negative impact of catastrophic disruption on the supply chain.
The characteristics and relationships of the core categories are explored in detail
below (see also Figure 30):
1. Preparation
2. Partnership
3. Organisation
4. Reserve

252
Figure 30: Factors Underlying Companies' Response to Supply Chain Disruption
8.4 Preparation
Preparation can be considered to consist of the tailored approaches made prior to
detection of an event that contribute positively to the organization’s speed of
response. Preparation can be mandated by industry or government regulation, grow
out of experience with previous events, or come from fortuitous alignment with
supply chain optimization for normal operations.
Preparedness is defined here as the degree to which the organization has executed
activities and investments are identified during the cases to prepare an organization
to handle disruption.

253
From the data, there is a clear focus in preparation on information access and
interpretation within the organization and also extending to information gathering
partners along the supply chain. Viewed along a time dimension, this preparation
takes the form of response review and post-event learning (‘lessons learned’).
Assessment of organizational preparedness is linked to improved avoidance and
rapid response. Having plans such as contingency (recovery) plans, business
continuity plans, and preparedness plans in place and ready to use will shorten the
response time to different types of disruption. This can have a positive impact on
design lead-time as well as reducing deployment lead-time.
8.4.1 Develop Advanced Warning System
Early detection of impending events or anticipation of the impact of disruption is
implemented through one or more advanced warning systems. These systems must
help distinguish routine operational events and those that indicate elevated risk of
disruption. Event correlation is a key capability – advanced warning of disrupted
production and sudden influx of orders, for example, would elevate priority of the
coincident data. Failure to detect deteriorating safety culture and increasing
frequency of accidents is another example of the need for event correlation.
Advanced warning systems can take a range of forms and inputs, from automated
systems and through processes of observation and notification, using data from
monitoring internally and externally along the supply chain.
Early warning of potential or impending events relies, on information access and interpretation. At a most mechanical level, this is illustrated by failure of the Deepwater Horizon to correctly monitor on the rig – or offshore in real-time – the ominous increase in well pressure, foreshadowing an imminent blowout. Had the crew been alert, and taken the right action to redirect the erupting mix of mud and gas overboard, the resulting explosion could have been delayed or mitigated. Failed monitoring processes and equipment contributed directly to the disaster at Texas City. PHARMA stated that much information was first visible in the public press, both at the outside and at later stages of the pandemic.
8.4.2 Conduct Stress Testing
Stress testing is an exercise that helps managers identify and prioritize potentially
vulnerability of the supply.
Creating different scenarios and rehearse simulations runs/drills is seen to enhance
the company’s ability to respond more quickly. Sodhi and Tang (2009, P.36)

254
addressed that “the deployment time accounts for the preparation time to launch
the selected recovery plan, scenario planning and stress tests are effect mechanisms
for reduce deploy lead time.”
Targeted testing of components, systems and processes in the supply chain can
reveal vulnerability before risks escalates. Where this is not feasible, live testing can
be replaced or supplemented with modelling, and this is found in each of the cases.
While PHARMA runs successful preparedness exercises each year, investigation of BP Texas City revealed that pressure to reduce cost had reduced frequency of fire drills from bi-weekly to monthly. This division of BP was also noted for its ‘run to failure’ use of infrastructure, rather than implement rigorous testing of technical systems and processes. Likewise, prior to the BP Deepwater Horizon disaster, BP Upstream failed to assure that its partner Transocean had met recommended procedures for periodic testing of the Blowout Preventer (BOP). Transocean had a ‘condition based’ approach, e.g. testing was done based on experience of equipment use and failure, in some way corresponding to the ‘run to failure’ approach of BP. Failure to accurately predict increasing risk of failure of such components led to elevated risk exposure.
That said, stress testing itself could elevate systemic risks, as in the case of the
Chernobyl nuclear disaster, which failed during a test procedure. Pressure testing of
the oil well prior to production triggered the immediate failure, which caused the
well blow-out on BP Deepwater Horizon:
Stress testing of concrete formulation by Halliburton was not communicated in full to the BP Horizon drill team – only a final successful test was confirmed; previous failures that revealed instability were not disclosed until after the accident. Further, misinterpreted ‘negative pressure’ test results at BP Deepwater Horizon, which the drill team erroneously interpreted to indicate successful securing of the well, exposed the rig to disaster during subsequent steps. This is reminiscent of the nuclear meltdown on 26 April 1986 at the Chernobyl Nuclear Power Plant in the Ukrainian SSR which was caused by poorly designed recovery procedures during stress testing of the reactor control systems.
8.4.3 Develop Scenario Plan and Modelling Capability
Modelling of potential risks was used in each of the companies, both before and
after the event. As a technique for encapsulating experience and reducing the skill
burden during operations, modelling and simulation provide a useful avenue for
both disaster avoidance and optimizing deployment of scarce human resources and
other assets.

255
This tailored approach can also include development of a risk map – identification
of potential risks and assessment of impact. This was implemented, in the case of
PHARMA, as a two-dimensional matrix, estimating event frequency and severity. In
an engineering scenario, the risk map is expressed as a fault tree – where failure of
an element could trigger certain symptoms, and therefore such symptoms or
warnings, when present, could be traced back to potential faults. However, these
risk map representations may not accurately express heightened risk conditions, e.g.
coincident events can elevate total risk. This is the case when safety systems fail at
the same time as production systems, as seen in the BP Deepwater Horizon case.
It is important to point out as well modelling, just as with stress testing – can also
increase risk or create false confidence if a false sense of security if this testing no
longer corresponds to actual conditions and system behaviour.
Given the very complex response to the BP Deepwater Horizon oil spill, in which dozens of ships and thousands of staff were working in unprecedented proximity of each other and thousands of barrels of explosive hydrocarbons, each operation required close coordination and control. A simulation facility for ‘Simultaneous Operations’ was developed where the design of possible solutions could be tested and each stage of deployment could be carefully modelled to avoid further disaster or delay.
8.4.4 Leverage Preparedness Plan
Advanced planning, including up-to-date roles and responsibilities (an approach
recorded as part of the Organization factor), are identified as being key to rapid
response. From the cases under study, this includes response procedures for each
geographic, organizational or functional business unit. The currency – how up-to-
date- these plans and structures are – was shown to the effectiveness of such plans
in the response process.
PHARMA observed that while its emergency plans were correctly in place for lines of business and physical plant locations, reorganization through a corporate efficiency program resulted in many staff identified in the plans as having taken new roles. Further, some newly assigned staff who were responsible for site-level deployment were unaware that they had been assigned such a task. At BP Texas City, after frequent management reorganization and the speed of possible events made it policy to allow for any staff person to initiate the emergency response. In contrast, on the BP Deepwater Horizon, the captain of the Deepwater Horizon scolded its young, inexperienced ship-positioning operator for taking the liberty to officially make the Mayday distress call, despite the fact that the rig was very close to total destruction. At BP Texas City, the first response by management was to call its government Public Relations staff, secondly to inform the Business Unit Leader by phone – an issue in corporate priorities that was highly critical of BP during litigation against the firm.

256
8.4.5 Implement Training
Training of organization staff, suppliers and customers is identified as a key element
of rapid event detection and solution implementation. Skills are shown to be
essentially for early detection of impending events, as well of course as avoiding the
underlying root cause, for example, where a trigger is found in misjudged or
erroneously executed procedures. Adequate training internally and externally,
beyond typical operational requirements, allows rapid redeployment of skills for
greater capacity reserve and flexibility. Training of staff across multiple roles and
skills could assure continuity in the event that some staff were unavailable and also
create increased capacity where resources needed to be shifted, for example as
production was reallocated in the PHARMA case.
After the BP Deepwater Horizon disaster, an important learning point was made retrospectively for the otherwise experienced operators on the rig. The team erroneously believed that ill-fitting data from a ‘successful negative pressure test’ was caused by a ‘bladder effect’ (higher pressure due to configuration of the drilling fluid). No such effect exists – this was a propagated myth among some field engineers – and ultimately cost the life of the veteran drilling engineer who erroneously believed that explanation. Sadly, he died the day before he was scheduled to leave active work and to begin teaching at the company’s well control school. Recommendations by various panels after the BP Texas City also focussed on training to help staff identify the ‘early indicators’ of increasing risk.
8.5 Partnership
Management of external relationships is shown to be an important dimension in the
response to disruption. They can further trace the impact of each disruption along
the supply chain from upstream partners to downstream customers. This requires
productive relationships and communication between supply chain partners. This
requires productive relationships and communication between supply chain
partners. Creating a common awareness of different types of disruptions and the
impact on both parties could decrease the risk for all parties; “Companies must
identify ways to share the information with their supply-chain partners and to get
similar information from them” (Sodhi & Tang, 2009 p: 36).
Due to the nature of complex and global supply chains, large investment in specialized skills and capital, the firms studied here operate with extensive partnerships. Only seven of 126 employees on the Deepwater Horizon were actual employees of the ‘responsible party’, BP Upstream. All of the dead in the Texas City disaster were from companies contracting to BP. Indeed the disruption to supply chains, or in the case of PHARMA’s response to swine flu, had an impact far beyond each organization. Accordingly, Partnership is identified as an important category of capabilities related to risk response. Many companies identify potential disruptions to

257
business according to their impact and likelihood as part of their Business Continuity Plans.
8.5.1 Establish Frequent Communication with Supply Chain
Partners
Communication between supply chain partners is identified as a critical element of
response. As events evolve, control of communication to external parties is
prioritized, in particular where the catastrophic impact of the disruption is visible in
the public sphere. First information about events, in fact, is itself in public media.
PHARMA was asked to comment in press interviews on public perception of ‘price gouging’ of scarce medicines and made forced to make public statements on its distribution policy. BP Texas City issued a number of press releases and enlisted its mid-tier international executives in communications. Learning from previous failures to communicate effectively with government, the public and its partners, BP Upstream deployed real-time video feeds to show the actual, live flow of oil into the Gulf from 5,000 feet below the surface. Direct disclosure of frequent information is driven today by new forms of media and a need to retain trust and brand confidence in an increasingly online world. Legal restrictions and litigation, however, can make sharing of information difficult if not impossible. Facing huge fines, each party in the Deepwater Horizon case was reluctant to provide unfettered access to staff or engineering data. The failed equipment, recovered from the sea floor, remained as of this writing under close guard on US Federal government property. It is expected to remain there to support litigation for several decades.
8.5.2 Establish Relationship with Governments and Agencies
Governments, local and federal, along with a plethora of government and
regulatory agencies play an increasingly important role in the allocation of resources,
protection of employees and environment, parameters of trade and license to
operate complex supply chains. In the case studied, the government plays a key
influencing role and direct role as supplier (of right to drill, for example) or
customer (for purchase of medicines on behalf of the population). It is natural that
the relationship between the firm and various government agencies is a focal point
for response.
In a global supply chain, a number of activities including sourcing, manufacturing, distribution and marketing will fall under the control or influence of various local and international governments and agencies. These external bodies have considerable influence on the regulatory environment and can have a dramatic affect on the operating environment of a supply chain before and after a major disruption. The policy and operating relationship with such agencies is an explicit element of risk response. For downstream partners, close coordination and information exchange was important – PHARMA proactively contacted relevant organisations such as the WHO, the CDC, the Department of Health and Human Service in the US, The European Centre for Disease Prevention and Control and different governments

258
around the world. Being in direct contact with these parties helped PHARMA understand their needs and develop estimates for manufacturing capability and the timing of possible production as well as determine the benefit of developing additional technology for the production of a pandemic vaccine. PHARMA worked with its government customers to allocate scarce capacity (‘proportional response’). The first phone call made from BP Texas City was to its lobbyist in Washington. Lack of participation of the US President and the CEO of BP in the early stages of the BP Deepwater Horizon disaster was equally vocally critised.
8.5.3 Establish Relationship with Business Partners
The relationship with upstream and downstream business partners is by definition a
key control point in the supply chain. Management of such external relationships
during the response to a catastrophic event takes on new priority and new
mechanisms maybe established in the context of these relationships. In one of the
most studied supply chain cases, that of the fire at a Philips Electronics chip factory
in Arizona, Nokia has quickly moved to capitalize and extend a closer working
relationship that its rival Ericsson, enabling Nokia to secure scare inventory and
remaining production capacity. This led Ericsson Mobile to tremendous financial
and market share losses and eventual merger with Sony.
PHARMA has defined certain risk management processes for external suppliers. PHARMA had a team looking at external suppliers, because a significant portion of the supply chain is outside PHARMA and it must be ensured that those sites are considered in the BCP. For example, PHARMA assessed if it had any outsourcing or external contractors in Mexico in addition to its own site. Medically critical products or revenue-critical products could be affected by production or transport shutdown. Accordingly, on 29 April 2009 PHARMA gave antiviral drugs to its employees in Mexico to assure their safety as well as manufacturing and supply continuity.
8.5.4 Establish Relationship with Competitors
Competitors who may play an adversarial role during routine business can play a
very different role in the risk response, in particular where the event affects multiple
supply chains and can put either the entire industry or downstream customers under
stress. The nature of the relationship with competitors has both tactical (event
response) and strategic (market-shaping) aspects in the events under study. Parallel
to the shift from normal organizational design to crisis response within the
organization, each case shows the unique competitive and supply chain
configuration required to accelerate response in crisis.
BP Refining and Marketing shared findings with industrial competitors. BP Upstream, while protective of proprietary data on geologic information and drilling techniques (it refused to provide information to medical staff that was treating injured workers, so

259
as not to disclose formulation of drilling fluid), later joined a consortium of competitors to form a dedicated, not-for-profit disaster recovery organization – with investment of more than GBP 600 Million. BP Upstream also leveraged support from erstwhile competitor Chevron to model and stress test cement composition, in an effort to identify root-cause of the Deepwater Horizon Disaster. BP drew on partners that it harmed – local fisherman – through a special program, ‘Vessels of Opportunity’ which gave financial reward to affected fisherman for assisting in oil spill recovery. This novel approach of supporting such a widely affected group of downstream partners – tens of thousands of individuals participated – created logistic demands and administrative burden, however capped exposure to litigation, reduced public brand damage, and provided some capability in oil spill control. The technical mechanism, such as a purpose built radio-relay system, as well as lessons learned for both effective and ineffective spill control, are a key contribution of BP to the industry initiative on protecting the Gulf from subsequent disaster.
8.6 Organisation
Organization refers to investments and strategies that are directed to the structure
and internal management capabilities of the organization. In all three cases, the
companies refer extensively to their organizational structures and work culture.
Communication and decision-making are a key component of these factors. Clarity
and speed of communication as a consequence of organizational structure are
highlighted as relevant attributes for fast response.
The lack of investment in organizational capabilities is traced to increased likelihood
and impact of disruption.
BP was known to have a culture of austerity, acquiring many older firms with aging equipment and under investing, as stated by its own site management. PHARMA had designed a new line of communications and assigned a communications manager after it became aware of the ‘noise’ during the few weeks of the outbreak. Following Van Wassenhove (2006), effective coordination has three forms: (1) centralized coordination by command (2) coordination by consensus and information sharing and (3) coordination by default, e.g. through routine communication. PHARMA applied coordination by command during the design and deployment phases. According to Sodhi and Tang (2009), these two phases need to take central command for collecting and analysing information to design a recovery plan and disseminating information regarding the deployment of the selected recovery plan. In PHARMA's case, the central command was the MSC pandemic team.
8.6.1 Create Integrated Response Team
After detection of the events, each organization assigned an integrated team to
investigate and respond to the event, indicating that internal structures for routine
supply chain operation may not be adequate for rapid response. This integrated
response team was supplemented by external expertise and capacity.

260
PHARMA assigned working groups at each level of the organization. After initial failures by BP Upstream to stem flow of oil into the Gulf, growing frustration with the company prompted the US federal government to extend the mission of the Coast Guard’s Incident Management team under a “Unified Command”. BP Texas City managed an integrated investigation team with representation from executive, ‘salaried’ and ‘hourly’ workers to get a complete picture on possible changes in responding to the event.
8.6.2 Shorten Lines of Communications within the Organisation
Fast and direct communication was mentioned as a critical capability in developing
and deploying possible solutions. In the case of PHARMA, this was evident where
information would be cascaded through different layers of the organization through
multiple functional groups, e.g. production, HR, etc. The delay and potential
miscommunication inherent in relayed communication forced a rapid restructuring
of communications to reduce confusion. Electronic means, such as a shared online
team room, were employed to shorten lines of communication.
PHARMA mentioned the importance of collaborative techniques such as online team rooms to support deployment. BP claimed to significantly change its internal communications culture to encourage faster risk response.
8.6.3 Establish Learning from Past Events and During the
Events
While major disruption is by definition rare, explicit learning from such events
becomes even more a priority. Study of events faced competitors, historical events,
comparable scenarios are all part of a learning process to understand best practices.
PHARMA implemented an After event executive review; BP Texas City and BP
Deepwater Horizon triggered ongoing highly technical and broad organizational
investigation that continue to influence preparation by all industry participants.
PHARMA could leverage experience with previous types of Influenza, in processes as well as possible supply chain solutions. Incentives and rewards have a strong influence on internal communication and learning, according to executives at PHARMA. In contrast, BP Deepwater Horizon’s owner, Transocean, failed to keep its engineers informed of very similar events in the Northsea drilling, where the same type of well design and engineering approach resulted in loss of well control just weeks earlier. Investigation in each case by internal and external parties can be seen to have two components: root-cause analysis, in part to prepare for litigation, and recommendations going forward. In the case of BP Refining and Marketing, failure to implement many recommendations made after Texas City was cause for the company to be investigated again (Baker Commission) and heavily fined (more than GBP 50 Million).

261
8.6.4 Clarify Roles and Responsibilities
Well-defined roles and responsibilities may be explicitly defined for each of phase
of handling disruption. The authority to manage the crisis, for example, at
PHARMA rested politically with plant and site managers, however the expertise was
with specialists. Names mentioned in some plans were out-of-date; this is an issue
of maintaining Preparation (see above).
PHARMA observed that while its emergency plans were correctly in place for lines of business and physical plant locations, reorganization through a corporate efficiency program resulted in the prior year left many staff identified in the plans as having taken new roles. Further, some newly assigned staffs that were responsible for site-level deployment were unaware that they had been assigned such a task
8.7 Reserve
The category of Reserves covers the affordable additional resource beyond those
required for routine operations, which are immediately available for the firm to
mount an effective response, in detection (e.g. redundant alarm systems), in design
(e.g. scientific staff on board) or deployment.
Chopra and Sodhi (2009) discuss a range of techniques for tailoring reserves to
mitigate risk. Companies can extend their reserves by increasing capacity, acquiring
redundant suppliers, improving responsiveness, increasing inventory, increasing
flexibility, pooling or aggregating demand and increasing production capability.
However, the cost of building up a reserve must be balanced against the level of
risk. According to Chopra and Sodhi (2009), when the cost of building a reserve is
low, the reserves can be decentralized. Where costs are high, the reserves should be
centrally pooled. Similarly, they state that when the level of risk is low, the strategy
should focus on cost reduction. When the risk is high, the focus should be on
mitigation to reduce the likelihood of occurrence.
They also proposed ‘three time-tested approaches’ (Figure 31) which can be used to
help managers and companies mitigate inventory risk, are: (1) pooling inventory, (2)
creating common component across product lines and (2) postponing or delaying
the last stage of production.

262
Figure 31: Rule of Thumb for Tailored Risk Management
Source: Chopra & Sodhi (2004)
Internal capacity, above and beyond the mechanisms for routine supply chain
management, is shown as an important factor in risk response in the cases studied
here.
This is visible in terms of moth-balled production lines (PHARMA) that were quickly activated, also the availability of drilling rigs and support ships from Transocean already in the Gulf of Mexico that were not otherwise scheduled. The lack of such additional reserve is evident there was well: specialized fuel-burning equipment was weeks in transit from France, needed to safely burn-off the recovered oil where dozens of other ships were active in close proximity.
8.7.1 Assure Management Capacity and Employee Capacity
Protection of employee and management capacity was one of the first and most
rapidly implemented steps in each case under study. Both management skill and
employee resources are seen as critical to response speed. The threat to employees
from the event could trigger a delay or reduction in ability to respond, for example
through illness, as well as increase in actual demand for intermediate or end
product. Rapid isolation of key skills was implemented, for example by restricting
out-of-country travel for country and site management at PHARMA. Immediate
abandonment of the BP Deepwater Horizon rig served to limit casualties.
Cost of Risk Mitigating
Reserve
High
Low
Low High
$
$
Reduce Costs
Reduce Costs
Pool reserves
Pool reserves
Mitigate risk
Mitigate risk
Decentralize reserves
Decentralize reserves

263
PHARMA required its mangers to remain in country. BP Refining and Drilling has focussed on employee safety before and during the event, however mistakenly neglecting to cover process safety in the same fashion – and non-employees were obviously at full risk. BP Deepwater Horizon management chose to immediately abandon the rig; no further deaths occurred after the initial explosions. Able rig workers who survived were immediately pressed into service to fight the explosion from arriving support craft, and all were heavily involved in the investigation – legal and technical – after the event.
8.7.2 Increase (Production) Capacity
Ramping up production capacity along the supply chain is an explicit goal in the
crisis response. This can take on both physical dimension of goods and equipment,
but is also implemented in the greater concentration and availability of human
capital, in terms of better structuring management, expertise and skills to improve
capacity.
Geographically diverse supply chains, such as commodity oil and gas, by their nature require distributed investment in capacity. Spare drilling rigs can be moved, albeit slowly; fixed production equipment cannot. However, higher-value intermediate products, as well as critical skills and knowledge, can be accumulated centrally to support faster response. PHARMA, for example, stockpiled active ingredients and had implement procurement contracts in place for rapid acceleration of production. In the engineering- and science-intensive field of hydrocarbon exploration, BP Upstream maintains an offshore centre in Houston that has a myriad of engineers and facilities working in frequent, often real-time, cooperation with offshore teams. This centralized capability is a key design for reducing expensive offshore deployment, but was also critical to rapid design, evaluation and control of the various attempts to resolve the oil spill.
8.7.3 Develop Product or Solution Extension
Each organization studied maintained a portfolio of possible response solutions,
which were extended to address requirements for flexibility, speed of response, and
more rapid increase in capacity growth. These measures could be implemented for
example in simplification of production steps (PHARMA), increased flexibility of
technology or techniques (BP), changing design parameters and regulations (BP
Texas City).
Following the natural reassortment of viruses to form new pathogens, PHARMA can recombine existing active ingredients, vaccines, and delivery mechanisms to scale-out and scale-up production. BP Upstream had minimal experience with possible solutions to well blow-out, and other than the relief well, and struggled to find or develop a workable solution to the Deepwater conditions of the disaster at Macondo. In fact, many weeks and hundreds of millions of pounds was spent on adapting, modelling, and deploying solutions that failed – while million gallons (equating to tens of millions of dollars in environmental damage fines) of oil flowed unhindered into the Gulf. It became evident that nothing in oil spill recovery had evolved since the Exxon Valdez disaster some twenty years earlier; the same techniques were tried and failed on a grand scale. BP Refining and Marketing identified hundreds of

264
recommendations at Texas City, however had failed to implement previous lessons and recommendations on plant design and layout which could have reduced the scale of impact – more explicitly, the number of deaths and serious injuries.
8.7.4 Acquire Additional Suppliers
Capacity constraints on components, supplies, labour and distribution, to name a
few restrictions, can hinder rapid expansion or recovery of supply chain capacity.
Despite growing fluidity in faster, typically on-line sourcing procurement,
protection of intellectual property (PHARMA) and regulatory control make it
essential that firms ‘prepare’ to rapidly acquire additional suppliers.
PHARMA was fortunate, in responding to the demand from China and LDCs, that it had explored a voluntary licensing arrangement two years prior. Governments, under the same stress of rapid growth in demand, correspondingly had ‘Advanced Purchase Agreements’ in place on pre-negotiated terms to acquire Influenza medicines.
8.7.5 Increase Flexibility
An additional reserve of supply chain capacity is found through flexibility. This can
be the redeployment of production equipment or staff resources in the supply
chain, adaptable tooling (such as undersea equipment for deepwater operations,
reducing the need to resurface equipment), but also in policy such as the scarce-
product allocation in PHARMA.
PHARMA could shift production – labour resources – from two different lines to increase Influenza medicine availability while retaining a robust production capability for unrelated lines. BP Upstream used a multi-purpose rig, the Deepwater Horizon, for both exploration and establishing production readiness. This flexibility can come at a cost: such a rig, for example, is at the top-end of daily rates (USD 1 Million per day for certain operations). The recovery operation also created new modes of flexibility for its remotely operated vehicles (ROVs), which could rapidly exchange tooling without resurfacing from the seafloor – saving many hours on every step.
8.7.6 Increase Inventory
Traditional supply chain optimization often seeks an ‘optimal’ stock of inventory to
reduce working capital or increase design flexibility. Sudden spikes in demand or
disruption of supply to inventory can obviously diminish the firm’s ability to
respond. As the evolution of a disruption may be unpredictable, the firms studied
here sought to increase inventory to cover variance in the supply chain.

265
Sharp increase in demand or sudden disruption in the supply chain will have an immediate shift in the optimal availability of inventory. Increasing inventory is an explicit goal in this data, as part of the solving disruption remedy itself - e.g. emergency equipment - and as part of meeting existing or increased demand. Where competitors are affected in the same disruption, increase in inventory on scarce inputs becomes a competitive priority. While a carrying cost can be significant, ‘strategic’ inventory – as PHARMA refers to stock of key materials – is shown in these cases to support faster recovery. PHARMA, for example, reduces the dependency on shared machinery with limited capacity by over-producing secondary products in the supply chain. BP Upstream could assemble a remarkable fleet of support ships for oil recovery through its partnerships, though often operated at the extreme edge of internal capacity in many of its operations. Similarly, BP Refining and Marketing had driven its production capacity to the limit – employee exhaustion, reduced testing, reduced training, reduced supervision, reduced operating maximum pressure of aging equipment, etc. all pointed to a lack of ‘inventory’ in a broad sense that made incident detection and management far more difficult.
8.8 Core Categories in Related to the 3-D Framework
This research has used diverse examples of catastrophic events to argue that firms
can use a time-based risk management concept to reduce the response lead-time
(detection time (D1) + design lead-time (D2) + deploy lead-time (D3)), which will
in turn reduce the impact of a disruption.
Through an iterative process of coding and categorisation, each tailored approach is
identified which is expressed in observations of relevant actions performed by the
firm or related parties. Some approaches are seen as lacking, but suggested in the
subsequent root cause analysis or after-the-fact recommendations made by the firm.
The four factors are explained earlier in the previous section. These factors may
have significance across one or more phases of the response lifecycle. The use of
each tailored approach in the cases is shown in the following (Table 33) across the
lifecycle of detection-, design- and deployment lead-time. Moreover, while some
approaches may be uniquely effective in the context of catastrophic risk
management – for example cooperation in recovery with direct competitors – the
most effective approaches may have a positive effect on operational performance,
prior to an event.
Table 33 summarizes the observed actions in each case, indicated as follows:
Actions were explicitly identified and taken by the firm to improve response
time.

266
Actions were identified after the event, and are considered by the firm as
potential improvements in response for comparable events in the future.
Actions were not taken nor identified by the firm or its partners, but might have
had a positive impact on response speed.
Actions were not taken nor identified by the firm or its partners, and would be
unlikely to have had a relevant or positive effect on response speed.
The first two are indicated by a diamond symbol [], the second by a dash [-]. As
this study is in the early stages of building the framework, only positive
observations can be confirmed. Investigation on the effectiveness of each approach,
impact of withholding the tailored approach or possible risks for each would be
appropriate in further study of the same or new cases in management of disruption
risk.
Table 34 shows a summary of examples from three cases by grouping the actions
and initiatives taken by each company in detection and response to the disruption.
Data display was used in an organised, compressed way according to Miles and
Huberman (1994) for the purpose of data reduction. The table suggest tailored
approached activities that would enable the firms to reduce the respond lead-time,
which affect the impact of supply chain disruptions. Correspondingly, as evidenced
by investigation and retrospective recommendations, lacks of such capabilities
hinder companies in detecting and responding in a timely fashion to severe
disruption.

267
Time Factors Tailored approaches PHARMA BP
Deepwater BP
Texas
Det
ecti
on
Tim
e (D
1)
Preparation
Develop advanced warning system Conduct stress testing Develop scenario plan and modelling capability
-
Leverage preparedness plan - - - Implement training -
Partnership
Establish frequent communications with supply chain partners
-
Establish relationship with local and international agencies, business partners and competitors
-
Organisation
Create integrated response team - - - Shorten lines of communications within the organisation
- -
Clarify roles and responsibilities - - - Establish learning from past events and during the events
- -
Reserve
Assure management and employee capacity
- - -
Increase capacity - - Develop product or solution extensions - - - Acquire additional suppliers - - - Increase flexibility - - - Increase inventory - - -
Des
ign
Lea
d-T
ime
(D2)
Preparation
Develop advanced warning system - - - Conduct stress testing - - - Develop scenario plan and modelling capability
-
Leverage preparedness plan Implement training - - -
Partnership
Establish frequent communications with supply chain partners
Establish relationship with local and international agencies, business partners and competitors
- - -
Organisation
Create integrated response team Shorten lines of communications within the organisation
-
Clarify roles and responsibilities - - Establish learning from past events and during the events
Reserve
Assure management and employee capacity
- - -
Increase capacity - - - Develop product or solution extensions - Acquire additional suppliers - - Increase flexibility - Increase inventory - - -

268
Table 33: A Summary of Findings from Three Settings in Related to 3-D Framework
Time Factors Tailored approaches PHARMA BP Deepwater
BP Texas
Dep
loy
Lea
d-T
ime
(D3)
Preparation
Develop advanced warning system - - Conduct stress testing - Develop scenario plan and modelling capability
-
Leverage preparedness plan Implement training
Partnership
Establish frequent communications with supply chain partners
Establish relationship with local and international agencies, business partners and competitors
-
Organisation
Create integrated response team - Shorten lines of communications within the organisation
- -
Clarify roles and responsibilities - - - Establish learning from past events and during the events
-
Reserve
Assure management and employee capacity
Increase capacity Develop product or solution extensions Acquire additional suppliers - - Increase flexibility - Increase inventory -

269
Factors underlying response lead time
Tailored approaches Examples from PHARMA H1N1 2009 Influenza Pandemic
Examples from BP Response to Deepwater Horizon Oil Spill
Examples from BP Texas Refinery Explosion
Preparation (PR)
Develop advanced warning system
Assigned staff to monitor the information and process flow.
Well pressure monitoring: distractions while working prevented early detection. Gas detection systems for early warning (example: drill floor level was alarm was turned off) Lack of shift change information from night to day shift. Driller’s display screen (Sperry-Sun) difficult to interpret, e.g. (pressure anomaly unnoticed)
No on-shore real-time monitoring facility.
Failed alarm systems, e.g. high-level alarm sounded two minutes late when much higher liquid level was received. Broken physical sight equipment for visual inspection. No general alarm sounded, instead radio reports and shouting to notify workers in the area. Alarms not tested prior as required by standard operating procedures.
Conduct stress testing Pandemic stress testing each year (July). Engineering tests prior to deployment of equipment (example: BOP was not tested). Positive-pressure tests of well integrity.
Negative-pressure test of well integrity. Cement testing during formulation by Halliburton.
No approval of facilities layout (dangerous positioning of trailers). Lack of process review during sensitive shut down / start up phases.
Develop scenario plan and modelling capability
Modelling the second wave of pandemic to estimate demand of medicines.
Model of gas flow and explosion on the rig. Cement model software at Halliburton Independent testing of cement formulation by
Chevron and CSI. OLGA software well-flow modelling. Simultaneous Operations using storyboarding
to coordinate operations after the event. Oil spill modelling after the event. Forensic study of BOP after it was retrieved from the sea floor (flow modelling, finite element modelling).
Gas flow modelling. Major Accident Risk analysis performed in 2003, however using limited scope and generic industry data.
Leverage preparedness plan
Assessment and update site pandemic preparedness plan.
Blow-out procedures during well completion. Rig abandonment procedures.
Standard shutdown procedures. Standard emergency procedures.
Implement training Assure skill availability for managing risk. Blow out prevention school for key engineers Online electronic bulletins and document
databases.
Employee training on leading indicators to sense possible disruptions. Local trained emergency response

270
Factors underlying response lead time
Tailored approaches Examples from PHARMA H1N1 2009 Influenza Pandemic
Examples from BP Response to Deepwater Horizon Oil Spill
Examples from BP Texas Refinery Explosion
services from Texas City fire and ambulance services.
Partnership (PA)
Establish frequent communications with supply chain partners
Proactive contact with governments to anticipate orders and allocate stock proportional to need. Increase frequency of press and public communications. Establish direct line of communication with external suppliers.
Improve communication with key suppliers: e.g. Halliburton communication of cement test results was incomplete. Increased frequency of press and public communications-daily press briefings. Real-time video camera feed (‘spillcam)’.
Congressional hearings after the event. Radio relay network for thousands of ships and team to coordinate response.
Participation in congressional hearings. Baker panel on BP refinery safety to review implementation of recommended changes. CSB investigations on root-cause and management background to the event. EPA investigations on adherence to regulation and environmental impact.
OSHA investigations on root-cause and employees safety.
Establish relationship with government, agencies, press, business partners and expertise
Coordination with international agencies e.g. CDC and WHO. Establish relationship with experts in the industry.
Invite external experts (academic, industry) to assist in design.
Establish relationship with competitors
N/A Outsourcing key tasks (Halliburton, Chevron, etc.) before and after event. Shell help BP adding capacity by provides ships for clean up. Marine Well company formed after event to facilitate recovery and reduce cost of reserve.
N/A
Organisation (O)
Create integrated response team
Create pandemic management organisation chart. Established integrated response team called “Crisis Management Team”. Create frequent communication with site directors.
Set up a War room at headquarters. Established online team room for document sharing.
BP internal investigation team. Established integrated response team called “Unified Command”.
Creation of cross-functional investigation team within BP in first 24 hours.
Shorten lines of communications within the organisation
Modify organisation hierarchy to shorten lines of communication.
N/A BP created a new communication structure for safety related issues.
Clarify roles and responsibilities
Revised logistics pandemic BCP and site pandemic N/A N/A

271
Factors underlying response lead time
Tailored approaches Examples from PHARMA H1N1 2009 Influenza Pandemic
Examples from BP Response to Deepwater Horizon Oil Spill
Examples from BP Texas Refinery Explosion
preparedness plan. Revised and updated roles and responsibilities as formally documented in RACI diagram.
Establish learning from past events and during the events
Learning from past epidemics (e.g. H5N1 Avian Flu). BP investigation team on root-cause and possible mitigation. National Commission on BP Deepwater Horizon Oil Spill Offshore Drilling Chief Counsel’s Report Coast Guard ISPR and BOEMRE Joint Investigation
DNV BPO Report on key equipment. Department of Justice Investigation on potential criminal liability.
Independent panel to determine critical factors. Updated physical site layout recommendations. Numerous recommendations on engineering, process, management, training.
Reserves (R) Assure management and employee capacity
Distribute H1N1 antiviral medicines to employees. Lockdown managers in-country and restrict travel to at-
risk areas (Mexico). Recruiting contingency workers to cover peak period and move to 24/7 shifts for greater production capacity in existing sites (Nicole).
Rig was abandoned relatively quickly to avoid further casualty. Leverage rig personnel in immediate fire-fighting operations. Extensively staffed 27 hours search for survivors.
Improved safety procedures for employees. Improved control over dangerous (‘hot’) work areas and general operations during sensitive start-up and shutdown sequence.
Increase capacity Reallocate labour resources to increase capacity of Nicole.
Leverage production load balancing by reducing load of production on some sites while increase production on main sites.
Oil recovery and burning facilities put in place to reduce impact of spill.
Hire wide group of existing fishing vessels to assist in recovery (‘Vessels of Opportunity’)
Improved staffing to reduce employee fatigue and improve alertness and response speed. Reduce distractions in control room.
Allocate time to complete testing. Geographic reserve – greater spacing of
activities for improved Simultaneous Operations, e.g. trailer siting.
Develop product or solution extensions
Having easier-to-manufacture Nicole capsule inhaler product design in place and ready to produce. Accelerate approval process for new products e.g. Nicole capsule inhaler and antiviral masks.
Initiate Relief Well drilling immediately. Develop new design solutions in place (Top
Hat, Oil Boom, Artificial Barrier, Top Kill, Skimmers, Junk Shot, BOP activation)
Changes in system design (e.g. removing out-of-date blowout preventor).
Acquire additional suppliers
Granting a production licence to a Chinese manufacturer.
Relief well drilling using capacity from Transocean.
N/A

272
Factors underlying response lead time
Tailored approaches Examples from PHARMA H1N1 2009 Influenza Pandemic
Examples from BP Response to Deepwater Horizon Oil Spill
Examples from BP Texas Refinery Explosion
Leasing of clean-up equipment from across the industry.
Increase flexibility Using generic pack (vanilla pack) instead of market specific packaging. Shift shared Hematol manufacturing capacity to Nicole. Shared same machine, labour, resources, warehouse, quality insurance etc.
Design of rigs for multiple operations (exploration, drilling, production on both gas and oil)
N/A
Increase inventory Increase raw material by securing all available active pharmaceutical ingredients (API) from the suppliers. Increase strategic stock of micronised ingredients.
Deploy remotely operated vehicle (ROV) with more flexible tooling
N/A
Table 34: A Summary of Examples from Three Settings

273
Chapter 9 Conclusion
9.1 Research conclusion
This empirical study of three cases of major supply chain disruption set out to
contribute to the further development of a framework of time-based supply chain
risk management and formulate propositions for further study and validation. Three
additional objectives were stated, to examine how three global corporations
perceive and manage risk, look at how companies incorporate techniques to reduce
time, and finally identify, analyse and categorize the possible factors that underlying
time of response.
The investigation of three major supply chain disruptions demonstrates that there
are identifiable patterns to how global organizations attempt to manage time in
responding to supply chain disruption, through action and structure in detection,
design and deployment of solutions.
Grounded Theory methodology proved effective, where a Straussian approach was
taken, using the time-based risk management framework as a lens to construct
interview questions and case-based qualitative data collection. An adaptive
approach is used to formulate core categories of tailored approaches that can
reduce time of detection, design and deployment of solutions. The emerging
framework was further developed using data from the second two cases.
Four propositions emerge, expressed below, stating that Preparation, Partnership,
Organization and Reserve are key factors in reducing response time. The theoretical
and management implications, and recommendations for further research are
presented as follows.

274
9.2 Implications of the research
9.2.1 Theoretical implications
This research provides a first empirical examination of a time based risk
management framework using Grounded Theory method.
Based on our empirical research and review of the literature, I propose the
following relationship between response time and each of four constructs.
Proposition 1: Firm seeks to reduce response time to supply chain disruption
through preparation by training, preparedness plans, stress testing, modelling or
advance warning systems.
Proposition 2: Firm seeks to reduce response time to supply chain disruptions
through organisational development on lines of communication, roles and
responsibilities, learning or empowerment.
Proposition 3: Firm seeks to reduce response time to supply chain disruptions
through partnerships among others suppliers, customers, technical and scientific
experts, government agencies or public media.
Proposition 4: Firm seeks to reduce response time to supply chain disruptions with
appropriate reserves such as increased capacity or increased inventory.
These propositions can augment existing knowledge related to time-based risk
management but also support hypothesis testing for future research in the field of
supply chain risk management.

275
9.2.2 Managerial implications
The study is based on a set of real-world cases of supply chain disruption that had
broad impact within and external to the firms. As a direct benefit from using a
Grounded Theory methodology, the concepts derived remain close to the real-
world managerial perspective of the participants in each case. Managers can
benefit from adapting risk-mitigation and risk-response measures through
improving existing or new business continuity efforts. Investors and stakeholders
such as lenders, investors, government and industry bodies have a keen interest in
understanding risk management readiness. Improved agility and responsiveness is a
direct outcome of a time-based risk management, benefitting overall supply chain
performance through greater awareness of primary and secondary processes and
improved communication.
Organizational factors internal and external to the organization are often
mentioned. These are directly accessible for strategic management. The identified
tailored approaches are qualitative in nature, and should prove to be complementary
to traditional quantitative supply chain modelling and management.
The approach and framework of solutions may have benefits in general supply
chain operational performance as well as improving speed of response during
disruption. For example, lines of manufacturing in PHARMA that can handle
multiple products provide supply chain scale, flexibility and reserve capacity. The
flexibility added to equipment used at vast depths beneath the sea was essential to
develop and trial possible solutions to the BP Deepwater Horizon disaster. The
same techniques now greatly reduce the time and expense in handling routine
operations on the sea floor.
This classification of factors can form the basis of a useful tool for supply chain
managers to assess and balance investment in management of disruption risk in the
supply chain.
This study used pharmaceutical industry and energy industry as examples, but the
findings can be applied in other industries, which can be useful to practitioners.
There are recent cases of disruption both natural and man-made from supply-chains

276
in the electronic, computer and automobile industries where this could apply, to
name a few.
For instance, in mobile phone industry, one of the most referenced cases in supply
chain disruption is the fire at the Philips microchip plant in Albuquerque, New
Mexico in March 200, which simultaneously affected both Nokia and Ericsson. As
the two major customers of the Philips plant, both firms were notified on the same
Monday following the accident. Their very different reactions to this seemingly
minor event have highlighted the importance of managing supply chain risk to
other companies. While Ericsson took weeks to absorb the information and react,
Nokia moved swiftly at all levels in its relationship with Philips and with alternate
component suppliers, assuring continuity of product delivery towards its own
customers. The impact was far-reaching – allowing Nokia to extend its market
leadership (to 27% by 2002) and contributing to Ericsson’s merger of its handset
business with rival Sony with loss of USD 400 million in 2000.
The key lessons learned from this case can be structured using the proposed
framework as follows:
1. The cost of reaction grows disproportionately with time. The company,
which can shorten respond time can effective, reduce impact of supply
chain disruption (detection).
2. By swiftly taking control of the supply of a critical component, Nokia
secured its manufacturing its manufacturing capacity but also effectively
blocked Ericsson from recovering in the same time-frame – this shows that
Nokia had a superior reserve in term of production capacity and supplier
capacity.
3. Learning and organization are important. Nokia had previously faced a similar
event and had subsequently put in place the mechanisms to support a faster
and more flexible response.

277
4. A strong partnership with other suppliers helped Nokia secure reserve capacity
at other Philips plants and every other supplier that Nokia could find.
While, Ericsson had no other component source. This costly disruption
generate new learning to Ericsson – as they company defined new concepts,
put in place new methods and plans, and modelled reaction time in dealing
with the inevitable disruption event in the future.
During the primary cases were analysed, several comparable events underscored the
need for a coherent time-based risk-management framework. In March 2011, an
earthquake of the coast of Japan was quickly followed by a devastating tsunami. At
least 15,000 people died and more than one million buildings were destroyed or
damaged. This virtually shut down industry for months in the region, having a
significant impact on export-oriented industries.
Just four months later, while Japan was still wrestling with near nuclear disaster at
the damaged Fukushima power station and beginning the massive clean-up effort,
catastrophic flooding hit Thailand, the worst for more than a century. Low-cost
industrial production areas just north of Bangkok were among the areas worst hit,
damaging production facilities in components and finished products such as
automotive components, cameras, analog and semiconductors, and hard disks.
Two of the largest disk makers, Western Digital and Seagate, had a large portion of
their global manufacturing in the area and had to stop production, as did Toshiba
whose motor supplier Nidec was unable to continue manufacturing. Shipment of
disks dropped by 25% in the third quarter of 2011, causing price increase and
supply shortage in the laptop and consumer market. The Thailand flooding was the
second major natural disaster to affect Japan that year. Some 1,800 Japanese
manufacturers operate in the country and 450 Japanese businesses are located in the
flood-hit industrial parks. All major car manufacturers, for example, have
significant supply chain operations in Thailand serving the domestic and regional
markets, “HIS Automotive downgraded Thailand’s light-vehicle forecast to 1.64
million units in the fourth quarter, down from 1.77 million units…these have
affected vehicles to be exported to core market in the ASEAN region, Australia,

278
Japan and the Mille East where Thailand’s exports account for 56 percent of total
production.47”
These dramatic events, which affected millions of citizens as well as supply chain
partners across the globe, provide a clear test of how quickly a global firm can
respond and recover from disruption.
A less visible but equally far reaching event was triggered by a small fire in the Marl
Chemical factory in Germany, part of Evonik Industries global manufacturing
capabilities. Sadly, although the fire was quickly extinguished, two employees died,
and there was some concern over environmental impact to the nearby town; luckily
no major health risk faced the broader public. The plant produced a specialized
resin used in the automotive industry to make brake and fuel lines. This relatively
small event pushed US OEMs and suppliers to meet as an industry to discuss the
global impact: “The shortage of the resin may impact the production of these
components in the next few week. The shortage is real and immediate…the
possibility of production interruptions at some of your facilities in the next few
weeks is high48” said William Kozyra, chairman of Auburn Hills, Michigan-based TI
Automotive.
This latest supply chain disruptions should further companies interest in evaluating
and managing their supply chain risks. It is also urged the companies, for example,
to look at a greater geographical (location) spread of their supply chain for new
factories and in terms of suppliers or relocating production. The factors proposed
in this paper can be used to evaluate response and improve response speed. Using
this viewpoint, lessons learned from Tsunami and Thai floods include:
1. Risk factors were overlooked when businesses sought areas with low labour
costs such as the industrial zones north of Bangkok.
2. Business should know their supply chain inside out – which includes
knowing the business partners and understanding the risks they face and
responses they might take.
47Zhang, F. (2008) 48 Trudell et al., (2012)

279
3. Executives need to be aware of risks – this should be built into the culture
of the organisation. Every level in the company must know about the risks
to the supply chain and any contingency and mitigation plans in place.
4. Suppliers are a critical part of the supply chain and product development
process, the relationship and frequent communications are critical to rapid
response.
5. Visibility into key supplier performance and the ability to evaluate and
simulate disruption (preparation: scenario planning and modelling) and
constraints are as important as the internal operation planning process.
6. Risk mitigation and response management in the supply chain occurs at
every level in the organization.
7. Where products are highly specialized, as in the Marl fire example, the
supply chain requires specific reserve capacity in the form of stock,
manufacturing, or alternatives.
8. Partnership with competitors or from exceptional relationships, such as in
the nuclear response at Fukushima, which involved worldwide resources,
can accelerate response.
9.3 Limitations of the Study and Future Work
While the methodology proved effective for the nature of event under study, the
research has several limitations.
Only two industries are used and two cases are from derived from the same firm,
albeit quite different divisions and business models. Applicability to other industries
could be explored through further study.
A small set of cases was used, due to the intensity of study and duration. Ideally,
this could be expanded to a larger set, where statistical and other quantitative
methods can enhance the qualitative approach used here. As mentioned, new cases
could be added, such as the 2011 Tohoku earthquake and tsunami in Japan, or
flooding in recently developed industrial areas north of Bangkok.
Firms are global and of societal importance, putting great scrutiny on external
communications and analysis. These cases are particularly well studied and
scrutinized in the public eye and firms faced potential and real litigation. Legislation

280
and litigation were important factor, which may bias some response in first hand
interview and availability of data outside formal testimony.
On a practical note, the use of software could facilitate the coding process for this
or a following study.
This study provides a foundation for further research.
From a theoretical point of view, evaluation of the propositions can be used to
validate or explore applicability of theories that address the cause, frequency and
avoidance of disruption, in particular Normal Accident Theory versus High
Availability Theory. From this study, it is apparent that several factors underlie early
detection – line of communication as well as training, for example, as well as rapid
response in total.
The second avenue for further research could empirically study the perception and
use of factors as stated above in broader set of firms including those firms who
have experienced major disruption as well as a test group who perceive their supply
chain to have maintained planned supply chain operations.
A different perspective in empirical validation would be to explore the perceived
trade-off between factors, for example effectiveness of training and fixed
preparedness plans prior to an event versus the rapid solution development during
an event response (e.g. new or modified solutions). In the case of the BP
Deepwater Horizon oil spill, for example, established oil spill containment
techniques were in some cases useless (e.g. artificial berms) and even potentially
harmful (chemical dispersants). Under certain circumstances, it could be postulated
that inappropriate plans may in fact delay the rapid development of more effective,
new solutions, given the complex and infrequent nature of catastrophic disruption.
Lastly, further research is warranted to assess the cost / benefit aspects where the
identified factors can imply a significant investment or create additional risk. It can
be again postulated, for example, that close cooperation with competitors to
leverage solutions or increase deployment capacity may reduce the imperative for a
firm to invest sufficiently in internal reserve.

281
Data from a larger sample size of firms could be used to evaluate managerial
decision-making, interdependence, and perceived cost / benefit for specific factors
of response to low frequency and high-impact events.
This research examine events in two major corporations using a Grounded Theory
approach to identify and characterize factors driving response lead-time in the face
of significant supply chain disruption. Building on an emerging framework in time-
based response, in the context of existing literature on supply chain complexity and
supply chain management, these factors provide a vehicle for further research.
It is a starting point to highlight a potentially rich area of empirical research in
supply chain risk using Grounded Theory. This study adds new concepts on
improving response to disruption to literature that has been primarily focused on
prevention of delays and disruptions through various means rather than on
planning for post-incident recovery as it focuses on response rather than the
capability to respond.
The factors are derived directly from observations and recommendations made by
the firms and their stakeholders and occur in recognizable patterns – both in their
presence with successful support to risk response and in their absence with
contribution to delay and exponentially greater impact. Although the cases are
found in different domains: a leading pharmaceutical response to a pandemic,
upstream oil exploration under extreme and unfamiliar conditions, downstream
energy refining in antiquated, profit-oriented industrial site, the commonality of
factors in Preparation, Partnership, Organisation and Reserve between the cases
suggest that further investigation can lead to an improved mitigation of catastrophic
risk in complex supply chains.

282
Bibliography
60 mintues. (2010a) BP’s deepwater horizon oil rig disaster 3. [Video] Available from: http://www.youtube.com/watch?v=Ubqfo0x0nLo&feature=related. 60 mintues. (2010b) BP’s deepwater horizon oil rig disaster 3. [Video] Available from: http://www.youtube.com/watch?v=PLKTyYLJ54s&feature=related . Achenbach, J. (2010) BP cost-cuting measures are focus of U.S. inquiry into gulf spill. The Washington Post. [Online] Available from: http://www.washingtonpost.com/wp-dyn/content/article/2010/10/08/AR2010100803145.html Andreewsky, E. & Bourcier, D. (2000) Abduction in language interpretation and law making. Kybernetes, 29 (7/8), 836-845. Ansoff, H. I. (1975) Managing strategic surprise by response to weak signals. California Management Review, 18 (2), 21-33. Arora, V. K. & Boer, G. J. (2005) Fire as an interactive component of dynamic vegetation models. Journal of Geophysics Research, 110 (G02008), 1-20. Arrow, K. J. (1965) Aspact of Theory of Risk Bearing. Helsinki, Yrjö Jahnssonin Säätiö Publishing. Ashton, D. & Tippette, M. (2003) Systematic risk and empirical research. Journal of Business Finance and Accounting, 25 (9/10), 1325-1356. Associatedpress. (2010) Engineer: Deepwater horizon alarm ‘inhibited’. [Video] Available from: http://www.youtube.com/watch?v=9shhEjTeMhU. Baird, I. & Thomas, H. (1990) What is ris anyway? In R. A. Bettis & H. Thomas (Eds.), Risk, Strategy and Management, 21-52. Greenwich: JAI Press. Barnes, P. H. & Oloruntoba, R. (2005) Assurane of security in maritime supply chains: conceptual issues of vulberability and crisis management. Journal of International Management, 11 (4), 519-540. Barney, J. B. & Ouchi, W. G. (1986) Organisational Econonics, San Francisco, CA: Jossey-Bass Publishers. Baucus, D. A., Golec, J. H. & Cooper, J. R. (1993) Estimating risk-return relationships: an anlysis of measures. Strategic Management Journal, 14 (5), 387-396. Available from: DOI: 10.1002/smj.4250140506. Beckera, N.C. and Lillemarkb, M. (2006) “Marketing/ R&D integration in the pharmaceutical industry”, Research Policy, Vol. 35 No. 1, pp.105.20. Benbasat, I., Goldstein, D. and Mead, M. (1987) “The case research strategy in studies of information systems”, MIS Quarterly, September, pp.369-86. Berlin, Frenkel, M. and Rudolf, M. (2005) Risk Management: Challenge and Opportunity, 2nd revised and expanded edition, Springer-Verlag. Bernstein, P. (1996), Against the Gods: The Remarkable Story of Risk, Wiley, Chichester. Billings, R. S., Milburn, T. W. & Schaalman, M. L. (1980) A model of crisis perception: A theoretical and empirical analysis. Administrative Science Quarterly, 25, 300-316. Blackburn, J.D. (Ed.) (1991) Time-based Competition: The Next Battleground in American Manufacturing, Business One Irwin, Homewood, IL.

283
Blume, M. E. (1971) On the assessment of risk. The Journal of Finance, 26, 1-10. Bockerstette, J.A. and Shell, R.L. (1993) Time-based Manufacturing, Industrial Engineering and Management Press, Norcross, GA. Bode, C., Friederichs-Schmidt, S., Lindemann, E. & Sauer, R. (2007) Supply chain risiken und ihre versicherbarkeit. Logistik Management, 9, 8-22. Bowersox, D.L and Closs, D.J. (1996) Logistical Management, The Integrated Supply Chain Process, McGraw-Hill, International Edition. BP (2010a) BP'sdeepwater horizon oil rig disaster 2, Available from: http://www.youtube.com/watch?v=tXnFpkJ9au8&feature=related . BP (2010c) Deepwater horizon accident investigation report, BP. Available from: http://www.bp.com/liveassets/bp_internet/globalbp/globalbp_uk_english/incident_response/STAGING/local_assets/downloads_pdfs/Deepwater_Horizon_Accident_Investigation_Report.pdf. BP (2010d) Deepwater horizon accident investigation report appendixes abfgh, BP BP (2010e) Deepwater horizon accident investigation report appendixes cde, BP. BP (2010f) Deepwater horizon accident investigation report static presentation, BP. BP (2010g) Deepwater horizon containment and response: Harnessing capabilities and lessons learned, BP. Available from: http://www.bp.com/liveassets/bp_internet/globalbp/globalbp_uk_english/incident_response/STAGING/local_assets/downloads_pdfs/Deepwater_Horizon_Containment_Response.pdf. Brindley, C. (2004), Supply Chain Risk, Ashgate, USA. British Standards Institute (1995) BS7799- Code of Practice for Information Security Management, BSI, London, Burnes, B. and New, S. (1996) “New perspectives on supply chain improvement: purchasing power v supplier competence”, European Journal of Purchasing & Supply Management, Vol. 2 No. 1, pp.21-30. Burnes, B. and Dale, B. (Eds) (1998) Working in Partnership, Gower, Aldershot. Burns, A., Mensbrugghe, D. and Timmer, H. (2008) Evaluating the economic consequences of Avian Influenza. The World Bank’s June 2006 Edition of the Global Development Finance [Online] Available from: http://siteresources.worldbank.org/EXTAVIANFLU/Resources/EvaluatingAHIeconomics_2008.pdf Cavinato, J. L. (2004) Supply chain logistics risks: From the back room to the board room. International Journal of Physical Distribution & Logistics Management, 34, 383-387. Casselman, B. & Gold, R. (2010) BP decisions set stage for disaster The Wall Street Journal. Available: http://online.wsj.com/article/SB10001424052748704026204575266560930780190.html. CBS (2007) Final investigation report. Available from: http://www.csb.gov/index.cfm?folder=current_investigations&page=info&INV_ID=52 Celly, K. S., Frazier, G.L. (1996) Outcome-based and behavior-based coordination efforts in channel relationships. Journal of Marketing Research 33, 200–210. Charmaz, K. (2000) Grounded thoery: Objective and constructivist methods. In N.K. Denzin & Y.S. Lincoln (Eds., Handbook of Qualitative Research (2nd ed.). Thousand Oaks, CA: SAGE. Charmaz, K (2004). Premises, principles, and practices in qualitative research: Revisiting the foundation. Qualitative Health Research, 14, 976-993.

284
Charmaz, K. (2006). Constructing Grounded Theory: A Practical Guide Through Qualitative Analysis. Thousand Oask, CA: SAGE. Chartered Management Institute (CMI) (2002), Business Continuity and Supply Chain Management, report available at: www.thebci.org/2809-01 Bu Continuity Summ.pdf. Accessed on 22 August, 2007 Child, J. and Faulkner, D. (1998), “Strategies of cooperation: managing alliances, networks, and joint ventures”, Oxford University Press, 1998. Chropra, S. and Sodhi, M. (2004) Managing risk to avoid supply chain breakdown. Sloan Management Review, 46(1): 53-61. Chopra, S. and Sodhi, M. (2004), “Avoiding Supply Chain Breakdown”, Sloan Management Review, Fall, Vol. 46 No. 1, pp.53-62. Chow, K. V. & Denning, K. C. (1994). On variance and lower partial moment betas the equivalence of systematic risk measures. Journal of Business Finance & Accounting, 21, 231-241. Christopher, M. (1992), Logistics and Supply Chain Management: Creating Value-Adding Networks, 3rd ed., Prentice-Hall, Harlow. Christopher, M. (2002), Supply Chain Vulnerability, Cranfield University, Cranfield, final report on behalf of DTLR, DTi and Home Office. Christopher, M. (2004), “Creating resilient supply chains”, Logistics Europe, pp.14-21 Christopher, M. (2004),“Mitigating supply chain risk through improved confidence”, International Journal of Physical Distribution & Logistics Management, Vol. 34 No. 5, pp.388-396. Christopher, M. P., Helen (2002). Supply chain vulnerability. Cranfield Research. Christopher, M. and Peck, H. (2004), “Building the resilient supply chain”, International Journal of Logistics Management, Vol. 15 No. 2, pp.1-14. Christopher, M. & Peck, H. (2004). Building the resilient supply chain. International Journal of Logistics Management, 15, 1-13. Coase, R.H. (1939), Business Organisation and Accountant. Reprinted in J.M. Buchanan and G.F. Thirlby, eds, L.S.E. Essays on Cost (New York: New York University Press, 1981), pp.97-132. Cohen, M.A. and Huchzermeier, A. (1999), “Global supply chain management: a survey of research and applications”, in Tayur, S. and Ganeshan, R. (Eds), Quantitative Models for Supply Chain Mnagement, Kluwer, Boston, MA, pp.669-702. Coleman, L. (2006). Frequency of man-made disasters in the 20<sup>th</sup> century. Journal of Contingencies & Crisis Management, 14, 3-11. Cooper, M. C., Lambert, D. M. & Pagh, J. D. (1997). Supply chain management: More than a new name for logistics. International Journal of Logistics Management, 8, 14-11. Cooper, M. C., Lambert, D. M. & Pagh, J. D. (1998). Supply chain management: Implementation issues and research opportunities. International Journal of Logistics Management, 9, 20-21. Cortada, J.W. and Traser, H.E. (2005), “Mapping the future in science intensive industries: lessons from the pharmaceutical industry”, IBM Systems Journal, Vol. 44 No. 1, pp.163-83. Council of Logistics Management (CLM) (2003), http://www.clm1.org/aboutus_policy.asp#definitions. Accessed 22 August, 2007. Cousins, P., Lamming, R.C. and Bowen, F. (2004), “The role of risk in environment-related initiatives”, International Journal of Operations & Production Management, Vol. 24 No. 6, pp.554-65.

285
Covello, V.T. and Merkhofer, M.W. (1993), Risk Assessment Methods- Approaches for Assessing Health and Environmental Risks, Plenum Press, New York, NY. Cox, A. and Townsend, M. (1998), Strategic Procurement in Construction, Thomas Telford, London. Craighead, C. W., Blackhurst, J., Rungtusanatham, M. J. & Handfield, R. B. (2007). The severity of supply chain disruptions: Design characteristics and mitigation capabilities. Decision Sciences, 38, 131-156. Cresswell, J. W. (2003), Research design: Qualitative, quantitative and mixed methods approaches (2nd ed.). Thousand Oask, CA: SAGE. Cucchiella, F. and Gastaldi, M. (2005), “Risk management in supply chain: a real option approach”, Journal of Manufacturing Technology Management, Vol. 17 No. 6, pp.700-720. Danermark, B. (2001), Explaining Society: An Introduction to Critical Realism in the Social Sciences, Routledge, Florence, KY. Damodaran, A. (2007), Strategic Risk Taking: A Framework For Risk Management, Wharton School Publishing. Damon, A. (2010), Deepwater horizon survivors told to take drug test before being allowed to call families. Available: http://www.wsws.org/articles/2010/may2010/deep-m06.shtml. Daniels, N.C. and Essaides, G. (1993), Time-based Competition, Economic Intelligence Unit, London. DET NORSKE VERITAS. (2011b), Final report for united states department of the interior, bureau of ocean energy management, regulation, and enforcement - forensic examination of deepwater horizon blowout preventer, Washington, DC, OSC - Oil Spill Commission. Dibb, S., Russell, I. and Simkin, L. (1997), “The EU marketing environment: pharmaceuticals and Japanese strategy”, European Management Journal, Vol. 15 No. 2, pp.195-205. Dickson, G. (1989), Corporate Risk Management. Institute of Risk Management, Witherby, London. Dubois, A. and Gadde, L.-E. (2002), “Systematic combining: an abductive approach to case research”, Journal of Business Research, Vol. 55, pp. 553-60. Eisenhardt, K. (1989), “Building theories from case study research”, Academy of management Review, Vol. 14 No 4, pp. 532-550. Eisenhardt, M, K. (1989), “Agency theory: an assessment and review”, Academy of Management Review, Vol. 14 No. 1, pp.57. Elkins, D., Handfield, R. B., Blackhurst, J. & Craighead, C. W. (2005). 18 ways to guard against disruption. Supply Chain Management Review, 9, 46-53. Elliott, D. and Smith, D. (1993), “Football stadia disasters in the United Kingdom: learning from tragedy”, Industrial and Environmental Crisis Quarterly, Vol. 7 No. 3, pp.205-29. Elliott, D., Swartz, E. and Herbane, B. (2002), Business Continuity Managmenet. A Crisis Management Approach, Routledge, London. Elliott, L. (2005), “US trade deficit hits record after Boeing strike and hurricanes”, The Guardian, 11 November, p.32. Ellram, L.M. (1991a), “A managerial guideline for the development and implementation of purchasing partnerships”, Journal of Supply Chain Management, Vol. 27 No. 3, pp.2-8. Ellram, L.M. (1991b), “Supply chain management: the industrial organisation perspective” International Journal of Physical Distribution & Logistics Management, Vol. 21 No. 1, pp.13-22.

286
Ellram, L.M. (1996), “The use of case study in logistics”, Journal of Business Logistics, Vol. 17 No. 2, pp.92-138. Faisal, M.N., Banwet, D.K. and Shankar, R. (2006), “Supply chain risk mitigation: modelling the enablers”, Business Process Management Journal, Vol. 12 No. 4, pp.535-52. Financial Times (2011). Bp oil spill. Financial Times. Available: http://www.ft.com/indepth/bp-oil-spill. Fink, S. (1986), Crisis Management: Planning for the Inevitable, American Management Association, New York, NY. Fone, M. and Young, P. (2000), Public Sector Risk Management, Butterworth Heinemann, London. Food and Agriculture Organisation (2010) Avian Influenza: continued support is required. FAO [Online] Available from: http://www.fao.org/avianflu/en/news/hpai_support.html
Frosdick, M. (1997), “The techniques of risk management are insufficient in themselves”, Disaster Prevention and Management, Vol. 6 No. 3, pp. 165-772. Gatignon, H. And Kimberly, J.R. (2004), The Insead-Wharton Alliance on Globalizing: Strategies for Building Successful Global Business, Cambridge. Giferenzer, G. (2002), Reckoning With Risk, Penguin Books, London. Giunipero, L.C. and Brand, R.R. (1996), “Purchasing role in the supply chain management”, The International Journal of Logistics Management, Vol. 7 No.1, pp.29-37. Glaser, B. G. (1978). Theoretical Sensitivity: Advances in the Methodology of Grounded Theory. Mill Valley, CA: Sociology Press. Glaser, B.G. (1992). Basics of Grounded Theory: Emergence vs. Forcing. Mill Valley, CA: Sociology Press. Glaser, B.G. (1998). Doing Grounded Theory: Issues and Discussions. Mill Valley, CA: Sociology Press. Glaser, B.G. (2001). The Grounded Theory Perspective: Conceptualization Contrasted with Description. Mill Valley, CA: Sociology Press. Glaser, B.G. (2003). The Grounded Theory Perspective II Description’s Remodelling of Grounded Theory Methodology. Mill Valley, CA: Sociology Press. Glaser, B.G. (2005). The Grounded Theory Perspective III: Theoretical Coding. Mill Valley, CA: Sociology Press Glaser, B.G. & Strauss, A.L. (1967). The Discovery of Grounded Theory: Strategies for Qualitative Research. Hawthrone, NY Aldine de Gruyter. Goldenberg, S. (2010). Deepwater horizon survivor describes horrors of blast and escape from rig. The guardian. Available at: <http://www.guardian.co.uk/environment/2010/may/20/survivor-deepwater-horizon-gulf-oil-explosion> Golilic, S. L., Davis, D. F., McCarthy, T., Mentzer, J.T. (2002), “The impact on e-commerce on supply chain relationships”, in International Journal of Physical Distribution and Logistics Management, Vol. 32 No. 10, pp.851-871. Grayson, D. & Denyer, D. (2010), Reflections on the bp oil spill crisis. Cranfield Univeristy. Available: http://www.som.cranfield.ac.uk/som/p15276/Think-Cranfield/2010/September-2010/Reflections-on-the-BP-Oil-Spill-Crisis?utm_source=thinkcranfield&utm_medium=email&utm_term=operations&utm_content=think_article1&utm_campaign=think_sept2010&guid=26C87F0E-A2A6-4.

287
Greis, N.P. and Kasarda, J.D. (1997), “Enterprise logistics in the information era”, California Management Review, Vol. 39 No.3, pp.55-79. Grose, V. (1992), “Risk management from a technological perspective”, The Geneva Paper on Risk and Insurance, Vol. 12 No. 64, pp.335-42. Hallikas, J., Virolainen, V., Tuominen, M. (2002), "Risk analysis and assessment in network environments: a dyadic case study", International Journal of Production Economics, Vol. 78 No.1, pp.45-55. Hamel, G. (1994), Competing for the Future, Harvard Business School Press, Prahalad. Handfield, R. and Nichols, E.L. Jr. (1999), Introducion to Supply Chain Management, Prentice-Hall, Upper Saddle River, NJ. Harland, C., Brenchley, R. and Walker, H. (2003), “Risk in supply networks”, Journal of Purchasing and Supply Management, Vol. 9 No. 2, pp.51-62. Harland, C., Zheng, J., Johnsen, T. & Lamming, R. (2004). A conceptual model for researching the creation and operation of supply networks1. British Journal of Management, 15, 1-21. Hazarika, S. (1987), Bhopal. The Lessons of a Tragedy, Penguin Books, New Delhi. Helferich, O. K. & Cook , R. L. (2002). Securing the supply chain, Oak Brook, IL, Council of Logistics Management. Hendricks, K.B. and Singhal, V.R. (2002) “How supply chain glitches torpedo shareholder value”, Supply Chain Management Review 6, No. 1, pp.18-24. Hendricks, K.B. and Singhal, V.R. (2003), The effect of supply chain glitches on shareholder value”, Journal of Operations Management, Vol. 21 No. 5, pp.501-22. Hendricks, K.B. and Singhal, V.R. (2005), “An empirical analysis of the effects of supply chain disruption on long-run stock price performance and equity risk of the firm”, Production and Operations Management, Vol. 14 No. 1, pp.22-53. Heracleous, L. and Murray, J. (2001), “The urge to merge in the pharmaceutical industry”, European Management Journal, Vol. 19 No. 4, pp.430-7. Hermann, C. F. (1963). Some consequences of crisis which limit the viability of organizations. Administrative Science Quarterly, 8, 61-82. Hiles, A. and Barnes, P. (Eds) (2001), The Definitive Handbook of Business Continuity Management, J. Wiley & Sons, Chichester. Hill, T., Nicholson, A. and Westbrook, R. (1999), “Closing the gap: a polemic on plant-based research in operations management”, International Journal of Operations & Production Management, Vol. 19 No. 2, pp.139-156. Ho, S. S., Pike, R.H. (1992). Adoption of probabilistic risk analysis in capital budgeting and corporate investment. Journal of Business Finance and Accounting, 19, 387–405. Hood, C. and Rothstein, H. (2000), “Business risk management in government: pitfalls and possibilities”, National Audit Office: Supporting Innovation- Managing Risk in Government Departments, National Audit Office, London. Hood, J. & Young, P. (2005). Risk financing in UK local authorities: Is there a case for risk pooling? International Journal of Public Sector Management, 18, 563-578. Houlihan, J.B. (1985), “International supply chain management”, International Journal of Physical Distribution and Materials Management, Vol. 15 No. 1, pp.22-38.

288
Hudson, L.A. and Ozanne, J.L. (1988), “Alternative ways of seeking knowledge in consumer research”, Journal of Consumer Research, Vol. 14, pp.508-521. Hum, S. and Sim, H. (1996), “Time-based competition: literature review and implications for modelling”, International Journal of Operations & Production Management, Vol. 16, pp.75-90. In-Pharma (5 October 2006) GSK lets Chinese firm manufacture flu drug. In-Pharma Technologist [Online] Available from: http://www.in-pharmatechnologist.com/Regulatory-Safety/GSK-lets-Chinese-firm-manufacture-flu-drug Janssens, M. (2000), Introduction to Mathematical Fire Modelling, Second edition, CRC publisher. Johnson, M.E. (2001), “Learning from toys: lessons in managing supply chain risk from the toy industry”, California Management Review, Vol. 43 No.3, pp.106-24. Jones, T.C. and Riley, D.W. (1985), “Using inventory for competitive advantage through supply chain management”, International Journal of Physical Distribution and Materials Management, Vol. 15 No. 5, pp.16-26. Juttner, U. (2005), “Supply chain risk management understanding the business requirements from a practitioner perspective”, The International Journal of Logistics Management, Vol. 16 No. 1, pp.120-141. Jüttner, U., Peck, H. & Christopher, M. (2003). Supply chain risk management: Outlining an agenda for future research. International Journal of Logistics: Research & Applications, 6, 197-210. Keim, B. (15 June 2010) BP’s ‘Nightmare’ Well: Internal documents uncover negligence. Wired Science [Online] Available from: http://www.wired.com/wiredscience/2010/06/bp-nightmare-email/ Kent, J.L. and Flint, D.J. (1997), “Perspectives on the Evolution of Logistics Thought”, Journal of Business Logistics, Vol.18 No. 2, pp.15-29. Khan, O. and Burnes, B. (2007), “Risk and supply chain management: creating a research agenda”, The International Journal of Logistics Management, Vol. 18 No. 2, pp.197-216. Kirkeby, O.F. (1990), “Abduktion”, in Andersen, H. (Ed.), Vetenskapsteoriochmetodlara. Introduktion, (translated by Liungman, C.G.), Studentlitteratur, Lund. Kleindorfer, P.R. and Saad, G.H. (2005), “Managing disruption risks in supply chains”, Production and Operation Management, Vol. 14 No.1, pp.53-68. Kieindorfer, P. R. & Van Wassenhove, L. N. (2004). Managing risk in global supply chains. In: GATIGNON, H., JOHN, R. K. & ROBERT, E. G. (eds.) The insead-wharton alliance on globalizing. Cambridge, UK: Cambridge University Press. Knight, F.H. (1921), Risk, Uncertainty and Profit, Houghton Mifflin, Boston, MA. Kor, Yasemin Y. and Mahoney, Joseph T., "Edith Penrose's (1959) Contributions to the Resource-based View of Strategic Management", Journal of Management Studies, Vol. 41, No. 1, pp. 183-191. Kotzab, H., Seuring, S., Muller, N. and Reiner, G. (2005), Research Methodologies in Supply Chain Management, Phhysica-Verlag. Kovacs, G. and Spens, K.M. (2005), “Abductive reasoning in logistics research”, International Journal of Physical Distribution & Logistics Management, Vol. 35 No. 2, 2005. Kovoor-Misra, S., Clair, J. A. & Bettenhausen, K. L. (2001. Clarifying the attributes of organizational crises. Technological Forecasting and Social Change, 67, 77-91. Kraljic, P. (1983), “Purchasing must become supply management”, Harvard Business Review, Vol. 61 No. 5, pp.109-17.

289
Lambert, D.M., Cooper, M.C. and Pagh, D. (1997), “Supply chain management: more than a new name for logistics”, The International Journal of Logistics Management 8.1, pp.1-14. Lambert, D.M., Cooper, M.C. and Pagh, D. (1998), “Supply chain management: implementation issues and research opportunities”, The International Journal of Logisitcs Management 9, Vol. 1-19. Lambert, D.M. and Cooper, M.C. (2000), “Issue in supply chain management”, Industrial Marketing Management, No. 29, pp.65-83. Lee, H. (2004), “The Triple-A Supply Chain,” Harvard Business Review, pp.102-112. Lee, H. L. & Billington, C. (1993). Material management in decentralized supply chains. Operations Research, 41, 835-847. Lee, H. L. & Wolfe, M. (2003). Supply chain security without tears,. Supply Chain Management Review, 7, 12-20. Leonard-Barton, D. (1990), “A dual methodology for case studies: synergistic use of a longitudinal single site with replicated multiple sites”, Organisation Science, Vol. 1 No. 1, pp.248-66. Lin, Z., Zhao, X., Ismail, K. M. & Carley, K. M. (2006). Organizational design and restructuring in response to crises: Lessons from computational modeling and real-world cases. Organization Science, 17, 598–618 Lonsdale, C. (1999), “Effectively managing vertical supply relationships: a risk management model for outsourcing”, Supply Chain Management: An International Journal, Vol. 4 No. 4, pp.176-83. Losch, A. (2006), “Combining qualitative methods and Grounded Theory for researching E-Reverse auctions”, Department of Information and Communication, Manchester Metropolitan University, Manchester, UK. Lowrance, W.W. (1980), “The nature of risk”, in Schwing, R.C. and Albers, W.A. (Eds), How Safe is Safe Enough?, Plenum Press, New York, NY. Lupton, D. (1999), Risk, Routledge, London. Maanen, J.V. (1983), Qualitative Methodology, Sage Publication. Macrae, F. (18 January 2010) The false pandemic: drug firms cashed in on scare over swine flu, claims Euro health chief. Mail Online. [Online] Available from: http://www.dailymail.co.uk/news/article-1242147/The-false-pandemic-Drug-firms-cashed-scare-swine-flu-claims-Euro-health-chief.html Maccrimmon, K. R. & Wehrung, D. A. (1986). Taking risks: The management of uncertainty, New York, Free Press. Malnight, T.W. (2001), “Emerging structural patterns within multinational corporations: toward process-based structures”, Academy of Management Journal, Vol.44 No.6, pp.1187-210. Manuj, I. & Mentzer, J. T. 2008. Global supply chain risk management strategies. International Journal of Physical Distribution & Logistics Management, 38, 192-223. March, J.G. and Shapira, Z. (1987), “Managerial perspectives on risk and risk taking”, Management Science, Vol. 33 No. 11, pp.1404-18. Markowitz, H.M. (1959), Portfolio Selection Efficient Diversification of Investment, New Haven and London, Yale University press. Martha, J. & Subbakrishna, S. (2002). Targeting a just-in-case supply chain for the inevitable next disaster. Supply Chain Management Review, 6, 18.

290
Mason-Jones, R. and Towill, D. (1998), “Shrinking the supply chain uncertainty cycle”, Control, September, pp.17-22. Mayring, P. (2002), “Qualitative Inhaltsanalyse”, British Medical Journal Vol. 324, pp.838-842. McGinnis, M.A., Boltic, S.K. and Kochunny, C.M. (1994), “Trends in Logistics Thought: An Empirical Study”, Journal of Business Logistics, Vol. 15 No. 2, pp. 273-303. Mckinnon, A. (2006). Life without trucks: The impact of a temporary disruption of road freight transport on a national economy. Journal of Business Logistics, 27, 227-250. Members of the Subcommittee on Oversight and Investigations (2010), Key questions arising from inquiry into the deepwater horizon gulf of mexico oil spill. Mentzer, J.T. and Kahn, K.B. (1995), “A framework of logistics research”, Journal of Business Logistics, Vol. 16 No. 1, pp.231-251. Mentzer, J.T. and Flint, D.J. (1997), “Validity in logistics research”, Journal of Business Logistics, Vol. 18 No. 1, pp.199-216. Mentzer, J.T. DeWitt, W., Keebler, J.S., Min, S., Nix, N.W., Smith, C.D. and Zacharia, Z.G. (2001), “Defining supply chain management”, Journal of Business Logistics, Vol. 22 No. 2, pp.1-25. Meredith, J. (1993): Theory building through conceptual methods, in: Journal of Business Logistics, 18(2): 199-216 Meredith, J. (1998): Building operations management theory through case and field research, in: Journal of Operations Management, 16(4): 439-452 Merna, A. and Smith, N.J. (1999), “Privately finaced infrastructure for the 21st century”, Proceedings of the Institution of Civil Engineers, 132, pp.167-73 Merton, R.K., Fiske, M. and Kendall, P.L. (1990). The focused interview: A manual of problems and procedures (2n ed.), New York: Free Press. Milburn, T. W., Schuler, R. S. & Watman, K. H. (1983). Organizational crisis. Part i: Definition and conceptualization. Human Relations, 36, 1141. Miller, W.L., Crabtree, B.F. (1992), “Primary case research: A multimethod typology and qualification road map. In: Crabtree, B.F., Miller, W.L (Eds.), Doing Qualitative Research. Sage Publications, Newbury Park, CA. Minahan, T.A. (2005), The Supply Risk Benchmark Report, Aberdeen Group, Boston, MA. Mintzberg, H., Ahlstrand, B. and Lampel, J. (1998), Strategy Safari: A Guided Tour Through The Wilds of Strategic Management, Free press. Mitchell, V-W. (1995), “Organisational risk perception and reduction: a literature review”, British Journal of Management, Vol. 6, pp.115-33. Mitroff, I. I. & Alpaslan, M. C. (2003). Preparing for evil. Harvard Business Review, 81, 109-115. Mollison, D. (2003), Epidemic Models: Their Structure and Relation to Data, Cambridge University Press. Moore, P.G. (1983), The Business of Risk, Cambridge University Press, Cambridge. Mukherjee, A. Mitchell, W. and Talbot, F.B. (2000), The impact of new manufacturing technologies and strategically flexible production in: Journal of Operation Management, Vol. 18 pp. 139-168 Näslund, D. (2002), “Logistics needs qualitative research – especially action research”, International Journal of Physical Distribution & Logistics Management, Vol. 32 No. 5, pp.321-338.
291
Newman, K. and Pyne, T. (1997), “Service Quality and Blood Donors – a Marketing Perspective”, Journal of Marketing Management,, Vol.13, pp.579-599. Newman, W.R., Hanna, M. and Maffei, M.J. (1993), “Dealing with the uncertainties of manufacturing: flexibilities, buffers and integration”, International Journal of Operations & Production Management, Vol. 13 No. 1, pp.19-34 Norrman, A. & Jansson, U. (2004). Ericsson's proactive supply chain risk management approach after a serious sub-supplier accident. International Journal of Physical Distribution & Logistics Management, 34, 434-456. Norrman, A. and Lindroth, R. (2002), “Supply chain risk management: purchasers’ vs. planners” view on Sharing Capacity Investment Risks in the Telecom Industry”, proceedings of the 11th International Annual IPSERA conference, Twente University, 25th-27th March, pp.577-595. Norrman, A. and Jansson, U. (2004), “Ericsson’s proactive supply chain risk management approach after a serious sub-supplier accident”, International Journal of Physical Distribution & Logistics Management, Vol. 34 No. 5, pp. 434-56. Oil Spill News (11 October 2010) Gulf of Mexico Oil Spill Blog Federal Hearings: Gulf of Mexico. [Online] Available from: http://www.oilspillnews.net/oil-spill-claims/gulf-of-mexico-oil-spill-blog-federal-hearings-gulf-of-mexico/ OSC - Oil Spill Commission (2011a), Deep water: The gulf oil disaster and the future of offshore drilling - report to the president, National Commission on the BP Deepwater Horizon Oil Spill and Offshore Drilling. Available at: http://www.oilspillcommission.gov/final-report. OSC- Oil Spill Commision (2010b), Congressional testimony, Available at: http://www.oilspillcommission.gov/. OSC - Oil Spill Commission (2010c), Macondo: The gulf oil disaster / chief council's report, National Commission on the BP Deepwater Horizon Oil Spill and Offshore Drilling. OSC - Oil Spill Commission (2010d),The history of offshore oil and gas in the united states - staff working paper no. 22, National Commission on the BP Deepwater Horizon Oil Spill and Offshore Drilling. Osterholm, M.T. (5 May 2005) Preparing for the next pandemic. The New England Journal of Medicine [Online] Available from: http://www.nejm.org/doi/full/10.1056/NEJMp058068 OSHA (22 Septermber 2005) OSHA fines BP products North America more than USD 21 million following Texas City explosion. [Online] Available from: http://www.osha.gov/pls/oshaweb/owadisp.show_document?p_table=NEWS_RELEASES&p_id=11589 Oxfam (2001) Briefing paper on PHARMA: Dare to lead, public health and company weath. [Online] Available from: http://www.oxfam.org.uk/ Pagell, M., Krause, D.R. (1999). A multiple method study of environmental uncertainty and manufacturing flexibility. Journal of Operations Management 17, 307–326. Paraskevas, A. (2006), “Crisis management or crisis response system? A complexity science approach to organisational crises”, Management Decision, Vol. 44 No. 7, pp.892-907. Pearson, C.M. and Clair, J.A. (1998), “Reframing crisis management”, Academy of Management Review, Vol. 23 No. 1, pp.59-76. Peck, H. (2004), “Resilience: surviving the unthinkable”, Logistics Manager, March, pp.16-18. Peck, H. (2005a). Drivers of supply chain vulnerability: An integrated framework. International Journal of Physical Distribution & Logistics Management, 35, 210-232. Peck, H. (2005b). Reducing risk in the defence supply chain. Defend management journal.

292
Peck, H. and Juttner, U. (2002), “Risk management in the supply chain” Logistics & Transport Focus, Vol. 4 No. 11, pp.17-22. PHARMA (2007), Annual Report PHARMA (2008), Annual Report PHARMA (2009), Annual Report PHARMA (2010), Annual Report Pilling, B.K. and Zhang, L. (1992), “Cooperative exchange: rewards and risks”, International Journal of Purchasing & Materials Management, Vol. 28 No. 2, pp.2-9. Porter, M.E (1980), “Competitive Strategy”, The Free Press, New York. Porter, M.E (1985), Competitive Advantage: Creating and Sustaining Superior Performance” The Free Press collier Macmillan. Porter, M.E (1996), “What is strategy?”, Harvard Business Review, November-December, pp.61-78. Preble, J.F. (1997), “Integrating the crisis management perspective into the strategic management process”, Journal of Management Studies, Vol. 34 No. 5, pp.769-91. Puto, C.P., Patton, W.E. and King, R.H. (1985), “Risk handling strategies in industrial vendor selection decisions”, Journal of Marketing, Vol. 49, pp.89-98. Quarantelli, E.L. (Ed.) (1998), What is a Disaster? Perspectives on the question,Routledge, London. Rapier, R. (2011), A closer look at the commission report on the deepwater horizon disaster. Available: http://theenergycollective.com/robertrapier/52374/closer-look-commission-report-deepwater-horizon-disaster. Reason, J.T. (1997), Managing the Risks of Organisational Accidents, Ashgate, Aldershot. Remenyi, D., Williams, B., Money, A. and Swartz, E. (1998), Doing Research in Business and Management: An Introduction to Process and Methods. London, Sage Publications. Rice, J. B., Jr. & Caniato, F. (2003). Building a resilient and secure supply chain. Rice, J. B. and Caniato, F. (2004), “Supply chain response to terrorism: creating resilient and secure supply chains,” Supply Chain Response to Terrorism Project Interim Report, MIT Center for Transportation and Logistics, MIT, Massachusetts. Rice, J. B. J. & Tenney, W. 2007. How risk management can secure your business future. Supply Chain Strategy - A Newsletter From the MT Center for Transportation & Logistics, 3, 1-4. Richard, G.D. (1995), “A general mathematical framework for modelling two dimensional wild land fire spread”, International Journal of Wild Land Fire, Vol. 5, pp. 63-72. Ritchie, B. and Brindley, C. (2007), “Supply chain risk management and performance: a guiding framework for future development”, International Journal of Operations & Production Management, Vol. 27, pp. 303-322. Robinson, P.J., Faris, C.W. and Wind, Y. (1967), Industrial Buying and Creative Marketing, Allyn and Bacon, Boston, MA. Rowe, W. (1980), “Risk assessment: approaches and methods”, in Conrad, J. (Ed.), Society, Technology and Risk Assessment, Academic Press, London. Royal Society (1992), Risk: Analysis, Perception and Management, Royal Society, London.

293
Ruefli, T. W., Collins, J. M. & Lacugna, J. R. (1999). Risk measures in strategic management research: Auld lang syne? Strategic Management Journal, 20, 167-194. Rumelt, R.P., Schendel, D., and Teece, D.J. (1994), Fundamental issues in strategy: A research agenda, Harvard Business School Press, Boston, Mass. Salaam-Blyther, T. (23 June 2009) The 2009 Influenza Pandemic: U.S. Responses to Global Human Cases. Federation of American Scientist [Online] Available from: http://www.fas.org/sgp/crs/misc/R40588.pdf Congressional Research Service, The 2009 Influenza Pandemic: U.S. Responses to Global Human Cases, 23 June 2009. Available from: http://www.fas.org/sgp/crs/misc/R40588.pdf Sarathy, R. (2006). Security and the global supply chain. Transportation Journal, 45, 28-51. Schoemaker, P. and Gunther, R. (2002), Profiting from uncertainty: strategies for succeeding no matter what the future brings, Free Pace. Shapira, Z. (1995). Risk taking: A managerial perspective, New York, Russell Sage Foundation. Sheffi, Y. (2005), “Building a resilient supply chain,” Harvard Business Review, pp. 3-5. Sheffi, Y. & Rice, J. B. 2005. A supply chain view of the resilient enterprise. Simon, P., Hillson, D. and Newland, K. (1997), Project Risk Analysis and Management Guide (PRAM), Association for Project Management, Norwich. Sitkin, S. B., Pablo, A.L. (1992). Reconceptualizing the determinants of risk behavior. Academy of Management Review 17, 9–38. Slack, N. and Lewis, M. (2001), Operations Strategy, 3rd ed., Prentice-Hall, Harlow Smeltzer, L.R and Siferd, S.P. (1998), “Proactive supply management: the management of risk”, International Journal of Purchasing and Material Management, Vol.34 No.1, pp.38-45. Smith, D. (1990b), “Beyond contingency planning- towards a model of crisis management”, Industrial Crisis Quarterly, Vol. 4 No. 4, pp.263-75. Smith, D. (2005), “Business (not) as usual: crisis management, service recovery and the vulnerability of organisations”, Journal of Services Marketing, Vol. 19 No. 5, pp.309-320. Smith, D. (2005), “For whom the bell tolls: imagining accidents and the development of crisis simulation in organisations”, Simulation and Gaming, (forthcoming). Smith, M.E, Thorpe, R. and Lowe, A. (1991), Management Research: An Introduction, Sage Publication. Snider, H. (1991), “Risk management: a retrospective view”, Risk Management, April, pp.47-54. Sodhi, M. (2003) How to do strategic supply chain planning. Sloan Management Review, 45 (1), 69-75.
Sodhi, M. (2004) A tactical supply chain risk management model inspired by asset-liability management, SSRN. Sodhi, M. (2005a) Tactical planning under demand risk for a global elecctronics company. Production Operation Management, 14(1), 69-79. Sodhi, M. (2005b) LP modeling for asset-liability management: a survey of choices and simplifications. Operation Research, 53(2), 181-196. Sodhi, M. (2006) Risk drivers and risk consequences: a framework for understanding risk management in global manufacturing companies, working paper, Cass Business School.

294
Sodhi M. and Tang, C.S. (2009) Time-based disruption management: a framework for managing supply chain disruption. In: Blackhurst J, Wu T (eds). Managing Supply Chain Risk and Vulnerability: Tools and Methods for Supply Chain Decision Makers. Springer, New York. Sodhi, M., Son, B.G. and Tang, C.S. (2008) What employers demand from applicant for MBA-level supply chain jobs and the coverage of supply chain topics in MBC courses. Interfaces 38(6), 469-484 Souter, G., (2000), “Risk from supply chain also demand attention”, Business Insurance, Vol. 34, Issue 20, pp.26-28. Speckman, R.E. and Davis, E.W. (2004), “Risky business: expanding the discussion on risk and the extended enterprise”, International Journal of Physical Distribution & Logistics management, Vol. 34 No. 5, pp.414-33. Spens, K. (2001), “Managing Critical Resources Through Supply Network Management: A Study of the Finnish Blood Supply Network”, PhD Thesis Publication No 90, Helsinki, Swedish School of Economics and Business Administration. Spira, L.F. and Page, M. (2002), “Risk management: the reinvention of internal control and the changing role of internal audit”, Accounting, Auditing & Accountability Journal, Vol. 16 No. 4, pp. 640-61. Stalk, G. Jr, (1988), “Time-the next source of competitive advantage”, Harvard Business Review, July-August, pp. 41-51. Stalk, G. Jr and Hout, T.M. (1990), Competing against Time: How Time-based Competition Is Reshaping Global Markets, Free Press, New York, NY. Stock, J.R. (1997), “Applying theories from other disciplines to logistics”, International Journal of Physical Distribution & Logistics Management, Vol. 27 No.1, pp.515-539. Strauss, A.L., and Corbin, J.M. (1998), Basics of qualitative research: Techniques and Procedures for developing Grounded Theory, London: Sage Publications Ltd. Strauss, A.L. and Glaser, B.G. (1967), The Discovery of Grounded Theory. Aldine De Gruyter, NY. Stuart, I., McCutcheon, D., Handfield, R., McLachlin, R., Samson, D. (2002): “Effective Case Research in Operations Management: A Process Perspective”, in Journal of Operations Management, Vol. 20 No. 5, pp.419-433. Swaminathan, J.M., Smith, S.F. and Sadeh, N.M., (1996), “A multi agent framework for modelling supply chain dynamics” Technical Report, The Robotics Institute, Carnegie Mellon University. Swaminathan, J. M. (2003). Sars exposes risks of global supply chains. Journal of Commerce, 4, 38. Svensson, G. (2000). A conceptual framework for the analysis of vulnerability in supply chains. International Journal of Physical Distribution and Logistics Management, 30, 731 -750. Svensson, G. Ö. R. (2002). A conceptual framework of vulnerability in firms' inbound and outbound logistics flows. International Journal of Physical Distribution & Logistics Management, 32, 110. Svensson, G. (2003), “Key, areas, causes and contingency planning of corporate vulnerability in supply chains: a qualitative approach”, International Journal of Physical Distribution & Logistics Management, Vol. 34 No. 9, pp.728-748. Tang, C.S. (2005), “Perspectives in Supply Chain Risk Management: A Review”, Decision, Operations, and Technology Management, Paper CT39. Tang, C. S. (2006a). Perspectives in supply chain risk management. International Journal of Production Economics, 103, 451-488.

295
Tang, C. S. (2006b). Robust strategies for mitigating supply chain disruptions. International Journal of Logistics: Research & Applications, 9, 33-45. Tang, C. and Tomlin, B. (2007), “The power of flexibility for mitigating supply chain risks”, working paper, UCLA Anderson School. Taylor, S.S., Fisher, D. and Dufresne, R.L. (2002), “The aesthetics of management storytelling: a key to organisational learning”, Management Learning, Vol. 33 No. 3, pp.313-30. Tchankova, L. (2002), “Risk identification – basic stage in risk management”, Environmental Management and Health, Vol. 13 No. 3, pp. 290-7. The Whitehouse (2010), Remarks by the president in a discussion on jobs and the economy in charlotte, north carolina. The White House. Available: http://www.whitehouse.gov/the-press-office/remarks-president-a-discussion-jobs-and-economy-charlotte-north-carolina. Tracy, T. (2011), Criminal investigations into bp oil spill are consolidated. MarketWatch. Available: http://www.marketwatch.com/story/us-consolidates-bp-spill-probes-2011-03-07 Treleven, M. and Schweikhart, S.B. (1998), “A risk/ benefit analysis of sourcing strategies: single vs multiple sourcing”, Journal of Operation Management, Vol. 7 No. 4, pp.93-114. Treleven, M. D. (1988). A comparison of flow and queue time variances in machine-limited versus dual-resource-constrained systems. IIE Transactions, 1, 63–67 Trudell et al., (13 April 2012) Auto supplier warns of resin shortage disrupting output. Businessweek [Online] Available from: http://www.businessweek.com [Accessed 22 April 2012] Tucker, R.B. (1991), Managing the Future: Ten Driving Forces of Change for the ’90s, Putnam, New York, NY. Turner, B. A. (1994). Causes of disaster: Sloppy management. British Journal of Management, 5, 215. Vesely, W.E., “Robust risk analysis: the need for it in nuclear probabilistic risk evaluation”, in Waller, R.A. and Covello, V.T. (Eds), Low Probability High Consequence Risk Analysis, Plenum Press, New York, NY, 1984. Viswanadham, N. and Narahari, Y. (2001), “Queueing network modelling and lead time compression of pharmaceutical drug development”, International Journal of Production Research, Vol.39 No. 2, pp.395-412. Voss, C., Tsikritsis, N. and Frohlich, M. (2002), “Case research in operation management”, International Journal of Operations Management”, International Journal of Operation & Production Management, Vol. 22 No. 2, pp.195-219. Wagner, S. & Bode, C. (2009). Managing risk and security: The safeguard of long-term success for logistics service providers, Bern, Haupt Verlag. Wagner, S. M. & Bode, C. (2006). An empirical investigation into supply chain vulnerability. Wagner, S. M. & Bode, C. (2008). An empirical examination of supply chain performance along several dimensions of risk. Journal of Business Logistics, 29, 307–325. Wagner, S. M., Bode, C. & Koziol, P. (2009). Supplier default dependencies: Empirical evidence from the automotive industry. European Journal of Operational Research, 199, 150-161. Wagner, S. M. & Johnson, J. L. (2004). Configuring and managing strategic supplier portfolios. Industrial Marketing Management, 33, 717-730. Waring, A. E. & Glendon, A. I. (1998). Managing risk: Critical issues for survival and success into the 21st century, London, ITBP.

296
Waters, D. (2007), Supply Chain Risk Management: vulnerability and Resilience in Logistics, The Chartered Institute of Logistics and Transport (UK). White, D. (1995), “Application of systems thinking to risk management: a review of the literature”, Management Decision, Vol. 33 No. 10, pp.35-45. Williamson, O. E. (1975). Markets and hierarchies: Analysis and antitrust implications. A study in the economics of internal organization The Free Press. Williamson, O.E. (1979), “Transaction cost economics: the governance of contractual relations”, Journal of Law and Economics, Vol. 22 No. 2, pp.233-261. Womack, J. P., Jones, D. T. & Roos, D. (1990). The machine that changed the world,, New York, NY. Rawson Associates. Wright, J. W. & Flak, L. Part 11-relief wells: Advancements in technology and application engineering make the relief well a more practical blowout control option. Available: http://www.jwco.com/technical-litterature/p11.htm. Yates, J.F. and Stone, E. (1992), “The risk construct”, in Yates, J.F. (Ed.), Risk-taking Behaviour, Wiley, Chichester. Yin, R.K. (1994), Case Study Research – Design and Methods, Applied Social Research Methods Series, Vol. 5, Sage Publication, Thousand Oaks, CA. Yin, R.K. (2003), Applications of Case Study Research, Applied Social Science Methods Series, Vol.34, Sage Publication, Thousand Oaks, CA. Zhang, F. (31 October 2011), Thailand flood exerts broad impact on electronics supply chain. iSuppli [Online] Available from: www.isuppli.com [Accessed 2 April 2012]. Zsidisin, G. and Ellram, L.M. (1999), “Supply risk assessment analysis”, Practix, Best Practices in Purchasing and Supply Chain Management, June, pp.9-12. Zsidisin, G. (2001), “Measuring supply risk: an example from Europe”, Practix, Best Practices in Purchasing and Supply Chain Management, June, pp.1-6 Zsidisin, G. A. 2003. A grounded definition of supply risk. Journal of Purchasing & Supply Management 9 217–224 Zsidisin, G.A., Panelli, A. and Upton, R. (2000), “Purchasing organisation involvement in risk assessments, contingency plans, and risk management: an exploratory study”, Supply Chain Management: An international Journal, pp.187-197. Zsidisin, G.A. and Ellram, L.M. (2003), “Agency theory investigation of supply risk management”, Journal of Supply Chain Management, Vol.39 No.3, pp.15-27. Zsidisin, G., Ellram, L., Carter, J., and Cavinato, J. (2004), “An analysis of supply risk assessment techniques,” International Journal of Physical Distribution and Logistics Management, Vol. 34 No. 5, pp. 397-413. Zsidisin, G. A., Gary, L. R. & Steven, A. M. (2005). The dark side of supply chain management. Supply Chain Management Review, 9, 46-52 Zsidisin, G.A., Melnyk, A.S. and Ragatz, G.L. (2006), “An institutional theory perspective of business continuity planning for purchasing and supply management”, International Journal of Production Research, Vol. 43 No. 16, pp. 3401-3420. Zsidisin, G. A., Ritchie, B. (2008). Supply chain risk: A handbook of assessment, management and performance, New York, Springer.

297
Appendices
Appendix 1: Acronyms PHARMA Case
AAR After Action Review APAs Advanced Purchased Agreements API Active Pharmaceutical Ingredient BCP Business Continuity Plan CCMT The Corporate Crisis Management Team CDC Centres for Disease Control and Prevention CET Corporate Executive Team CMT Crisis Management Team COE Centre of Excellence Defra Department for Environment, Food and Rural Affairs DH Department of Health. DOD U.S. Department of Defence ECDC European Centre for Disease Prevention and Control EH+P Employee Health and Performance EHM Employee Health Management EHS Environment, Health and Safety EMEA European Medicines Evaluation FAO Food and Agriculture Organisation FDA The Food and Drug Administration FPP Flu Pandemic Plan GQMP Global Quality management Process in QMS HHS U.S. Department of Health and Human Services HPA The Health Protection Agency IMT Incident Management Team ITCP IT Continuity Plan LDCs Least Developing Countries MSC The Manufacture and Supply Chain OIE The World Organisation for Animal Health PAHO Pan American Health Organisation PMT Pandemic Management Team ROCC Risk Oversight and Compliance Council SAGE Scientific Advisory Group for Emergency SARS Severe Acute Respiratory Sydrome SVP Senior Vice President USAID U.S. Agency for International Development WHO World Health Organisation

298
Appendix 2: Acronyms BP Deepwater Horizon
AFE Approval for Expenditure AMF Automatic mode function APB Annular pressure buildup APD Application for permit to drill API American Petroleum Institute APM Application for permit to modify bbl Barrels BOEMRE Bureau of Ocean Energy Management, Regulation, and Enforcement BOP Blowout preventer bpm Barrels per minute BSR Blind shear ram CMMS Computerized Maintenance Management System DP Dynamically positioned DPO Dynamic positioning officers ECD Equivalent circulating density EDS Emergency disconnect system ERA Efficient Reservoir Access ESD Equivalent static density ETP Engineering Technical Practice FIT Formation integrity test gal/sack Gallons per sack gpm Gallons per minute HSSE Health, safety, security, and the environment LDS Lockdown sleeve LMRP Lower marine riser package LOT Leak off test MC 252 Mississippi Canyon Block 252 MD Measured depth MMS Minerals Management Service MOC Management of change MODU Mobile offshore drilling unit MUX Multiplex OIM Offshore installation manager OMS Operating management system PINC Potential incidents and non-compliance ppg Pounds per gallon PRV Pressure relief valve psi Pounds per square inch RCRA Resource Conservation and Recovery Act RMS Rig Management System ROV Remotely operated vehicle SG Specific gravity TD Total depth TIGER Totally Integrated Geological and Engineering Resource TOC Top of cement TVD Total vertical depth UWILD Underwater Inspection in Lieu of Dry-docking

299
Appendix 3: Timeline of BP Deepwater Horizon Oil Spill
Date Time Events Source 18 March 2008 BP pays USD 34 million for an exclusive lease to drill in Mississippi
Canyon Block 252. Oil Spill Commission
6 October 2009
Spudded Macondo well with Transocean’s Marianas OpenWells® Transocean's Marianas arrives on location and begins the drilling of
the Macondo well. Oil Spill Commission
8 November 2009 The Marianas drills for 34 days, reaching a depth of 9,090 feet. It then stops drilling and moves off-site to avoid Hurricane Ida. Hurricane Ida nevertheless damages the rig badly enough that it can no longer drill the well.
Oil Spill Commission
8-27 November 2009
Pull riser and evacuated Marianas for Hurricane Ida. Marianas subsequently damaged and moved to safe harbour for repairs.
OpenWells®
Transocean’s Deepwater Horizon on location to replace Marianas 31 January - 6 February 2010
Six days of pre-job maintenance and testing of blowout preventer (BOP) followed
OpenWells®
Drilling activities recommenced on 6 February. 31 January 2010 Transocean's Deepwater Horizon arrives on location.
Its first task is to lower its giant blowout preventer (BOP) onto the wellhead that the Marianas had left behind. The BOP is a stack of enormous valves that rig crews use both as a drilling tool and as an emergency safety device. Once it is put in place, everything needed in the well—drilling pipe, bits, casing, and mud—passes through the BOP.
Oil Spill Commission
10 February 2010 The Deepwater Horizon resumes the drilling of the Macondo well. Drilling Terminology: Drilling through the seafloor does not differ fundamentally from drilling on land. The crews on any drilling rig use rotary drill bits that they lubricate and cool with drilling mud—an ordinary name for what is today a sophisticated blend of synthetic fluids, polymers, and weighting agents that often costs over USD 100 per barrel. The rig crews pump the mud down through a drill pipe that connects with and turns the bit. The mud flows out holes in the bit and then circulates back to the rig through the space between the drill pipe and the sides of the well (the annulus), carrying to the surface bits of rock called cuttings that the drill bit has removed from the bottom of the well. When the mud returns to the rig at the surface, the cuttings are sieved out and the mud is sent back down the drill string. The mud thus travels in a closed loop
Oil Spill Commission
23 February - 13 March 2010
Pilot valve leak of 1 gpm noticed on yellow pod of BOP, leak reduced after switching to blue pod
OpenWells®
8 March 2010
Well control event at 13,305 ft. Pipe stuck; severed pipe at 12,146ft. OpenWells® Halliburton personnel send BP the results of a foam stability test it
ran in February on the cement blend it plans to use at Macondo. To the trained eye, the data showed that the cement slurry design was unstable. Halliburton personnel did not comment on the evidence of the cement slurry's instability, and there is no evidence that BP examined the foam stability data in the report at all.
Oil Spill Commission
12-22 March 2010 Contingency liner utilized, a new drilling liner was added and production casing changed to 9 7/8 in x 7 in. long string
Macondo well plan
Minerals Management Service (MMS) approved changes MMS applications
5-6 April 2010 Stripped drill pipe through upper annular preventer from 17,146 ft. to 14, 937 ft. while addressing wellbore losses
OpenWells®
9-14 April 2010 Total depth of 18,360ft. reached and data collected for five days. Reservoir sands contained hydrocarbons at pressures of approximately 11,850 psi.
OpenWells®
9 April 2010 After numerous instances indicating fractures in the formation over the past few weeks, BP elects to call total depth at 18,360 feet, short of the 20,200 feet initially planned. BP informs its lease partners Anadarko and MOEX that "well integrity and safety" issues require the rig to stop drilling further. Drilling Terminology: The weight of the column of mud in a well exerts pressure that counterbalances the pressure in the hydrocarbon formation. If the mud weight is too low, fluids such as oil and gas can enter the well, causing what is known as a "kick." But if the mud weight is too high, it can fracture the surrounding rock, potentially leading to “lost returns”—leakage of the mud into the formation. The rig crew therefore monitors and adjusts the weight (density) of the drilling mud as the well is being drilled—one of many sensitive, technical tasks requiring special equipment and the interpretation of data from difficult drilling environments.
Oil Spill Commission

300
Date Time Events Source 11-15 April 2010 BP and its contractors spend five days logging the open hole with
sophisticated instruments. Based on the logging data, BP concludes that it has drilled into a hydrocarbon reservoir of sufficient size (at least 50 million barrels) and pressure that it is economically worthwile to install a final production casing string that BP will eventually use to recover the oil and gas
Oil Spill Commission
13 April 2010 Halliburton personnel run a second set of tests on the now-slightly-altered cement blend they plan to use at Macondo. The foam stability test showed that the cement slurry would be unstable.
Oil Spill Commission
14-15 April 2010 After going back and forth, BP engineers choose a "long string" production casing—for a single continuous wall of steel between the wellhead, on the seafloor, and the oil and gas zone at the bottom of the well. The other option considered, a "liner," would result in a more complex—and theoretically more leak-prone—system over the life of the well. But it would be easier to cement into place at Macondo.
Oil Spill Commission
14 April2010 Halliburton Opticem cement model review concluded zonal isolation objectives could be met using 9 7/8 in x 7 in. long string as production casing
Halliburton 9 7/8 in. x 7 in. Production Casing Design Report
15 April2010 OptiCem model updated with open hole calliper and survey data. Input included 21 centralizers and 70% standoff above the top centralizer
Company emails
Decision made to order 15 additional centralizer order placed Company emails
A Halliburton engineer informs BP engineers that computer simulations suggest that the Macondo production casing would need more than six centralizers (used to keep the casing string centered) to avoid channeling in the cement job. BP engineers order 15 additional centralizers—the most BP could transport immediately in a helicopter.
Oil Spill Commission
16 April 2010
11:51 AM Fifteen slip-on bow spring centralizers delivered to rig by helicopter OpenWells® 12:48-12:53 PM
Mechanical integrity concerns regarding the bow spring centralizers. Decision made not to run bow spring centralizers.
Company emails Interview
A helicopter delivers 15 additional centralizers to the rig. BP engineers decide the centralizers are the wrong kind and do not run them.
Oil Spill Commission
18 April 2010
20:58 PM Partial lab test results, a new OptiCem model report (using seven inline centralizers) and Halliburton’s cementing recommended procedure for the Macondo well cement job were provided to BP and Halliburton staff
Email from Halliburton in-house cementing engineer to BP and Halliburton staff
Halliburton personnel run yet another set of tests on the cement slurry they plan to use at Macondo. The test would normally take 48 hours to complete. It is unclear whether Halliburton had results from the test in hand before it pumped the job. Halliburton did not send the results of the final test to BP until six days after the blowout.
Oil Spill Commission
18-19 April 2010 The Deepwater Horizon crew installs the long string production casing. The leading end of the casing, the "shoe track," began with a "reamer shoe"—a bullet-shaped piece of metal with three holes designed to help guide the casing down the hole. The reamer shoe was followed by 180 feet of seven-inch-diameter steel casing. Then came a Weatherford-manufactured "float collar," a simple arrangement of two flapper (float) valves, spaced one after the other, held open by a short "auto-fill tube" through which the mud in the well could flow. As the long string was lowered down the wellbore, the mud passed through the holes in the reamer shoe and auto-fill tube that propped open the float valves, giving it a clear flow path upward
Oil Spill Commission
Final Casing Run
Date Time Events Source
19 April 2010 13:30 PM Completed final (production) casing run to 18,304ft. (Job took 37 hours). The shoe track included a Weatherford float collar installed at the top and a reamer shoe at the bottom.
OpenWells®
14:30-16:20 PM
Nine attempts made to establish circulation. Circulation established with 3,412 psi
OpenWells® Real-time data
16:20-19:30 PM
Circulation pressure of 340 psi did not match modeling results of 570psi.
OpenWells®

301
Date Time Events Source
19 April 2010 An explosion aboard the Deepwater Horizon drilling rig in the Gulf of Mexico, 52 miles (84km) south-east of Venice, Louisiana, kills 11 workers. Operator Transocean, under contract for BP, says it had no warning of trouble ahead of the blast.
BBC
Cement Job
Date Time Events Source
19 April 2010 In preparation for cementing, the crew attempts to convert the float valves by pushing the tube downward. After nine attempts, the crew establishes circulation. Circulation pressure is lower than predicted, but the crew decides the pressure gauge is broken.
Oil Spill Commission
The first compromise in BP's plan was to limit the circulation of drilling mud through the wellbore before cementing. Optimally, mud in the wellbore would have been circulated “bottoms up”—meaning the rig crew would have pumped enough mud down the wellbore to bring mud originally at the bottom of the well all the way back up to the rig. There are at least two benefits to bottoms up circulation. Such extensive circulation cleans the wellbore and reduces the likelihood of channeling. And circulating bottoms up allows technicians on the rig to examine mud from the bottom of the well for hydrocarbon content before cementing. But the BP engineers feared that the longer the rig crew circulated mud through the casing before cementing, the greater the risk of another lost-returns event. Accordingly, BP circulated approximately 350 barrels of mud before cementing, rather than the 2,760 barrels needed to do a full bottoms up circulation.
Oil Spill Commission
20 April 2010
The crew pumps cement into the well for the shoe track cement job. BP decides to pump the cement down at the relatively low rate of 4 barrels or less per minute. BP also decides to limit the volume of cement pumped to approximately 60 barrels—a volume that its own engineers recognized would provide little margin for error.
Oil Spill Commission
19:30-00:36 PM
Cement job pumped as planned with full fluid returns observed. Bottom plug burst disk ruptured at higher-tan-planned pressure, 2,900 psi
OpenWells® Real-time data
Cement job completed bumped top wiper plug at 00:3 hours. Real-time data
20 April 2010
00:30 – 03:00 AM
BP and Halliburton personnel perform a check to see whether the float valves are closed and holding the cement in. While it is not clear how long the personnel watched for flow, they eventually concluded the float valves were holding.
Oil Spill Commission
0:40 AM Bled off 5 bbls of fluid to reduce drill pipe pressure from 1,150 psi to 0 psi. No flow observed after bleeding 5bbls.
Real-time data OpenWells®
00:40-07:00 AM
Dril-Quip seal assembly installed in subsea wellhead. Two pressure tests successfully completed. Drill pipe pulled out of riser.
Real-time data OpenWells® Interview
05:45 – 7:30 AM
BP and Halliburton personnel declare the cement job a success. BP decides to send home a team of Schlumberger technicians who had been standing by on the rig to perform a suite of cement evaluation tests.
Oil Spill Commission
~ 07:30 BP and service providers discussed running cement bond log (CBL) during morning operations call.
Interviews
Decision made, in accordance with pre-established BP Macondo well team decision tree, not to run CBL.
Positive-pressure and Negative-pressure Tests
Date Time Events Source 20 April 2010 10:43 AM BP moves on to prepare the well for temporary abandonment. A BP
engineer sends out an "Ops Note" to the rest of the Macondo team listing the temporary abandonment procedure for the well. The temporary abandonment procedure had undergone numerous
Oil Spill Commission

302
Date Time Events Source modifications over a short period, none of which appear to have been subject to any formal risk assessment. The morning of April 20 was the first time rig personnel had seen the procedure they would use that day. The basic sequence for the procedure is as follows: 1. Perform a positive-pressure test to test the integrity of the production casing; 2. Run the drill pipe into the well to 8,367 feet (3,300 feet below the mud line); 3. Displace 3,300 feet of mud in the well with seawater, lifting the mud above the BOP and into the riser; 4. Perform a negative-pressure test to assess the integrity of the well and bottom-hole cement job to ensure outside fluids (such as hydrocarbons) are not leaking into the well; 5. Displace the mud in the riser with seawater; 6. Set the surface cement plug at 8,367 feet; and 7. Set the lockdown sleeve.
10:55 AM-12:00 PM
Successful positive-pressure test of the production casing Real-time data Interviews
Drill pipe run in hole to 8,367 ft. Displacement procedure reviewed in preparation for mud displacement and negative-pressure test.
The crew conducts a positive-pressure test to evaluate, among other things, the ability of the casing in the well to hold in pressure. The pressure inside the well remained steady, showing there were no leaks in the production casing through which fluids could pass from inside the well to the outside.
Oil Spill Commission
12:00-15:04 PM
At 13L28 hours. Deepwater Horizon started offloading mud to M/V Damon Bankston.
Real-time data M/V Damon Bankston log
12:00-15:04 PM
Mudlogger told assistant driller that pit levels could not be monitored during offloading. Assistant driller told mudlogger that notice would be provided when offloading to M/V Damon Bankston ceased.
Interview
15:00-16:57 PM
The crew prepares to conduct a negative-pressure test, and displaces mud from a depth of 8,367 feet to above the blowout preventer. The negative-pressure test checks not only the integrity of the casing but also the integrity of the bottomhole cement job. At the Macondo well, the negative-pressure test was the only test performed that would have checked the integrity of the bottomhole cement job.
Oil Spill Commission
15:04-15:56 PM
Seawater pumped into boost, choke and lines to displace mud. 1,2000 psi left trapped in the kill line (i.e., not blend off).
Real-time data
15:56-16:53 PM
A total of 424 bbls of 16 ppg of freshwater pumped into well. Displacement completed with 352 bbls of seawater, placing the spacer 12 ft. above the BOP.
Real-time data M-I SWACO
20 April 2010 (From ~ 16:00 hours - 17:50 hours, trip tank was being cleaned. Recorded flow data unreliable during this period).
Displacement procedure
16:54 PM Upon shutting down pumps, drill pipe pressure was at 2,325 psi. Pressure in kill line remained at 1,200 psi.
Real-time data
An annular preventer was closed for the negative pressure test. Interview 16:54-16:56 PM
Drill pipe pressure bled from 2,325 psi down to 1,220 psi in order to equalize with the 1,200 psi on the kill line.
Real-time data
16:57-18:40 PM
The crew conducts a negative-pressure test on the drill pipe. For a successful negative-pressure test, the drill-pipe pressure must remain at zero psi after the pressure is bled off and the pipe is closed. The crew attempts to bleed drill-pipe pressure down to zero three times, but each time drill-pipe pressure builds back up. At the end of the test, drill-pipe pressure is 1,400 psi. BP and Transocean personnel discuss the pressure, apparently explaining it as a result of "the bladder effect." BP's Well Site Leader Don Vidrine insists on running a second negative-pressure test, this time on the kill line.
Oil Spill Commission
16:57-16:59 PM
Kill line opened and pressure decreased to 645 psi, drill pipe pressure increased to 1,350 psi.
Real-time data Interview
Attempt made to bleed system down to 0 psi. Drill pipe pressure decreased to 273 psi. Kill line pressure decreased to 0 psi. Kill line shut in.
16:59-17:08 PM
At 16:59 hours, drill pipe pressure increased from 273 psi to 1,250 psi in 6 minutes.
Real-time data MBI testimony
Annular preventer closing pressure was increased from 1,500 psi to 1,900 psi to create a seal.
The riser was topped up with approximately 50 bbls of mud from the trip tank to replace the volume blend off through the drill pipe. (Spacer fluid was then across the BOP.)
17:08-17:27 PM
Drill pipe pressure decreased from 1,250 psi to 1,205 psi. Real-time data

303
Date Time Events Source 17:17 PM Mud offloading from Deepwater Horizon mud pits to M/V Damon
Bankston ceased. Mudlogger not notified. M/V Damon Bankston log Interviews
17:27-17:52 PM
Drill pipe pressure reduced from 1,205 psi to 0 psi by bleeding off 15 bbls to 23 bbls of fluid to the cement unit.
Real-time data Interviews
Rig crew and well site leader discussed negative pressure test procedure. Well site leader stated the negative-pressure test needed to be done on the kill line in accordance with the BP plan submitted to MMS.
17:52-18:00
Kill line opened to the cement unit Real-time data Interview
Cementer bled off 3 bbls to 15 bbls of seawater. A witness reported continuous flow from the kill line that spurted and was still flowing when instructed to shut in the line.
18:00-18:35 PM
Drill pipe pressure gradually increased to 1,4000 psi over 25 minutes. Build profile showed distinct pressure fluctuations at fairly uniform intervals.
Real-time data
Discussion ensurd about pressure anomalies and negative pressure test procedure.
18:35-19:55
Seawater pumped into the kill line to confirm it was full. Real-time data Interviews
Opened kill line and bled 0.2 bbl to mini trip tank; flow stopped. Kill line opened and monitored for 30 minutes with no flow.
At 19:55 hours, the negative-pressure test was concluded and considered a good test.
Well Monitoring and Simultaneous Operations
Date Time Events Source 20 April 2010 20:00 PM Internal blowout preventer (BOP) and annular preventer opened and
pumping of seawater commenced down the drill pipe to displace mud and spacer from the riser.
Real-time data
20:02 PM The crew opens the annular preventer and begins displacing mud and spacer from the riser.
Oil Spill Commission
20:50 PM Pumps slowed for the spacer arriving at surface Real-time data ~ 20:52 PM
Calculated that the well went underbalanced and started to flow] OLGA model
20:58-21:08 PM
Flow out from the well increased Real-time data Calculatons
Tip tank was emptied into the flow-line at this time. [Taking into account the emptying of the trip tank calculated a gain
of approximately 39 bbls over this period.]
21:01 PM After steadily decreasing for much of the displacement, drill-pipe pressure changes direction and begins increasing. This is an anomaly that apparently went unnoticed.
Oil Spill Commission
21:01-21:08 PM
Drill pipe pressure increased from 1,250 psi to 1,350 psi at constant pump rate
Real-time data
21:09 PM Spacer observed at surface Pumps shut down to enable sheen test to be conducted
Real-time data Interviews
21:08-21:14 PM
Pumps off, drill pipe pressure increased from 1,017 psi to 1,263 psi in 5 ½ minutes.
Real-time data Interviews Deepwater Horizon P&IDs OLGA model
20 April 2010 Overboard dump line opened during sheen test; Sperry-Sun flow meter by passed. Successful result from visual sheen test indicated that fluids could be discharged overboard. [OLGA well flow modelling calculated that in-flow to the well during this period was approximately 9bbls/min.]
The crew shuts down the pumps to perform a sheen test. With the pumps off, the drill-pipe pressure should have stayed constant or gone down. Instead, it went up by approximately 250 psi. Had someone noticed it, he would have recognized this as a significant anomaly that warranted further investigation before turning the pumps back on.
Oil Spill Commission
21:14 PM The crew turns the pumps back on and continues the displacement. Oil Spill Commission
21:14-21:31 PM
Pumps restarted to continue displacement Real-time data Interviews
Displaced well fluids discharged overboard. Drill pipe pressure on continually increasing trend 21:17 PM Pump no. 2 started ad pressure spiked to 6,000 psi. [Inferred that the
pump likely started against a closed valve and the pressure lifted the Real-time data MBI

304
Date Time Events Source relief valve.] testimony
21:18 PM Pumps no.2, no.3, no.4 were shut down. Pump no.1 stayed online (boost line)
Real-time data
The pressure-relief valve on Pump No. 2 blows, and the driller organizes a group of crewmembers to go to the pump room to fix the valve.
Oil Spill Commission
~21:18-21:20 PM
Toolpusher was called to rig floor Interviews
~21:20 PM Assistant driller was called to either the pit room or the pumproom Interviews MBI testimony
~21:20 PM Senior Toolpusher called toolpusher and ask how the negative-pressure test had gone. Toolpusher responded that the test result was good, and the displacement was “going fine.”
MBI testimony
The senior toolpusher calls the rig floor and asks about the displacement. The toolpusher responds, "It's going fine. . . . I've got this."
Oil Spill Commission
21:20-21:27 PM
Pump no.3, and no.4 restarted. Some pressure started to build on pump no.2, reaching 800 psi at 21:27 hours
Real-time data
21:26-21:30 PM
Drill pipe pressure declined by 400 psi at constant pump rate. Real-time data
21:30 PM [Calculated that the space was fully displaced from the riser] Real-time data OLGA model
The driller notices an odd and unexpected pressure difference between the drill pipe and the kill line. The crew shuts off the pumps to investigate.
Oil Spill Commission
Well Control Response
Date Time Events Source 20 April 2010 21:30 PM Pumps shut down: first pump no.3 and no.4, then no.1 (boost pump) Real-time
data 21:31-21:34 PM
Drill pipe pressure increased from 1,210 psi to 1,766 psi. ~21:33 hours, chief mate observed Toolpusher and driller discussing differential pressure”. Toolpusher told chief mate that cement job may be delayed
Real-time data MBI testimony
21:36-21:37 PM
The driller orders a floorhand to bleed off the drill-pipe pressure, in an apparent attempt to eliminate the difference. The drill-pipe pressure initially dropped off as expected, but immediately began climbing again. Despite the mounting evidence of a kick, neither the driller nor the toolpusher performed a visual flow check or shut in the well.
Oil Spill Commission
21:36-21:38 PM
Over a 90 second period, drill pipe pressure decreased from 1,782 psi to 714 psi and then increased from 714 psi to 1,353 psi
Real-time data
[Inferred to have been caused by opening and closing a 4 in. valve on the standpide manifold.]
OLGA model
21:38 PM [Calculated that at approximately 21:38, hydrocarbons passed from well into riser.]
OLGA model
21:38-21:42 PM
Drill pipe pressure held briefly, then decreased steadily from 1,400 psi to 338 psi.
Real-time data
21.40 -21.43 PM
Drilling mud begins spewing from the rotary onto the rig floor. The crew closes one of the annular preventers to shut in the well and routes the flow to the mud-gas separator (rather than overboard into the sea). The flow continues and quickly overwhelms the mud-gas separator system.
Oil Spill Commission
~21:40-21:48 PM
Chief electrician observed four personnel (including the assistant driller) completing repair of the pressure relief valve on pump no.2 at the time he left the area (~21:48 hours)
MBI testimony
~21:40 hours – Mud overflowed the flow line and onto rig floor ~21:41 hours – Mud shot up through derrick. ~21:41 hours – Diverter closed and flow routed to mud gas
separator (MGS); NOP activated (believed to be lower annular preventer).
~21:41 hours – M/V Damon Bankston was advised by Deepwater Horizon bridge to stand off 500 m because of a problem with the well. The ship began to move away.
~21:42 hours – Drill pipe pressure increased steadily from 338 psi to 1,200 psi over 5 minute period
~21:44 hours – Mud and water exited MGS vents; mud rained down on rig and M/V Damon Bankston as it pulled away from rig.
20 April 2010 21:40-21:48 PM
~21:44 hours – Toolpusher called well site leader and stated they were “getting mud back” and that they had “diverted to the mud gas separator” and had either closed or were closing the annular
Real-time data Interviews

305
Date Time Events Source preventer. MBI
testimony
~21:45 hours – Assistant driller called the senior Toolpusher to report that “The well is blowing out…[the Toolpusher] is shutting it in now.
~21:46 hours - Gas hissing noise heard and high-pressure gas discharged from MGS vents towards deck.
~21:47 hours – First gas alarm sounded. Gas rapidly dispersed, setting off other gas alarms.
~21:47 hours – Roaring noise heard and vibration felt. ~21:47 hours – Drill pipe pressure started rapidly increasing from
1,200 psi to 5,730 psi.
[This is thought to have been the BOP sealing around pipe. Possible activation of variable bore rams [VBRs] at 21:46 hours.]
~21:48 hours – Main power generation engines started going into overspeed (no.3 and no.6 were online)
Rig power lost. Sperry-Sun real-time data transmission lost. 21.45 PM The assistant driller calls the senior toolpusher and tells him the well
is "blowing out." Oil Spill Commission
21.46 PM The crew activates a variable bore ram to shut in the well. Oil Spill Commission
21:49 PM First explosion occurred an estimated 5 seconds after power loss. Real-time data Interviews MBI testimony
Second explosion occurred an estimated 10 seconds after first explosion
The first explosion occurs. On the drilling floor, the Macondo disaster claims its first victims. A short time later, a second explosion occurs.
Oil Spill Commission
21:52 PM Mayday call made by Deepwater Horizon M/V Damon Bankston log
~21:52-21:57 PM
Subsea supervisor attempted to activate emergency disconnect sequence (EDS) for the BOP at the panel on the bridge. Lights changed on panel, but no flow was observed on the flow meter.
MBI testimony Interviews
Lower marine riser package did not unlatch. Deepwater Horizon master announced the activation of the EDS at
21:56
~22:00-23:22 PM
Transfer of 115 personnel including 17 injured, to M/V Damon Bankston
MBI testimony
11 people were determined to be missing, and search and rescue activities ensued.
US. Coast Guard arrived on-site at 23:22 hours. Sometime after the first explosion, Transocean personnel on the
bridge attempt to activate the Emergency Disconnect System. Although the panel indicators lit up, the rig never disconnected.
Oil Spill Commission
22 April 2010 10:22 PM Deepwater Horizon Sank Unified Command
23 April 2010 17:00 PM The search for the 11 missing people was suspended 22 April 2011 The Deepwater Horizon sinks to the bottom of the Gulf after
burning for 36 hours, raising concerns of a catastrophic oil spill. A Coast Guard official says the Macondo well, which the rig had been drilling, could be releasing up to 8,000 barrels of oil per day.
BBC
BOP Emergency Operation
Date Time Events Source
21-22 April 2010 18:00-01:15 PM
Remotely operated vehicle (ROV) operations were initiated. IMT reports
22 April 2010 ~02:45 AM
ROV attempted hot stab interventions to close VBRs and blind shear rams (BSRs); ROV attempts were ineffective.
IMT reports
~07:40 AM
On the third attempt, ROV activated autoshear function. (BSR thought to have closed) Well continued to flow.
IMT reports
25 April – 5 May 2010
Seventeen further attempts by ROVs using subsea accumulators to close various BOP rams and annular preventers. Well continued to flow
IMT reports
23 April 2010 The Coast Guard says it had no indication that oil was leaking from the well 5,000ft below the surface of the Gulf.
BBC
26 April2010 In a reverse, officials reveal the well is leaking an estimated 1,000 barrels of oil per day and warn of environmental disaster. Meanwhile, BP sends undersea robots to the wellhead in an
BBC

306
Date Time Events Source
unsuccessful effort to activate the blowout preventer, a piece of heavy kit mounted on top of the well to stem the flow of oil.
28 April2010 The US Coast Guard warns the oil leak could become the worst oil spill in US history.
BBC
29 April2010 The US Coast Guard sets fire to patches of spilled oil in an effort to prevent the slick from reaching the vulnerable Louisiana coastal wetlands. President Barack Obama pledges "every single available resource", including the military, to help in the response effort.
BBC
30 April 2010 Oil from the leaking well begins washing ashore in Louisiana. Soon fragile coastal wetlands are inundated with thick, brown mud. President Barack Obama's administration bans oil drilling in new areas off the US coast pending investigations into the cause of the BP spill. Before the spill, Mr Obama had said he would allow new offshore drilling.
BBC
2 May 2010 President Obama makes his first trip to the Gulf Coast and says BP is responsible for the leak and for paying for its clean-up. "We're dealing with a massive and potentially unprecedented environmental disaster," he says. "The oil that is still leaking from the well could seriously damage the economy and the environment of our Gulf states. And it could extend for a long time. It could jeopardise the livelihoods of thousands of Americans who call this place home." President Obama said he would 'spare no effort' in responding to the crisis
BBC
8 May 2010 BP's effort to place a giant metal box atop the leaking well to contain the spill fails when ice crystals accumulate inside the box and engineers are forced to remove it. Meanwhile, officials revise the estimate of the leak's rate upward to 5,000 barrels per day.
BBC
10 May 2010 BP officials weigh shoving debris, including golf balls and rubber tyres, into the leaking wellhead, a manoeuvre known as the "junk shot". They also ready a "top hat" - a metal dome - to be placed over the leak. Meanwhile, BP reveals the oil spill has cost the company USD 350m (GBP 233m) so far.
BBC
11 May 2010 At a series of congressional hearings, BP, Transocean and Halliburton, the three companies involved in the Deepwater Horizon drilling operations, all blame each other for the disaster.
BBC
14 May 2010 Pelicans are among the wildlife harmed by the oil Researchers who have analysed underwater video from the leak site estimate as many as 70,000 barrels of oil are leaking into the Gulf per day, with a margin of error of plus or minus 20%, significantly higher than earlier estimates. BP tries to thread a tube into the broken wellhead in an effort to collect some of the leaking oil in surface ships. Meanwhile, President Obama condemns the "ridiculous spectacle" of the companies trading blame while oil spews from the well.
BBC
19 May 2010 Oceanographers say oil from the leak has entered an ocean current - the "loop current" - that could carry it towards Florida and potentially up the US east coast.
BBC
26 May 2010 BP prepares to plug the leaking well with heavy drilling mud, a procedure called a "top kill". The attempt is declared a failure three days later.
BBC
28 May 2010 Obama visits the Gulf Coast again and declares "the buck stops with me".
BBC
30 May 2010 Carol Browner, President Barack Obama's adviser on energy policy, says the spill is the worst environmental disaster in US history, worse even than the 1989 Exxon Valdez spill in Alaska.
BBC
2 June 2010 The US announces a criminal inquiry into the BP oil spill. BBC
4 June 2010 BP places a cap, called the "lower marine riser package", atop the leaking wellhead. The cap allows the company to pipe much of the oil and gas leaking from the well to ships on the surface. President Obama takes a third trip to the region.
BBC
8 June 2010 Skimmers, including the giant "A Whale", are cleaning oil from the surface Adm Thad Allen, the commander of the US response, says clean-up of the oil-stricken Gulf could take years. Meanwhile, President Obama says he has been consulting with experts so he can learn "whose ass to kick" in the matter. The US government says underwater oil plumes have travelled as far as 40 miles from the site of the leaking well.
BBC
10 June 2010 The US Geological Survey estimates the oil flow at as many as 40,000 barrels per day before a cap was put on the well on 3 June. BP announces it is collecting 15,800 barrels per day from the well.
BBC

307
Date Time Events Source
12 June 2010 Responding to complaints in the British media of an anti-British tone to his remarks, President Barack Obama tells UK Prime Minister David Cameron that his criticism of BP has nothing to do with national identity.
BBC
14 June 2010 President Obama makes a fourth trip to the gulf BBC
15 June 2010 President Obama addresses the nation from the Oval Office, vowing, "We will make BP pay for the damage their company has caused."
BBC
17 June 2010 BP announces it will place USD 20bn in a fund to compensate victims of the oil spill and says it will not pay a shareholder dividend this year.
BBC
18 June 2010 BP chief executive Tony Hayward receives a tongue-lashing at a hearing in the US Congress. Henry Waxman, chairman of the House Committee on Energy and Commerce, says BP's "complacency" before the 20 April rig explosion was "astonishing".
BBC
22 June 2010 Many fishermen put out of work by the oil spill have taken jobs in the clean-up effort A federal judge blocks the Obama administration's six-month moratorium on Deepwater oil drilling in the Gulf of Mexico, saying the ban cannot be justified. The administration quickly issues another moratorium with revised terms. Meanwhile, BP hands day-to-day control of the response to Bob Dudley, replacing Chief Executive Tony Hayward, who had been widely criticised for his insensitive remarks on the spill.
BBC
5 July 2010 BP says the oil spill response has cost the company USD 3.12bn (GBP 2bn), including the cost of containing the spill and cleaning up the oil, and the cost of drilling relief wells. The figure also includes USD 147m paid out in compensation to some of those affected by the spill.
BBC
6 July 2010 Oil from the spill reaches Texas, meaning it has affected all five US Gulf Coast states. But officials said it was unclear if the oil had drifted hundreds of kilometres from the leak site to the Texas shore, or had fallen from ships taking part in the clean-up operation.
BBC
10 July 2010 BP begins a bid to place a tighter-fitting cap atop the leaking wellhead. The company warns that oil will flow freely while the caps are being exchanged, but says it has brought in 400 oil-skimming ships to deal with the increased flow. The BBC's Madeleine Morris says it may take days to complete the operation
BBC
14 July 2010 Adm Thad Allen says a relief well, which officials and BP have said is the only way permanently to plug the well, has come within 5ft (1.5m) of the leaking well bore.
BBC
15 July 2010 With the new cap in place, BP says it has temporarily shut off the oil flow in order to test the integrity of the well. President Barack Obama hails "a positive sign".
BBC
19 July 2010 Adm Allen tells BP he is concerned about a "detected seep" on the sea floor near the well and other "undetermined anomalies". He said that if methane was found to be seeping from the sea floor, oil might also be leaking.
BBC
22 July 2010 The rig drilling a relief well was ordered to leave the spill site ahead of Tropical Storm Bonnie Dozens of vessels, including the rig drilling a relief well to permanently block the damaged well, are ordered to leave the site as Tropical Storm Bonnie approaches. BP warns that the final operation to plug the well could be delayed by up to two weeks by the storm. The capped well is to remain unmonitored for several days. Meanwhile, BP says it has been given permission to prepare for a "static kill" - pumping mud into the top of the well through the new cap - a step viewed as an intermediate measure. The firm would need final approval from the US to carry it out.
BBC
25 July 2010 Ships involved in BP's effort to secure the blown-out oil well prepare to resume work after a tropical storm in the Gulf of Mexico weakened. Coast Guard chief Adm Thad Allen says the storm put back efforts to drill a relief well by seven to 10 days.
BBC
The BBC learns that BP's chief executive Tony Hayward, who has faced widespread criticism over his handling of the spill, is negotiating the terms of his exit from his post.
BBC
26 July 2010 The BBC reveals that 53-year old BP chief executive Tony Hayward will receive a year's salary plus benefits, together worth more than GBP 1m, when he steps down. He will also be entitled to draw an annual pension of GBP 600,000 once he reaches the age of 55.
BBC
27 July 2010 Mr Hayward will leave his post by October BBC

308
Date Time Events Source
BP confirms that chief executive Tony Hayward will leave his post by mutual agreement in October, but he is likely to retain a position in the company. BP plans to nominate him as a non-executive director of its Russian joint venture, TNK-BP. Mr Hayward's American colleague, Bob Dudley, who has taken charge of the clean-up operation, will replace him. Meanwhile, the oil giant's second quarter earnings are published, showing losses of USD 17bn for the three months between April and June - a UK record. The company says it has set aside USD 32.2bn (GBP 20.8bn) to cover the costs linked to the Gulf of Mexico spill.
28 July 2010 US scientists say the oil from the well has cleared from the sea surface faster than expected, 100 days after the disaster began.
BBC
2 August 2010 The US Environmental Protection Agency says in a study the dispersant used after the spill is no more toxic than oil alone. There had been concerns raised by congressional investigators that dispersant may have been more widely used than the government ordered.
BBC
3 August 2010 The US government says the oil spill is officially the biggest leak ever, with 4.9 million barrels of oil leaked before the well was capped last month. Scientists said only a fifth of the leaking oil - around 800,000 barrels - was captured during the clean-up operation.
BBC
4 August 2010 The US government says three-quarters of the oil spilled in the Gulf has been cleaned up or broken down by natural forces. Meanwhile, BP reports "encouraging" progress with the "static kill" operation to plug the well with mud and seal it with cement.
BBC
9 August 2010 BP announces that the total cost to it of the oil spill so far has reached USD 6.1bn (GBP 3.8bn). The total includes the cost of the spill response, containment, relief well drilling, and cementing up of the damaged well. It also includes grants to the Gulf states hit by the spill and USD 319m paid out in compensation to some of those affected by the spill.
BBC
16 August 2010 The US announces that future applications for Deepwater offshore drilling will require an environmental assessment, ending a practice that allowed BP's Deepwater Horizon rig to drill with little scrutiny. The White House said decision-making must be "fully informed" by knowledge of any potential environmental consequences.
BBC
19 August 2010 A study published in a leading scientific journal confirms the presence of a toxic chemical residue one kilometre below the surface of the Gulf of Mexico, but says it amounts to just 0.1% of the total amount spilled.
BBC
3 September 2010 The blowout preventer that failed to stop the explosion on the Deepwater Horizon rig is removed from the stricken Gulf of Mexico oil well by BP. The 300-ton device will be examined as part of the inquiry into the leak of 206m gallons of oil into the Gulf. Meanwhile, the cost of the oil spill has risen to USD 8bn (GBP 5.2bn), BP says - a rise of some USD 2bn in the past month alone.
BBC
5 September 2010 Thad Allen, the US coastguard official overseeing the clean-up operation, says the BP oil well at the centre of the leak poses "no further risk" to the environment, despite the final stages of an operation to pump concrete into a relief well remaining unfinished.
BBC
8 September 2010 In its own internal report into the Gulf of Mexico oil spill - the first to be published since the disaster - BP spreads the blame for the 11 April explosion and resulting leak. In a 193-page report BP accepts responsibility in part for the disaster, but also blames other companies working on the well.
BBC
17 September 2010 BP pumps cement to seal the damaged well after it was intercepted by a relief well.
BBC
19 September 2010 The ruptured well is finally sealed and "effectively dead", says the top US federal official overseeing the disaster, Coast Guard Adm Thad Allen.
BBC
Table 35: Timeline of BP Deepwater Horizon Oil Spill
Source: BP (2010c), Deepwater horizon accident investigation report

309
Appendix 4: Acronyms BP Texas Case
ACC American Chemistry Council AIChE American Institute of Chemical Engineers API American Petroleum Institute ARPD Amoco Refining Planning Department ARU Aromatics Recovery Unit AU2 Aromatics Unit #2 BOT Basic Operator Training BPSH BP South Houston bpd barrels per day BUL Business Unit Leader CAIB Columbia Accident Investigation Board CDP Compliance Delivery Process CFHU Cat Feed Hydrotreating Unit CCPS Center for Chemical Process Safety CMMS Computerized Maintenance Management Software CSB U.S. Chemical Safety and Hazard Investigation Board CVP Capital Value Process DIERS Design Institute for Emergency Relief Systems DIH Deisohexanizer EHS Environment, Health and Safety EPA Environmental Protection Agency ERP Enterprise Resource Planning GHSER Getting Health, Safety, and Environment Right gph gallons per hour HAZOP Hazard and Operability Study HC1 Hydrogen Chloride HRO High Reliability Organization HSE Health, Safety & Environment HSSE Health, Safety, Security, & Environment HUF Heavy Ultraformate Fractionator IH Industrial Hygiene IMAS Industrial Mutual Aid System ISBL Inside Battery Limits ISOM Isomerization unit kPa kilopascal KPI Key Performance Indicators L&D Learning and Development MAR Major Accident Risk MAWP Maximum Allowable Working Pressure MDL Manufacturing Delivery Leader MOA Memorandum of Agreement MOC Management of Change mscf million standard cubic feet NDU Naptha Desulfurization Unit NESHAP National Emissions Standard for Hazardous Air Pollutants NPRA National Petrochemical and Refiners Association NPS Nominal Pipe Size NTSB National Transportation Safety Board OSBL Outside Battery Limits OCAM Operator Competency Assurance Model OSHA Occupational Safety and Health Administration P&ID Piping and Instrumentation Diagram PHA Process Hazard Analysis PIP Piping Integrity Program pph pounds per hour PPS Amoco Petroleum Products Sector psi pounds per square inch PSM Process Safety Management PSS Process Safety Standard

310
PSSR Pre-Startup Safety Review PT Process Technician QA/QC Quality Assurance/Quality Control R&M Refining and Marketing RCFA Root Cause Failure Analysis RHU ResidHydrotreating Unit RIF Recordable Injury Frequency RMP Risk Management Program SAP Systems Applications and Products SEP Special Emphasis Program SHIFT South Houston Infrastructure for Tomorrow SIS Safety Instrumented System SOI Standard Operating Instructions SOPs Standard Operating Procedures TCEQ Texas Commission on Environmental Quality TCR Texas City Refinery TCS Texas City Site TSP Traffic Safety Policy UK United Kingdom ULC Ultracracker unit UOP Universal Oil Products USW United Steelworkers UU3 Ultraformer Unit # 3 UU4 Ultraformer Unit #4 VOC Volatile Organic Compounds VPP Variable Pay Plan

311

312


![Berkshire Functional Economic Market Area Study [9Mb]](https://static.fdocuments.in/doc/165x107/589edc811a28abb84a8c01d9/berkshire-functional-economic-market-area-study-9mb.jpg)


![West Lothian Local Plan [9Mb]](https://static.fdocuments.in/doc/165x107/5878ac7c1a28ab9c028c30f4/west-lothian-local-plan-9mb.jpg)