Download (9.78 MB )
26
Cell Reports, Volume 15 Supplemental Information KRAS-MEK Signaling Controls Ago2 Sorting into Exosomes Andrew J. McKenzie, Daisuke Hoshino, Nan Hyung Hong, Diana J. Cha, Jeffrey L. Franklin, Robert J. Coffey, James G. Patton, and Alissa M. Weaver
Transcript of Download (9.78 MB )

Cell Reports, Volume 15
Supplemental Information
KRAS-MEK Signaling Controls
Ago2 Sorting into Exosomes
Andrew J. McKenzie, Daisuke Hoshino, Nan Hyung Hong, Diana J. Cha, Jeffrey L.Franklin, Robert J. Coffey, James G. Patton, and Alissa M. Weaver

SUPPLEMENTAL INFORMATION KRAS-MEK signaling controls Ago2 sorting into exosomes Andrew J. McKenzie, Daisuke Hoshino, Nan Hyung Hong, Diana J. Cha, Jeffrey L. Franklin, Robert J. Coffey, James G. Patton, and Alissa M. Weaver 1. Supplemental Methods Cell lines MutDKO-1 and WTDKs-8 cells were cultured in DMEM (Corning) supplemented with 10% fetal bovine serum (FBS; HyClone), non-essential amino acids (Sigma), and L-Glutamine. MutHCT-116 and WTHKe-3 cells were cultured in RPMI (Corning) supplemented with 10% FBS. HEK 293FT cells were cultured in DMEM (Corning) supplemented with 10% FBS and sodium pyruvate as per the manufacturer’s instructions. Plasmids, reagents, and antibodies mCherry Ago2 constructs were generated by site-directed mutagenesis (Stratagene), confirmed by sequencing, and subcloned into pLenti6. shRNAs: 3’UTR Ago2-1: 5’-gggattcacgagaccagctaccgaagtagctggtctcgtgaatccc-3’, 3’UTR Ago2-2: 5’-gctcaaactagctgtgaatctcgaaagattcacagctagtttgagc-3’. shRNAs were cloned into pENTR U6 entry vector and subcloned into pLenti6 BlockiT destination vector. Ago2-KD cells were used immediately after confirmation of KD by Western blot, within 4 weeks of lentiviral transduction, to avoid loss of KD or compensatory effects. Triciribine, PD 0325901, FR180204 and SB203580 were purchased from Selleckchem, Sigma, Calbiochem, and Cell Signaling, respectively. Let-7a miRNA mimic was purchased from Thermo. LabelIT miRNA labeling kit (Mirus Bio) was used to make Cy3-Let-7a. Rat anti-Ago2 (MABE253, EMD Millipore), rabbit anti-DCP1a (ab47811, Abcam), rabbit anti-GW182 (NBP1-28751, Novus Biologicals), rabbit anti-Dicer (sc30226, Santa Cruz), anti-CD63 (ab68418, Abcam, for Western Blots; ab8219, Abcam, for IPs and IF), mouse anti-Flotillin1 (610820, BD Biosciences), mouse anti-ERKI/II (9107-s, Cell Signaling Technologies), rabbit anti-phospho-ERKI/II (4370-p, Cell Signaling Technologies), mouse anti-mCherry (ab125096, Abcam), anti-TSG101 (ab30871, Abcam), anti-HSP70 (sc-24, Santa Cruz Biotech), anti-Rab7 (9367, Cell Signaling), anti-GAPDH (GT-239, GENETEX), anti-actin (4967s, Cell Signaling), and anti-phosphoserine-387-Ago2 ((Horman et al., 2013), a kind gift of Dr. Paul Graves, New York Methodist Hospital) were used. Iodixanol (Opti-Prep™) was purchased from Sigma. StrataClean resin was purchased from Aligent Technologies. Immunofluorescence microscopy Cells were seeded on coverslips, serum-starved overnight in serum-free DMEM, and fixed in 4% formaldehyde in PBS for 15 min at room temperature. For drug treatment cells were starved in serum-free DMEM overnight then treated with drugs for 4 hr before being processed for immunofluorescence. Cells were rinsed three times in PBS and blocked in blocking buffer (5% normal goat serum; 0.1% saponin; 1X PBS) for 60 min at RT. Antibodies were diluted in antibody dilution buffer (1% BSA; 0.1% saponin; 1X PBS) at 1:500 (Ago2, and DCP1a), 1:100 (Dicer), and 1:200 (CD63) and incubated overnight at 4˚C. Coverslips were washed 5x5 min in PBS before being incubated with species-specific Alexa Fluor-conjugated (488, 546, 647) secondary antibodies (diluted 1:400 in antibody dilution buffer) for 1 hr at RT and washed, again, 5x5 min in PBS. Coverslips were mounted on glass slides using a small drop of ProLong Antifade XL (Molecular Probes) mounting media. Confocal images were obtained with a Zeiss LSM 510 equipped with a 63X/1.4 NA PlanApo objective using fluorophore-specific lasers Subcellular fractionation Subcellular fractionation was performed essentially as previously described (Squadrito et al., 2014). Briefly, 1x10⁶ cells were serum starved for 18 hr, harvested in homogenization buffer (HB, 0.25 M sucrose; 10 mM triethanolamine; 1 mM EDTA; 10 mM acetic acid; pH 7.8), mechanically lysed using 10 strokes of a Dounce homogenizer followed by passing the lysate through a 27 ¼ gauge needle 10 times. The lysate was cleared of nuclei by centrifugation at 10,000 x g and the post-nuclear extract was loaded on a continuous iodixanol density gradient and spun at 100,000 x g for 5 h in a SW40 Ti (Beckman) swinging bucket rotor. To generate the 12 ml continuous iodixanol density gradient, 30, 20, 10, 5, and 2 % iodixanol solutions were diluted in HB and overlayed from increasing to decreasing density. The gradient was incubated at 4˚C overnight to generate a continuous gradient, and post-nuclear extracts were loaded on the top of the gradient. After centrifugation,

fractions were collected in 1 mL volumes and proteins were precipitated by adding 30 µL StrataClean Resin (Agilent Technologies) to each fraction and incubating 1 hr at 4˚C. Protein-bound StrataClean resin was pelleted by centrifugation and the pellet was washed three times in HB and proteins were eluted by heating beads in 20 µL Laemmli sample buffer to 95˚C for 5 min. Western blot analyses of the fractions were quantitated by densitometric measurement of the bands. Extracellular vesicle isolation and NanoSight particle tracking Extracellular vesicles were isolated from conditioned cell culture media as previously described (Sung et al., 2015) and characterized according to (Lotvall et al., 2014). Briefly, cells were grown to ~80% confluence, washed three times in PBS, and incubated in serum-free DMEM for 48 hr. Conditioned media was collected and cells were trypsinized, counted, and cell viability was assessed. Preparations were only performed on cells that were >90% viable. Conditioned media was cleared of cells by centrifugation at 500 rpm for 10 min and cleared of cell debris by spinning at 2000 x g for 25 min. Microvesicles were collected by centrifugation at 10,000 x g for 30 minutes, and ultracentrifuge-purified exosomes (UC exo) were collected by centrifugation at 100,000 x g for 18 hr (or 2 hr for Fig S1F-H). For density gradient purification, UC exosomes were loaded on the top of a 12 ml 40-5% discontinuous iodixanol density gradient and spun at 100,000 x g for 18 hr in an SW40 Ti (Beckman) swinging bucket rotor. Fractions were collected in 1 ml volumes, diluted in PBS, washed twice by centrifugation at 100,000 x g for 3 hr, and pellets were resuspended in 30 µl. For nanoparticle tracking analysis, vesicles diluted in PBS were passed through a 27 ¼ gauge needle 10 times and analyzed by NanoSight particle tracking analysis (LM10, with software version 2.03). For particle tracking, at least five 60 sec videos were taken of each sample with a camera gain of 10. From these videos, the average concentration and size of particles was calculated and considered to be one biological replicate. Settings were kept the same for all replicates and between different samples for normalization. Vesicle concentrations were calculated as particle/cell/hour of culture in order to obtain net vesicle secretion rates. Immunoprecipitation of Exosomes Purified exosomes resuspended in PBS were subject to BCA assay (Pierce) and 50 µg of exosomes (in a 200 µl volume) were incubated with either 5 µg mouse-anti-CD63 antibody (IP: CD63) or 5 µg normal mouse IgG (IP: IgG) for 3 hr at 4˚C. Magnetic protein A/G beads were washed three times in PBS and blocked for 1 hr in 1.5%BSA diluted in PBS. Beads were washed twice in PBS then immune-captured purified exosomes were added to the beads and incubated for 1 hr at 4˚C. The supernatant was reserved to analyze pull-down efficiency then beads were washed three times in PBS. To elute proteins, beads were incubated with 25 µl 1X Laemmli sample buffer at 95˚C for 10 min. 10 µg of purified exosomes were loaded as 20% input for comparison to the 20% of the supernatant loaded on the blot. Dot blot localization of Ago2 Dot blotting of exosome preparation was done essentially as described previously (Lai et al., 2015). In brief, different concentrations of exosomes collected from conditioned media of mCherry-Ago2 expressing cells were dotted onto nitrocellulose membranes and allowed to dry at room temperature for 1 h. The membrane was then blocked with 5% non-fat dried milk in Tris-buffered saline (TBS) in the absence or presence of 0.1% (v/v) Tween 20 (TBS-T) at room temperature for 1h, followed by incubation with anti-Ago2, anti-mCherry, or anti-CD63 antibody in TBS or TBS-T overnight at 4 °C. Preparation of negatively stained grids for transmission electron microscopy Formvar carbon film-coated grids were rinsed by immersion into double distilled water and 100% ethanol. After each step, excess liquid was wicked away with filter paper. Diluted samples were added to the grid in 6 µl volume and incubated at RT for 60 s. Grids were subsequently stained with 2% phosphotungstic acid, pH 6.1 for 15 s and allowed to air-dry overnight. Grids were mounted and imaged on a FEI Tecnai T12 TEM (120kV LaB6 source), Gatan cryotransfer stage, and AMT CR41-S side mounted 2K x 2K CCD camera, 2102 SC. Polyacrylamide gel electrophoresis and western blotting For western blots, either 10 µg total cell lysates (obtained from cells that were serum starved for 18 h), equal vesicle numbers, or total precipitated protein (for gradient fractions) were boiled in Laemmli sample buffer for 5 min and loaded on 15-well 7.5, 8, or 10% polyacrylamide gels. Proteins were transferred to nitrocellulose membranes for 1 hr at 100 volts at 4˚C. Gels were stained with Coomassie blue to ensure complete transfer of proteins. Membranes were rinsed once in water then blocked in either 5% non-fat dry milk (NFDM) or 3% BSA

diluted in tris-buffered saline with 0.5% Tween20 (TBST) for 1 hr at RT. Primary antibodies were diluted in 5% NFDM-TBST (Ago2, 1:1000; DCP1a, 1:1000; Rab7, 1:2000; CD63, 1:500; Flotillin, 1:1000; Hsp70, 1:1000; ERKI/II, 1:1000; mCherry, 1:1000) or 3% BSA-TBST (phospho Ago2, 1:1000; phospho ERKI/II, 1:1000) and incubated overnight at 4˚C. Membranes were washed 5x5 min in TBST and subsequently incubated with species-specific HRP-conjugated secondary antibodies (1:5000; Biorad) for 1 hr at RT. Membranes were washed 5x5 min in TBST and incubated with an enhanced chemiluminescence (ECL) reagent (ThermoScientific) for 2 min before being exposed to film. At least 5 exposures were taken for each blot in order to include the entire dynamic range of the film for densitometry measurements. qRT-PCR for miRNA Total RNA was isolated from exosomes, MVs, and serum-starved cells using TRIzol (Life Technologies/Thermo, Grand Island, NY). For exosome and MV RNA, TRIzol was incubated for an additional 15 min prior to chloroform extraction. Purified RNA was resuspended in RNase-free water and re-purified using the miRNeasy kit (Qiagen Inc., Valencia, CA, USA), which isolates all small RNAs <200 nt, including miRNAs. Total RNA amounts were measured by NanoDrop. Taqman small RNA assays (Life Technologies) were performed on exosomal and cellular RNA according to manufacturer instructions using Taqman assay probes #: U6 snRNA: 001973; hsa-let7a-5p: 000377; hsa-miR-100-5p:000437; hsa-miR320a: 002277. Individual reverse transcription reactions were performed using 5 ng RNA from each sample per Taqman miRNA primer in a final reaction volume of 10 µl. RNA-free water was used a negative control. After transcription, 0.34 ng (0.67 µl) cDNA was used as template with the corresponding Taqman miRNA probe for qPCR in a final reaction volume of 10 µl. Each Taqman miRNA qPCR was performed in technical triplicate on a Bio-Rad CFX384. C(t) values were averaged for each technical triplicate. U6 snRNA was used as a normalization control for each biological sample and was not affected by Ago2-knockdown. To calculate fold changes (FC), the ∆∆C(t) method was used (Schmittgen and Livak, 2008). Briefly, ∆C(t) values were calculated for each biological sample, where ∆C(t) = C(t)miRNA-C(t)U6 snRNA. Relative fold changes were determined by FC = 2-∆∆C(t), where ∆∆C(t) = ∆C(t)-∆C(t)control. For ∆∆C(t) values < 0 (signifying a negative fold change), the negative reciprocal FC formula was used (-1/(2-∆∆C(t))). Statistical analyses were performed from three independent biological replicates. Data analysis and statistics For colocalization analyses, 1 µm thick z-slices were captured for each color. To obtain the cell boundary, cells were thresholded and an outline was created in ImageJ. Once an outline was obtained, the outline was added to an unmodified image. Colocalization and intensity of individual cells were quantitated using ‘measure colocalization’ plugin of MetaMorph software. For analysis of western blots, ImageJ analysis software was used to plot the relative band intensities for bands within the linear range of the film. Bands were normalized to loading controls as described in the figure legends. SPSS PASW Statistics 18 and GraphPad software packages were used for statistical analyses. All data were analyzed for normality in SPSS using the Kolmogorov-Smirnov test, and non-parametric data were analyzed with Kruskal-Wallis one-way ANOVA and Tamhane post-hoc test for multiple comparisons. Normally distributed data were analyzed using either a Student’s t test or a one-way ANOVA followed by a Bonferroni post-hoc test. Data were plotted using GraphPad. All data are depicted using scatter plots where the mean ± SEM are shown superimposed over the individual data points. 2. Supplemental References Horman, S.R., Janas, M.M., Litterst, C., Wang, B., MacRae, I.J., Sever, M.J., Morrissey, D.V., Graves, P., Luo, B., Umesalma, S., et al. (2013). Akt-mediated phosphorylation of argonaute 2 downregulates cleavage and upregulates translational repression of MicroRNA targets. Molecular cell 50, 356-367. Lai, C.P., Kim, E.Y., Badr, C.E., Weissleder, R., Mempel, T.R., Tannous, B.A., and Breakefield, X.O. (2015). Visualization and tracking of tumour extracellular vesicle delivery and RNA translation using multiplexed reporters. Nature communications 6, 7029. Lotvall, J., Hill, A.F., Hochberg, F., Buzas, E.I., Di Vizio, D., Gardiner, C., Gho, Y.S., Kurochkin, I.V., Mathivanan, S., Quesenberry, P., et al. (2014). Minimal experimental requirements for definition of extracellular vesicles and their functions: a position statement from the International Society for Extracellular Vesicles. Journal of extracellular vesicles 3, 26913.
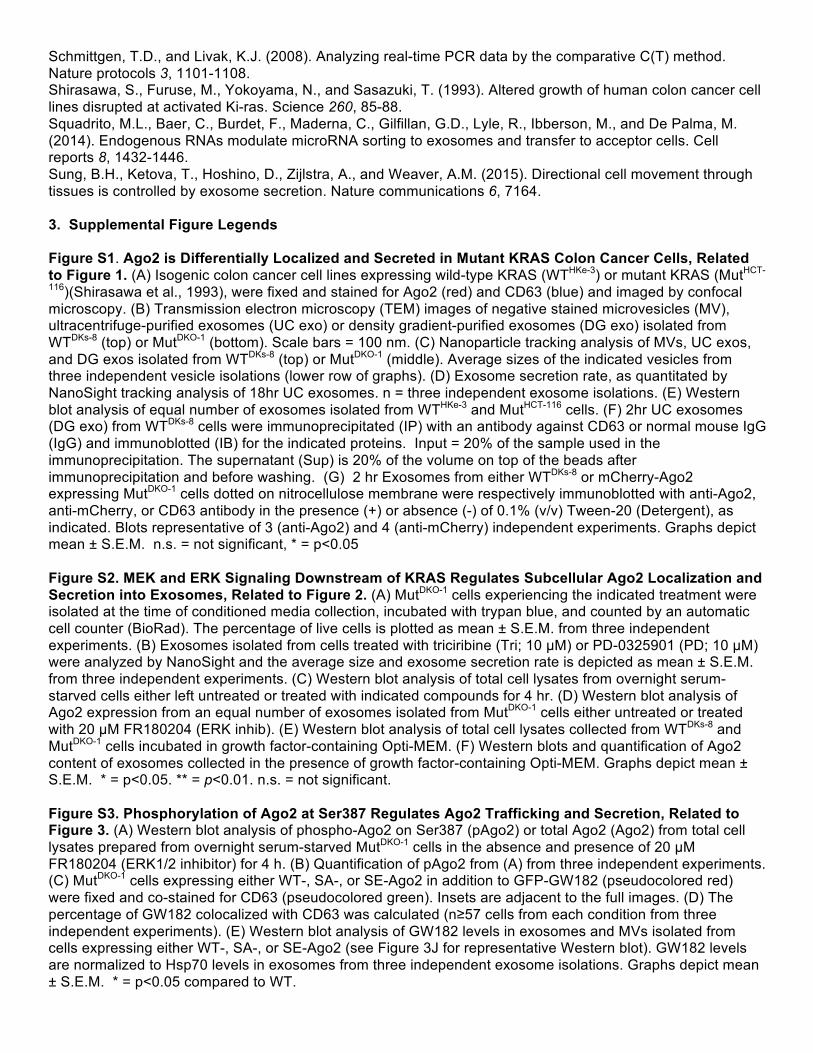
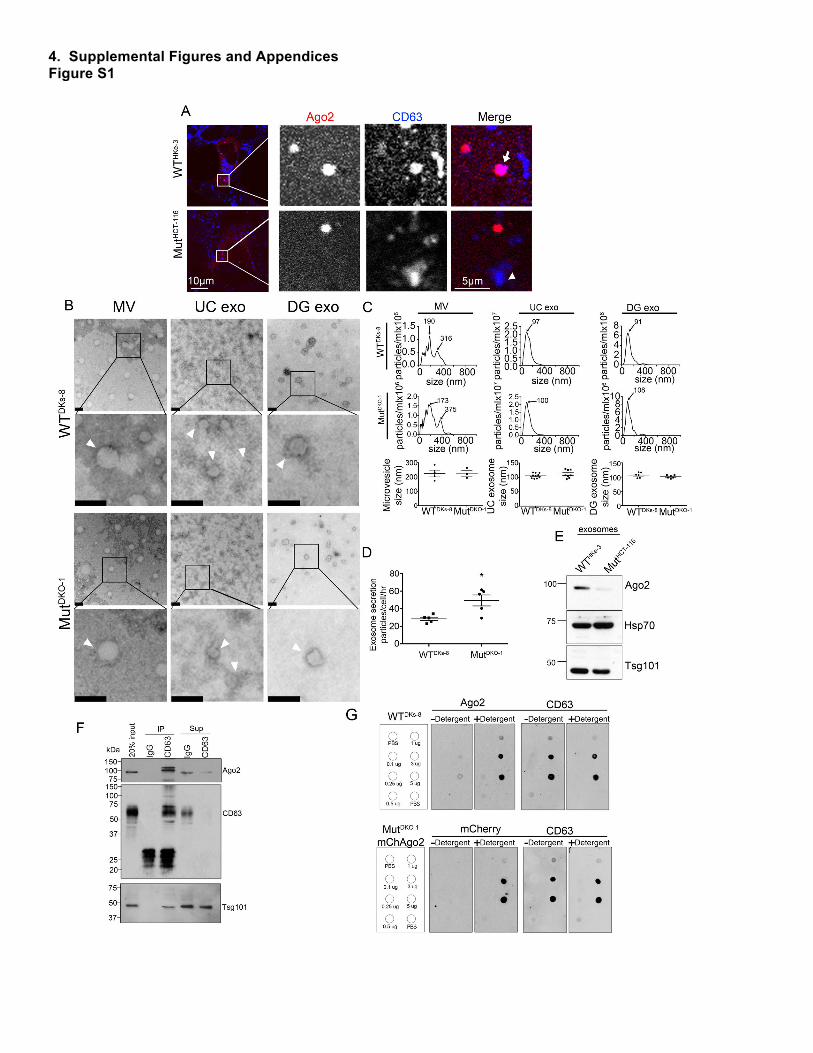
Schmittgen, T.D., and Livak, K.J. (2008). Analyzing real-time PCR data by the comparative C(T) method. Nature protocols 3, 1101-1108. Shirasawa, S., Furuse, M., Yokoyama, N., and Sasazuki, T. (1993). Altered growth of human colon cancer cell lines disrupted at activated Ki-ras. Science 260, 85-88. Squadrito, M.L., Baer, C., Burdet, F., Maderna, C., Gilfillan, G.D., Lyle, R., Ibberson, M., and De Palma, M. (2014). Endogenous RNAs modulate microRNA sorting to exosomes and transfer to acceptor cells. Cell reports 8, 1432-1446. Sung, B.H., Ketova, T., Hoshino, D., Zijlstra, A., and Weaver, A.M. (2015). Directional cell movement through tissues is controlled by exosome secretion. Nature communications 6, 7164. 3. Supplemental Figure Legends Figure S1. Ago2 is Differentially Localized and Secreted in Mutant KRAS Colon Cancer Cells, Related to Figure 1. (A) Isogenic colon cancer cell lines expressing wild-type KRAS (WTHKe-3) or mutant KRAS (MutHCT-
116)(Shirasawa et al., 1993), were fixed and stained for Ago2 (red) and CD63 (blue) and imaged by confocal microscopy. (B) Transmission electron microscopy (TEM) images of negative stained microvesicles (MV), ultracentrifuge-purified exosomes (UC exo) or density gradient-purified exosomes (DG exo) isolated from WTDKs-8 (top) or MutDKO-1 (bottom). Scale bars = 100 nm. (C) Nanoparticle tracking analysis of MVs, UC exos, and DG exos isolated from WTDKs-8 (top) or MutDKO-1 (middle). Average sizes of the indicated vesicles from three independent vesicle isolations (lower row of graphs). (D) Exosome secretion rate, as quantitated by NanoSight tracking analysis of 18hr UC exosomes. n = three independent exosome isolations. (E) Western blot analysis of equal number of exosomes isolated from WTHKe-3 and MutHCT-116 cells. (F) 2hr UC exosomes (DG exo) from WTDKs-8 cells were immunoprecipitated (IP) with an antibody against CD63 or normal mouse IgG (IgG) and immunoblotted (IB) for the indicated proteins. Input = 20% of the sample used in the immunoprecipitation. The supernatant (Sup) is 20% of the volume on top of the beads after immunoprecipitation and before washing. (G) 2 hr Exosomes from either WTDKs-8 or mCherry-Ago2 expressing MutDKO-1 cells dotted on nitrocellulose membrane were respectively immunoblotted with anti-Ago2, anti-mCherry, or CD63 antibody in the presence (+) or absence (-) of 0.1% (v/v) Tween-20 (Detergent), as indicated. Blots representative of 3 (anti-Ago2) and 4 (anti-mCherry) independent experiments. Graphs depict mean ± S.E.M. n.s. = not significant, * = p<0.05 Figure S2. MEK and ERK Signaling Downstream of KRAS Regulates Subcellular Ago2 Localization and Secretion into Exosomes, Related to Figure 2. (A) MutDKO-1 cells experiencing the indicated treatment were isolated at the time of conditioned media collection, incubated with trypan blue, and counted by an automatic cell counter (BioRad). The percentage of live cells is plotted as mean ± S.E.M. from three independent experiments. (B) Exosomes isolated from cells treated with triciribine (Tri; 10 µM) or PD-0325901 (PD; 10 µM) were analyzed by NanoSight and the average size and exosome secretion rate is depicted as mean ± S.E.M. from three independent experiments. (C) Western blot analysis of total cell lysates from overnight serum-starved cells either left untreated or treated with indicated compounds for 4 hr. (D) Western blot analysis of Ago2 expression from an equal number of exosomes isolated from MutDKO-1 cells either untreated or treated with 20 µM FR180204 (ERK inhib). (E) Western blot analysis of total cell lysates collected from WTDKs-8 and MutDKO-1 cells incubated in growth factor-containing Opti-MEM. (F) Western blots and quantification of Ago2 content of exosomes collected in the presence of growth factor-containing Opti-MEM. Graphs depict mean ± S.E.M. * = p<0.05. ** = p<0.01. n.s. = not significant. Figure S3. Phosphorylation of Ago2 at Ser387 Regulates Ago2 Trafficking and Secretion, Related to Figure 3. (A) Western blot analysis of phospho-Ago2 on Ser387 (pAgo2) or total Ago2 (Ago2) from total cell lysates prepared from overnight serum-starved MutDKO-1 cells in the absence and presence of 20 µM FR180204 (ERK1/2 inhibitor) for 4 h. (B) Quantification of pAgo2 from (A) from three independent experiments. (C) MutDKO-1 cells expressing either WT-, SA-, or SE-Ago2 in addition to GFP-GW182 (pseudocolored red) were fixed and co-stained for CD63 (pseudocolored green). Insets are adjacent to the full images. (D) The percentage of GW182 colocalized with CD63 was calculated (n≥57 cells from each condition from three independent experiments). (E) Western blot analysis of GW182 levels in exosomes and MVs isolated from cells expressing either WT-, SA-, or SE-Ago2 (see Figure 3J for representative Western blot). GW182 levels are normalized to Hsp70 levels in exosomes from three independent exosome isolations. Graphs depict mean ± S.E.M. * = p<0.05 compared to WT.

Table S1, Tabulated Results of Vesicle Number and RNA Analysis of Four Independent qRT-PCR Experiments from Microvesicles Isolated from Mutdko1 Cells Stably Expressing WT, S387A (SA), or S387E (SE) Mcherry-Ago2, Related to Figure 4. Appendix 1: All Western Blots in The Figures Shown Uncropped. Appendix 2: All Images in The Figures Shown at Higher Magnification.
4. Supplemental Figures and Appendices Figure S1

Figure S2

Figure S3


Appendix 1: Whole blot images for every Western blot from McKenzie et al.
Figure 1

Figure 1 continued

Figure 2
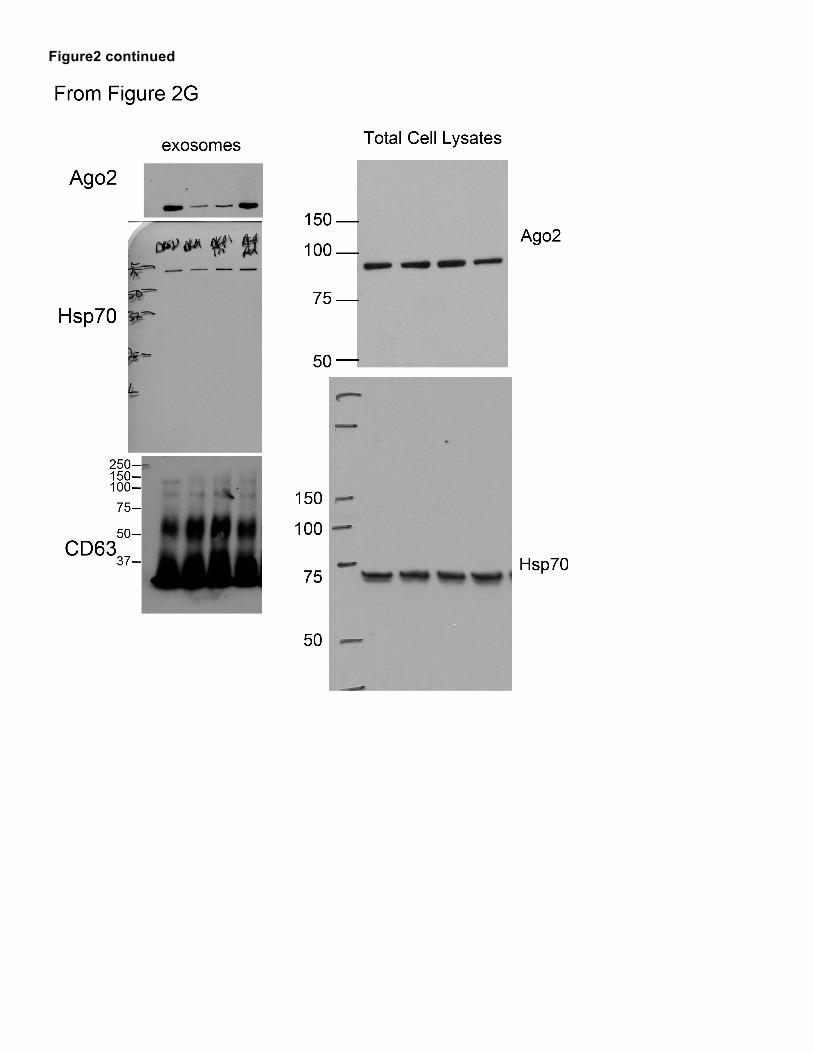
Figure2 continued

Figure 3

Figure 4
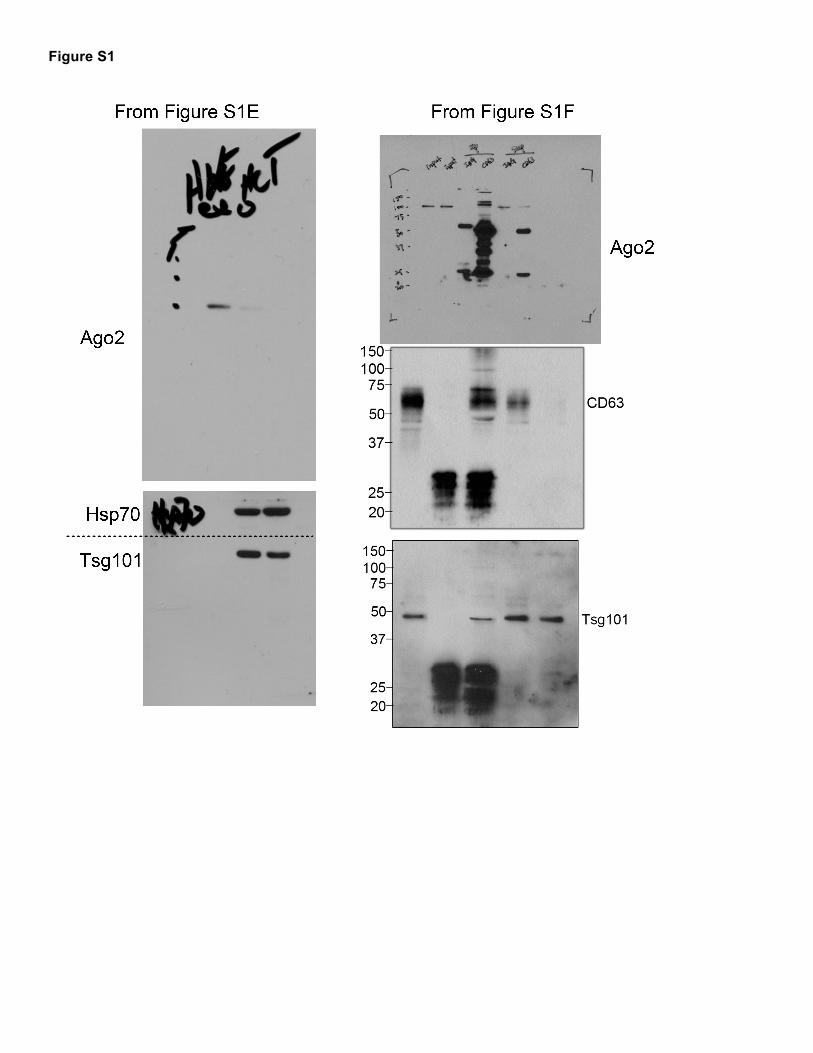
Figure S1

Figure S2

Figure S2 continued

Figure S3 From Fig S3A:

Appendix 2: Enlarged whole images from the Figures From Figure 1:

From Figure 2:

From Figure 3:
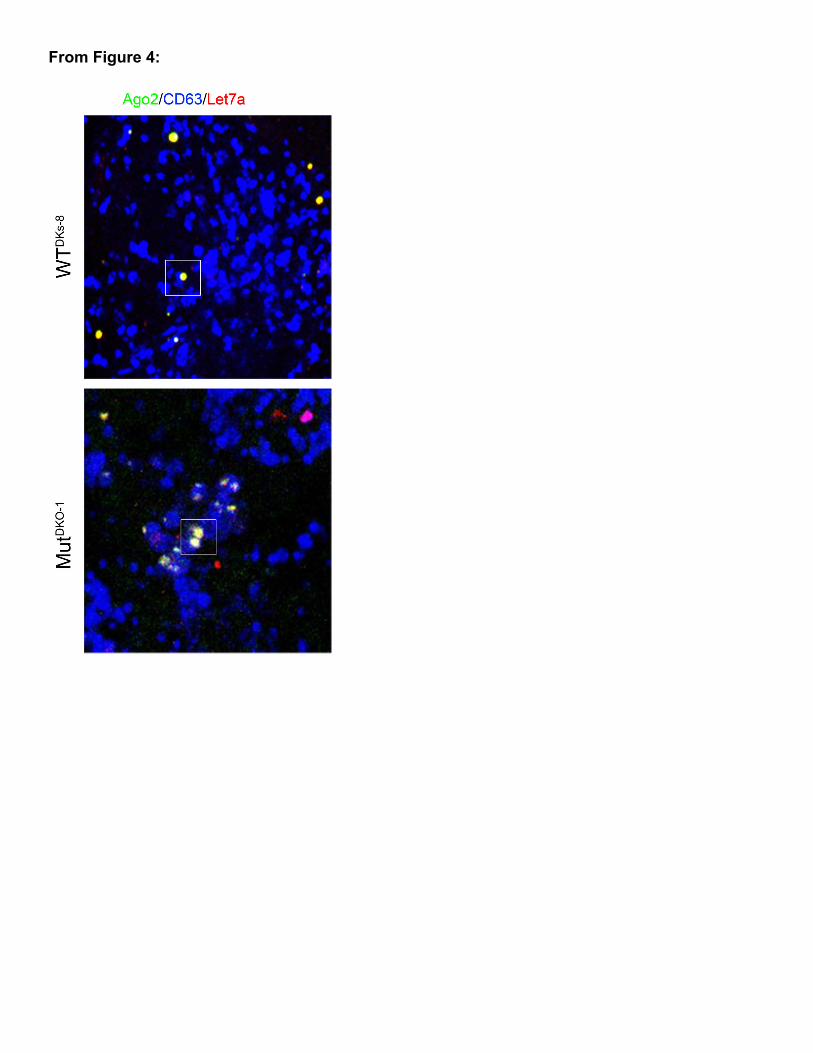
From Figure 4:

From Figure S1:

From Figure S3: