DOWA HOLDINGS CO., LTD. - marketscreener.com fileworld stage, Dowa seeks to contribute to the...
36
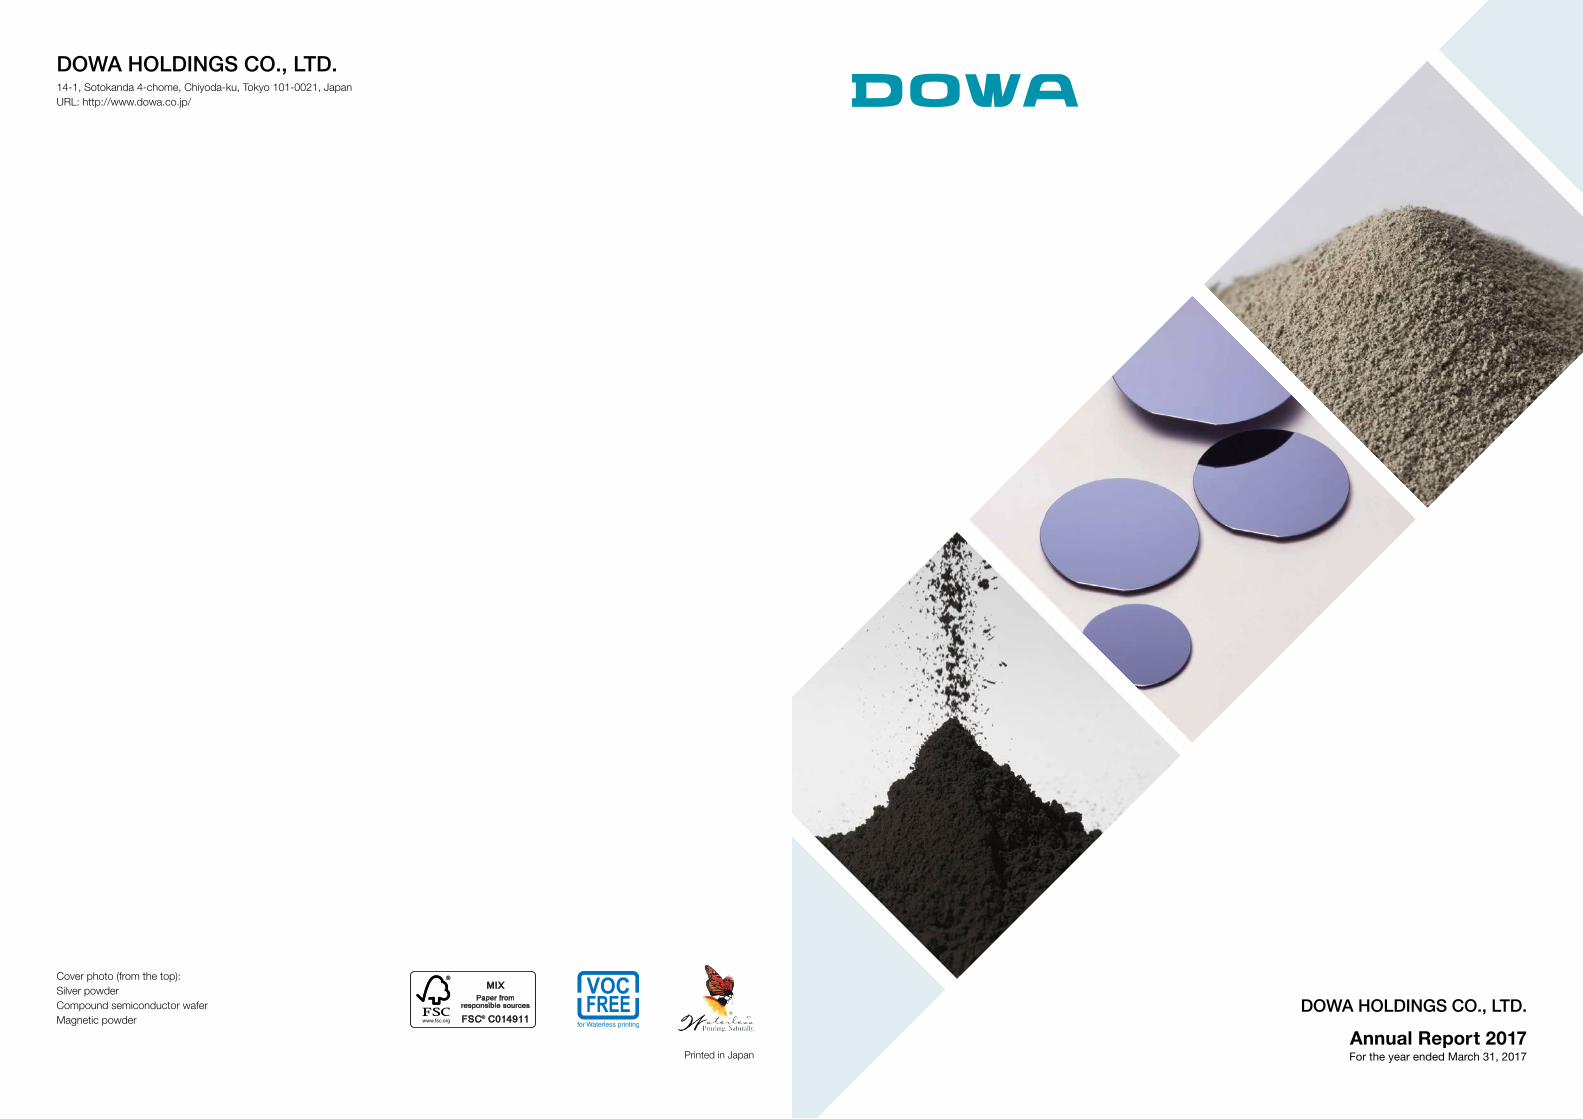
Printed in Japan Cover photo (from the top): Silver powder Compound semiconductor wafer Magnetic powder DOWA HOLDINGS CO., LTD. Annual Report 2017 For the year ended March 31, 2017 14-1, Sotokanda 4-chome, Chiyoda-ku, Tokyo 101-0021, Japan URL: http://www.dowa.co.jp/ DOWA HOLDINGS CO., LTD.
Transcript of DOWA HOLDINGS CO., LTD. - marketscreener.com fileworld stage, Dowa seeks to contribute to the...
Printed in Japan
Cover photo (from the top):Silver powderCompound semiconductor waferMagnetic powder
DOWA HOLDINGS CO., LTD.
Annual Report 2017For the year ended March 31, 2017
14-1, Sotokanda 4-chome, Chiyoda-ku, Tokyo 101-0021, Japan URL: http://www.dowa.co.jp/
DOWA HOLDINGS CO., LTD.
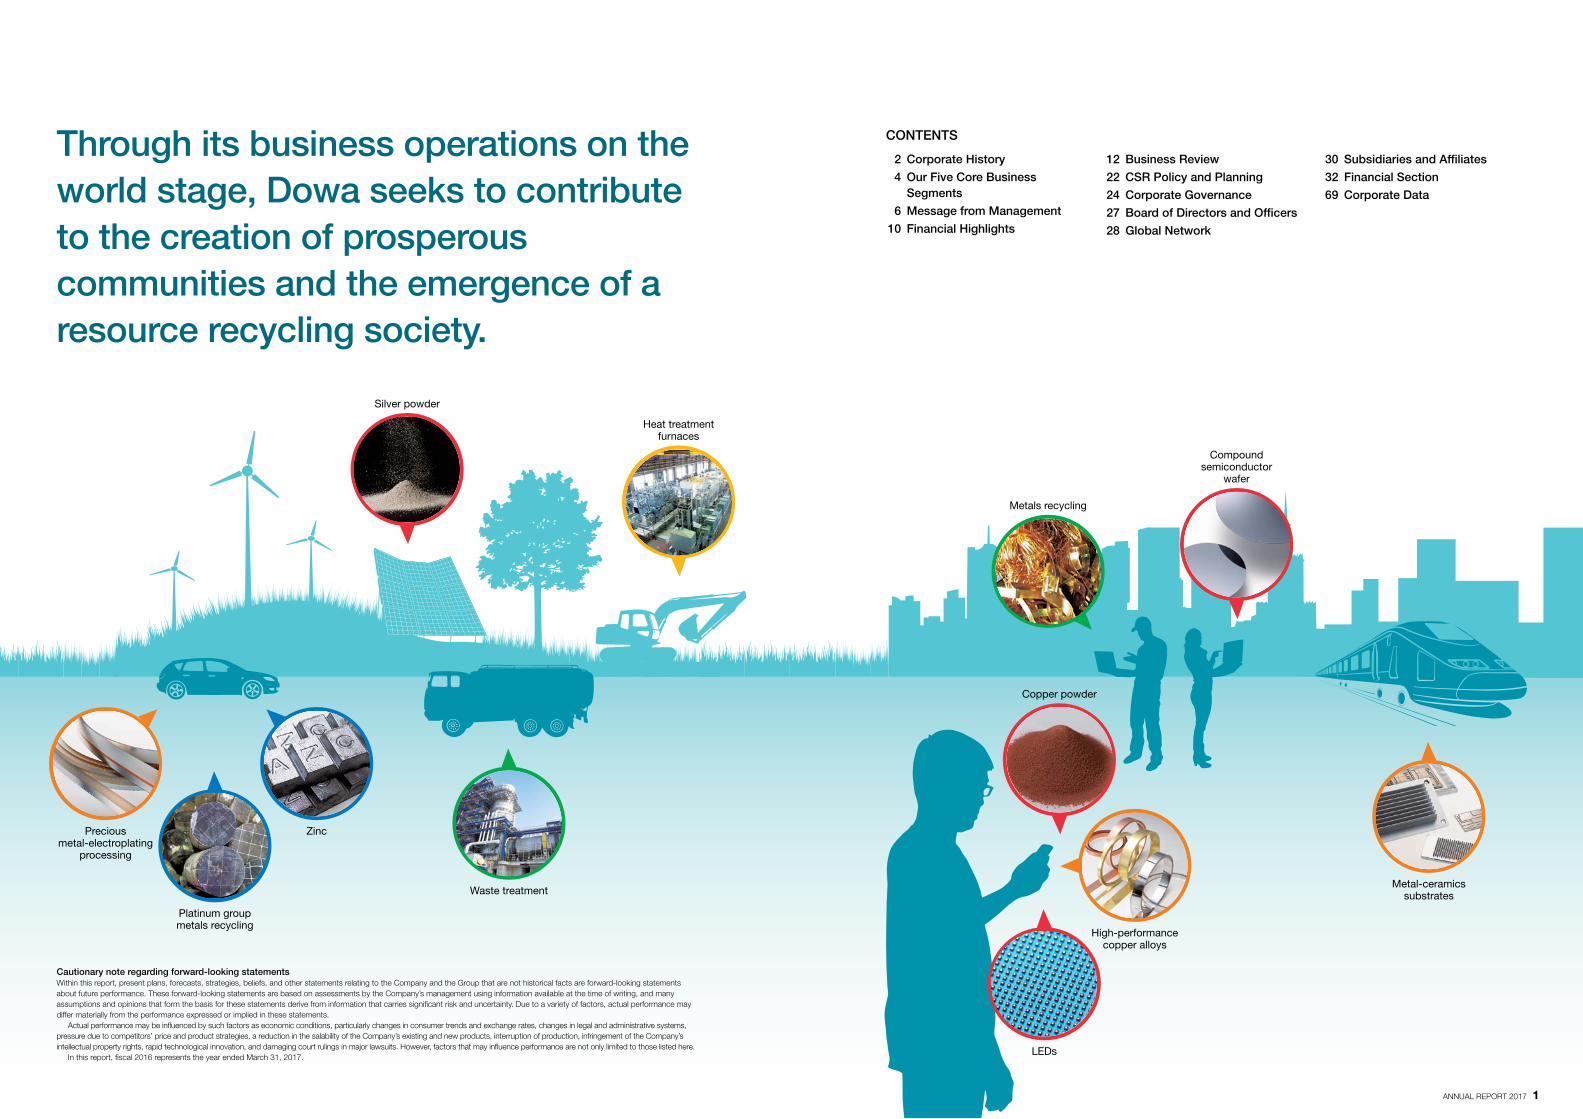
Through its business operations on the world stage, Dowa seeks to contribute to the creation of prosperous communities and the emergence of a resource recycling society.
CONTENTS
2 Corporate History
4 Our Five Core Business Segments
6 Message from Management
10 Financial Highlights
12 Business Review
22 CSR Policy and Planning
24 Corporate Governance
27 Board of Directors and Officers
28 Global Network
30 Subsidiaries and Affiliates
32 Financial Section
69 Corporate Data
Cautionary note regarding forward-looking statementsWithin this report, present plans, forecasts, strategies, beliefs, and other statements relating to the Company and the Group that are not historical facts are forward-looking statements about future performance. These forward-looking statements are based on assessments by the Company’s management using information available at the time of writing, and many assumptions and opinions that form the basis for these statements derive from information that carries significant risk and uncertainty. Due to a variety of factors, actual performance may differ materially from the performance expressed or implied in these statements. Actual performance may be influenced by such factors as economic conditions, particularly changes in consumer trends and exchange rates, changes in legal and administrative systems, pressure due to competitors’ price and product strategies, a reduction in the salability of the Company’s existing and new products, interruption of production, infringement of the Company’s intellectual property rights, rapid technological innovation, and damaging court rulings in major lawsuits. However, factors that may influence performance are not only limited to those listed here. In this report, fiscal 2016 represents the year ended March 31, 2017.
Metal-ceramics substrates
LEDs
Platinum group metals recycling
Metals recycling
Silver powder
Compound semiconductor
wafer
Copper powder
Heat treatment furnaces
High-performance copper alloys
Waste treatment
ZincPrecious metal-electroplating
processing
ANNUAL REPORT 2017 1
Fujita Gumi (1881–)
1880 1890 1900 1910 1920 1930 1940 1950 1960 1970 1980 1990 2000 2010
DOWA MINING CO., LTD. (1945–) DOWA HOLDINGS CO., LTD. (2006–)
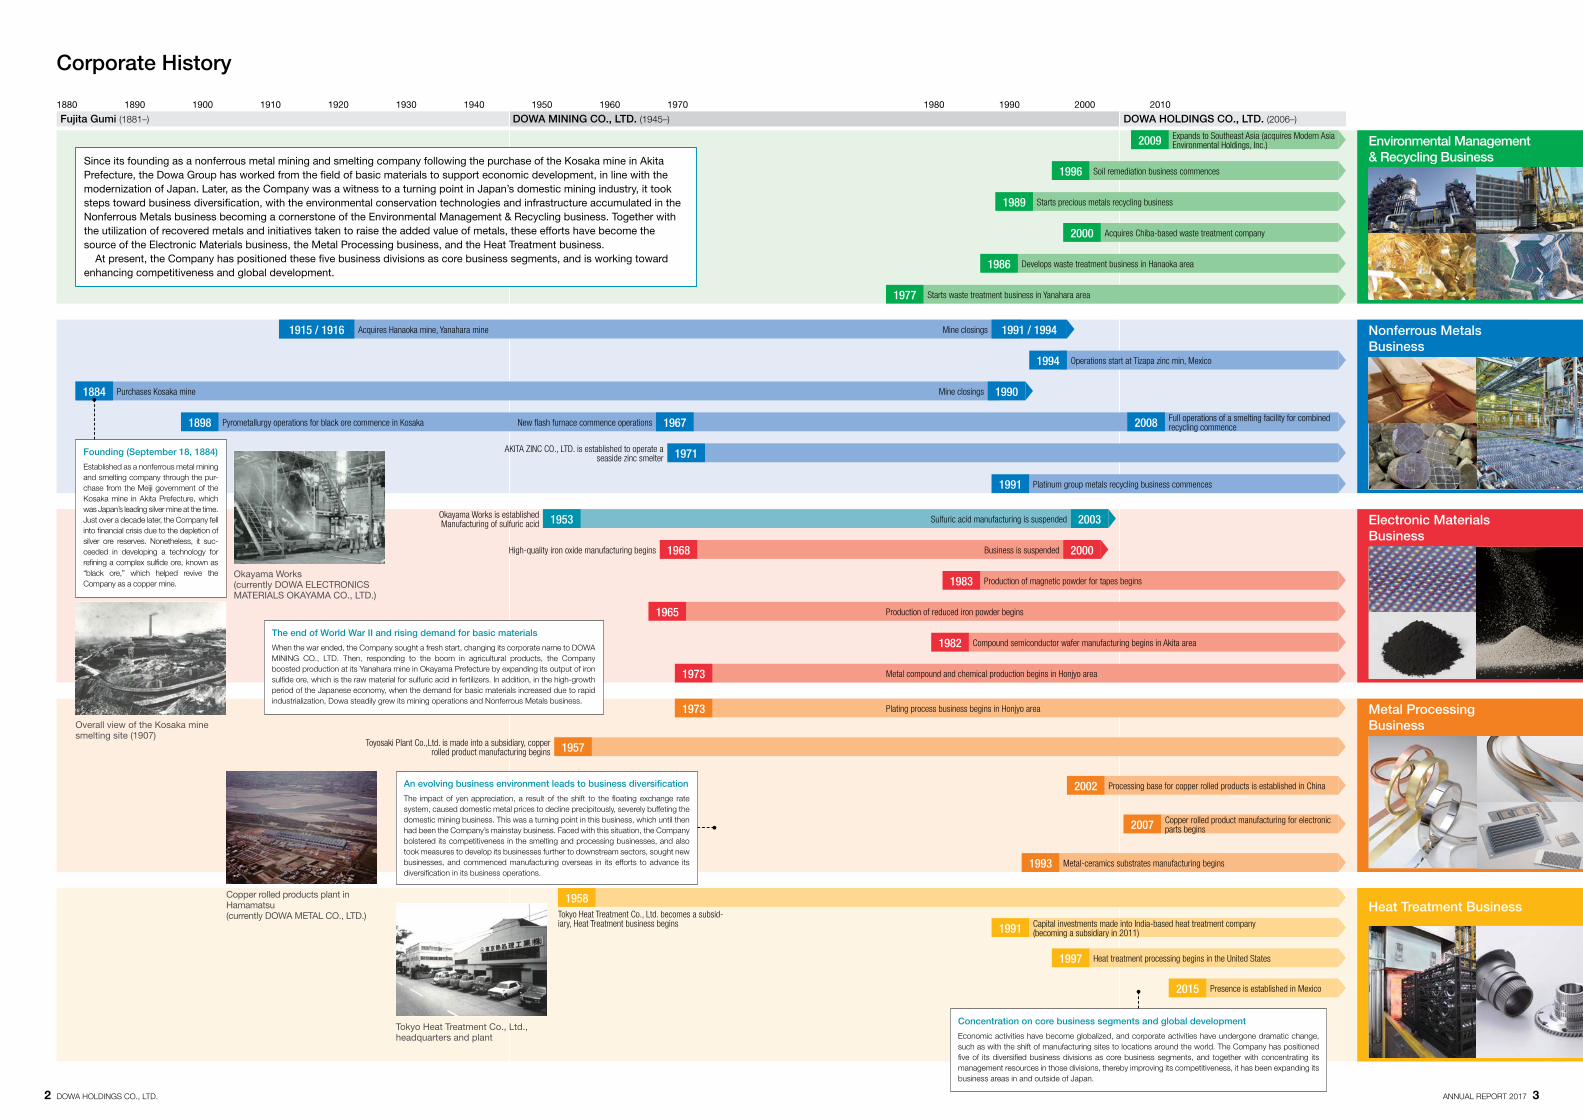
Corporate History
Environmental Management & Recycling Business
Nonferrous Metals Business
Heat Treatment Business
Metal Processing Business
Electronic Materials Business
2009
20081898 1967
1968
1965
1971
1973
1993
2007
2002
20031953
1957
1958
1996
2000
1977
1989
1994
1991 / 19941915 / 1916
1997
2015
19901884
1991
1983
2000
1982
1973
1991
Expands to Southeast Asia (acquires Modern Asia Environmental Holdings, Inc.)
Soil remediation business commences
Acquires Chiba-based waste treatment company
Starts waste treatment business in Yanahara area
Develops waste treatment business in Hanaoka area1986
Production of magnetic powder for tapes begins
Business is suspended
Compound semiconductor wafer manufacturing begins in Akita area
Metal compound and chemical production begins in Honjyo area
Plating process business begins in Honjyo area
Toyosaki Plant Co.,Ltd. is made into a subsidiary, copper rolled product manufacturing begins
Copper rolled product manufacturing for electronic parts begins
Tokyo Heat Treatment Co., Ltd. becomes a subsid-iary, Heat Treatment business begins
Heat treatment processing begins in the United States
Presence is established in Mexico
Capital investments made into India-based heat treatment company (becoming a subsidiary in 2011)
Metal-ceramics substrates manufacturing begins
Processing base for copper rolled products is established in China
High-quality iron oxide manufacturing begins
Production of reduced iron powder begins
Starts precious metals recycling business
Operations start at Tizapa zinc min, Mexico
Okayama Works is establishedManufacturing of sulfuric acid
Platinum group metals recycling business commences
AKITA ZINC CO., LTD. is established to operate a seaside zinc smelter
Full operations of a smelting facility for combined recycling commencePyrometallurgy operations for black ore commence in Kosaka New flash furnace commence operations
Sulfuric acid manufacturing is suspended
Mine closings
Mine closings
Acquires Hanaoka mine, Yanahara mine
Purchases Kosaka mine
Overall view of the Kosaka mine smelting site (1907)
Okayama Works (currently DOWA ELECTRONICS MATERIALS OKAYAMA CO., LTD.)
Copper rolled products plant in Hamamatsu (currently DOWA METAL CO., LTD.)
Tokyo Heat Treatment Co., Ltd., headquarters and plant
2 DOWA HOLDINGS CO., LTD. ANNUAL REPORT 2017 3
An evolving business environment leads to business diversification
The impact of yen appreciation, a result of the shift to the floating exchange rate system, caused domestic metal prices to decline precipitously, severely buffeting the domestic mining business. This was a turning point in this business, which until then had been the Company’s mainstay business. Faced with this situation, the Company bolstered its competitiveness in the smelting and processing businesses, and also took measures to develop its businesses further to downstream sectors, sought new businesses, and commenced manufacturing overseas in its efforts to advance its diversification in its business operations.
Concentration on core business segments and global development
Economic activities have become globalized, and corporate activities have undergone dramatic change, such as with the shift of manufacturing sites to locations around the world. The Company has positioned five of its diversified business divisions as core business segments, and together with concentrating its management resources in those divisions, thereby improving its competitiveness, it has been expanding its business areas in and outside of Japan.
The end of World War II and rising demand for basic materials
When the war ended, the Company sought a fresh start, changing its corporate name to DOWA MINING CO., LTD. Then, responding to the boom in agricultural products, the Company boosted production at its Yanahara mine in Okayama Prefecture by expanding its output of iron sulfide ore, which is the raw material for sulfuric acid in fertilizers. In addition, in the high-growth period of the Japanese economy, when the demand for basic materials increased due to rapid industrialization, Dowa steadily grew its mining operations and Nonferrous Metals business.
Since its founding as a nonferrous metal mining and smelting company following the purchase of the Kosaka mine in Akita Prefecture, the Dowa Group has worked from the field of basic materials to support economic development, in line with the modernization of Japan. Later, as the Company was a witness to a turning point in Japan’s domestic mining industry, it took steps toward business diversification, with the environmental conservation technologies and infrastructure accumulated in the Nonferrous Metals business becoming a cornerstone of the Environmental Management & Recycling business. Together with the utilization of recovered metals and initiatives taken to raise the added value of metals, these efforts have become the source of the Electronic Materials business, the Metal Processing business, and the Heat Treatment business. At present, the Company has positioned these five business divisions as core business segments, and is working toward enhancing competitiveness and global development.
Founding (September 18, 1884)
Established as a nonferrous metal mining and smelting company through the pur-chase from the Meiji government of the Kosaka mine in Akita Prefecture, which was Japan’s leading silver mine at the time. Just over a decade later, the Company fell into financial crisis due to the depletion of silver ore reserves. Nonetheless, it suc-ceeded in developing a technology for refining a complex sulfide ore, known as “black ore,” which helped revive the Company as a copper mine.
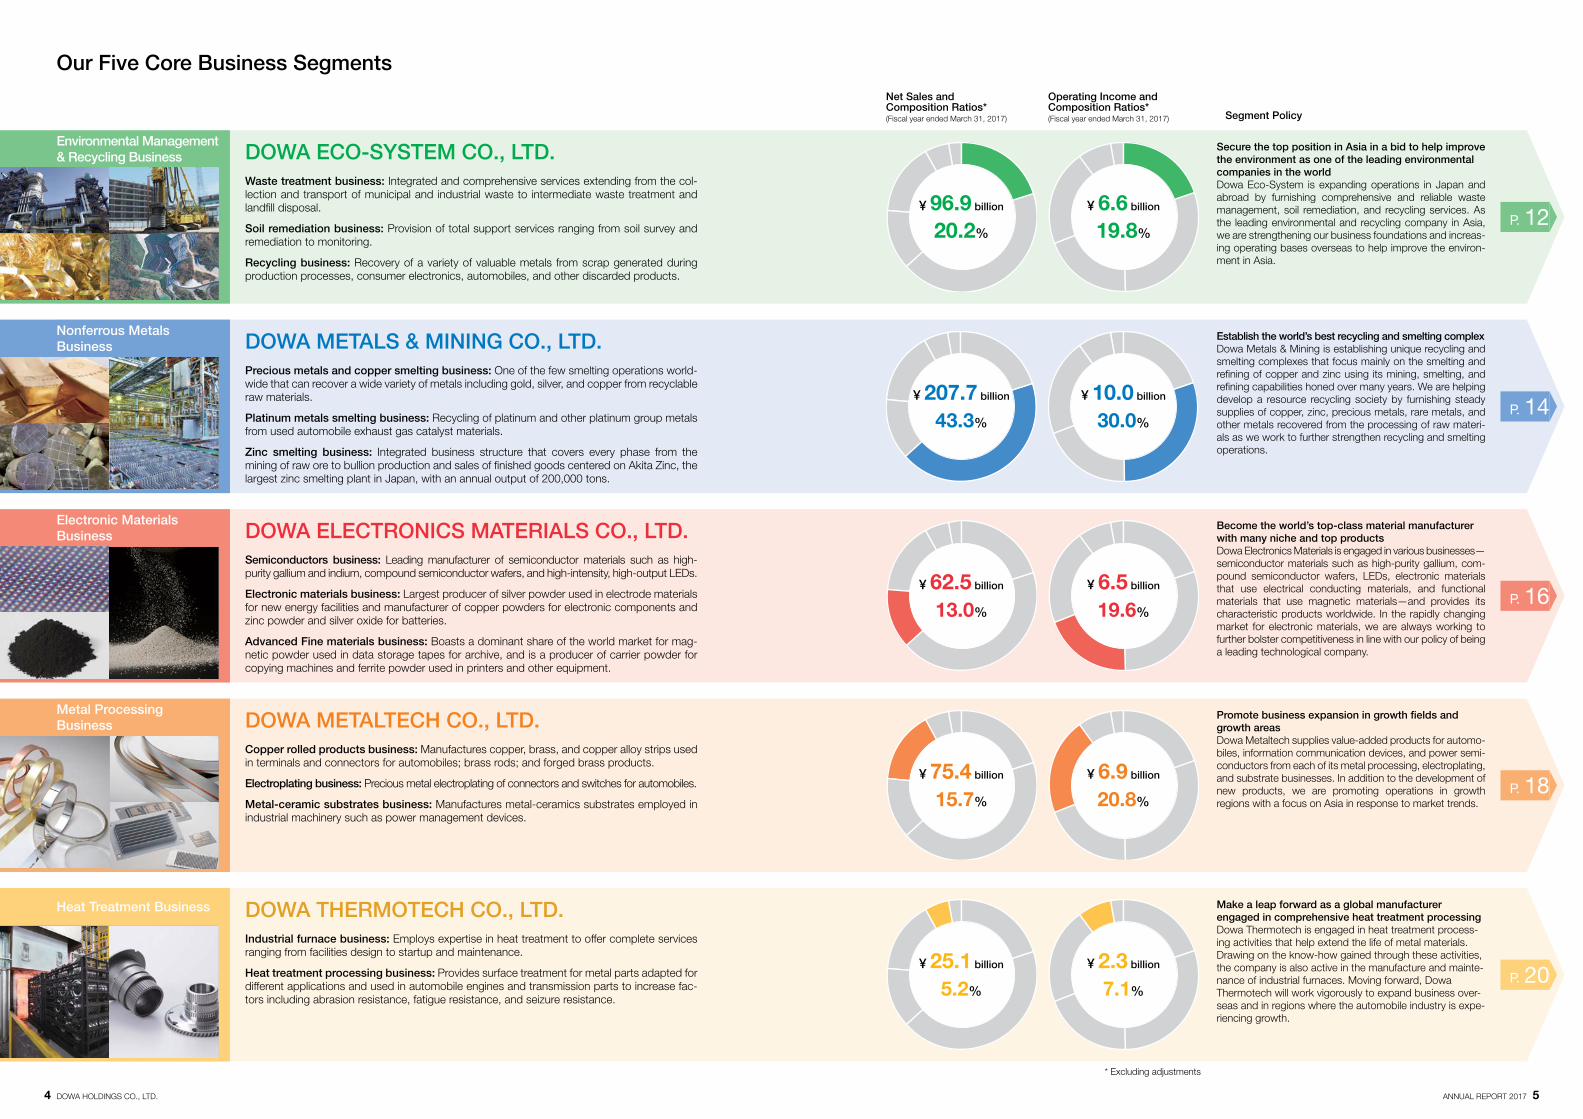
Our Five Core Business Segments
* Excluding adjustments
Environmental Management & Recycling Business
Nonferrous Metals Business
Heat Treatment Business
Metal Processing Business
Electronic Materials Business
Net Sales and Composition Ratios* (Fiscal year ended March 31, 2017)
Operating Income and Composition Ratios*(Fiscal year ended March 31, 2017) Segment Policy
Waste treatment business: Integrated and comprehensive services extending from the col-lection and transport of municipal and industrial waste to intermediate waste treatment and landfill disposal.
Soil remediation business: Provision of total support services ranging from soil survey and remediation to monitoring.
Recycling business: Recovery of a variety of valuable metals from scrap generated during production processes, consumer electronics, automobiles, and other discarded products.
Precious metals and copper smelting business: One of the few smelting operations world-wide that can recover a wide variety of metals including gold, silver, and copper from recyclable raw materials.
Platinum metals smelting business: Recycling of platinum and other platinum group metals from used automobile exhaust gas catalyst materials.
Zinc smelting business: Integrated business structure that covers every phase from the mining of raw ore to bullion production and sales of finished goods centered on Akita Zinc, the largest zinc smelting plant in Japan, with an annual output of 200,000 tons.
Industrial furnace business: Employs expertise in heat treatment to offer complete services ranging from facilities design to startup and maintenance.
Heat treatment processing business: Provides surface treatment for metal parts adapted for different applications and used in automobile engines and transmission parts to increase fac-tors including abrasion resistance, fatigue resistance, and seizure resistance.
Copper rolled products business: Manufactures copper, brass, and copper alloy strips used in terminals and connectors for automobiles; brass rods; and forged brass products.
Electroplating business: Precious metal electroplating of connectors and switches for automobiles.
Metal-ceramic substrates business: Manufactures metal-ceramics substrates employed in industrial machinery such as power management devices.
Semiconductors business: Leading manufacturer of semiconductor materials such as high-purity gallium and indium, compound semiconductor wafers, and high-intensity, high-output LEDs.
Electronic materials business: Largest producer of silver powder used in electrode materials for new energy facilities and manufacturer of copper powders for electronic components and zinc powder and silver oxide for batteries.
Advanced Fine materials business: Boasts a dominant share of the world market for mag-netic powder used in data storage tapes for archive, and is a producer of carrier powder for copying machines and ferrite powder used in printers and other equipment.
DOWA ECO-SYSTEM CO., LTD.
DOWA METALS & MINING CO., LTD.
DOWA THERMOTECH CO., LTD.
DOWA METALTECH CO., LTD.
DOWA ELECTRONICS MATERIALS CO., LTD.
Secure the top position in Asia in a bid to help improve the environment as one of the leading environmental companies in the worldDowa Eco-System is expanding operations in Japan and abroad by furnishing comprehensive and reliable waste management, soil remediation, and recycling services. As the leading environmental and recycling company in Asia, we are strengthening our business foundations and increas-ing operating bases overseas to help improve the environ-ment in Asia.
Establish the world’s best recycling and smelting complexDowa Metals & Mining is establishing unique recycling and smelting complexes that focus mainly on the smelting and refining of copper and zinc using its mining, smelting, and refining capabilities honed over many years. We are helping develop a resource recycling society by furnishing steady supplies of copper, zinc, precious metals, rare metals, and other metals recovered from the processing of raw materi-als as we work to further strengthen recycling and smelting operations.
Make a leap forward as a global manufacturer engaged in comprehensive heat treatment processing Dowa Thermotech is engaged in heat treatment process-ing activities that help extend the life of metal materials. Drawing on the know-how gained through these activities, the company is also active in the manufacture and mainte-nance of industrial furnaces. Moving forward, Dowa Thermotech will work vigorously to expand business over-seas and in regions where the automobile industry is expe-riencing growth.
Promote business expansion in growth fields and growth areasDowa Metaltech supplies value-added products for automo-biles, information communication devices, and power semi-conductors from each of its metal processing, electroplating, and substrate businesses. In addition to the development of new products, we are promoting operations in growth regions with a focus on Asia in response to market trends.
Become the world’s top-class material manufacturer with many niche and top productsDowa Electronics Materials is engaged in various businesses—semiconductor materials such as high-purity gallium, com-pound semiconductor wafers, LEDs, electronic materials that use electrical conducting materials, and functional materials that use magnetic materials—and provides its characteristic products worldwide. In the rapidly changing market for electronic materials, we are always working to further bolster competitiveness in line with our policy of being a leading technological company.
4 DOWA HOLDINGS CO., LTD. ANNUAL REPORT 2017 5
P. 12
P. 14
P. 16
P. 18
P. 20
¥ 6.6 billion
19.8%
¥ 10.0 billion
30.0%
¥ 6.5 billion
19.6%
¥ 6.9 billion
20.8%
¥ 2.3 billion
7.1%
¥ 96.9 billion
20.2%
¥ 207.7 billion
43.3%
¥ 62.5 billion
13.0%
¥ 75.4 billion
15.7%
¥ 25.1 billion
5.2%
Message from Management
Business Environment
The Japanese economy followed a gradual recovery track in fiscal 2016, the fiscal year ended March 31, 2017. While the global economy continued to expand at a moderate rate, there was also ongoing uncertainty due to geopolitical concerns in Europe, including in regard to the issue of the U.K.’s decision to leave the EU, as well as uncertainty over the direction of the new U.S. administration’s policies. Turning to the business environment in which the Dowa Group operates, demand for automotive-related products was relatively firm both in Japan and overseas. We also note that demand, particularly in East Asia, expanded for electronic components and new energy-related products. As for the commodities markets, prices for metals, including for zinc and precious metals, rose during the fiscal year under review. With regard to foreign exchange rates, the yen continued to appreciate through the second quarter of the fiscal year under review, although the trend shifted to yen depreciation thereafter.
Financial Performance in Fiscal 2016
Under the aforementioned circumstances, the Dowa Group continued in fiscal 2016 to push for-ward with a variety of measures in line with the basic policies of its Medium-Term Plan. This con-tributed to net sales improving 1% compared with the previous fiscal year, to ¥410.5 billion, while operating income dropped 3%, to ¥33.9 billion, ordinary income expanded 4%, to ¥36.5 billion, and net income attributable to owners of the parent increased 20%, to ¥26.1 billion.
Financial Condition
As of March 31, 2017, total equity increased ¥24.4 billion compared with the previous fiscal year, to ¥227.8 billion, as shareholders’ equity expanded ¥20.6 billion. This resulted in the equity ratio rising 0.7 percentage point compared with the end of the previous fiscal year, to 54.2%. The bal-ance of interest-bearing debt declined ¥1.2 billion compared with the previous fiscal year-end, to ¥79.8 billion.
Fiscal 2016 Initiatives
The Dowa Group is committed to fostering an expansion in each of its five distinctive business divisions, utilizing the overall strength of the Group to build a solid earnings structure that can with-stand changes in the operating environments of each of the mainstay businesses. We are also focused on stabilizing earnings by reducing the risk of losses due to fluctuations in metal prices or foreign exchange rates. From here, I would like to outline details of the initiatives undertaken in fiscal 2016 in line with the basic policies of our Medium-Term Plan: further expansion of overseas businesses, business expansion by entering growth markets and related fields, and continuous reinforcement of business competitiveness.
The Dowa Group will pursue further growth by expanding its operations in Asia and other emerging markets where growth is ongoing, continuing to invest in growth fields such as new energy and automobiles, and steadily carrying out policies directed at improving productivity and increasing orders.
Masao YamadaPresident and Representative Director
6 DOWA HOLDINGS CO., LTD. ANNUAL REPORT 2017 7
Fiscal 2017 Policies
Taking into consideration market trends throughout the fiscal year ending March 31, 2018, we will steadily implement the following policies.
Further Expansion of Overseas BusinessesIn the Environmental Management & Recycling business, we will focus on launching operations at the new incinerator in Singapore and constructing a new landfill disposal facility in Indonesia. In the Nonferrous Metals business, we will continue to expand the collection of used catalyst converters from overseas. In the Metal Processing business, we intend to promote an increase in sales of copper rolled products in Asia using our facilities in China, Thailand, and Taiwan. We will also promote the further strengthening of our global supply system in line with the launch of the new precious metal electroplating plant in Mexico. In the Heat Treatment business, we aim to launch new factories in India and expand orders from regional clients.
Business Expansion by Entering Growth Markets and Related FieldsIn the automotive field, we will work to boost the number of facilities so as to increase production of metal-ceramics substrates for automotive inverters. We are also working to develop and expand sales of high-performance copper alloys used in connectors. In the information and com-munications field, we are focused on promoting sales of high-strength copper alloys that are compatible with parts that are necessarily smaller and thinner as smartphones become more sophisticated. We will also work to expand sample work in new conductive materials for use in touch panels. In the new energy field, we will continue to work toward the swift commercialization of new products, including electrode materials for fuel cells. In addition, the Company will endeavor to roll out initiatives in peripheral business fields by expanding municipal waste treat-ment activities in the Environmental Management & Recycling business and promoting business growth in the Metal Processing business in Asia.
Continuous Reinforcement of Business CompetitivenessIn the Environmental Management & Recycling business, we will strengthen the processing capacity at low-contaminated PCB waste facilities. In the Nonferrous Metals business, we will pursue new construction and replacement of vital facilities. We will also focus on securing a stable supply of raw materials for our smelters, including through the launch of construction at mines in Mexico and ongoing exploration in Alaska. In the Electronic Materials business, we will expand capacity and production of silver powder while capturing firm new energy demand. In the Metal Processing business, we will work to improve productivity in high-performance copper alloys featuring advanced properties, such as heat resistance, conductivity, and strength, as we target enhanced sales in electronic components used in smartphones and automobiles. In the Heat Treatment business, we will work to improve sales of industrial furnaces and bolster domestic processing capacity to meet increasing demand.
By steadily implementing these policies, the Dowa Group intends to achieve continued growth.
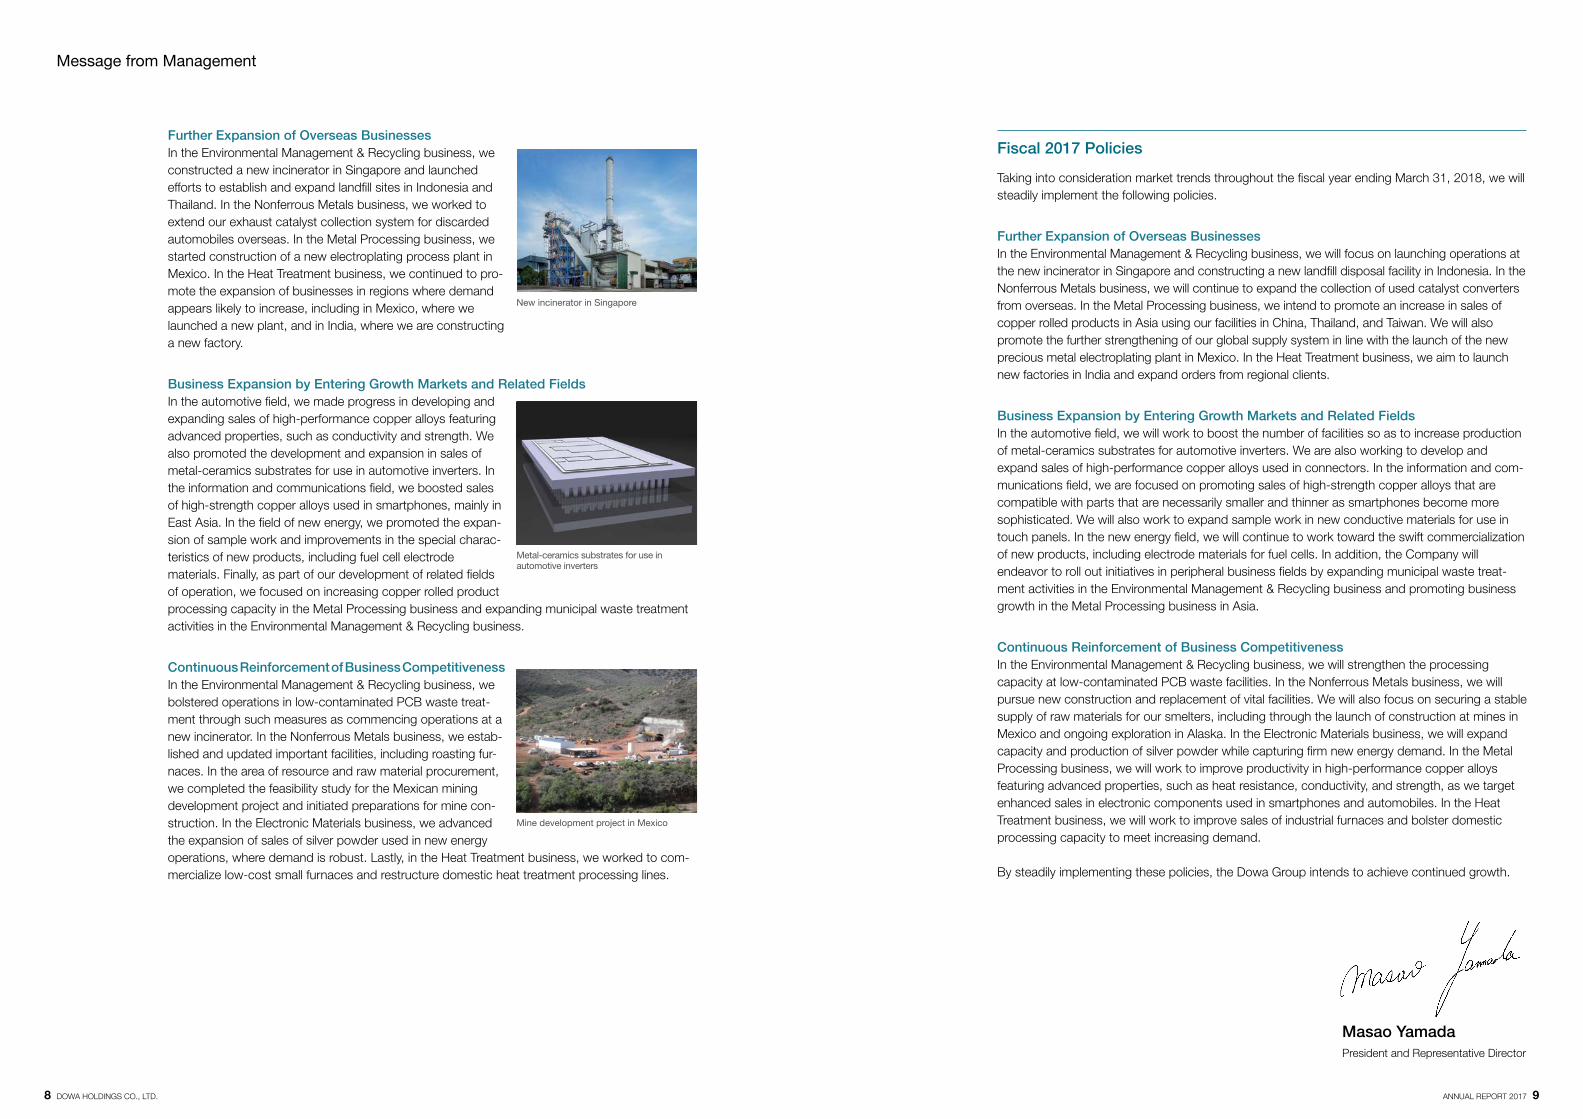
Further Expansion of Overseas BusinessesIn the Environmental Management & Recycling business, we constructed a new incinerator in Singapore and launched efforts to establish and expand landfill sites in Indonesia and Thailand. In the Nonferrous Metals business, we worked to extend our exhaust catalyst collection system for discarded automobiles overseas. In the Metal Processing business, we started construction of a new electroplating process plant in Mexico. In the Heat Treatment business, we continued to pro-mote the expansion of businesses in regions where demand appears likely to increase, including in Mexico, where we launched a new plant, and in India, where we are constructing a new factory.
Business Expansion by Entering Growth Markets and Related FieldsIn the automotive field, we made progress in developing and expanding sales of high-performance copper alloys featuring advanced properties, such as conductivity and strength. We also promoted the development and expansion in sales of metal-ceramics substrates for use in automotive inverters. In the information and communications field, we boosted sales of high-strength copper alloys used in smartphones, mainly in East Asia. In the field of new energy, we promoted the expan-sion of sample work and improvements in the special charac-teristics of new products, including fuel cell electrode materials. Finally, as part of our development of related fields of operation, we focused on increasing copper rolled product processing capacity in the Metal Processing business and expanding municipal waste treatment activities in the Environmental Management & Recycling business.
Continuous Reinforcement of Business CompetitivenessIn the Environmental Management & Recycling business, we bolstered operations in low-contaminated PCB waste treat-ment through such measures as commencing operations at a new incinerator. In the Nonferrous Metals business, we estab-lished and updated important facilities, including roasting fur-naces. In the area of resource and raw material procurement, we completed the feasibility study for the Mexican mining development project and initiated preparations for mine con-struction. In the Electronic Materials business, we advanced the expansion of sales of silver powder used in new energy operations, where demand is robust. Lastly, in the Heat Treatment business, we worked to com-mercialize low-cost small furnaces and restructure domestic heat treatment processing lines.
Message from Management
New incinerator in Singapore
Metal-ceramics substrates for use in automotive inverters
Mine development project in Mexico
Masao YamadaPresident and Representative Director
8 DOWA HOLDINGS CO., LTD. ANNUAL REPORT 2017 9
13 14 15 16 17
410.5406.5
464.2443.9
419.3
33.935.0
39.0
31.7
24.5
13 14 15 16 17
404.6
349.7 358.7
9.49
364.4
9.43
379.1
11.39
8.15
9.90
13 14 15 16 17
36.535.0
42.0
27.2
35.0
13 14 15 16 17
29.3
45.7
38.3
30.1
34.9
13 14 15 16 17
38.19
227.8
142.4
166.9
54.20
203.3
53.49
195.6
49.3544.12
13 14 15 16 17
26.1
21.8
26.5
15.2
23.3
13 14 15 16 17
79.8
107.199.6
0.36
81.1
0.42
86.6
0.46
0.80
0.63
13 14 15 16 17
26.5
15.7
22.9
15.117.2
15.516.9
18.416.516.2
13 14 15 16 17
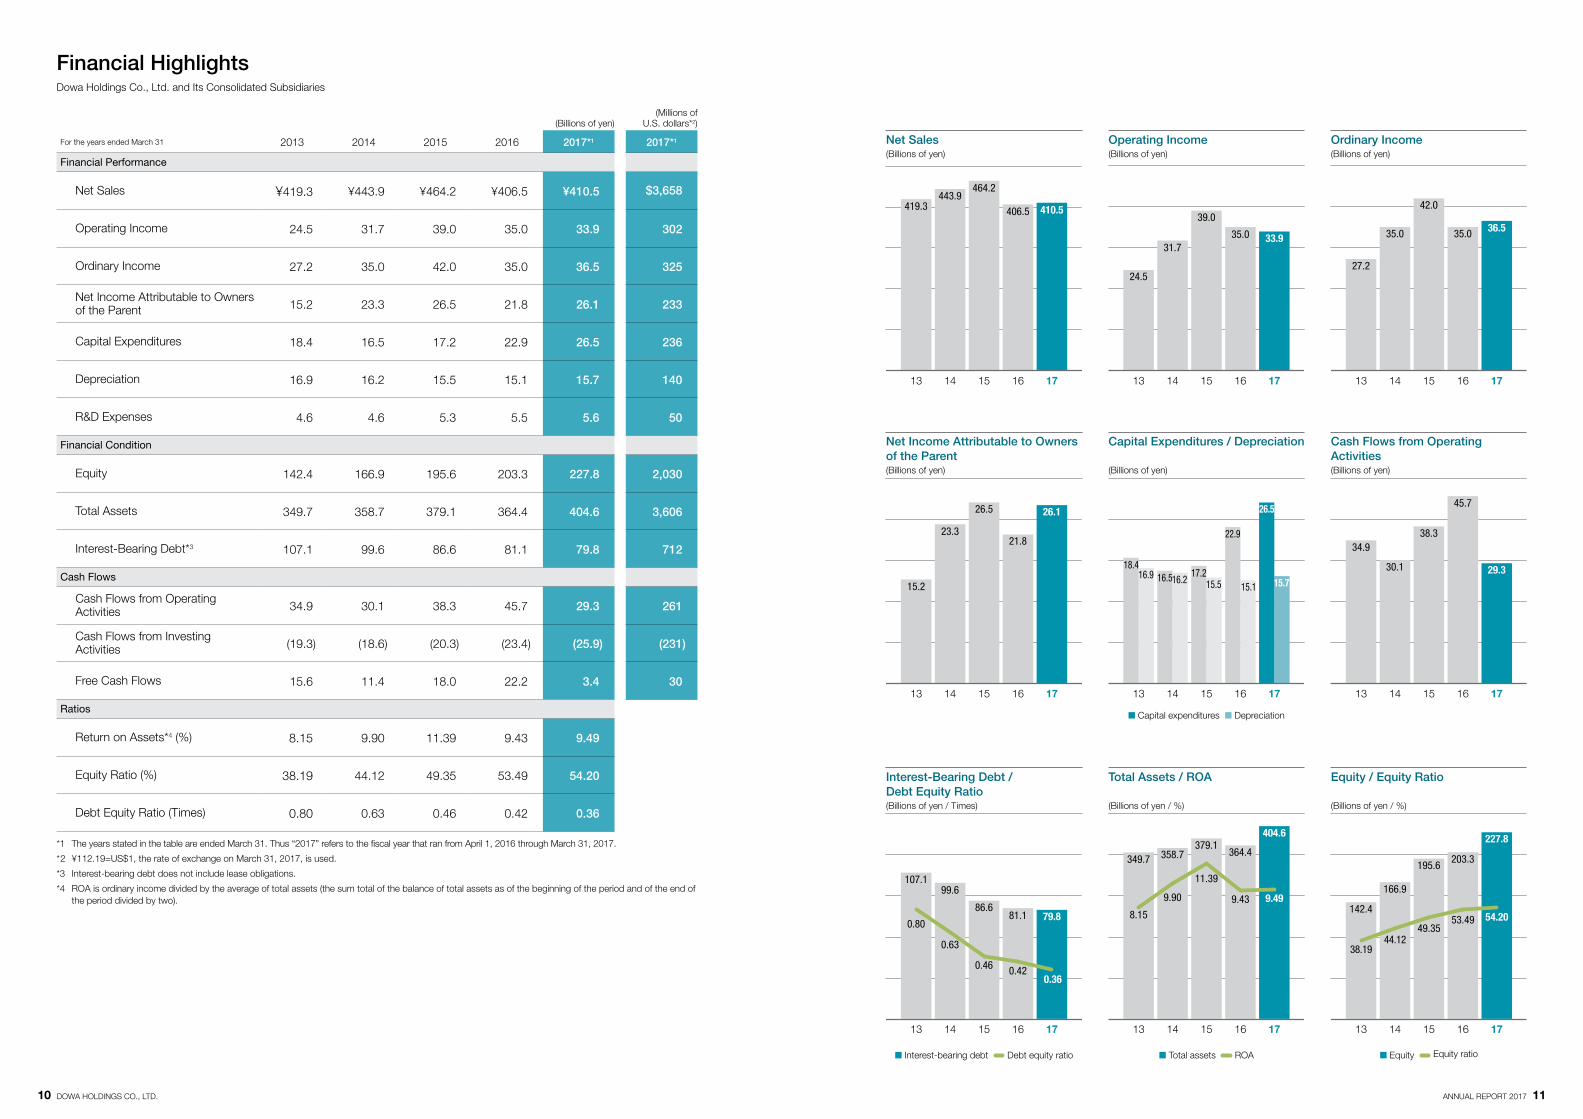
Financial HighlightsDowa Holdings Co., Ltd. and Its Consolidated Subsidiaries
(Millions of U.S. dollars*2)(Billions of yen)
Net Sales(Billions of yen)
Operating Income(Billions of yen)
Ordinary Income(Billions of yen)
Total Assets / ROA
(Billions of yen / %)
Capital Expenditures / Depreciation
(Billions of yen)
Cash Flows from Operating Activities(Billions of yen)
Equity / Equity Ratio
(Billions of yen / %)
Net Income Attributable to Owners of the Parent(Billions of yen)
Interest-Bearing Debt / Debt Equity Ratio(Billions of yen / Times)
■ Capital expenditures ■ Depreciation
■ Equity Equity ratio■ Interest-bearing debt Debt equity ratio ■ Total assets ROA
10 DOWA HOLDINGS CO., LTD. ANNUAL REPORT 2017 11
For the years ended March 31 2013 2014 2015 2016 2017*1 2017*1
Financial Performance
Net Sales ¥419.3 ¥443.9 ¥464.2 ¥406.5 ¥410.5 $3,658
Operating Income 24.5 31.7 39.0 35.0 33.9 302
Ordinary Income 27.2 35.0 42.0 35.0 36.5 325
Net Income Attributable to Owners of the Parent 15.2 23.3 26.5 21.8 26.1 233
Capital Expenditures 18.4 16.5 17.2 22.9 26.5 236
Depreciation 16.9 16.2 15.5 15.1 15.7 140
R&D Expenses 4.6 4.6 5.3 5.5 5.6 50
Financial Condition
Equity 142.4 166.9 195.6 203.3 227.8 2,030
Total Assets 349.7 358.7 379.1 364.4 404.6 3,606
Interest-Bearing Debt*3 107.1 99.6 86.6 81.1 79.8 712
Cash Flows
Cash Flows from Operating Activities 34.9 30.1 38.3 45.7 29.3 261
Cash Flows from Investing Activities (19.3) (18.6) (20.3) (23.4) (25.9) (231)
Free Cash Flows 15.6 11.4 18.0 22.2 3.4 30
Ratios
Return on Assets*4 (%) 8.15 9.90 11.39 9.43 9.49
Equity Ratio (%) 38.19 44.12 49.35 53.49 54.20
Debt Equity Ratio (Times) 0.80 0.63 0.46 0.42 0.36
*1 The years stated in the table are ended March 31. Thus “2017” refers to the fiscal year that ran from April 1, 2016 through March 31, 2017.
* 2 ¥112.19=US$1, the rate of exchange on March 31, 2017, is used.
*3 Interest-bearing debt does not include lease obligations.
*4 ROA is ordinary income divided by the average of total assets (the sum total of the balance of total assets as of the beginning of the period and of the end of the period divided by two).
Waste Treatment Soil Remediation Recycling
Main Products and Services
Waste treatment, landfill disposal, soil remediation, metal recycling, household appliance recycling, automobile recycling, consulting on environmental matters, and logistics
Environmental Management & Recycling
DOWA ECO-SYSTEM CO., LTD.
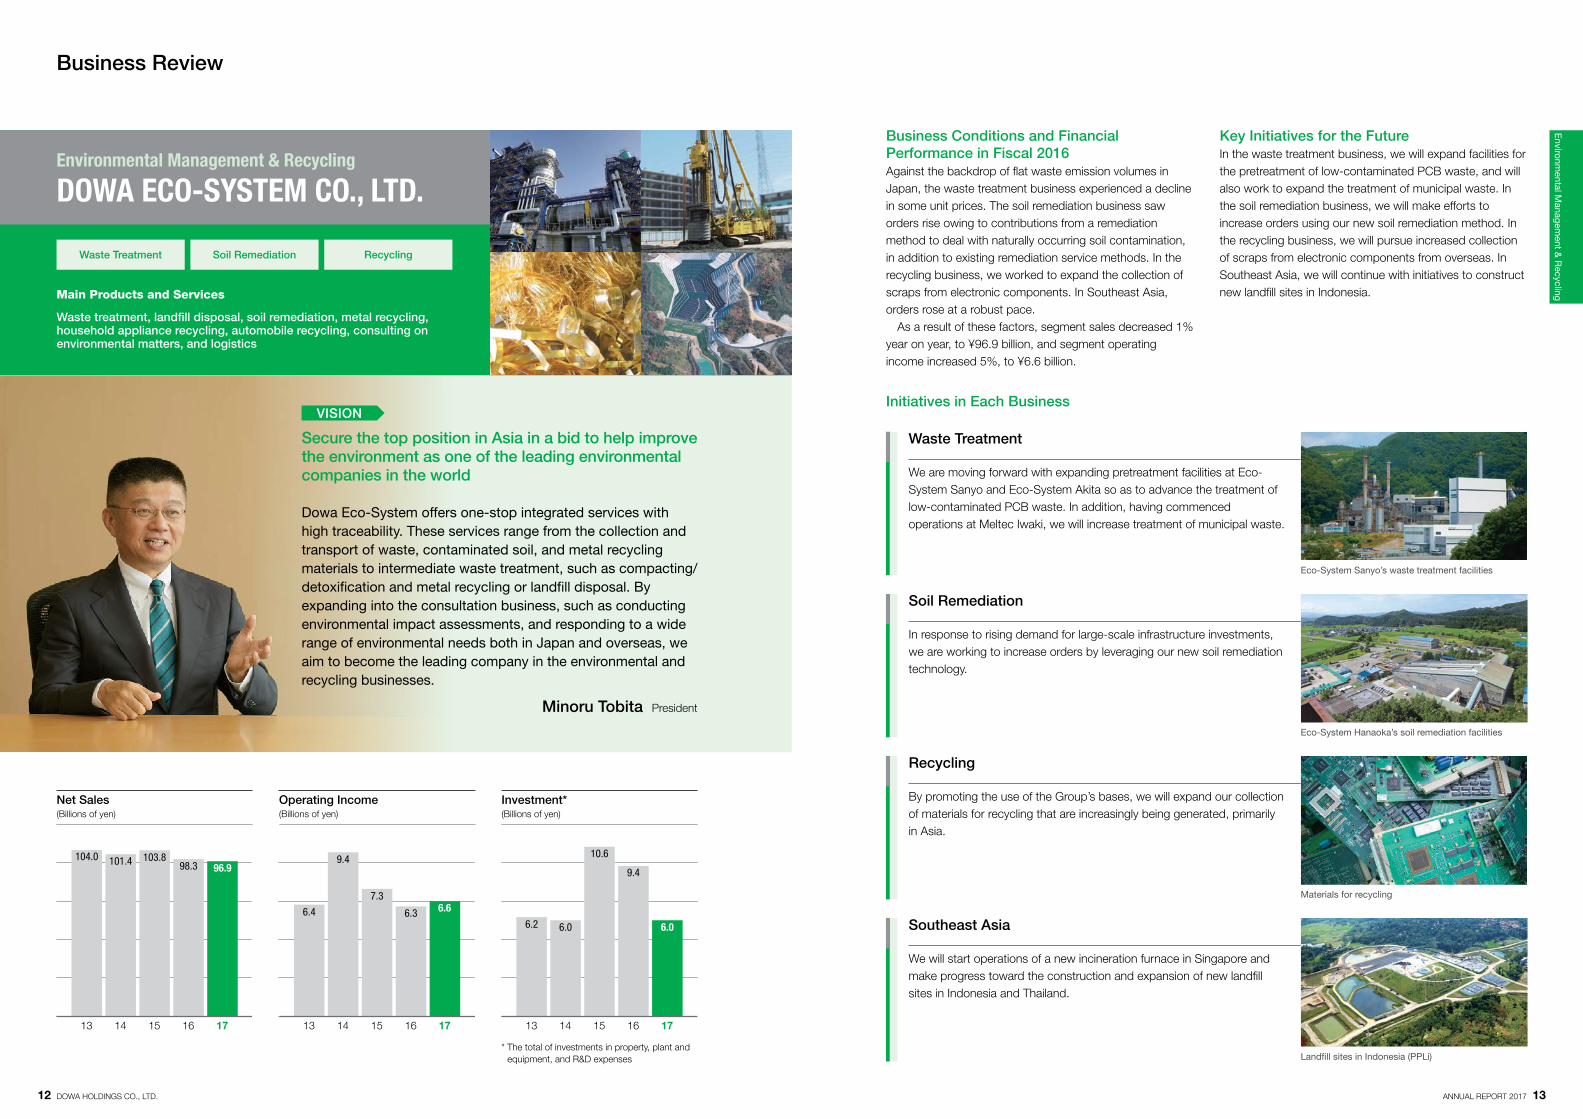
Business Conditions and Financial Performance in Fiscal 2016Against the backdrop of flat waste emission volumes in Japan, the waste treatment business experienced a decline in some unit prices. The soil remediation business saw orders rise owing to contributions from a remediation method to deal with naturally occurring soil contamination, in addition to existing remediation service methods. In the recycling business, we worked to expand the collection of scraps from electronic components. In Southeast Asia, orders rose at a robust pace. As a result of these factors, segment sales decreased 1% year on year, to ¥96.9 billion, and segment operating income increased 5%, to ¥6.6 billion.
Key Initiatives for the FutureIn the waste treatment business, we will expand facilities for the pretreatment of low-contaminated PCB waste, and will also work to expand the treatment of municipal waste. In the soil remediation business, we will make efforts to increase orders using our new soil remediation method. In the recycling business, we will pursue increased collection of scraps from electronic components from overseas. In Southeast Asia, we will continue with initiatives to construct new landfill sites in Indonesia.
Initiatives in Each Business
Business Review
Net Sales(Billions of yen)
Operating Income(Billions of yen)
Investment*(Billions of yen)
* The total of investments in property, plant and equipment, and R&D expenses
104.096.9
101.4 98.3103.8
13 14 15 16 17
6.4 6.6
9.4
6.3
7.3
13 14 15 16 17
6.2 6.0 6.0
9.4
10.6
13 14 15 16 17
Waste Treatment
We are moving forward with expanding pretreatment facilities at Eco-System Sanyo and Eco-System Akita so as to advance the treatment of low-contaminated PCB waste. In addition, having commenced operations at Meltec Iwaki, we will increase treatment of municipal waste.
Recycling
By promoting the use of the Group’s bases, we will expand our collection of materials for recycling that are increasingly being generated, primarily in Asia.
Soil Remediation
In response to rising demand for large-scale infrastructure investments, we are working to increase orders by leveraging our new soil remediation technology.
Southeast Asia
We will start operations of a new incineration furnace in Singapore and make progress toward the construction and expansion of new landfill sites in Indonesia and Thailand.
Eco-System Sanyo’s waste treatment facilities
Eco-System Hanaoka’s soil remediation facilities
Landfill sites in Indonesia (PPLi)
Materials for recycling
Secure the top position in Asia in a bid to help improve the environment as one of the leading environmental companies in the world
VISION
Minoru Tobita President
Dowa Eco-System offers one-stop integrated services with high traceability. These services range from the collection and transport of waste, contaminated soil, and metal recycling materials to intermediate waste treatment, such as compacting/detoxification and metal recycling or landfill disposal. By expanding into the consultation business, such as conducting environmental impact assessments, and responding to a wide range of environmental needs both in Japan and overseas, we aim to become the leading company in the environmental and recycling businesses.
Environm
ental Managem
ent & R
ecycling
12 DOWA HOLDINGS CO., LTD. ANNUAL REPORT 2017 13
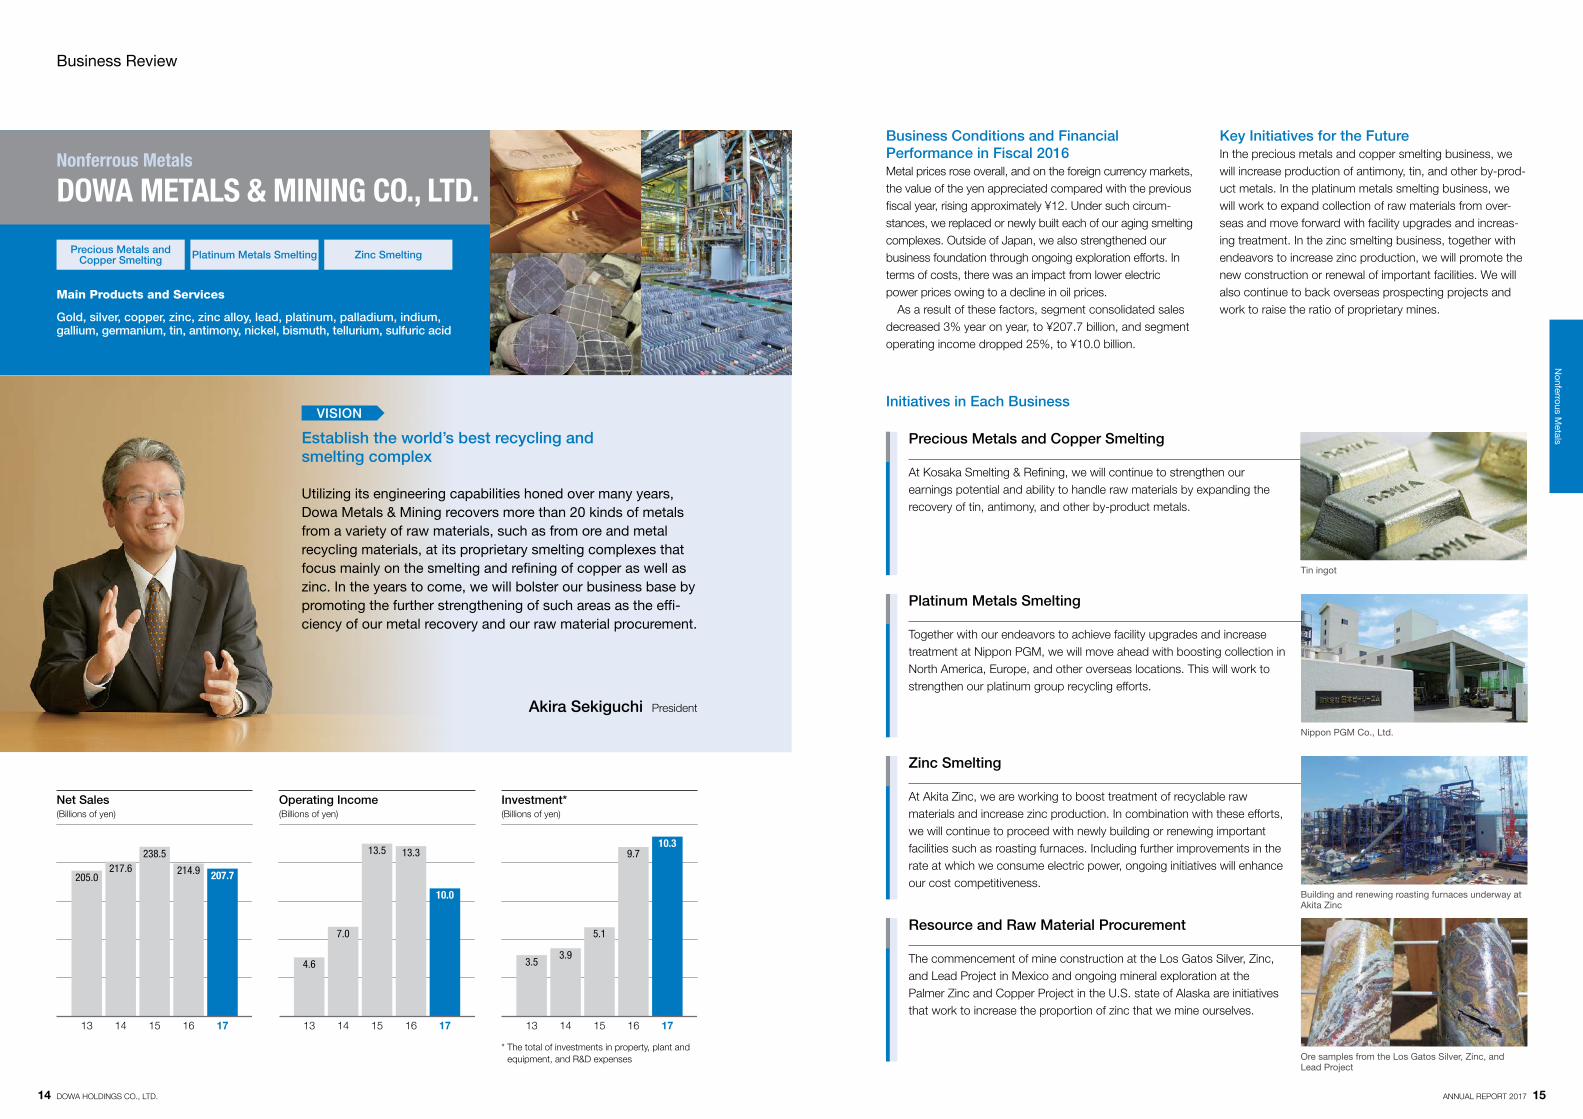
Business Conditions and Financial Performance in Fiscal 2016Metal prices rose overall, and on the foreign currency markets, the value of the yen appreciated compared with the previous fiscal year, rising approximately ¥12. Under such circum-stances, we replaced or newly built each of our aging smelting complexes. Outside of Japan, we also strengthened our business foundation through ongoing exploration efforts. In terms of costs, there was an impact from lower electric power prices owing to a decline in oil prices. As a result of these factors, segment consolidated sales decreased 3% year on year, to ¥207.7 billion, and segment operating income dropped 25%, to ¥10.0 billion.
Key Initiatives for the FutureIn the precious metals and copper smelting business, we will increase production of antimony, tin, and other by-prod-uct metals. In the platinum metals smelting business, we will work to expand collection of raw materials from over-seas and move forward with facility upgrades and increas-ing treatment. In the zinc smelting business, together with endeavors to increase zinc production, we will promote the new construction or renewal of important facilities. We will also continue to back overseas prospecting projects and work to raise the ratio of proprietary mines.
Precious Metals and Copper Smelting
At Kosaka Smelting & Refining, we will continue to strengthen our earnings potential and ability to handle raw materials by expanding the recovery of tin, antimony, and other by-product metals.
Platinum Metals Smelting
Together with our endeavors to achieve facility upgrades and increase treatment at Nippon PGM, we will move ahead with boosting collection in North America, Europe, and other overseas locations. This will work to strengthen our platinum group recycling efforts.
Zinc Smelting
At Akita Zinc, we are working to boost treatment of recyclable raw materials and increase zinc production. In combination with these efforts, we will continue to proceed with newly building or renewing important facilities such as roasting furnaces. Including further improvements in the rate at which we consume electric power, ongoing initiatives will enhance our cost competitiveness.
Resource and Raw Material Procurement
The commencement of mine construction at the Los Gatos Silver, Zinc, and Lead Project in Mexico and ongoing mineral exploration at the Palmer Zinc and Copper Project in the U.S. state of Alaska are initiatives that work to increase the proportion of zinc that we mine ourselves.
Business Review
Building and renewing roasting furnaces underway at Akita Zinc
Ore samples from the Los Gatos Silver, Zinc, and Lead Project
Tin ingot
Nippon PGM Co., Ltd.
13 14 15 16 17
1,776
205.0217.6
207.7214.9
238.5
4.6
7.0
10.0
13.313.5
13 14 15 16 17
3.53.9
10.39.7
5.1
13 14 15 16 17
Precious Metals and Copper Smelting Platinum Metals Smelting Zinc Smelting
Initiatives in Each Business
Main Products and Services
Gold, silver, copper, zinc, zinc alloy, lead, platinum, palladium, indium, gallium, germanium, tin, antimony, nickel, bismuth, tellurium, sulfuric acid
Nonferrous Metals
DOWA METALS & MINING CO., LTD.
Utilizing its engineering capabilities honed over many years, Dowa Metals & Mining recovers more than 20 kinds of metals from a variety of raw materials, such as from ore and metal recycling materials, at its proprietary smelting complexes that focus mainly on the smelting and refining of copper as well as zinc. In the years to come, we will bolster our business base by promoting the further strengthening of such areas as the effi-ciency of our metal recovery and our raw material procurement.
Establish the world’s best recycling and smelting complex
Akira Sekiguchi President
VISION
Net Sales(Billions of yen)
Operating Income(Billions of yen)
Investment*(Billions of yen)
* The total of investments in property, plant and equipment, and R&D expenses
Nonferrous M
etals
14 DOWA HOLDINGS CO., LTD. ANNUAL REPORT 2017 15
Business Conditions and Financial Performance in Fiscal 2016In the semiconductors business, there was a drop in sales volumes on account of demand for smartphones becoming sluggish. In the electronic materials business, demand grew for silver powder to be used in new energy and sales increased. The advanced fine materials business worked to expand sales of magnetic powder for data storage tapes used in data archive. We also made progress in the devel-opment of new products to meet market needs. As a result of these factors, segment consolidated sales rose 29% year on year, to ¥62.5 billion, and segment oper-ating income decreased 18%, to ¥6.5 billion.
Key Initiatives for the FutureIn the semiconductors business, we will pursue the devel-opment and sales of new products for the entire range of sensors. In the electronic materials business, we will work to expand facilities and increase production of silver powder to capitalize on brisk demand. In the advanced fine materi-als business, we will endeavor to expand sales and improve the properties of magnetic powder for data storage tapes. In our efforts for new development, we will seek the early commercialization of deep ultraviolet LEDs for medical equipment and of electrode materials for fuel cells.
Semiconductors
We will seek to develop and expand sales of new products such as high-output LEDs for the full range of sensors used in smartphones, in which they are anticipated to be increasingly equipped. We will also work to improve the properties of deep ultraviolet LEDs for medical equipment.
Electronic Materials
We will pursue facility expansion and increased production in line with demand for silver powder used in new energy, as the market for this continues to grow. In this way, we will work to leverage robust demand. In addition, we will seek to accelerate the development of new conducting materials and expand the lineup of such products.
Advanced Fine Materials
In magnetic powders for data storage tapes used by archives, we will endeavor to improve properties and expand sales. For fuel cells as well, as they are expected to see future growth in demand, we will strive to expand sample work of electrode materials.
Business Review
Magnetic powder
Deep ultraviolet LEDs
Silver powder
71.3
62.5
83.2
48.3
73.6
13 14 15 16 17
5.7
6.56.7
8.0
8.8
13 14 15 16 17
6.5
5.8
7.06.8
4.8
13 14 15 16 17
Semiconductors Electronic Materials Advanced Fine Materials
Initiatives in Each Business
Main Products and Services
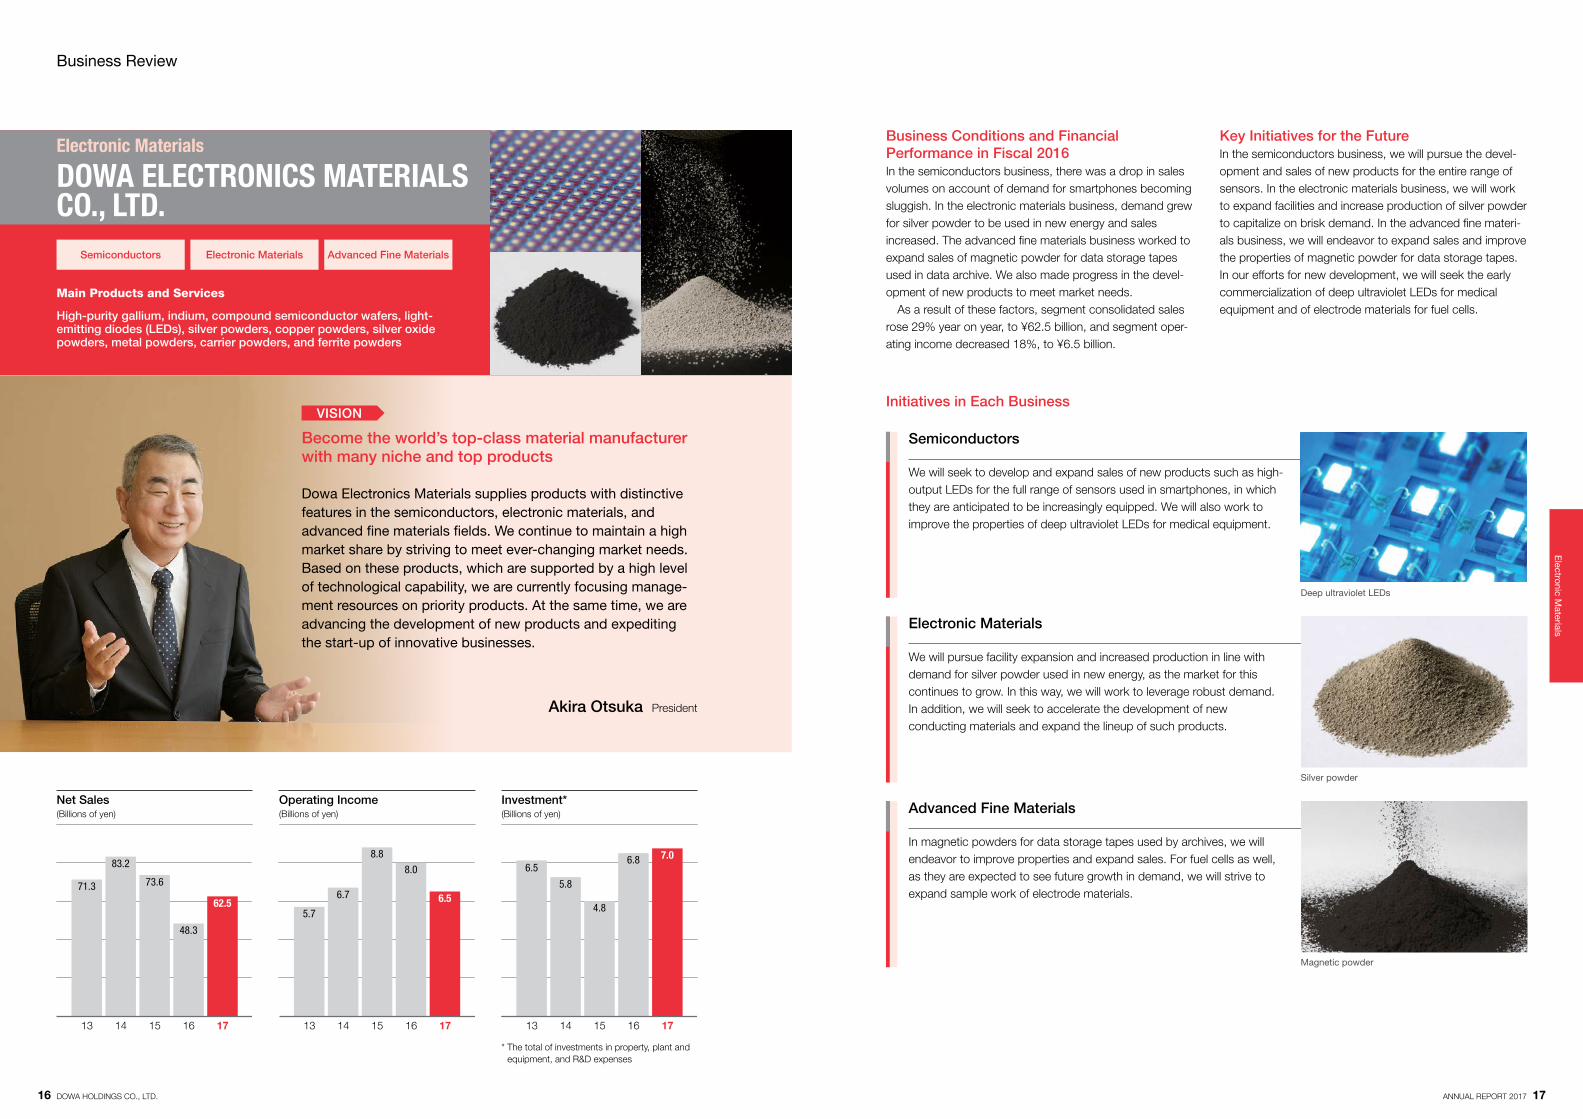
High-purity gallium, indium, compound semiconductor wafers, light-emitting diodes (LEDs), silver powders, copper powders, silver oxide powders, metal powders, carrier powders, and ferrite powders
Electronic Materials
DOWA ELECTRONICS MATERIALS CO., LTD.
Dowa Electronics Materials supplies products with distinctive features in the semiconductors, electronic materials, and advanced fine materials fields. We continue to maintain a high market share by striving to meet ever-changing market needs. Based on these products, which are supported by a high level of technological capability, we are currently focusing manage-ment resources on priority products. At the same time, we are advancing the development of new products and expediting the start-up of innovative businesses.
Become the world’s top-class material manufacturer with many niche and top products
VISION
Akira Otsuka President
Net Sales(Billions of yen)
Operating Income(Billions of yen)
Investment*(Billions of yen)
* The total of investments in property, plant and equipment, and R&D expenses
Electronic M
aterials
16 DOWA HOLDINGS CO., LTD. ANNUAL REPORT 2017 17
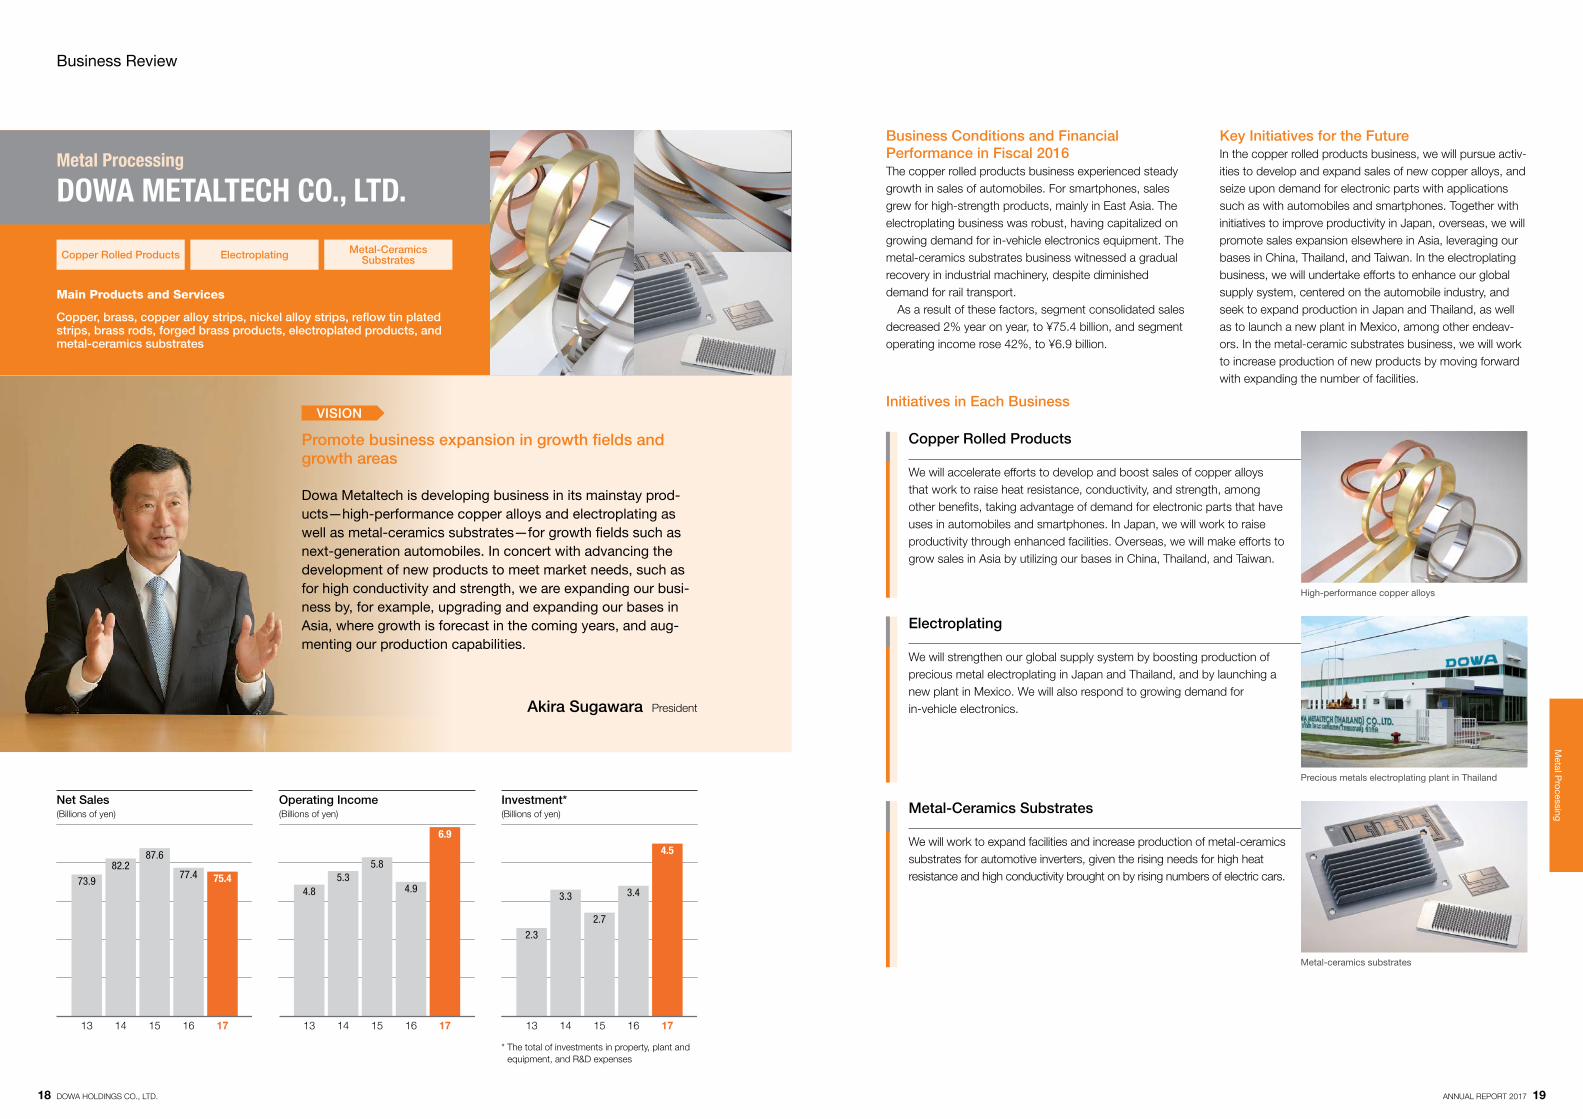
Copper, brass, copper alloy strips, nickel alloy strips, reflow tin plated strips, brass rods, forged brass products, electroplated products, and metal-ceramics substrates
Metal Processing
DOWA METALTECH CO., LTD.
Business Conditions and Financial Performance in Fiscal 2016The copper rolled products business experienced steady growth in sales of automobiles. For smartphones, sales grew for high-strength products, mainly in East Asia. The electroplating business was robust, having capitalized on growing demand for in-vehicle electronics equipment. The metal-ceramics substrates business witnessed a gradual recovery in industrial machinery, despite diminished demand for rail transport. As a result of these factors, segment consolidated sales decreased 2% year on year, to ¥75.4 billion, and segment operating income rose 42%, to ¥6.9 billion.
Key Initiatives for the FutureIn the copper rolled products business, we will pursue activ-ities to develop and expand sales of new copper alloys, and seize upon demand for electronic parts with applications such as with automobiles and smartphones. Together with initiatives to improve productivity in Japan, overseas, we will promote sales expansion elsewhere in Asia, leveraging our bases in China, Thailand, and Taiwan. In the electroplating business, we will undertake efforts to enhance our global supply system, centered on the automobile industry, and seek to expand production in Japan and Thailand, as well as to launch a new plant in Mexico, among other endeav-ors. In the metal-ceramic substrates business, we will work to increase production of new products by moving forward with expanding the number of facilities.
Copper Rolled Products
We will accelerate efforts to develop and boost sales of copper alloys that work to raise heat resistance, conductivity, and strength, among other benefits, taking advantage of demand for electronic parts that have uses in automobiles and smartphones. In Japan, we will work to raise productivity through enhanced facilities. Overseas, we will make efforts to grow sales in Asia by utilizing our bases in China, Thailand, and Taiwan.
Electroplating
We will strengthen our global supply system by boosting production of precious metal electroplating in Japan and Thailand, and by launching a new plant in Mexico. We will also respond to growing demand for in-vehicle electronics.
Metal-Ceramics Substrates
We will work to expand facilities and increase production of metal-ceramics substrates for automotive inverters, given the rising needs for high heat resistance and high conductivity brought on by rising numbers of electric cars.
Business Review
Metal-ceramics substrates
High-performance copper alloys
Precious metals electroplating plant in Thailand
13 14 15 16 17
73.9 75.482.2
77.4
87.6
4.8
6.9
5.34.9
5.8
13 14 15 16 17
2.3
3.3
4.5
3.4
2.7
13 14 15 16 17
Copper Rolled Products Electroplating Metal-Ceramics Substrates
Initiatives in Each Business
Main Products and Services
Dowa Metaltech is developing business in its mainstay prod-ucts—high-performance copper alloys and electroplating as well as metal-ceramics substrates—for growth fields such as next-generation automobiles. In concert with advancing the development of new products to meet market needs, such as for high conductivity and strength, we are expanding our busi-ness by, for example, upgrading and expanding our bases in Asia, where growth is forecast in the coming years, and aug-menting our production capabilities.
Promote business expansion in growth fields and growth areas
VISION
Akira Sugawara President
Net Sales(Billions of yen)
Operating Income(Billions of yen)
Investment*(Billions of yen)
* The total of investments in property, plant and equipment, and R&D expenses
Metal P
rocessing
18 DOWA HOLDINGS CO., LTD. ANNUAL REPORT 2017 19
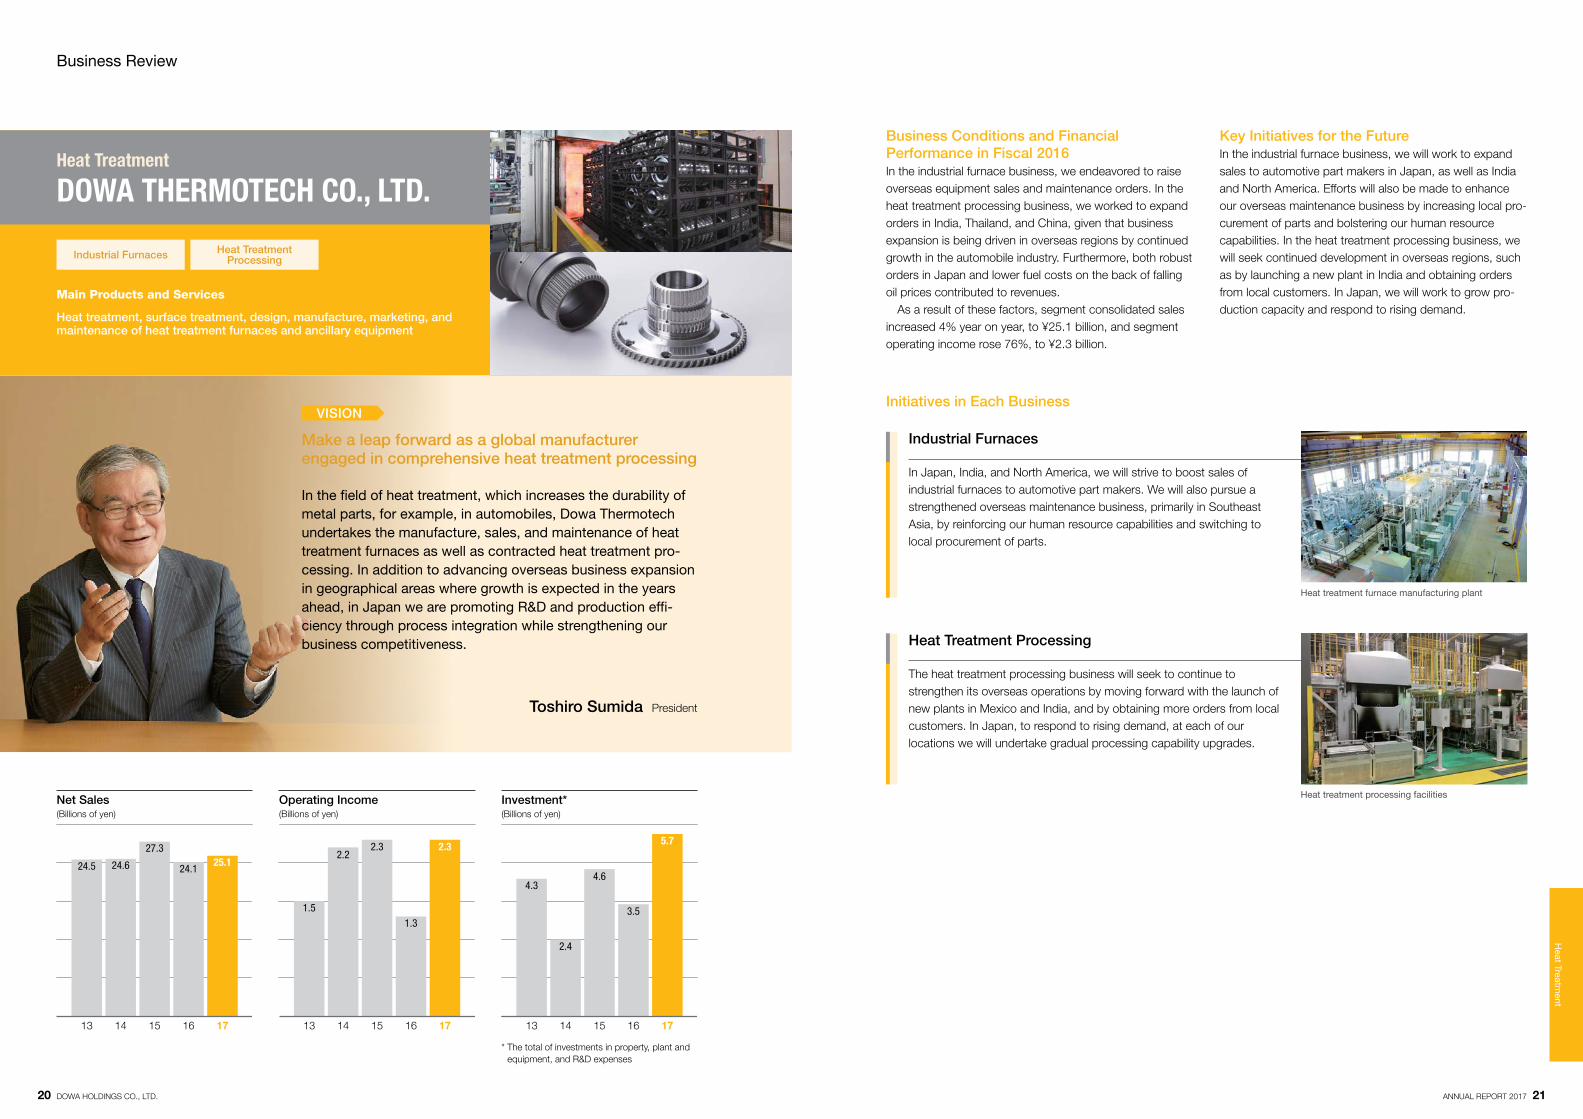
Heat treatment, surface treatment, design, manufacture, marketing, and maintenance of heat treatment furnaces and ancillary equipment
Heat Treatment
DOWA THERMOTECH CO., LTD.
Business Conditions and Financial Performance in Fiscal 2016In the industrial furnace business, we endeavored to raise overseas equipment sales and maintenance orders. In the heat treatment processing business, we worked to expand orders in India, Thailand, and China, given that business expansion is being driven in overseas regions by continued growth in the automobile industry. Furthermore, both robust orders in Japan and lower fuel costs on the back of falling oil prices contributed to revenues. As a result of these factors, segment consolidated sales increased 4% year on year, to ¥25.1 billion, and segment operating income rose 76%, to ¥2.3 billion.
Key Initiatives for the FutureIn the industrial furnace business, we will work to expand sales to automotive part makers in Japan, as well as India and North America. Efforts will also be made to enhance our overseas maintenance business by increasing local pro-curement of parts and bolstering our human resource capabilities. In the heat treatment processing business, we will seek continued development in overseas regions, such as by launching a new plant in India and obtaining orders from local customers. In Japan, we will work to grow pro-duction capacity and respond to rising demand.
Industrial Furnaces
In Japan, India, and North America, we will strive to boost sales of industrial furnaces to automotive part makers. We will also pursue a strengthened overseas maintenance business, primarily in Southeast Asia, by reinforcing our human resource capabilities and switching to local procurement of parts.
Heat Treatment Processing
The heat treatment processing business will seek to continue to strengthen its overseas operations by moving forward with the launch of new plants in Mexico and India, and by obtaining more orders from local customers. In Japan, to respond to rising demand, at each of our locations we will undertake gradual processing capability upgrades.
Business Review
Heat treatment furnace manufacturing plant
Heat treatment processing facilities
13 14 15 16 17
24.5 25.124.6 24.1
27.3
1.5
2.32.2
1.3
2.3
13 14 15 16 17
4.3
2.4
5.7
3.5
4.6
13 14 15 16 17
Industrial Furnaces Heat Treatment Processing
Initiatives in Each Business
Main Products and Services
In the field of heat treatment, which increases the durability of metal parts, for example, in automobiles, Dowa Thermotech undertakes the manufacture, sales, and maintenance of heat treatment furnaces as well as contracted heat treatment pro-cessing. In addition to advancing overseas business expansion in geographical areas where growth is expected in the years ahead, in Japan we are promoting R&D and production effi-ciency through process integration while strengthening our business competitiveness.
Make a leap forward as a global manufacturer engaged in comprehensive heat treatment processing
VISION
Toshiro Sumida President
Net Sales(Billions of yen)
Operating Income(Billions of yen)
Investment*(Billions of yen)
* The total of investments in property, plant and equipment, and R&D expenses
Heat Treatm
ent
20 DOWA HOLDINGS CO., LTD. ANNUAL REPORT 2017 21
CSR Policy and Planning
The Dowa Group’s CSR Policy and Planning
The Dowa Group has commenced initiatives based on CSR plans with targets for fiscal 2020.
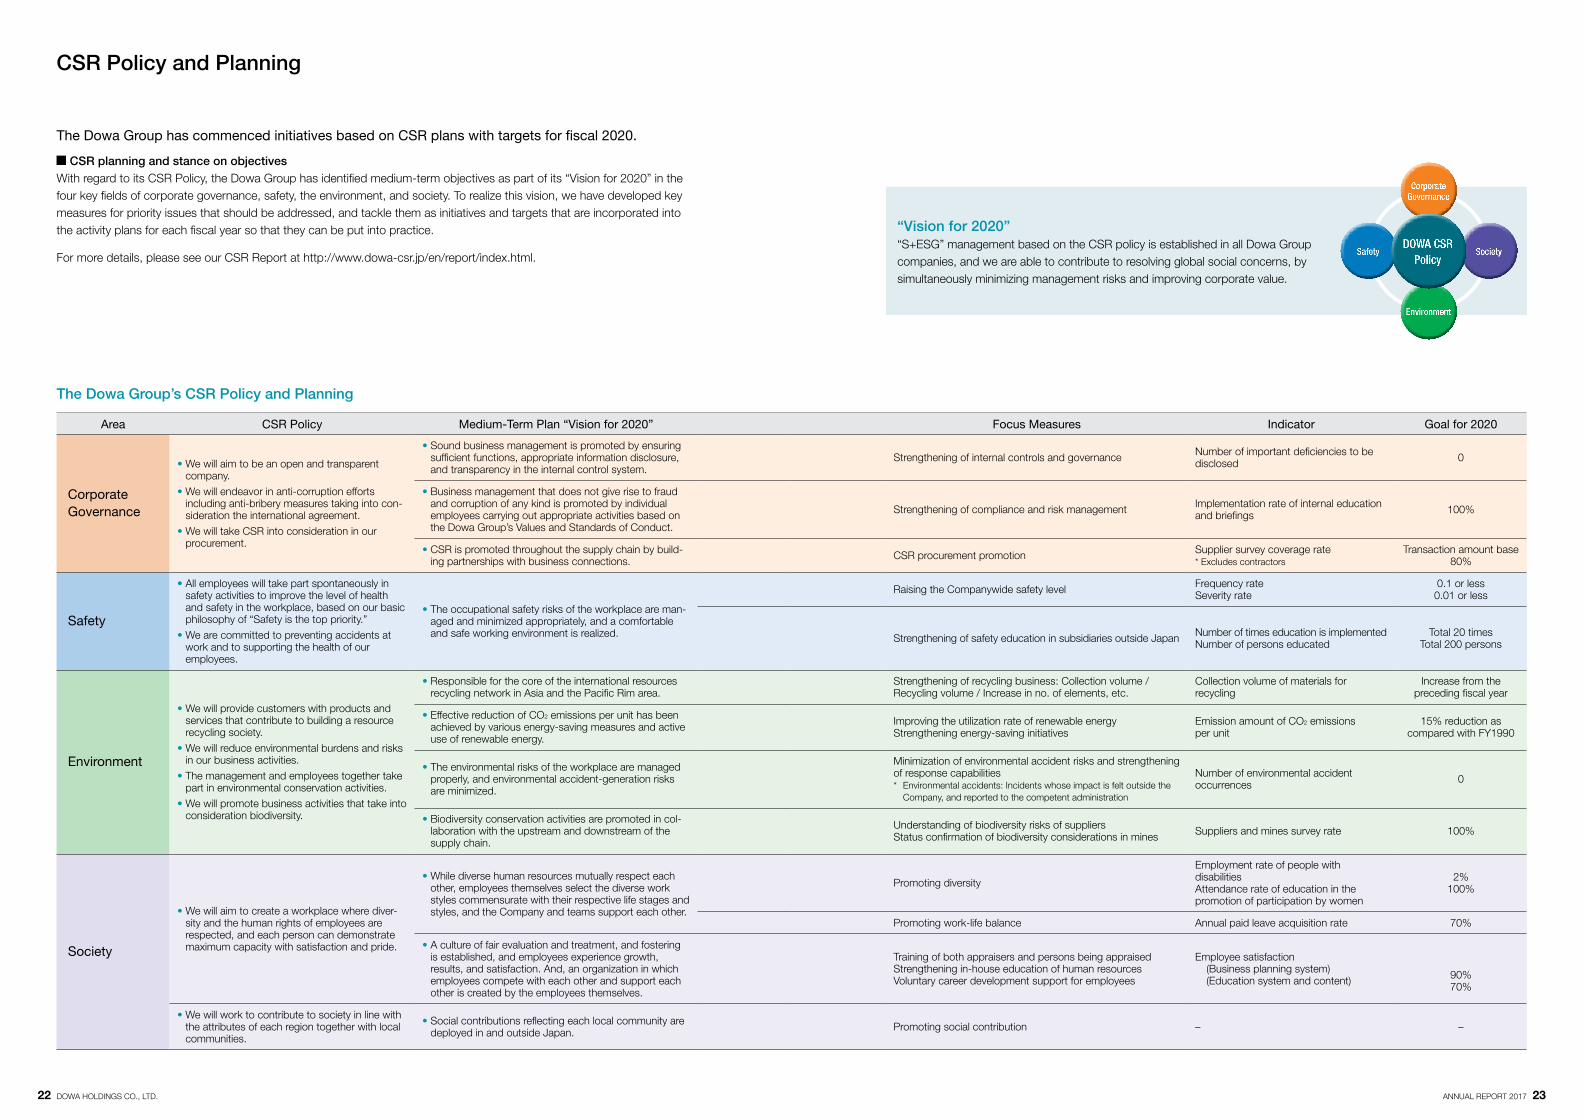
CSR planning and stance on objectivesWith regard to its CSR Policy, the Dowa Group has identified medium-term objectives as part of its “Vision for 2020” in the four key fields of corporate governance, safety, the environment, and society. To realize this vision, we have developed key measures for priority issues that should be addressed, and tackle them as initiatives and targets that are incorporated into the activity plans for each fiscal year so that they can be put into practice.
For more details, please see our CSR Report at http://www.dowa-csr.jp/en/report/index.html.
“Vision for 2020”“S+ESG” management based on the CSR policy is established in all Dowa Group companies, and we are able to contribute to resolving global social concerns, by simultaneously minimizing management risks and improving corporate value.
Safety
Corporate Governance
Society
Environment
DOWA CSR Policy
22 DOWA HOLDINGS CO., LTD. ANNUAL REPORT 2017 23
Area CSR Policy Medium-Term Plan “Vision for 2020” Focus Measures Indicator Goal for 2020
Corporate Governance
• We will aim to be an open and transparent company.
• We will endeavor in anti-corruption efforts including anti-bribery measures taking into con-sideration the international agreement.
• We will take CSR into consideration in our procurement.
• Sound business management is promoted by ensuring sufficient functions, appropriate information disclosure, and transparency in the internal control system.
Strengthening of internal controls and governance Number of important deficiencies to be disclosed 0
• Business management that does not give rise to fraud and corruption of any kind is promoted by individual employees carrying out appropriate activities based on the Dowa Group’s Values and Standards of Conduct.
Strengthening of compliance and risk management Implementation rate of internal education and briefings 100%
• CSR is promoted throughout the supply chain by build-ing partnerships with business connections. CSR procurement promotion Supplier survey coverage rate
* Excludes contractorsTransaction amount base
80%
Safety
• All employees will take part spontaneously in safety activities to improve the level of health and safety in the workplace, based on our basic philosophy of “Safety is the top priority.”
• We are committed to preventing accidents at work and to supporting the health of our employees.
• The occupational safety risks of the workplace are man-aged and minimized appropriately, and a comfortable and safe working environment is realized.
Raising the Companywide safety level Frequency rateSeverity rate
0.1 or less0.01 or less
Strengthening of safety education in subsidiaries outside Japan Number of times education is implementedNumber of persons educated
Total 20 timesTotal 200 persons
Environment
• We will provide customers with products and services that contribute to building a resource recycling society.
• We will reduce environmental burdens and risks in our business activities.
• The management and employees together take part in environmental conservation activities.
• We will promote business activities that take into consideration biodiversity.
• Responsible for the core of the international resources recycling network in Asia and the Pacific Rim area.
Strengthening of recycling business: Collection volume / Recycling volume / Increase in no. of elements, etc.
Collection volume of materials for recycling
Increase from the preceding fiscal year
• Effective reduction of CO2 emissions per unit has been achieved by various energy-saving measures and active use of renewable energy.
Improving the utilization rate of renewable energyStrengthening energy-saving initiatives
Emission amount of CO2 emissions per unit
15% reduction as compared with FY1990
• The environmental risks of the workplace are managed properly, and environmental accident-generation risks are minimized.
Minimization of environmental accident risks and strengthening of response capabilities* Environmental accidents: Incidents whose impact is felt outside the
Company, and reported to the competent administration
Number of environmental accident occurrences 0
• Biodiversity conservation activities are promoted in col-laboration with the upstream and downstream of the supply chain.
Understanding of biodiversity risks of suppliersStatus confirmation of biodiversity considerations in mines Suppliers and mines survey rate 100%
Society
• We will aim to create a workplace where diver-sity and the human rights of employees are respected, and each person can demonstrate maximum capacity with satisfaction and pride.
• While diverse human resources mutually respect each other, employees themselves select the diverse work styles commensurate with their respective life stages and styles, and the Company and teams support each other.
Promoting diversity
Employment rate of people with disabilitiesAttendance rate of education in the promotion of participation by women
2%100%
Promoting work-life balance Annual paid leave acquisition rate 70%
• A culture of fair evaluation and treatment, and fostering is established, and employees experience growth, results, and satisfaction. And, an organization in which employees compete with each other and support each other is created by the employees themselves.
Training of both appraisers and persons being appraisedStrengthening in-house education of human resourcesVoluntary career development support for employees
Employee satisfaction (Business planning system) (Education system and content) 90%
70%
• We will work to contribute to society in line with the attributes of each region together with local communities.
• Social contributions reflecting each local community are deployed in and outside Japan. Promoting social contribution – –
The Dowa Group has made the strengthening of corporate governance one of its most important management priorities, and every Group company is engaged in contributing to society as well as in developing and oper-ating effective and efficient internal controls based on the Dowa Group’s Values and Standards of Conduct.
For more details, please see our Corporate Governance Report at: http://www.dowa.co.jp/en/about_dowa/governance.html.(In Japanese only)
Status of Internal Audits and Auditor AuditsThe Company and all Dowa Group companies have formu-lated internal audit regulations, and use these regulations as a basis upon which to conduct internal audits. The audits cover all corporate activities, and include accounting audits, legal audits, and activities involving safety and the environment. In the execution of an audit, the Company’s General Affairs and Legal Department, all relevant divisions, and Group compa-nies coordinate with one another and allocate employees with a wealth of practical experience to properly conduct the audit. The findings of such audits are reported to directors, Audit & Supervisory Board members, the General Affairs and Legal Department, and other relevant departments. In accordance with the audit policies and audit plans for the term stipulated by the Audit & Supervisory Board, Audit & Supervisory Board members attend Board of Directors’ meetings and other important meetings, and audit the exe-cution of directors’ duties, such as reviewing status reports on such tasks from directors. They also monitor the inde-pendence of the independent auditors and work with them to explain the audit plans of the independent auditors and report audit findings. Audit & Supervisory Board members, independent audi-tors, and the General Affairs and Legal Department regu-larly set up discussion forums and work closely with one another in order to further improve internal audits. The results of these audits are reported to the General Affairs and Legal Department as appropriate, and any necessary corrective measures are implemented.
Development and Overview of Internal Control SystemsApproach Regarding Internal Control SystemsIn accordance with the Dowa Group’s Values and Standards of Conduct, the Company and Group companies have made a collective effort to design and operate effective and efficient internal controls to contribute to society, maxi-mize corporate value, and fulfill management responsibilities conferred by shareholders. At the same time, laws are being revised and the public’s general stance toward compliance is hardening, so we expect even stronger demands to be placed on the Group going forward. Given these trends, the Company converted to a holding company structure on October 1, 2006. The holding company structure raises the level of special-ization of each business group and the speed at which poli-cies can be executed. However, it also carries the risk that control systems will become localized and overall governance will suffer. As a result, at the Dowa Group, basic policies and sys-tems for internal control are shared among Group compa-nies. Additionally, individual companies can utilize their own unique characteristics for specific activities in order to develop an effective and efficient internal control system
suited to our holding company structure. Moreover, the internal control system must continuously be revised in line with changes in business activities and the social environment, so the Company and Group companies intend to promote the system even more robustly.
Overview of Internal Control SystemsThe Company will work to strengthen oversight of the Board of Directors by appointing executive officers and separating the execution function from the Board. The Company and all the companies of the Dowa Group will clarify the authority and responsibilities of personnel for each rank based on Company rules such as Board regula-tions and administrative authority regulations and will rigor-ously ensure compliance with the law, the Articles of Incorporation, and social norms through independent study and educational programs for directors and employees. The Company will continue to design and operate sys-tems at the Company and all the companies of the Dowa Group to ensure the reliability of financial reporting. The Company and all the companies of the Dowa Group will adopt a firm stance across the organization toward anti-social forces. In addition, we will coordinate efforts with all rel-evant organizations, including the police and legal advisors. By establishing the Dowa Consultation Desk and imple-menting internal audits, the Company has introduced mea-sures to prevent any improprieties or misconduct and to quickly discover any such incidents at the Company and all the companies of the Dowa Group, and will take appropri-ate action as necessary. In gathering information relating to the execution of direc-tors’ duties, the Company will manage the information in accordance with Company regulations, such as the Dowa Group IT Systems Management Regulations and Intellectual Property Management Regulations. In order to identify and avoid risk, the Company will have the Board of Directors and other bodies conduct rigorous reviews when decisions are made on important matters of the Company and of all the companies of the Dowa Group. We will also work to build a communication system to facili-tate coordination among Group companies and improve our emergency response capabilities. By means of Company regulations such as Board regula-tions and administrative authority regulations, the Company will clarify the authority and responsibilities of the Company and of all the companies of the Dowa Group. The Company and all the companies of the Dowa Group will share important regulation systems and items, including Board regulations and those covering administrative author-ity, accounting, documentation, purchasing, and systems management, at the Company and all the companies of the Dowa Group, and clarify the responsibilities and authority as well as the (approval) procedures of people in each posi-tion of employment.
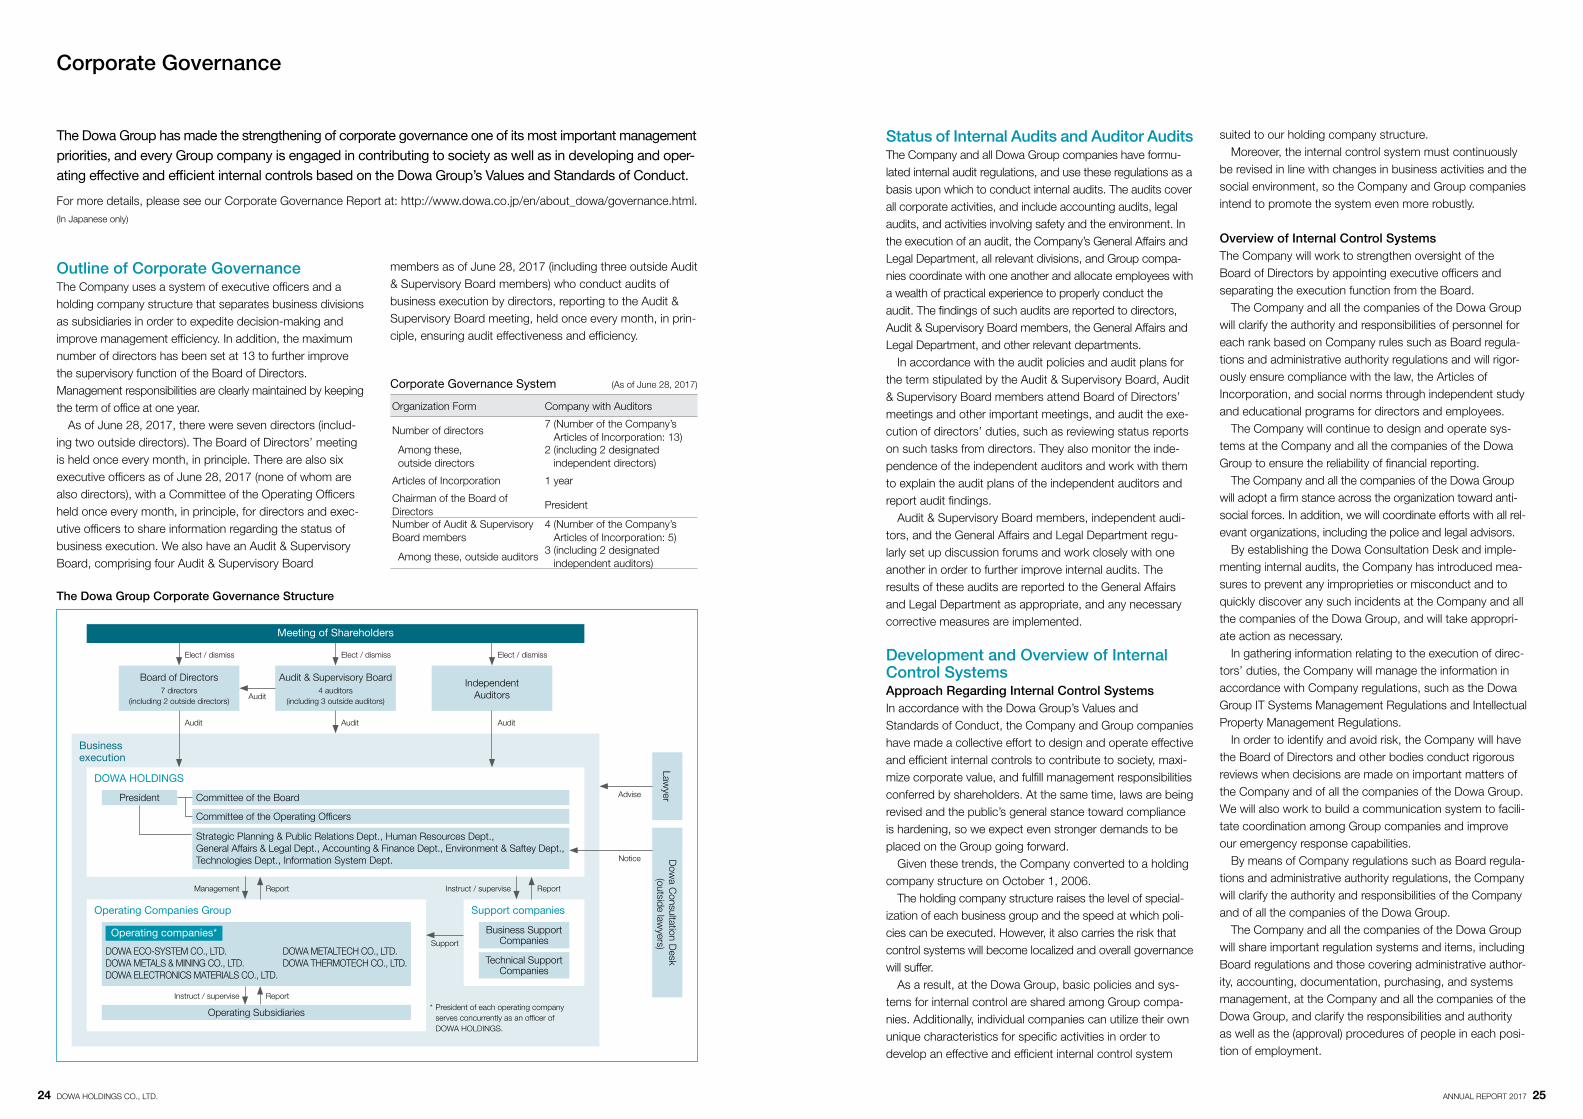
Outline of Corporate GovernanceThe Company uses a system of executive officers and a holding company structure that separates business divisions as subsidiaries in order to expedite decision-making and improve management efficiency. In addition, the maximum number of directors has been set at 13 to further improve the supervisory function of the Board of Directors. Management responsibilities are clearly maintained by keeping the term of office at one year. As of June 28, 2017, there were seven directors (includ-ing two outside directors). The Board of Directors’ meeting is held once every month, in principle. There are also six executive officers as of June 28, 2017 (none of whom are also directors), with a Committee of the Operating Officers held once every month, in principle, for directors and exec-utive officers to share information regarding the status of business execution. We also have an Audit & Supervisory Board, comprising four Audit & Supervisory Board
members as of June 28, 2017 (including three outside Audit & Supervisory Board members) who conduct audits of business execution by directors, reporting to the Audit & Supervisory Board meeting, held once every month, in prin-ciple, ensuring audit effectiveness and efficiency.
Corporate Governance
The Dowa Group Corporate Governance Structure
24 DOWA HOLDINGS CO., LTD. ANNUAL REPORT 2017 25
Corporate Governance System (As of June 28, 2017)
Organization Form Company with Auditors
Number of directors7 (Number of the Company’s
Articles of Incorporation: 13) Among these, outside directors
2 (including 2 designated independent directors)
Articles of Incorporation 1 year
Chairman of the Board of Directors
President
Number of Audit & Supervisory Board members
4 (Number of the Company’s Articles of Incorporation: 5)
Among these, outside auditors3 (including 2 designated
independent auditors)
Lawyer
Dow
a Consultation D
esk (outside law
yers)
DOWA HOLDINGS
Operating Companies Group
Strategic Planning & Public Relations Dept., Human Resources Dept., General Affairs & Legal Dept., Accounting & Finance Dept., Environment & Saftey Dept., Technologies Dept., Information System Dept.
Committee of the Operating Officers
Committee of the Board President
Audit & Supervisory Board4 auditors
(including 3 outside auditors)
Independent Auditors
Board of Directors7 directors
(including 2 outside directors)
Business execution
Meeting of Shareholders
DOWA ECO-SYSTEM CO., LTD.DOWA METALS & MINING CO., LTD.DOWA ELECTRONICS MATERIALS CO., LTD.
DOWA METALTECH CO., LTD.DOWA THERMOTECH CO., LTD.
Operating Subsidiaries
Support companies
Technical Support Companies
Business Support Companies
* President of each operating company serves concurrently as an officer of DOWA HOLDINGS.
Elect / dismiss
Audit
Elect / dismiss
Audit
Report
Report
Report
Advise
Support
Notice
Management
Instruct / supervise
Instruct / supervise
Elect / dismiss
Audit
Operating companies*
Audit
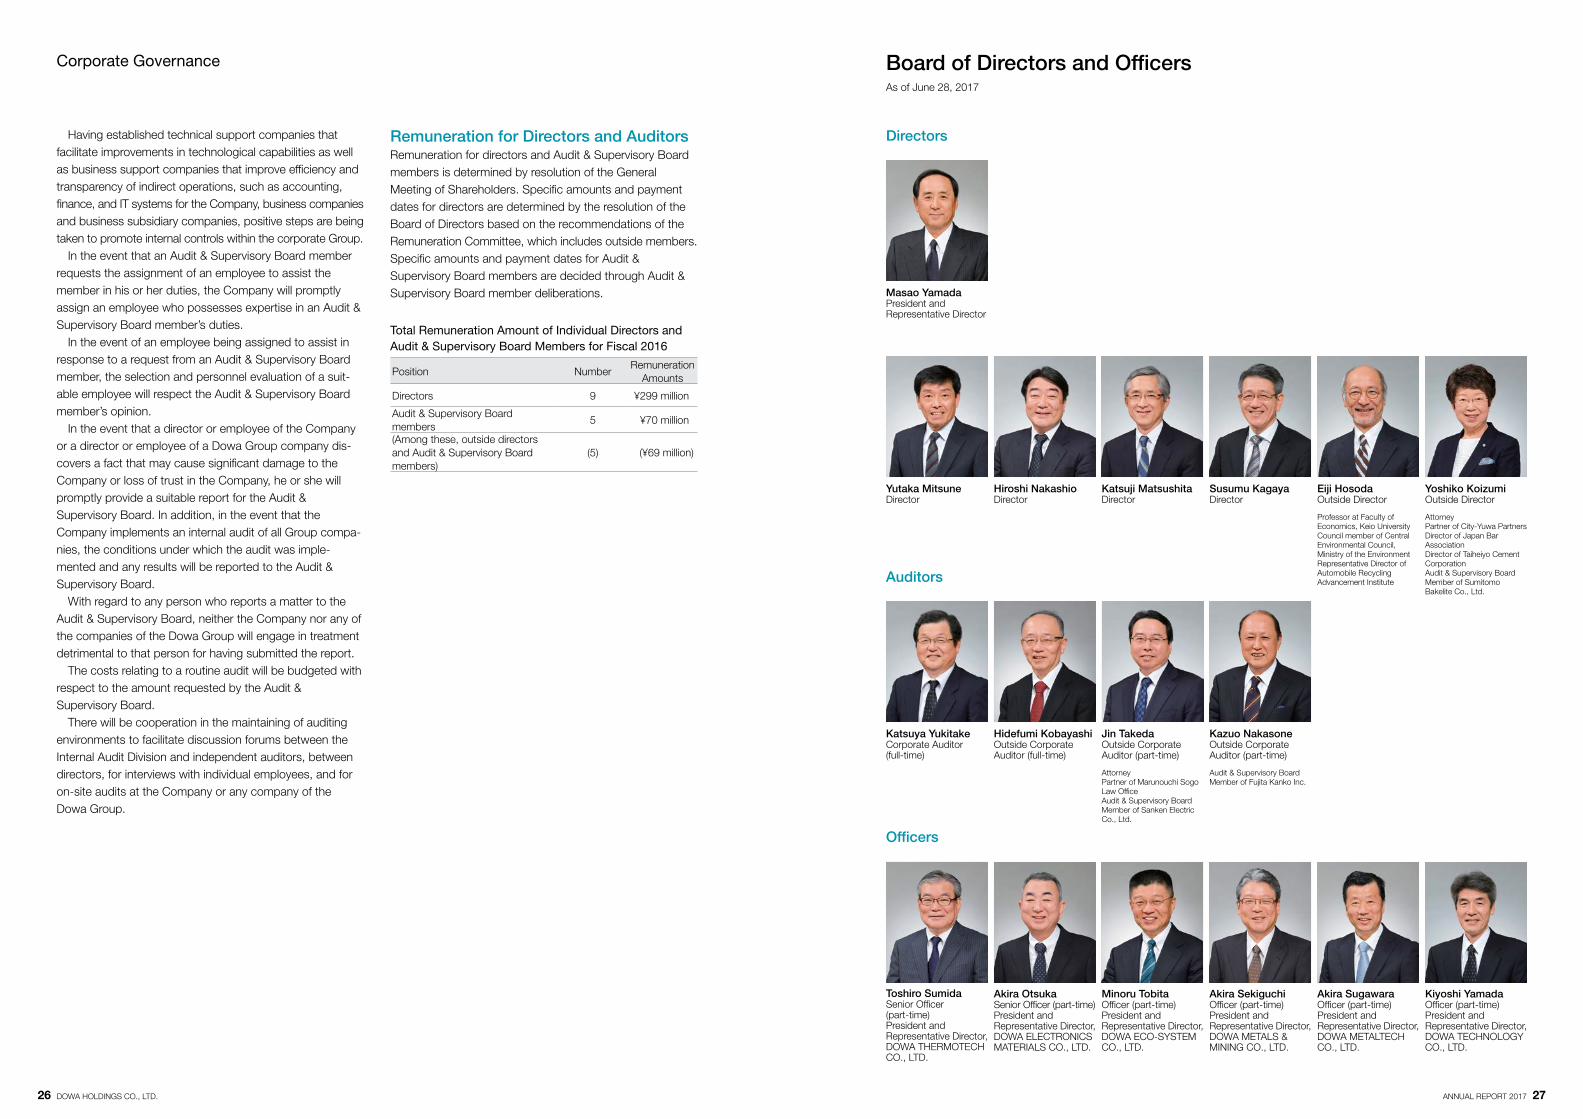
Corporate Governance Board of Directors and OfficersAs of June 28, 2017
Hidefumi KobayashiOutside Corporate Auditor (full-time)
Directors
Officers
Having established technical support companies that facilitate improvements in technological capabilities as well as business support companies that improve efficiency and transparency of indirect operations, such as accounting, finance, and IT systems for the Company, business companies and business subsidiary companies, positive steps are being taken to promote internal controls within the corporate Group. In the event that an Audit & Supervisory Board member requests the assignment of an employee to assist the member in his or her duties, the Company will promptly assign an employee who possesses expertise in an Audit & Supervisory Board member’s duties. In the event of an employee being assigned to assist in response to a request from an Audit & Supervisory Board member, the selection and personnel evaluation of a suit-able employee will respect the Audit & Supervisory Board member’s opinion. In the event that a director or employee of the Company or a director or employee of a Dowa Group company dis-covers a fact that may cause significant damage to the Company or loss of trust in the Company, he or she will promptly provide a suitable report for the Audit & Supervisory Board. In addition, in the event that the Company implements an internal audit of all Group compa-nies, the conditions under which the audit was imple-mented and any results will be reported to the Audit & Supervisory Board. With regard to any person who reports a matter to the Audit & Supervisory Board, neither the Company nor any of the companies of the Dowa Group will engage in treatment detrimental to that person for having submitted the report. The costs relating to a routine audit will be budgeted with respect to the amount requested by the Audit & Supervisory Board. There will be cooperation in the maintaining of auditing environments to facilitate discussion forums between the Internal Audit Division and independent auditors, between directors, for interviews with individual employees, and for on-site audits at the Company or any company of the Dowa Group.
Remuneration for Directors and AuditorsRemuneration for directors and Audit & Supervisory Board members is determined by resolution of the General Meeting of Shareholders. Specific amounts and payment dates for directors are determined by the resolution of the Board of Directors based on the recommendations of the Remuneration Committee, which includes outside members. Specific amounts and payment dates for Audit & Supervisory Board members are decided through Audit & Supervisory Board member deliberations. Masao Yamada
President and Representative Director
Hiroshi NakashioDirector
Yutaka MitsuneDirector
Susumu KagayaDirector
Katsuji MatsushitaDirector
Eiji HosodaOutside Director
Professor at Faculty of Economics, Keio UniversityCouncil member of Central Environmental Council, Ministry of the EnvironmentRepresentative Director of Automobile Recycling Advancement Institute
Yoshiko KoizumiOutside Director
AttorneyPartner of City-Yuwa PartnersDirector of Japan Bar AssociationDirector of Taiheiyo Cement CorporationAudit & Supervisory Board Member of Sumitomo Bakelite Co., Ltd.
Katsuya YukitakeCorporate Auditor (full-time)
Jin TakedaOutside Corporate Auditor (part-time)
AttorneyPartner of Marunouchi Sogo Law OfficeAudit & Supervisory Board Member of Sanken Electric Co., Ltd.
Kazuo NakasoneOutside Corporate Auditor (part-time)
Audit & Supervisory Board Member of Fujita Kanko Inc.
Auditors
Akira SekiguchiOfficer (part-time)President and Representative Director, DOWA METALS & MINING CO., LTD.
Minoru TobitaOfficer (part-time)President and Representative Director, DOWA ECO-SYSTEM CO., LTD.
Akira OtsukaSenior Officer (part-time)President and Representative Director, DOWA ELECTRONICS MATERIALS CO., LTD.
Akira SugawaraOfficer (part-time)President and Representative Director, DOWA METALTECH CO., LTD.
Toshiro SumidaSenior Officer (part-time)President and Representative Director, DOWA THERMOTECH CO., LTD.
Kiyoshi YamadaOfficer (part-time)President and Representative Director, DOWA TECHNOLOGY CO., LTD.
26 DOWA HOLDINGS CO., LTD. ANNUAL REPORT 2017 27
Total Remuneration Amount of Individual Directors and Audit & Supervisory Board Members for Fiscal 2016
Position NumberRemuneration
Amounts
Directors 9 ¥299 million
Audit & Supervisory Board members
5 ¥70 million
(Among these, outside directors and Audit & Supervisory Board members)
(5) (¥69 million)
DOWA ECO-SYSTEM CO., LTD.❶ DOWA ENVIRONMENTAL MANAGEMENT CO., LTD. (China)❷ PT. PRASADHA PAMUNAH LIMBAH INDUSTRI (PPLi)
(Indonesia)❸ TECHNOCHEM ENVIRONMENTAL COMPLEX PTE. LTD. (TEC)
(Singapore)❹ DOWA ECO-SYSTEM SINGAPORE PTE. LTD. (Singapore)❺ WASTE MANAGEMENT SIAM LTD. (WMS) (Thailand)❻ BANGPOO ENVIRONMENTAL COMPLEX LTD. (BPEC)
(Thailand)❼ EASTERN SEABOARD ENVIRONMENTAL COMPLEX CO., LTD.
(ESBEC) (Thailand)❽ GOLDEN DOWA ECO-SYSTEM MYANMAR COMPANY
LIMITED (Myanmar) DOWA METALS & MINING CO., LTD.❾ DOWA METALS & MINING CO., LTD. Vancouver Office
(Canada) Cariboo Copper Corporation (Canada) NIPPON PGM AMERICA, INC. (U.S.A.) DOWA METALS & MINING CO., LTD. Mexico Office MINERA TIZAPA, S.A. DE C.V. (Mexico) Nippon PGM Europe s.r.o. (Czech Republic) DOWA METALS & MINING (THAILAND) CO., LTD. (Thailand) KEY METAL REFINING, LLC (U.S.A.) DOWA METALS & MINING AMERICA INC. (U.S.A.)
DOWA METALTECH CO., LTD. DOWA ADVANCED MATERIALS SHANGHAI CO., LTD. (China) DOWA NEW MATERIALS (SHANGHAI) CO., LTD. (China) DOWA METALTECH (THAILAND) CO., LTD. (Thailand) Dowa Precision (Thailand) Co., Ltd. (Thailand) Dowa Metaltech Co., Ltd. Singapore Branch DOWALI PRECISION CO., LTD. (Taiwan) DOWA METALTECH MEXICO, S.A. DE C.V. (Mexico)
DOWA THERMOTECH CO., LTD. DOWA THT AMERICA, INC. (U.S.A.) KUNSHAN DOWA THERMO FURNACE CO., LTD. (China) DOWA Thermotech (Thailand) Co., Ltd. (Thailand) HIGHTEMP FURNACES LTD. (India) PT. DOWA THERMOTECH INDONESIA (Indonesia) PT. DOWA THERMOTECH FURNACES (Indonesia) DOWA THERMOTECH MEXICO, S.A. DE C.V. (Mexico)
Headquarters, Others
DOWA INTERNATIONAL CORPORATION (U.S.A.) DOWA INTERNATIONAL CORPORATION San Jose Branch (U.S.A.)
DOWA HOLDINGS (SHANGHAI) CO., LTD. (China) DOWA HOLDINGS (SHANGHAI) CO., LTD. Shenzhen Branch (China)
DOWA HD Europe GmbH (Germany) DOWA HOLDINGS (THAILAND) CO., LTD. (Thailand)
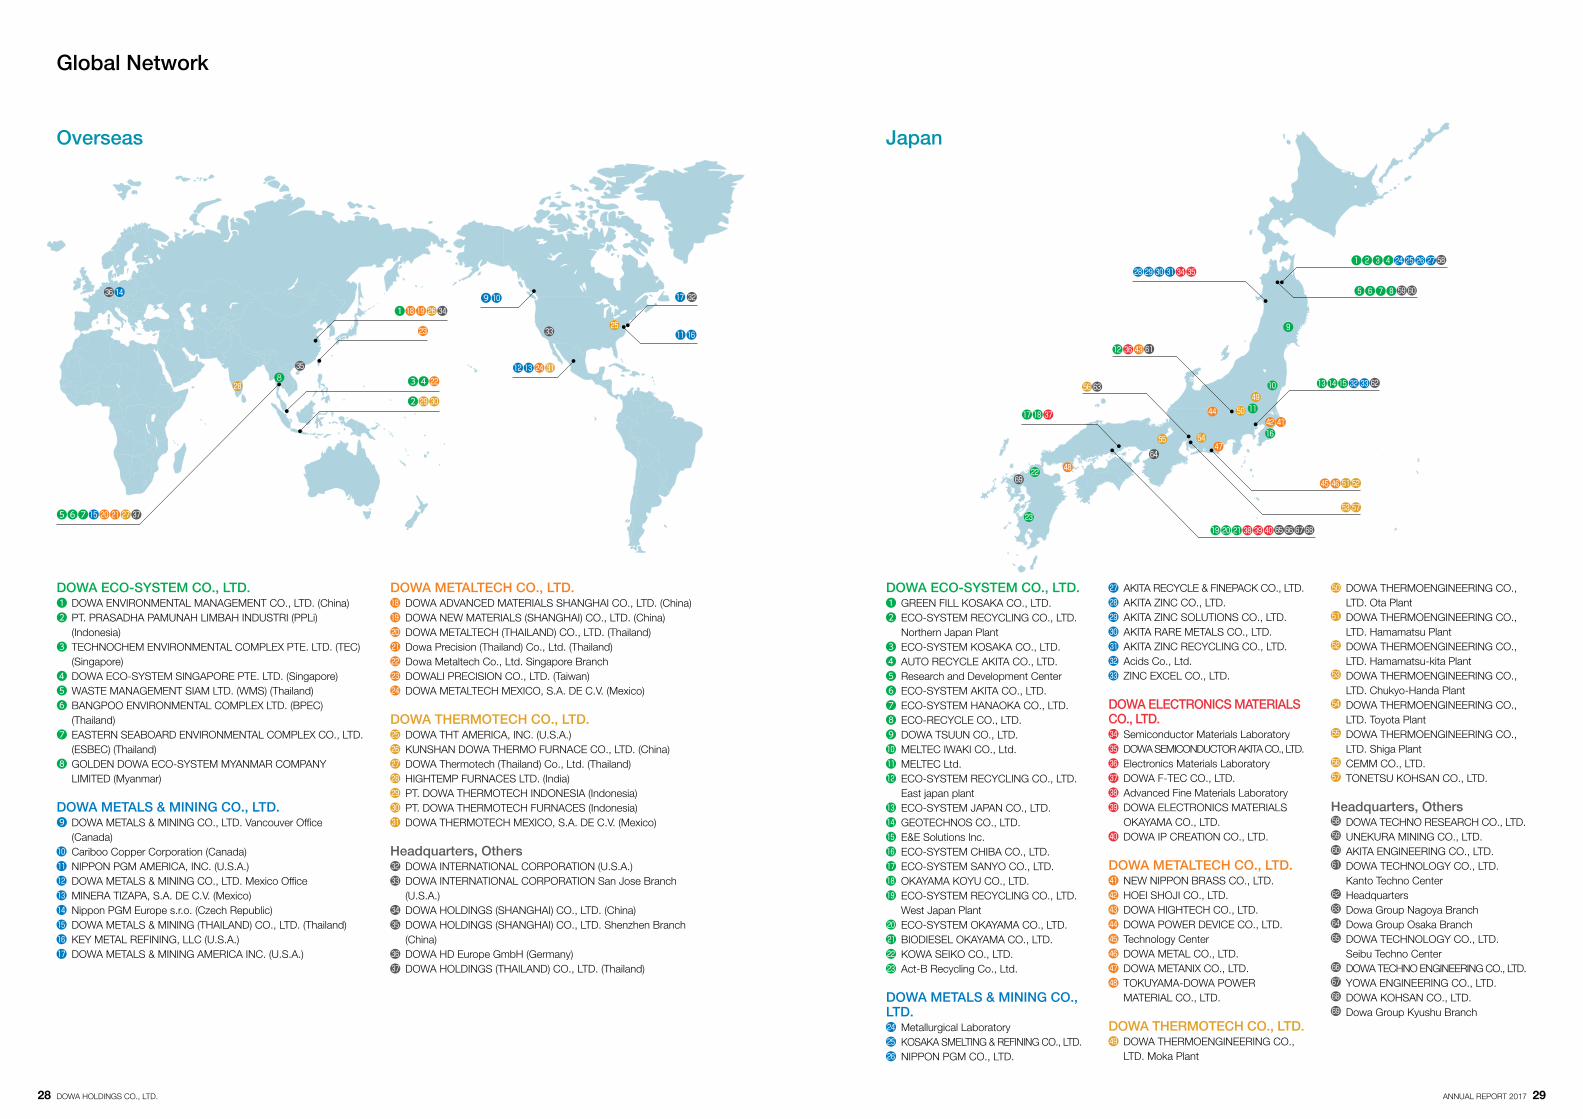
Global Network
❶⓲⓳㉖㉞㉓
❸❹㉒
❾❿
⓬⓭㉔㉛
❷㉙㉚
❺❻❼⓯⓴㉑㉗㊲
㊱⓮
㉘
㉕
❽
㉝
⓱㉜
⓫⓰
㉘㉙㉚㉛㉞㉟
⓬㊱㊸
⓱⓲㊲
❶❷❸❹㉔㉕㉖㉗
❺❻❼❽
⓭⓮⓯㉜㉝
⓳⓴㉑㊳㊴㊵
㊺㊻㉒
㉓
㊽
㊹
㊼
❿
⓫
❾
⓰㊷㊶
㉟
㊿㊾
Overseas Japan
DOWA ECO-SYSTEM CO., LTD. GREEN FILL KOSAKA CO., LTD. ECO-SYSTEM RECYCLING CO., LTD. Northern Japan Plant
ECO-SYSTEM KOSAKA CO., LTD. AUTO RECYCLE AKITA CO., LTD. Research and Development Center ECO-SYSTEM AKITA CO., LTD. ECO-SYSTEM HANAOKA CO., LTD. ECO-RECYCLE CO., LTD. DOWA TSUUN CO., LTD. MELTEC IWAKI CO., Ltd. MELTEC Ltd. ECO-SYSTEM RECYCLING CO., LTD. East japan plant
ECO-SYSTEM JAPAN CO., LTD. GEOTECHNOS CO., LTD. E&E Solutions Inc. ECO-SYSTEM CHIBA CO., LTD. ECO-SYSTEM SANYO CO., LTD. OKAYAMA KOYU CO., LTD. ECO-SYSTEM RECYCLING CO., LTD. West Japan Plant
ECO-SYSTEM OKAYAMA CO., LTD. BIODIESEL OKAYAMA CO., LTD. KOWA SEIKO CO., LTD. Act-B Recycling Co., Ltd.
DOWA METALS & MINING CO., LTD.
Metallurgical Laboratory KOSAKA SMELTING & REFINING CO., LTD. NIPPON PGM CO., LTD.
AKITA RECYCLE & FINEPACK CO., LTD. AKITA ZINC CO., LTD. AKITA ZINC SOLUTIONS CO., LTD. AKITA RARE METALS CO., LTD. AKITA ZINC RECYCLING CO., LTD. Acids Co., Ltd. ZINC EXCEL CO., LTD.
DOWA ELECTRONICS MATERIALS CO., LTD.
Semiconductor Materials Laboratory DOWA SEMICONDUCTOR AKITA CO., LTD. Electronics Materials Laboratory DOWA F-TEC CO., LTD. Advanced Fine Materials Laboratory DOWA ELECTRONICS MATERIALS OKAYAMA CO., LTD.
DOWA IP CREATION CO., LTD.
DOWA METALTECH CO., LTD. NEW NIPPON BRASS CO., LTD. HOEI SHOJI CO., LTD. DOWA HIGHTECH CO., LTD. DOWA POWER DEVICE CO., LTD. Technology Center DOWA METAL CO., LTD. DOWA METANIX CO., LTD. TOKUYAMA-DOWA POWER MATERIAL CO., LTD.
DOWA THERMOTECH CO., LTD. DOWA THERMOENGINEERING CO., LTD. Moka Plant
DOWA THERMOENGINEERING CO., LTD. Ota Plant
DOWA THERMOENGINEERING CO., LTD. Hamamatsu Plant
DOWA THERMOENGINEERING CO., LTD. Hamamatsu-kita Plant
DOWA THERMOENGINEERING CO., LTD. Chukyo-Handa Plant
DOWA THERMOENGINEERING CO., LTD. Toyota Plant
DOWA THERMOENGINEERING CO., LTD. Shiga Plant
CEMM CO., LTD. TONETSU KOHSAN CO., LTD.
Headquarters, Others DOWA TECHNO RESEARCH CO., LTD. UNEKURA MINING CO., LTD. AKITA ENGINEERING CO., LTD. DOWA TECHNOLOGY CO., LTD. Kanto Techno Center
Headquarters Dowa Group Nagoya Branch Dowa Group Osaka Branch DOWA TECHNOLOGY CO., LTD. Seibu Techno Center
DOWA TECHNO ENGINEERING CO., LTD. YOWA ENGINEERING CO., LTD. DOWA KOHSAN CO., LTD. Dowa Group Kyushu Branch
28 DOWA HOLDINGS CO., LTD. ANNUAL REPORT 2017 29
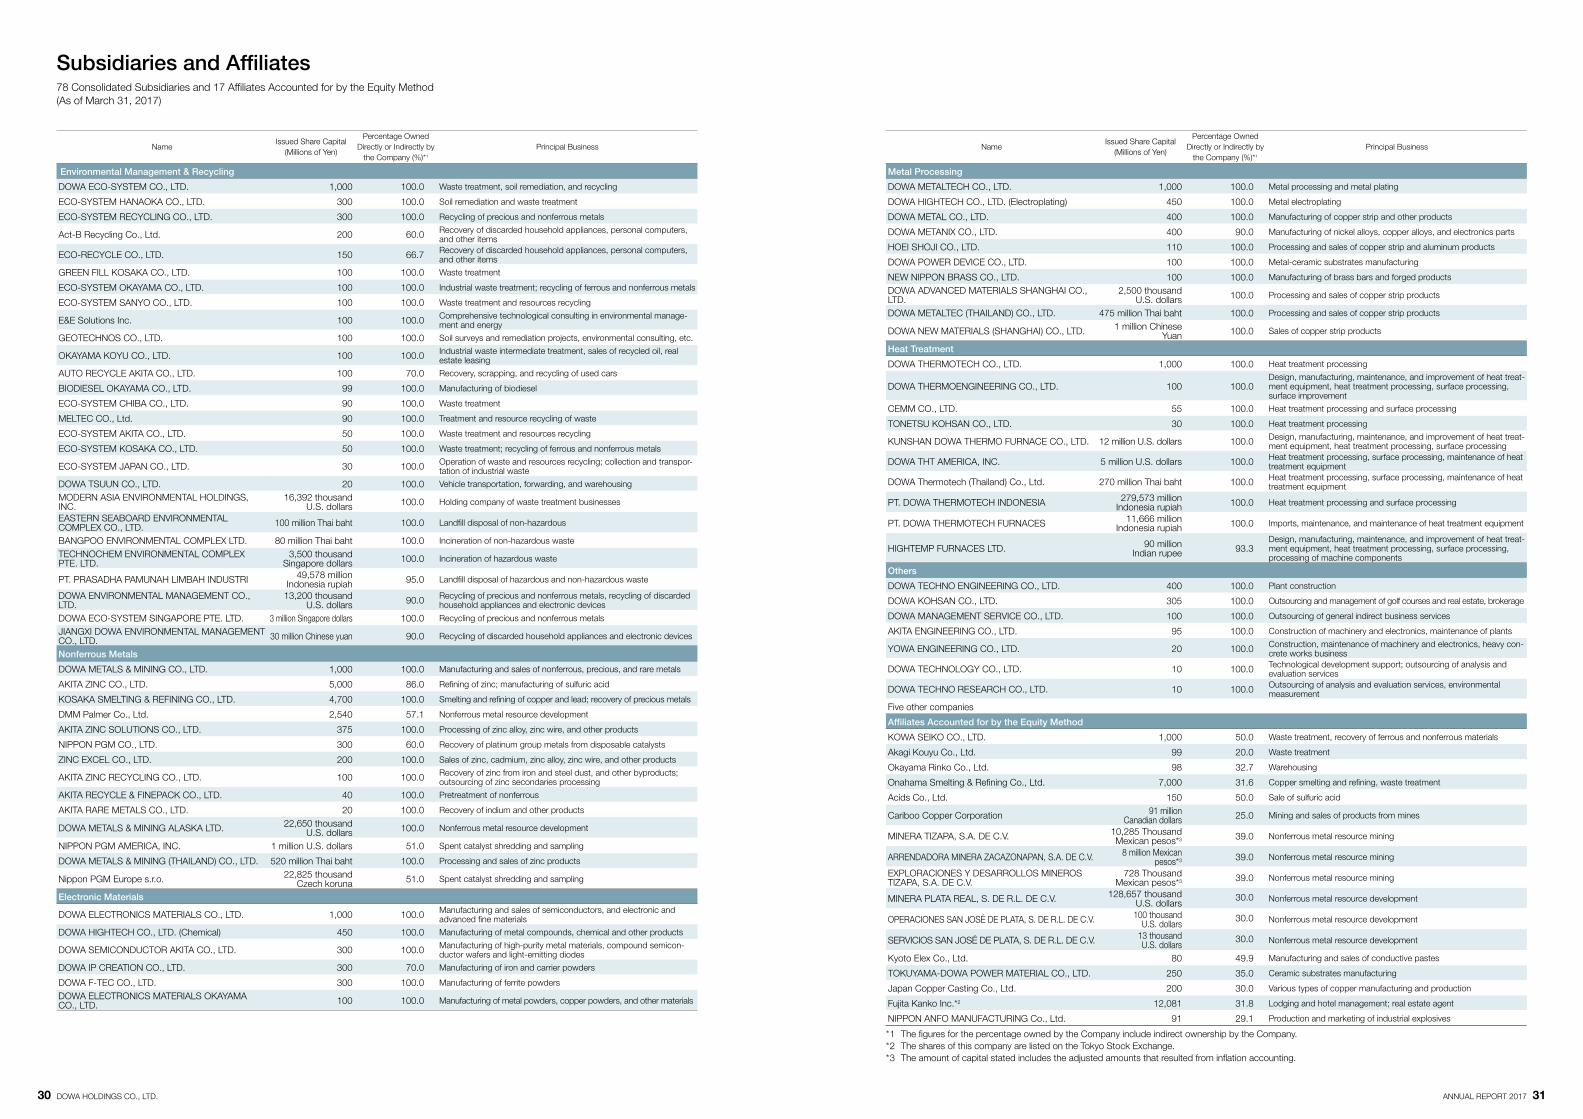
Subsidiaries and Affiliates78 Consolidated Subsidiaries and 17 Affiliates Accounted for by the Equity Method (As of March 31, 2017)
NameIssued Share Capital
(Millions of Yen)
Percentage Owned Directly or Indirectly by
the Company (%)*1
Principal Business
Environmental Management & Recycling
DOWA ECO-SYSTEM CO., LTD. 1,000 100.0 Waste treatment, soil remediation, and recycling
ECO-SYSTEM HANAOKA CO., LTD. 300 100.0 Soil remediation and waste treatment
ECO-SYSTEM RECYCLING CO., LTD. 300 100.0 Recycling of precious and nonferrous metals
Act-B Recycling Co., Ltd. 200 60.0 Recovery of discarded household appliances, personal computers, and other items
ECO-RECYCLE CO., LTD. 150 66.7 Recovery of discarded household appliances, personal computers, and other items
GREEN FILL KOSAKA CO., LTD. 100 100.0 Waste treatment
ECO-SYSTEM OKAYAMA CO., LTD. 100 100.0 Industrial waste treatment; recycling of ferrous and nonferrous metals
ECO-SYSTEM SANYO CO., LTD. 100 100.0 Waste treatment and resources recycling
E&E Solutions Inc. 100 100.0 Comprehensive technological consulting in environmental manage-ment and energy
GEOTECHNOS CO., LTD. 100 100.0 Soil surveys and remediation projects, environmental consulting, etc.
OKAYAMA KOYU CO., LTD. 100 100.0 Industrial waste intermediate treatment, sales of recycled oil, real estate leasing
AUTO RECYCLE AKITA CO., LTD. 100 70.0 Recovery, scrapping, and recycling of used cars
BIODIESEL OKAYAMA CO., LTD. 99 100.0 Manufacturing of biodiesel
ECO-SYSTEM CHIBA CO., LTD. 90 100.0 Waste treatment
MELTEC CO., Ltd. 90 100.0 Treatment and resource recycling of waste
ECO-SYSTEM AKITA CO., LTD. 50 100.0 Waste treatment and resources recycling
ECO-SYSTEM KOSAKA CO., LTD. 50 100.0 Waste treatment; recycling of ferrous and nonferrous metals
ECO-SYSTEM JAPAN CO., LTD. 30 100.0 Operation of waste and resources recycling; collection and transpor-tation of industrial waste
DOWA TSUUN CO., LTD. 20 100.0 Vehicle transportation, forwarding, and warehousing
MODERN ASIA ENVIRONMENTAL HOLDINGS, INC.
16,392 thousand U.S. dollars 100.0 Holding company of waste treatment businesses
EASTERN SEABOARD ENVIRONMENTAL COMPLEX CO., LTD. 100 million Thai baht 100.0 Landfill disposal of non-hazardous
BANGPOO ENVIRONMENTAL COMPLEX LTD. 80 million Thai baht 100.0 Incineration of non-hazardous waste
TECHNOCHEM ENVIRONMENTAL COMPLEX PTE. LTD.
3,500 thousand Singapore dollars 100.0 Incineration of hazardous waste
PT. PRASADHA PAMUNAH LIMBAH INDUSTRI 49,578 million Indonesia rupiah 95.0 Landfill disposal of hazardous and non-hazardous waste
DOWA ENVIRONMENTAL MANAGEMENT CO., LTD.
13,200 thousand U.S. dollars 90.0 Recycling of precious and nonferrous metals, recycling of discarded
household appliances and electronic devices
DOWA ECO-SYSTEM SINGAPORE PTE. LTD. 3 million Singapore dollars 100.0 Recycling of precious and nonferrous metals
JIANGXI DOWA ENVIRONMENTAL MANAGEMENT CO., LTD. 30 million Chinese yuan 90.0 Recycling of discarded household appliances and electronic devices
Nonferrous Metals
DOWA METALS & MINING CO., LTD. 1,000 100.0 Manufacturing and sales of nonferrous, precious, and rare metals
AKITA ZINC CO., LTD. 5,000 86.0 Refining of zinc; manufacturing of sulfuric acid
KOSAKA SMELTING & REFINING CO., LTD. 4,700 100.0 Smelting and refining of copper and lead; recovery of precious metals
DMM Palmer Co., Ltd. 2,540 57.1 Nonferrous metal resource development
AKITA ZINC SOLUTIONS CO., LTD. 375 100.0 Processing of zinc alloy, zinc wire, and other products
NIPPON PGM CO., LTD. 300 60.0 Recovery of platinum group metals from disposable catalysts
ZINC EXCEL CO., LTD. 200 100.0 Sales of zinc, cadmium, zinc alloy, zinc wire, and other products
AKITA ZINC RECYCLING CO., LTD. 100 100.0 Recovery of zinc from iron and steel dust, and other byproducts; outsourcing of zinc secondaries processing
AKITA RECYCLE & FINEPACK CO., LTD. 40 100.0 Pretreatment of nonferrous
AKITA RARE METALS CO., LTD. 20 100.0 Recovery of indium and other products
DOWA METALS & MINING ALASKA LTD. 22,650 thousand U.S. dollars 100.0 Nonferrous metal resource development
NIPPON PGM AMERICA, INC. 1 million U.S. dollars 51.0 Spent catalyst shredding and sampling
DOWA METALS & MINING (THAILAND) CO., LTD. 520 million Thai baht 100.0 Processing and sales of zinc products
Nippon PGM Europe s.r.o. 22,825 thousand Czech koruna 51.0 Spent catalyst shredding and sampling
Electronic Materials
DOWA ELECTRONICS MATERIALS CO., LTD. 1,000 100.0 Manufacturing and sales of semiconductors, and electronic and advanced fine materials
DOWA HIGHTECH CO., LTD. (Chemical) 450 100.0 Manufacturing of metal compounds, chemical and other products
DOWA SEMICONDUCTOR AKITA CO., LTD. 300 100.0 Manufacturing of high-purity metal materials, compound semicon-ductor wafers and light-emitting diodes
DOWA IP CREATION CO., LTD. 300 70.0 Manufacturing of iron and carrier powders
DOWA F-TEC CO., LTD. 300 100.0 Manufacturing of ferrite powders
DOWA ELECTRONICS MATERIALS OKAYAMA CO., LTD. 100 100.0 Manufacturing of metal powders, copper powders, and other materials
NameIssued Share Capital
(Millions of Yen)
Percentage Owned Directly or Indirectly by
the Company (%)*1
Principal Business
Metal Processing
DOWA METALTECH CO., LTD. 1,000 100.0 Metal processing and metal plating
DOWA HIGHTECH CO., LTD. (Electroplating) 450 100.0 Metal electroplating
DOWA METAL CO., LTD. 400 100.0 Manufacturing of copper strip and other products
DOWA METANIX CO., LTD. 400 90.0 Manufacturing of nickel alloys, copper alloys, and electronics parts
HOEI SHOJI CO., LTD. 110 100.0 Processing and sales of copper strip and aluminum products
DOWA POWER DEVICE CO., LTD. 100 100.0 Metal-ceramic substrates manufacturing
NEW NIPPON BRASS CO., LTD. 100 100.0 Manufacturing of brass bars and forged products
DOWA ADVANCED MATERIALS SHANGHAI CO., LTD.
2,500 thousand U.S. dollars 100.0 Processing and sales of copper strip products
DOWA METALTEC (THAILAND) CO., LTD. 475 million Thai baht 100.0 Processing and sales of copper strip products
DOWA NEW MATERIALS (SHANGHAI) CO., LTD. 1 million Chinese Yuan 100.0 Sales of copper strip products
Heat Treatment
DOWA THERMOTECH CO., LTD. 1,000 100.0 Heat treatment processing
DOWA THERMOENGINEERING CO., LTD. 100 100.0Design, manufacturing, maintenance, and improvement of heat treat-ment equipment, heat treatment processing, surface processing, surface improvement
CEMM CO., LTD. 55 100.0 Heat treatment processing and surface processing
TONETSU KOHSAN CO., LTD. 30 100.0 Heat treatment processing
KUNSHAN DOWA THERMO FURNACE CO., LTD. 12 million U.S. dollars 100.0 Design, manufacturing, maintenance, and improvement of heat treat-ment equipment, heat treatment processing, surface processing
DOWA THT AMERICA, INC. 5 million U.S. dollars 100.0 Heat treatment processing, surface processing, maintenance of heat treatment equipment
DOWA Thermotech (Thailand) Co., Ltd. 270 million Thai baht 100.0 Heat treatment processing, surface processing, maintenance of heat treatment equipment
PT. DOWA THERMOTECH INDONESIA 279,573 million Indonesia rupiah 100.0 Heat treatment processing and surface processing
PT. DOWA THERMOTECH FURNACES 11,666 million Indonesia rupiah 100.0 Imports, maintenance, and maintenance of heat treatment equipment
HIGHTEMP FURNACES LTD. 90 million Indian rupee 93.3
Design, manufacturing, maintenance, and improvement of heat treat-ment equipment, heat treatment processing, surface processing, processing of machine components
Others
DOWA TECHNO ENGINEERING CO., LTD. 400 100.0 Plant construction
DOWA KOHSAN CO., LTD. 305 100.0 Outsourcing and management of golf courses and real estate, brokerage
DOWA MANAGEMENT SERVICE CO., LTD. 100 100.0 Outsourcing of general indirect business services
AKITA ENGINEERING CO., LTD. 95 100.0 Construction of machinery and electronics, maintenance of plants
YOWA ENGINEERING CO., LTD. 20 100.0 Construction, maintenance of machinery and electronics, heavy con-crete works business
DOWA TECHNOLOGY CO., LTD. 10 100.0 Technological development support; outsourcing of analysis and evaluation services
DOWA TECHNO RESEARCH CO., LTD. 10 100.0 Outsourcing of analysis and evaluation services, environmental measurement
Five other companies
Affiliates Accounted for by the Equity Method
KOWA SEIKO CO., LTD. 1,000 50.0 Waste treatment, recovery of ferrous and nonferrous materials
Akagi Kouyu Co., Ltd. 99 20.0 Waste treatment
Okayama Rinko Co., Ltd. 98 32.7 Warehousing
Onahama Smelting & Refining Co., Ltd. 7,000 31.6 Copper smelting and refining, waste treatment
Acids Co., Ltd. 150 50.0 Sale of sulfuric acid
Cariboo Copper Corporation 91 million Canadian dollars 25.0 Mining and sales of products from mines
MINERA TIZAPA, S.A. DE C.V. 10,285 Thousand Mexican pesos*3 39.0 Nonferrous metal resource mining
ARRENDADORA MINERA ZACAZONAPAN, S.A. DE C.V. 8 million Mexican pesos*3 39.0 Nonferrous metal resource mining
EXPLORACIONES Y DESARROLLOS MINEROS TIZAPA, S.A. DE C.V.
728 Thousand Mexican pesos*3 39.0 Nonferrous metal resource mining
MINERA PLATA REAL, S. DE R.L. DE C.V. 128,657 thousand U.S. dollars
30.0 Nonferrous metal resource development
OPERACIONES SAN JOSÉ DE PLATA, S. DE R.L. DE C.V. 100 thousand U.S. dollars
30.0 Nonferrous metal resource development
SERVICIOS SAN JOSÉ DE PLATA, S. DE R.L. DE C.V. 13 thousand U.S. dollars
30.0 Nonferrous metal resource development
Kyoto Elex Co., Ltd. 80 49.9 Manufacturing and sales of conductive pastes
TOKUYAMA-DOWA POWER MATERIAL CO., LTD. 250 35.0 Ceramic substrates manufacturing
Japan Copper Casting Co., Ltd. 200 30.0 Various types of copper manufacturing and production
Fujita Kanko Inc.*2 12,081 31.8 Lodging and hotel management; real estate agent
NIPPON ANFO MANUFACTURING Co., Ltd. 91 29.1 Production and marketing of industrial explosives
* 1 The figures for the percentage owned by the Company include indirect ownership by the Company.* 2 The shares of this company are listed on the Tokyo Stock Exchange.* 3 The amount of capital stated includes the adjusted amounts that resulted from inflation accounting.
30 DOWA HOLDINGS CO., LTD. ANNUAL REPORT 2017 31
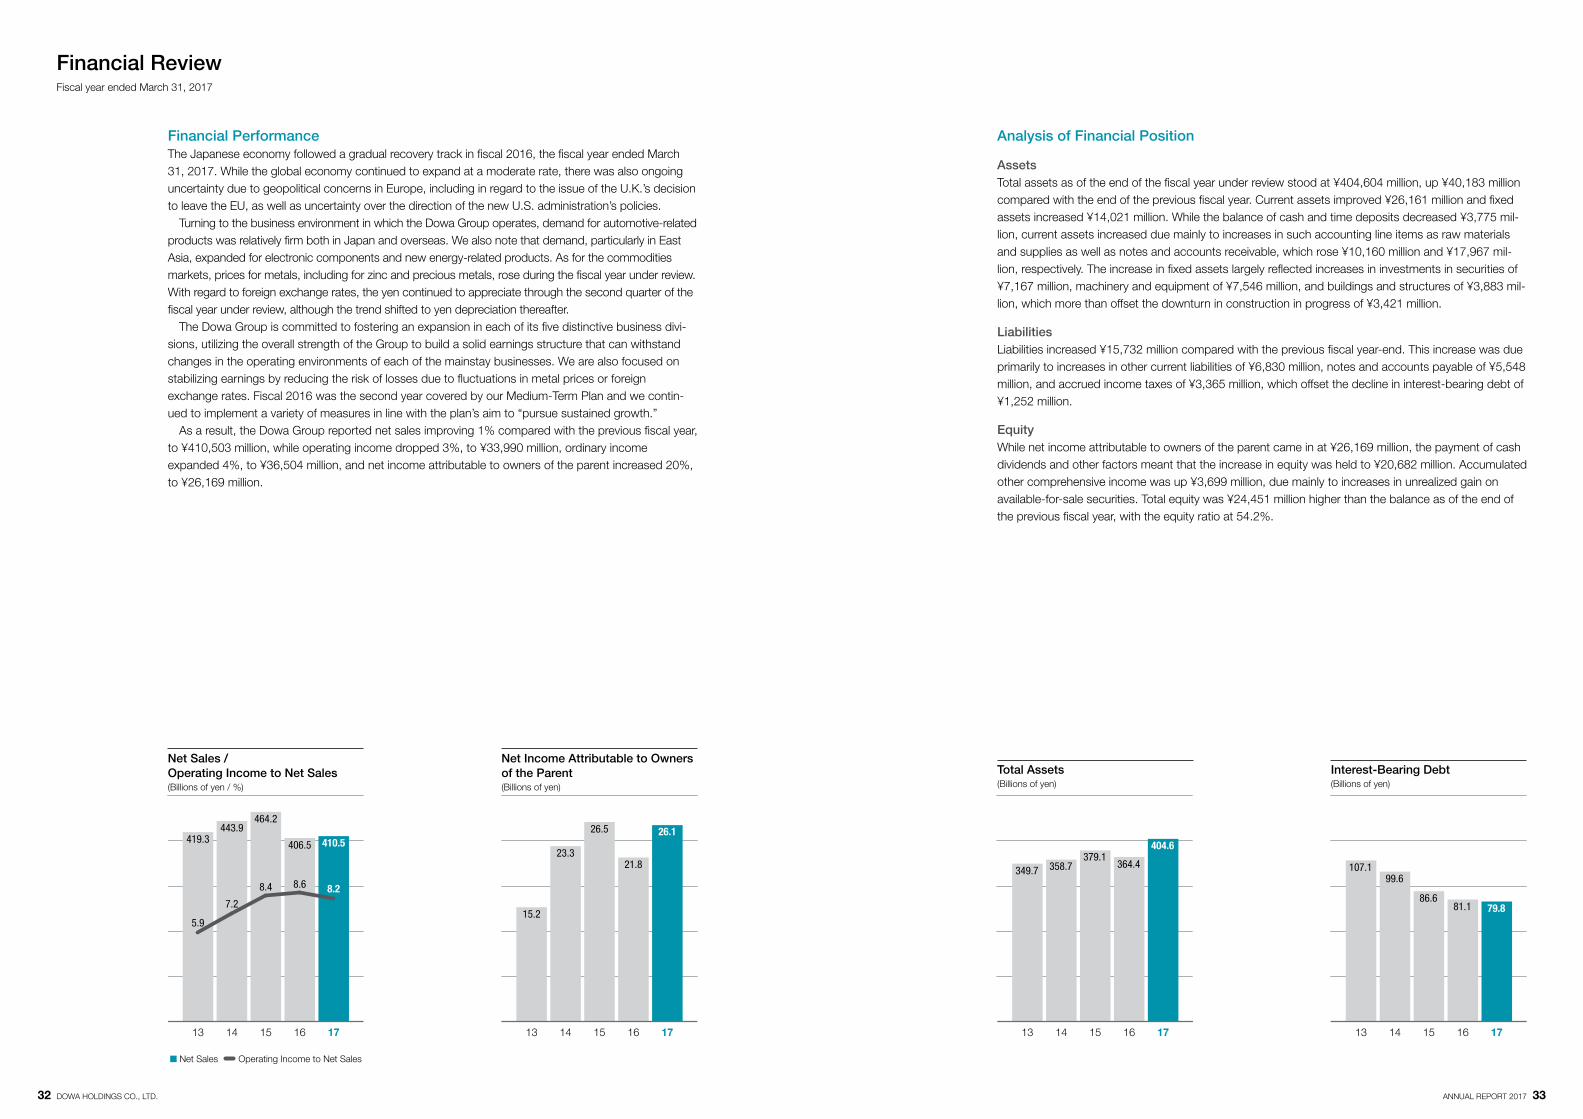
Financial PerformanceThe Japanese economy followed a gradual recovery track in fiscal 2016, the fiscal year ended March 31, 2017. While the global economy continued to expand at a moderate rate, there was also ongoing uncertainty due to geopolitical concerns in Europe, including in regard to the issue of the U.K.’s decision to leave the EU, as well as uncertainty over the direction of the new U.S. administration’s policies. Turning to the business environment in which the Dowa Group operates, demand for automotive-related products was relatively firm both in Japan and overseas. We also note that demand, particularly in East Asia, expanded for electronic components and new energy-related products. As for the commodities markets, prices for metals, including for zinc and precious metals, rose during the fiscal year under review. With regard to foreign exchange rates, the yen continued to appreciate through the second quarter of the fiscal year under review, although the trend shifted to yen depreciation thereafter. The Dowa Group is committed to fostering an expansion in each of its five distinctive business divi-sions, utilizing the overall strength of the Group to build a solid earnings structure that can withstand changes in the operating environments of each of the mainstay businesses. We are also focused on stabilizing earnings by reducing the risk of losses due to fluctuations in metal prices or foreign exchange rates. Fiscal 2016 was the second year covered by our Medium-Term Plan and we contin-ued to implement a variety of measures in line with the plan’s aim to “pursue sustained growth.” As a result, the Dowa Group reported net sales improving 1% compared with the previous fiscal year, to ¥410,503 million, while operating income dropped 3%, to ¥33,990 million, ordinary income expanded 4%, to ¥36,504 million, and net income attributable to owners of the parent increased 20%, to ¥26,169 million.
Financial ReviewFiscal year ended March 31, 2017
13 14 15 16 17
419.3 410.5443.9
5.9
8.2
406.5
8.6
464.2
8.4
7.215.2
26.1
21.8
26.5
23.3
13 14 15 16 17
3,196349.7
404.6
364.4379.1
358.7
13 14 15 16 17
1,176
107.1
79.881.186.6
99.6
13 14 15 16 17
Analysis of Financial Position
AssetsTotal assets as of the end of the fiscal year under review stood at ¥404,604 million, up ¥40,183 million compared with the end of the previous fiscal year. Current assets improved ¥26,161 million and fixed assets increased ¥14,021 million. While the balance of cash and time deposits decreased ¥3,775 mil-lion, current assets increased due mainly to increases in such accounting line items as raw materials and supplies as well as notes and accounts receivable, which rose ¥10,160 million and ¥17,967 mil-lion, respectively. The increase in fixed assets largely reflected increases in investments in securities of ¥7,167 million, machinery and equipment of ¥7,546 million, and buildings and structures of ¥3,883 mil-lion, which more than offset the downturn in construction in progress of ¥3,421 million.
LiabilitiesLiabilities increased ¥15,732 million compared with the previous fiscal year-end. This increase was due primarily to increases in other current liabilities of ¥6,830 million, notes and accounts payable of ¥5,548 million, and accrued income taxes of ¥3,365 million, which offset the decline in interest-bearing debt of ¥1,252 million.
EquityWhile net income attributable to owners of the parent came in at ¥26,169 million, the payment of cash dividends and other factors meant that the increase in equity was held to ¥20,682 million. Accumulated other comprehensive income was up ¥3,699 million, due mainly to increases in unrealized gain on available-for-sale securities. Total equity was ¥24,451 million higher than the balance as of the end of the previous fiscal year, with the equity ratio at 54.2%.
Net Sales / Operating Income to Net Sales(Billions of yen / %)
■ Net Sales Operating Income to Net Sales
Net Income Attributable to Owners of the Parent(Billions of yen)
Total Assets(Billions of yen)
Interest-Bearing Debt(Billions of yen)
32 DOWA HOLDINGS CO., LTD. ANNUAL REPORT 2017 33
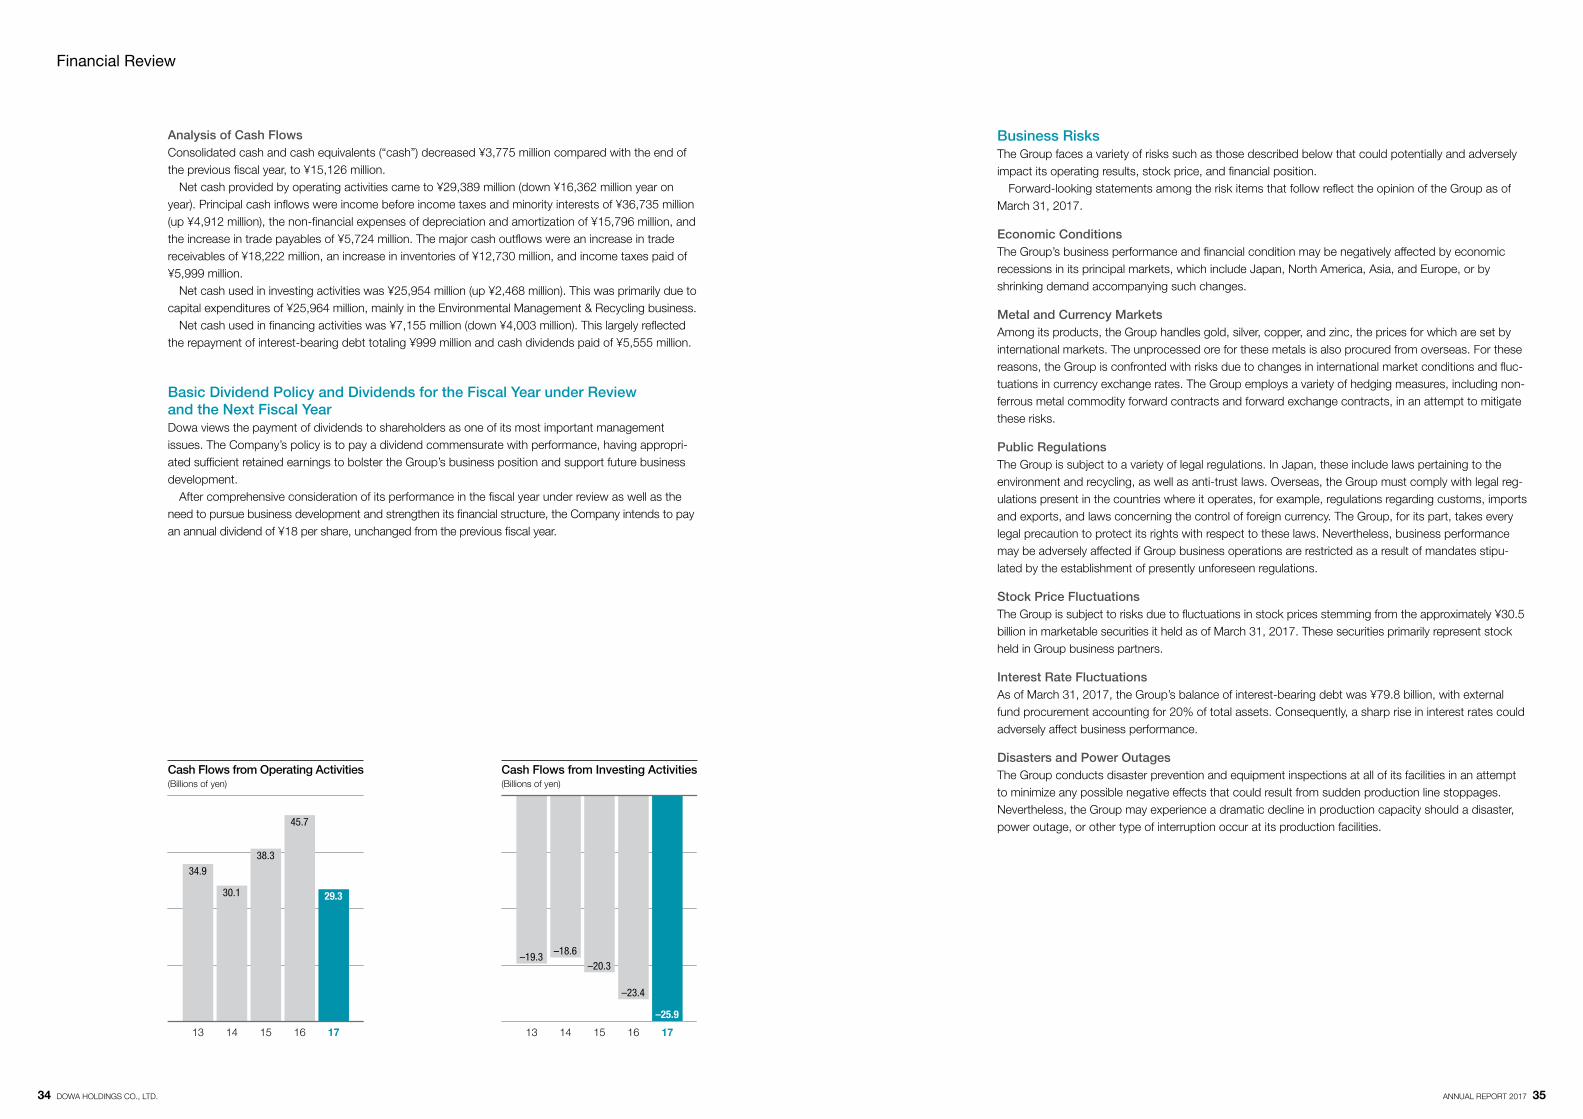
Analysis of Cash FlowsConsolidated cash and cash equivalents (“cash”) decreased ¥3,775 million compared with the end of the previous fiscal year, to ¥15,126 million. Net cash provided by operating activities came to ¥29,389 million (down ¥16,362 million year on year). Principal cash inflows were income before income taxes and minority interests of ¥36,735 million (up ¥4,912 million), the non-financial expenses of depreciation and amortization of ¥15,796 million, and the increase in trade payables of ¥5,724 million. The major cash outflows were an increase in trade receivables of ¥18,222 million, an increase in inventories of ¥12,730 million, and income taxes paid of ¥5,999 million. Net cash used in investing activities was ¥25,954 million (up ¥2,468 million). This was primarily due to capital expenditures of ¥25,964 million, mainly in the Environmental Management & Recycling business. Net cash used in financing activities was ¥7,155 million (down ¥4,003 million). This largely reflected the repayment of interest-bearing debt totaling ¥999 million and cash dividends paid of ¥5,555 million.
Business RisksThe Group faces a variety of risks such as those described below that could potentially and adversely impact its operating results, stock price, and financial position. Forward-looking statements among the risk items that follow reflect the opinion of the Group as of March 31, 2017.
Economic ConditionsThe Group’s business performance and financial condition may be negatively affected by economic recessions in its principal markets, which include Japan, North America, Asia, and Europe, or by shrinking demand accompanying such changes.
Metal and Currency MarketsAmong its products, the Group handles gold, silver, copper, and zinc, the prices for which are set by international markets. The unprocessed ore for these metals is also procured from overseas. For these reasons, the Group is confronted with risks due to changes in international market conditions and fluc-tuations in currency exchange rates. The Group employs a variety of hedging measures, including non-ferrous metal commodity forward contracts and forward exchange contracts, in an attempt to mitigate these risks.
Public RegulationsThe Group is subject to a variety of legal regulations. In Japan, these include laws pertaining to the environment and recycling, as well as anti-trust laws. Overseas, the Group must comply with legal reg-ulations present in the countries where it operates, for example, regulations regarding customs, imports and exports, and laws concerning the control of foreign currency. The Group, for its part, takes every legal precaution to protect its rights with respect to these laws. Nevertheless, business performance may be adversely affected if Group business operations are restricted as a result of mandates stipu-lated by the establishment of presently unforeseen regulations.
Stock Price FluctuationsThe Group is subject to risks due to fluctuations in stock prices stemming from the approximately ¥30.5 billion in marketable securities it held as of March 31, 2017. These securities primarily represent stock held in Group business partners.
Interest Rate FluctuationsAs of March 31, 2017, the Group’s balance of interest-bearing debt was ¥79.8 billion, with external fund procurement accounting for 20% of total assets. Consequently, a sharp rise in interest rates could adversely affect business performance.
Disasters and Power OutagesThe Group conducts disaster prevention and equipment inspections at all of its facilities in an attempt to minimize any possible negative effects that could result from sudden production line stoppages. Nevertheless, the Group may experience a dramatic decline in production capacity should a disaster, power outage, or other type of interruption occur at its production facilities.
Basic Dividend Policy and Dividends for the Fiscal Year under Review and the Next Fiscal YearDowa views the payment of dividends to shareholders as one of its most important management issues. The Company’s policy is to pay a dividend commensurate with performance, having appropri-ated sufficient retained earnings to bolster the Group’s business position and support future business development. After comprehensive consideration of its performance in the fiscal year under review as well as the need to pursue business development and strengthen its financial structure, the Company intends to pay an annual dividend of ¥18 per share, unchanged from the previous fiscal year.
314
34.9
29.3
45.7
38.3
30.1
13 14 15 16 17
–194
–19.3
–25.9
–23.4
–20.3–18.6
13 14 15 16 17
Financial Review
Cash Flows from Operating Activities(Billions of yen)
Cash Flows from Investing Activities(Billions of yen)
34 DOWA HOLDINGS CO., LTD. ANNUAL REPORT 2017 35
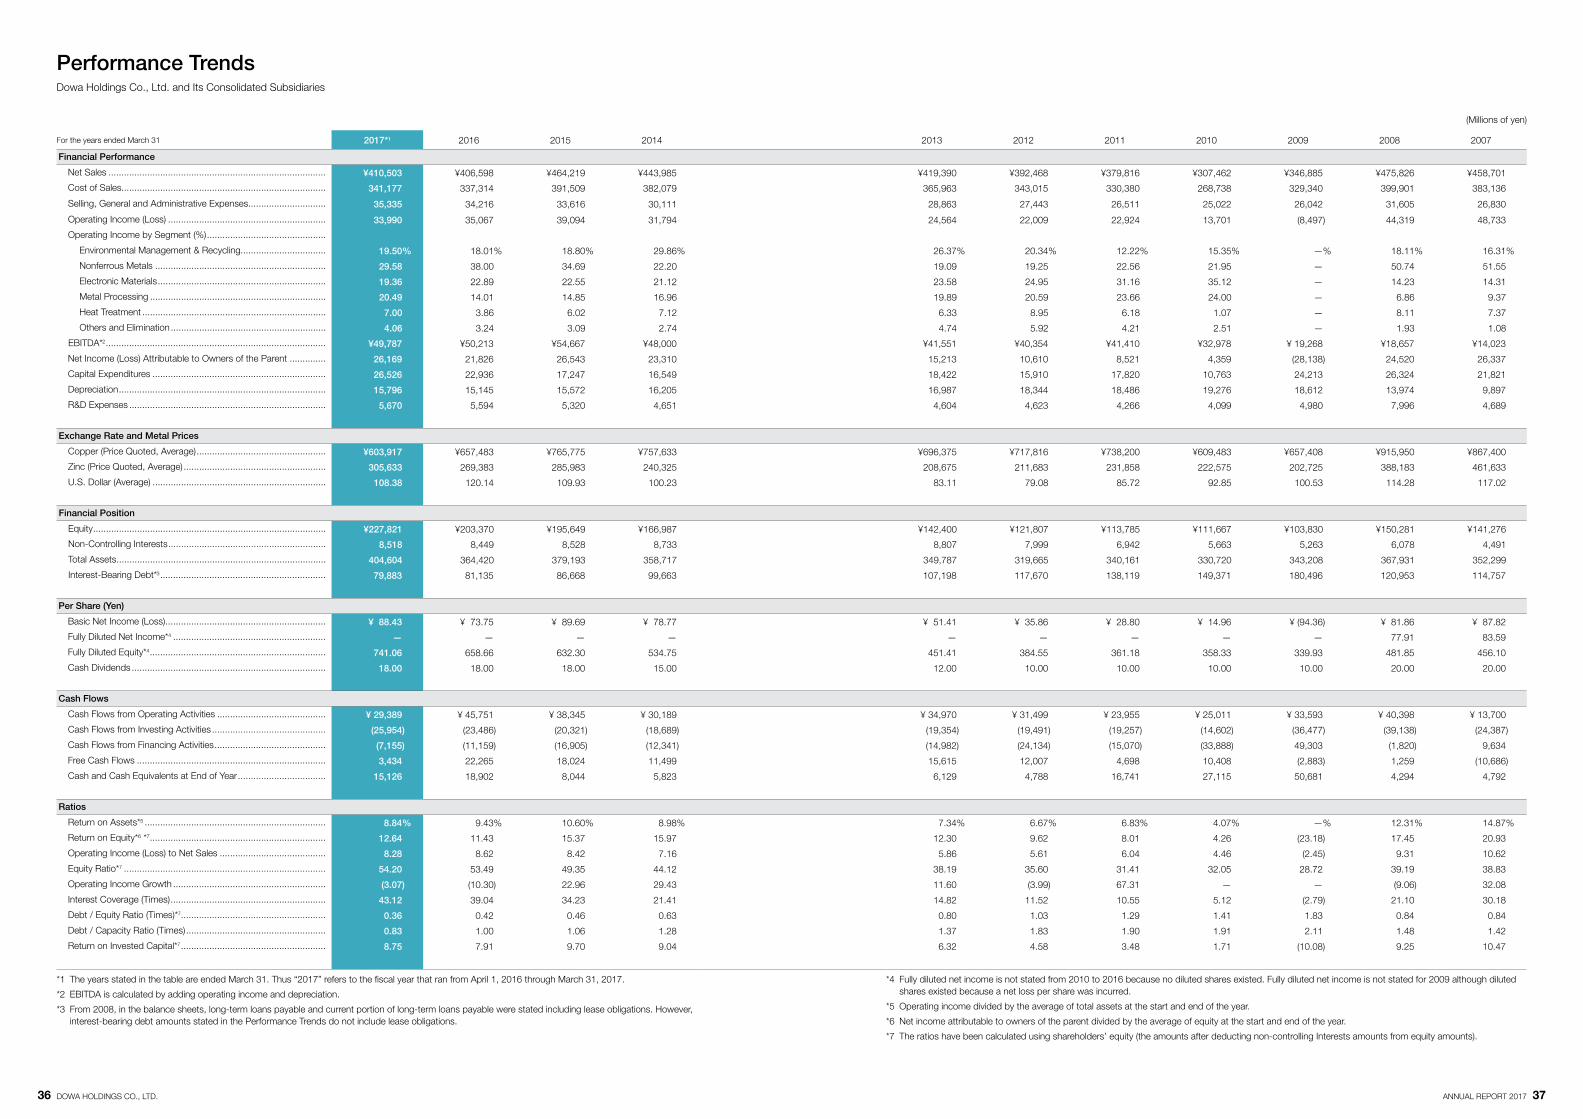
Performance TrendsDowa Holdings Co., Ltd. and Its Consolidated Subsidiaries
(Millions of yen)
For the years ended March 31 2017*1 2016 2015 2014 2013 2012 2011 2010 2009 2008 2007
Financial Performance
Net Sales .................................................................................... ¥410,503 ¥406,598 ¥464,219 ¥443,985 ¥419,390 ¥392,468 ¥379,816 ¥307,462 ¥346,885 ¥475,826 ¥458,701
Cost of Sales............................................................................... 341,177 337,314 391,509 382,079 365,963 343,015 330,380 268,738 329,340 399,901 383,136
Selling, General and Administrative Expenses .............................. 35,335 34,216 33,616 30,111 28,863 27,443 26,511 25,022 26,042 31,605 26,830
Operating Income (Loss) ............................................................. 33,990 35,067 39,094 31,794 24,564 22,009 22,924 13,701 (8,497) 44,319 48,733
Operating Income by Segment (%) ..............................................
Environmental Management & Recycling................................. 19.50% 18.01% 18.80% 29.86% 26.37% 20.34% 12.22% 15.35% —% 18.11% 16.31%
Nonferrous Metals .................................................................. 29.58 38.00 34.69 22.20 19.09 19.25 22.56 21.95 — 50.74 51.55
Electronic Materials ................................................................. 19.36 22.89 22.55 21.12 23.58 24.95 31.16 35.12 — 14.23 14.31
Metal Processing .................................................................... 20.49 14.01 14.85 16.96 19.89 20.59 23.66 24.00 — 6.86 9.37
Heat Treatment ....................................................................... 7.00 3.86 6.02 7.12 6.33 8.95 6.18 1.07 — 8.11 7.37
Others and Elimination ............................................................ 4.06 3.24 3.09 2.74 4.74 5.92 4.21 2.51 — 1.93 1.08
EBITDA*2 ..................................................................................... ¥49,787 ¥50,213 ¥54,667 ¥48,000 ¥41,551 ¥40,354 ¥41,410 ¥32,978 ¥ 19,268 ¥18,657 ¥14,023
Net Income (Loss) Attributable to Owners of the Parent .............. 26,169 21,826 26,543 23,310 15,213 10,610 8,521 4,359 (28,138) 24,520 26,337
Capital Expenditures ................................................................... 26,526 22,936 17,247 16,549 18,422 15,910 17,820 10,763 24,213 26,324 21,821
Depreciation ................................................................................ 15,796 15,145 15,572 16,205 16,987 18,344 18,486 19,276 18,612 13,974 9,897
R&D Expenses ............................................................................ 5,670 5,594 5,320 4,651 4,604 4,623 4,266 4,099 4,980 7,996 4,689
Exchange Rate and Metal Prices
Copper (Price Quoted, Average) .................................................. ¥603,917 ¥657,483 ¥765,775 ¥757,633 ¥696,375 ¥717,816 ¥738,200 ¥609,483 ¥657,408 ¥915,950 ¥867,400
Zinc (Price Quoted, Average) ....................................................... 305,633 269,383 285,983 240,325 208,675 211,683 231,858 222,575 202,725 388,183 461,633
U.S. Dollar (Average) ................................................................... 108.38 120.14 109.93 100.23 83.11 79.08 85.72 92.85 100.53 114.28 117.02
Financial Position
Equity .......................................................................................... ¥227,821 ¥203,370 ¥195,649 ¥166,987 ¥142,400 ¥121,807 ¥113,785 ¥111,667 ¥103,830 ¥150,281 ¥141,276
Non-Controlling Interests ............................................................. 8,518 8,449 8,528 8,733 8,807 7,999 6,942 5,663 5,263 6,078 4,491
Total Assets ................................................................................. 404,604 364,420 379,193 358,717 349,787 319,665 340,161 330,720 343,208 367,931 352,299
Interest-Bearing Debt*3 ................................................................ 79,883 81,135 86,668 99,663 107,198 117,670 138,119 149,371 180,496 120,953 114,757
Per Share (Yen)
Basic Net Income (Loss) .............................................................. ¥ 88.43 ¥ 73.75 ¥ 89.69 ¥ 78.77 ¥ 51.41 ¥ 35.86 ¥ 28.80 ¥ 14.96 ¥ (94.36) ¥ 81.86 ¥ 87.82
Fully Diluted Net Income*4 ........................................................... — — — — — — — — — 77.91 83.59
Fully Diluted Equity*4 .................................................................... 741.06 658.66 632.30 534.75 451.41 384.55 361.18 358.33 339.93 481.85 456.10
Cash Dividends ........................................................................... 18.00 18.00 18.00 15.00 12.00 10.00 10.00 10.00 10.00 20.00 20.00
Cash Flows
Cash Flows from Operating Activities .......................................... ¥ 29,389 ¥ 45,751 ¥ 38,345 ¥ 30,189 ¥ 34,970 ¥ 31,499 ¥ 23,955 ¥ 25,011 ¥ 33,593 ¥ 40,398 ¥ 13,700
Cash Flows from Investing Activities ............................................ (25,954) (23,486) (20,321) (18,689) (19,354) (19,491) (19,257) (14,602) (36,477) (39,138) (24,387)
Cash Flows from Financing Activities ........................................... (7,155) (11,159) (16,905) (12,341) (14,982) (24,134) (15,070) (33,888) 49,303 (1,820) 9,634
Free Cash Flows ......................................................................... 3,434 22,265 18,024 11,499 15,615 12,007 4,698 10,408 (2,883) 1,259 (10,686)
Cash and Cash Equivalents at End of Year .................................. 15,126 18,902 8,044 5,823 6,129 4,788 16,741 27,115 50,681 4,294 4,792
Ratios
Return on Assets*5 ...................................................................... 8.84% 9.43% 10.60% 8.98% 7.34% 6.67% 6.83% 4.07% —% 12.31% 14.87%
Return on Equity*6 *7 .................................................................... 12.64 11.43 15.37 15.97 12.30 9.62 8.01 4.26 (23.18) 17.45 20.93
Operating Income (Loss) to Net Sales ......................................... 8.28 8.62 8.42 7.16 5.86 5.61 6.04 4.46 (2.45) 9.31 10.62
Equity Ratio*7 .............................................................................. 54.20 53.49 49.35 44.12 38.19 35.60 31.41 32.05 28.72 39.19 38.83
Operating Income Growth ........................................................... (3.07) (10.30) 22.96 29.43 11.60 (3.99) 67.31 — — (9.06) 32.08
Interest Coverage (Times) ............................................................ 43.12 39.04 34.23 21.41 14.82 11.52 10.55 5.12 (2.79) 21.10 30.18
Debt / Equity Ratio (Times)*7 ........................................................ 0.36 0.42 0.46 0.63 0.80 1.03 1.29 1.41 1.83 0.84 0.84
Debt / Capacity Ratio (Times) ...................................................... 0.83 1.00 1.06 1.28 1.37 1.83 1.90 1.91 2.11 1.48 1.42
Return on Invested Capital*7 ........................................................ 8.75 7.91 9.70 9.04 6.32 4.58 3.48 1.71 (10.08) 9.25 10.47
*1 The years stated in the table are ended March 31. Thus “2017” refers to the fiscal year that ran from April 1, 2016 through March 31, 2017.
*2 EBITDA is calculated by adding operating income and depreciation.
*3 From 2008, in the balance sheets, long-term loans payable and current portion of long-term loans payable were stated including lease obligations. However, interest-bearing debt amounts stated in the Performance Trends do not include lease obligations.
*4 Fully diluted net income is not stated from 2010 to 2016 because no diluted shares existed. Fully diluted net income is not stated for 2009 although diluted shares existed because a net loss per share was incurred.
*5 Operating income divided by the average of total assets at the start and end of the year.
*6 Net income attributable to owners of the parent divided by the average of equity at the start and end of the year.
*7 The ratios have been calculated using shareholders’ equity (the amounts after deducting non-controlling Interests amounts from equity amounts).
36 DOWA HOLDINGS CO., LTD. ANNUAL REPORT 2017 37
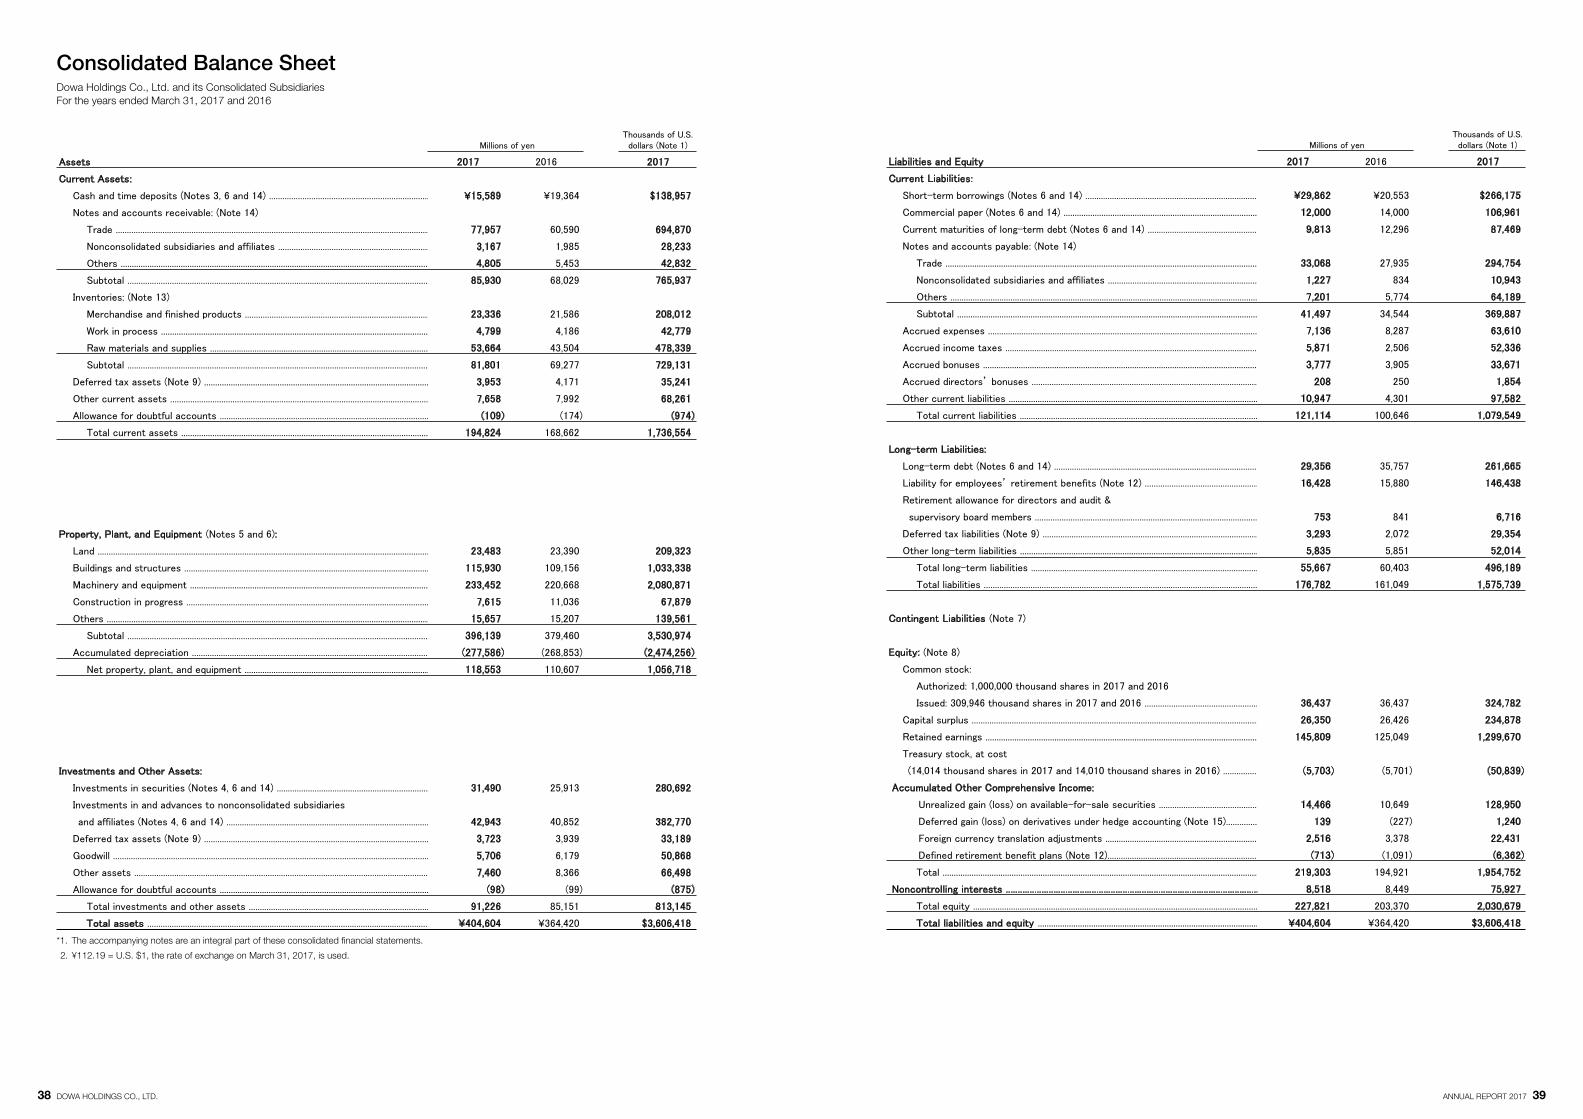
¥15,589 ¥19,364
and affiliates (Notes 4, 6 and 14) .................................................................................................................................
¥404,604 ¥364,420
*2. ¥112.19=US$1, the rate of exchange on March 31, 2017, is used.
¥15,589 ¥19,364
and affiliates (Notes 4, 6 and 14) .................................................................................................................................
¥404,604 ¥364,420
*2. ¥112.19=US$1, the rate of exchange on March 31, 2017, is used.
¥29,862 ¥20,553
Accrued directors’ bonuses .............................................................................................................................................................................................
Liability for employees’ retirement benefits (Note 12) .......................................................................
(14,014 thousand shares in 2017 and 14,010 thousand shares in 2016) ............................................
¥404,604 ¥364,420
Consolidated Balance SheetDowa Holdings Co., Ltd. and its Consolidated SubsidiariesFor the years ended March 31, 2017 and 2016
*1. The accompanying notes are an integral part of these consolidated financial statements.
2. ¥112.19 = U.S. $1, the rate of exchange on March 31, 2017, is used.
38 DOWA HOLDINGS CO., LTD. ANNUAL REPORT 2017 39
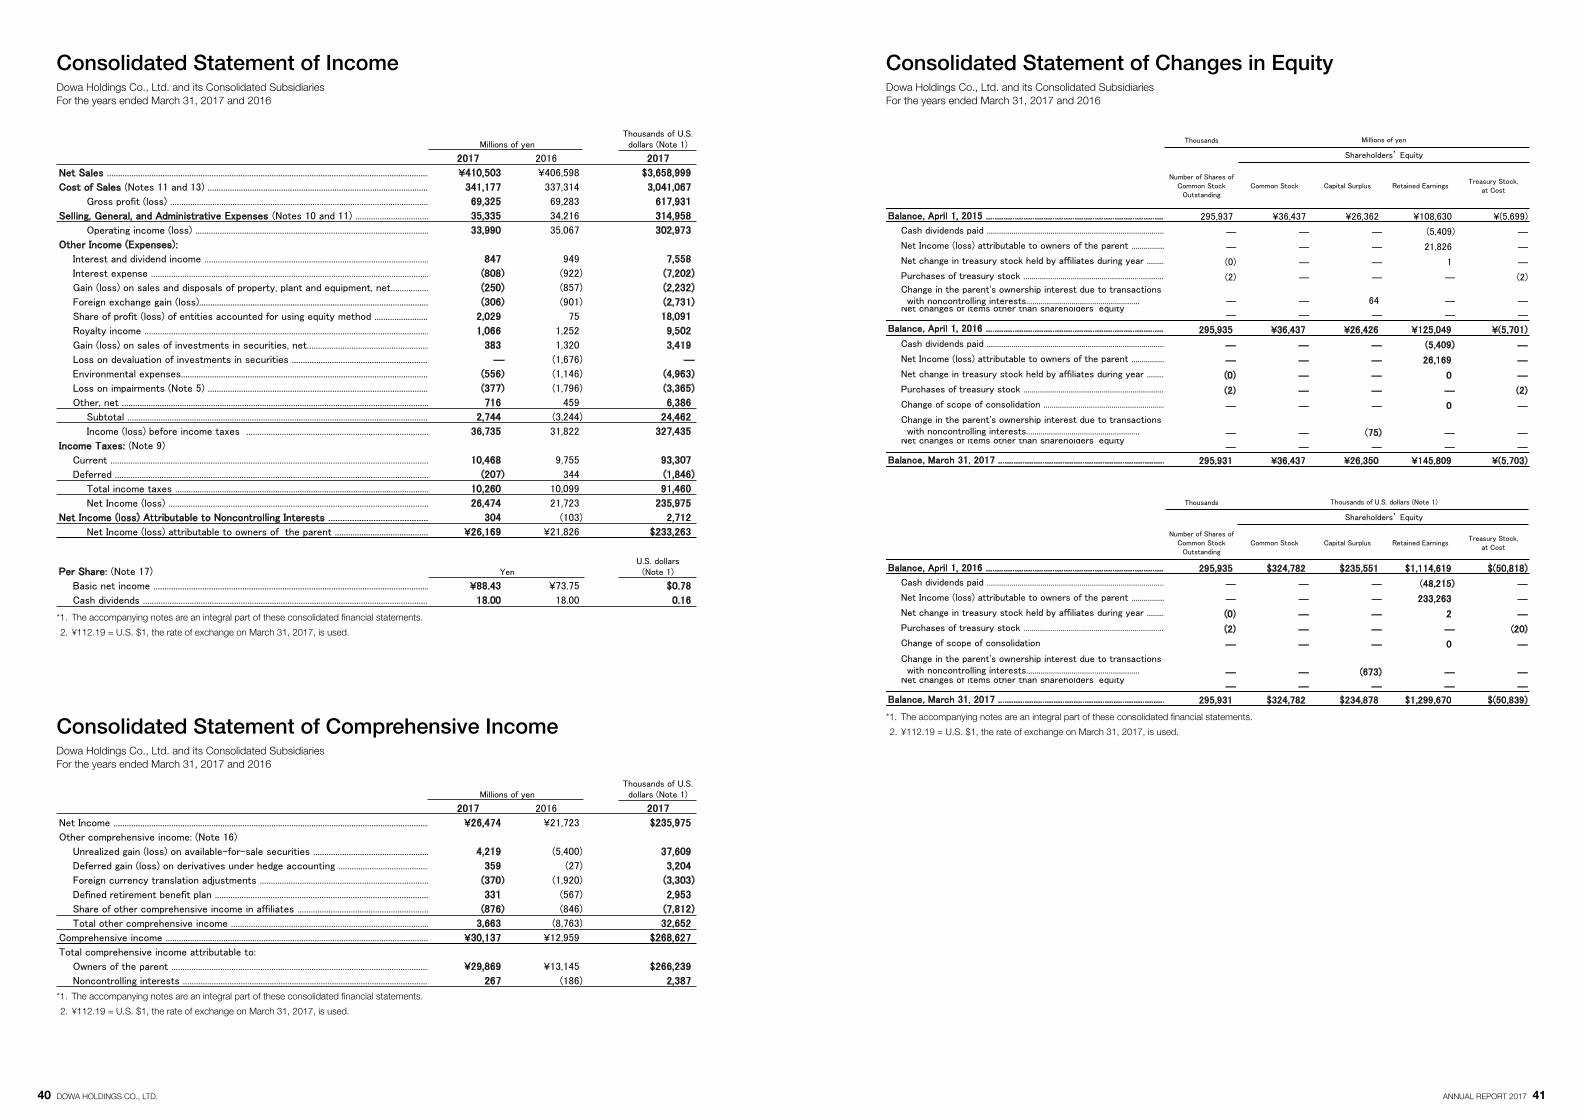
¥410,503 ¥406,598
― ―
¥26,169 ¥21,826
¥88.43 ¥73.75
*2. ¥112.19=US$1, the rate of exchange on March 31, 2017, is used.
¥26,474 ¥21,723
Share of other comprehensive income in affiliates .............................................................................................
¥30,137 ¥12,959
¥29,869 ¥13,145
*2. ¥112.19=US$1, the rate of exchange on March 31, 2017, is used.
¥36,437 ¥26,362 ¥108,630 ¥(5,699)
― ― ― ―
― ― ― ―
― ― ―
― ― ―
― ― ― ―
― ― ― ― ―
¥36,437 ¥26,426 ¥125,049 ¥(5,701)
― ― ― ―
― ― ― ―
― ― ―
― ― ―
― ― ― ―
― ― ― ―
― ― ― ― ―
¥36,437 ¥26,350 ¥145,809 ¥(5,703)
― ― ― ―
― ― ― ―
― ― ―
― ― ―
― ― ― ―
― ― ― ―
― ― ― ― ―
*2. ¥112.19=U.S.$1, the rate of exchange on March 31 2017, is used.
Shareholders’ Equity
Shareholders’ Equity
Consolidated Statement of IncomeDowa Holdings Co., Ltd. and its Consolidated SubsidiariesFor the years ended March 31, 2017 and 2016
Consolidated Statement of Comprehensive IncomeDowa Holdings Co., Ltd. and its Consolidated SubsidiariesFor the years ended March 31, 2017 and 2016
Consolidated Statement of Changes in EquityDowa Holdings Co., Ltd. and its Consolidated SubsidiariesFor the years ended March 31, 2017 and 2016
*1. The accompanying notes are an integral part of these consolidated financial statements.
2. ¥112.19 = U.S. $1, the rate of exchange on March 31, 2017, is used.
*1. The accompanying notes are an integral part of these consolidated financial statements.
2. ¥112.19 = U.S. $1, the rate of exchange on March 31, 2017, is used.
*1. The accompanying notes are an integral part of these consolidated financial statements.
2. ¥112.19 = U.S. $1, the rate of exchange on March 31, 2017, is used.
40 DOWA HOLDINGS CO., LTD. ANNUAL REPORT 2017 41
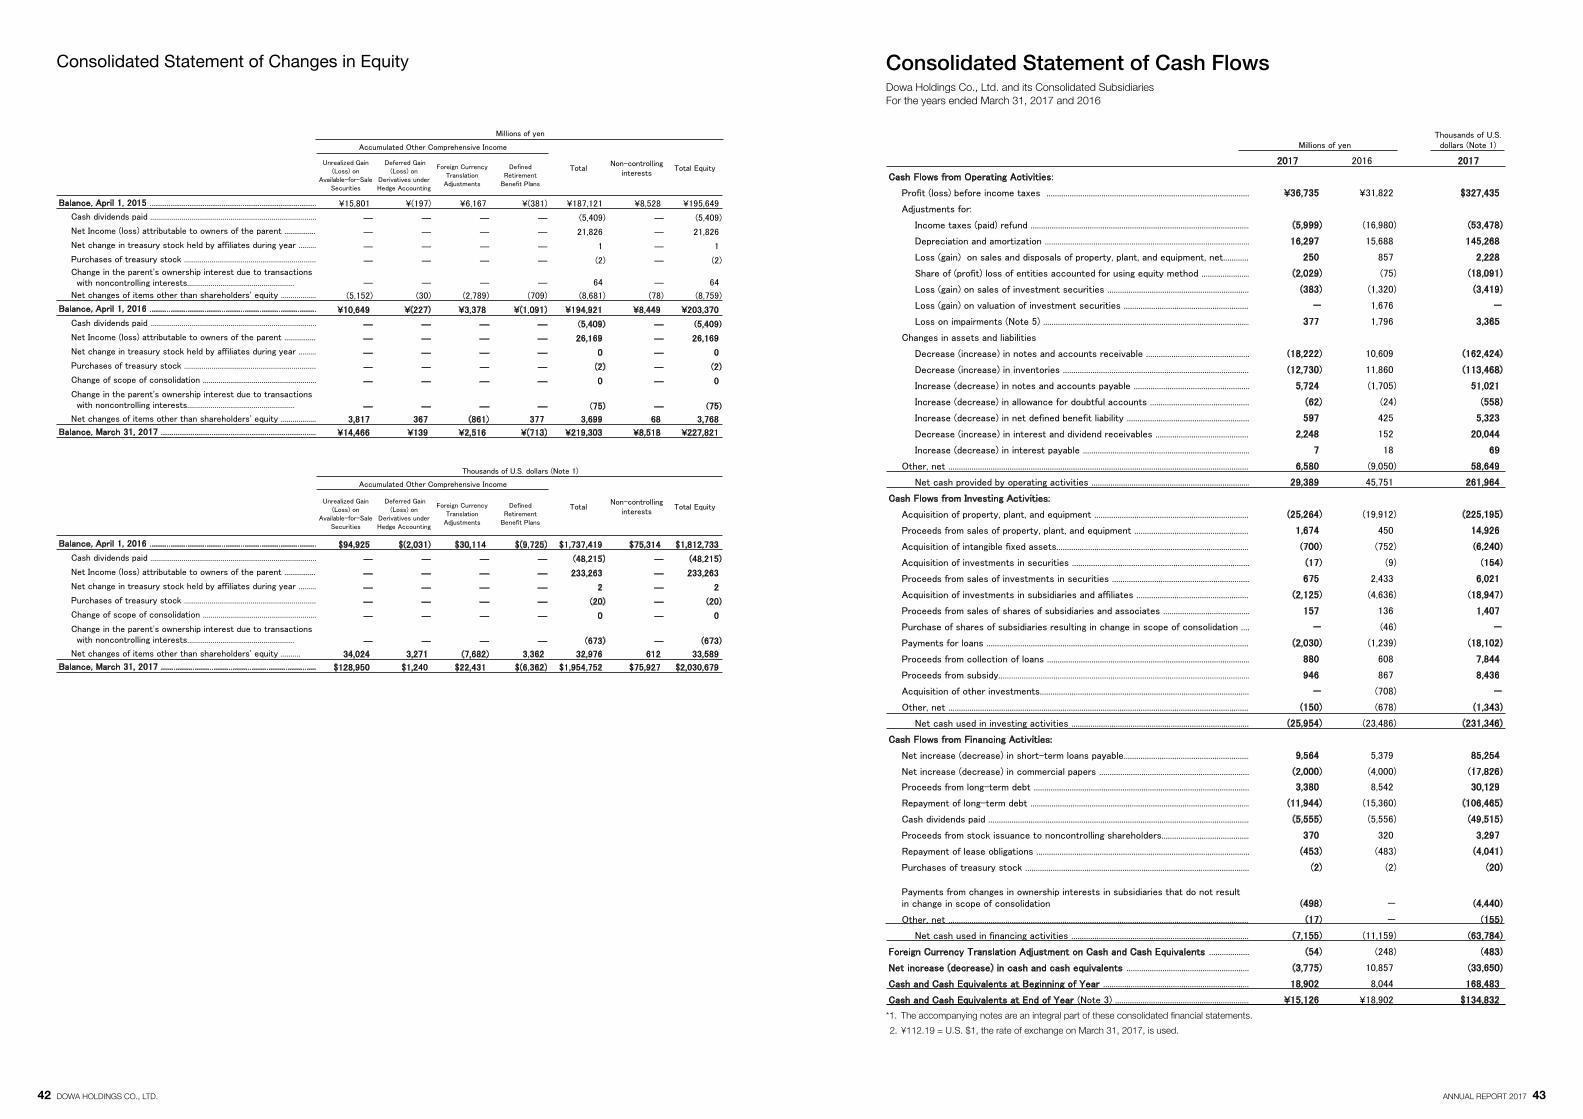
¥15,801 ¥(197) ¥6,167 ¥(381) ¥187,121 ¥8,528 ¥195,649
― ― ― ― ―
― ― ― ― ―
― ― ― ― ―
― ― ― ― ―
― ― ― ― ―
¥10,649 ¥(227) ¥3,378 ¥(1,091) ¥194,921 ¥8,449 ¥203,370
― ― ― ― ―
― ― ― ― ―
― ― ― ― ―
― ― ― ― ―
― ― ― ― ―
― ― ― ― ―
¥14,466 ¥139 ¥2,516 ¥(713) ¥219,303 ¥8,518 ¥227,821
― ― ― ― ―
― ― ― ― ―
― ― ― ― ―
― ― ― ― ―
― ― ― ― ―
― ― ― ― ―
¥36,735 ¥31,822
- -
- -
- -
-
-
¥15,126 ¥18,902
*2. ¥112.19 = U.S. $1, the rate of exchange on March 31, 2017, is used.
Consolidated Statement of Cash FlowsDowa Holdings Co., Ltd. and its Consolidated SubsidiariesFor the years ended March 31, 2017 and 2016
Consolidated Statement of Changes in Equity
*1. The accompanying notes are an integral part of these consolidated financial statements.
2. ¥112.19 = U.S. $1, the rate of exchange on March 31, 2017, is used.
42 DOWA HOLDINGS CO., LTD. ANNUAL REPORT 2017 43
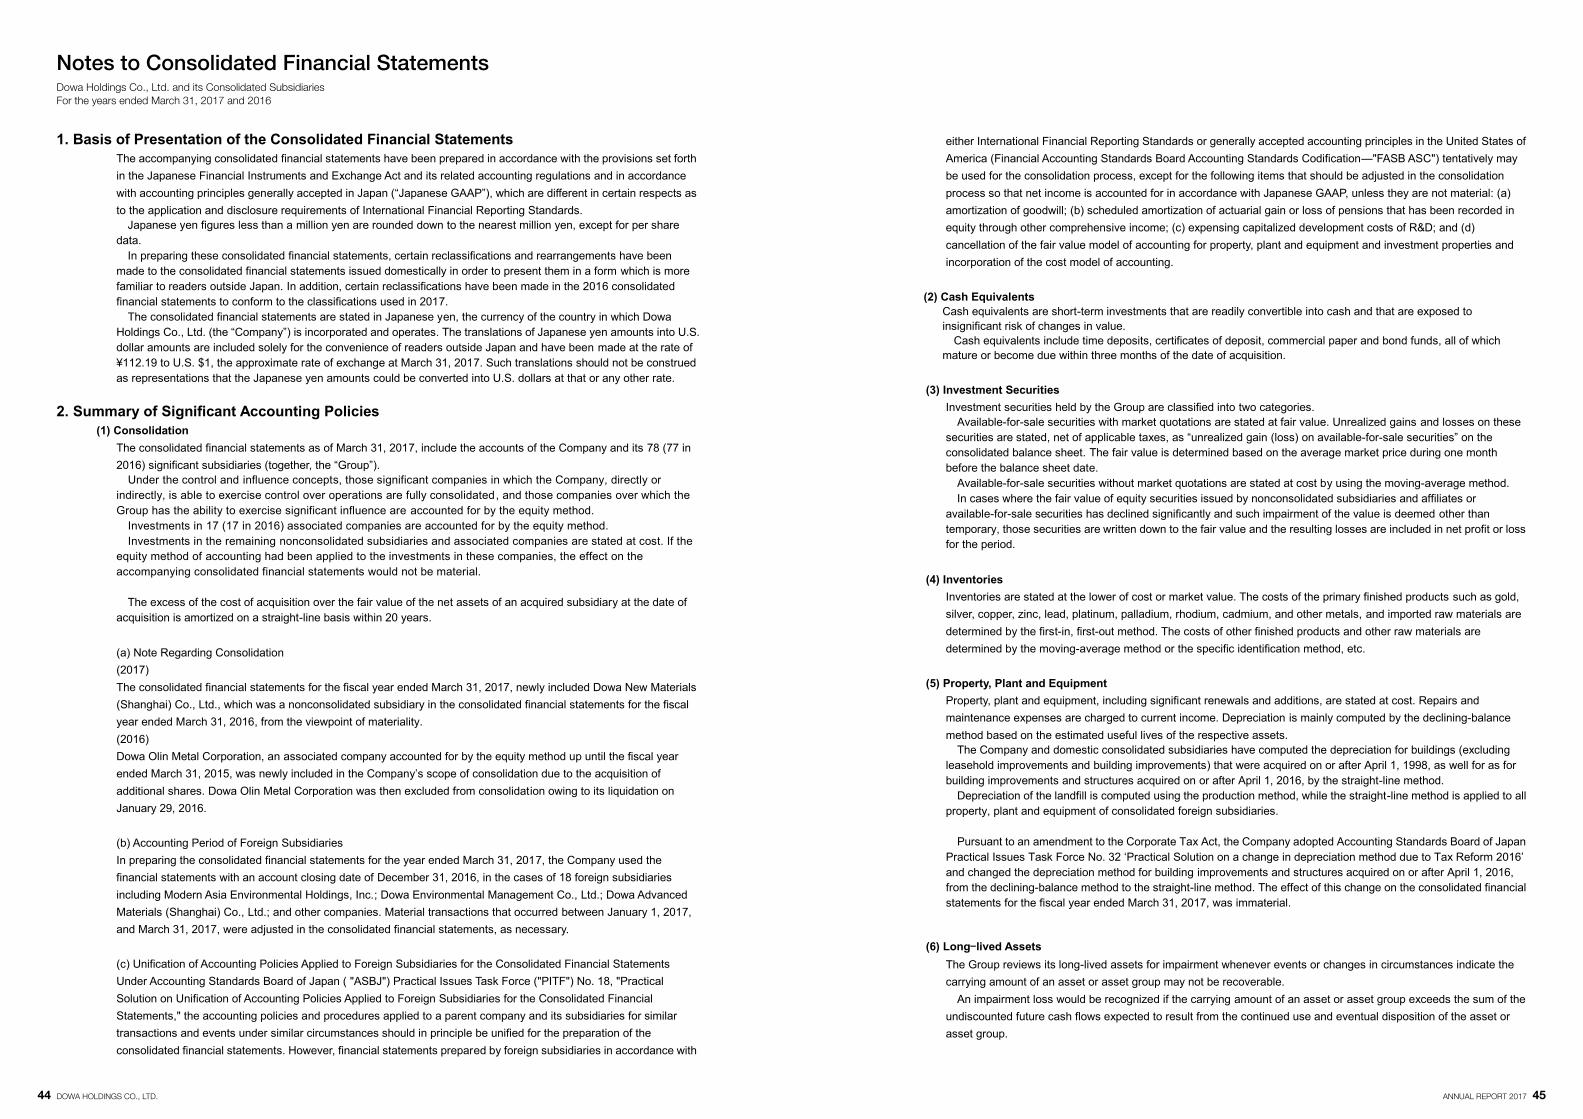
1. Basis of Presentation of the Consolidated Financial Statements The accompanying consolidated financial statements have been prepared in accordance with the provisions set forth in the Japanese Financial Instruments and Exchange Act and its related accounting regulations and in accordance with accounting principles generally accepted in Japan (“Japanese GAAP”), which are different in certain respects as to the application and disclosure requirements of International Financial Reporting Standards.
Japanese yen figures less than a million yen are rounded down to the nearest million yen, except for per share data.
In preparing these consolidated financial statements, certain reclassifications and rearrangements have been made to the consolidated financial statements issued domestically in order to present them in a form which is more familiar to readers outside Japan. In addition, certain reclassifications have been made in the 2016 consolidated financial statements to conform to the classifications used in 2017.
The consolidated financial statements are stated in Japanese yen, the currency of the country in which Dowa Holdings Co., Ltd. (the “Company”) is incorporated and operates. The translations of Japanese yen amounts into U.S. dollar amounts are included solely for the convenience of readers outside Japan and have been made at the rate of ¥112.19 to U.S. $1, the approximate rate of exchange at March 31, 2017. Such translations should not be construed as representations that the Japanese yen amounts could be converted into U.S. dollars at that or any other rate.
2. Summary of Significant Accounting Policies
(1) Consolidation The consolidated financial statements as of March 31, 2017, include the accounts of the Company and its 78 (77 in 2016) significant subsidiaries (together, the “Group”).
Under the control and influence concepts, those significant companies in which the Company, directly or indirectly, is able to exercise control over operations are fully consolidated, and those companies over which the Group has the ability to exercise significant influence are accounted for by the equity method.
Investments in 17 (17 in 2016) associated companies are accounted for by the equity method. Investments in the remaining nonconsolidated subsidiaries and associated companies are stated at cost. If the
equity method of accounting had been applied to the investments in these companies, the effect on the accompanying consolidated financial statements would not be material.
The excess of the cost of acquisition over the fair value of the net assets of an acquired subsidiary at the date of
acquisition is amortized on a straight-line basis within 20 years.
(a) Note Regarding Consolidation (2017) The consolidated financial statements for the fiscal year ended March 31, 2017, newly included Dowa New Materials (Shanghai) Co., Ltd., which was a nonconsolidated subsidiary in the consolidated financial statements for the fiscal year ended March 31, 2016, from the viewpoint of materiality. (2016) Dowa Olin Metal Corporation, an associated company accounted for by the equity method up until the fiscal year ended March 31, 2015, was newly included in the Company‟s scope of consolidation due to the acquisition of additional shares. Dowa Olin Metal Corporation was then excluded from consolidation owing to its liquidation on January 29, 2016.
(b) Accounting Period of Foreign Subsidiaries In preparing the consolidated financial statements for the year ended March 31, 2017, the Company used the financial statements with an account closing date of December 31, 2016, in the cases of 18 foreign subsidiaries including Modern Asia Environmental Holdings, Inc.; Dowa Environmental Management Co., Ltd.; Dowa Advanced Materials (Shanghai) Co., Ltd.; and other companies. Material transactions that occurred between January 1, 2017, and March 31, 2017, were adjusted in the consolidated financial statements, as necessary.
(c) Unification of Accounting Policies Applied to Foreign Subsidiaries for the Consolidated Financial Statements Under Accounting Standards Board of Japan ( "ASBJ") Practical Issues Task Force ("PITF") No. 18, "Practical Solution on Unification of Accounting Policies Applied to Foreign Subsidiaries for the Consolidated Financial Statements," the accounting policies and procedures applied to a parent company and its subsidiaries for similar transactions and events under similar circumstances should in principle be unified for the preparation of the consolidated financial statements. However, financial statements prepared by foreign subsidiaries in accordance with
either International Financial Reporting Standards or generally accepted accounting principles in the United States of America (Financial Accounting Standards Board Accounting Standards Codification—"FASB ASC") tentatively may be used for the consolidation process, except for the following items that should be adjusted in the consolidation process so that net income is accounted for in accordance with Japanese GAAP, unless they are not material: (a) amortization of goodwill; (b) scheduled amortization of actuarial gain or loss of pensions that has been recorded in equity through other comprehensive income; (c) expensing capitalized development costs of R&D; and (d) cancellation of the fair value model of accounting for property, plant and equipment and investment properties and incorporation of the cost model of accounting.
(2) Cash Equivalents
Cash equivalents are short-term investments that are readily convertible into cash and that are exposed to insignificant risk of changes in value.
Cash equivalents include time deposits, certificates of deposit, commercial paper and bond funds, all of which mature or become due within three months of the date of acquisition.
(3) Investment Securities
Investment securities held by the Group are classified into two categories. Available-for-sale securities with market quotations are stated at fair value. Unrealized gains and losses on these
securities are stated, net of applicable taxes, as “unrealized gain (loss) on available-for-sale securities” on the consolidated balance sheet. The fair value is determined based on the average market price during one month before the balance sheet date.
Available-for-sale securities without market quotations are stated at cost by using the moving-average method. In cases where the fair value of equity securities issued by nonconsolidated subsidiaries and affiliates or
available-for-sale securities has declined significantly and such impairment of the value is deemed other than temporary, those securities are written down to the fair value and the resulting losses are included in net profit or loss for the period.
(4) Inventories Inventories are stated at the lower of cost or market value. The costs of the primary finished products such as gold, silver, copper, zinc, lead, platinum, palladium, rhodium, cadmium, and other metals, and imported raw materials are determined by the first-in, first-out method. The costs of other finished products and other raw materials are determined by the moving-average method or the specific identification method, etc.
(5) Property, Plant and Equipment
Property, plant and equipment, including significant renewals and additions, are stated at cost. Repairs and maintenance expenses are charged to current income. Depreciation is mainly computed by the declining-balance method based on the estimated useful lives of the respective assets.
The Company and domestic consolidated subsidiaries have computed the depreciation for buildings (excluding leasehold improvements and building improvements) that were acquired on or after April 1, 1998, as well for as for building improvements and structures acquired on or after April 1, 2016, by the straight-line method.
Depreciation of the landfill is computed using the production method, while the straight-line method is applied to all property, plant and equipment of consolidated foreign subsidiaries.
Pursuant to an amendment to the Corporate Tax Act, the Company adopted Accounting Standards Board of Japan
Practical Issues Task Force No. 32 „Practical Solution on a change in depreciation method due to Tax Reform 2016‟ and changed the depreciation method for building improvements and structures acquired on or after April 1, 2016, from the declining-balance method to the straight-line method. The effect of this change on the consolidated financial statements for the fiscal year ended March 31, 2017, was immaterial.
(6) Long lived Assets The Group reviews its long-lived assets for impairment whenever events or changes in circumstances indicate the carrying amount of an asset or asset group may not be recoverable.
An impairment loss would be recognized if the carrying amount of an asset or asset group exceeds the sum of the undiscounted future cash flows expected to result from the continued use and eventual disposition of the asset or asset group.
Notes to Consolidated Financial StatementsDowa Holdings Co., Ltd. and its Consolidated SubsidiariesFor the years ended March 31, 2017 and 2016
44 DOWA HOLDINGS CO., LTD. ANNUAL REPORT 2017 45
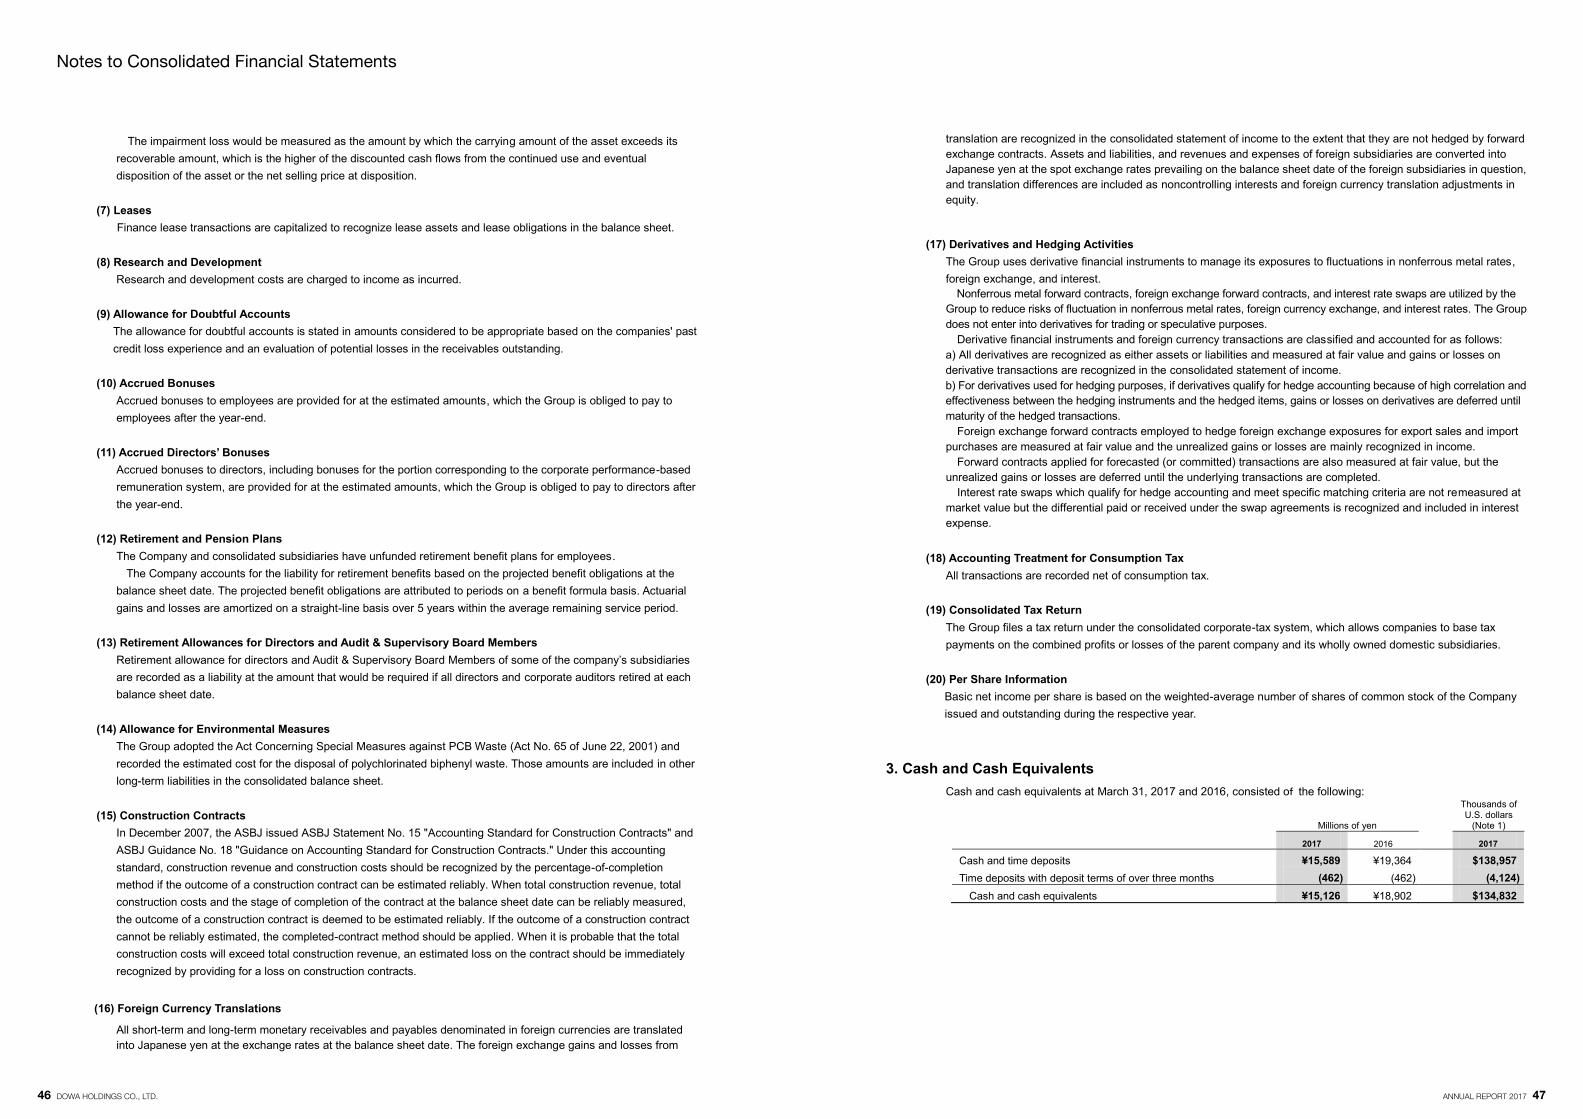
The impairment loss would be measured as the amount by which the carrying amount of the asset exceeds its recoverable amount, which is the higher of the discounted cash flows from the continued use and eventual disposition of the asset or the net selling price at disposition.
(7) Leases
Finance lease transactions are capitalized to recognize lease assets and lease obligations in the balance sheet. (8) Research and Development
Research and development costs are charged to income as incurred. (9) Allowance for Doubtful Accounts
The allowance for doubtful accounts is stated in amounts considered to be appropriate based on the companies' past credit loss experience and an evaluation of potential losses in the receivables outstanding.
(10) Accrued Bonuses
Accrued bonuses to employees are provided for at the estimated amounts, which the Group is obliged to pay to employees after the year-end.
(11) Accrued Directors’ Bonuses
Accrued bonuses to directors, including bonuses for the portion corresponding to the corporate performance-based remuneration system, are provided for at the estimated amounts, which the Group is obliged to pay to directors after the year-end.
(12) Retirement and Pension Plans
The Company and consolidated subsidiaries have unfunded retirement benefit plans for employees. The Company accounts for the liability for retirement benefits based on the projected benefit obligations at the
balance sheet date. The projected benefit obligations are attributed to periods on a benefit formula basis. Actuarial gains and losses are amortized on a straight-line basis over 5 years within the average remaining service period.
(13) Retirement Allowances for Directors and Audit & Supervisory Board Members
Retirement allowance for directors and Audit & Supervisory Board Members of some of the company‟s subsidiaries are recorded as a liability at the amount that would be required if all directors and corporate auditors retired at each balance sheet date.
(14) Allowance for Environmental Measures
The Group adopted the Act Concerning Special Measures against PCB Waste (Act No. 65 of June 22, 2001) and recorded the estimated cost for the disposal of polychlorinated biphenyl waste. Those amounts are included in other long-term liabilities in the consolidated balance sheet.
(15) Construction Contracts
In December 2007, the ASBJ issued ASBJ Statement No. 15 "Accounting Standard for Construction Contracts" and ASBJ Guidance No. 18 "Guidance on Accounting Standard for Construction Contracts." Under this accounting standard, construction revenue and construction costs should be recognized by the percentage-of-completion method if the outcome of a construction contract can be estimated reliably. When total construction revenue, total construction costs and the stage of completion of the contract at the balance sheet date can be reliably measured, the outcome of a construction contract is deemed to be estimated reliably. If the outcome of a construction contract cannot be reliably estimated, the completed-contract method should be applied. When it is probable that the total construction costs will exceed total construction revenue, an estimated loss on the contract should be immediately recognized by providing for a loss on construction contracts.
(16) Foreign Currency Translations
All short-term and long-term monetary receivables and payables denominated in foreign currencies are translated into Japanese yen at the exchange rates at the balance sheet date. The foreign exchange gains and losses from
translation are recognized in the consolidated statement of income to the extent that they are not hedged by forward exchange contracts. Assets and liabilities, and revenues and expenses of foreign subsidiaries are converted into Japanese yen at the spot exchange rates prevailing on the balance sheet date of the foreign subsidiaries in question, and translation differences are included as noncontrolling interests and foreign currency translation adjustments in equity.
(17) Derivatives and Hedging Activities The Group uses derivative financial instruments to manage its exposures to fluctuations in nonferrous metal rates, foreign exchange, and interest.
Nonferrous metal forward contracts, foreign exchange forward contracts, and interest rate swaps are utilized by the Group to reduce risks of fluctuation in nonferrous metal rates, foreign currency exchange, and interest rates. The Group does not enter into derivatives for trading or speculative purposes.
Derivative financial instruments and foreign currency transactions are classified and accounted for as follows: a) All derivatives are recognized as either assets or liabilities and measured at fair value and gains or losses on derivative transactions are recognized in the consolidated statement of income. b) For derivatives used for hedging purposes, if derivatives qualify for hedge accounting because of high correlation and effectiveness between the hedging instruments and the hedged items, gains or losses on derivatives are deferred until maturity of the hedged transactions.
Foreign exchange forward contracts employed to hedge foreign exchange exposures for export sales and import purchases are measured at fair value and the unrealized gains or losses are mainly recognized in income.
Forward contracts applied for forecasted (or committed) transactions are also measured at fair value, but the unrealized gains or losses are deferred until the underlying transactions are completed.
Interest rate swaps which qualify for hedge accounting and meet specific matching criteria are not remeasured at market value but the differential paid or received under the swap agreements is recognized and included in interest expense.
(18) Accounting Treatment for Consumption Tax
All transactions are recorded net of consumption tax.
(19) Consolidated Tax Return The Group files a tax return under the consolidated corporate-tax system, which allows companies to base tax payments on the combined profits or losses of the parent company and its wholly owned domestic subsidiaries.
(20) Per Share Information
Basic net income per share is based on the weighted-average number of shares of common stock of the Company issued and outstanding during the respective year.
3. Cash and Cash Equivalents Cash and cash equivalents at March 31, 2017 and 2016, consisted of the following:
Millions of yen
Thousands of U.S. dollars
(Note 1)
2017 2016 2017
Cash and time deposits ¥15,589 ¥19,364 $138,957 Time deposits with deposit terms of over three months (462) (462) (4,124)
Cash and cash equivalents ¥15,126 ¥18,902 $134,832
Notes to Consolidated Financial Statements
46 DOWA HOLDINGS CO., LTD. ANNUAL REPORT 2017 47
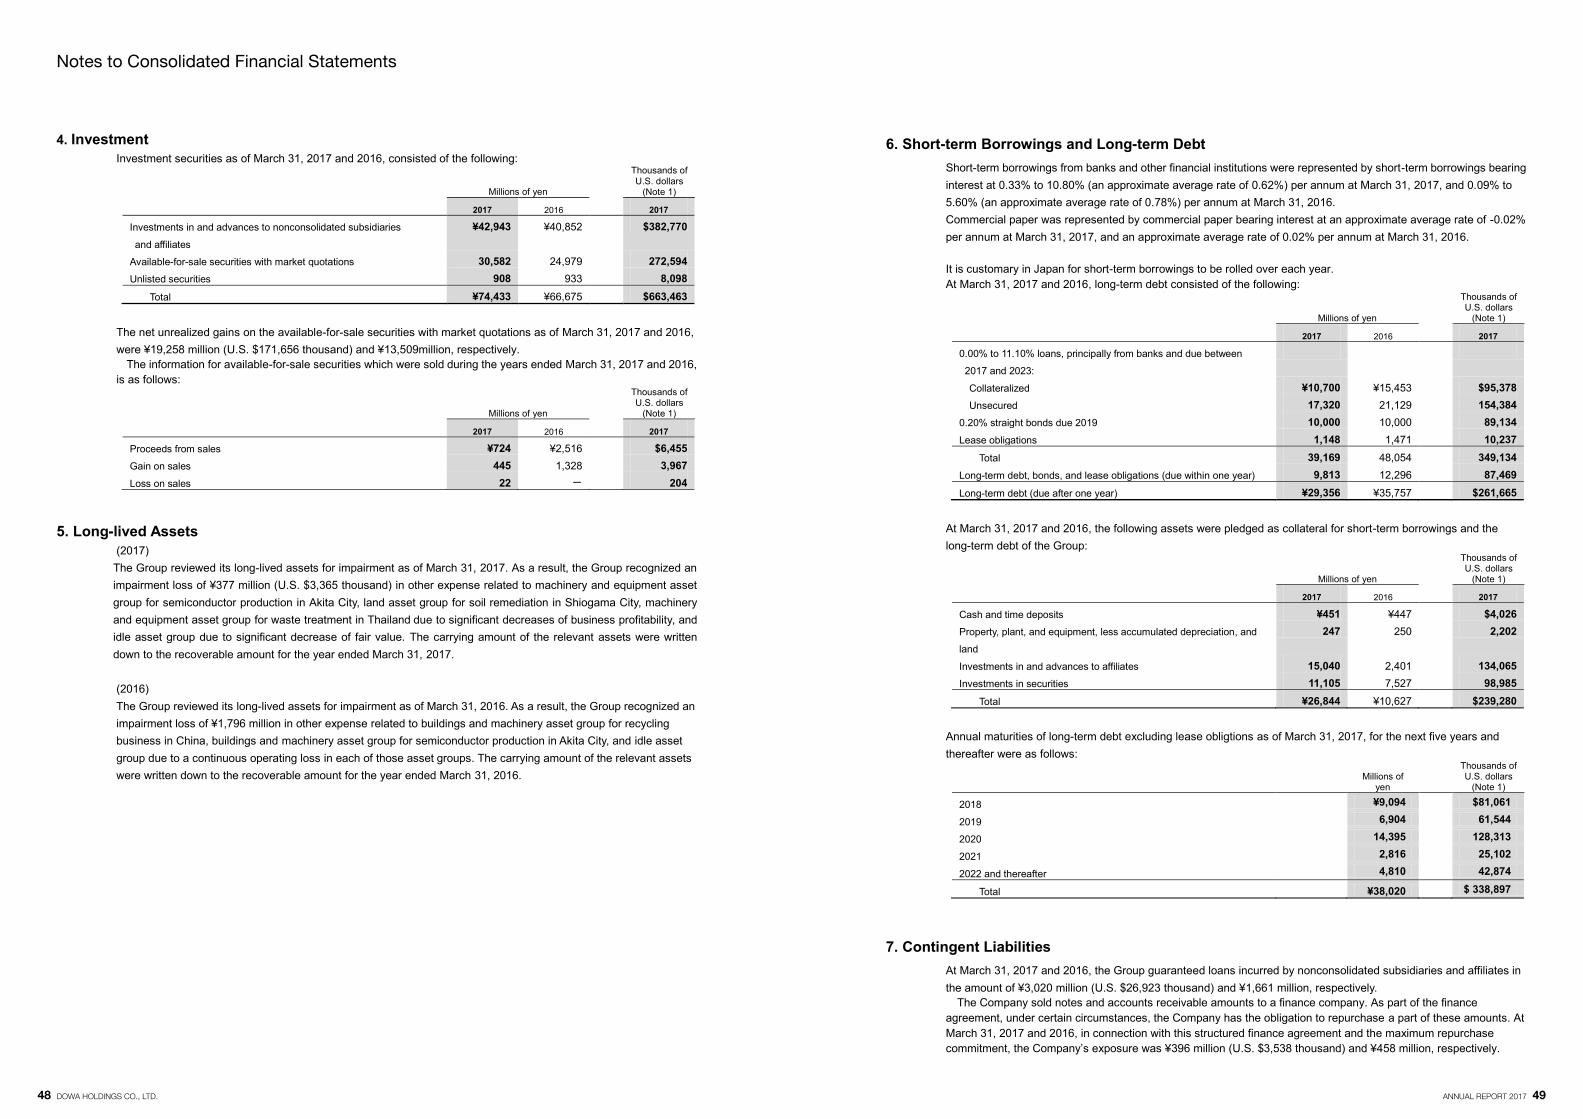
4. Investment Investment securities as of March 31, 2017 and 2016, consisted of the following:
Millions of yen
Thousands of U.S. dollars
(Note 1)
2017 2016 2017
Investments in and advances to nonconsolidated subsidiaries
and affiliates
¥42,943 ¥40,852
$382,770
Available-for-sale securities with market quotations 30,582 24,979 272,594 Unlisted securities 908 933 8,098
Total ¥74,433 ¥66,675 $663,463
The net unrealized gains on the available-for-sale securities with market quotations as of March 31, 2017 and 2016, were ¥19,258 million (U.S. $171,656 thousand) and ¥13,509million, respectively.
The information for available-for-sale securities which were sold during the years ended March 31, 2017 and 2016, is as follows:
Millions of yen
Thousands of U.S. dollars
(Note 1)
2017 2016 2017
Proceeds from sales ¥724 ¥2,516 $6,455 Gain on sales 445 1,328 3,967 Loss on sales 22 - 204
5. Long-lived Assets
(2017) The Group reviewed its long-lived assets for impairment as of March 31, 2017. As a result, the Group recognized an impairment loss of ¥377 million (U.S. $3,365 thousand) in other expense related to machinery and equipment asset group for semiconductor production in Akita City, land asset group for soil remediation in Shiogama City, machinery and equipment asset group for waste treatment in Thailand due to significant decreases of business profitability, and idle asset group due to significant decrease of fair value. The carrying amount of the relevant assets were written down to the recoverable amount for the year ended March 31, 2017. (2016) The Group reviewed its long-lived assets for impairment as of March 31, 2016. As a result, the Group recognized an impairment loss of ¥1,796 million in other expense related to buildings and machinery asset group for recycling business in China, buildings and machinery asset group for semiconductor production in Akita City, and idle asset group due to a continuous operating loss in each of those asset groups. The carrying amount of the relevant assets were written down to the recoverable amount for the year ended March 31, 2016.
6. Short-term Borrowings and Long-term Debt Short-term borrowings from banks and other financial institutions were represented by short-term borrowings bearing interest at 0.33% to 10.80% (an approximate average rate of 0.62%) per annum at March 31, 2017, and 0.09% to 5.60% (an approximate average rate of 0.78%) per annum at March 31, 2016. Commercial paper was represented by commercial paper bearing interest at an approximate average rate of -0.02% per annum at March 31, 2017, and an approximate average rate of 0.02% per annum at March 31, 2016. It is customary in Japan for short-term borrowings to be rolled over each year. At March 31, 2017 and 2016, long-term debt consisted of the following:
Millions of yen
Thousands of U.S. dollars
(Note 1)
2017 2016 2017
0.00% to 11.10% loans, principally from banks and due between
2017 and 2023:
Collateralized ¥10,700 ¥15,453 $95,378 Unsecured 17,320 21,129 154,384
0.20% straight bonds due 2019 10,000 10,000 89,134 Lease obligations 1,148 1,471 10,237
Total 39,169 48,054 349,134 Long-term debt, bonds, and lease obligations (due within one year) 9,813 12,296 87,469 Long-term debt (due after one year) ¥29,356 ¥35,757 $261,665
At March 31, 2017 and 2016, the following assets were pledged as collateral for short-term borrowings and the long-term debt of the Group:
Millions of yen
Thousands of U.S. dollars
(Note 1)
2017 2016 2017
Cash and time deposits ¥451 ¥447 $4,026 Property, plant, and equipment, less accumulated depreciation, and
land
247 250 2,202
Investments in and advances to affiliates 15,040 2,401 134,065 Investments in securities 11,105 7,527 98,985
Total ¥26,844 ¥10,627 $239,280
Annual maturities of long-term debt excluding lease obligtions as of March 31, 2017, for the next five years and thereafter were as follows:
Millions of yen
Thousands of U.S. dollars
(Note 1)
2018 ¥9,094 $81,061
2019 6,904 61,544
2020 14,395 128,313
2021 2,816 25,102
2022 and thereafter 4,810 42,874
Total ¥38,020 $ 338,897
7. Contingent Liabilities At March 31, 2017 and 2016, the Group guaranteed loans incurred by nonconsolidated subsidiaries and affiliates in the amount of ¥3,020 million (U.S. $26,923 thousand) and ¥1,661 million, respectively.
The Company sold notes and accounts receivable amounts to a finance company. As part of the finance agreement, under certain circumstances, the Company has the obligation to repurchase a part of these amounts. At March 31, 2017 and 2016, in connection with this structured finance agreement and the maximum repurchase commitment, the Company‟s exposure was ¥396 million (U.S. $3,538 thousand) and ¥458 million, respectively.
Notes to Consolidated Financial Statements
48 DOWA HOLDINGS CO., LTD. ANNUAL REPORT 2017 49
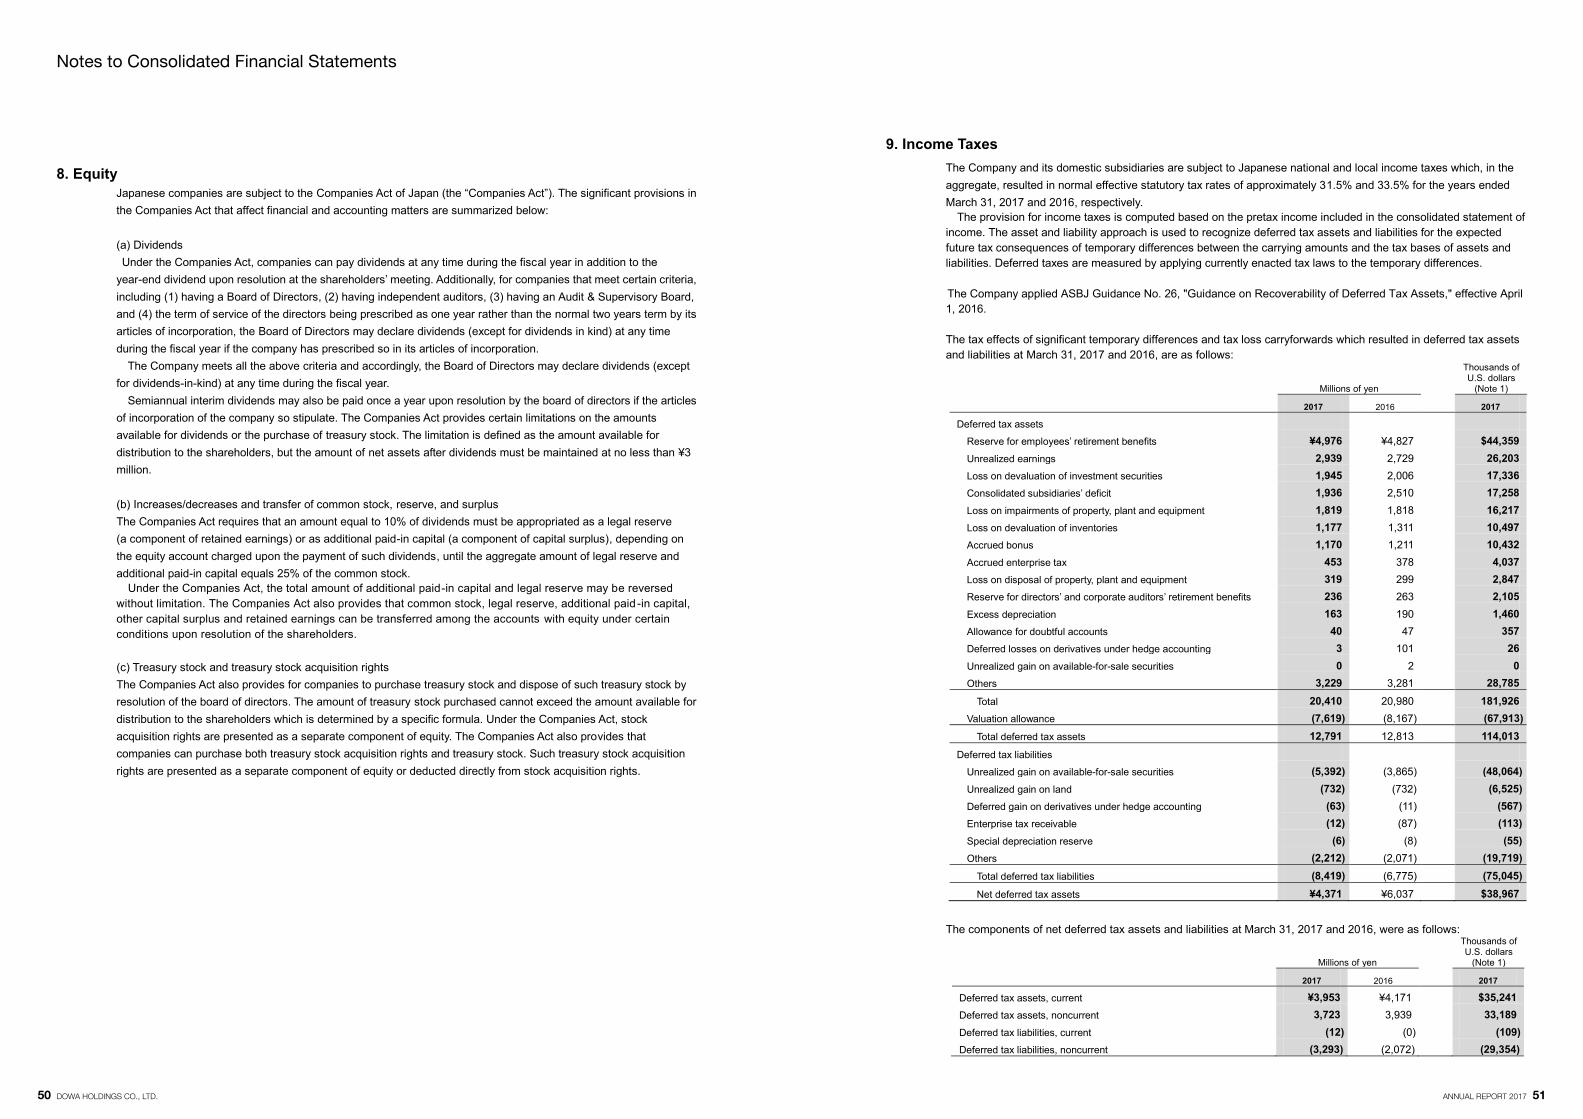
8. Equity
Japanese companies are subject to the Companies Act of Japan (the “Companies Act”). The significant provisions in the Companies Act that affect financial and accounting matters are summarized below:
(a) Dividends Under the Companies Act, companies can pay dividends at any time during the fiscal year in addition to the
year-end dividend upon resolution at the shareholders‟ meeting. Additionally, for companies that meet certain criteria, including (1) having a Board of Directors, (2) having independent auditors, (3) having an Audit & Supervisory Board, and (4) the term of service of the directors being prescribed as one year rather than the normal two years term by its articles of incorporation, the Board of Directors may declare dividends (except for dividends in kind) at any time during the fiscal year if the company has prescribed so in its articles of incorporation.
The Company meets all the above criteria and accordingly, the Board of Directors may declare dividends (except for dividends-in-kind) at any time during the fiscal year.
Semiannual interim dividends may also be paid once a year upon resolution by the board of directors if the articles of incorporation of the company so stipulate. The Companies Act provides certain limitations on the amounts available for dividends or the purchase of treasury stock. The limitation is defined as the amount available for distribution to the shareholders, but the amount of net assets after dividends must be maintained at no less than ¥3 million. (b) Increases/decreases and transfer of common stock, reserve, and surplus The Companies Act requires that an amount equal to 10% of dividends must be appropriated as a legal reserve (a component of retained earnings) or as additional paid-in capital (a component of capital surplus), depending on the equity account charged upon the payment of such dividends, until the aggregate amount of legal reserve and additional paid-in capital equals 25% of the common stock.
Under the Companies Act, the total amount of additional paid-in capital and legal reserve may be reversed without limitation. The Companies Act also provides that common stock, legal reserve, additional paid -in capital, other capital surplus and retained earnings can be transferred among the accounts with equity under certain conditions upon resolution of the shareholders.
(c) Treasury stock and treasury stock acquisition rights The Companies Act also provides for companies to purchase treasury stock and dispose of such treasury stock by resolution of the board of directors. The amount of treasury stock purchased cannot exceed the amount available for distribution to the shareholders which is determined by a specific formula. Under the Companies Act, stock acquisition rights are presented as a separate component of equity. The Companies Act also provides that companies can purchase both treasury stock acquisition rights and treasury stock. Such treasury stock acquisition rights are presented as a separate component of equity or deducted directly from stock acquisition rights.
9. Income Taxes
The Company and its domestic subsidiaries are subject to Japanese national and local income taxes which, in the aggregate, resulted in normal effective statutory tax rates of approximately 31.5% and 33.5% for the years ended March 31, 2017 and 2016, respectively.
The provision for income taxes is computed based on the pretax income included in the consolidated statement of income. The asset and liability approach is used to recognize deferred tax assets and liabilities for the expected future tax consequences of temporary differences between the carrying amounts and the tax bases of assets and liabilities. Deferred taxes are measured by applying currently enacted tax laws to the temporary differences.
The Company applied ASBJ Guidance No. 26, "Guidance on Recoverability of Deferred Tax Assets," effective April 1, 2016.
The tax effects of significant temporary differences and tax loss carryforwards which resulted in deferred tax assets and liabilities at March 31, 2017 and 2016, are as follows:
The components of net deferred tax assets and liabilities at March 31, 2017 and 2016, were as follows:
Millions of yen Thousands of
U.S. dollars (Note 1)
2017 2016 2017
Deferred tax assets, current ¥3,953 ¥4,171 $35,241 Deferred tax assets, noncurrent 3,723 3,939 33,189 Deferred tax liabilities, current (12) (0) (109) Deferred tax liabilities, noncurrent (3,293) (2,072) (29,354)
Millions of yen
Thousands of U.S. dollars
(Note 1)
2017 2016 2017
Deferred tax assets Reserve for employees‟ retirement benefits ¥4,976 ¥4,827 $44,359 Unrealized earnings 2,939 2,729 26,203 Loss on devaluation of investment securities 1,945 2,006 17,336 Consolidated subsidiaries‟ deficit 1,936 2,510 17,258 Loss on impairments of property, plant and equipment 1,819 1,818 16,217 Loss on devaluation of inventories 1,177 1,311 10,497 Accrued bonus 1,170 1,211 10,432 Accrued enterprise tax 453 378 4,037 Loss on disposal of property, plant and equipment 319 299 2,847 Reserve for directors‟ and corporate auditors‟ retirement benefits 236 263 2,105 Excess depreciation 163 190 1,460 Allowance for doubtful accounts 40 47 357 Deferred losses on derivatives under hedge accounting 3 101 26 Unrealized gain on available-for-sale securities 0 2 0 Others 3,229 3,281 28,785
Total 20,410 20,980 181,926 Valuation allowance (7,619) (8,167) (67,913)
Total deferred tax assets 12,791 12,813 114,013 Deferred tax liabilities
Unrealized gain on available-for-sale securities (5,392) (3,865) (48,064) Unrealized gain on land (732) (732) (6,525) Deferred gain on derivatives under hedge accounting (63) (11) (567) Enterprise tax receivable (12) (87) (113) Special depreciation reserve (6) (8) (55) Others (2,212) (2,071) (19,719)
Total deferred tax liabilities (8,419) (6,775) (75,045) Net deferred tax assets ¥4,371 ¥6,037 $38,967
Notes to Consolidated Financial Statements
50 DOWA HOLDINGS CO., LTD. ANNUAL REPORT 2017 51
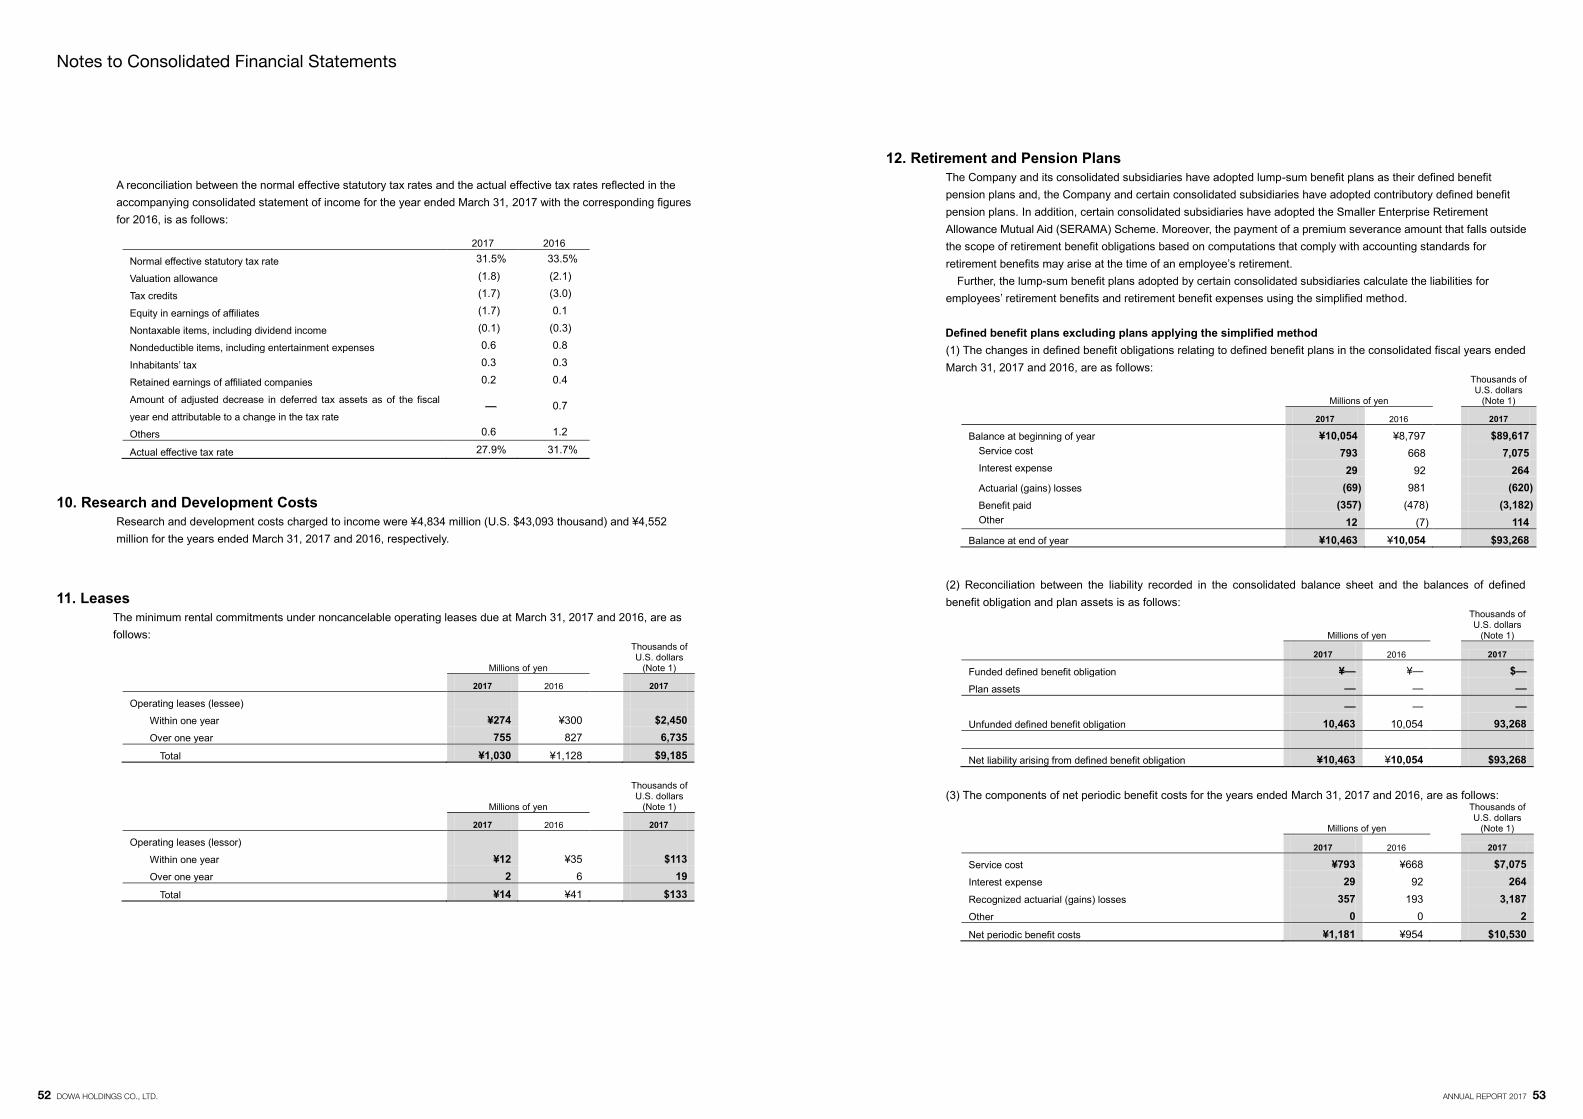
A reconciliation between the normal effective statutory tax rates and the actual effective tax rates reflected in the accompanying consolidated statement of income for the year ended March 31, 2017 with the corresponding figures for 2016, is as follows:
2017
2016
Normal effective statutory tax rate 31.5% 33.5%
Valuation allowance (1.8) (2.1)
Tax credits (1.7) (3.0)
Equity in earnings of affiliates (1.7) 0.1
Nontaxable items, including dividend income (0.1) (0.3)
Nondeductible items, including entertainment expenses 0.6 0.8
Inhabitants‟ tax 0.3 0.3
Retained earnings of affiliated companies 0.2 0.4
Amount of adjusted decrease in deferred tax assets as of the fiscal
year end attributable to a change in the tax rate ― 0.7
Others 0.6 1.2
Actual effective tax rate 27.9% 31.7%
10. Research and Development Costs
Research and development costs charged to income were ¥4,834 million (U.S. $43,093 thousand) and ¥4,552 million for the years ended March 31, 2017 and 2016, respectively.
11. Leases
The minimum rental commitments under noncancelable operating leases due at March 31, 2017 and 2016, are as follows:
Millions of yen
Thousands of U.S. dollars
(Note 1)
2017 2016 2017
Operating leases (lessee) Within one year ¥274 ¥300 $2,450 Over one year 755 827 6,735
Total ¥1,030 ¥1,128 $9,185
Millions of yen
Thousands of U.S. dollars
(Note 1)
2017 2016 2017
Operating leases (lessor) Within one year ¥12 ¥35 $113 Over one year 2 6 19
Total ¥14 ¥41 $133
12. Retirement and Pension Plans The Company and its consolidated subsidiaries have adopted lump-sum benefit plans as their defined benefit pension plans and, the Company and certain consolidated subsidiaries have adopted contributory defined benefit pension plans. In addition, certain consolidated subsidiaries have adopted the Smaller Enterprise Retirement Allowance Mutual Aid (SERAMA) Scheme. Moreover, the payment of a premium severance amount that falls outside the scope of retirement benefit obligations based on computations that comply with accounting standards for retirement benefits may arise at the time of an employee‟s retirement.
Further, the lump-sum benefit plans adopted by certain consolidated subsidiaries calculate the liabilities for employees‟ retirement benefits and retirement benefit expenses using the simplified method.
Defined benefit plans excluding plans applying the simplified method (1) The changes in defined benefit obligations relating to defined benefit plans in the consolidated fiscal years ended March 31, 2017 and 2016, are as follows:
Millions of yen
Thousands of U.S. dollars
(Note 1)
2017 2016 2017
Balance at beginning of year ¥10,054 ¥8,797 $89,617 Service cost 793 668 7,075 Interest expense 29 92 264 Actuarial (gains) losses (69) 981 (620) Benefit paid (357) (478) (3,182) Other 12 (7) 114
Balance at end of year ¥10,463 ¥10,054 $93,268
(2) Reconciliation between the liability recorded in the consolidated balance sheet and the balances of defined benefit obligation and plan assets is as follows:
Millions of yen
Thousands of U.S. dollars
(Note 1)
2017 2016 2017
Funded defined benefit obligation ¥― ¥― $― Plan assets ― ― ―
― ― ― Unfunded defined benefit obligation 10,463 10,054 93,268 Net liability arising from defined benefit obligation ¥10,463 ¥10,054 $93,268
(3) The components of net periodic benefit costs for the years ended March 31, 2017 and 2016, are as follows:
Millions of yen
Thousands of U.S. dollars
(Note 1)
2017 2016 2017
Service cost ¥793 ¥668 $7,075 Interest expense 29 92 264 Recognized actuarial (gains) losses 357 193 3,187 Other 0 0 2 Net periodic benefit costs ¥1,181 ¥954 $10,530
Notes to Consolidated Financial Statements
52 DOWA HOLDINGS CO., LTD. ANNUAL REPORT 2017 53
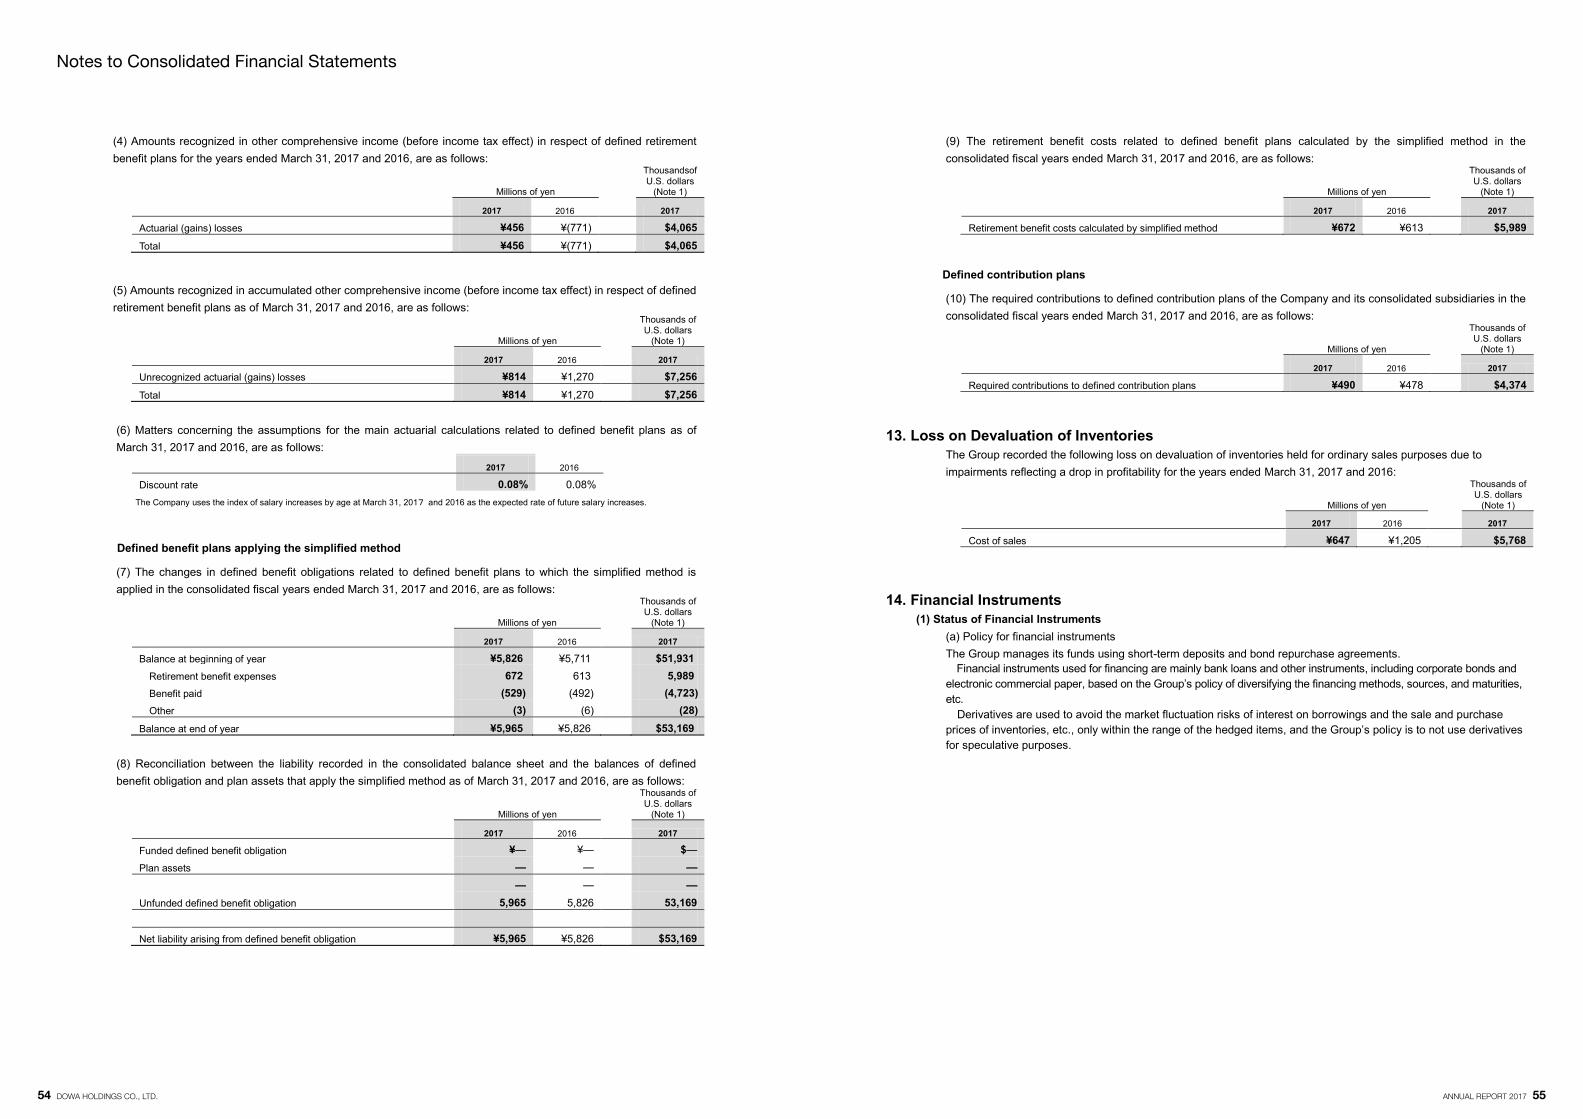
(4) Amounts recognized in other comprehensive income (before income tax effect) in respect of defined retirement benefit plans for the years ended March 31, 2017 and 2016, are as follows:
Millions of yen
Thousandsof U.S. dollars
(Note 1)
2017 2016 2017
Actuarial (gains) losses ¥456 ¥(771) $4,065 Total ¥456 ¥(771) $4,065
(5) Amounts recognized in accumulated other comprehensive income (before income tax effect) in respect of defined retirement benefit plans as of March 31, 2017 and 2016, are as follows:
Millions of yen
Thousands of U.S. dollars
(Note 1)
2017 2016 2017
Unrecognized actuarial (gains) losses ¥814 ¥1,270 $7,256 Total ¥814 ¥1,270 $7,256
(6) Matters concerning the assumptions for the main actuarial calculations related to defined benefit plans as of March 31, 2017 and 2016, are as follows:
2017 2016
Discount rate 0.08% 0.08% The Company uses the index of salary increases by age at March 31, 2017 and 2016 as the expected rate of future salary increases.
Defined benefit plans applying the simplified method
(7) The changes in defined benefit obligations related to defined benefit plans to which the simplified method is applied in the consolidated fiscal years ended March 31, 2017 and 2016, are as follows:
Millions of yen
Thousands of U.S. dollars
(Note 1)
2017 2016 2017
Balance at beginning of year ¥5,826 ¥5,711 $51,931 Retirement benefit expenses 672 613 5,989 Benefit paid (529) (492) (4,723) Other (3) (6) (28)
Balance at end of year ¥5,965 ¥5,826 $53,169
(8) Reconciliation between the liability recorded in the consolidated balance sheet and the balances of defined benefit obligation and plan assets that apply the simplified method as of March 31, 2017 and 2016, are as follows:
Millions of yen
Thousands of U.S. dollars
(Note 1)
2017 2016 2017
Funded defined benefit obligation ¥― ¥― $― Plan assets ― ― ―
― ― ― Unfunded defined benefit obligation 5,965 5,826 53,169 Net liability arising from defined benefit obligation ¥5,965 ¥5,826 $53,169
(9) The retirement benefit costs related to defined benefit plans calculated by the simplified method in the consolidated fiscal years ended March 31, 2017 and 2016, are as follows:
Millions of yen
Thousands of U.S. dollars
(Note 1)
2017 2016 2017
Retirement benefit costs calculated by simplified method ¥672 ¥613 $5,989
Defined contribution plans
(10) The required contributions to defined contribution plans of the Company and its consolidated subsidiaries in the consolidated fiscal years ended March 31, 2017 and 2016, are as follows:
Millions of yen
Thousands of U.S. dollars
(Note 1)
2017 2016 2017
Required contributions to defined contribution plans ¥490 ¥478 $4,374 13. Loss on Devaluation of Inventories
The Group recorded the following loss on devaluation of inventories held for ordinary sales purposes due to impairments reflecting a drop in profitability for the years ended March 31, 2017 and 2016:
Millions of yen
Thousands of U.S. dollars
(Note 1)
2017 2016 2017
Cost of sales ¥647 ¥1,205 $5,768
14. Financial Instruments
(1) Status of Financial Instruments (a) Policy for financial instruments The Group manages its funds using short-term deposits and bond repurchase agreements.
Financial instruments used for financing are mainly bank loans and other instruments, including corporate bonds and electronic commercial paper, based on the Group‟s policy of diversifying the financing methods, sources, and maturities, etc.
Derivatives are used to avoid the market fluctuation risks of interest on borrowings and the sale and purchase prices of inventories, etc., only within the range of the hedged items, and the Group‟s policy is to not use derivatives for speculative purposes.
Notes to Consolidated Financial Statements
54 DOWA HOLDINGS CO., LTD. ANNUAL REPORT 2017 55
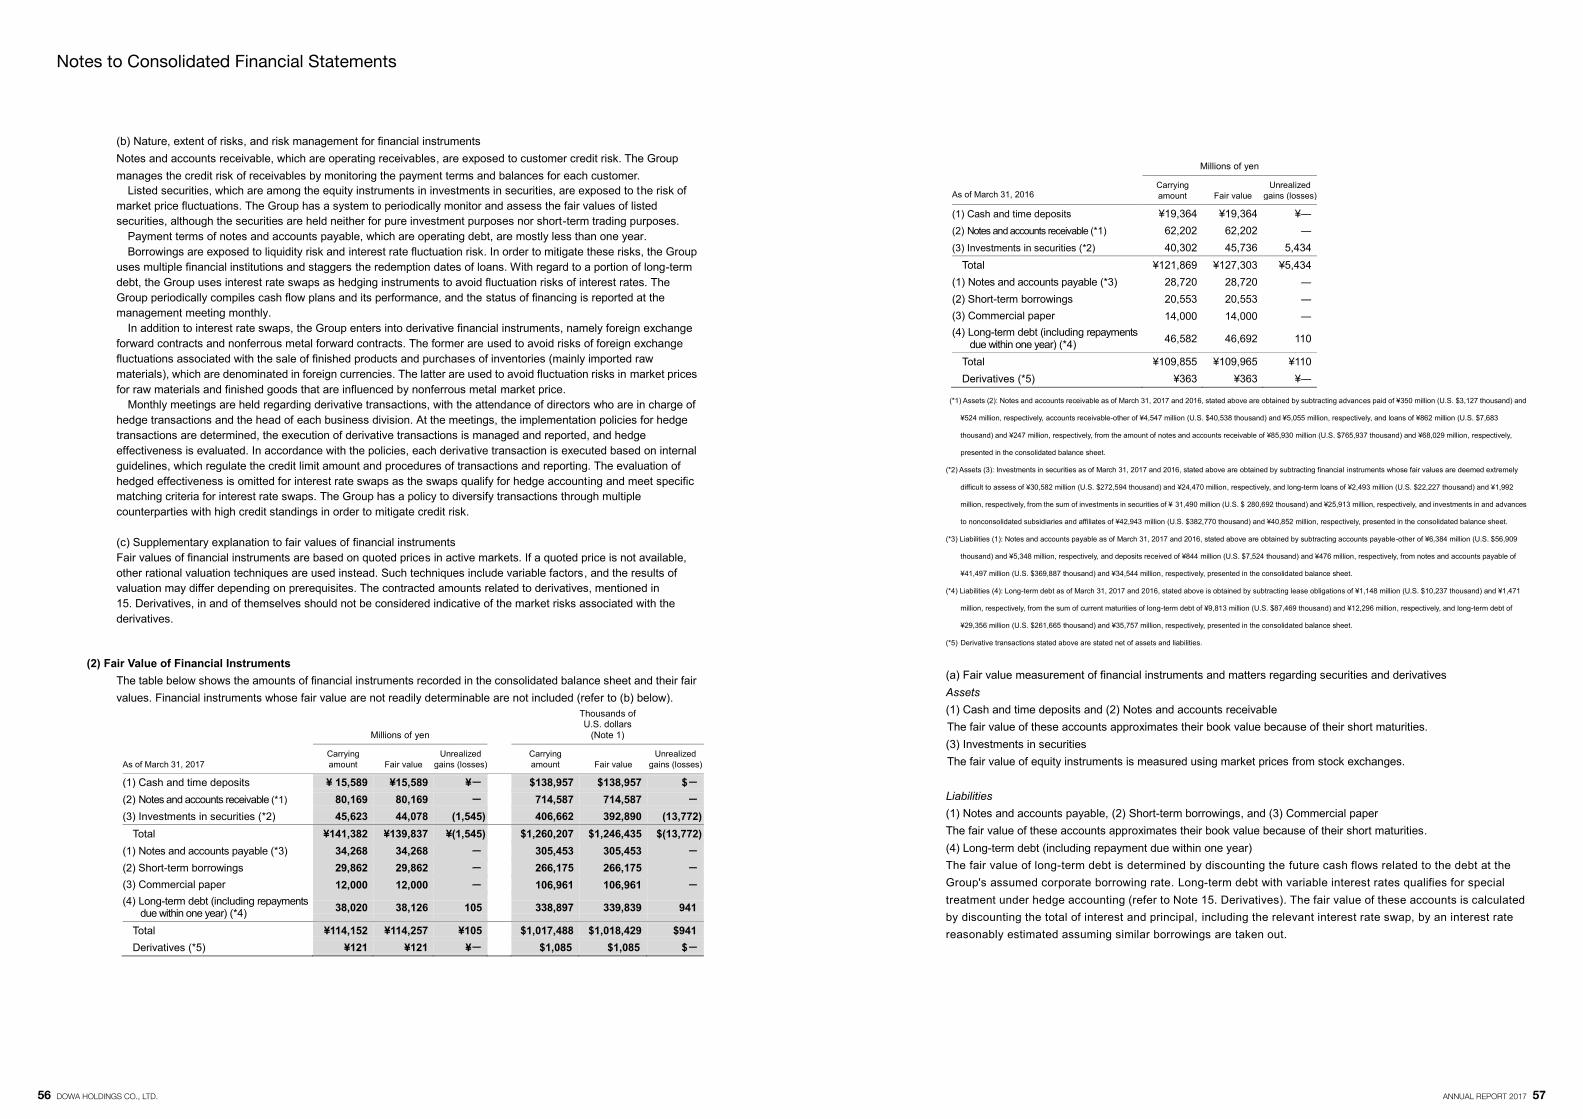
(b) Nature, extent of risks, and risk management for financial instruments Notes and accounts receivable, which are operating receivables, are exposed to customer credit risk. The Group manages the credit risk of receivables by monitoring the payment terms and balances for each customer.
Listed securities, which are among the equity instruments in investments in securities, are exposed to the risk of market price fluctuations. The Group has a system to periodically monitor and assess the fair values of listed securities, although the securities are held neither for pure investment purposes nor short-term trading purposes.
Payment terms of notes and accounts payable, which are operating debt, are mostly less than one year. Borrowings are exposed to liquidity risk and interest rate fluctuation risk. In order to mitigate these risks, the Group
uses multiple financial institutions and staggers the redemption dates of loans. With regard to a portion of long-term debt, the Group uses interest rate swaps as hedging instruments to avoid fluctuation risks of interest rates. The Group periodically compiles cash flow plans and its performance, and the status of financing is reported at the management meeting monthly.
In addition to interest rate swaps, the Group enters into derivative financial instruments, namely foreign exchange forward contracts and nonferrous metal forward contracts. The former are used to avoid risks of foreign exchange fluctuations associated with the sale of finished products and purchases of inventories (mainly imported raw materials), which are denominated in foreign currencies. The latter are used to avoid fluctuation risks in market prices for raw materials and finished goods that are influenced by nonferrous metal market price.
Monthly meetings are held regarding derivative transactions, with the attendance of directors who are in charge of hedge transactions and the head of each business division. At the meetings, the implementation policies for hedge transactions are determined, the execution of derivative transactions is managed and reported, and hedge effectiveness is evaluated. In accordance with the policies, each derivative transaction is executed based on internal guidelines, which regulate the credit limit amount and procedures of transactions and reporting. The evaluation of hedged effectiveness is omitted for interest rate swaps as the swaps qualify for hedge accounting and meet specific matching criteria for interest rate swaps. The Group has a policy to diversify transactions through multiple counterparties with high credit standings in order to mitigate credit risk.
(c) Supplementary explanation to fair values of financial instruments Fair values of financial instruments are based on quoted prices in active markets. If a quoted price is not available, other rational valuation techniques are used instead. Such techniques include variable factors, and the results of valuation may differ depending on prerequisites. The contracted amounts related to derivatives, mentioned in 15. Derivatives, in and of themselves should not be considered indicative of the market risks associated with the derivatives.
(2) Fair Value of Financial Instruments The table below shows the amounts of financial instruments recorded in the consolidated balance sheet and their fair values. Financial instruments whose fair value are not readily determinable are not included (refer to (b) below).
Millions of yen
Thousands of U.S. dollars
(Note 1)
As of March 31, 2017 Carrying amount Fair value
Unrealized gains (losses)
Carrying amount Fair value
Unrealized gains (losses)
(1) Cash and time deposits ¥ 15,589 ¥15,589 ¥- $138,957 $138,957 $- (2) Notes and accounts receivable (*1) 80,169 80,169 - 714,587 714,587 - (3) Investments in securities (*2) 45,623 44,078 (1,545) 406,662 392,890 (13,772)
Total ¥141,382 ¥139,837 ¥(1,545) $1,260,207 $1,246,435 $(13,772) (1) Notes and accounts payable (*3) 34,268 34,268 - 305,453 305,453 - (2) Short-term borrowings 29,862 29,862 - 266,175 266,175 - (3) Commercial paper 12,000 12,000 - 106,961 106,961 - (4) Long-term debt (including repayments
due within one year) (*4) 38,020 38,126 105 338,897 339,839 941
Total ¥114,152 ¥114,257 ¥105 $1,017,488 $1,018,429 $941 Derivatives (*5) ¥121 ¥121 ¥- $1,085 $1,085 $-
Millions of yen
As of March 31, 2016 Carrying amount Fair value
Unrealized gains (losses)
(1) Cash and time deposits ¥19,364 ¥19,364 ¥― (2) Notes and accounts receivable (*1) 62,202 62,202 ― (3) Investments in securities (*2) 40,302 45,736 5,434
Total ¥121,869 ¥127,303 ¥5,434 (1) Notes and accounts payable (*3) 28,720 28,720 ― (2) Short-term borrowings 20,553 20,553 ― (3) Commercial paper 14,000 14,000 ― (4) Long-term debt (including repayments
due within one year) (*4) 46,582 46,692 110
Total ¥109,855 ¥109,965 ¥110 Derivatives (*5) ¥363 ¥363 ¥―
(*1) Assets (2): Notes and accounts receivable as of March 31, 2017 and 2016, stated above are obtained by subtracting advances paid of ¥350 million (U.S. $3,127 thousand) and
¥524 million, respectively, accounts receivable-other of ¥4,547 million (U.S. $40,538 thousand) and ¥5,055 million, respectively, and loans of ¥862 million (U.S. $7,683
thousand) and ¥247 million, respectively, from the amount of notes and accounts receivable of ¥85,930 million (U.S. $765,937 thousand) and ¥68,029 million, respectively,
presented in the consolidated balance sheet.
(*2) Assets (3): Investments in securities as of March 31, 2017 and 2016, stated above are obtained by subtracting financial instruments whose fair values are deemed extremely
difficult to assess of ¥30,582 million (U.S. $272,594 thousand) and ¥24,470 million, respectively, and long-term loans of ¥2,493 million (U.S. $22,227 thousand) and ¥1,992
million, respectively, from the sum of investments in securities of ¥ 31,490 million (U.S. $ 280,692 thousand) and ¥25,913 million, respectively, and investments in and advances
to nonconsolidated subsidiaries and affiliates of ¥42,943 million (U.S. $382,770 thousand) and ¥40,852 million, respectively, presented in the consolidated balance sheet.
(*3) Liabilities (1): Notes and accounts payable as of March 31, 2017 and 2016, stated above are obtained by subtracting accounts payable-other of ¥6,384 million (U.S. $56,909
thousand) and ¥5,348 million, respectively, and deposits received of ¥844 million (U.S. $7,524 thousand) and ¥476 million, respectively, from notes and accounts payable of
¥41,497 million (U.S. $369,887 thousand) and ¥34,544 million, respectively, presented in the consolidated balance sheet.
(*4) Liabilities (4): Long-term debt as of March 31, 2017 and 2016, stated above is obtained by subtracting lease obligations of ¥1,148 million (U.S. $10,237 thousand) and ¥1,471
million, respectively, from the sum of current maturities of long-term debt of ¥9,813 million (U.S. $87,469 thousand) and ¥12,296 million, respectively, and long-term debt of
¥29,356 million (U.S. $261,665 thousand) and ¥35,757 million, respectively, presented in the consolidated balance sheet.
(*5) Derivative transactions stated above are stated net of assets and liabilities.
(a) Fair value measurement of financial instruments and matters regarding securities and derivatives Assets (1) Cash and time deposits and (2) Notes and accounts receivable The fair value of these accounts approximates their book value because of their short maturities. (3) Investments in securities The fair value of equity instruments is measured using market prices from stock exchanges. Liabilities (1) Notes and accounts payable, (2) Short-term borrowings, and (3) Commercial paper The fair value of these accounts approximates their book value because of their short maturities. (4) Long-term debt (including repayment due within one year) The fair value of long-term debt is determined by discounting the future cash flows related to the debt at the Group's assumed corporate borrowing rate. Long-term debt with variable interest rates qualifies for special treatment under hedge accounting (refer to Note 15. Derivatives). The fair value of these accounts is calculated by discounting the total of interest and principal, including the relevant interest rate swap, by an interest rate reasonably estimated assuming similar borrowings are taken out.
Notes to Consolidated Financial Statements
56 DOWA HOLDINGS CO., LTD. ANNUAL REPORT 2017 57
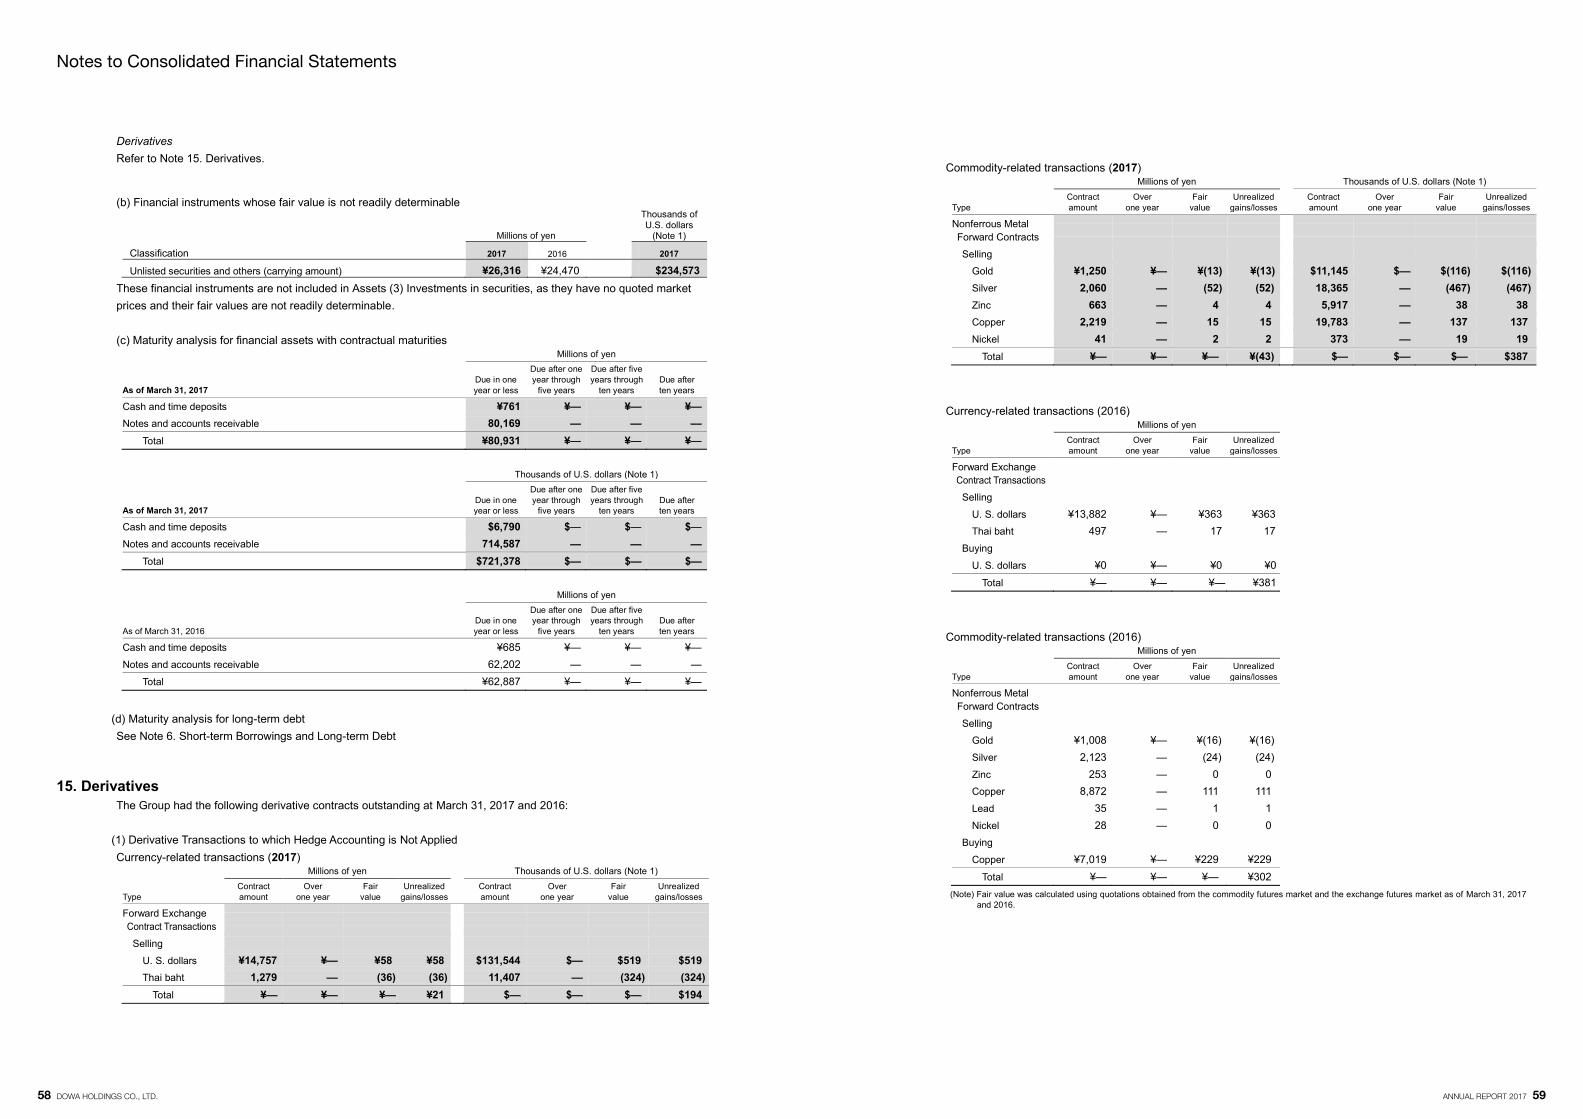
Derivatives Refer to Note 15. Derivatives.
(b) Financial instruments whose fair value is not readily determinable
Millions of yen Thousands of
U.S. dollars (Note 1)
Classification 2017 2016 2017
Unlisted securities and others (carrying amount) ¥26,316 ¥24,470 $234,573 These financial instruments are not included in Assets (3) Investments in securities, as they have no quoted market prices and their fair values are not readily determinable.
(c) Maturity analysis for financial assets with contractual maturities
Millions of yen
As of March 31, 2017 Due in one year or less
Due after one year through
five years
Due after five years through
ten years Due after ten years
Cash and time deposits ¥761 ¥― ¥― ¥― Notes and accounts receivable 80,169 ― ― ―
Total ¥80,931 ¥― ¥― ¥―
Thousands of U.S. dollars (Note 1)
As of March 31, 2017 Due in one year or less
Due after one year through
five years
Due after five years through
ten years Due after ten years
Cash and time deposits $6,790 $― $― $― Notes and accounts receivable 714,587 ― ― ―
Total $721,378 $― $― $―
Millions of yen
As of March 31, 2016 Due in one year or less
Due after one year through
five years
Due after five years through
ten years Due after ten years
Cash and time deposits ¥685 ¥― ¥― ¥― Notes and accounts receivable 62,202 ― ― ―
Total ¥62,887 ¥― ¥― ¥―
(d) Maturity analysis for long-term debt See Note 6. Short-term Borrowings and Long-term Debt
15. Derivatives The Group had the following derivative contracts outstanding at March 31, 2017 and 2016:
(1) Derivative Transactions to which Hedge Accounting is Not Applied Currency-related transactions (2017)
Millions of yen Thousands of U.S. dollars (Note 1)
Type Contract amount
Over one year
Fair value
Unrealized gains/losses
Contract amount
Over one year
Fair value
Unrealized gains/losses
Forward Exchange Contract Transactions
Selling U. S. dollars ¥14,757 ¥― ¥58 ¥58 $131,544 $― $519 $519 Thai baht 1,279 ― (36) (36) 11,407 ― (324) (324)
Total ¥― ¥― ¥― ¥21 $― $― $― $194
Commodity-related transactions (2017) Millions of yen Thousands of U.S. dollars (Note 1)
Type Contract amount
Over one year
Fair value
Unrealized gains/losses
Contract amount
Over one year
Fair value
Unrealized gains/losses
Nonferrous Metal Forward Contracts
Selling Gold ¥1,250 ¥― ¥(13) ¥(13) $11,145 $― $(116) $(116) Silver 2,060 ― (52) (52) 18,365 ― (467) (467) Zinc 663 ― 4 4 5,917 ― 38 38 Copper 2,219 ― 15 15 19,783 ― 137 137 Nickel 41 ― 2 2 373 ― 19 19
Total ¥― ¥― ¥― ¥(43) $― $― $― $387
Currency-related transactions (2016) Millions of yen
Type Contract amount
Over one year
Fair value
Unrealized gains/losses
Forward Exchange Contract Transactions
Selling U. S. dollars ¥13,882 ¥― ¥363 ¥363 Thai baht 497 ― 17 17
Buying U. S. dollars ¥0 ¥― ¥0 ¥0
Total ¥― ¥― ¥― ¥381
Commodity-related transactions (2016) Millions of yen
Type Contract amount
Over one year
Fair value
Unrealized gains/losses
Nonferrous Metal Forward Contracts
Selling Gold ¥1,008 ¥― ¥(16) ¥(16) Silver 2,123 ― (24) (24) Zinc 253 ― 0 0 Copper 8,872 ― 111 111 Lead 35 ― 1 1 Nickel 28 ― 0 0
Buying Copper ¥7,019 ¥― ¥229 ¥229
Total ¥― ¥― ¥― ¥302 (Note) Fair value was calculated using quotations obtained from the commodity futures market and the exchange futures market as of March 31, 2017
and 2016.
Notes to Consolidated Financial Statements
58 DOWA HOLDINGS CO., LTD. ANNUAL REPORT 2017 59
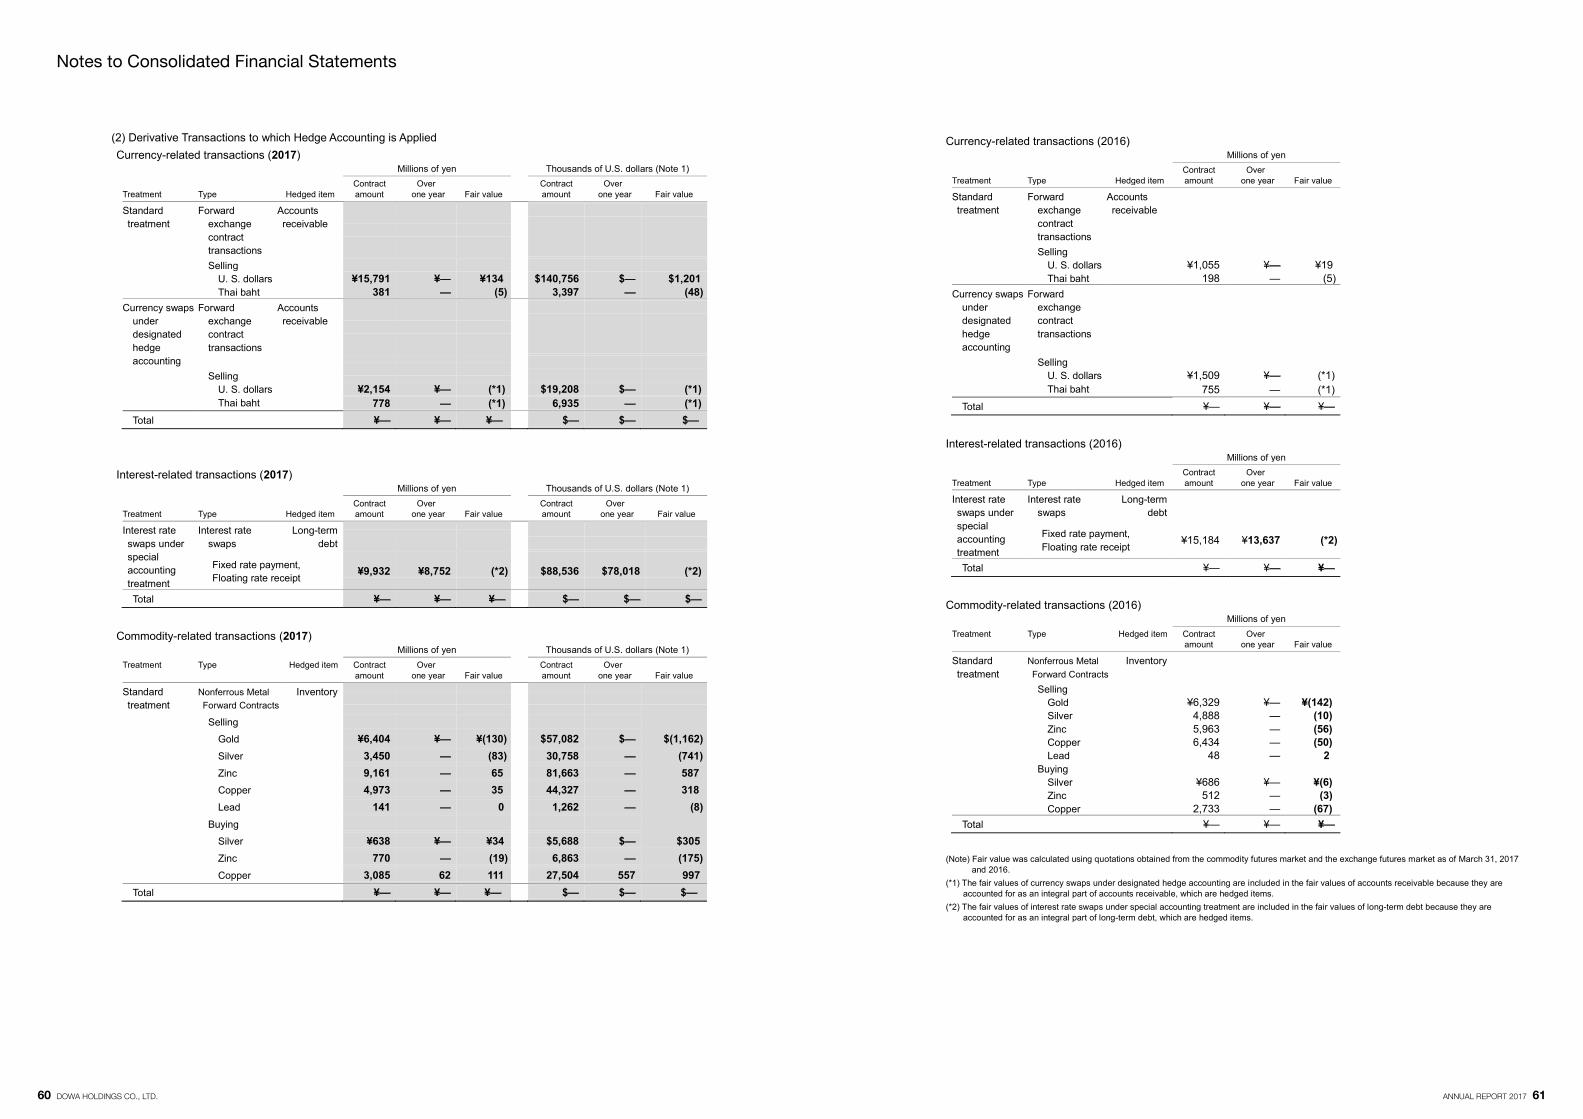
(2) Derivative Transactions to which Hedge Accounting is Applied Currency-related transactions (2017)
Millions of yen Thousands of U.S. dollars (Note 1)
Treatment Type Hedged item Contract amount
Over one year Fair value
Contract amount
Over one year Fair value
Standard treatment
Forward exchange contract transactions
Accounts receivable
Selling U. S. dollars ¥15,791 ¥― ¥134 $140,756 $― $1,201 Thai baht 381 ― (5) 3,397 ― (48)
Currency swaps under designated hedge accounting
Forward exchange contract transactions
Accounts receivable
Selling
U. S. dollars ¥2,154 ¥― (*1) $19,208 $― (*1) Thai baht 778 ― (*1) 6,935 ― (*1)
Total ¥― ¥― ¥― $― $― $―
Interest-related transactions (2017)
Millions of yen Thousands of U.S. dollars (Note 1)
Treatment Type Hedged item Contract amount
Over one year Fair value
Contract amount
Over one year Fair value
Interest rate swaps under special accounting treatment
Interest rate swaps
Long-term debt
Fixed rate payment, Floating rate receipt
¥9,932 ¥8,752 (*2)
$88,536 $78,018 (*2)
Total ¥― ¥― ¥― $― $― $―
Commodity-related transactions (2017) Millions of yen Thousands of U.S. dollars (Note 1)
Treatment Type Hedged item Contract amount
Over one year Fair value
Contract amount
Over one year Fair value
Standard treatment
Nonferrous Metal Forward Contracts
Inventory
Selling Gold ¥6,404 ¥― ¥(130) $57,082 $― $(1,162) Silver 3,450 ― (83) 30,758 ― (741) Zinc 9,161 ― 65 81,663 ― 587 Copper 4,973 ― 35 44,327 ― 318 Lead 141 ― 0 1,262 ― (8)
Buying Silver ¥638 ¥― ¥34 $5,688 $― $305 Zinc 770 ― (19) 6,863 ― (175) Copper 3,085 62 111 27,504 557 997
Total ¥― ¥― ¥― $― $― $―
Currency-related transactions (2016) Millions of yen
Treatment Type Hedged item Contract amount
Over one year Fair value
Standard treatment
Forward exchange contract transactions
Accounts receivable
Selling U. S. dollars ¥1,055 ¥― ¥19 Thai baht 198 ― (5)
Currency swaps under designated hedge accounting
Forward exchange contract transactions
Selling
U. S. dollars ¥1,509 ¥― (*1) Thai baht 755 ― (*1)
Total ¥― ¥― ¥―
Interest-related transactions (2016) Millions of yen
Treatment Type Hedged item Contract amount
Over one year Fair value
Interest rate swaps under special accounting treatment
Interest rate swaps
Long-term debt
Fixed rate payment, Floating rate receipt
¥15,184 ¥13,637 (*2)
Total ¥― ¥― ¥―
Commodity-related transactions (2016)
Millions of yen
Treatment Type Hedged item Contract amount
Over one year Fair value
Standard treatment
Nonferrous Metal Forward Contracts
Inventory
Selling Gold ¥6,329 ¥― ¥(142) Silver 4,888 ― (10) Zinc 5,963 ― (56) Copper 6,434 ― (50) Lead 48 ― 2
Buying Silver ¥686 ¥― ¥(6) Zinc 512 ― (3) Copper 2,733 ― (67)
Total ¥― ¥― ¥―
(Note) Fair value was calculated using quotations obtained from the commodity futures market and the exchange futures market as of March 31, 2017
and 2016. (*1) The fair values of currency swaps under designated hedge accounting are included in the fair values of accounts receivable because they are
accounted for as an integral part of accounts receivable, which are hedged items. (*2) The fair values of interest rate swaps under special accounting treatment are included in the fair values of long-term debt because they are
accounted for as an integral part of long-term debt, which are hedged items.
Notes to Consolidated Financial Statements
60 DOWA HOLDINGS CO., LTD. ANNUAL REPORT 2017 61
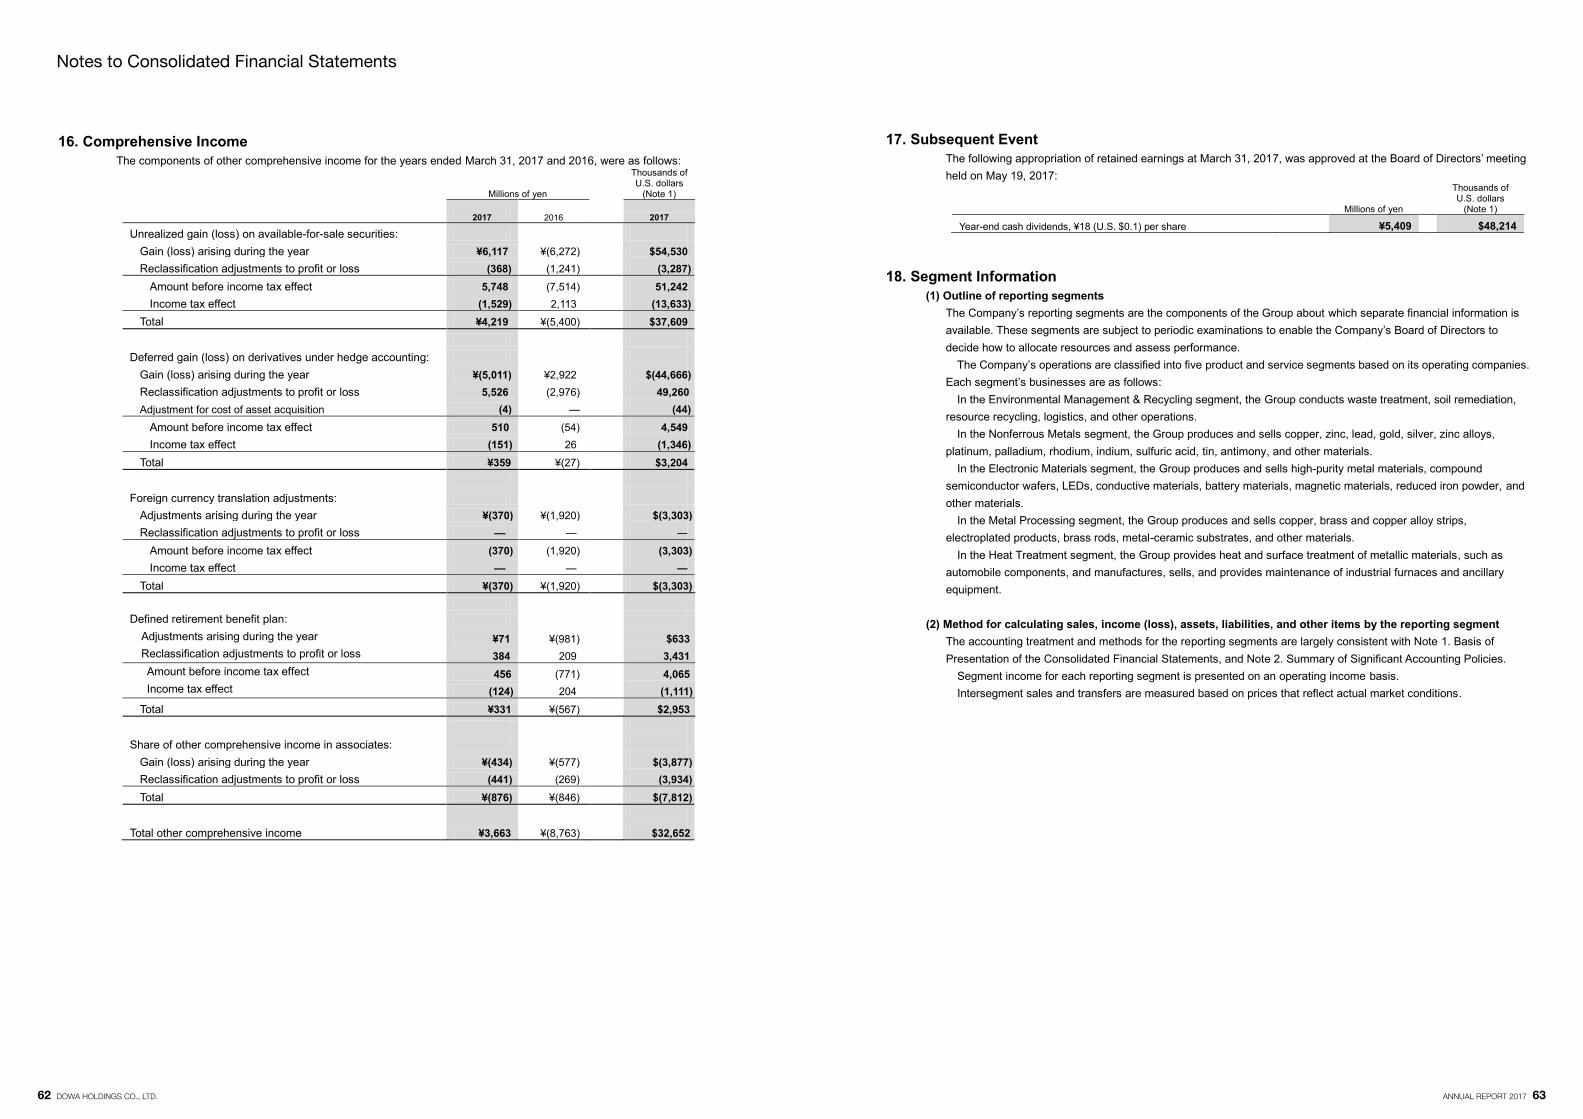
16. Comprehensive Income
The components of other comprehensive income for the years ended March 31, 2017 and 2016, were as follows:
Millions of yen Thousands of
U.S. dollars (Note 1)
2017 2016 2017
Unrealized gain (loss) on available-for-sale securities: Gain (loss) arising during the year ¥6,117 ¥(6,272) $54,530 Reclassification adjustments to profit or loss (368) (1,241) (3,287)
Amount before income tax effect 5,748 (7,514) 51,242 Income tax effect (1,529) 2,113 (13,633)
Total ¥4,219 ¥(5,400) $37,609
Deferred gain (loss) on derivatives under hedge accounting: Gain (loss) arising during the year ¥(5,011) ¥2,922 $(44,666) Reclassification adjustments to profit or loss 5,526 (2,976) 49,260 Adjustment for cost of asset acquisition (4) ― (44)
Amount before income tax effect 510 (54) 4,549 Income tax effect (151) 26 (1,346)
Total ¥359 ¥(27) $3,204 Foreign currency translation adjustments:
Adjustments arising during the year ¥(370) ¥(1,920) $(3,303) Reclassification adjustments to profit or loss ― ― ―
Amount before income tax effect (370) (1,920) (3,303) Income tax effect ― ― ―
Total ¥(370) ¥(1,920) $(3,303) Defined retirement benefit plan: Adjustments arising during the year ¥71 ¥(981) $633 Reclassification adjustments to profit or loss 384 209 3,431 Amount before income tax effect 456 (771) 4,065
Income tax effect (124) 204 (1,111) Total ¥331 ¥(567) $2,953
Share of other comprehensive income in associates:
Gain (loss) arising during the year ¥(434) ¥(577) $(3,877) Reclassification adjustments to profit or loss (441) (269) (3,934) Total ¥(876) ¥(846) $(7,812)
Total other comprehensive income ¥3,663 ¥(8,763)
$32,652
17. Subsequent Event The following appropriation of retained earnings at March 31, 2017, was approved at the Board of Directors‟ meeting held on May 19, 2017:
Millions of yen
Thousands of U.S. dollars
(Note 1)
Year-end cash dividends, ¥18 (U.S. $0.1) per share ¥5,409 $48,214 18. Segment Information
(1) Outline of reporting segments The Company‟s reporting segments are the components of the Group about which separate financial information is available. These segments are subject to periodic examinations to enable the Company‟s Board of Directors to decide how to allocate resources and assess performance.
The Company‟s operations are classified into five product and service segments based on its operating companies. Each segment‟s businesses are as follows:
In the Environmental Management & Recycling segment, the Group conducts waste treatment, soil remediation, resource recycling, logistics, and other operations.
In the Nonferrous Metals segment, the Group produces and sells copper, zinc, lead, gold, silver, zinc alloys, platinum, palladium, rhodium, indium, sulfuric acid, tin, antimony, and other materials.
In the Electronic Materials segment, the Group produces and sells high-purity metal materials, compound semiconductor wafers, LEDs, conductive materials, battery materials, magnetic materials, reduced iron powder, and other materials.
In the Metal Processing segment, the Group produces and sells copper, brass and copper alloy strips, electroplated products, brass rods, metal-ceramic substrates, and other materials.
In the Heat Treatment segment, the Group provides heat and surface treatment of metallic materials, such as automobile components, and manufactures, sells, and provides maintenance of industrial furnaces and ancillary equipment.
(2) Method for calculating sales, income (loss), assets, liabilities, and other items by the reporting segment
The accounting treatment and methods for the reporting segments are largely consistent with Note 1. Basis of Presentation of the Consolidated Financial Statements, and Note 2. Summary of Significant Accounting Policies.
Segment income for each reporting segment is presented on an operating income basis. Intersegment sales and transfers are measured based on prices that reflect actual market conditions.
Notes to Consolidated Financial Statements
62 DOWA HOLDINGS CO., LTD. ANNUAL REPORT 2017 63
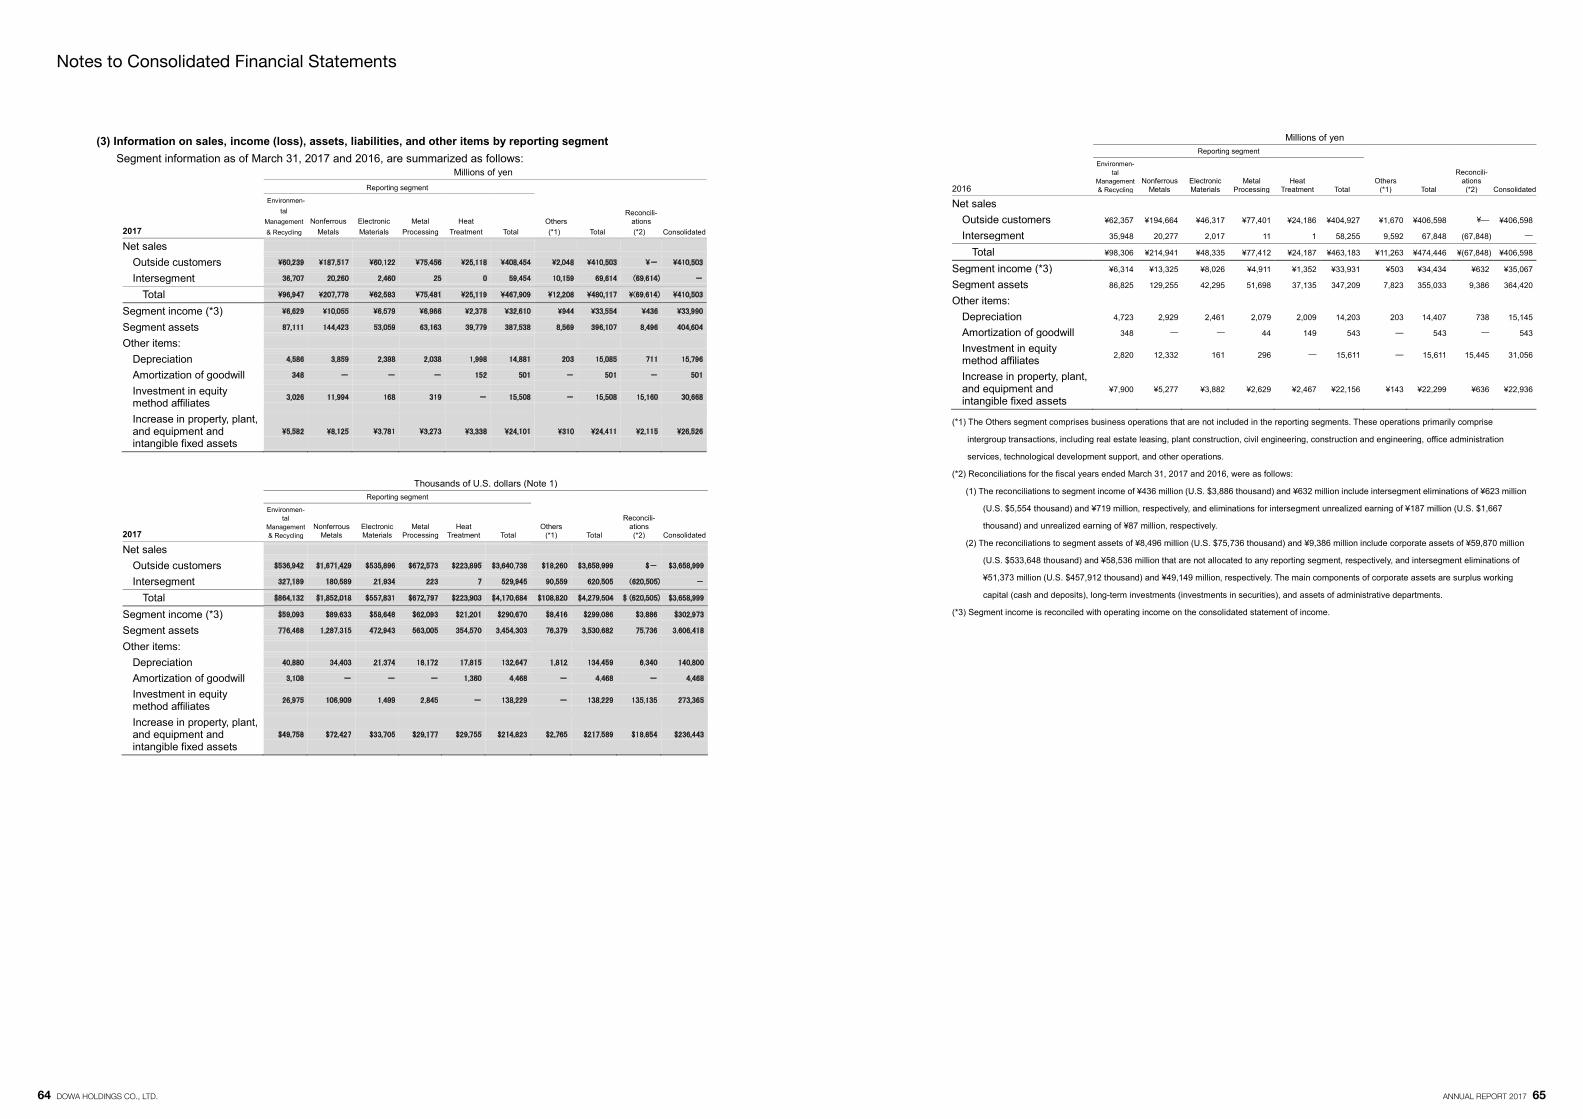
(3) Information on sales, income (loss), assets, liabilities, and other items by reporting segment Segment information as of March 31, 2017 and 2016, are summarized as follows:
Millions of yen
Reporting segment
Others (*1) Total
Reconcili- ations (*2) Consolidated 2017
Environmen- tal
Management & Recycling
Nonferrous Metals
Electronic Materials
Metal Processing
Heat Treatment Total
Net sales
Outside customers -
Intersegment -
Total Segment income (*3) Segment assets
Other items: Depreciation
Amortization of goodwill - - - - -
Investment in equity method affiliates
- -
Increase in property, plant, and equipment and intangible fixed assets
Thousands of U.S. dollars (Note 1) Reporting segment
Others
(*1) Total
Reconcili- ations (*2) Consolidated 2017
Environmen- tal
Management & Recycling
Nonferrous Metals
Electronic Materials
Metal Processing
Heat Treatment Total
Net sales
Outside customers -
Intersegment -
Total Segment income (*3) Segment assets
Other items: Depreciation
Amortization of goodwill - - - - -
Investment in equity method affiliates
- -
Increase in property, plant, and equipment and intangible fixed assets
Millions of yen
Reporting segment
Others
(*1) Total
Reconcili- ations (*2) Consolidated 2016
Environmen- tal
Management & Recycling
Nonferrous Metals
Electronic Materials
Metal Processing
Heat Treatment Total
Net sales
Outside customers ¥62,357 ¥194,664 ¥46,317 ¥77,401 ¥24,186 ¥404,927 ¥1,670 ¥406,598 ¥― ¥406,598
Intersegment 35,948 20,277 2,017 11 1 58,255 9,592 67,848 (67,848) ―
Total ¥98,306 ¥214,941 ¥48,335 ¥77,412 ¥24,187 ¥463,183 ¥11,263 ¥474,446 ¥(67,848) ¥406,598
Segment income (*3) ¥6,314 ¥13,325 ¥8,026 ¥4,911 ¥1,352 ¥33,931 ¥503 ¥34,434 ¥632 ¥35,067
Segment assets 86,825 129,255 42,295 51,698 37,135 347,209 7,823 355,033 9,386 364,420
Other items:
Depreciation 4,723 2,929 2,461 2,079 2,009 14,203 203 14,407 738 15,145
Amortization of goodwill 348 ― ― 44 149 543 ― 543 ― 543
Investment in equity method affiliates
2,820 12,332 161 296 ― 15,611 ― 15,611 15,445 31,056
Increase in property, plant, and equipment and intangible fixed assets
¥7,900 ¥5,277 ¥3,882 ¥2,629 ¥2,467 ¥22,156 ¥143 ¥22,299 ¥636 ¥22,936
(*1) The Others segment comprises business operations that are not included in the reporting segments. These operations primarily comprise
intergroup transactions, including real estate leasing, plant construction, civil engineering, construction and engineering, office administration
services, technological development support, and other operations.
(*2) Reconciliations for the fiscal years ended March 31, 2017 and 2016, were as follows:
(1) The reconciliations to segment income of ¥436 million (U.S. $3,886 thousand) and ¥632 million include intersegment eliminations of ¥623 million
(U.S. $5,554 thousand) and ¥719 million, respectively, and eliminations for intersegment unrealized earning of ¥187 million (U.S. $1,667
thousand) and unrealized earning of ¥87 million, respectively.
(2) The reconciliations to segment assets of ¥8,496 million (U.S. $75,736 thousand) and ¥9,386 million include corporate assets of ¥59,870 million
(U.S. $533,648 thousand) and ¥58,536 million that are not allocated to any reporting segment, respectively, and intersegment eliminations of
¥51,373 million (U.S. $457,912 thousand) and ¥49,149 million, respectively. The main components of corporate assets are surplus working
capital (cash and deposits), long-term investments (investments in securities), and assets of administrative departments.
(*3) Segment income is reconciled with operating income on the consolidated statement of income.
Notes to Consolidated Financial Statements
64 DOWA HOLDINGS CO., LTD. ANNUAL REPORT 2017 65
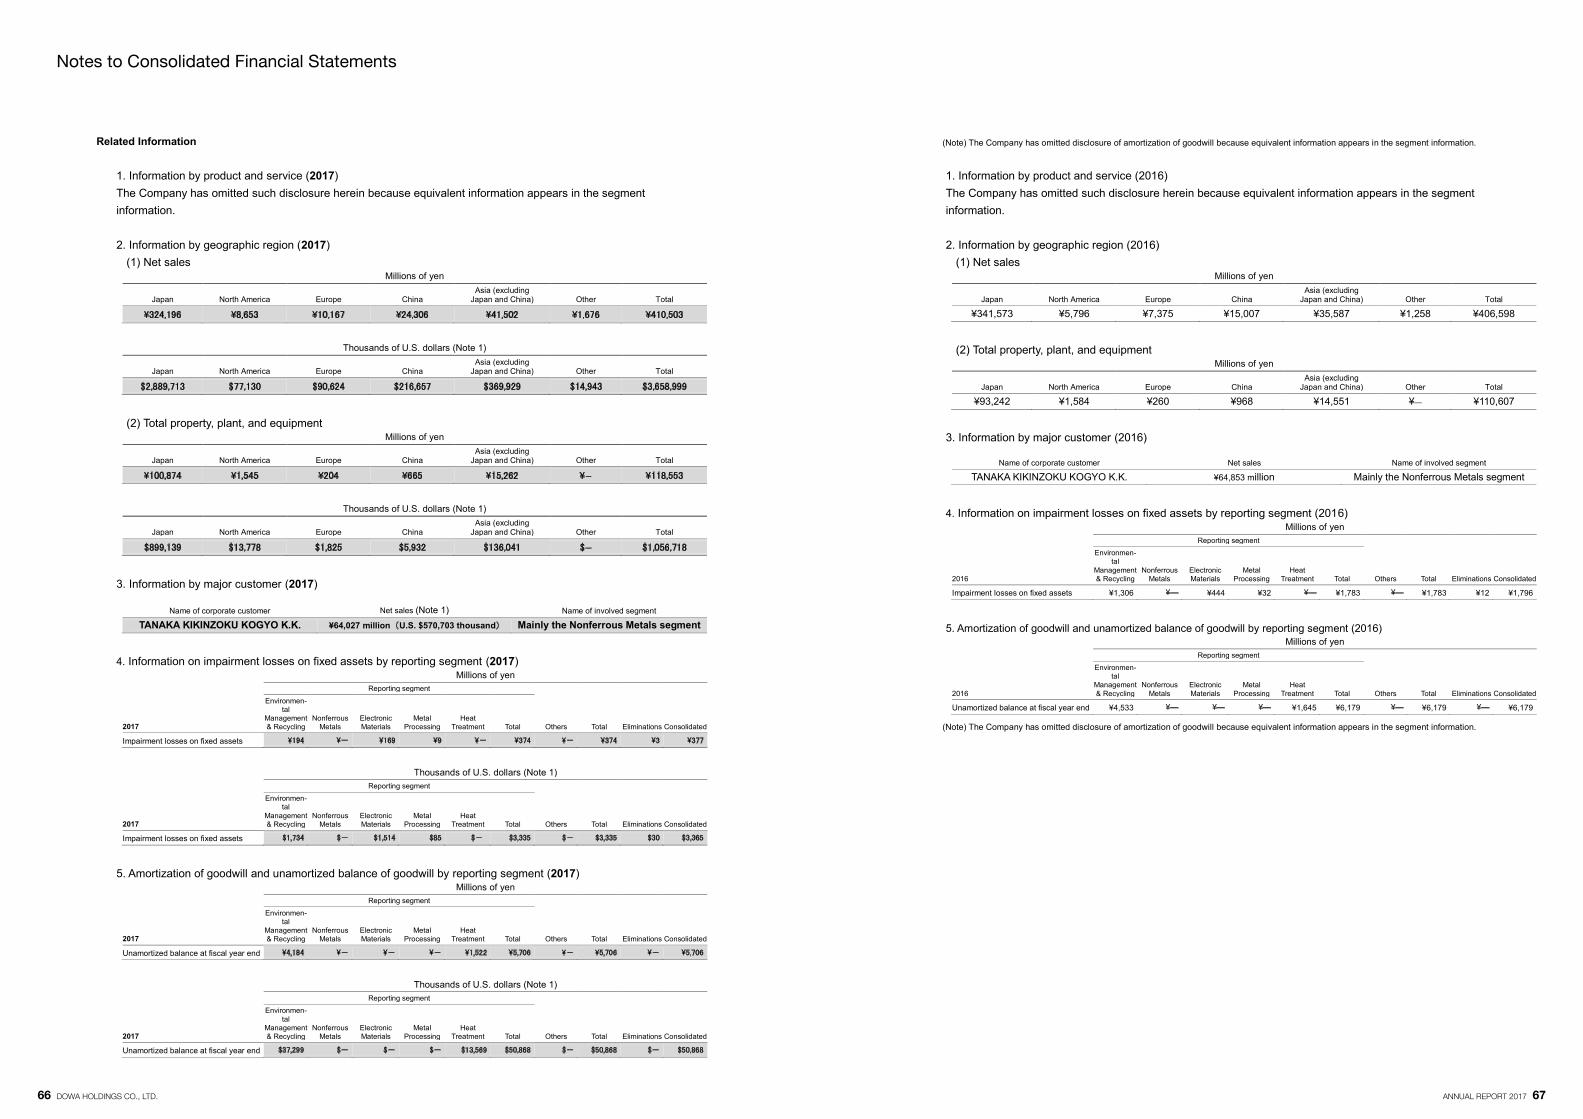
Related Information
1. Information by product and service (2017) The Company has omitted such disclosure herein because equivalent information appears in the segment information. 2. Information by geographic region (2017)
(1) Net sales Millions of yen
Japan North America Europe China Asia (excluding
Japan and China) Other Total
Thousands of U.S. dollars (Note 1)
Japan North America Europe China Asia (excluding
Japan and China) Other Total
(2) Total property, plant, and equipment Millions of yen
Japan North America Europe China Asia (excluding
Japan and China) Other Total
-
Thousands of U.S. dollars (Note 1)
Japan North America Europe China Asia (excluding
Japan and China) Other Total
-
3. Information by major customer (2017)
Name of corporate customer Net sales (Note 1) Name of involved segment
TANAKA KIKINZOKU KOGYO K.K. ¥64,027 million (U.S. $570,703 thousand) Mainly the Nonferrous Metals segment
4. Information on impairment losses on fixed assets by reporting segment (2017)
Millions of yen
Reporting segment
Others Total Eliminations Consolidated 2017
Environmen- tal
Management & Recycling
Nonferrous Metals
Electronic Materials
Metal Processing
Heat Treatment Total
Impairment losses on fixed assets - - -
Thousands of U.S. dollars (Note 1)
Reporting segment
Others Total Eliminations Consolidated 2017
Environmen- tal
Management & Recycling
Nonferrous Metals
Electronic Materials
Metal Processing
Heat Treatment Total
Impairment losses on fixed assets - - -
5. Amortization of goodwill and unamortized balance of goodwill by reporting segment (2017)
Millions of yen
Reporting segment
Others Total Eliminations Consolidated 2017
Environmen- tal
Management & Recycling
Nonferrous Metals
Electronic Materials
Metal Processing
Heat Treatment Total
Unamortized balance at fiscal year end - - - - -
Thousands of U.S. dollars (Note 1)
Reporting segment
Others Total Eliminations Consolidated 2017
Environmen- tal
Management & Recycling
Nonferrous Metals
Electronic Materials
Metal Processing
Heat Treatment Total
Unamortized balance at fiscal year end - - - - -
(Note) The Company has omitted disclosure of amortization of goodwill because equivalent information appears in the segment information.
1. Information by product and service (2016) The Company has omitted such disclosure herein because equivalent information appears in the segment information. 2. Information by geographic region (2016)
(1) Net sales Millions of yen
Japan North America Europe China Asia (excluding
Japan and China) Other Total
¥341,573 ¥5,796 ¥7,375 ¥15,007 ¥35,587 ¥1,258 ¥406,598
(2) Total property, plant, and equipment Millions of yen
Japan North America Europe China Asia (excluding
Japan and China) Other Total
¥93,242 ¥1,584 ¥260 ¥968 ¥14,551 ¥― ¥110,607
3. Information by major customer (2016)
Name of corporate customer Net sales Name of involved segment
TANAKA KIKINZOKU KOGYO K.K. ¥64,853 million Mainly the Nonferrous Metals segment
4. Information on impairment losses on fixed assets by reporting segment (2016)
Millions of yen
Reporting segment
Others Total Eliminations Consolidated 2016
Environmen- tal
Management & Recycling
Nonferrous Metals
Electronic Materials
Metal Processing
Heat Treatment Total
Impairment losses on fixed assets ¥1,306 ¥― ¥444 ¥32 ¥― ¥1,783 ¥― ¥1,783 ¥12 ¥1,796
5. Amortization of goodwill and unamortized balance of goodwill by reporting segment (2016)
Millions of yen
Reporting segment
Others Total Eliminations Consolidated 2016
Environmen- tal
Management & Recycling
Nonferrous Metals
Electronic Materials
Metal Processing
Heat Treatment Total
Unamortized balance at fiscal year end ¥4,533 ¥― ¥― ¥― ¥1,645 ¥6,179 ¥― ¥6,179 ¥― ¥6,179
(Note) The Company has omitted disclosure of amortization of goodwill because equivalent information appears in the segment information.
Notes to Consolidated Financial Statements
66 DOWA HOLDINGS CO., LTD. ANNUAL REPORT 2017 67
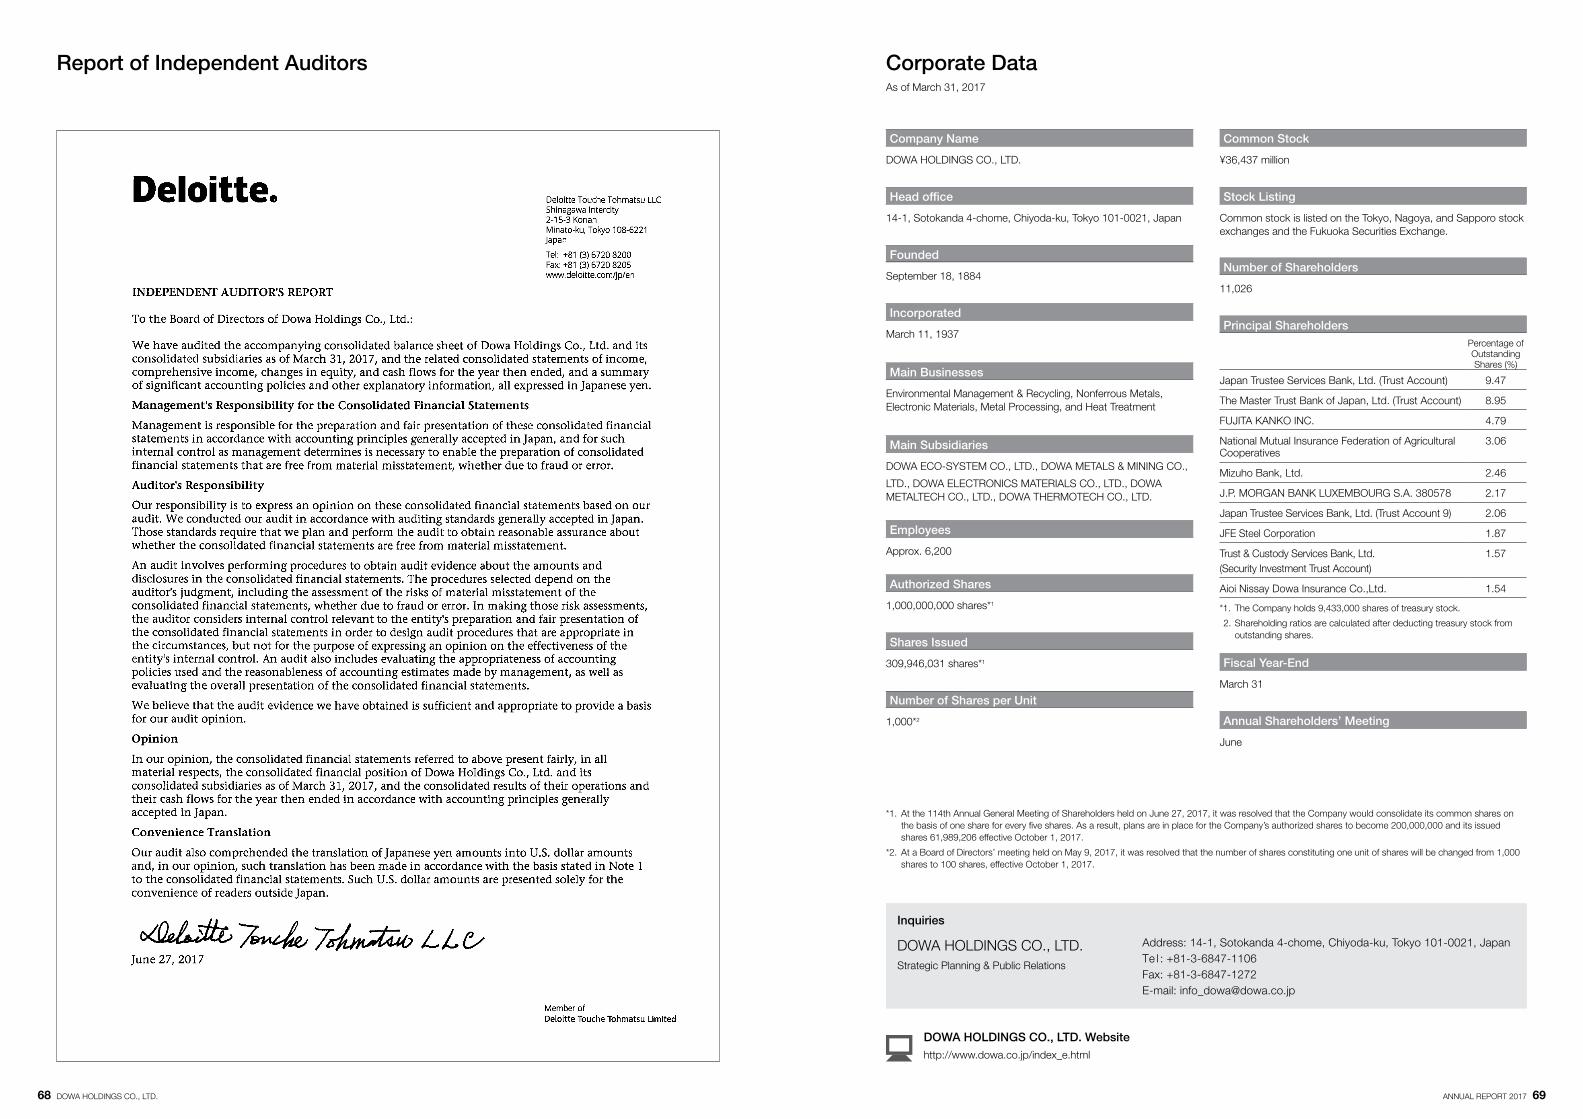
Corporate DataAs of March 31, 2017
*1. At the 114th Annual General Meeting of Shareholders held on June 27, 2017, it was resolved that the Company would consolidate its common shares on the basis of one share for every five shares. As a result, plans are in place for the Company’s authorized shares to become 200,000,000 and its issued shares 61,989,206 effective October 1, 2017.
*2. At a Board of Directors’ meeting held on May 9, 2017, it was resolved that the number of shares constituting one unit of shares will be changed from 1,000 shares to 100 shares, effective October 1, 2017.
Company Name
DOWA HOLDINGS CO., LTD.
Head office
14-1, Sotokanda 4-chome, Chiyoda-ku, Tokyo 101-0021, Japan
Founded
September 18, 1884
Incorporated
March 11, 1937
Main Businesses
Environmental Management & Recycling, Nonferrous Metals, Electronic Materials, Metal Processing, and Heat Treatment
Main Subsidiaries
DOWA ECO-SYSTEM CO., LTD., DOWA METALS & MINING CO.,
LTD., DOWA ELECTRONICS MATERIALS CO., LTD., DOWA METALTECH CO., LTD., DOWA THERMOTECH CO., LTD.
Employees
Approx. 6,200
Authorized Shares
1,000,000,000 shares*1
Shares Issued
309,946,031 shares*1
Number of Shares per Unit
1,000*2
Common Stock
¥36,437 million
Stock Listing
Common stock is listed on the Tokyo, Nagoya, and Sapporo stock exchanges and the Fukuoka Securities Exchange.
Number of Shareholders
11,026
Principal ShareholdersPercentage of Outstanding Shares (%)
Japan Trustee Services Bank, Ltd. (Trust Account) 9.47
The Master Trust Bank of Japan, Ltd. (Trust Account) 8.95
FUJITA KANKO INC. 4.79
National Mutual Insurance Federation of Agricultural Cooperatives
3.06
Mizuho Bank, Ltd. 2.46
J.P. MORGAN BANK LUXEMBOURG S.A. 380578 2.17
Japan Trustee Services Bank, Ltd. (Trust Account 9) 2.06
JFE Steel Corporation 1.87
Trust & Custody Services Bank, Ltd. (Security Investment Trust Account)
1.57
Aioi Nissay Dowa Insurance Co.,Ltd. 1.54
*1. The Company holds 9,433,000 shares of treasury stock.
2. Shareholding ratios are calculated after deducting treasury stock from outstanding shares.
Fiscal Year-End
March 31
Annual Shareholders’ Meeting
June
DOWA HOLDINGS CO., LTD. Websitehttp://www.dowa.co.jp/index_e.html
Inquiries
DOWA HOLDINGS CO., LTD.Strategic Planning & Public Relations
Address: 14-1, Sotokanda 4-chome, Chiyoda-ku, Tokyo 101-0021, JapanTe l : +81-3-6847-1106Fax: +81-3-6847-1272E-mail: [email protected]
Report of Independent Auditors
68 DOWA HOLDINGS CO., LTD. ANNUAL REPORT 2017 69