DOTP ANNUAL REPORT FOR 2019/2020
264
DOTP ANNUAL REPORT FOR 2019/2020 1
Transcript of DOTP ANNUAL REPORT FOR 2019/2020
DOTP ANNUAL REPORT FOR 2019/2020 1

2 DOTP ANNUAL REPORT FOR 2019/2020
DOTP ANNUAL REPORT FOR 2019/2020 3
Contents
PART A: GENERAL INFORMATION ............................................................................................... 6
1. DEPARTMENT GENERAL INFORMATION ................................................................................................. 8
2. ABBREVIATIONS/ACRONYMS ................................................................................................................. 9
3. FOREWORD BY THE PREMIER .................................................................................................................. 12
4. REPORT OF THE ACCOUNTING OFFICER ............................................................................................... 14
4.1. Overview of the operations of the department ..................................................................... 14
4.2. Overview of the financial results of the department ............................................................. 16
4.3. Irregular expenditure ................................................................................................................. 18
4.4. Future plans of the department ............................................................................................... 19
4.5. Public-private partnerships ........................................................................................................ 21
4.6. Discontinued activities/activities to be discontinued ............................................................ 21
4.7. New or proposed activities ....................................................................................................... 21
4.8. Supply chain management ...................................................................................................... 21
4.9. Gifts and donations received in kind from non-related parties ........................................... 22
4.10. Exemptions and deviations received from the national treasury ........................................ 23
4.11. Events after the reporting date ................................................................................................ 23
4.12. Other .......................................................................................................................................... 25
5. STATEMENT OF RESPONSIBILITY AND CONFIRMATION OF ACCURACY OF THE ANNUAL REPORT ... 26
6. STRATEGIC OVERVIEW ............................................................................................................................. 27
6.1. Vision .......................................................................................................................................... 27
6.2. Mission .......................................................................................................................................... 27
6.3. Values .......................................................................................................................................... 27
7. LEGISLATIVE AND OTHER MANDATES .................................................................................................... 29
7.1. Constitutional mandates ........................................................................................................... 29
7.2. Legislative mandates ................................................................................................................. 29
8. ORGANISATIONAL STRUCTURE ............................................................................................................... 31
9. ENTITIES REPORTING TO THE PREMIER ..................................................................................................... 34
PART B: PERFORMANCE INFORMATION ..................................................................................... 36
1. AUDITOR-GENERAL’S REPORT: PREDETERMINED OBJECTIVES ............................................................. 38
2. OVERVIEW OF DEPARTMENTAL PERFORMANCE .................................................................................. 38
2.1. Service delivery environment ................................................................................................... 38
2.2. Service delivery improvement plan ......................................................................................... 41
2.3. Organisational environment ..................................................................................................... 48
2.4. Key policy developments and legislative changes ............................................................... 50
4 DOTP ANNUAL REPORT FOR 2019/2020
3. STRATEGIC OUTCOME-ORIENTED GOALS ............................................................................................. 51
4. PERFORMANCE INFORMATION BY PROGRAMME ................................................................................ 56
4.1. Programme 1: Executive Governance and Integration ....................................................... 56
4.2. Programme 2: Provincial Strategic Management ................................................................. 61
4.3. Programme 3: People Management ...................................................................................... 68
4.4. Programme 4: Centre for e-Innovation .................................................................................... 83
4.5. Programme 5: Corporate Assurance ....................................................................................... 89
5. TRANSFER PAYMENTS ............................................................................................................................... 98
5.1. Transfer payments to public entities ......................................................................................... 98
5.2. Transfer payments to all organisations other than public entities ........................................ 98
6. CONDITIONAL GRANTS ........................................................................................................................... 100
6.1. Conditional grants and earmarked funds paid ..................................................................... 100
6.2. Conditional grants and earmarked funds received .............................................................. 100
7. DONOR FUNDS ......................................................................................................................................... 109
7.1. Donor funds received ................................................................................................................ 109
8. CAPITAL INVESTMENT ............................................................................................................................... 109
8.1. Capital investment, maintenance and asset management plan ...................................... 109
PART C: GOVERNANCE .............................................................................................................. 110
1. INTRODUCTION ........................................................................................................................................ 112
2. RISK MANAGEMENT ................................................................................................................................. 112
3. FRAUD AND CORRUPTION ...................................................................................................................... 115
4. MINIMISING CONFLICT OF INTEREST ....................................................................................................... 116
5. CODE OF CONDUCT ............................................................................................................................... 117
6. HEALTH SAFETY AND ENVIRONMENTAL ISSUES ...................................................................................... 117
7. PORTFOLIO COMMITTEES ........................................................................................................................ 119
8. SCOPA RESOLUTIONS .............................................................................................................................. 120
9. INTERNAL AUDIT AND AUDIT COMMITTEES ............................................................................................ 122
10. AUDIT COMMITTEE REPORT ..................................................................................................................... 123
11. BROAD-BASED BLACK ECONOMIC EMPOWERMENT (B-BBEE) COMPLIANCE
PERFORMANCE INFORMATION .............................................................................................................. 126
PART D: PEOPLE MANAGEMENT OVERSIGHT .............................................................................. 128
1. INTRODUCTION ........................................................................................................................................ 130
2. STATUS OF PEOPLE MANAGEMENT AT THE DEPARTMENT .................................................................... 130
2.1. Departmental workforce planning priorities ........................................................................... 130
2.2. Employee performance management ................................................................................... 131
2.3. Employee wellness ..................................................................................................................... 131
2.4. People management monitoring ............................................................................................ 132
DOTP ANNUAL REPORT FOR 2019/2020 5
3. PEOPLE MANAGEMENT OVERSIGHT STATISTICS .................................................................................... 133
3.1. Personnel-related expenditure ................................................................................................. 133
3.2. Employment and vacancies .................................................................................................... 135
3.3. Job evaluation ............................................................................................................................ 137
3.4. Employment changes ............................................................................................................... 139
3.5. Employment equity .................................................................................................................... 143
3.6. Signing of performance agreements by sms members ........................................................ 149
3.7. Filling of sms posts ....................................................................................................................... 150
3.8. Employee performance ............................................................................................................ 152
3.9. Foreign workers ........................................................................................................................... 155
3.10. Leave utilisation for the period 1 January 2019 to 31 December 2019 ............................... 156
3.11. Health promotion programmes, including hiv and aids ....................................................... 159
3.12. Labour relations .......................................................................................................................... 161
3.13. Skills development ...................................................................................................................... 164
3.14. Injury on duty ............................................................................................................................... 165
3.15. Utilisation of consultants ............................................................................................................ 166
PART E: FINANCIAL INFORMATION ............................................................................................ 168
1. REPORT OF THE AUDITOR-GENERAL TO WESTERN CAPE PROVINCIAL PARLIAMENT ON
VOTE NO. 1: WESTERN CAPE DEPARTMENT OF THE PREMIER .............................................................. 171
1.1. Report on the audit of the financial statements .................................................................... 171
1.2. Report on the audit of the annual performance report ....................................................... 172
1.3. Report on the audit of compliance with legislation .............................................................. 173
1.4. Other information ....................................................................................................................... 173
1.5. Internal control deficiencies ..................................................................................................... 174
2. ANNEXURE – AUDITOR-GENERAL’S RESPONSIBILITY FOR THE AUDIT .................................................. 175
3. APPROPRIATION STATEMENT ................................................................................................................... 176
4. NOTES TO THE APPROPRIATION STATEMENT ........................................................................................... 205
5. STATEMENT OF THE FINANCIAL PERFORMANCE .................................................................................... 207
6. STATEMENT OF THE FINANCIAL POSITION ............................................................................................... 208
7. STATEMENT OF CHANGES IN NET ASSETS ................................................................................................ 209
8. CASH FLOW STATEMENT ........................................................................................................................... 210
9. NOTES TO THE ANNUAL FINANCIAL STATEMENTS (INCLUDING ACCOUNTING POLICIES) ................. 211
10. ANNEXURES .......................................................................................................................................... 248

6 DOTP ANNUAL REPORT FOR 2019/2020
PART A: GENERAL INFORMATION

DOTP ANNUAL REPORT FOR 2019/2020 7
8 DOTP ANNUAL REPORT FOR 2019/2020
1. DEPARTMENT GENERAL INFORMATION
FULL NAME: Department of the Premier
PHYSICAL ADDRESS: Room 157
1st Floor
15 Wale Street
Cape Town
POSTAL ADDRESS: P.O. Box 659
Cape Town
8001
TELEPHONE NUMBER/S: 021 483 6032
FAX NUMBER: 021 483 3300
EMAIL ADDRESS: [email protected]
WEBSITE ADDRESS: www.westerncape.gov.za
DOTP ANNUAL REPORT FOR 2019/2020 9
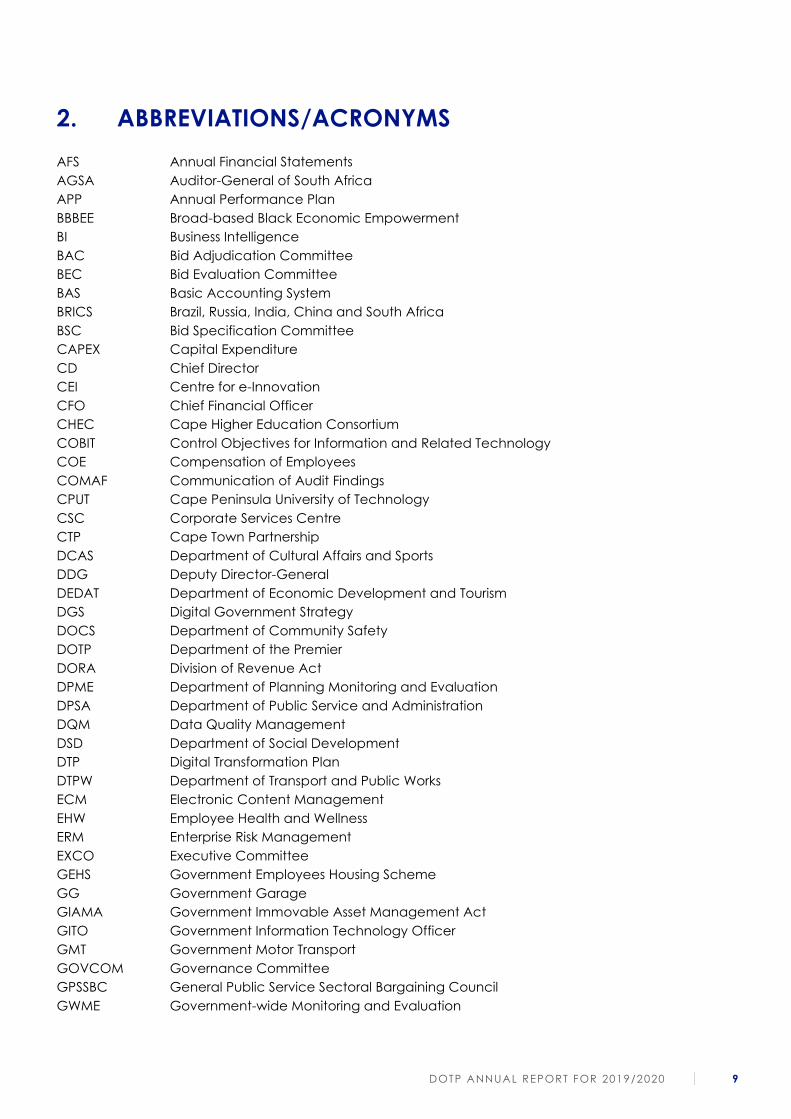
2. ABBREVIATIONS/ACRONYMS
AFS Annual Financial Statements
AGSA Auditor-General of South Africa
APP Annual Performance Plan
BBBEE Broad-based Black Economic Empowerment
BI Business Intelligence
BAC Bid Adjudication Committee
BEC Bid Evaluation Committee
BAS Basic Accounting System
BRICS Brazil, Russia, India, China and South Africa
BSC Bid Specification Committee
CAPEX Capital Expenditure
CD Chief Director
CEI Centre for e-Innovation
CFO Chief Financial Officer
CHEC Cape Higher Education Consortium
COBIT Control Objectives for Information and Related Technology
COE Compensation of Employees
COMAF Communication of Audit Findings
CPUT Cape Peninsula University of Technology
CSC Corporate Services Centre
CTP Cape Town Partnership
DCAS Department of Cultural Affairs and Sports
DDG Deputy Director-General
DEDAT Department of Economic Development and Tourism
DGS Digital Government Strategy
DOCS Department of Community Safety
DOTP Department of the Premier
DORA Division of Revenue Act
DPME Department of Planning Monitoring and Evaluation
DPSA Department of Public Service and Administration
DQM Data Quality Management
DSD Department of Social Development
DTP Digital Transformation Plan
DTPW Department of Transport and Public Works
ECM Electronic Content Management
EHW Employee Health and Wellness
ERM Enterprise Risk Management
EXCO Executive Committee
GEHS Government Employees Housing Scheme
GG Government Garage
GIAMA Government Immovable Asset Management Act
GITO Government Information Technology Officer
GMT Government Motor Transport
GOVCOM Governance Committee
GPSSBC General Public Service Sectoral Bargaining Council
GWME Government-wide Monitoring and Evaluation
10 DOTP ANNUAL REPORT FOR 2019/2020
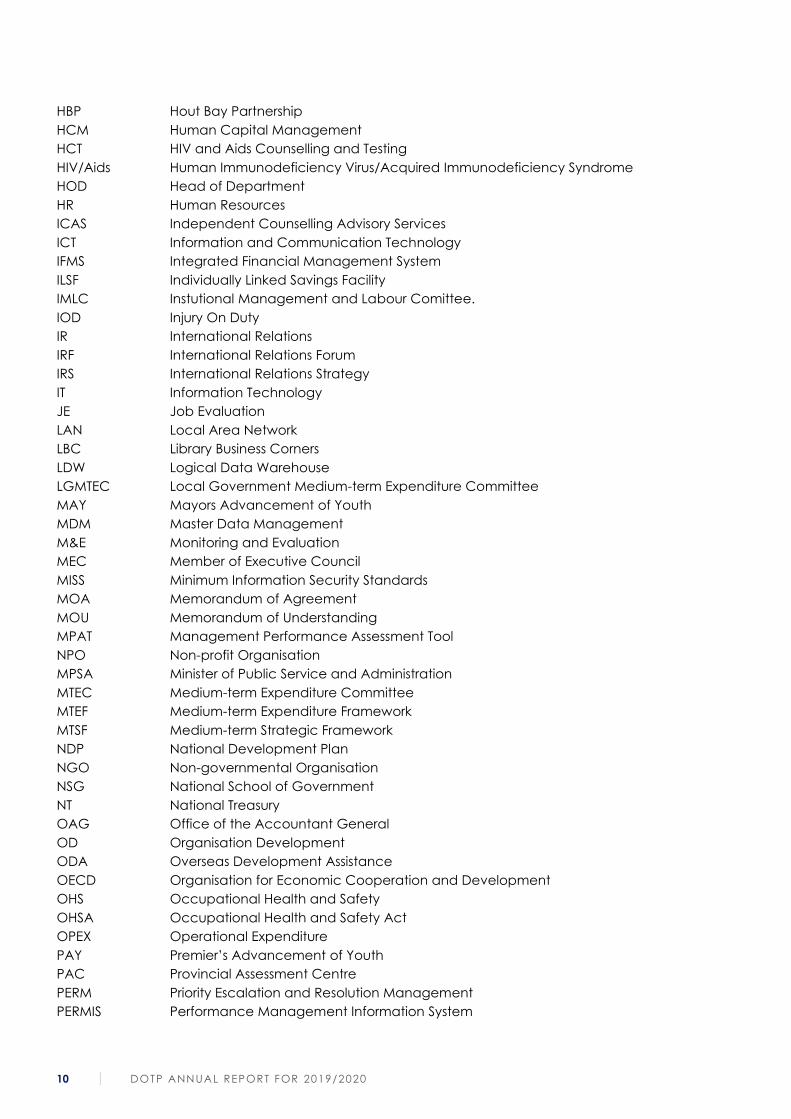
HBP Hout Bay Partnership
HCM Human Capital Management
HCT HIV and Aids Counselling and Testing
HIV/Aids Human Immunodeficiency Virus/Acquired Immunodeficiency Syndrome
HOD Head of Department
HR Human Resources
ICAS Independent Counselling Advisory Services
ICT Information and Communication Technology
IFMS Integrated Financial Management System
ILSF Individually Linked Savings Facility
IMLC Instutional Management and Labour Comittee.
IOD Injury On Duty
IR International Relations
IRF International Relations Forum
IRS International Relations Strategy
IT Information Technology
JE Job Evaluation
LAN Local Area Network
LBC Library Business Corners
LDW Logical Data Warehouse
LGMTEC Local Government Medium-term Expenditure Committee
MAY Mayors Advancement of Youth
MDM Master Data Management
M&E Monitoring and Evaluation
MEC Member of Executive Council
MISS Minimum Information Security Standards
MOA Memorandum of Agreement
MOU Memorandum of Understanding
MPAT Management Performance Assessment Tool
NPO Non-profit Organisation
MPSA Minister of Public Service and Administration
MTEC Medium-term Expenditure Committee
MTEF Medium-term Expenditure Framework
MTSF Medium-term Strategic Framework
NDP National Development Plan
NGO Non-governmental Organisation
NSG National School of Government
NT National Treasury
OAG Office of the Accountant General
OD Organisation Development
ODA Overseas Development Assistance
OECD Organisation for Economic Cooperation and Development
OHS Occupational Health and Safety
OHSA Occupational Health and Safety Act
OPEX Operational Expenditure
PAY Premier’s Advancement of Youth
PAC Provincial Assessment Centre
PERM Priority Escalation and Resolution Management
PERMIS Performance Management Information System
DOTP ANNUAL REPORT FOR 2019/2020 11
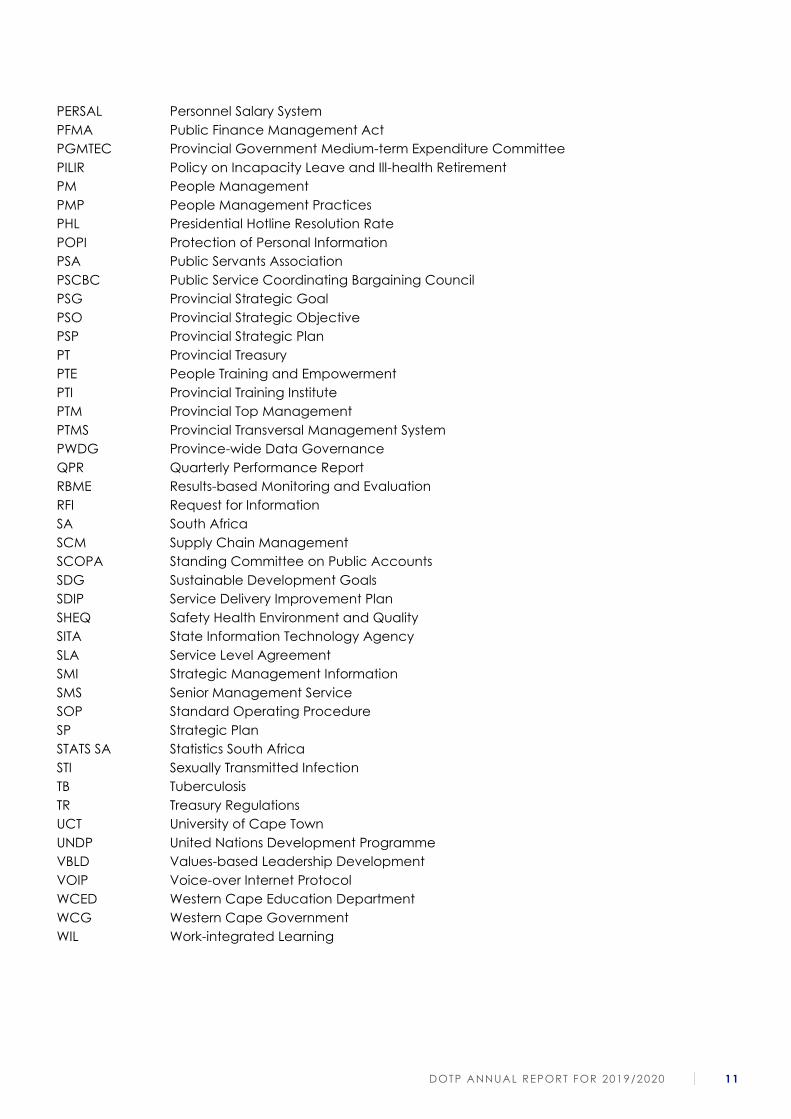
PERSAL Personnel Salary System
PFMA Public Finance Management Act
PGMTEC Provincial Government Medium-term Expenditure Committee
PILIR Policy on Incapacity Leave and Ill-health Retirement
PM People Management
PMP People Management Practices
PHL Presidential Hotline Resolution Rate
POPI Protection of Personal Information
PSA Public Servants Association
PSCBC Public Service Coordinating Bargaining Council
PSG Provincial Strategic Goal
PSO Provincial Strategic Objective
PSP Provincial Strategic Plan
PT Provincial Treasury
PTE People Training and Empowerment
PTI Provincial Training Institute
PTM Provincial Top Management
PTMS Provincial Transversal Management System
PWDG Province-wide Data Governance
QPR Quarterly Performance Report
RBME Results-based Monitoring and Evaluation
RFI Request for Information
SA South Africa
SCM Supply Chain Management
SCOPA Standing Committee on Public Accounts
SDG Sustainable Development Goals
SDIP Service Delivery Improvement Plan
SHEQ Safety Health Environment and Quality
SITA State Information Technology Agency
SLA Service Level Agreement
SMI Strategic Management Information
SMS Senior Management Service
SOP Standard Operating Procedure
SP Strategic Plan
STATS SA Statistics South Africa
STI Sexually Transmitted Infection
TB Tuberculosis
TR Treasury Regulations
UCT University of Cape Town
UNDP United Nations Development Programme
VBLD Values-based Leadership Development
VOIP Voice-over Internet Protocol
WCED Western Cape Education Department
WCG Western Cape Government
WIL Work-integrated Learning
12 DOTP ANNUAL REPORT FOR 2019/2020
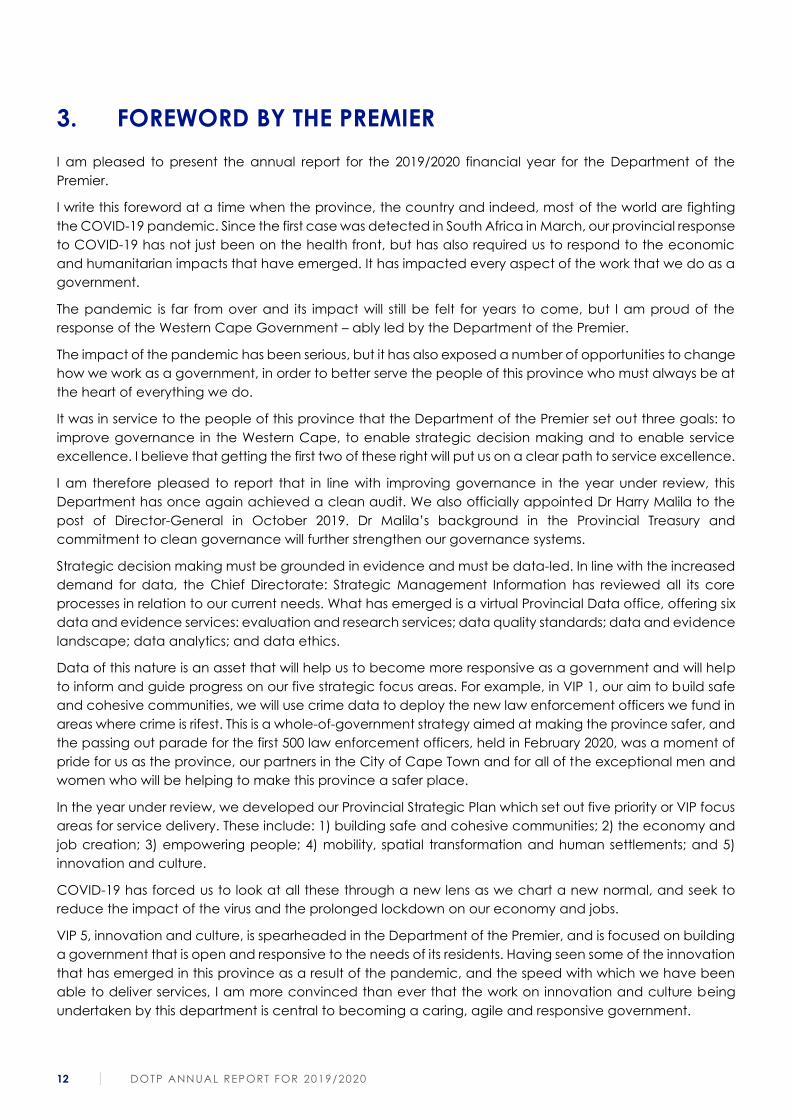
3. FOREWORD BY THE PREMIER
I am pleased to present the annual report for the 2019/2020 financial year for the Department of the
Premier.
I write this foreword at a time when the province, the country and indeed, most of the world are fighting
the COVID-19 pandemic. Since the first case was detected in South Africa in March, our provincial response
to COVID-19 has not just been on the health front, but has also required us to respond to the economic
and humanitarian impacts that have emerged. It has impacted every aspect of the work that we do as a
government.
The pandemic is far from over and its impact will still be felt for years to come, but I am proud of the
response of the Western Cape Government – ably led by the Department of the Premier.
The impact of the pandemic has been serious, but it has also exposed a number of opportunities to change
how we work as a government, in order to better serve the people of this province who must always be at
the heart of everything we do.
It was in service to the people of this province that the Department of the Premier set out three goals: to
improve governance in the Western Cape, to enable strategic decision making and to enable service
excellence. I believe that getting the first two of these right will put us on a clear path to service excellence.
I am therefore pleased to report that in line with improving governance in the year under review, this
Department has once again achieved a clean audit. We also officially appointed Dr Harry Malila to the
post of Director-General in October 2019. Dr Malila’s background in the Provincial Treasury and
commitment to clean governance will further strengthen our governance systems.
Strategic decision making must be grounded in evidence and must be data-led. In line with the increased
demand for data, the Chief Directorate: Strategic Management Information has reviewed all its core
processes in relation to our current needs. What has emerged is a virtual Provincial Data office, offering six
data and evidence services: evaluation and research services; data quality standards; data and evidence
landscape; data analytics; and data ethics.
Data of this nature is an asset that will help us to become more responsive as a government and will help
to inform and guide progress on our five strategic focus areas. For example, in VIP 1, our aim to build safe
and cohesive communities, we will use crime data to deploy the new law enforcement officers we fund in
areas where crime is rifest. This is a whole-of-government strategy aimed at making the province safer, and
the passing out parade for the first 500 law enforcement officers, held in February 2020, was a moment of
pride for us as the province, our partners in the City of Cape Town and for all of the exceptional men and
women who will be helping to make this province a safer place.
In the year under review, we developed our Provincial Strategic Plan which set out five priority or VIP focus
areas for service delivery. These include: 1) building safe and cohesive communities; 2) the economy and
job creation; 3) empowering people; 4) mobility, spatial transformation and human settlements; and 5)
innovation and culture.
COVID-19 has forced us to look at all these through a new lens as we chart a new normal, and seek to
reduce the impact of the virus and the prolonged lockdown on our economy and jobs.
VIP 5, innovation and culture, is spearheaded in the Department of the Premier, and is focused on building
a government that is open and responsive to the needs of its residents. Having seen some of the innovation
that has emerged in this province as a result of the pandemic, and the speed with which we have been
able to deliver services, I am more convinced than ever that the work on innovation and culture being
undertaken by this department is central to becoming a caring, agile and responsive government.
DOTP ANNUAL REPORT FOR 2019/2020 13
The key public-facing services of this Department include the roll-out of Wi-Fi in the province, as well as the
management of the contact centre.
In the year under review, we have added an additional 452 hotspots across the province, bringing the
number of public Wi-Fi hotspots to 630 in the Western Cape. This has allowed about 120 000 people access
to the internet each month.
We were also able to open three new e-centres as part of our Cape Access project, in Klapmuts,
Sonskynvallei and Rietpoort. Two additional e-centres in Brandwacht and Melkhoutfontein were due to
open in March 2020, however these were delayed due to COVID-19 concerns and the lockdown. We will
ensure that they will be brought online soon. These centres provide spaces in communities where people
can make use of computers and printers, to access the internet and email, search and apply for jobs and
receive computer training. A total of 682 263 Cape Access user sessions were recorded in the 2019/2020
financial year, and 3 171 accredited and 1 504 non-accredited training sessions completed.
Our contact centre allows for citizens to reach us through a number of channels including the website,
direct calls and social media channels. In the year under review, 108 942 009 tickets were generated. The
data from these calls is logged and used to produce monthly reports detailing the top 10 issues identified,
which are then shared with the appropriate departments to indicate where improvements need to be
made.
This year, my office also introduced monthly First Thursday events, which allow members of the public to
interact face-to-face with members of the cabinet, to ask questions and to share ideas. While the in-person
version of these interactions have had to be put on hold as a result of COVID-19, we introduced other
innovative ways of connecting with our residents, including radio and social media engagements.
The Department of the Premier has also been instrumental in arranging meetings with key stakeholder
groups. In the year under review, the cabinet has held fruitful meetings with stakeholders in agriculture,
municipalities, business, and in the religious sector. Building these partnerships is key in ensuring a whole-of-
society approach in the Western Cape.
The Department of the Premier also completed the policy and legal work to appoint the first ever Children’s
Commissioner in the Western Cape over the past year – allowing the Western Cape Legislature to
commence the appointment process in the 2019/2020 year. Ms Christina Nomdu took up the post on
1 June 2020 and we wish her well in her important role.
I would like to express my thanks to Dr Malila and the entire Department of the Premier team for their hard
work and support over the past year. I look forward to continuing the work we have begun, to ensure that
this province delivers services that will improve the lives of all those who reside here.
________________________
MR ALAN R WINDE
PREMIER OF THE WESTERN CAPE WESTERN CAPE
DATE: 31 July 2020
14 DOTP ANNUAL REPORT FOR 2019/2020
4. REPORT OF THE ACCOUNTING OFFICER
4.1. Overview of the operations of the Department
Deliverables in the 2019/2020 Annual Performance Plan were largely informed by Provincial Strategic Goal
5 at the time of developing the 2019/20 Annual Performance Plan and related to embedding good
governance and integrated service delivery through partnerships and spatial alignment. Strategic Goal 5
had the following outcomes, which directed much of what the Department undertook during the year
under review:
• enhanced governance through efficient, effective and responsive local and provincial governance;
• an inclusive society through improving the service interface between citizens and government and
fostering community engagement; and
• integrated management through partnerships, PSP and game changer implementation, integrated
planning, budgeting and implementation and a province-wide Monitoring and Evaluation system.
The period under review ushered in a new term of office. With that came a rearticulation of the provincial
vision “A safe Western Cape where everyone prospers”. Five Vision-Inspired Priorities that underpin the
vision were agreed upon. These priorities informed the development of a new five-year Provincial Strategic
Plan and underpin the Western Cape Government’s commitment to improve the lives of its citizens.
The Department of the Premier, together with the Provincial Treasury, the Department of Local Government
and the Department of Environmental Affairs and Development Planning, will play a transversal role across
the entire Provincial Strategic Plan and will lead its implementation. The Department was also designated
as the lead department for the fifth Vision-Inspired Priority, Innovation and Culture, in alignment with its
Constitutional and legislative mandates.
Departmental efforts during the 2019/2020 financial year were directed towards ensuring alignment of all
provincial plans and strategies with the new strategic direction that puts citizens at the centre of what the
Western Cape Government wants to achieve.
Towards the end of the 2019/20 financial year, the Department had to redirect its effort and resources
towards responding and managing the impact of COVID-19 on the Western Cape Province. This impacted
negatively on the Department’s ability to finalise some of its planned deliverables as travel was suspended
and face-to-face contact was prohibited.
The Department is structured in five budget programmes:
• Programme 1: Executive Governance and Integration delivers governance support services to the
Premier, Cabinet, Director-General, the Provincial Top Management and the Department of the
Premier’s Executive Committee by enabling effective decision making and communication by the
Executive.
• Programme 2: Provincial Strategic Management provides strategic support to the Executive in
relation to policy and strategy development, international relations and priority programmes, and
strategic management information.
• The Corporate Services Centre makes up the rest of the Department and consists of transversal
provincial support services in respect of people management (Programme 3), the provision of ICT
services (Programme 4), and corporate assurance functions that comprise internal audit, enterprise-
wide risk management, forensic, legal, and communication services (Programme 5).
The Department’s functions are transversal in nature; in addition to the Executive, its primary clients are the
other Western Cape Government departments, which are the main beneficiaries of the Department’s core
DOTP ANNUAL REPORT FOR 2019/2020 15
functions. During the period under review, much effort was directed towards ensuring that the future plans
of the Department have a more citizen-centric focus rather than an internal focus.
The Department’s delivery in the last year of the previous term registers a number of achievements
confirming the Department’s ability to maintain high standards of good governance.
The Department continued to function in an austere fiscal environment, which made it difficult to fully
realise its intention to continuously add more value to the services that it renders to the Western Cape
Government. Austerity meant that the filling of vacancies was tightly managed, which made it difficult
to expand its service offerings without being able to increase the number of people required to add
more value.
The Department recorded an 88% achievement of indicator targets for the 2019/2020 financial year; the
slightly lower performance due to the impact of COVID-19 on some functional areas. Detailed
performance on each of the indicators is given in the tables on performance indicators in section B of the
Annual Report.
The Department has managed to achieve an clean audit report for the 2019/2020 financial year.
Programme 1 supported the Director-General of the Western Cape Government. The Branch ensured that
progress against financial and non- financial performance was monitored and reported on throughout the
financial year. A culture of doing more with less was reinforced by the Finance Management component
by the tight controls that they put on the COE budget. The implementation of an electronic invoice
tracking system ensured for continuous improvement on the turnaround times for the payment of
uncontested invoices. The Directorate Supply Chain Management ensured that there was compliance
with regulatory and legislative frameworks through their ongoing supply chain training and by regular
review of their policies, delegations and circulars. The Branch also played a crucial role in ensuring that
intergovernmental relations remain healthy and beneficial to the Western Cape.
Programme 2 played a predominant transversal role and coordinated a range of transversal programmes
through its three Chief Directorates. Amongst these were the development of the 2019-2024 Provincial
Strategic Plan with its implementation framework, coordinating the provincial strategic planning process,
the management of data and information as a strategic asset to the province and creating value through
stakeholder engagements from international relations and within the human rights and frontline arena.
Programme 3 is responsible for integrated and innovative people solutions that contribute to improved
organisational performance and good governance for service delivery. The continued increase in
demand for services from client departments coupled with ongoing budget cuts and a less-than-full staff
compliment, necessitated the engagement with client departments with the Annual People Management
Planner that both departments and the Branch can use for more effective planning. During the last quarter
of the financial year there were additional demands placed on the Branch due to the impact of the
COVID-19 Pandemic this was particularly felt in the increased demand for Employee Health and Wellness
services as well as the provision for clear policy guidelines to WCG departments.
Programme 4 in its transversal role continued to drive the digital transformation agenda. Underpinned by
the Broadband initiative it ensured for improved connectivity for more efficient service delivery and greater
cost benefit. For the 2017/18 financial year 1 875 provincial buildings were provided with broadband
connectivity during the phase 1 and in phase 2, which involved the upgrade of the connectivity to
minimum speeds of 100 megabits per second for 1 912 sites, included sites that were placed on hold during
phase 1. For the financial year under review an additional 405 sites had been upgraded to the faster
phase 2 connectivity speeds, bringing the total number of sites upgraded to 1089.
Accelerated service delivery was experience in the Public WI-FI Hotspot project. During the financial year
under review, 452 hotspots were installed which offered faster speed and greater free data allowance
16 DOTP ANNUAL REPORT FOR 2019/2020
than the initial 178 hotspots. The project activated 630 WI-FI hotspots across the province by the end of the
financial year under review. This resulted in 120 000 citizens accessing the internet through these WI-FI
hotspots every month.
Programme 5 delivers most of its services based on approved delivery plans. The ability of the Branch to
respond to these service demands was, however, impacted on due to budget reductions over the MTEF
and the introduction of the COE funding ceilings. The COE is the main cost driver, taking 85% of the budget
allocated to the Branch, thus emphasising the ability of the Branch to fund its vacancies.
The main cost driver for this Branch is Compensation of Employees, and with 85% of the budget allocated
to this, the Branch’s ability to fund its vacancies is a pressure point. Although the majority of services in the
Branch are delivered based on approved delivery plans, there are some services that are not predictable.
The delivery plans are finalised and agreed at the start of the financial year and there are processes in
place to amend these if required. The business units evaluate this on an ongoing basis and request changes
to the plans if and when required.
The principles in the Combined Assurance Framework approved by the Provincial Top Management are
being applied during the development of internal audit annual operational plans and a better picture of
the total assurance gap across all assurance providers is provided to audit committees during the
evaluation and approval of internal audit annual operational plans, with feedback on the execution of
such planned assurance to the audit committees bi-annually.
The Branch was furthermore instrumental in the development of a Corporate Governance Framework for
the WCG and a concomitant Governance Maturity Model. It is imperative that corporate governance
within all the departments of the WCG is robust and contribute directly to the achievement of provincial
and departmental strategic goals and intent. This framework and maturity model set forth the principles
and requirements for corporate governance in the WCG. Internal audit assisted a number of departments
in conducting their baseline assessments and will continue to do so for all departments.
4.2. Overview of the financial results of the Department:
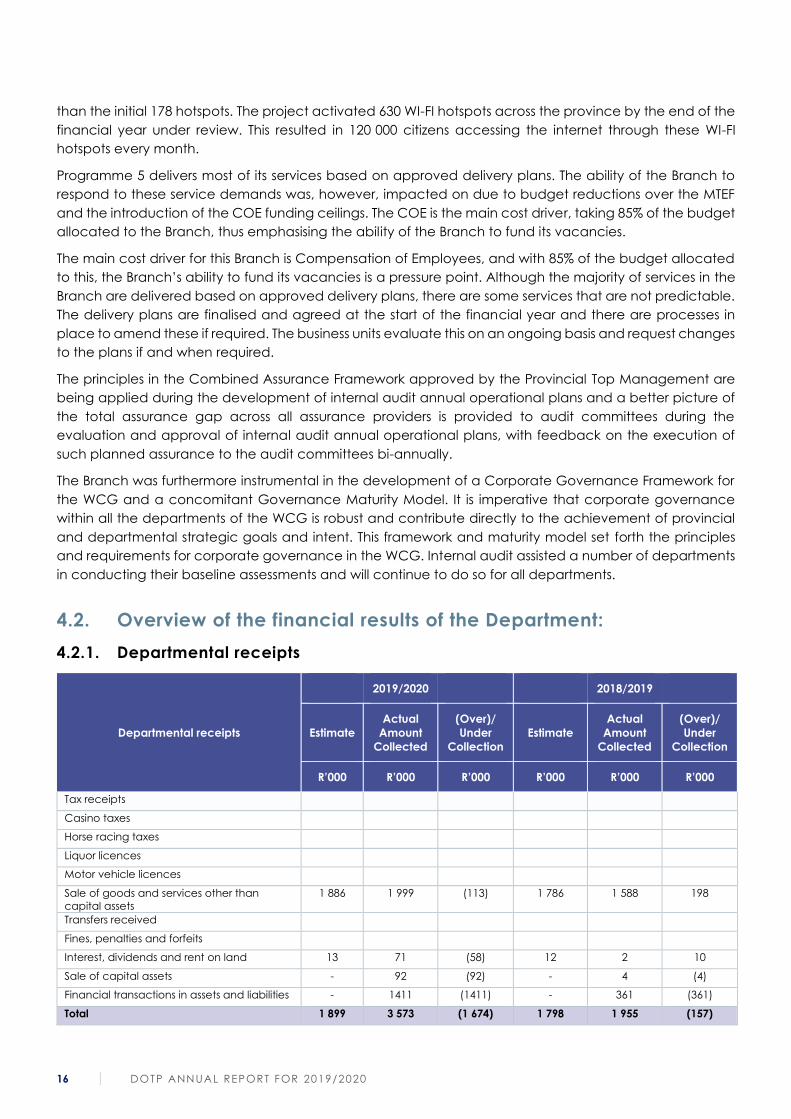
4.2.1. Departmental receipts
Departmental receipts
2019/2020 2018/2019
Estimate
Actual
Amount
Collected
(Over)/
Under
Collection
Estimate
Actual
Amount
Collected
(Over)/
Under
Collection
R’000 R’000 R’000 R’000 R’000 R’000
Tax receipts
Casino taxes
Horse racing taxes
Liquor licences
Motor vehicle licences
Sale of goods and services other than
capital assets
1 886 1 999 (113) 1 786 1 588 198
Transfers received
Fines, penalties and forfeits
Interest, dividends and rent on land 13 71 (58) 12 2 10
Sale of capital assets - 92 (92) - 4 (4)
Financial transactions in assets and liabilities - 1411 (1411) - 361 (361)
Total 1 899 3 573 (1 674) 1 798 1 955 (157)
DOTP ANNUAL REPORT FOR 2019/2020 17
The Department remains a non-revenue-generating organisation, though has through annual revision of its
tariffs successfully delivered on its plan to collect departmental revenue. The Department over-collected
revenue by R1 674 000. The better than anticipated performance is due to the usage of the venues and
facilities at the Provincial Training Institute. It remains a difficult task to budget accurately for these items
given that these items are demand driven.
The bad debt was written off in terms of the Provincial Debt Management Policy. During the year under
review, one debt valued at R260 507.15 was written off.
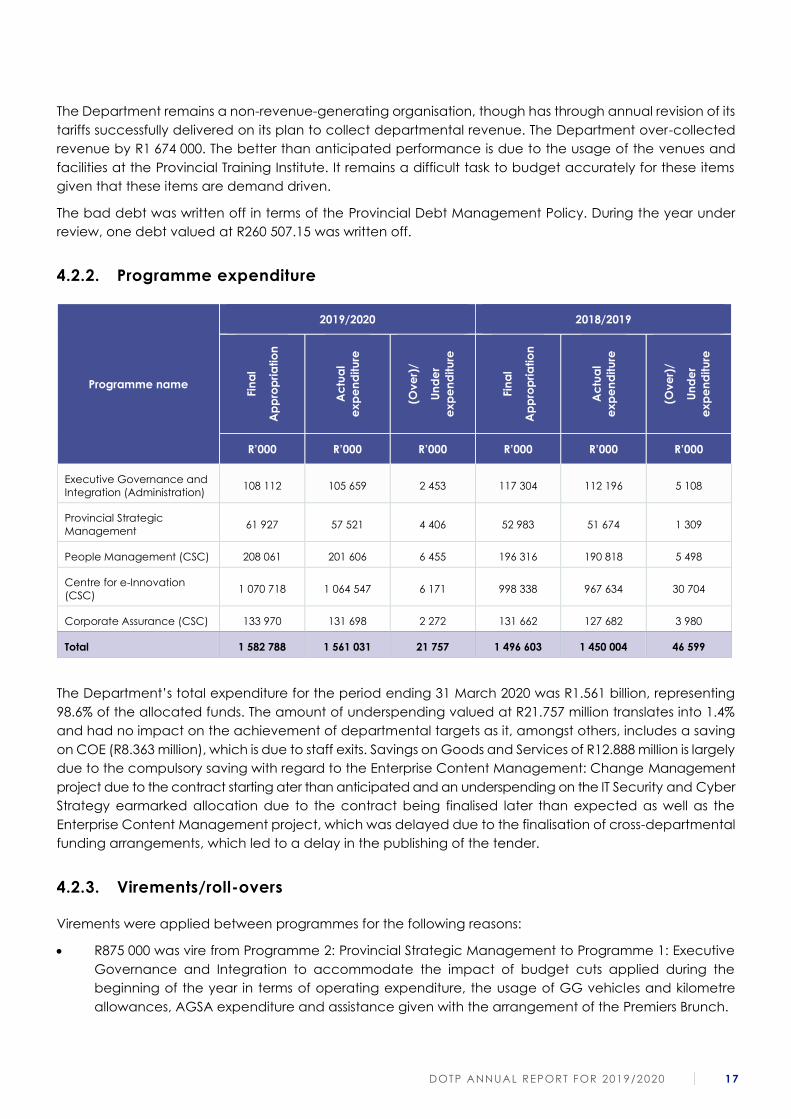
4.2.2. Programme expenditure
Programme name
2019/2020 2018/2019
Fin
al
Ap
pro
pri
atio
n
Ac
tua
l
ex
pe
nd
itu
re
(Ov
er)
/
Un
de
r
ex
pe
nd
itu
re
Fin
al
Ap
pro
pri
atio
n
Ac
tua
l
ex
pe
nd
itu
re
(Ov
er)
/
Un
de
r
ex
pe
nd
itu
re
R’000 R’000 R’000 R’000 R’000 R’000
Executive Governance and
Integration (Administration) 108 112 105 659 2 453 117 304 112 196 5 108
Provincial Strategic
Management 61 927 57 521 4 406 52 983 51 674 1 309
People Management (CSC) 208 061 201 606 6 455 196 316 190 818 5 498
Centre for e-Innovation
(CSC) 1 070 718 1 064 547 6 171 998 338 967 634 30 704
Corporate Assurance (CSC) 133 970 131 698 2 272 131 662 127 682 3 980
Total 1 582 788 1 561 031 21 757 1 496 603 1 450 004 46 599
The Department’s total expenditure for the period ending 31 March 2020 was R1.561 billion, representing
98.6% of the allocated funds. The amount of underspending valued at R21.757 million translates into 1.4%
and had no impact on the achievement of departmental targets as it, amongst others, includes a saving
on COE (R8.363 million), which is due to staff exits. Savings on Goods and Services of R12.888 million is largely
due to the compulsory saving with regard to the Enterprise Content Management: Change Management
project due to the contract starting ater than anticipated and an underspending on the IT Security and Cyber
Strategy earmarked allocation due to the contract being finalised later than expected as well as the
Enterprise Content Management project, which was delayed due to the finalisation of cross-departmental
funding arrangements, which led to a delay in the publishing of the tender.
4.2.3. Virements/roll-overs
Virements were applied between programmes for the following reasons:
• R875 000 was vire from Programme 2: Provincial Strategic Management to Programme 1: Executive
Governance and Integration to accommodate the impact of budget cuts applied during the
beginning of the year in terms of operating expenditure, the usage of GG vehicles and kilometre
allowances, AGSA expenditure and assistance given with the arrangement of the Premiers Brunch.
18 DOTP ANNUAL REPORT FOR 2019/2020
• R300 000 was vire from Programme 3: People Management to Programme 1: Executive Governance
and Integration for the assistance given with the arrangement of the Premier Service Excellence
Awards.
• R1.597 million was vire from Programme 3: People Management to Programme 4: Centre for e-
Innovation to assist with the impact of the expansion of the WCG Network and the purchase of
capital equipment within the Centre for e-Innovation space.
• R62 000 was vire from Programme 5: Corporate Assurance to Programme 1: Executive Governance
and Integration for assistance given during certain events involving the Premier.
• Roll-overs were requested with regard to the Enterprise Content Management services rendered on
behalf of DCAS by the Centre for e-Innovation.
• Revenue retention was requested to be utilised for IT Refresh within the Department.
4.3. Irregular expenditure
Irregular expenditure: (Annexure D1)
• 13 cases of irregular expenditure were identified during the year.
• Of the 13 cases:
o 10 cases amounting to R975 536.73 are still under investigation;
o 1 case amounting to R261.33 is awaiting PT condonation;
o 1 case amounting to R264.33 was deemed as a valid expense (not recoverable/not
condoned) subsequent to year end; and
o 1 case amounting to R18 080.66 was identified as a recoverable expense (recoverable / not
condoned) subsequent to year end.
Fruitless and wasteful expenditure: (Annexure D2)
• 4 cases of possible fruitless and wasteful expenditure were identified during the year.
• Of the 4 cases:
o 1 case amounting to R1 023.30 was transferred to receivables for recovery;
o 1 case amounting to R1 384.13 was identified as a recoverable expense (subsequent to
year end);
o 1 case amounting to R7 192.43 was written off (subsequent to year end);
o 1 case amounting to R188.26 was identified as a valid expense (subsequent to year end).

DOTP ANNUAL REPORT FOR 2019/2020 19
4.4. Future plans of the Department
The Centre for e-Innovation in is the process of developing a Digital Transformation Plan (DTP) that aligns
to the Provincial Strategic Plan and its Vision-Inspired Priorities. Through a process of consultation with
stakeholders the Ce-I has identified the key digital initiatives that will contribute to the delivery of the PSP.
Through the DTP Plan the Ce-I aims to transform the WCG from being reactive in its citizen-facing services,
to a responsive and ultimately smart government that has empowered its citizens to conveniently access
quality public services and information. To achieve this outcome, the WCG has to optimise, transform and
integrate its public services by maximising the value of its data assets, digital technologies and people. This
level of transformation requires a holistic approach to digital government maturity improvement.
The foundational elements for achieving digital transformation is the availability of high-speed connectivity
as well as robust and resilient infrastructure at all WCG facilities. The upgrading of our current Broadband
capacity will therefore continue in order to ensure that provincial and local government as well as our
citizens can harness the full benefits of robust and world-class infrastructure. It will also continue to support
e-learning in education. Following the completion of Phase 1 in the 2017/2018 financial year, where the
initial 1 875 WCG sites were connected to Broadband, the project will continue the roll-out of Phase 2. This
phase involves the upgrade of connectivity to minimum speeds of 100 megabits per second for 1 912 sites,
which includes sites that were placed on hold during Phase 1. During the 2020/2021 financial year, an
additional 161 sites will be upgraded to the Phase 2 speeds, bringing the total to 1 250 sites towards the
target of 1 912. Most of these sites will be schools, in line with the branch’s continued support of e-learning
in education.
The roll-out of limited free public Wi-Fi hotspots will continue in the 2020/2021 financial year and will see the
installation of an additional 400 sites for the benefit of our citizens, culminating in a total of 978 hotspots by
the end of the financial year. The ultimate goal is to offer public Wi-Fi hotspots at 1 600 WCG buildings.
Digital transformation is a key enabler of the new normal as the COVID-19 pandemic has forced upon
everybody the use of technology for working remotely. The Digital Government programmes and projects
that the Ce-I embarks on will therefore include, amongst other, servicing the WCG ICT user base and the
schools labs, performing systems integration, developing and maintaining transversal applications,
embedding a provincial mobile applications platform, refreshing ICT Infrastructure, VOIP roll-out,
strengthening cyber security capacity, cloud services consolidation, frontline service digitalisation,
enhancing digital communications platforms and maintaining the Cape Access Programme.
Provincial Strategic Management has coordinated the development and adoption of the 2019–2024
Provincial Strategic Plan (PSP), which sets out the vision and provincial priorities of the WCG vision of “a
safe Western Cape where everyone prospers” is expressed in the five strategic priorities identified for 2019–
2024, the Vision-inspired Priorities: Safe and Cohesive Communities; Growth and Jobs; Empowering People;
Mobility and Spatial Transformation, and Innovation and Culture.
During the development of the PSP, it was widely recognised and accepted that its implementation would
be a dynamic process taking into account significant shifts and changes in the external environment. In
the light of the impact of the coronavirus pandemic on the resources and service delivery obligations of
the WCG, the Department will coordinate a review of the PSP to respond to and accommodate these
changes and the implications of the pandemic.
The strategic agenda of Province-wide Data Governance (PWDG) has been reaffirmed to strengthen the
policy and data decision-making chain. This is in line with Government’s focus on service delivery; assessing
performance or results that are underpinned by data governance; which in turn, are key to drive the
collective management of the availability, quality, sharing and integrity of data, and treating data as a
strategic asset.
20 DOTP ANNUAL REPORT FOR 2019/2020
The Province-Wide Data Governance objective and outcome for the policy context is geared towards
using quality data and evidence for improved service delivery; and better societal outcomes, initially for
the five (5) Vision-Inspired Priorities (VIPs). As at March 2020, this focus has been converged to address data
and evidence requirements in supporting decision making on the COVID-19 pandemic response plan.
Based on lessons learnt, the PWDG implementation approach has been repositioned from delivering
data governance outputs to leveraging data and evidence as a strategic asset. Key to this is improved
business performance; and policy, data and technology integration across departments and within
the WCG. The strategic intent, as well as the implementation approach, is documented in Volume 5,
which forms part of a series of volumes.
Focus areas towards improving service delivery results and outcomes include consolidating the approach
to coordinating the institionalisation of strategic programmes towards delivery on government’s strategic
priorities. These programmes include the strategic approach to International Relations in support of
developing strategic partnerships to advance strategic priorities, particularly with regard to economic
growth, trade, investment, tourism, safety and skills development. Priority programmes also include citizen-
and frontline-focused initiatives such as partnering for the coordination of the human rights-based
programmes, the Frontline monitoring and support programme and Event strategy implementation
together with key provincial departments and other stakeholders.
The Branch: People Management, as part of the broader WCG, will contribute to the strategic Priorities
identified by the Premier, it will align with the Vision-inspired Priority 5 of innovation and culture change for
embedding a Citizen-centric culture throughout the WCG. The Branch has therefore also based its strategic
outcomes on those of the Department viz Outcome 1: Improved employee engagement; Outcome 2:
Improved quality, efficiency and effectiveness of organisational performance; and Outcome 3: Citizen-
centric culture inculcated in the WCG.
The Branch has identified as one of strategic outcomes an Enabled Citizen-centric Culture. This outcome
has its foundation in the Culture Transformation Plan 2015-2019 of the Branch and will thus be a continuation
of the culture journey. The initiatives from the previous five years will be continued, such as the values
assessment surveys (Barrett) that ensure that departments could be provided with a clear sense of the
value gaps in the organisations, and to allow for the development of culture journeys with interventions
tailored to the situations in the departments. The values-based leadership philosophy on which the
leadership programme is based will ensure that there is continuity, but with the emphasis now moving to
implementation. One of the values of the WCG is Innovation, and while all these values are equally
important and they must be driven holistically, innovation has been highlighted as one of the main priorities,
especially in response to the current demand for better, quicker services within in an austere environment.
The second strategic Outcome for the Branch is the development and implementation of a future-fit
People Management (“PM”) Strategy. The WCG adopted a people management strategy in 2015 that
has been implemented to provide a clear understanding of the current people management context and
the desired people state in line with the (then) Provincial Strategic Plan (PSP). The PM strategy defines a
distinctive people philosophy, value proposition, ideal people profile, strategic initiatives; people score
card as well as the implementation of governance architecture that will facilitate an improved citizen
experience through people efficiencies. It is also imperative that the values and principles in the
Constitution of SA must be lived and upheld, specifically that of dignity and equality, and further espoused
in section 195, in the way we work and in our policies and practices. One also needs to take into account
that the future is going to look vastly different: both in terms of the world at large, and more specifically the
world of work. In particular, the worker, leadership and organisation of the future, regardless of sector,
whether public or private, are and will continue to undergo fundamental and radical change.
DOTP ANNUAL REPORT FOR 2019/2020 21
People Management is not immune to this changing environment and technology advances. In order to
meet this challenge, the Branch has embarked on a journey to develop a Future-fit Guide for People
Professionals aimed at transforming the Branch and its People Professionals to become future-fit pro-
actively, and travel well capacitated for and into the future. Last but not least, the Branch is aware that
the WCG as employer does not operate in a vacuum and that the socio-economic situation of the
province impacts equally on staff as citizens as well. And hence, it is imperative that strategy take this into
account. With this is mind, a revised PM strategy is called for.
The spectre of the COVID 19 pandemic and its traumatic impact on the country and its people, including
the workplace, coupled with the economic recession, will however mean that the future plans must be re-
examined in the next financial year.
4.5. Public-private Partnerships
No public-private partnerships were entered into.
4.6. Discontinued activities/activities to be discontinued
No activities were discontinued.
4.7. New or proposed activities
• Review of the Provincial Strategic Plan 2019–2024;
• Development of a WCG Capability Model; and
• Consolidating the approach to mainstream and monitor the implementation of the Human Rights
framework in relation to Priority Groups and Gender responsiveness in the Western Cape
Government.
4.8. Supply chain management
There were no unsolicited bid proposals for the year under review.
SCM processes and systems are in place to prevent irregular expenditure. The SCM component continued
to inculcate in the Department a culture of compliance with procurement prescripts to ensure good
governance (accountability, credibility, clean government) through its training programmes, awareness
sessions and collaboration between line functions and the SCM officials.
22 DOTP ANNUAL REPORT FOR 2019/2020
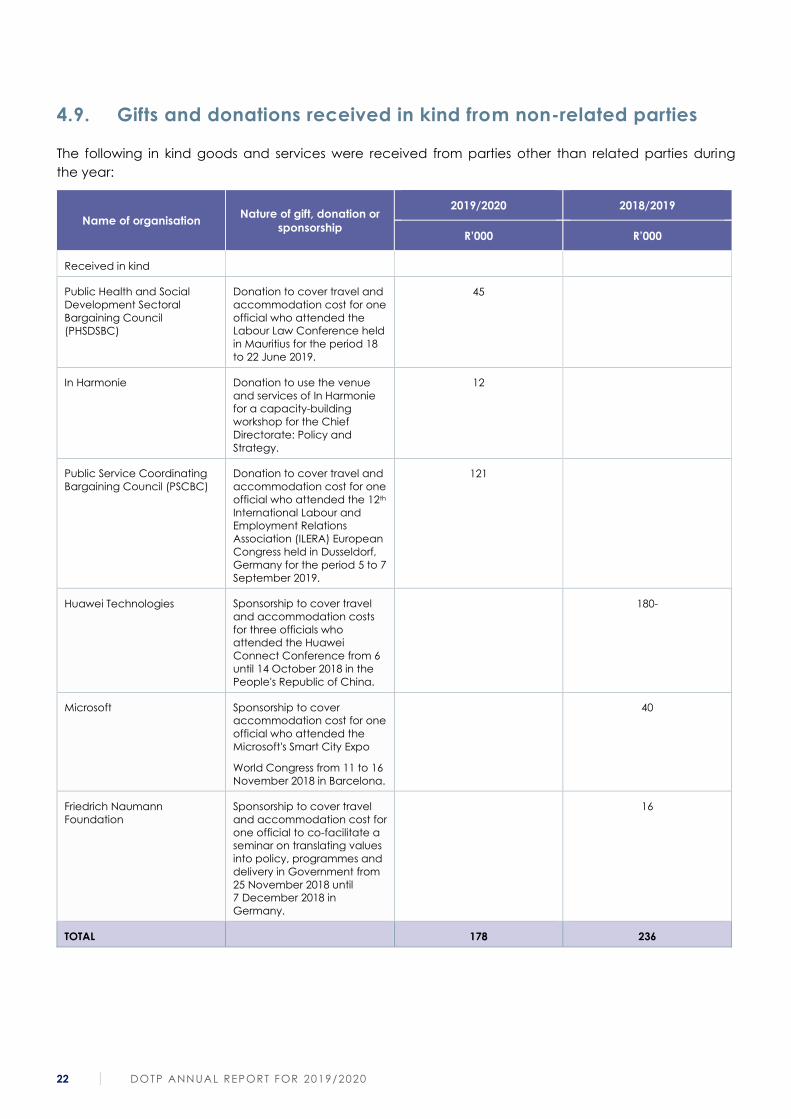
4.9. Gifts and donations received in kind from non-related parties
The following in kind goods and services were received from parties other than related parties during
the year:
Name of organisation Nature of gift, donation or
sponsorship
2019/2020 2018/2019
R’000 R’000
Received in kind
Public Health and Social
Development Sectoral
Bargaining Council
(PHSDSBC)
Donation to cover travel and
accommodation cost for one
official who attended the
Labour Law Conference held
in Mauritius for the period 18
to 22 June 2019.
45
In Harmonie Donation to use the venue
and services of In Harmonie
for a capacity-building
workshop for the Chief
Directorate: Policy and
Strategy.
12
Public Service Coordinating
Bargaining Council (PSCBC)
Donation to cover travel and
accommodation cost for one
official who attended the 12th
International Labour and
Employment Relations
Association (ILERA) European
Congress held in Dusseldorf,
Germany for the period 5 to 7
September 2019.
121
Huawei Technologies Sponsorship to cover travel
and accommodation costs
for three officials who
attended the Huawei
Connect Conference from 6
until 14 October 2018 in the
People's Republic of China.
180-
Microsoft Sponsorship to cover
accommodation cost for one
official who attended the
Microsoft's Smart City Expo
World Congress from 11 to 16
November 2018 in Barcelona.
40
Friedrich Naumann
Foundation
Sponsorship to cover travel
and accommodation cost for
one official to co-facilitate a
seminar on translating values
into policy, programmes and
delivery in Government from
25 November 2018 until
7 December 2018 in
Germany.
16
TOTAL 178 236
DOTP ANNUAL REPORT FOR 2019/2020 23
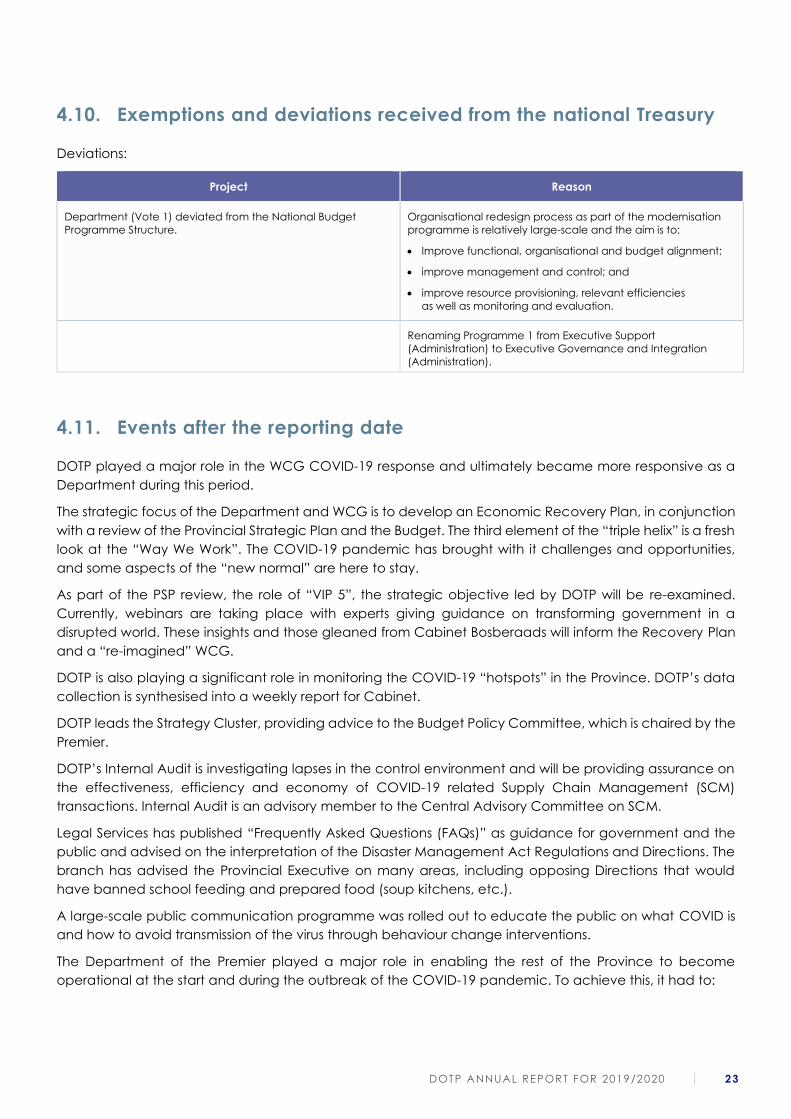
4.10. Exemptions and deviations received from the national Treasury
Deviations:
Project Reason
Department (Vote 1) deviated from the National Budget
Programme Structure.
Organisational redesign process as part of the modernisation
programme is relatively large-scale and the aim is to:
• Improve functional, organisational and budget alignment;
• improve management and control; and
• improve resource provisioning, relevant efficiencies
as well as monitoring and evaluation.
Renaming Programme 1 from Executive Support
(Administration) to Executive Governance and Integration
(Administration).
4.11. Events after the reporting date
DOTP played a major role in the WCG COVID-19 response and ultimately became more responsive as a
Department during this period.
The strategic focus of the Department and WCG is to develop an Economic Recovery Plan, in conjunction
with a review of the Provincial Strategic Plan and the Budget. The third element of the “triple helix” is a fresh
look at the “Way We Work”. The COVID-19 pandemic has brought with it challenges and opportunities,
and some aspects of the “new normal” are here to stay.
As part of the PSP review, the role of “VIP 5”, the strategic objective led by DOTP will be re-examined.
Currently, webinars are taking place with experts giving guidance on transforming government in a
disrupted world. These insights and those gleaned from Cabinet Bosberaads will inform the Recovery Plan
and a “re-imagined” WCG.
DOTP is also playing a significant role in monitoring the COVID-19 “hotspots” in the Province. DOTP’s data
collection is synthesised into a weekly report for Cabinet.
DOTP leads the Strategy Cluster, providing advice to the Budget Policy Committee, which is chaired by the
Premier.
DOTP’s Internal Audit is investigating lapses in the control environment and will be providing assurance on
the effectiveness, efficiency and economy of COVID-19 related Supply Chain Management (SCM)
transactions. Internal Audit is an advisory member to the Central Advisory Committee on SCM.
Legal Services has published “Frequently Asked Questions (FAQs)” as guidance for government and the
public and advised on the interpretation of the Disaster Management Act Regulations and Directions. The
branch has advised the Provincial Executive on many areas, including opposing Directions that would
have banned school feeding and prepared food (soup kitchens, etc.).
A large-scale public communication programme was rolled out to educate the public on what COVID is
and how to avoid transmission of the virus through behaviour change interventions.
The Department of the Premier played a major role in enabling the rest of the Province to become
operational at the start and during the outbreak of the COVID-19 pandemic. To achieve this, it had to:
24 DOTP ANNUAL REPORT FOR 2019/2020
• equip our Provincial Executive with video-conferencing capacity in the Joint Operations Centre at 4
Dorp Str, capacitate the Disaster Management Centre with video-conferencing facilities and install
access points in various facilities to create wireless local area networks;
• equip staff to work from home by rolling out MS Teams to 10 000+ staff members;
• procure bulk data and Wi-Fi routers for 500 key staff members and distribute these to the various
departments;
• manage VPNRA activations for staff who required access to applications hosted on the corporate
network; and
• ensure that all departmental critical systems and applications to which staff required access while
working from home were accessible via VPNRA.
CeI also installed the Information Technology at the WCG field hospitals, including the “Hospital of Hope”
at the Cape Town International Convention Centre, which was opened by the President on 5 June 2020.
Behind the scenes, CeI has developed solutions for the Humanitarian Cluster on food distribution and
economic forecasting for the Economic Cluster.
People Management ensured that our salaries were paid, and has developed a number of policies and
guidelines in response to the pandemic. A decision has been taken that only critical vacancies will be filled
in the coming months, and routine OD work has been suspended as the OD team will be focusing on a
reimagined WCG.
The Strategic Management team is compiling information that will form the basis for a report on our
COVID-19 response to national government. Four rapid assessments are being conducted with a focus
on innovation. The Frontline Monitoring and Support team will focus on support to the Hotspots Strategy.
Priority Programmes has been liaising with national government departments regarding vulnerable groups
and has been assisting with conflict resolution and mediation.
International Relations played a strong role in repatriating our citizens as well as foreign nationals in South
Africa to their home countries.
Ms Christina Nomdo has been appointed Children’s Commissioner and commenced duty on 1 June 2020.
The Priority Programmes team is assisting with work on Gender-based Violence in support of the
Department of Social Development and Safety Plan initiatives of VIP 1.
Secretariat Services and Protocol supported 30 Cabinet meetings and ensured a successful visit by the
President. The team has been working with Faith-based Organisations to develop protocols on
bereavements and funerals.
Departmental Strategy, responsible for Organisational Health and Safety (OHS), procured masks for staff,
thermometers for the various buildings occupied by DotP staff and ensured compliance with a multitude
of regulatory frameworks. A Compliance Officer was appointed, the Terms of Reference of the OHS
Committee was updated, an “office cleaning” protocol was implemented and isolation rooms have been
set up and are being equipped.
Corporate Communication has implemented two campaigns, “Stop the Spread” and “Stay Safe and Save
Lives” using a variety of media including:
• television adverts;
• radio adverts;
• billboard adverts;
• loud hailing services;
DOTP ANNUAL REPORT FOR 2019/2020 25
• flyers and press adverts;
• pamphlets;
• taxi decals;
• “Share the Love” presentation to NGOs;
• GIFs for online digital ads;
• “Keep Gran and Grandpa Safe” poster jpegs for online digital ads and street pole posters;
• taxi execution – inside; and
• link to CTICC video.
4.12. Other
To the best of my knowledge there are no other material facts or circumstances that may have an effect
on the understanding of the financial state of affairs not addressed elsewhere in this report.
I wish to express my sincere appreciation to the management and every employee of this Department
who continuously strive towards continuous improvement in service delivery and steady increase in the
value-add that this Department brings to the Western Cape Government.
I hereby approve the 2019/2020 Annual Report of the Department of the Premier.
__________________
MR HARRY MALILA
DIRECTOR-GENERAL AND ACCOUNTING OFFICER
DEPARTMENT OF THE PREMIER
DATE: 31 JULY 2020
26 DOTP ANNUAL REPORT FOR 2019/2020
5. STATEMENT OF RESPONSIBILITY AND CONFIRMATION
OF ACCURACY OF THE ANNUAL REPORT
To the best of my knowledge and belief, I confirm the following:
• All information and amounts disclosed throughout the Annual Report are consistent.
• The Annual Report is complete, accurate and is free from any omissions.
• The Annual Report has been prepared in accordance with the guidelines on the Annual Report as
issued by National Treasury.
• The Annual Financial Statements (Part E) have been prepared in accordance with the modified cash
standard and the relevant frameworks and guidelines issued by the National Treasury.
• The Accounting Officer is responsible for the preparation of the annual financial statements and for
the judgements made in this information.
• The Accounting Officer is responsible for establishing and implementing a system of internal control
that has been designed to provide reasonable assurance as to the integrity and reliability of the
performance information, the human resources information and the annual financial statements.
• The external auditors are engaged to express an independent opinion on the annual financial
statements.
In my opinion, the annual report fairly reflects the operations, the performance information, the human
resources information and the financial affairs of the Department for the financial year ended 31 March
2020.
Yours faithfully
__________________
MR HARRY MALILA
DIRECTOR-GENERAL AND ACCOUNTING OFFICER
DEPARTMENT OF THE PREMIER
DATE: 31 JULY 2020
DOTP ANNUAL REPORT FOR 2019/2020 27
6. STRATEGIC OVERVIEW
6.1. Vision
The vision of the Department of the Premier is to be a leading department enabling the Western Cape
Government to improve the quality of life of all its people.
6.2. Mission
The mission of the Department of the Premier is to embed good governance and to enable integrated
service delivery in the Western Cape through partnerships, innovation and people excellence.
6.3. Values
We commit ourselves to delivering services according to the following values:
COMPETENCE (The ability and capacity to do the job appointed to do)
• We are able to do the job we have been appointed to do, and always strive for excellence.
• We develop and grow our people, enabling and empowering them to do their jobs in support of
service delivery.
• We empower employees to render an excellent service to the people in the Western Cape and we
focus on this.
• We demonstrate knowledge and an understanding of executing our task in terms of the
constitutional, legislative and electoral mandates and we work together to achieve this.
ACCOUNTABILITY (We take responsibility)
• We have a clear understanding of our vision, mission, strategic objectives, roles, delegations and
responsibilities.
• We deliver on our outcomes and targets with quality, on budget and in time.
• We hold each other accountable as Public Servants and know we can trust each other to deliver.
• We individually take responsibility for and ownership of our work, actions and decisions.
INTEGRITY (To be honest and do the right thing)
• We create an ethical environment by being honest, showing respect and living out positive values.
• We seek the truth and do the right things in the right way in each situation.
• We are reliable and trustworthy and behave consistently in word and in action.
• We act with integrity at all levels and in all instances, with zero tolerance for corruption.
RESPONSIVENESS (To serve the needs of our citizens and those we work with)
• Our focus is the citizens, building relationships that allow us to anticipate their needs and deal with
them proactively.
28 DOTP ANNUAL REPORT FOR 2019/2020
• We take each other and the citizens seriously, being accessible, listening and hearing their voices.
• We respond with timeous action and within agreed timeframes.
• We collaborate with each other, providing appropriate and reliable information and sharing it
responsibly.
• Caring (To care for those we serve and work with)
• We value each other and citizens and treat all with dignity and respect.
• We listen actively and display compassion towards each other and citizens.
• We provide support to and show interest in each other and the citizens, caring for the wellbeing of
everyone.
• We show appreciation and give recognition to each other and citizens.
INNOVATION (To be open to new ideas and develop creative solutions to challenges in a resourceful
way)
• We seek to implement new ideas, create dynamic service options and improve services.
• We strive to be creative thinkers who view challenges and opportunities from all possible
perspectives.
• We are citizen-centric and have the ability to consider all options and find a resourceful solution.
• We value employees who question existing practices with the aim of renewing, rejuvenating and
improving them.
• We foster an environment where innovative ideas are encouraged and rewarded.
• We understand mistakes made in good faith, and allow employees to learn from them.
• We solve problems collaboratively to realise our strategic organisational goals.
DOTP ANNUAL REPORT FOR 2019/2020 29
7. Legislative and other mandates
The Department complies with its constitutional and legislative mandates. Additional capacity has been
created in the Department to ensure compliance with all prescripts in the execution of the Department’s
mandates.
7.1. Constitutional mandates
The Department acts in accordance with the mandates as determined by the Constitution of the Republic
of South Africa, 1996 and the Constitution of the Western Cape, 1997 (Act 1 of 1998).
7.2. Legislative mandates
The Constitutions, together with the Acts listed hereunder, guide and direct the actions, performance and
responsibilities carried out in the Department.
• Basic Conditions of Employment Act, 1997 (Act 75 of 1997)
• Broad-based Black Economic Empowerment Act, 2003 (Act 53 of 2003)
• Compensation for Occupational Injuries and Diseases Act, 1993 (Act 130 of 1993)
• Consumer Protection Act, 2008 (Act 68 of 2008)
• Division of Revenue Act (annually)
• Electronic Communications and Transactions Act, 2002 (Act 25 of 2002)
• Employment Equity Act, 1998 (Act 55 of 1998)
• Employment Services Act, 2014(Act 4 of 2014)
• Financial Intelligence Centre Act, 2001 (Act 38 of 2001)
• Geomatics Professions Act, 2013 (Act 19 of 2013)
• Government Employees Pension Law, 1996 (Proclamation 21 of 1996)
• Government Immovable Asset Management Act, 2007 (Act 19 of 2007)
• Income Tax Act, 1962 (Act 58 of 1962)
• Intergovernmental Relations Framework Act, 2005 (Act 13 of 2005)
• Labour Relations Act, 1995 (Act 66 of 1995)
• National Archives and Record Service of South Africa Act, 1996 (Act 43 of 1996)
• National Qualifications Framework Act, 2008 (Act 67 of 2008)
• National Treasury Regulations, 2005
• Occupational Health and Safety Act, 1993 (Act 85 of 1993)
• Pensions Fund Act, 1956 (Act 24 of 1956)
• Preferential Procurement Policy Framework Act, 2000 (Act 5 of 2000)
• Preferential Procurement Regulations, 2017
• Prescription Act, 1969 (Act 68 of 1969)
30 DOTP ANNUAL REPORT FOR 2019/2020
• Prevention and Combating of Corrupt Activities Act, 2004 (Act 12 of 2004)
• Prevention of Organised Crime Act, 1998 (Act 121 of 1998)
• Promotion of Access to Information Act, 2000 (Act 2 of 2000)
• Promotion of Administrative Justice Act, 2000 (Act 3 of 2000)
• Promotion of Equality and Prevention of Unfair Discrimination Act, 2000 (Act 4 of 2000)
• Protected Disclosures Act, 2000 (Act 26 of 2000)
• Protection of Personal Information Act, 2013 (Act 4 of 2013)
• Provincial Archives and Records Service of the Western Cape Act, 2005 (Act 3 of 2005)
• Provincial Treasury Instructions, 2012
• Public Administration Management Act, 2014 (Act 11 of 2014)
• Public Audit Act, 2004 (Act 25 of 2004)
• Public Finance Management Act, 1999 (Act 1 of 1999)
• Public Holidays Act, 1994 (Act 36 of 1994)
• Public Service Act, 1994 (Proclamation 103 of 1994)
• Public Service Regulations 2016
• Regulation of Interception of Communications and Provision of Communication-related Information
Act, 2002 (Act 70 of 2002)
• Skills Development Act, 1998 (Act 97 of 1998)
• Skills Development Levies Act, 1999 (Act 9 of 1999)
• Spatial Data Infrastructure Act, 2003 (Act 54 of 2003)
• State Information Technology Agency Act, 1998 (Act 88 of 1998)
• Western Cape Appropriation Act (annually)
• Western Cape Delegation of Powers Law, 1994 (Law 7 of 1994)
• Western Cape Direct Charges Act, 2000 (Act 6 of 2000)
• Western Cape Provincial Coat of Arms Act, 1998 (Act 7 of 1998)
• Western Cape Provincial Commissions Act, 1998 (Act 10 of 1998)
• Western Cape Provincial Honours Act, 1999 (Act 9 of 1999)
• Western Cape Provincial Languages Act, 1998 (Act 13 of 1998)
• Western Cape Commissioner for Children Act, 2019 (Act 2 of 2019)
In addition, the Department, as an entity and in fulfilling its role within the provincial government, takes into
account national policy mandates, in particular the following:
• Green Paper on National Performance Management (2009)
• Revised Framework for Strategic Plans and Annual Performance Plans 2019
• Medium-term Strategic Framework – 2019–2024
DOTP ANNUAL REPORT FOR 2019/2020 31
• National Development Plan (2012)
• National e-Strategy (2017)
• National Evaluation Policy Framework (2011)
• National Integrated ICT Policy White Paper (2016)
• National Measurable Outcomes
• National Monitoring and Evaluation Framework – White Paper, October 2009
• National Skills Development Strategy (I, II and III)
• National Strategic Framework of the Department for Women, Children and People with Disabilities
• National Treasury Framework for Managing Programme Performance Information (2007)
• National Youth Policy (2009-2014) of the National Youth Development Agency
• Policy Framework for a Government Wide Monitoring and Evaluation System (2007)
• Policy Frameworks of the National Department of Public Service and Administration on Gender
Equality, Disability and Youth in the Public Service
• Data Quality Policy 001: Policy on informing users of data quality (Stats SA), 2006
• Specific National Policy Frameworks on Gender and Women’s Empowerment, Disability and Children
• The White Paper on a New Employment Policy for the Public Service (1997)
• The White Paper on Human Resources Management in the Public Service
• The White Paper on Public Service Training and Education (1997)
• The White Paper on the Transformation of the Public Service (1995)
• The White Paper on Transforming Public Service Delivery [Batho Pele] (1997)
• Disaster Management Act 57 of 2002
• Disaster Management Act (57/2002): Electronic Communications, Postal and Broadcasting Directions
Issued under Regulation 10 (8) of the Act (2020)
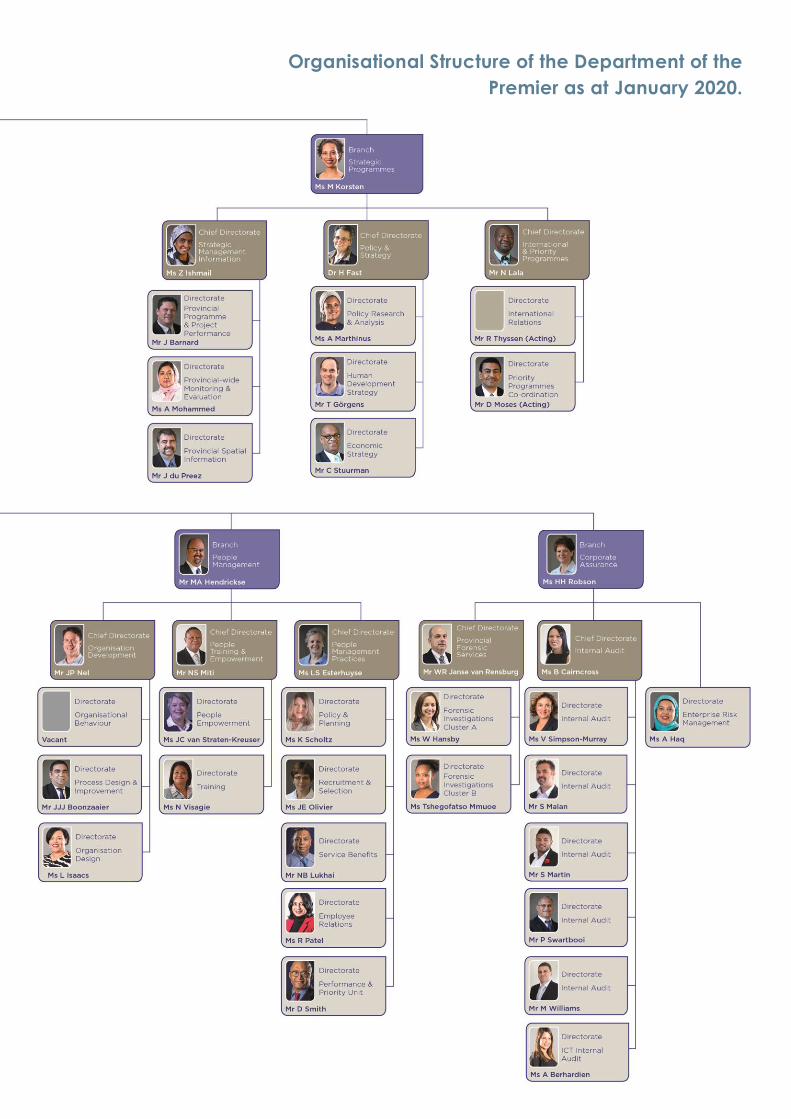
8. ORGANISATIONAL STRUCTURE
The following chart depicts the top management structure of the Department as at January 2020. The
Department’s senior management structure is depicted in Annexure A of the report.

32 DOTP ANNUAL REPORT FOR 2019/2020
DOTP ANNUAL REPORT FOR 2019/2020 33
Organisational Structure of the Department of the
Premier as at January 2020.

34 DOTP ANNUAL REPORT FOR 2019/2020
9. ENTITIES REPORTING TO THE PREMIER
During the period under review, no entities reported to the Premier.

DOTP ANNUAL REPORT FOR 2019/2020 35

36 DOTP ANNUAL REPORT FOR 2019/2020
PART B: PERFORMANCE INFORMATION

DOTP ANNUAL REPORT FOR 2019/2020 37

38 DOTP ANNUAL REPORT FOR 2019/2020
1. AUDITOR-GENERAL’S REPORT: PREDETERMINED
OBJECTIVES
The AGSA currently performs certain audit procedures on the performance information to provide
reasonable assurance in the form of an audit conclusion. The audit conclusion on the performance against
predetermined objectives is included in the report to management, with material findings being reported
under the Predetermined Objectives heading in the Report on other legal and regulatory requirements of
the auditor’s report.
Refer to page 171 (Report of the Auditor-General), published as Part E: Financial Information.
2. OVERVIEW OF DEPARTMENTAL PERFORMANCE
2.1. Service Delivery Environment
During the year under review, the Department achieved 88% of its performance targets, as specified in the
2019/2020 Annual Performance Plan. Detailed performance on each of the indicators is given in the tables
on performance indicators under point 5 in this section (section B of the Annual Report).
The Department continued to function in an austere fiscal environment, which made it difficult to fully
realise its intention to continuously add more value to the services that it renders to the Western Cape
Government. Austerity meant that the filling of vacancies was tightly managed, which made it difficult
to expand its service offerings without being able to increase the number of people required to add
more value.
The Branch Executive Governance and Integration has ensured that Cabinet, Provincial Top Management
and DotP EXCO processes were conducted seamlessly and that effective decisions were taken, which
determined the strategic direction of the Western Cape Government. The Premier’s external forums with
the Mayors in the province were all provided with high-level logistical and secretariat support. The finances
of the Department of the Premier were commendably managed, despite a very tight budget, and
legislative frameworks, National Treasury Regulations and Supply Chain Policies and prescripts were
complied with. This resulted in yet another clean audit outcome for the Department. All strategic
interactions with the provincial Mayors and Municipal Managers were seamlessly managed by the Branch,
and last-minute changes were managed strategically without any negative financial or reputational
repercussions to the Western Cape Government.
The Director-General of the Western Cape was excellently supported by all Directorates in the Branch and
it was ensured that intergovernmental relations remain healthy and beneficial to the Western Cape.
Progress with performance indicators was assessed and reported on quarterly. The Finance management
component ensured that there are tight controls on the COE budget and much was achieved with less. In
addition, the turnaround times for the payment of uncontested invoices continued to improve. Continued
supply chain training, and revised policies, and circulars ensured that there was compliance with the
regulatory and legislative frameworks.
The strategic messages of the Western Cape Government were successfully channelled to the key
stakeholders through the various strategic communications platforms in collaboration with other provincial
departments. This minimised negative reputational impacts to the Western Cape Government.
Programme 2 Provincial Strategic Management and its three chief directorates: Policy and Strategy,
Strategic Management Information and International and Priority Programmes, have coordinated a range
DOTP ANNUAL REPORT FOR 2019/2020 39
of transversal programmes within the WCG over the 2019/2020 financial year. These include developing
the 2019–2024 Provincial Strategic Plan and its implementation framework, the coordination of provincial
strategic planning, management of data and information as a strategic asset and stakeholder
engagements focusing on creating value from international relations and within the human rights and
frontline arena.
Key to note is that the Chief Directorate: Strategic Management Information has reviewed all the outdated
core processes in relation to the current business needs. This is due to an increased demand for data and
technical support. This role has emerged into a virtual Provincial Data Office that is central to support the
WCG in becoming a data-driven organisation. Six (6) data and evidence services are offered that cover
an indicator universe; evaluation and research services; data quality standards; data and evidence
landscape; data analytics; and data ethics. The Provincial Data Office has been responsive to the
demands to shape this emerging role of an integrated data and evidence service within and across
the WCG.
The role in supporting delivery on provincial strategic priorities is expected to increase further given the
renewed focus on delivering a PSP that is data-driven and regularly reviewed based on an informed,
evidence-based decision-making approach that improves service delivery results, outcomes and impact.
A citizen-centric focus has been embedded in projects that support Human Rights Mainstreaming, building
on the pilot project to build the soft skills of Western Cape employees using the UNDP-authored Community
Capacity Enhancement training, which is now a key part of the Provincial Training Institute’s training
programme and the Frontline monitoring and support programme. Supporting the events sector continued
through partnership with the public and private sectors.
One of the key responsibilities of the Branch People Management is to provide integrated and innovative
people solutions that contribute to improved organisational performance and good governance for
service delivery. By its nature there is a co-dependency between the people manager and the people
professional in fulfilling this mandate. There is a continuing increase in the level of people management
services required from client departments, which is juxtaposed against budget cuts and a less-than-full staff
compliment. This has necessitated, in line with the broader CSC demand planning process, the
engagement with client departments with the Annual PM Planner, which both Departments and the
Branch People Management can use for more effective planning. Closer alignment of the Chief
Directorates within the Branch: People Management with regard to demand planning is continuing and
set the foundation for greater synergies with regard to integrated management. The ICT Plan of the Branch
also seeks, within budgetary constraints, to use innovative ways and technology to improve the provision
of people practices. The emerging risk and impact of the COVID 19 pandemic in the last quarter of the
financial year placed additional demands on the Branch, especially in the Employee Health and Wellness
services being offered, and the provision of clear policy and guidelines to WCG departments in response
to the consequences of the pandemic on the workplace and safety of staff.
The Centre for e-Innovation has contributed significantly to the success of the provincial game changers
(with a particular focus on the e-Learning and After School game changers). Through the Broadband
game changer, 1 875 provincial buildings such as schools, clinics, and hospitals were provided with
Broadband connectivity, of which 684 have been upgraded to Phase 2 Broadband connectivity speeds
as at the end of the 2018/2019 financial year.
The Ce-I’s service delivery environment is both diverse and specialised in many respects. It is involved in
almost every aspect of government’s service delivery value chain. As such it enables digital services to
citizens, improves and optimises operational processes, ensures sound ICT governance, specifically in the
fields of information security and business continuity, and equips employees with the relevant tools and
services.
40 DOTP ANNUAL REPORT FOR 2019/2020
The Broadband Initiative continues to underpin the WCG’s digital transformation agenda by ensuring
improved connectivity for more efficient service delivery and greater cost benefits. During Phase 1 of the
initiative, which was completed during the 2017/2018 financial year, 1 875 provincial buildings were
provided with Broadband connectivity. Phase 2 involves the upgrade of connectivity to minimum speeds
of 100 megabits per second for 1 912 sites, which includes sites that were placed on hold during Phase 1.
By the end of the 2019/2020 financial year, an additional 405 sites had been upgraded to the faster Phase
2 connectivity speeds, bringing the total number of sites upgraded to 1 089.
The Public Wi-Fi hotspot project has also experienced accelerated delivery in order to provide limited free
internet access at WCG buildings for citizens. A further 452 hotspots were installed during the year, offering
faster speeds and a greater free data allowance than the initial 178 hotspots. Accordingly, there were 630
Wi-Fi hotspots across the province by the end of the 2019/2020 financial year, and on average over 120 000
citizens accessed the internet through these Wi-Fi hotspots every month.
The Centre for e-Innovation’s user base has remained at 28 600 Western Cape Government ICT users and
24 500 workstations, which had a direct influence on its major expenditure items, which included software
licences, ICT support, security and infrastructure. There has been a dramatic increase in the optimisation
and innovative use of the existing technology investments, particularly in the area of the uptake of
collaboration and video conferencing tools. This will become an integral part of the “new normal” where
employees will continue to work remotely and citizens will engage government through channels other
than physical ones.
One of the key projects undertaken by Ce-I during the year under review was the migration on on-premises
workloads to the Azure cloud. This was successfully completed in January 2020 and was followed by a
decommissioning process of the on-prem environment. Hosting workloads in the cloud provides us with
three key benefits, namely high availability, enhanced security and remote accessibility.
A review of the application portfolio is in progress, coupled with the drafting of a Digital Platform Roadmap.
It is a key step in the Digital Transformation Planning process.
The importance of data has never been more pronounced as in the present. Ce-I has put in place various
building blocks and tools that enable the rapid analysis and presentation of data in various formats. To this
end, the work done in geospatial mapping and the logical data warehouse has contributed significantly
to our Department’s responsiveness in providing our political and administrative principals with dashboards
and spatial maps during the outbreak of the COVID-19 pandemic.
The Cape Access Programme plays a major role in digitally empowering our citizens by providing free
access to ICTs, the internet and digital literacy training. Three new e-centres were established in
Sonskynvallei, Rietpoort and Klapmuts, which brings our total number of e-centres to 73. The completion of
Brandwacht and Melkhoutsfontein e-centres, scheduled for the last two weeks of March 2020, had to be
put on hold due to the outbreak of the COVID-19 pandemic. This will be completed as soon as practically
possible.
The current economic climate, resultant budget reductions over the MTEF period and introduction of
Compensation of Employees funding ceilings are having an impact on the ability of the Branch Corporate
Assurance to respond to the demand for its services. The main cost driver for this Branch is Compensation
of Employees, and with 85% of the budget allocated to this, the Branch’s ability to fund its vacancies is a
pressure point. Although the majority of services in the Branch are delivered based on approved delivery
plans, there are some services that are not predictable. The delivery plans are finalised and agreed at the
start of the financial year and there are processes in place to amend these if required. The business units
evaluate this on an ongoing basis and request changes to the plans if and when required.
The principles in the Combined Assurance Framework approved by the Provincial Top Management are
being applied during the development of internal audit annual operational plans and a better picture of
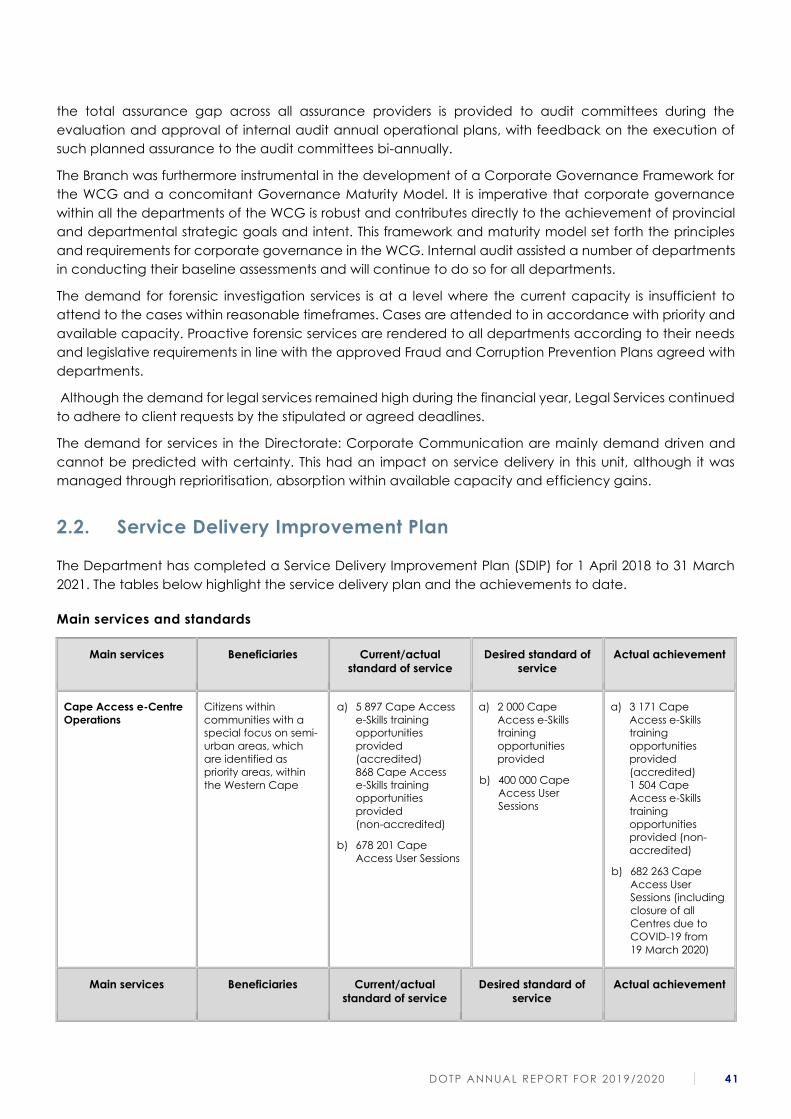
DOTP ANNUAL REPORT FOR 2019/2020 41
the total assurance gap across all assurance providers is provided to audit committees during the
evaluation and approval of internal audit annual operational plans, with feedback on the execution of
such planned assurance to the audit committees bi-annually.
The Branch was furthermore instrumental in the development of a Corporate Governance Framework for
the WCG and a concomitant Governance Maturity Model. It is imperative that corporate governance
within all the departments of the WCG is robust and contributes directly to the achievement of provincial
and departmental strategic goals and intent. This framework and maturity model set forth the principles
and requirements for corporate governance in the WCG. Internal audit assisted a number of departments
in conducting their baseline assessments and will continue to do so for all departments.
The demand for forensic investigation services is at a level where the current capacity is insufficient to
attend to the cases within reasonable timeframes. Cases are attended to in accordance with priority and
available capacity. Proactive forensic services are rendered to all departments according to their needs
and legislative requirements in line with the approved Fraud and Corruption Prevention Plans agreed with
departments.
Although the demand for legal services remained high during the financial year, Legal Services continued
to adhere to client requests by the stipulated or agreed deadlines.
The demand for services in the Directorate: Corporate Communication are mainly demand driven and
cannot be predicted with certainty. This had an impact on service delivery in this unit, although it was
managed through reprioritisation, absorption within available capacity and efficiency gains.
2.2. Service Delivery Improvement Plan
The Department has completed a Service Delivery Improvement Plan (SDIP) for 1 April 2018 to 31 March
2021. The tables below highlight the service delivery plan and the achievements to date.
Main services and standards
Main services Beneficiaries Current/actual
standard of service
Desired standard of
service
Actual achievement
Cape Access e-Centre
Operations
Citizens within
communities with a
special focus on semi-
urban areas, which
are identified as
priority areas, within
the Western Cape
a) 5 897 Cape Access
e-Skills training
opportunities
provided
(accredited)
868 Cape Access
e-Skills training
opportunities
provided
(non-accredited)
b) 678 201 Cape
Access User Sessions
a) 2 000 Cape
Access e-Skills
training
opportunities
provided
b) 400 000 Cape
Access User
Sessions
a) 3 171 Cape
Access e-Skills
training
opportunities
provided
(accredited)
1 504 Cape
Access e-Skills
training
opportunities
provided (non-
accredited)
b) 682 263 Cape
Access User
Sessions (including
closure of all
Centres due to
COVID-19 from
19 March 2020)
Main services Beneficiaries Current/actual
standard of service
Desired standard of
service
Actual achievement

42 DOTP ANNUAL REPORT FOR 2019/2020
e-Government
Channels
Citizens within the
Western Cape
a) 39 207 931
(Internet Portal
only). 99 952 932
(including Social
Media and WCG
Contact Centre)
Contact tickets
across channels
(excluding WCG
Intranet)
b) 99.53% Presidential
Hotline Resolution
Rate
c) 1 User and Client
Experience Survey
conducted
d) 1 User and Client
Experience Report
released
a) 20 000 000 Contact
tickets across
channels (excluding
WCG Intranet) [Nr
WCG Portal Contact
tickets; Nr WCG
Contact Centre
tickets; Nr WCG
Social Media
Impressions; 13 e-
Government access
channels managed
through which
citizens actively
engage
Government
(excluding Intranet)
b) 95% Presidential
Hotline Resolution
Rate
c) 1 User and Client
Experience Surveys
conducted
d) 1 User and Client
Experience Report
released
a) 42 547 968
(Internet Portal
only). 108 942 009
(including Social
Media and WCG
Contact Centre
Contact tickets
across channels,
excluding WCG
Intranet)
b) 99.02% Presidential
Hotline Resolution
Rate
c) Citizen
engagements
(enquiries,
compliments and
complaints) are
gathered daily
through the
Western Cape
Government
Contact Centre
d) Monthly reports
are produced on
Citizen
engagements
across all
channels. The Top
10 issues are
identified and
provided to
Departments to
inform service
improvement
Batho Pele arrangements with beneficiaries (Consultation, access, etc.)
Current/actual arrangements Desired arrangements Actual achievements
Cape Access e-Centre Operations
Consultation:
Clients are consulted through:
a) Annual User and Client Survey
conducted
b) Annual User and Client Report
finalised
c) e-Centre managers on site during
working hours
Consultation:
Clients are consulted through:
a) Annual User and Client Survey
conducted to consult clients on their
e.g. input; experience; improvement
suggested; training required
b) Annual User and Client Report
indicating findings and
recommendations on Annual User
and Client Survey conducted
c) e-Centre managers on site during
working hours to engage with
citizens throughout access sessions to
obtain their input, when required
Consultation:
Clients are consulted through:
a) Citizen engagements (enquiries,
compliments and complaints) are
gathered daily through the
Western Cape Government
Contact Centre
b) Monthly reports are produced on
Citizen engagements across all
channels. The Top 10 issues are
identified and provided to
Departments to inform service
improvement
c) Centre Managers are always on
site as required
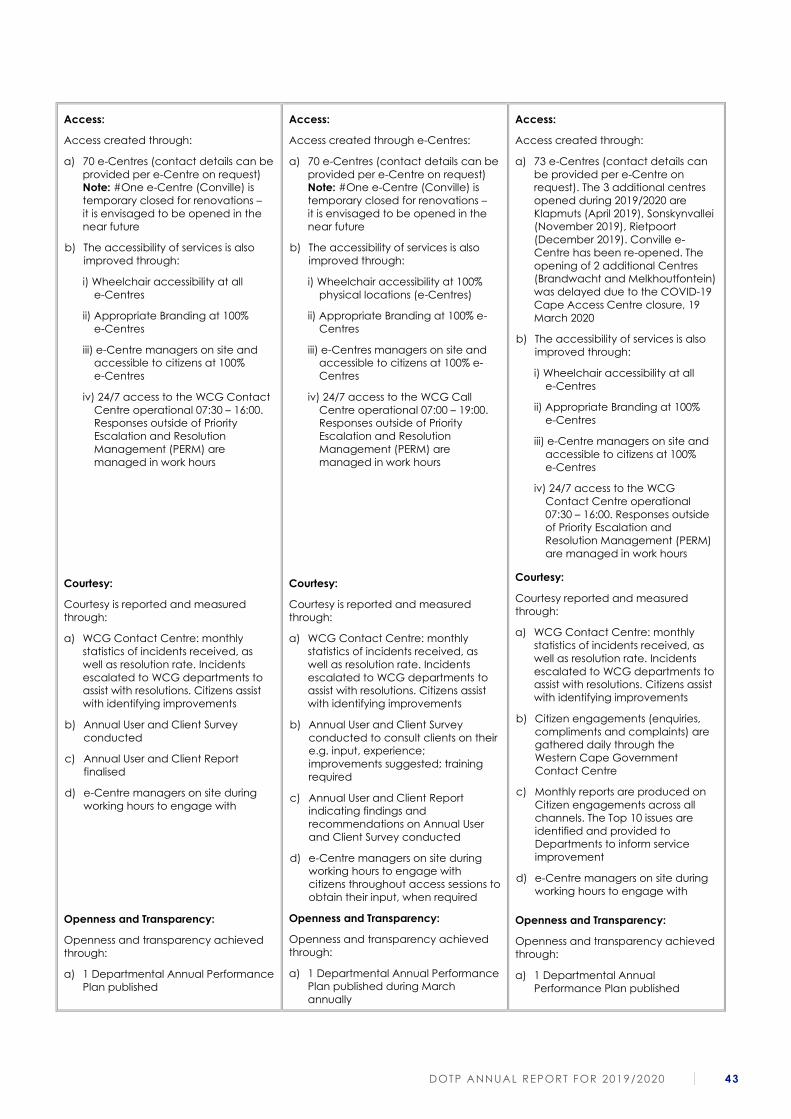
DOTP ANNUAL REPORT FOR 2019/2020 43
Access:
Access created through:
a) 70 e-Centres (contact details can be
provided per e-Centre on request)
Note: #One e-Centre (Conville) is
temporary closed for renovations –
it is envisaged to be opened in the
near future
b) The accessibility of services is also
improved through:
i) Wheelchair accessibility at all
e-Centres
ii) Appropriate Branding at 100%
e-Centres
iii) e-Centre managers on site and
accessible to citizens at 100%
e-Centres
iv) 24/7 access to the WCG Contact
Centre operational 07:30 – 16:00.
Responses outside of Priority
Escalation and Resolution
Management (PERM) are
managed in work hours
Courtesy:
Courtesy is reported and measured
through:
a) WCG Contact Centre: monthly
statistics of incidents received, as
well as resolution rate. Incidents
escalated to WCG departments to
assist with resolutions. Citizens assist
with identifying improvements
b) Annual User and Client Survey
conducted
c) Annual User and Client Report
finalised
d) e-Centre managers on site during
working hours to engage with
Openness and Transparency:
Openness and transparency achieved
through:
a) 1 Departmental Annual Performance
Plan published
Access:
Access created through e-Centres:
a) 70 e-Centres (contact details can be
provided per e-Centre on request)
Note: #One e-Centre (Conville) is
temporary closed for renovations –
it is envisaged to be opened in the
near future
b) The accessibility of services is also
improved through:
i) Wheelchair accessibility at 100%
physical locations (e-Centres)
ii) Appropriate Branding at 100% e-
Centres
iii) e-Centres managers on site and
accessible to citizens at 100% e-
Centres
iv) 24/7 access to the WCG Call
Centre operational 07:00 – 19:00.
Responses outside of Priority
Escalation and Resolution
Management (PERM) are
managed in work hours
Courtesy:
Courtesy is reported and measured
through:
a) WCG Contact Centre: monthly
statistics of incidents received, as
well as resolution rate. Incidents
escalated to WCG departments to
assist with resolutions. Citizens assist
with identifying improvements
b) Annual User and Client Survey
conducted to consult clients on their
e.g. input, experience;
improvements suggested; training
required
c) Annual User and Client Report
indicating findings and
recommendations on Annual User
and Client Survey conducted
d) e-Centre managers on site during
working hours to engage with
citizens throughout access sessions to
obtain their input, when required
Openness and Transparency:
Openness and transparency achieved
through:
a) 1 Departmental Annual Performance
Plan published during March
annually
Access:
Access created through:
a) 73 e-Centres (contact details can
be provided per e-Centre on
request). The 3 additional centres
opened during 2019/2020 are
Klapmuts (April 2019), Sonskynvallei
(November 2019), Rietpoort
(December 2019). Conville e-
Centre has been re-opened. The
opening of 2 additional Centres
(Brandwacht and Melkhoutfontein)
was delayed due to the COVID-19
Cape Access Centre closure, 19
March 2020
b) The accessibility of services is also
improved through:
i) Wheelchair accessibility at all
e-Centres
ii) Appropriate Branding at 100%
e-Centres
iii) e-Centre managers on site and
accessible to citizens at 100%
e-Centres
iv) 24/7 access to the WCG
Contact Centre operational
07:30 – 16:00. Responses outside
of Priority Escalation and
Resolution Management (PERM)
are managed in work hours
Courtesy:
Courtesy reported and measured
through:
a) WCG Contact Centre: monthly
statistics of incidents received, as
well as resolution rate. Incidents
escalated to WCG departments to
assist with resolutions. Citizens assist
with identifying improvements
b) Citizen engagements (enquiries,
compliments and complaints) are
gathered daily through the
Western Cape Government
Contact Centre
c) Monthly reports are produced on
Citizen engagements across all
channels. The Top 10 issues are
identified and provided to
Departments to inform service
improvement
d) e-Centre managers on site during
working hours to engage with
Openness and Transparency:
Openness and transparency achieved
through:
a) 1 Departmental Annual
Performance Plan published
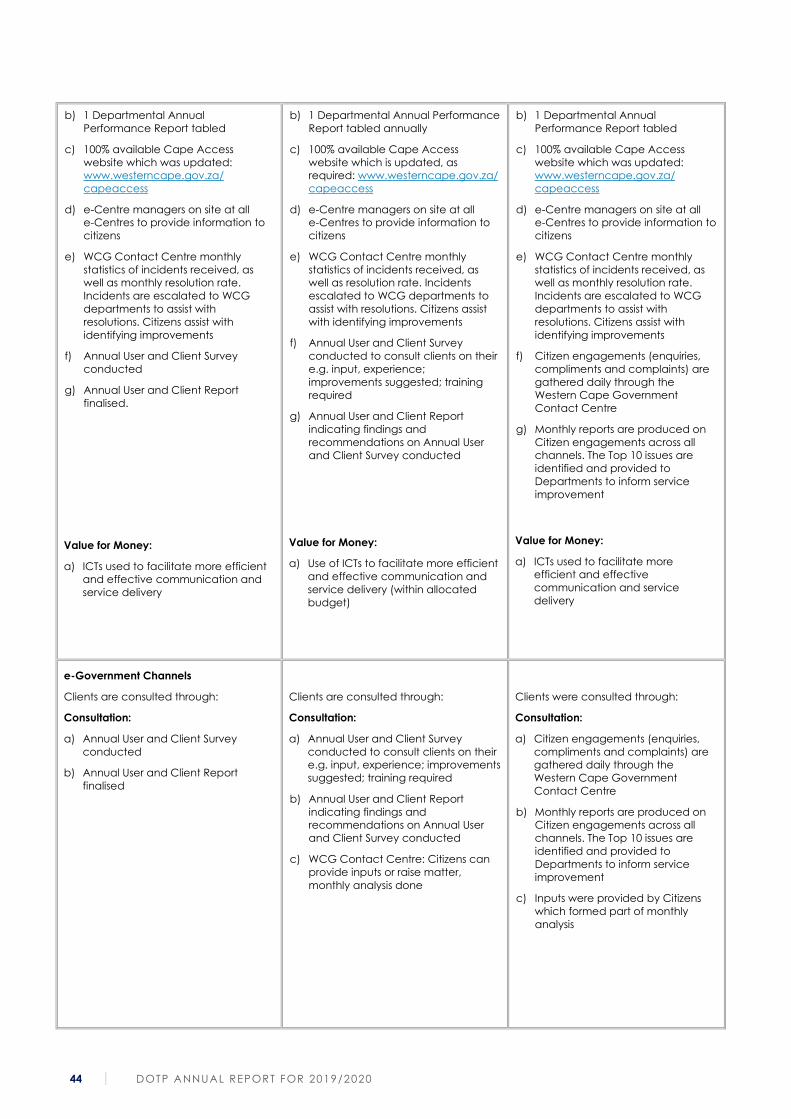
44 DOTP ANNUAL REPORT FOR 2019/2020
b) 1 Departmental Annual
Performance Report tabled
c) 100% available Cape Access
website which was updated:
www.westerncape.gov.za/
capeaccess
d) e-Centre managers on site at all
e-Centres to provide information to
citizens
e) WCG Contact Centre monthly
statistics of incidents received, as
well as monthly resolution rate.
Incidents are escalated to WCG
departments to assist with
resolutions. Citizens assist with
identifying improvements
f) Annual User and Client Survey
conducted
g) Annual User and Client Report
finalised.
Value for Money:
a) ICTs used to facilitate more efficient
and effective communication and
service delivery
b) 1 Departmental Annual Performance
Report tabled annually
c) 100% available Cape Access
website which is updated, as
required: www.westerncape.gov.za/
capeaccess
d) e-Centre managers on site at all
e-Centres to provide information to
citizens
e) WCG Contact Centre monthly
statistics of incidents received, as
well as resolution rate. Incidents
escalated to WCG departments to
assist with resolutions. Citizens assist
with identifying improvements
f) Annual User and Client Survey
conducted to consult clients on their
e.g. input, experience;
improvements suggested; training
required
g) Annual User and Client Report
indicating findings and
recommendations on Annual User
and Client Survey conducted
Value for Money:
a) Use of ICTs to facilitate more efficient
and effective communication and
service delivery (within allocated
budget)
b) 1 Departmental Annual
Performance Report tabled
c) 100% available Cape Access
website which was updated:
www.westerncape.gov.za/
capeaccess
d) e-Centre managers on site at all
e-Centres to provide information to
citizens
e) WCG Contact Centre monthly
statistics of incidents received, as
well as monthly resolution rate.
Incidents are escalated to WCG
departments to assist with
resolutions. Citizens assist with
identifying improvements
f) Citizen engagements (enquiries,
compliments and complaints) are
gathered daily through the
Western Cape Government
Contact Centre
g) Monthly reports are produced on
Citizen engagements across all
channels. The Top 10 issues are
identified and provided to
Departments to inform service
improvement
Value for Money:
a) ICTs used to facilitate more
efficient and effective
communication and service
delivery
e-Government Channels
Clients are consulted through:
Consultation:
a) Annual User and Client Survey
conducted
b) Annual User and Client Report
finalised
Clients are consulted through:
Consultation:
a) Annual User and Client Survey
conducted to consult clients on their
e.g. input, experience; improvements
suggested; training required
b) Annual User and Client Report
indicating findings and
recommendations on Annual User
and Client Survey conducted
c) WCG Contact Centre: Citizens can
provide inputs or raise matter,
monthly analysis done
Clients were consulted through:
Consultation:
a) Citizen engagements (enquiries,
compliments and complaints) are
gathered daily through the
Western Cape Government
Contact Centre
b) Monthly reports are produced on
Citizen engagements across all
channels. The Top 10 issues are
identified and provided to
Departments to inform service
improvement
c) Inputs were provided by Citizens
which formed part of monthly
analysis

DOTP ANNUAL REPORT FOR 2019/2020 45
Access:
Access created through the 14
Government channels (including
Intranet):
a) WCG Digital platform:
Internet Portal:
http://www.westerncape.gov.za/
Intranet Portal:
http://intrawp.pgwc.gov.za/
b) WCG Social Media channels:
Twitter: https://twitter.com/
WesternCapeGov
Facebook: www.facebook.com/
WesternCapeGovernment
YouTube:
https://www.youtube.com/
user/westerncapegov
LinkedIn:
https://www.linkedin.com/company
/westerncape-government
c) WCG Contact Centre:
Call Centre: 0860 142142
Fax: 021 483 7216
SMS: 31022 – Help
Please Call me: 079 769 1207
Walk-in-Centre: 9 Wale Street, Cape
Town
Snail Mail: 9 Wale Street, Cape Town
E-mail Centre:
Presidential Hotline: 17737
Courtesy:
Courtesy is reported and measured
through:
a) WCG Contact Centre: monthly
statistics of incident received, as well
as resolution rate. Incidents
escalated to WCG departments to
assist with resolutions. Citizens assist
with identifying improvements
b) Annual User and Client Survey
conducted
c) Annual User and Client Report
finalised
d) Annual Contact Centre training
conducted
Access:
Access created through the 14
Government channels (including
Intranet):
a) WCG Digital platform:
Internet Portal:
http://www.westerncape.gov.za/
Intranet Portal:
http://intrawp.pgwc.gov.za/
b) WCG Social Media channels:
Twitter: https://twitter.com/
WesternCapeGov
Facebook: www.facebook.com/
WesternCapeGovernment
YouTube:
https://www.youtube.com/
user/westerncapegov
LinkedIn:
https://www.linkedin.com/company
/westerncape-government
c) WCG Contact Centre:
Call Centre: 0860 142142
Fax: 021 483 7216
SMS: 31022 – Help
Please Call me: 079 769 1207
Walk-in-Centre: 9 Wale Street, Cape
Town
Snail Mail: 9 Wale Street, Cape Town
E-mail Centre:
Presidential Hotline: 17737
Courtesy:
Courtesy is reported and measured
through:
a) WCG Contact Centre: monthly
statistics of incident received, as well
as resolution rate. Incidents
escalated to WCG departments to
assist with resolutions. Citizens assist
with identifying improvements
b) Annual User and Client Survey
conducted to consult clients on their
e.g. input, experience;
improvements suggested; training
required
c) Annual User and Client Report
indicating findings and
recommendations on Annual User
and Client Survey conducted
d) Annual Contact Centre training, e.g.
how to answer telephone; how to
engage with citizens etc.
Access:
Access created through the 14
Government channels (including
Intranet):
a) WCG Digital platform:
Internet Portal:
http://www.westerncape.gov.za/
Intranet Portal:
http://intrawp.pgwc.gov.za/
b) WCG Social Media channels:
Twitter: https://twitter.com/
WesternCapeGov
Facebook: www.facebook.com/
WesternCapeGovernment
YouTube:
https://www.youtube.com/
user/westerncapegov
LinkedIn:
https://www.linkedin.com/compan
y/westerncape-government
c) WCG Contact Centre:
Call Centre: 0860 142142
Fax: 021 483 7216
SMS: 31022 – Help
Please Call me: 079 769 1207
Walk-in-Centre: 9 Wale Street,
Cape Town
Snail Mail: 9 Wale Street, Cape
Town
E-mail Centre:
Presidential Hotline: 17737
Additional mechanism utilised:
d) First Thursdays
Courtesy:
Courtesy is reported and measured
through:
a) WCG Contact Centre: monthly
statistics of incident received, as
well as resolution rate. Incidents
escalated to WCG departments to
assist with resolutions. Citizens assist
with identifying improvements
b) Citizen engagements (enquiries,
compliments and complaints) are
gathered daily through the
Western Cape Government
Contact Centre
c) Monthly reports are produced on
Citizen engagements across all
channels. The Top 10 issues are
identified and provided to
Departments to inform service
improvement
d) Ongoing Contact Centre training
conducted
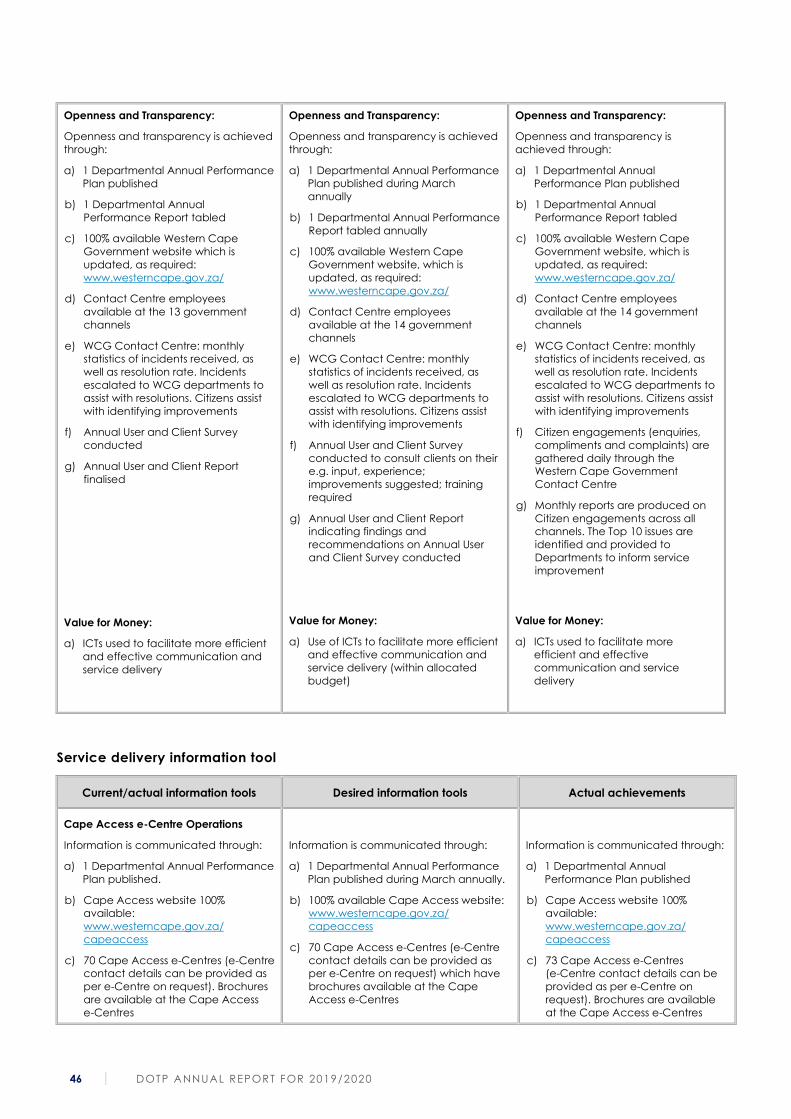
46 DOTP ANNUAL REPORT FOR 2019/2020
Openness and Transparency:
Openness and transparency is achieved
through:
a) 1 Departmental Annual Performance
Plan published
b) 1 Departmental Annual
Performance Report tabled
c) 100% available Western Cape
Government website which is
updated, as required:
www.westerncape.gov.za/
d) Contact Centre employees
available at the 13 government
channels
e) WCG Contact Centre: monthly
statistics of incidents received, as
well as resolution rate. Incidents
escalated to WCG departments to
assist with resolutions. Citizens assist
with identifying improvements
f) Annual User and Client Survey
conducted
g) Annual User and Client Report
finalised
Value for Money:
a) ICTs used to facilitate more efficient
and effective communication and
service delivery
Openness and Transparency:
Openness and transparency is achieved
through:
a) 1 Departmental Annual Performance
Plan published during March
annually
b) 1 Departmental Annual Performance
Report tabled annually
c) 100% available Western Cape
Government website, which is
updated, as required:
www.westerncape.gov.za/
d) Contact Centre employees
available at the 14 government
channels
e) WCG Contact Centre: monthly
statistics of incidents received, as
well as resolution rate. Incidents
escalated to WCG departments to
assist with resolutions. Citizens assist
with identifying improvements
f) Annual User and Client Survey
conducted to consult clients on their
e.g. input, experience;
improvements suggested; training
required
g) Annual User and Client Report
indicating findings and
recommendations on Annual User
and Client Survey conducted
Value for Money:
a) Use of ICTs to facilitate more efficient
and effective communication and
service delivery (within allocated
budget)
Openness and Transparency:
Openness and transparency is
achieved through:
a) 1 Departmental Annual
Performance Plan published
b) 1 Departmental Annual
Performance Report tabled
c) 100% available Western Cape
Government website, which is
updated, as required:
www.westerncape.gov.za/
d) Contact Centre employees
available at the 14 government
channels
e) WCG Contact Centre: monthly
statistics of incidents received, as
well as resolution rate. Incidents
escalated to WCG departments to
assist with resolutions. Citizens assist
with identifying improvements
f) Citizen engagements (enquiries,
compliments and complaints) are
gathered daily through the
Western Cape Government
Contact Centre
g) Monthly reports are produced on
Citizen engagements across all
channels. The Top 10 issues are
identified and provided to
Departments to inform service
improvement
Value for Money:
a) ICTs used to facilitate more
efficient and effective
communication and service
delivery
Service delivery information tool
Current/actual information tools Desired information tools Actual achievements
Cape Access e-Centre Operations
Information is communicated through:
a) 1 Departmental Annual Performance
Plan published.
b) Cape Access website 100%
available:
www.westerncape.gov.za/
capeaccess
c) 70 Cape Access e-Centres (e-Centre
contact details can be provided as
per e-Centre on request). Brochures
are available at the Cape Access
e-Centres
Information is communicated through:
a) 1 Departmental Annual Performance
Plan published during March annually.
b) 100% available Cape Access website:
www.westerncape.gov.za/
capeaccess
c) 70 Cape Access e-Centres (e-Centre
contact details can be provided as
per e-Centre on request) which have
brochures available at the Cape
Access e-Centres
Information is communicated through:
a) 1 Departmental Annual
Performance Plan published
b) Cape Access website 100%
available:
www.westerncape.gov.za/
capeaccess
c) 73 Cape Access e-Centres
(e-Centre contact details can be
provided as per e-Centre on
request). Brochures are available
at the Cape Access e-Centres
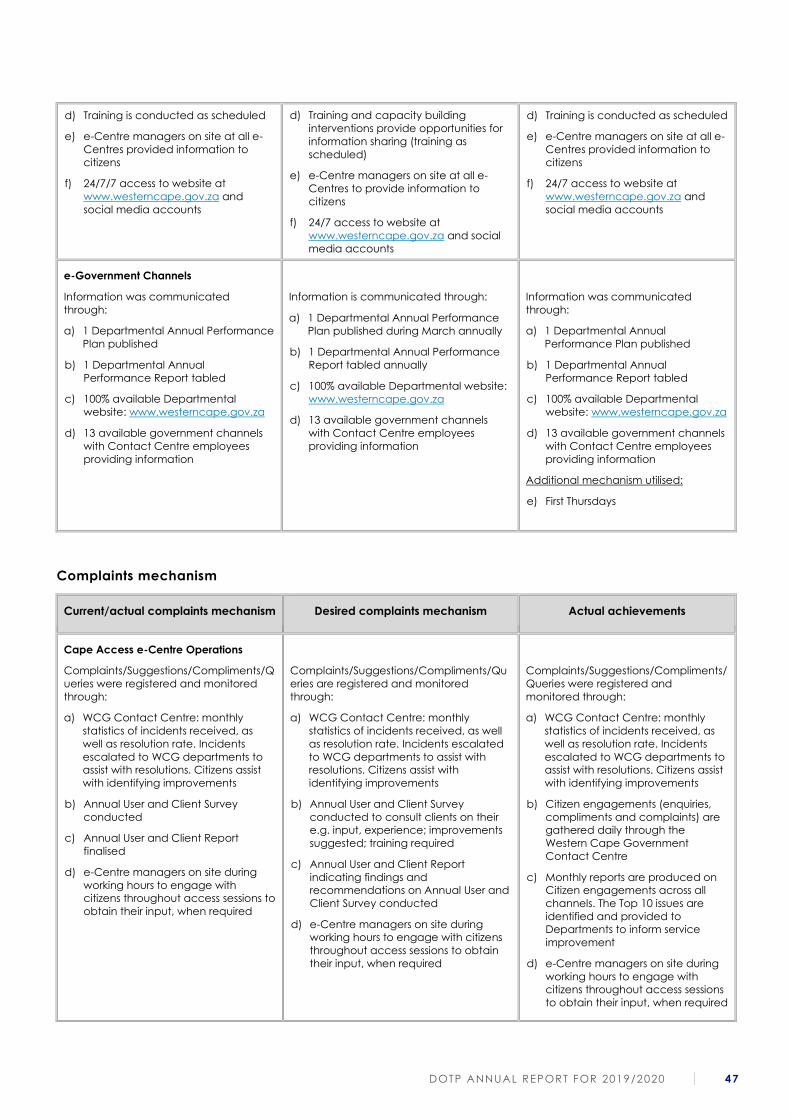
DOTP ANNUAL REPORT FOR 2019/2020 47
d) Training is conducted as scheduled
e) e-Centre managers on site at all e-
Centres provided information to
citizens
f) 24/7/7 access to website at
www.westerncape.gov.za and
social media accounts
d) Training and capacity building
interventions provide opportunities for
information sharing (training as
scheduled)
e) e-Centre managers on site at all e-
Centres to provide information to
citizens
f) 24/7 access to website at
www.westerncape.gov.za and social
media accounts
d) Training is conducted as scheduled
e) e-Centre managers on site at all e-
Centres provided information to
citizens
f) 24/7 access to website at
www.westerncape.gov.za and
social media accounts
e-Government Channels
Information was communicated
through:
a) 1 Departmental Annual Performance
Plan published
b) 1 Departmental Annual
Performance Report tabled
c) 100% available Departmental
website: www.westerncape.gov.za
d) 13 available government channels
with Contact Centre employees
providing information
Information is communicated through:
a) 1 Departmental Annual Performance
Plan published during March annually
b) 1 Departmental Annual Performance
Report tabled annually
c) 100% available Departmental website:
www.westerncape.gov.za
d) 13 available government channels
with Contact Centre employees
providing information
Information was communicated
through:
a) 1 Departmental Annual
Performance Plan published
b) 1 Departmental Annual
Performance Report tabled
c) 100% available Departmental
website: www.westerncape.gov.za
d) 13 available government channels
with Contact Centre employees
providing information
Additional mechanism utilised:
e) First Thursdays
Complaints mechanism
Current/actual complaints mechanism Desired complaints mechanism Actual achievements
Cape Access e-Centre Operations
Complaints/Suggestions/Compliments/Q
ueries were registered and monitored
through:
a) WCG Contact Centre: monthly
statistics of incidents received, as
well as resolution rate. Incidents
escalated to WCG departments to
assist with resolutions. Citizens assist
with identifying improvements
b) Annual User and Client Survey
conducted
c) Annual User and Client Report
finalised
d) e-Centre managers on site during
working hours to engage with
citizens throughout access sessions to
obtain their input, when required
Complaints/Suggestions/Compliments/Qu
eries are registered and monitored
through:
a) WCG Contact Centre: monthly
statistics of incidents received, as well
as resolution rate. Incidents escalated
to WCG departments to assist with
resolutions. Citizens assist with
identifying improvements
b) Annual User and Client Survey
conducted to consult clients on their
e.g. input, experience; improvements
suggested; training required
c) Annual User and Client Report
indicating findings and
recommendations on Annual User and
Client Survey conducted
d) e-Centre managers on site during
working hours to engage with citizens
throughout access sessions to obtain
their input, when required
Complaints/Suggestions/Compliments/
Queries were registered and
monitored through:
a) WCG Contact Centre: monthly
statistics of incidents received, as
well as resolution rate. Incidents
escalated to WCG departments to
assist with resolutions. Citizens assist
with identifying improvements
b) Citizen engagements (enquiries,
compliments and complaints) are
gathered daily through the
Western Cape Government
Contact Centre
c) Monthly reports are produced on
Citizen engagements across all
channels. The Top 10 issues are
identified and provided to
Departments to inform service
improvement
d) e-Centre managers on site during
working hours to engage with
citizens throughout access sessions
to obtain their input, when required
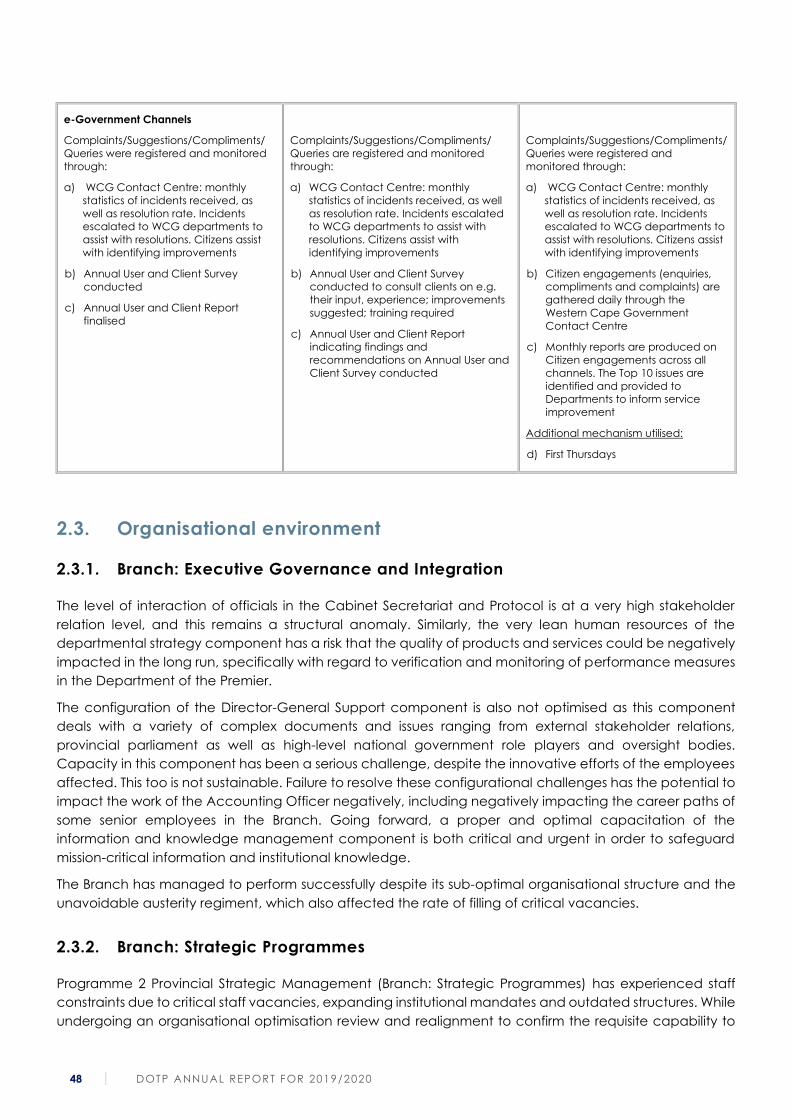
48 DOTP ANNUAL REPORT FOR 2019/2020
e-Government Channels
Complaints/Suggestions/Compliments/
Queries were registered and monitored
through:
a) WCG Contact Centre: monthly
statistics of incidents received, as
well as resolution rate. Incidents
escalated to WCG departments to
assist with resolutions. Citizens assist
with identifying improvements
b) Annual User and Client Survey
conducted
c) Annual User and Client Report
finalised
Complaints/Suggestions/Compliments/
Queries are registered and monitored
through:
a) WCG Contact Centre: monthly
statistics of incidents received, as well
as resolution rate. Incidents escalated
to WCG departments to assist with
resolutions. Citizens assist with
identifying improvements
b) Annual User and Client Survey
conducted to consult clients on e.g.
their input, experience; improvements
suggested; training required
c) Annual User and Client Report
indicating findings and
recommendations on Annual User and
Client Survey conducted
Complaints/Suggestions/Compliments/
Queries were registered and
monitored through:
a) WCG Contact Centre: monthly
statistics of incidents received, as
well as resolution rate. Incidents
escalated to WCG departments to
assist with resolutions. Citizens assist
with identifying improvements
b) Citizen engagements (enquiries,
compliments and complaints) are
gathered daily through the
Western Cape Government
Contact Centre
c) Monthly reports are produced on
Citizen engagements across all
channels. The Top 10 issues are
identified and provided to
Departments to inform service
improvement
Additional mechanism utilised:
d) First Thursdays
2.3. Organisational environment
2.3.1. Branch: Executive Governance and Integration
The level of interaction of officials in the Cabinet Secretariat and Protocol is at a very high stakeholder
relation level, and this remains a structural anomaly. Similarly, the very lean human resources of the
departmental strategy component has a risk that the quality of products and services could be negatively
impacted in the long run, specifically with regard to verification and monitoring of performance measures
in the Department of the Premier.
The configuration of the Director-General Support component is also not optimised as this component
deals with a variety of complex documents and issues ranging from external stakeholder relations,
provincial parliament as well as high-level national government role players and oversight bodies.
Capacity in this component has been a serious challenge, despite the innovative efforts of the employees
affected. This too is not sustainable. Failure to resolve these configurational challenges has the potential to
impact the work of the Accounting Officer negatively, including negatively impacting the career paths of
some senior employees in the Branch. Going forward, a proper and optimal capacitation of the
information and knowledge management component is both critical and urgent in order to safeguard
mission-critical information and institutional knowledge.
The Branch has managed to perform successfully despite its sub-optimal organisational structure and the
unavoidable austerity regiment, which also affected the rate of filling of critical vacancies.
2.3.2. Branch: Strategic Programmes
Programme 2 Provincial Strategic Management (Branch: Strategic Programmes) has experienced staff
constraints due to critical staff vacancies, expanding institutional mandates and outdated structures. While
undergoing an organisational optimisation review and realignment to confirm the requisite capability to
DOTP ANNUAL REPORT FOR 2019/2020 49
deliver on its mandate, the Branch has adopted more flexible and integrated ways of working across to
deliver on its mandates and strengthen capacity through partnerships.
This includes the role of a Provincial Data Office, which now leads and coordinates data and evidence as
a strategic asset across departments; and within the WCG using two (2) key approaches, namely Results-
based M&E and Province-wide Data Governance. A key success factor is the resource utilisation across
data and evidence services, which is geared towards building internal and transversal capacity. Capacity,
particularly in the Policy and Strategy unit and the International Relations unit, however, remains
constrained given demand and potential impact.
2.3.3. Branch: People Management
Within the Branch: People Management the organisational environment was relatively stable and the
focus was more on improving business processes, greater efficiencies and ensuring integration between
business units, as well as responding to new challenges and initiatives. The continued austerity with
concomitant budget limitations places a strain on staff to manage increasing workload as vacant posts
become unfunded. Any organisational structure requests will be in line with strategic developments within
the Department and the Branch. One area that has been identified for further consideration is to create
an Innovation hub at the Kromme Rhee Campus of the PTI, which will act as a facilitation and unlocking
space for innovative ideas and proposals.
2.3.4. Branch: Centre for e-innovation
The structure of Ce-I provides for four Chief Directorates that focus on different domains of the WCG’s ICT
ecosystem. These domains are Connected Government and Infrastructure Services, Transversal
Applications, Strategic ICT Services and GITO Management Services.
Depending on the type of services to be rendered, these chief directorates make use of either insourced,
co-sourced or outsourced business models. The use of externally sourced resources (Professional Services)
is predominantly as a result of the difficulty experienced by government with attracting, developing and
retaining staff in roles such as application developers, technologists, business analysts, ICT architects, ICT
governance and information security specialists.
The Ce-I has a few vacancies at SMS level, which places huge strain on those acting in the senior
management positions while having to perform their daily tasks. These pressures are compounded by the
general reduction of the Compensation of Employees budgets, which limits the branch’s ability to fill
technical posts. This puts at risk the service levels as required by our client departments.
50 DOTP ANNUAL REPORT FOR 2019/2020
2.3.5. Branch: Corporate Assurance
The organisational structure of the Branch: Corporate Assurance is, as indicated in the APP, not ideal. It
does, however, respond reasonably to the demand for services in the Branch. Although delivery is planned
for at the start of a financial year, there are certain areas where service requirements cannot be predicted.
In the context of the weak economic outlook, additional funding is not foreseen in the medium term, and
in line with departmental planning processes certain posts are not funded. The funded posts in this branch
have been filled and where vacancies arise, they are addressed expeditiously if approved for filling. We
no longer have budget flexibility to augment capacity, but where required and within the available
budget, capacity is augmented by insourcing capacity, especially in the Chief Directorate: Internal Audit.
There are some areas where it is not viable to create permanent posts in the approved structures due to
the specific expertise required; these skills will be insourced as and when required.
Legal Services maintained its levels and standards of service that it renders to a large client base, which
comprises the Provincial Executive, provincial departments and a number of provincial public entities. Due
to significant growth in the demand for services over time, a review of Legal Services’ structure and delivery
model was completed during the 2019/2020 financial year, the implementation of which is subject to the
availability of funding.
2.4. Key policy developments and legislative changes
The promulgation of the Public Service Regulations, 2016, with concomitant directives issued by the Minister
of Public Service and Administration (MPSA) has had an indelible impact on the people management
policy environment. As a consequence, new prescripts and procedures were directed, resulting in the
Corporate Services Centre having to align provincial people management policies and practices to the
new regulations. The alignment process has been concluded and a policy renewal programme is currently
underway and will continue into the next financial year. The implementation of the new regulations is still
hampered by vague contents of directives by the MPSA or by the failure to issue directives.
The Department of the Premier has been instrumental in developing the policy and resultant legislation to
appoint the first Commissioner for Children in the Province and South Africa. The Western Cape
Commissioner for Children Act, 2019 (Act 2 of 2019) was assented to and signed by the Premier on 29 March
2019. The purpose of the Children’s Commissioner is to assist the WCG in promoting and protecting the
rights and interests of children. The Children’s Commissioner’s powers and duties are to monitor, investigate,
research, educate, lobby and advise on matters pertaining to children in the areas of health services,
education, welfare services, recreation and amenities, and sport. The Western Cape Provincial Parliament
concluded the shortlisting and recommendation process of candidates for the Western Cape
Commissioner for Children in accordance with the Western Cape Commissioner for Children’s Act, 2019.
The Children’s Commissioner has been appointed and commenced 1 June 2020.
DOTP ANNUAL REPORT FOR 2019/2020 51
3. STRATEGIC OUTCOME-ORIENTED GOALS
The Department crafted three strategic goals to guide the institution as it gives effect to the mandate of
Government. These three goals are captured in the Department’s strategic plan as:
1. improved good governance in the Western Cape Government;
2. enabled strategic decision making and stakeholder engagement; and
3. enabled service excellence to the people of the Western Cape with people, technology and
processes.
The National Development Plan 2030 and the supporting Medium-term Strategic Framework (MTSF) (2014–
2019) respond strategically to the main challenges facing South Africa: poverty, inequality and
unemployment. The National Development Plan put forward a number of national key priorities for the
country to be achieved over the next 15 years in response to the main strategic challenges. The MTSF
constitutes the first five-year delivery plan against the National Development Plan. The alignment of the
Department’s strategic plan with the national strategic imperatives can be found in the following
outcomes:
• Outcome 3: All people in South Africa are and feel safe as it relates to the work of the Chief
Directorate: Provincial Forensic Services.
• Outcome 6: An efficient, competitive and responsive economic infrastructure network as it relates to
strategic initiatives to improve Broadband connectivity.
• Outcome 12: An efficient, effective and development-oriented public service as it relates,
predominantly, to the work of the Corporate Services Centre.
Provincial Strategic Goal 5 as contained in the Provincial Strategic Plan (2014–2019) allows for synergy with
all three outcomes listed above, but in particular as it relates to the notion of a capable and
developmental state.
The Department contributed mainly to Provincial Strategic Goal 5, which aims to embed good governance
and integrated service delivery through partnerships and spatial alignment. This strategic goal will be
achieved through pursuing the objectives relating to enhancing good governance in the Western Cape
Government, fostering of an inclusive society and achieving greater integration between the different
strategic agents involved in ensuring outcomes that add public value.
Significant progress has been made with the pursuit of the departmental strategic goals, as illustrated by
progress made with the realisation of indicator targets.
The first outcome indicator is of a composite nature and consists of five governance areas measured on a
five-point scale: people management maturity, WCG governance maturity, results-based monitoring and
evaluation maturity, ICT governance maturity and stakeholder engagement. It is recognised that parts of
the measuring instrument are still in development.
With regard to the WCG governance maturity model, it can be reported that the approved WCG
Corporate Governance Framework paved the way for determining a provincial baseline for corporate
governance for the 2018/2019 financial year. This baseline indicated that a target of a level 4 for all
components of the WCG Governance Framework was achievable. The collated self-assessment results of
departments where the self-assessment was completed at the end of the 2019/2020 financial year,
indicated an achievement of Level 5 for the Western Cape Governance. It must be noted that this was a
facilitated self-assessment, without evaluating evidence towards a specific level.
52 DOTP ANNUAL REPORT FOR 2019/2020
The RBM&E maturity testing has sustained its focus on key areas of Monitoring and Evaluation (M&E);
identified as critical for the effective and coherent implementation of an RBM&E system over the previous
five-year planning cycle (2015/2016–2019/2020). For this assessment, the level of maturity was calculated
for RBM&E in the WCG as an average of all the individual WCG departments’ assessments. The maturity
testing was completed during the 4th quarter of 2019/2020. The result reflects that an overall score of 3.33
for 2019/2020. This score represents a consistent incremental increase on the 2018/2019 (3.25), 2017/2018
(3.21) and 2016/2017 (3.15) respective scores. The final score confirms that RBM&E has been sustained
following the adoption of the approach in WCG, and that some departments are maturing in some areas
faster than others.
An ICT governance maturity rating of 1 was once again achieved against the COBIT 5 assessment tool. It
must be noted that COBIT 5 has far more stringent assessment criteria than COBIT4 and that most agents
in the industry would score a level 1 against COBIT5.
No performance was recorded against the MPAT tool as the MPAT assessment terminated prior to the end
of the five-year electoral term. The management practice, however, continued for the year under review.
In respect of contribution to the National Development Plan and Medium-term Strategic Framework the
work of Provincial Forensic Services contributed to Outcome 3: All people in South Africa are and feel safe,
particularly as it pertains to fighting corruption. The unit rendered a range of preventative and reactive
services in this regard to all departments in the WCG. In addition to investigations, some of the interventions
implemented included fraud risk assessments, fraud preventative data analytics, training employees on
the various manifestations of fraud, corruption, conflict of interest and how to identify it and all aspects of
whistle-blowing. Electronic newsletters and other awareness interventions were also conducted.
The Centre for e-Innovation contributed directly to Outcome 6: An efficient, competitive and responsive
economic infrastructure network as it relates to the Unit’s strategic initiatives to improve Broadband
connectivity. Following the initial 1 875 government sites that were connected to Broadband as part of
Phase 1 of the initiative, some of the sites that had been on hold during Phase 1 will be available for
Broadband connectivity during Phase 2. Accordingly, Phase 2 now involves the upgrading of the
connectivity speeds to a minimum of 100 megabits per second at 1 912 WCG sites, including schools,
libraries, administrative buildings, clinics, and hospitals. By the end of the 2019/2020 financial year, a total
of 1 089 of these Phase 2 speed upgrades had been completed, which is an increase of 405 sites during
the reporting period. Broadband connectivity has also been provided to the main administration offices
of 21 municipalities, enabling the requisite connectivity for local governments to meet their business
requirements.
The Department is committed to leveraging government infrastructure for the benefit of citizens, and to
this end has continued to install limited free public Wi-Fi hotspots at WCG buildings. Broadband
infrastructure is an important economic enabler for residents wishing to further their careers, grow their
businesses, to communicate or to learn, and the roll-out of an additional 452 hotspots during the financial
year means there are 630 Wi-Fi hotspots across the province for them to connect to by the end of
2019/2020. On average, over 120 000 citizens access the internet using limited free data through the Wi-Fi
hotspots every month.
The bulk of the work of the Corporate Services Centre also contributed to Outcome 12: An efficient,
effective and development-oriented public service. In this regard, good progress was registered with the
development of people management maturity and governance maturity models, in addition to the
existing ICT governance maturity model. These models will embed good governance in the WCG as the
foundation of a capable state.
In rendering relevant and timeous executive governance support services to the Executive and the
Director-General, the Department provided a support service to the Premier and the Director-General.
Executive engagements were supported, which enabled the Executive to govern the Province.
DOTP ANNUAL REPORT FOR 2019/2020 53
A critical indicator of the quality of governance support rendered to the executive authority and
accounting officer of the Department is the financial conformance and performance. In this respect, the
Department again managed to achieve a clean audit. The Department managed to achieve a 98.6%
spend of its budget allocation for the year under review.
Governance support and stakeholder engagement in respect of international relations and the transversal
coordination and execution of this function has promoted effective relations with relevant stakeholders
active within the International Relations space. In supporting and facilitating a number of strategic
engagements with the international community and partners, these have contributed to strategic
economic and development outcomes of the Province. In moving towards an inclusive society, the Human
Rights Mainstreaming approach saw a continued shift from an events orientation approach to a more
strategic approach to integrate human rights issues with the fabric of provincial government. The
Community Engagement Forum (PSG5 Work Group) broadened its pilot of a training methodology to drive
citizen-centred engagement and the Community Capacity Enhancement training is now part of the
Provincial Training Institute’s curriculum. A range of events with economic, social and environmental
objectives have been supported programmes as well in partnership with the Provincial Events Forum (such
as the annual conference, three master classes, and the Events Incubation Programme) continued to
provide information sharing and learning opportunities for event organisers to increase the impact of
the sector.
The progress made in supporting the Premier and Cabinet in respect of provincial strategic management
is evidenced by the policy and strategy support in the development and implementation of strategies and
policies for the Western Cape. Key deliverables include the development of the new PSP for the 2019–2024
term of office informed by a comprehensive End-of-term Review of the PSP 2014–2019. At the end of March
2019, a total of 21 policy and strategy papers were developed, which included strategic foresight papers,
policy commentaries and strategic frameworks and discussion documents to inform strategic decision
making. The Department, through the provision of strategic management information, has also published
a number of documents, including: an annual publication on key indicator trends on development
outcomes; one provincial publication and provincial spatial monitoring assessment; an annual publication
of the institutionalisation of evaluations relating to the Provincial Evaluation Plan; and quarterly reviews on
project performance data and quarterly briefs on the non-financial performance data. These data and
evidence products have been timeously communicated to key stakeholders in various formats for
improved evidence use to inform better decision making.
The People Management Branch pursues the strategic objective that seeks to provide a highly capable
workforce, create an enabling workplace and develop leadership that promotes employee engagement
and optimal service delivery. The Branch is placed within the Corporate Services Centre of the Department
and provides transversal services across Western Cape Government (WCG) departments, which range
from the high-volume transactional to expert advice and consultancy. As such it encompasses day-to-day
operational activities, as well as an array of different transversal initiatives, programmes, interventions and
projects. The Branch is not limited to the operational space, but ensures that people management
contributes to the achievement of the strategic goals of the Department and the WCG as a whole. It
ensures that people management contributes to the achievement of the strategic goals aligned with the
National Development Plan, specifically the achievement of a Capable State and Provincial Strategic
Goal 5. The PSG 5 project that contributes specifically to the sub-output Service Excellence with People is
the development and implementation of a people management maturity model based on the principles
of self-assessment and panel moderation (much like the current MPAT process). It consists of a maturity
growth path of levels 1-5 (with 1 being “fragmented” and 5 being “continuously improved). The assessment
tool was tested within the Branch and demonstrated value in prioritising developmental focus of People
Management practices. The People Management Branch delivers its core function of people
management through organisational development, people management practices and people training
54 DOTP ANNUAL REPORT FOR 2019/2020
and empowerment. The constrained budget allocation, an increase in demand for services, lack of joint
planning and ad hoc requests from departments is however placing the ability of the Branch to perform its
functions under serious strain. The streamlined service level agreements with departments are improved
and regular engagement with senior officers of departments ensures that there is a clearer understanding
of respective roles and responsibilities, more planned and agreed interventions, and improved service
delivery. The overall emphasis of the CSC on demand planning processes and service delivery (via the
introduction of WCG Dashboard) will also assist in improving the performance of the Branch. The Values-
based Leadership Development (VBLD) initiative, envisaged to be piloted in 2019, will also play a pivotal
role in increasing the required leadership capability that is so vital in the challenging, austere environment
the WCG finds itself. It is foreseen that the VBLD initiative will play an instrumental role in facilitating the
desired cultural transformation within the WCG to support the delivery of the PSP.
In this regard, the Chief Directorate Organisation Development of the Branch accepted 88 projects of
which 60 were completed in the financial year. The remainder of the projects are multi-year projects and
will be finalised in the 2020 financial year. These projects were aimed at bolstering the service delivery
capability of the Western Cape Government through solutions like process improvements, design solutions
to facilitate the delivery of strategy implementation and organisation culture solutions aimed at developing
and reinforcing the appropriate practices to support service delivery improvement. The foundation was
laid through a Strategic Alignment Workshop with the senior leadership of the Province, to assess and
develop the change capability required to support the delivery of the PSP and to contribute to the overall
resilience of the WCG. Similarly, the delivery of transversal and management training by the Provincial
Training Institute contributed to establishing the provincial government as a professional institution with
excellent people. In addition, certain process reengineering and system implementation in the people
practices environment resulted in reduced turnaround times within the transactional environment, for
example within service conditions, leave administration and recruitment. These gains contribute to greater
efficiencies in government while ensuring that a conducive workplace is attained. One of the success
stories of the Department has been the Premier’s Advancement of Youth Project (PAY) that seeks to give
matriculants work experience and learning opportunism for a period of one year. Since its inception in
2012, just under 5 000 matriculants have been PAY interns in departments of the Western Cape
Government.
The Centre for e-Innovation is continually working towards improving the ICT governance maturity of the
WCG through various interventions, with specific focus on Information Security, Business Continuity
Planning/Disaster Recovery Planning, ICT Planning, IT Service Management and refreshing of the WCG
Technology landscape. Ce-I has once again managed to maintain a systems and network uptime and
availability in excess of 98%. Good progress has also been made with the implementation of the Biz Systems
applications and infrastructure (which includes the BizBrain, BizPerformance and other bespoke
applications). A significant number of our users’ mailboxes were successfully migrated to the Cloud as well
as migrating users to Office 365. Similarly, we have successfully migrated all Oracle-based systems to SITA’s
Oracle Cloud Services as well as migrating the Microsoft-based systems to the Microsoft Azure cloud
services.
In the corporate assurance environment, the achievement of PSG5 was supported by deliverables such as
the roll-out of the Combined Assurance Framework as well as the finalisation of a single Corporate
Governance Framework for the WCG and an associated maturity model. The WCG Corporate
Governance Framework formalised the principles and requirements to which corporate governance for
the WCG is benchmarked. Conducting of the baseline assessments for departments is included on the
Internal Audit Coverage Plans for departments in a staggered approach.
Although the demand for legal services remained high during the financial year, Legal Services continued
to respond to client requests by the stipulated and agreed deadlines.
DOTP ANNUAL REPORT FOR 2019/2020 55
The progress registered above indicated how deliverables in support of the departmental strategic goals
also contributed to the realisation of the Provincial Strategic Plan and in particular Provincial Strategic Goal
5. Programme 2: Provincial Strategic Management supported the Executive in the development and
implementation of the Provincial Strategic Plan 2014–2019, resulting in a synergistic relationship with the
National Development Plan as it relates to “build a professional public service and a capable state” and
national outcome 12: “an efficient, effective and development-oriented public service”. All the 2018/2019
deliverables supported the realisation of these national imperatives, specifically as it relates to the
deliverables of Programme 3, People Management (including organisational development, people
training and empowerment and human resource management), Programme 4, Centre for e-Innovation
and Programme 5, Corporate Assurance (enterprise risk management, internal audit, provincial forensic
services and legal services and corporate communication). Deliverables by these programmes
contributed directly to the national outputs relating to improved access and quality of services, human
resource management and development, business processes, systems, decision rights and accountability,
citizen participation and reducing corruption.
One of the aims of the National Development Plan is to foster improved governance by, amongst others,
professionalising the public service, upgrading skills, improving coordination within government and
tackling fraud and corruption. These delivery mechanisms form the basis of the Department’s core
functions and the achievements registered during 2018/2019 continued to address these aims.
The focus of Corporate Communication drastically changed during the latter part of quarter 4 due to the
outbreak of COVID-19. Certain communication elements (for the 2020/2021 financial year were already
implemented during March 2020. In addition, the WCG communications response was being
developed/started to take shape for further implementation during 2020/2021.
56 DOTP ANNUAL REPORT FOR 2019/2020
4. PERFORMANCE INFORMATION BY PROGRAMME
4.1. Programme 1: Executive Governance and Integration
4.1.1. The purpose of the programme
The main purpose of the programme is to provide executive governance services to the provincial
executive and senior management of the department. The programme strategically supports the
Department of the Premier, Cabinet and the Accounting Officer and the provincial top management by
providing good governance support and seamless executive secretariat support services for effective
decision making by the Executive. In addition, the programme enables the Accounting Officer to comply
with his corporate responsibilities, e.g. financial management, internal control, supply chain management,
strategic management, strategic communications, Minimum Information Security Standards (MISS) and
Occupational Health and Safety (OHS). The departmental Deputy Information Officer function is also
provided for in this programme.
The programme contributes to Provincial Strategic Goal 5 aimed at enhancing good governance in the
Western Cape Government through efforts to improve corporate governance maturity, people
management maturity and e-governance maturity and connectivity. There is also a linkage with the
2014/2019 Medium-term Strategic Framework as it relates to obtaining a positive audit outcome, payment
of unopposed invoices within 30 days, maintenance of financial delegations and a procurement system
that delivers value for money, which are all critical landmarks of good governance. The supply chain
management policy and delegations are reviewed annually to incorporate changes in the policy
environment and introduce improved practices to officials in the Department.
4.1.2. Sub-programmes
During the period under review, the programme provided for the following functions to be delivered:
Sub-programme 1.1: Programme support: to provide administrative support to the management of this
programme.
Sub-programme 1.2: Office of the Premier: to provide operational support to the Premier. Operational
support to the Premier entails general office support, parliamentary support, media liaison services, diary
management and reception services, as well as household support at the official residence. Most of the
key positions in this sub-programme are filled on a contractual basis as it is linked to the term of the Premier.
Provision is also made for the appointment of special advisors in accordance with the Ministerial Handbook.
Sub-programme 1.3: Executive Council Support: to manage the executive secretariat. This sub-programme
manages the provision of secretariat, logistical and decision support services to the Cabinet, the Premier’s
intergovernmental relations forums, the provincial top management and the Department of the Premier’s
executive committee. The unit further deals with provincial protocol matters and administers the provincial
honours.
Sub-programme 1.4: Departmental Strategy: to provide strategic management, coordination and
governance support services. The sub-programme facilitates the departmental strategic management
processes, and the safety and security arrangements for the Department.
Sub-programme 1.5: Office of the Director-General: to provide operational support to the Director-
General. The sub-programme provides operational and administrative support services to the Director-
General, manages departmental responses to parliamentary questions and assists with communication
between the Director-General and relevant role players.
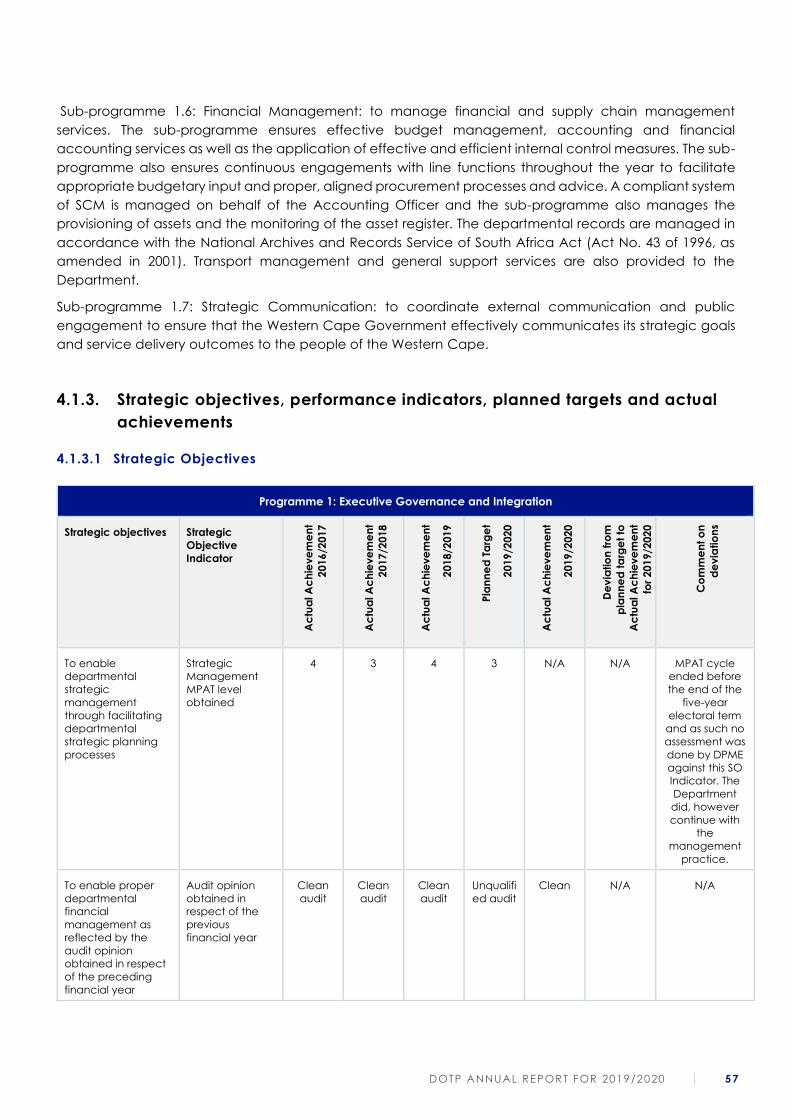
DOTP ANNUAL REPORT FOR 2019/2020 57
Sub-programme 1.6: Financial Management: to manage financial and supply chain management
services. The sub-programme ensures effective budget management, accounting and financial
accounting services as well as the application of effective and efficient internal control measures. The sub-
programme also ensures continuous engagements with line functions throughout the year to facilitate
appropriate budgetary input and proper, aligned procurement processes and advice. A compliant system
of SCM is managed on behalf of the Accounting Officer and the sub-programme also manages the
provisioning of assets and the monitoring of the asset register. The departmental records are managed in
accordance with the National Archives and Records Service of South Africa Act (Act No. 43 of 1996, as
amended in 2001). Transport management and general support services are also provided to the
Department.
Sub-programme 1.7: Strategic Communication: to coordinate external communication and public
engagement to ensure that the Western Cape Government effectively communicates its strategic goals
and service delivery outcomes to the people of the Western Cape.
4.1.3. Strategic objectives, performance indicators, planned targets and actual
achievements
4.1.3.1 Strategic Objectives
Programme 1: Executive Governance and Integration
Strategic objectives Strategic
Objective
Indicator
Ac
tua
l A
ch
ieve
me
nt
2016
/2017
Ac
tua
l A
ch
ieve
me
nt
2017
/2018
Ac
tua
l A
ch
ieve
me
nt
2018
/2019
Pla
nn
ed
Ta
rge
t
2019
/2020
Ac
tua
l A
ch
ieve
me
nt
2019
/2020
De
via
tio
n f
rom
pla
nn
ed
ta
rge
t to
Ac
tua
l A
ch
ieve
me
nt
for
201
9/2
02
0
Co
mm
en
t o
n
de
via
tio
ns
To enable
departmental
strategic
management
through facilitating
departmental
strategic planning
processes
Strategic
Management
MPAT level
obtained
4 3
4 3 N/A N/A MPAT cycle
ended before
the end of the
five-year
electoral term
and as such no
assessment was
done by DPME
against this SO
Indicator. The
Department
did, however
continue with
the
management
practice.
To enable proper
departmental
financial
management as
reflected by the
audit opinion
obtained in respect
of the preceding
financial year
Audit opinion
obtained in
respect of the
previous
financial year
Clean
audit
Clean
audit
Clean
audit
Unqualifi
ed audit
Clean N/A N/A
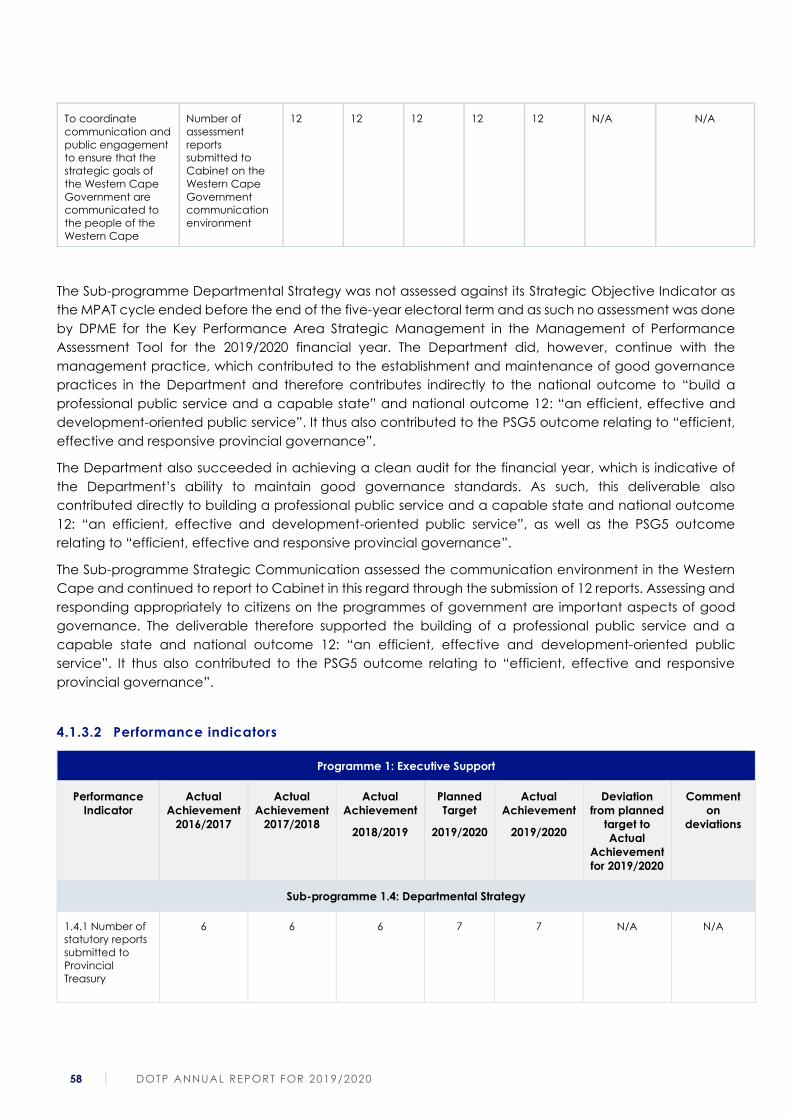
58 DOTP ANNUAL REPORT FOR 2019/2020
The Sub-programme Departmental Strategy was not assessed against its Strategic Objective Indicator as
the MPAT cycle ended before the end of the five-year electoral term and as such no assessment was done
by DPME for the Key Performance Area Strategic Management in the Management of Performance
Assessment Tool for the 2019/2020 financial year. The Department did, however, continue with the
management practice, which contributed to the establishment and maintenance of good governance
practices in the Department and therefore contributes indirectly to the national outcome to “build a
professional public service and a capable state” and national outcome 12: “an efficient, effective and
development-oriented public service”. It thus also contributed to the PSG5 outcome relating to “efficient,
effective and responsive provincial governance”.
The Department also succeeded in achieving a clean audit for the financial year, which is indicative of
the Department’s ability to maintain good governance standards. As such, this deliverable also
contributed directly to building a professional public service and a capable state and national outcome
12: “an efficient, effective and development-oriented public service”, as well as the PSG5 outcome
relating to “efficient, effective and responsive provincial governance”.
The Sub-programme Strategic Communication assessed the communication environment in the Western
Cape and continued to report to Cabinet in this regard through the submission of 12 reports. Assessing and
responding appropriately to citizens on the programmes of government are important aspects of good
governance. The deliverable therefore supported the building of a professional public service and a
capable state and national outcome 12: “an efficient, effective and development-oriented public
service”. It thus also contributed to the PSG5 outcome relating to “efficient, effective and responsive
provincial governance”.
4.1.3.2 Performance indicators
Programme 1: Executive Support
Performance
Indicator
Actual
Achievement
2016/2017
Actual
Achievement
2017/2018
Actual
Achievement
2018/2019
Planned
Target
2019/2020
Actual
Achievement
2019/2020
Deviation
from planned
target to
Actual
Achievement
for 2019/2020
Comment
on
deviations
Sub-programme 1.4: Departmental Strategy
1.4.1 Number of
statutory reports
submitted to
Provincial
Treasury
6 6 6 7 7 N/A N/A
To coordinate
communication and
public engagement
to ensure that the
strategic goals of
the Western Cape
Government are
communicated to
the people of the
Western Cape
Number of
assessment
reports
submitted to
Cabinet on the
Western Cape
Government
communication
environment
12 12 12 12 12 N/A N/A
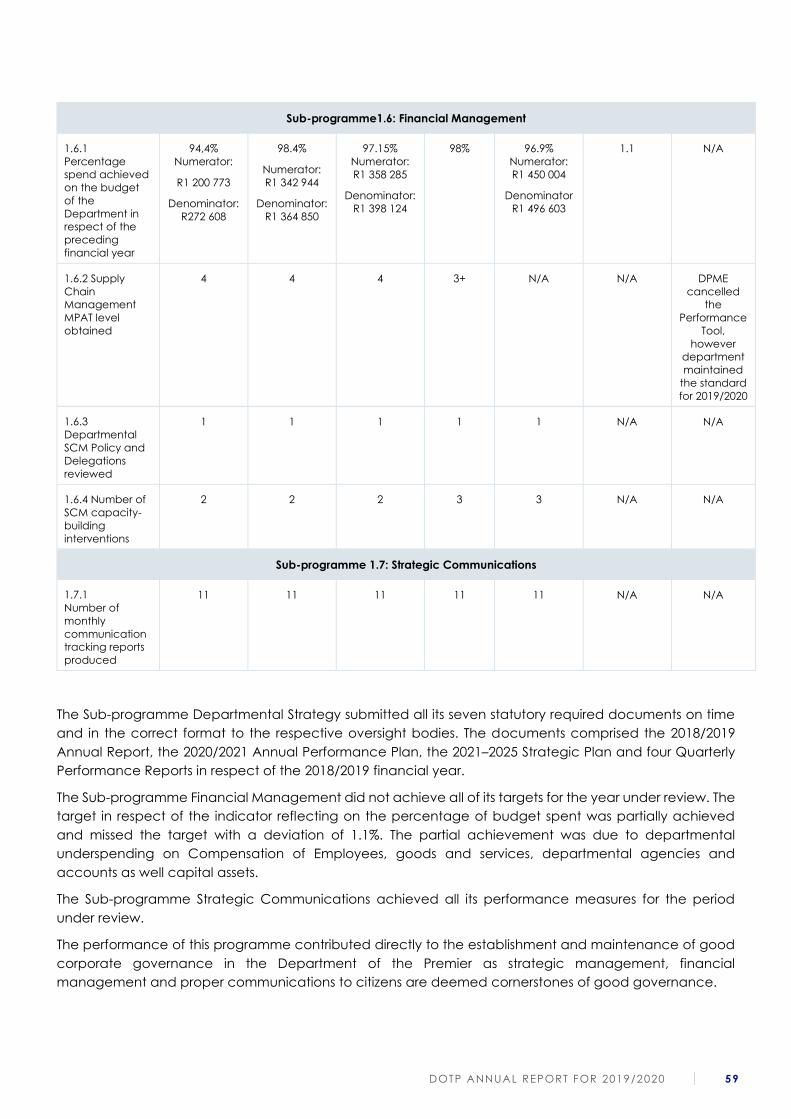
DOTP ANNUAL REPORT FOR 2019/2020 59
Sub-programme1.6: Financial Management
1.6.1
Percentage
spend achieved
on the budget
of the
Department in
respect of the
preceding
financial year
94,4%
Numerator:
R1 200 773
Denominator:
R272 608
98.4%
Numerator:
R1 342 944
Denominator:
R1 364 850
97.15%
Numerator:
R1 358 285
Denominator:
R1 398 124
98% 96.9%
Numerator:
R1 450 004
Denominator
R1 496 603
1.1 N/A
1.6.2 Supply
Chain
Management
MPAT level
obtained
4 4 4 3+ N/A N/A DPME
cancelled
the
Performance
Tool,
however
department
maintained
the standard
for 2019/2020
1.6.3
Departmental
SCM Policy and
Delegations
reviewed
1 1 1 1 1 N/A N/A
1.6.4 Number of
SCM capacity-
building
interventions
2 2 2 3 3 N/A N/A
Sub-programme 1.7: Strategic Communications
1.7.1
Number of
monthly
communication
tracking reports
produced
11 11 11 11
11 N/A N/A
The Sub-programme Departmental Strategy submitted all its seven statutory required documents on time
and in the correct format to the respective oversight bodies. The documents comprised the 2018/2019
Annual Report, the 2020/2021 Annual Performance Plan, the 2021–2025 Strategic Plan and four Quarterly
Performance Reports in respect of the 2018/2019 financial year.
The Sub-programme Financial Management did not achieve all of its targets for the year under review. The
target in respect of the indicator reflecting on the percentage of budget spent was partially achieved
and missed the target with a deviation of 1.1%. The partial achievement was due to departmental
underspending on Compensation of Employees, goods and services, departmental agencies and
accounts as well capital assets.
The Sub-programme Strategic Communications achieved all its performance measures for the period
under review.
The performance of this programme contributed directly to the establishment and maintenance of good
corporate governance in the Department of the Premier as strategic management, financial
management and proper communications to citizens are deemed cornerstones of good governance.
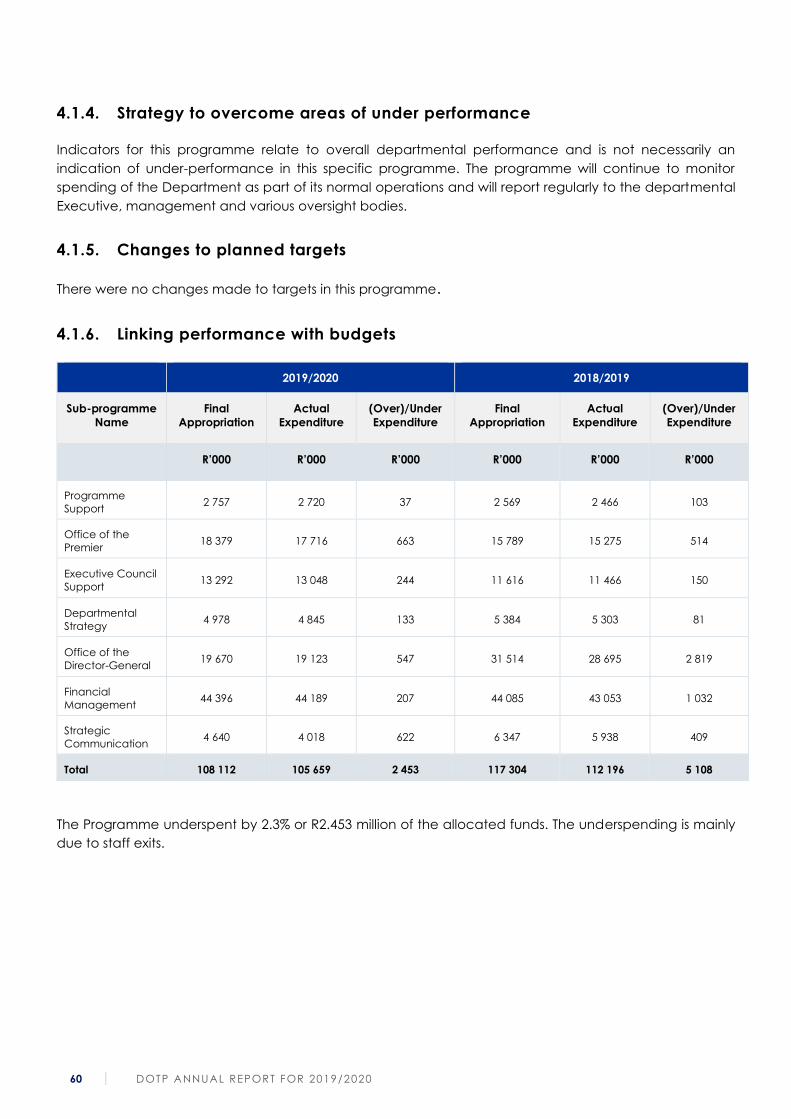
60 DOTP ANNUAL REPORT FOR 2019/2020
4.1.4. Strategy to overcome areas of under performance
Indicators for this programme relate to overall departmental performance and is not necessarily an
indication of under-performance in this specific programme. The programme will continue to monitor
spending of the Department as part of its normal operations and will report regularly to the departmental
Executive, management and various oversight bodies.
4.1.5. Changes to planned targets
There were no changes made to targets in this programme.
4.1.6. Linking performance with budgets
2019/2020 2018/2019
Sub-programme
Name
Final
Appropriation
Actual
Expenditure
(Over)/Under
Expenditure
Final
Appropriation
Actual
Expenditure
(Over)/Under
Expenditure
R’000 R’000 R’000 R’000 R’000 R’000
Programme
Support 2 757 2 720 37 2 569 2 466 103
Office of the
Premier 18 379 17 716 663 15 789 15 275 514
Executive Council
Support 13 292 13 048 244 11 616 11 466 150
Departmental
Strategy 4 978 4 845 133 5 384 5 303 81
Office of the
Director-General 19 670 19 123 547 31 514 28 695 2 819
Financial
Management 44 396 44 189 207 44 085 43 053 1 032
Strategic
Communication 4 640 4 018 622 6 347 5 938 409
Total 108 112 105 659 2 453 117 304 112 196 5 108
The Programme underspent by 2.3% or R2.453 million of the allocated funds. The underspending is mainly
due to staff exits.
DOTP ANNUAL REPORT FOR 2019/2020 61
4.2. Programme 2: Provincial Strategic Management
4.2.1. The purpose of the Programme
The purpose of this programme is to provide policy and strategy support as well as strategic management
information and to coordinate strategic projects through partnerships and strategic engagements.
The Programme plays a pivotal role in providing strategic leadership and coordination in provincial policy
formulation and review, supporting and overseeing service delivery planning and implementation in
support of provincial priorities and plans. Provincial Strategic Management focuses its work towards
improving service delivery results and outcomes through providing policy and strategy support, driving
data-driven and evidence-based decision making and coordinating strategic priority programmes to
support planning and implementation of government’s priorities. It therefore brings together the policy
imperatives, data and evidence, and strategic programmes to support delivery. The key areas of strategic
support are in relation to transversal policy and strategy development and analysis; policy planning and
implementation; Results-based Monitoring and Evaluation and Data Governance; and Strategic
programme coordination. This Programme plays a key role in the development and implementation of the
2019-2024 Provincial Strategic Plan.
The Programme coordinated a range of transversal programmes and engagements of strategic
importance to the WCG. Policy and Strategy development and support include coordination of provincial
planning, and policy research and analysis that aims to improve evidence-based policy, planning and
implementation. The Programme contributes towards ensuring that the strategic priorities are aligned to
the policies and high-level strategies of government including the 2019–2024 Provincial Strategic Plan and
the Vision-inspired Priorities, the Medium-term Strategic Framework (MTSF) and NDP, as well as the global
Sustainable Development Goals (SDGs). Strategic Programmes coordination is towards implementation on
the strategic priorities that contribute to a more responsive and people-centred approach. These include
strategic international and local stakeholder engagements, frontline monitoring and support, as well as
human rights-based interventions and event sector support.
Strategic Management Information has evolved into a Provincial Data Office that supports the WCG in
becoming a data- and evidence-driven organisation, operating strategically with key stakeholders to work
in a collaborative and integrated manner, contributing towards the coherence in production and use of
data evidence across departments. This is done through integrating two key lenses: Results-based
Monitoring and Evaluation (RBM&E) and Province-wide Data Governance (PWDG).
Critical stakeholders of this Branch are the Premier and Cabinet, the Director-General and Heads of
Departments, members of the diplomatic and consular corps, academic institutions including CHEC, non-
governmental organisations, national and local spheres of government, international partners and event
organisers.
4.2.2. Sub-programmes
During the period under review, the programme provided for the following functions to be delivered:
Sub-programme 2.1: Programme Support: to provide administrative support to the management of this
programme.
Sub-programme 2.2: Policy and Strategy: to support the Executive strategically in the development and
implementation of high-level provincial policies and strategies. This role is to lead, coordinate and
support evidence-based policy development and innovation, planning and review across and within
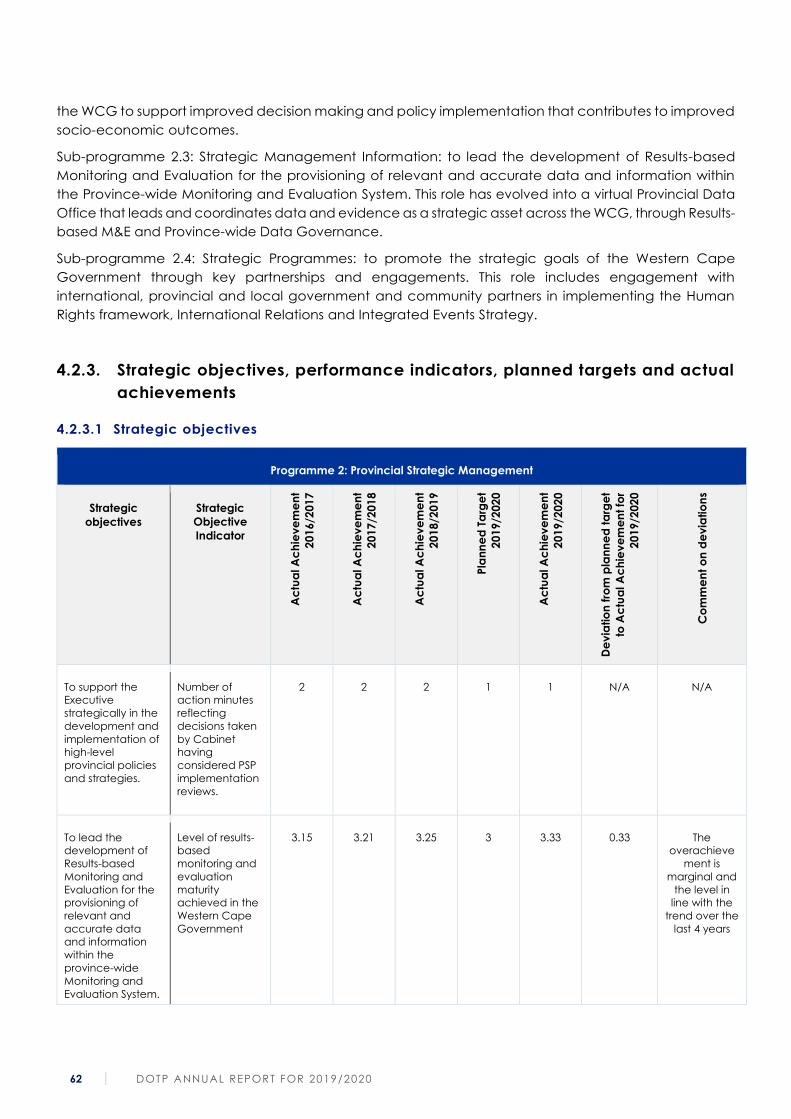
62 DOTP ANNUAL REPORT FOR 2019/2020
the WCG to support improved decision making and policy implementation that contributes to improved
socio-economic outcomes.
Sub-programme 2.3: Strategic Management Information: to lead the development of Results-based
Monitoring and Evaluation for the provisioning of relevant and accurate data and information within
the Province-wide Monitoring and Evaluation System. This role has evolved into a virtual Provincial Data
Office that leads and coordinates data and evidence as a strategic asset across the WCG, through Results-
based M&E and Province-wide Data Governance.
Sub-programme 2.4: Strategic Programmes: to promote the strategic goals of the Western Cape
Government through key partnerships and engagements. This role includes engagement with
international, provincial and local government and community partners in implementing the Human
Rights framework, International Relations and Integrated Events Strategy.
4.2.3. Strategic objectives, performance indicators, planned targets and actual
achievements
4.2.3.1 Strategic objectives
Programme 2: Provincial Strategic Management
Strategic
objectives
Strategic
Objective
Indicator
Ac
tua
l A
ch
iev
em
en
t
20
16/2
01
7
Ac
tua
l A
ch
iev
em
en
t
20
17/2
01
8
Ac
tua
l A
ch
iev
em
en
t
20
18/2
01
9
Pla
nn
ed
Ta
rge
t
20
19/2
02
0
Ac
tua
l A
ch
iev
em
en
t
20
19/2
02
0
De
via
tio
n f
rom
pla
nn
ed
ta
rge
t
to A
ctu
al A
ch
iev
em
en
t fo
r
20
19/2
02
0
Co
mm
en
t o
n d
ev
iatio
ns
To support the
Executive
strategically in the
development and
implementation of
high-level
provincial policies
and strategies.
Number of
action minutes
reflecting
decisions taken
by Cabinet
having
considered PSP
implementation
reviews.
2 2 2 1 1 N/A N/A
To lead the
development of
Results-based
Monitoring and
Evaluation for the
provisioning of
relevant and
accurate data
and information
within the
province-wide
Monitoring and
Evaluation System.
Level of results-
based
monitoring and
evaluation
maturity
achieved in the
Western Cape
Government
3.15 3.21 3.25 3 3.33 0.33 The
overachieve
ment is
marginal and
the level in
line with the
trend over the
last 4 years
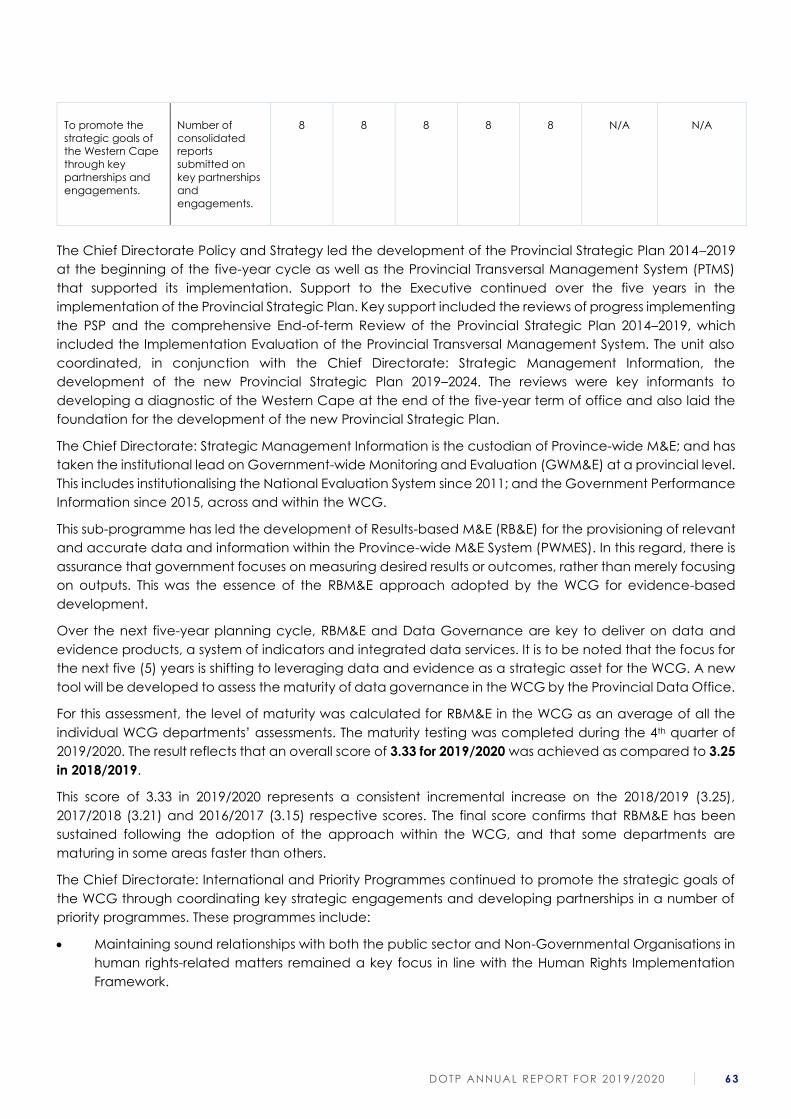
DOTP ANNUAL REPORT FOR 2019/2020 63
To promote the
strategic goals of
the Western Cape
through key
partnerships and
engagements.
Number of
consolidated
reports
submitted on
key partnerships
and
engagements.
8 8 8 8 8 N/A N/A
The Chief Directorate Policy and Strategy led the development of the Provincial Strategic Plan 2014–2019
at the beginning of the five-year cycle as well as the Provincial Transversal Management System (PTMS)
that supported its implementation. Support to the Executive continued over the five years in the
implementation of the Provincial Strategic Plan. Key support included the reviews of progress implementing
the PSP and the comprehensive End-of-term Review of the Provincial Strategic Plan 2014–2019, which
included the Implementation Evaluation of the Provincial Transversal Management System. The unit also
coordinated, in conjunction with the Chief Directorate: Strategic Management Information, the
development of the new Provincial Strategic Plan 2019–2024. The reviews were key informants to
developing a diagnostic of the Western Cape at the end of the five-year term of office and also laid the
foundation for the development of the new Provincial Strategic Plan.
The Chief Directorate: Strategic Management Information is the custodian of Province-wide M&E; and has
taken the institutional lead on Government-wide Monitoring and Evaluation (GWM&E) at a provincial level.
This includes institutionalising the National Evaluation System since 2011; and the Government Performance
Information since 2015, across and within the WCG.
This sub-programme has led the development of Results-based M&E (RB&E) for the provisioning of relevant
and accurate data and information within the Province-wide M&E System (PWMES). In this regard, there is
assurance that government focuses on measuring desired results or outcomes, rather than merely focusing
on outputs. This was the essence of the RBM&E approach adopted by the WCG for evidence-based
development.
Over the next five-year planning cycle, RBM&E and Data Governance are key to deliver on data and
evidence products, a system of indicators and integrated data services. It is to be noted that the focus for
the next five (5) years is shifting to leveraging data and evidence as a strategic asset for the WCG. A new
tool will be developed to assess the maturity of data governance in the WCG by the Provincial Data Office.
For this assessment, the level of maturity was calculated for RBM&E in the WCG as an average of all the
individual WCG departments’ assessments. The maturity testing was completed during the 4th quarter of
2019/2020. The result reflects that an overall score of 3.33 for 2019/2020 was achieved as compared to 3.25
in 2018/2019.
This score of 3.33 in 2019/2020 represents a consistent incremental increase on the 2018/2019 (3.25),
2017/2018 (3.21) and 2016/2017 (3.15) respective scores. The final score confirms that RBM&E has been
sustained following the adoption of the approach within the WCG, and that some departments are
maturing in some areas faster than others.
The Chief Directorate: International and Priority Programmes continued to promote the strategic goals of
the WCG through coordinating key strategic engagements and developing partnerships in a number of
priority programmes. These programmes include:
• Maintaining sound relationships with both the public sector and Non-Governmental Organisations in
human rights-related matters remained a key focus in line with the Human Rights Implementation
Framework.

64 DOTP ANNUAL REPORT FOR 2019/2020
• Training of officials on the United Nations Development Program (UNDP-authored) Community
Capacity Enhancement methodology as a means to facilitate the shift towards a citizen-centric
service delivery paradigm within the WCG.
• Giving effect to the Integrated Events Strategy in striving to grow the event sector through events
support and capacity development within the events sector.
• Community engagement on issues where strong social outcomes are sought, e.g. the monitoring
and coordination of the Hangberg Peace Accord and Court Order through community
engagement, in relation to social cohesion between foreign nationals and local communities,
facilitating in situations fuelled by service delivery issues.
• Coordination of International Relations included managing both outgoing and incoming
international visits, facilitating key events with International stakeholders such as the Africa Day
Programme, the annual Diplomatic Brunch, as well as topical briefing sessions for members of the
Diplomatic Consular Corps and the International Relations Forum (e.g. briefing on Brexit, Electricity
crisis, Safety during 2019/2020). The value of these remained focused on building stronger
partnerships with Consuls-general and other strategic partners on the objectives of the IR strategy,
namely: promoting trade, tourism and investments; developing skills and sharing best practices
through knowledge and information sharing in all sectors; and improving resilience.
4.2.3.2 Performance indicators
Programme 2: Provincial Strategic Management
Performance
Indicator
Actual
Achievement
2016/2017
Actual
Achievement
2017/2018
Actual
Achievement
2018/2019
Planned
Target
2019/
2020
Actual
Achievement
2019/2020
Deviation
from
planned
target to
Actual
Achievem
ent for
2019/2020
Comment on
deviations
Sub-programme 2.2: Policy and Strategy
2.2.1 Number of
assessment
reports
submitted on
the alignment
and non-
alignment of
departments’
APPs to the
Provincial
Strategic Plan
13 13 13 13 13 N/A N/A
2.2.2 Number of
policy and
strategy papers
in response to
national and
provincial
strategic
imperatives
20 19 17 14 21 7 This is a partly
demand-driven
indicator,
policies and
legislation
requiring policy
commentary is
variable and
more policy and
strategy papers
were produced
than originally
anticipated.
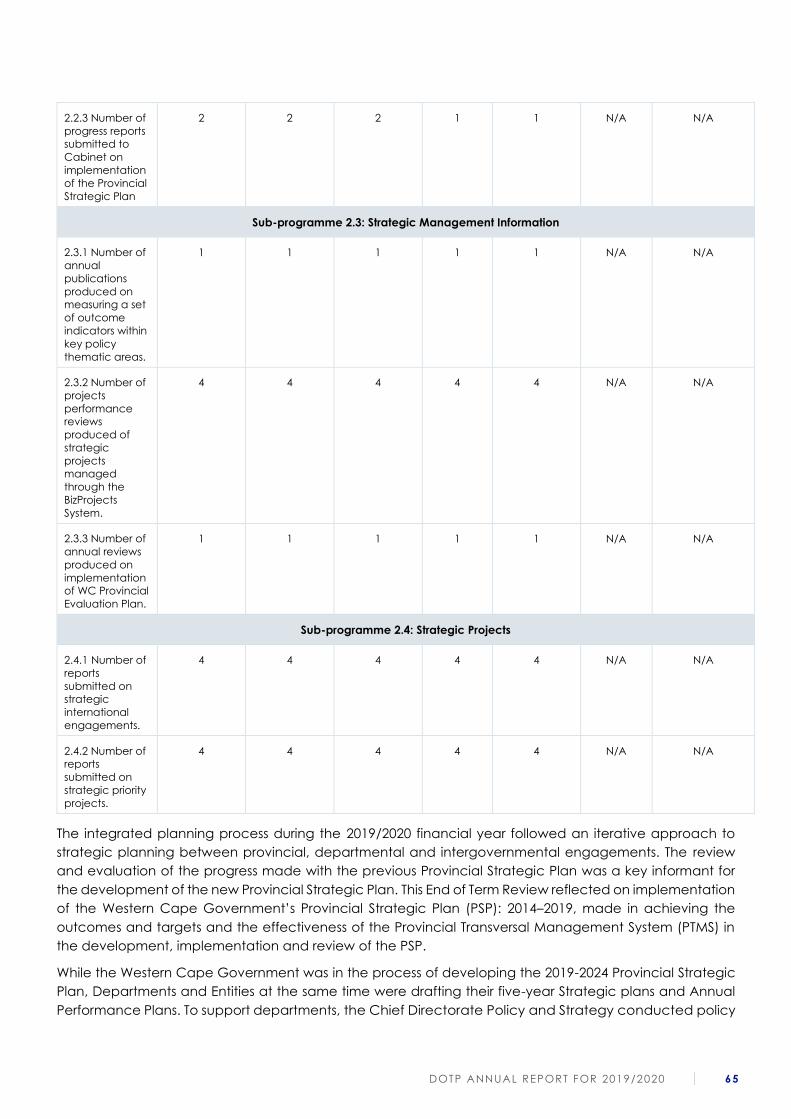
DOTP ANNUAL REPORT FOR 2019/2020 65
2.2.3 Number of
progress reports
submitted to
Cabinet on
implementation
of the Provincial
Strategic Plan
2 2 2 1 1 N/A N/A
Sub-programme 2.3: Strategic Management Information
2.3.1 Number of
annual
publications
produced on
measuring a set
of outcome
indicators within
key policy
thematic areas.
1 1 1 1 1 N/A N/A
2.3.2 Number of
projects
performance
reviews
produced of
strategic
projects
managed
through the
BizProjects
System.
4 4 4 4 4 N/A N/A
2.3.3 Number of
annual reviews
produced on
implementation
of WC Provincial
Evaluation Plan.
1 1 1 1 1 N/A N/A
Sub-programme 2.4: Strategic Projects
2.4.1 Number of
reports
submitted on
strategic
international
engagements.
4 4 4 4 4 N/A N/A
2.4.2 Number of
reports
submitted on
strategic priority
projects.
4 4 4 4 4 N/A N/A
The integrated planning process during the 2019/2020 financial year followed an iterative approach to
strategic planning between provincial, departmental and intergovernmental engagements. The review
and evaluation of the progress made with the previous Provincial Strategic Plan was a key informant for
the development of the new Provincial Strategic Plan. This End of Term Review reflected on implementation
of the Western Cape Government’s Provincial Strategic Plan (PSP): 2014–2019, made in achieving the
outcomes and targets and the effectiveness of the Provincial Transversal Management System (PTMS) in
the development, implementation and review of the PSP.
While the Western Cape Government was in the process of developing the 2019-2024 Provincial Strategic
Plan, Departments and Entities at the same time were drafting their five-year Strategic plans and Annual
Performance Plans. To support departments, the Chief Directorate Policy and Strategy conducted policy
66 DOTP ANNUAL REPORT FOR 2019/2020
alignment assessments on the draft Strategic and Annual Performance Plans to strengthen alignment to
the priorities outlined in Provincial Strategic Plan (PSP 2019 – 2024) and Medium-Term Strategic Framework
(MTSF). These were done in conjunction with technical indicators assessments of the Chief Directorate
Strategic Management Information.
The unit supported the development and implementation of strategies and policies towards the
advancement and realisation of the Western Cape Government’s strategic priorities. The key focus was
developing the Provincial Strategic Plan 2019 – 2024 and the Vision-inspired priorities of safe and cohesive
communities, growth and jobs, empowering people, spatial transformation and mobility and innovation
and culture. Reviews and research were undertaken related to key transversal priorities, such as Economic
Procurement, the YearBeyond programme and, Alcohol-related Harm Reduction Policy and Strategy
papers compiled, including a number of policy commentaries, several key national draft policies and
legislation, which include the areas of resilience, youth, economy, the MTSF. The unit also applied
innovative policy and research methodologies aligned to key priorities. This included a number of Strategic
Foresight policy papers as well as behavioural change initiatives (e.g. Growth Mindset intervention among
learners and learner safety initiative in partnership with the Western Cape Education Department and
Department of the Community Safety). Policy support towards the appointment of the Children’s
Commissioner continued. Coordinating the research collaboration through the Cape Higher Education
Consortium (CHEC) also continued during the period under review.
Strategic Management Information has over the five-year cycle produced relevant and accurate data
that are supported by sound methodologies to inform the policy, data and evidence agenda. The sub-
programme produced two (2) annual publications on key indicator trends in relation to development
outcomes and service delivery. The sub-programme also produced five (5) quarterly briefs on non-financial
performance and four (4) quarterly reviews on project performance information. In addition to the annual
review on implementation of the WC Provincial Evaluation Plan, a five-year review of the Provincial
Evaluation System was done to inform the strategic direction for evaluations for the next five (5) years.
The publication “Measuring results using key outcome indicators”, year-on-year, provides a coherent set
of outcome indicators with data trends to support evidence-based development. This annual release is
inclusive of baselines that relate to 27 outcome indicators for the PSP.
The publication "Measuring results using key direct service delivery indicators”, covers a six-year trend for
the financial years 2013/2014 to 2018/2019 respectively; providing a consolidated departmental view of all
WCG key direct service delivery indicators. This publication measures the departmental performance
targets and plots the annual trends on those key performance indicators that are geared towards and
tracks direct service delivery.
The quarterly releases on the “Performance of non-financial performance data for the WCG”, provided
quarter-on-quarter performance of the Western Cape Government (WCG) for the 2019/2020 financial
year.
In line with the PWDG programme, the sub-programme emerged as a Provincial Data Office and lead the
Provincial Data Office Steercom (PDOS) as an integrator for strategic implementation. This approach
strengthened partnerships with provincial and national departments; and external entities such as the City
of Cape Town.
This role became key to respond to a number of requests in relation to data analytics and production of
briefs on data and statistics for Ministerial and Executive requests. The data and evidence products were
timeously disseminated to key stakeholders in various formats for further use as evidence to inform better
decision making.
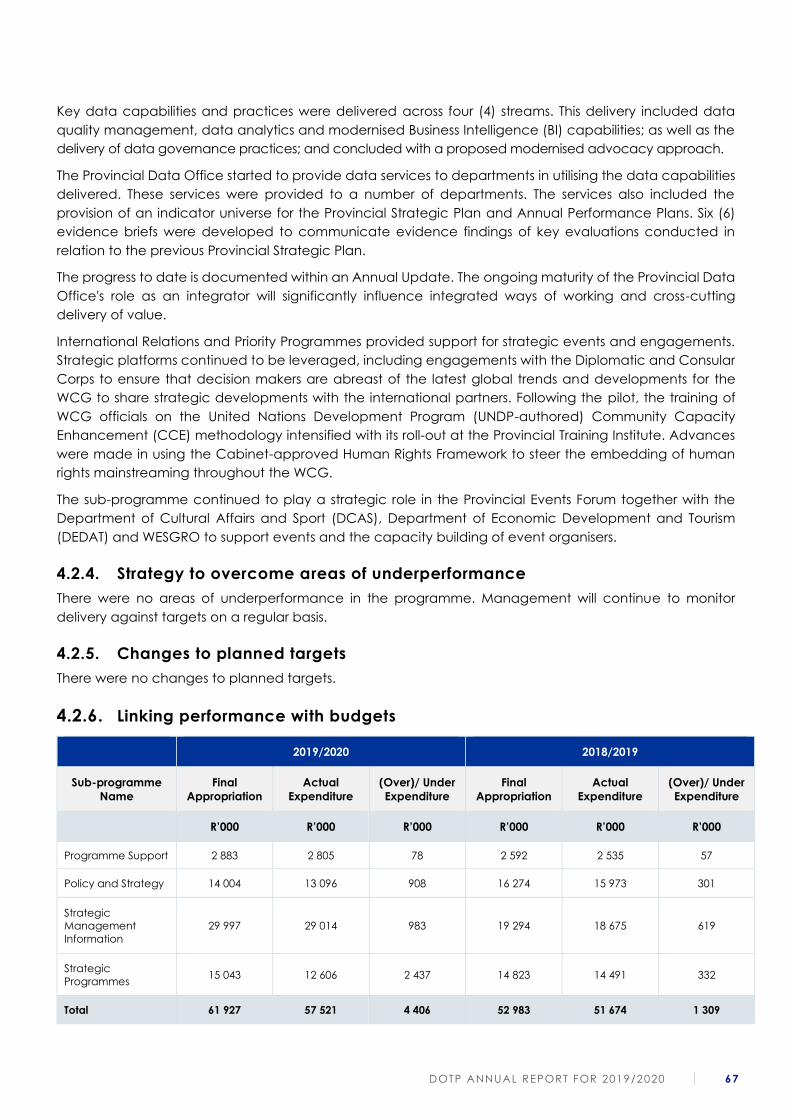
DOTP ANNUAL REPORT FOR 2019/2020 67
Key data capabilities and practices were delivered across four (4) streams. This delivery included data
quality management, data analytics and modernised Business Intelligence (BI) capabilities; as well as the
delivery of data governance practices; and concluded with a proposed modernised advocacy approach.
The Provincial Data Office started to provide data services to departments in utilising the data capabilities
delivered. These services were provided to a number of departments. The services also included the
provision of an indicator universe for the Provincial Strategic Plan and Annual Performance Plans. Six (6)
evidence briefs were developed to communicate evidence findings of key evaluations conducted in
relation to the previous Provincial Strategic Plan.
The progress to date is documented within an Annual Update. The ongoing maturity of the Provincial Data
Office's role as an integrator will significantly influence integrated ways of working and cross-cutting
delivery of value.
International Relations and Priority Programmes provided support for strategic events and engagements.
Strategic platforms continued to be leveraged, including engagements with the Diplomatic and Consular
Corps to ensure that decision makers are abreast of the latest global trends and developments for the
WCG to share strategic developments with the international partners. Following the pilot, the training of
WCG officials on the United Nations Development Program (UNDP-authored) Community Capacity
Enhancement (CCE) methodology intensified with its roll-out at the Provincial Training Institute. Advances
were made in using the Cabinet-approved Human Rights Framework to steer the embedding of human
rights mainstreaming throughout the WCG.
The sub-programme continued to play a strategic role in the Provincial Events Forum together with the
Department of Cultural Affairs and Sport (DCAS), Department of Economic Development and Tourism
(DEDAT) and WESGRO to support events and the capacity building of event organisers.
4.2.4. Strategy to overcome areas of underperformance
There were no areas of underperformance in the programme. Management will continue to monitor
delivery against targets on a regular basis.
4.2.5. Changes to planned targets
There were no changes to planned targets.
4.2.6. Linking performance with budgets
2019/2020 2018/2019
Sub-programme
Name
Final
Appropriation
Actual
Expenditure
(Over)/ Under
Expenditure
Final
Appropriation
Actual
Expenditure
(Over)/ Under
Expenditure
R’000 R’000 R’000 R’000 R’000 R’000
Programme Support 2 883 2 805 78 2 592 2 535 57
Policy and Strategy 14 004 13 096 908 16 274 15 973 301
Strategic
Management
Information
29 997 29 014 983 19 294 18 675 619
Strategic
Programmes 15 043 12 606 2 437 14 823 14 491 332
Total 61 927 57 521 4 406 52 983 51 674 1 309
68 DOTP ANNUAL REPORT FOR 2019/2020
The Programme underspent by 7.1% or R4.406 million due to staff exits and certain projects and events not
materialising as planned.
4.3. Programme 3: People Management
4.3.1. The purpose of the programme
Purpose: To render a transversal people management service, consisting of organisational development,
training and empowerment, and people practices.
The Branch: People Management seeks to enable service excellence with people through the provision of
highly capable people, a performance-conducive workplace and leadership that drives employee
engagement. For this reason, the vison of the Branch: People Management is: “Highly competent people
contributing to the Capable State.” The Branch falls within the Corporate Services Centre of the
Department and provides transversal services across WCG departments, which range from the high-
volume transactional to expert advice and consultancy services. As such, it encompasses day-to-day
operational activities as well as an array of different initiatives, programmes, interventions and projects. The
mission of the Branch is to be “a trusted partner providing integrated and innovative people solutions to
the WCG departments through clear strategy, talent management expertise and professional
engagement that contributes to good governance and improved organisational performance.”
The Branch is, however, not limited to operational activities, but ensures that people management
contributes to the achievement of the strategic goals of the Department and the WCG as a whole. The
People Management Strategy of the Western Cape Government has been implemented to provide a
clear understanding of the current people management context and the desired people state in line with
the Provincial Strategic Plan (PSP). The strategy defines a distinctive people philosophy, value proposition,
ideal people profile, strategic initiatives; people score card as well as the implementation of governance
architecture that will facilitate an improved citizen experience through people efficiencies.
The future is going to look vastly different: both in terms of the world at large, and more specifically the
world of work. In particular, the worker, leadership and organisation of the future, regardless of sector,
whether public or private, are and will continue to undergo fundamental and radical change.
People Management is not immune to these changing environment and technology advances. In order
to meet this challenge, the Branch has embarked on a journey to develop a Future-fit Guide for People
Professionals aimed at transforming the Branch and its People Professionals to become future-fit pro-
actively, and travel well capacitated for and into the future. At the outset, it was important to identify the
trends that are impacting on people management and our response thereto, and then to co-create an
implementation plan.
In the vein of the Provincial Strategic Plan 2020–2025, while the Branch as part of the broader WCG will
contribute to the strategic priorities identified by the Premier, it will align with the Vision-inspired Priority 5 of
innovation and culture change for embedding a Citizen-centric culture throughout the WCG. The Branch
has therefore also based its strategic outcomes for the next five years on those of the Departmental
Strategic Plan viz Outcome 1: Improved employee engagement; Outcome 2: Improved quality, efficiency
and effectiveness of organisational performance; and Outcome 3: Citizen-centric culture inculcated in
the WCG. Given the COVID-19 Pandemic that was declared by the World Health Organisation during the
last quarter of the current financial year, and its anticipated profound impact socio-economically on not
only the province, but the country as a whole, the plans over the next Medium-term may need to be
reviewed and revised.

DOTP ANNUAL REPORT FOR 2019/2020 69
4.3.2. Sub-programmes
Programme 3 performs its people management functions through its three sub-programmes viz:
3.1 Programme Support;
3.2 Organisation Development;
3.3 People Training and Empowerment; and
3.4 People Management Practices.
Sub-programme 3.1: Programme support: to provide administrative support to the management of this
programme.
The Chief Directorate Organisation Development has an integrated but dual focus. It refers to ensuring that
both service excellence (performance) and employee engagement (satisfaction) are achieved, since
one cannot be achieved without the other.
Through our integrated effort, we endeavour to enable solutions that make it possible for the Western Cape
Government to serve the people of the Western Cape as effectively, efficiently and economically as
possible with the available resources and within the organisation’s strategic framework. The Chief
Directorate therefore strives to support the enabling of continuous organisational capability improvement.
The role of the Chief Directorate: Organisation Development is to enable improvements in organisational
effectiveness through planned interventions with departments and thereby contributing to improving the
service delivery capability of the Western Cape Government. This cycle saw the initiation of work to define
and validate the desired WCG Capabilities – this will continue during the 2019/2020 cycle and will be
integrated with the Provincial planning process. The vision of the Chief Directorate is to become a strategic
business partner to our clients and through that relationship, contribute through co-created solutions to
enhancing the service delivery capability of the Western Cape Government. The Chief Directorate
embarked on a realignment process with the aim of ensuring that it’s design (process, structure, culture) is
aligned to deliver the stated vision. Focus is being applied in building the required functional (processes,
practices, structure), talent (competency development) and cultural capacities within the Chief
Directorate. Substantial work was done in this regard and it is foreseen that this will be finalised by the end
of the 2019/2020 financial year. The Chief Directorate Organisation Development is built on three
foundations: Organisation Design, Process Design and Improvement and Organisational Behaviour.
Organisation design interventions of varying focus and scope are conducted as part of a continuous
process of assessing and adapting departments to evolving internal and external environmental
requirements and challenges, such as statutory and strategic mandates, client needs and expectations,
fiscal constraints and information and communication technology advancements.
From the Directorate Organisation Design’s perspective, work organisation represents a key executive
responsibility that profoundly impacts on the Western Cape Government’s ability to successfully execute
its constitutional, legislative, electoral and core strategic mandates. As such, organisation design
represents the beginning of the people management value chain. Public institutions with their people need
to deliver diverse services, and they do so by applying a vast array of specialised skills. To deliver all these
services in a coordinated and controlled manner that gives the best value for money, people’s work must
be structured and grouped together in a manner that, first, optimises their efforts into meaningful service
delivery outcomes; and that, second, contributes to good governance by allocating horizontal and
vertical responsibility and accountability for service delivery in the institution. In addition, people’s work also
needs to be designed in a manner that creates a work environment that is conducive to optimal
performance. To ensure that such services can be rendered effectively and efficiently, organisation design
aligns organisational structures, post establishments, jobs, job grading, processes and systems with the
70 DOTP ANNUAL REPORT FOR 2019/2020
strategy of the Western Cape Government, as well as with human factors that determine individual
engagement. The Directorate Organisation Design therefore enables purposeful and meaningful work. The
Job Design Project plays a vital role in this regard and a meaningful collaboration has been established
with DPSA to facilitate greater understanding and clarity regarding accountabilities across the various
levels in the WCG.
Infinite societal needs and finite resources require the Western Cape Government to work smarter, i.e. to
do more with less. In essence, this is what the Directorate Process Design and Improvement focuses on. The
Directorate supports individuals, teams, departments and the Western Cape Government as a whole to
perform optimally by optimising work processes and creating systems to manage and continuously
improve the way people do their work and deliver services. Government is highly regulated and thus by
nature tends towards bureaucracy. Bureaucratic systems can become painfully inefficient. Inefficient
bureaucracies lead to wastage of time and money, as well as to wide-ranging frustration of our people
(employees and citizens). It therefore has a negative psychological impact on people in general, and
especially on the motivation and productivity of employees. Process design and improvement, therefore,
has an extremely important role to fulfil in supporting people to work smarter and make government more
efficient. The Directorate Process Design and Improvement therefore enables people to work smarter and
deliver services more efficiently.
The Directorate Organisational Behaviour aims to foster a productive work environment in the Western
Cape Government by applying the principles of positive psychology that enable employees to flourish and
perform optimally in the workplace. The Directorate plays a leading role in ensuring that the work-related
behaviours of employees and leaders of Western Cape Government fit, change and adapt in
accordance with the strategic requirements of the organisation. The achievement of organisational goals
is supported by focussing on an integrated approach to organisational culture and values, specifically
related to leadership behaviour, team effectiveness, person-job/organisational fit, engagement
(productivity, morale, quality of work life, motivation), resilience, wellbeing as well as to respond to and
navigate change. The work done on the Values-based Leadership Development Programme (VBLDP) and
the Change Capability project has been instrumental in defining and supporting the development of the
desired WORK culture within the WCG. The Directorate Organisation Behaviour therefore enables
productive service delivery behaviours and the wellbeing of the Western Cape Government’s employees.
Organisation Development services are demand driven and the delivery of services are responsive to the
organisation’s needs.
The Chief Directorate: People Training and Empowerment (PTE) ensures people development through the
identification of training needs by designing and offering relevant learning programmes directly or through
appointed service providers. The PTE also plays a broader strategic role in the governance and
management of transversal people development and training in the province, taking into account the
strategic objectives and plans of provincial departments. An exciting approach to design and training
delivery has been embarked upon, leading to new approaches in the way training is delivered in the
Province, e.g. eLearning, utilisation of subject matter experts, the revision of internal processes and
interactive learning, to name a few. Significant strides have been made towards integrating these
innovations into the operational strategies of the Provincial Training Institute (PTI).
The Chief Directorate also conducts training impact assessments on selected learning programmes and
assumes responsibility for the development of Workplace Skills Plans, learnerships, administering the
placement of interns and facilitating the process for awarding bursaries.
The Chief Directorate administers the Premier’s Advancement of Youth (PAY) project. The PAY project is
one of the attempts by the WCG to address the growing youth unemployment and skills challenge in South
Africa. It does this by providing a number of matriculants from the previous year with experiential learning
within the 13 government departments. During the one-year internship, the young people are exposed to
DOTP ANNUAL REPORT FOR 2019/2020 71
skills development programmes and supported through mentorship, coaching and career guidance in
order to make them more marketable and employable. Candidates are recruited from secondary schools
throughout the Western Cape. Much focus is placed on advocacy in community newspapers, community
structures and government platforms like the Cape Access and Thusong Centres, to ensure that as many
matriculants as possible are reached.
The PAY Project will be streamlined and become an integral part of the Chief Directorate rather than a
separate “project”. This will ensure that sufficient time and resources are allocated to this important youth
development initiative. As such, this is one of the indicators that will be reported on annually.
The purpose of the Chief Directorate: People Management Practices is talent attraction and retention.
The Chief Directorate has five Directorates. The Directorate Performance and Priority Unit provides an all-
encompassing service with regard to the recruitment of all Heads of Department, SMS members within 11
departments (excluding Health and Education), performance consulting and performance administration.
People managers (line managers) are supported with the management of poor performance and
incapacity.
Apart from the coordination and integration role, the Directorate: Policy and Planning provides critical
policy interpretations, policy updates, employment equity planning, reporting, workforce plans and
monthly management information. People metrics and intelligence contribute and inform timeous and
appropriate decision making by heads of departments and people managers (line managers). Within the
Directorate: Policy and Planning, a capability has been established within the Provincial Biz Suite to gather
and store a plethora of people management-related data sets, which will enable the automation of a
number of data-reliant products in the ensuing year. Progress has also been made with the establishment
of case management capabilities in most functional areas in the branch. Client departments are already
served with much improved analyses reports, situational reports and profile reports to assist them with their
people management-related strategic planning.
The Directorate: Recruitment and Selection plays a critical role in talent acquisition and management of
the 11 departments (excluding Health and Education) and has embarked on research on values-based
recruitment practices to further enhance the principle of person/job fit – the selection of persons with the
right skill sets, competencies and attitude to ensure recruitment and retention of people who are citizen–
centred, approachable, determined to overcome challenges, professional and competent at what they
do, and passionate in their desire to serve.
The Directorate: Employee Relations manage and coordinate Collective Bargaining – as well as Individual
matters, which include misconduct cases, disputes and grievances. A dedicated panel of presiding
officers assist in improving timelines for dealing with disciplinary cases while training interventions improve
the capacity of people managers (line managers) to deal with labour issues proactively.
The Directorate: Service Benefits manages all service conditions inclusive of Injury on Duty, Terminations,
Employee Benefits as well as all Leave matters. The Internal Control Unit, in collaboration with the various
Directorates and client departments, seeks to ensure clean audits for people management practices.
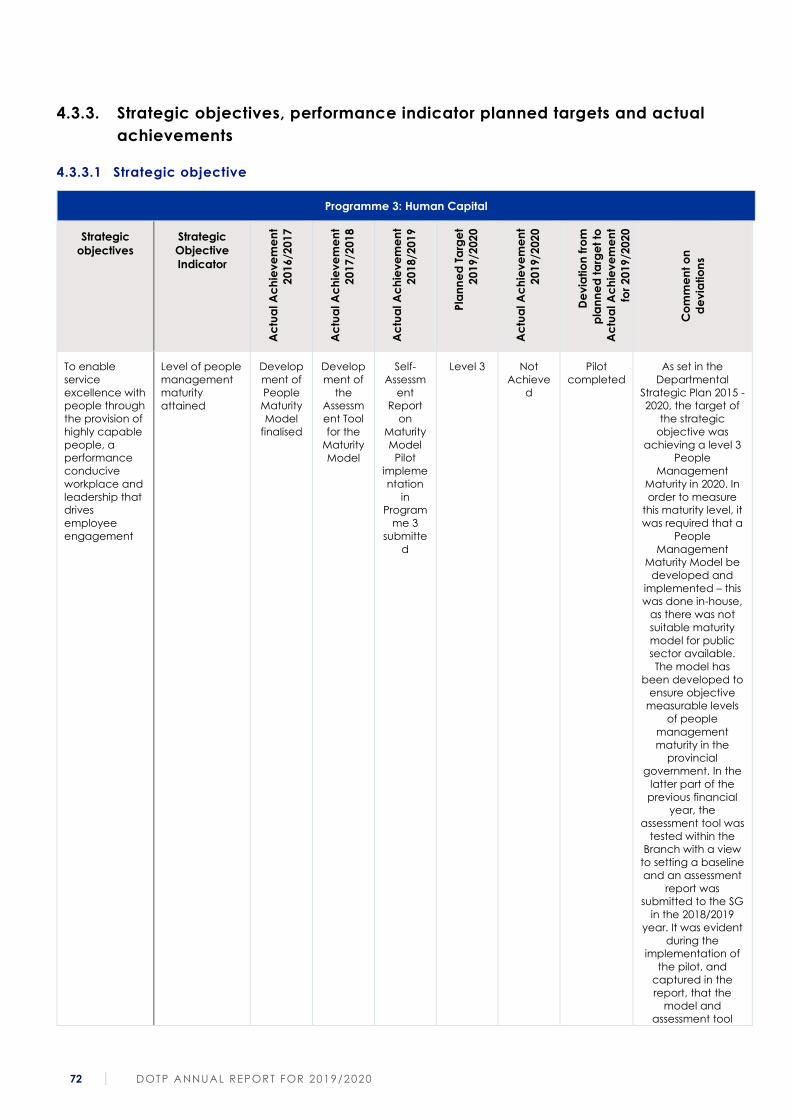
72 DOTP ANNUAL REPORT FOR 2019/2020
4.3.3. Strategic objectives, performance indicator planned targets and actual
achievements
4.3.3.1 Strategic objective
Programme 3: Human Capital
Strategic
objectives
Strategic
Objective
Indicator A
ctu
al A
ch
iev
em
en
t
20
16/2
01
7
Ac
tua
l A
ch
iev
em
en
t
20
17/2
01
8
Ac
tua
l A
ch
iev
em
en
t
20
18/2
01
9
Pla
nn
ed
Ta
rge
t
20
19/2
02
0
Ac
tua
l A
ch
iev
em
en
t
20
19/2
02
0
De
via
tio
n f
rom
pla
nn
ed
ta
rge
t to
Ac
tua
l A
ch
iev
em
en
t
for
20
19
/20
20
Co
mm
en
t o
n
de
via
tio
ns
To enable
service
excellence with
people through
the provision of
highly capable
people, a
performance
conducive
workplace and
leadership that
drives
employee
engagement
Level of people
management
maturity
attained
Develop
ment of
People
Maturity
Model
finalised
Develop
ment of
the
Assessm
ent Tool
for the
Maturity
Model
Self-
Assessm
ent
Report
on
Maturity
Model
Pilot
impleme
ntation
in
Program
me 3
submitte
d
Level 3 Not
Achieve
d
Pilot
completed
As set in the
Departmental
Strategic Plan 2015 -
2020, the target of
the strategic
objective was
achieving a level 3
People
Management
Maturity in 2020. In
order to measure
this maturity level, it
was required that a
People
Management
Maturity Model be
developed and
implemented – this
was done in-house,
as there was not
suitable maturity
model for public
sector available.
The model has
been developed to
ensure objective
measurable levels
of people
management
maturity in the
provincial
government. In the
latter part of the
previous financial
year, the
assessment tool was
tested within the
Branch with a view
to setting a baseline
and an assessment
report was
submitted to the SG
in the 2018/2019
year. It was evident
during the
implementation of
the pilot, and
captured in the
report, that the
model and
assessment tool
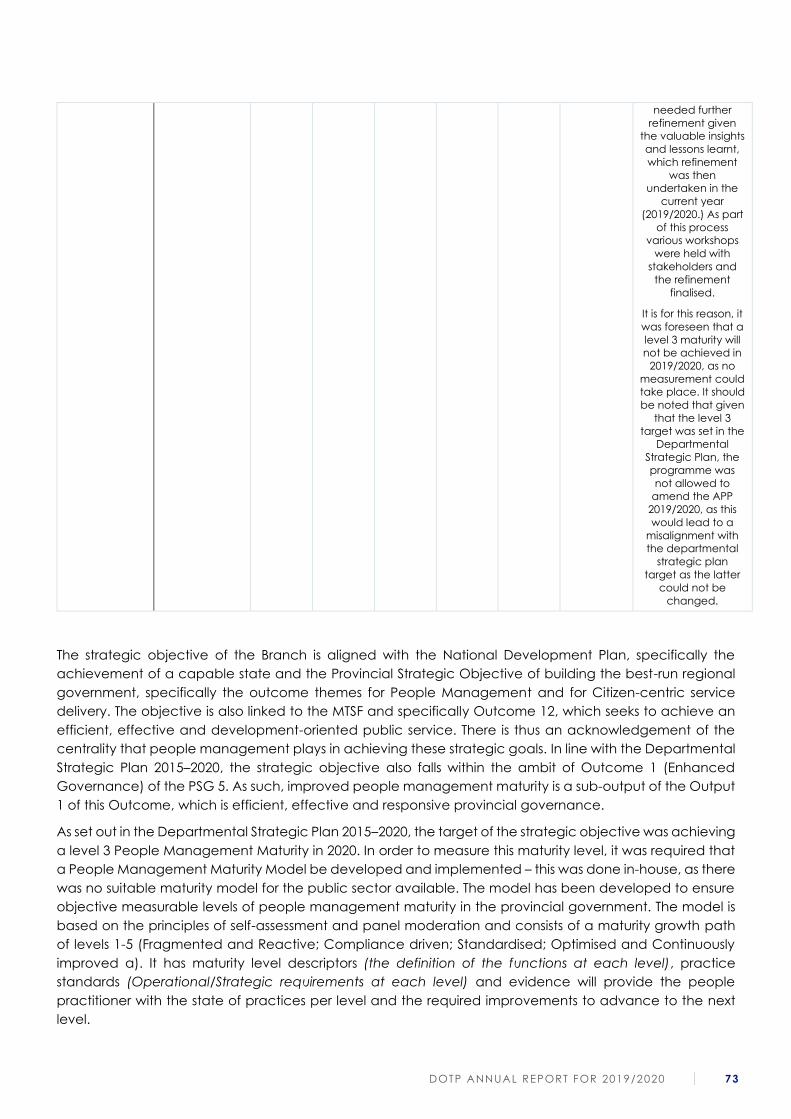
DOTP ANNUAL REPORT FOR 2019/2020 73
needed further
refinement given
the valuable insights
and lessons learnt,
which refinement
was then
undertaken in the
current year
(2019/2020.) As part
of this process
various workshops
were held with
stakeholders and
the refinement
finalised.
It is for this reason, it
was foreseen that a
level 3 maturity will
not be achieved in
2019/2020, as no
measurement could
take place. It should
be noted that given
that the level 3
target was set in the
Departmental
Strategic Plan, the
programme was
not allowed to
amend the APP
2019/2020, as this
would lead to a
misalignment with
the departmental
strategic plan
target as the latter
could not be
changed.
The strategic objective of the Branch is aligned with the National Development Plan, specifically the
achievement of a capable state and the Provincial Strategic Objective of building the best-run regional
government, specifically the outcome themes for People Management and for Citizen-centric service
delivery. The objective is also linked to the MTSF and specifically Outcome 12, which seeks to achieve an
efficient, effective and development-oriented public service. There is thus an acknowledgement of the
centrality that people management plays in achieving these strategic goals. In line with the Departmental
Strategic Plan 2015–2020, the strategic objective also falls within the ambit of Outcome 1 (Enhanced
Governance) of the PSG 5. As such, improved people management maturity is a sub-output of the Output
1 of this Outcome, which is efficient, effective and responsive provincial governance.
As set out in the Departmental Strategic Plan 2015–2020, the target of the strategic objective was achieving
a level 3 People Management Maturity in 2020. In order to measure this maturity level, it was required that
a People Management Maturity Model be developed and implemented – this was done in-house, as there
was no suitable maturity model for the public sector available. The model has been developed to ensure
objective measurable levels of people management maturity in the provincial government. The model is
based on the principles of self-assessment and panel moderation and consists of a maturity growth path
of levels 1-5 (Fragmented and Reactive; Compliance driven; Standardised; Optimised and Continuously
improved a). It has maturity level descriptors (the definition of the functions at each level), practice
standards (Operational/Strategic requirements at each level) and evidence will provide the people
practitioner with the state of practices per level and the required improvements to advance to the next
level.
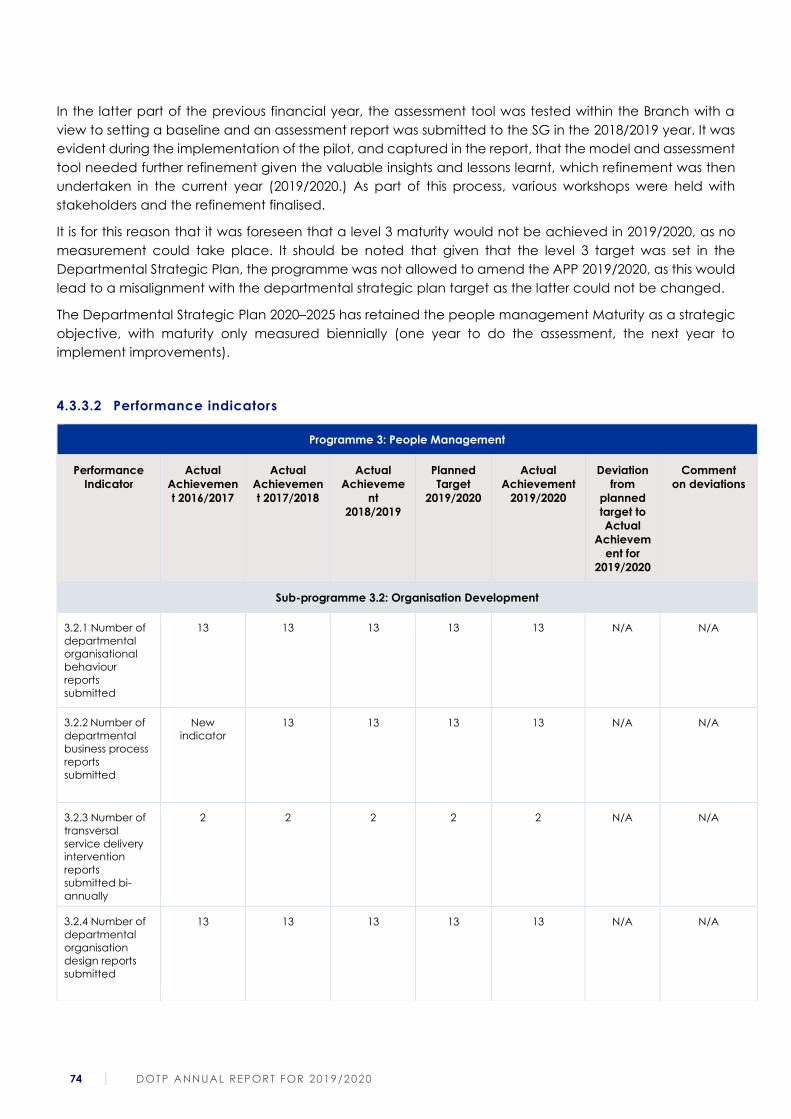
74 DOTP ANNUAL REPORT FOR 2019/2020
In the latter part of the previous financial year, the assessment tool was tested within the Branch with a
view to setting a baseline and an assessment report was submitted to the SG in the 2018/2019 year. It was
evident during the implementation of the pilot, and captured in the report, that the model and assessment
tool needed further refinement given the valuable insights and lessons learnt, which refinement was then
undertaken in the current year (2019/2020.) As part of this process, various workshops were held with
stakeholders and the refinement finalised.
It is for this reason that it was foreseen that a level 3 maturity would not be achieved in 2019/2020, as no
measurement could take place. It should be noted that given that the level 3 target was set in the
Departmental Strategic Plan, the programme was not allowed to amend the APP 2019/2020, as this would
lead to a misalignment with the departmental strategic plan target as the latter could not be changed.
The Departmental Strategic Plan 2020–2025 has retained the people management Maturity as a strategic
objective, with maturity only measured biennially (one year to do the assessment, the next year to
implement improvements).
4.3.3.2 Performance indicators
Programme 3: People Management
Performance
Indicator
Actual
Achievemen
t 2016/2017
Actual
Achievemen
t 2017/2018
Actual
Achieveme
nt
2018/2019
Planned
Target
2019/2020
Actual
Achievement
2019/2020
Deviation
from
planned
target to
Actual
Achievem
ent for
2019/2020
Comment
on deviations
Sub-programme 3.2: Organisation Development
3.2.1 Number of
departmental
organisational
behaviour
reports
submitted
13 13 13 13 13 N/A N/A
3.2.2 Number of
departmental
business process
reports
submitted
New
indicator
13 13 13 13 N/A N/A
3.2.3 Number of
transversal
service delivery
intervention
reports
submitted bi-
annually
2 2 2 2 2 N/A N/A
3.2.4 Number of
departmental
organisation
design reports
submitted
13 13 13 13 13 N/A N/A

DOTP ANNUAL REPORT FOR 2019/2020 75
Sub-programme 3.3: People Training and Empowerment
3.3.1 Number of
learning
programmes
offered.
51 57 50 50 60 10 The annual
target of 50 has
been
exceeded by
10, due to the
offering of
additional
learning
programmes
on special
request from
client
departments
and
municipalities.
3.3.2 Number of
learning
programmes
assessed for
training impact.
8 8 9 8 8 N/A N/A
3.3.3 Number of
Projects for
Youth
Empowerment
offered
1 1 1 1 1 N/A N/A
Sub-programme 3.4: People Management Practices
3.4.1 Percentage
of planned
strategic
business
partnership
initiatives
completed.
95.24%
Numerator:
40
Denominator
: 42
92.55%
Numerator:
87
Denominator
: 94
99%
Numerator:
106
Denominator
: 107
90% 84.%
Numerator:
83
Denominator:
99
6% Some
Workforce
Plans, People
Planners and EE
plans could not
be signed off
by 31 March
2020 due to the
HOD's and their
management
teams’
involvement in
the COVID-19
pandemic.
3.4.2 Percentage
planned
innovative
people
practices
initiatives
completed.
88.89%
Numerator:
8
Denominator
: 9
90%
Numerator:
9
Denominator
: 10
94%
Numerator:
16
Denominator
: 17
85% 100%
Numerator:
7
Denominator:
7
15% Focus on
Business plan
implementation
as it reflects in
performance
agreements
3.4.3 Percentage
planned
transactional
excellence
initiatives
completed.
91.66%
Numerator:
22
Denominator
: 24
83.87%
Numerator:
26
Denominator
: 31
84%
Numerator:
42
Denominator
: 50
85% 92%
Numerator:
158
Denominator:
172
7% Focus on
Business plan
implementation
as it reflects in
performance
agreements
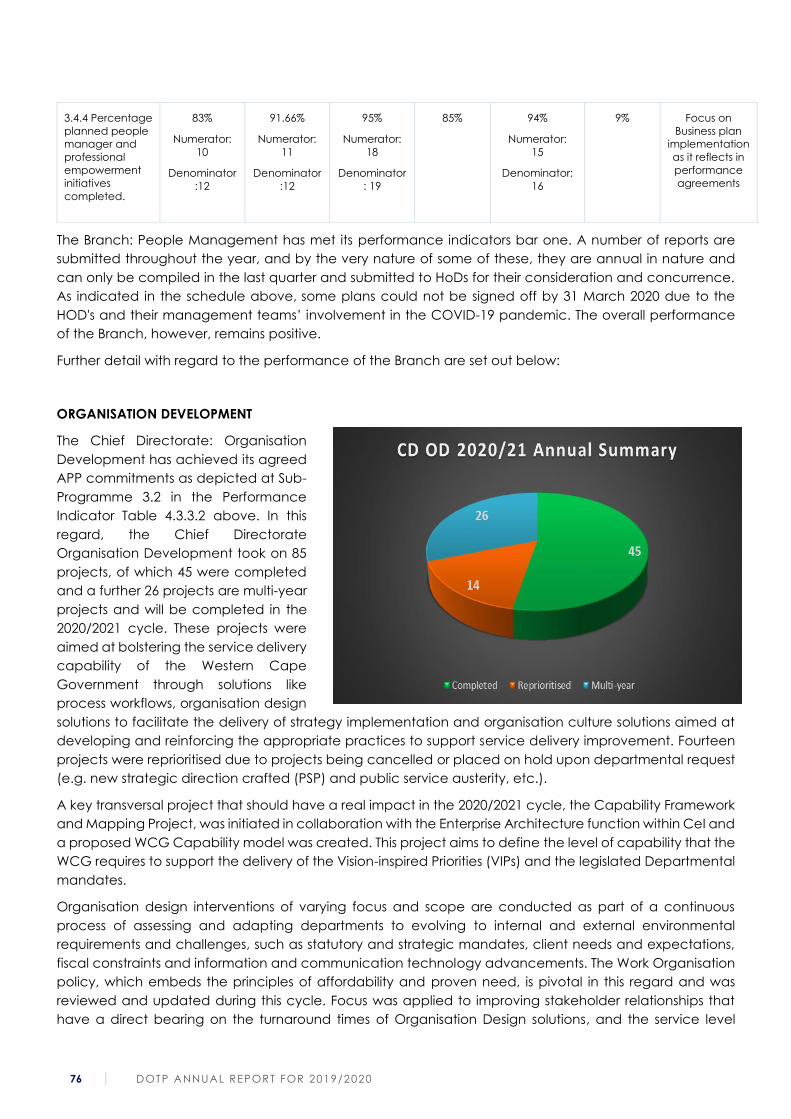
76 DOTP ANNUAL REPORT FOR 2019/2020
The Branch: People Management has met its performance indicators bar one. A number of reports are
submitted throughout the year, and by the very nature of some of these, they are annual in nature and
can only be compiled in the last quarter and submitted to HoDs for their consideration and concurrence.
As indicated in the schedule above, some plans could not be signed off by 31 March 2020 due to the
HOD's and their management teams’ involvement in the COVID-19 pandemic. The overall performance
of the Branch, however, remains positive.
Further detail with regard to the performance of the Branch are set out below:
ORGANISATION DEVELOPMENT
The Chief Directorate: Organisation
Development has achieved its agreed
APP commitments as depicted at Sub-
Programme 3.2 in the Performance
Indicator Table 4.3.3.2 above. In this
regard, the Chief Directorate
Organisation Development took on 85
projects, of which 45 were completed
and a further 26 projects are multi-year
projects and will be completed in the
2020/2021 cycle. These projects were
aimed at bolstering the service delivery
capability of the Western Cape
Government through solutions like
process workflows, organisation design
solutions to facilitate the delivery of strategy implementation and organisation culture solutions aimed at
developing and reinforcing the appropriate practices to support service delivery improvement. Fourteen
projects were reprioritised due to projects being cancelled or placed on hold upon departmental request
(e.g. new strategic direction crafted (PSP) and public service austerity, etc.).
A key transversal project that should have a real impact in the 2020/2021 cycle, the Capability Framework
and Mapping Project, was initiated in collaboration with the Enterprise Architecture function within CeI and
a proposed WCG Capability model was created. This project aims to define the level of capability that the
WCG requires to support the delivery of the Vision-inspired Priorities (VIPs) and the legislated Departmental
mandates.
Organisation design interventions of varying focus and scope are conducted as part of a continuous
process of assessing and adapting departments to evolving to internal and external environmental
requirements and challenges, such as statutory and strategic mandates, client needs and expectations,
fiscal constraints and information and communication technology advancements. The Work Organisation
policy, which embeds the principles of affordability and proven need, is pivotal in this regard and was
reviewed and updated during this cycle. Focus was applied to improving stakeholder relationships that
have a direct bearing on the turnaround times of Organisation Design solutions, and the service level
3.4.4 Percentage
planned people
manager and
professional
empowerment
initiatives
completed.
83%
Numerator:
10
Denominator
:12
91.66%
Numerator:
11
Denominator
:12
95%
Numerator:
18
Denominator
: 19
85% 94%
Numerator:
15
Denominator:
16
9% Focus on
Business plan
implementation
as it reflects in
performance
agreements
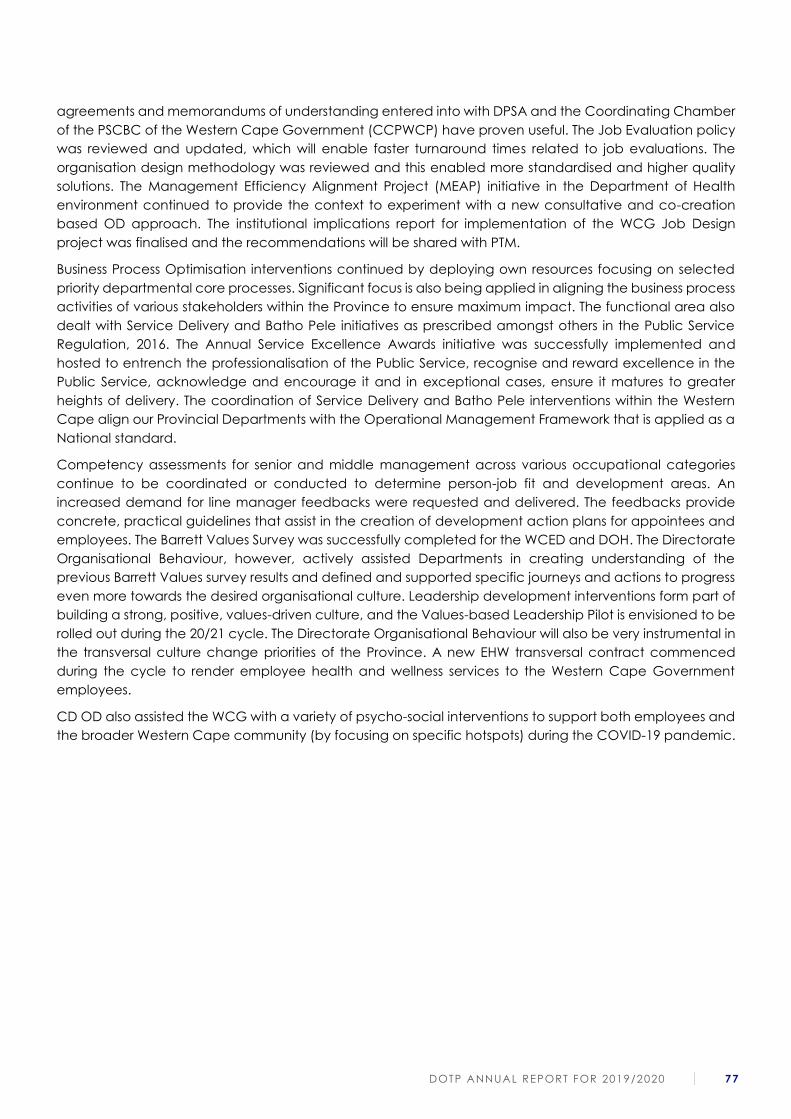
DOTP ANNUAL REPORT FOR 2019/2020 77
agreements and memorandums of understanding entered into with DPSA and the Coordinating Chamber
of the PSCBC of the Western Cape Government (CCPWCP) have proven useful. The Job Evaluation policy
was reviewed and updated, which will enable faster turnaround times related to job evaluations. The
organisation design methodology was reviewed and this enabled more standardised and higher quality
solutions. The Management Efficiency Alignment Project (MEAP) initiative in the Department of Health
environment continued to provide the context to experiment with a new consultative and co-creation
based OD approach. The institutional implications report for implementation of the WCG Job Design
project was finalised and the recommendations will be shared with PTM.
Business Process Optimisation interventions continued by deploying own resources focusing on selected
priority departmental core processes. Significant focus is also being applied in aligning the business process
activities of various stakeholders within the Province to ensure maximum impact. The functional area also
dealt with Service Delivery and Batho Pele initiatives as prescribed amongst others in the Public Service
Regulation, 2016. The Annual Service Excellence Awards initiative was successfully implemented and
hosted to entrench the professionalisation of the Public Service, recognise and reward excellence in the
Public Service, acknowledge and encourage it and in exceptional cases, ensure it matures to greater
heights of delivery. The coordination of Service Delivery and Batho Pele interventions within the Western
Cape align our Provincial Departments with the Operational Management Framework that is applied as a
National standard.
Competency assessments for senior and middle management across various occupational categories
continue to be coordinated or conducted to determine person-job fit and development areas. An
increased demand for line manager feedbacks were requested and delivered. The feedbacks provide
concrete, practical guidelines that assist in the creation of development action plans for appointees and
employees. The Barrett Values Survey was successfully completed for the WCED and DOH. The Directorate
Organisational Behaviour, however, actively assisted Departments in creating understanding of the
previous Barrett Values survey results and defined and supported specific journeys and actions to progress
even more towards the desired organisational culture. Leadership development interventions form part of
building a strong, positive, values-driven culture, and the Values-based Leadership Pilot is envisioned to be
rolled out during the 20/21 cycle. The Directorate Organisational Behaviour will also be very instrumental in
the transversal culture change priorities of the Province. A new EHW transversal contract commenced
during the cycle to render employee health and wellness services to the Western Cape Government
employees.
CD OD also assisted the WCG with a variety of psycho-social interventions to support both employees and
the broader Western Cape community (by focusing on specific hotspots) during the COVID-19 pandemic.
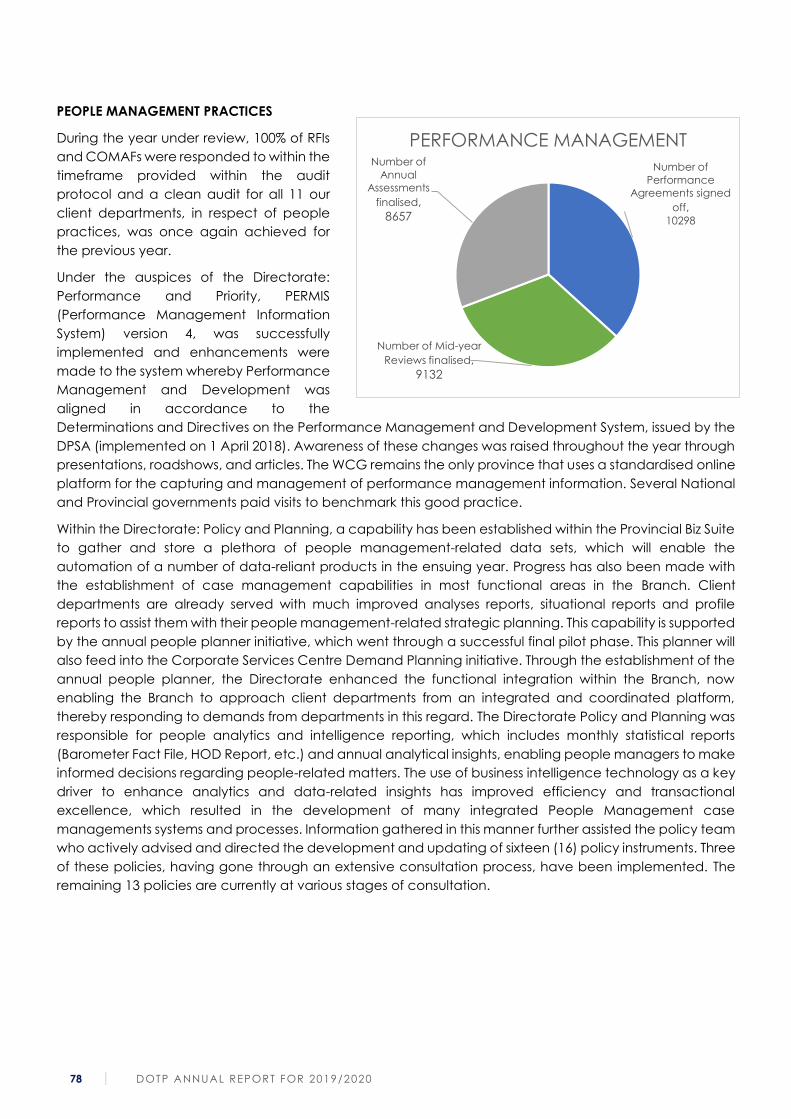
78 DOTP ANNUAL REPORT FOR 2019/2020
PEOPLE MANAGEMENT PRACTICES
During the year under review, 100% of RFIs
and COMAFs were responded to within the
timeframe provided within the audit
protocol and a clean audit for all 11 our
client departments, in respect of people
practices, was once again achieved for
the previous year.
Under the auspices of the Directorate:
Performance and Priority, PERMIS
(Performance Management Information
System) version 4, was successfully
implemented and enhancements were
made to the system whereby Performance
Management and Development was
aligned in accordance to the
Determinations and Directives on the Performance Management and Development System, issued by the
DPSA (implemented on 1 April 2018). Awareness of these changes was raised throughout the year through
presentations, roadshows, and articles. The WCG remains the only province that uses a standardised online
platform for the capturing and management of performance management information. Several National
and Provincial governments paid visits to benchmark this good practice.
Within the Directorate: Policy and Planning, a capability has been established within the Provincial Biz Suite
to gather and store a plethora of people management-related data sets, which will enable the
automation of a number of data-reliant products in the ensuing year. Progress has also been made with
the establishment of case management capabilities in most functional areas in the Branch. Client
departments are already served with much improved analyses reports, situational reports and profile
reports to assist them with their people management-related strategic planning. This capability is supported
by the annual people planner initiative, which went through a successful final pilot phase. This planner will
also feed into the Corporate Services Centre Demand Planning initiative. Through the establishment of the
annual people planner, the Directorate enhanced the functional integration within the Branch, now
enabling the Branch to approach client departments from an integrated and coordinated platform,
thereby responding to demands from departments in this regard. The Directorate Policy and Planning was
responsible for people analytics and intelligence reporting, which includes monthly statistical reports
(Barometer Fact File, HOD Report, etc.) and annual analytical insights, enabling people managers to make
informed decisions regarding people-related matters. The use of business intelligence technology as a key
driver to enhance analytics and data-related insights has improved efficiency and transactional
excellence, which resulted in the development of many integrated People Management case
managements systems and processes. Information gathered in this manner further assisted the policy team
who actively advised and directed the development and updating of sixteen (16) policy instruments. Three
of these policies, having gone through an extensive consultation process, have been implemented. The
remaining 13 policies are currently at various stages of consultation.
Number of
Performance
Agreements signed
off, 10298
Number of Mid-year
Reviews finalised,
9132
Number of
Annual
Assessments
finalised,
8657
PERFORMANCE MANAGEMENT
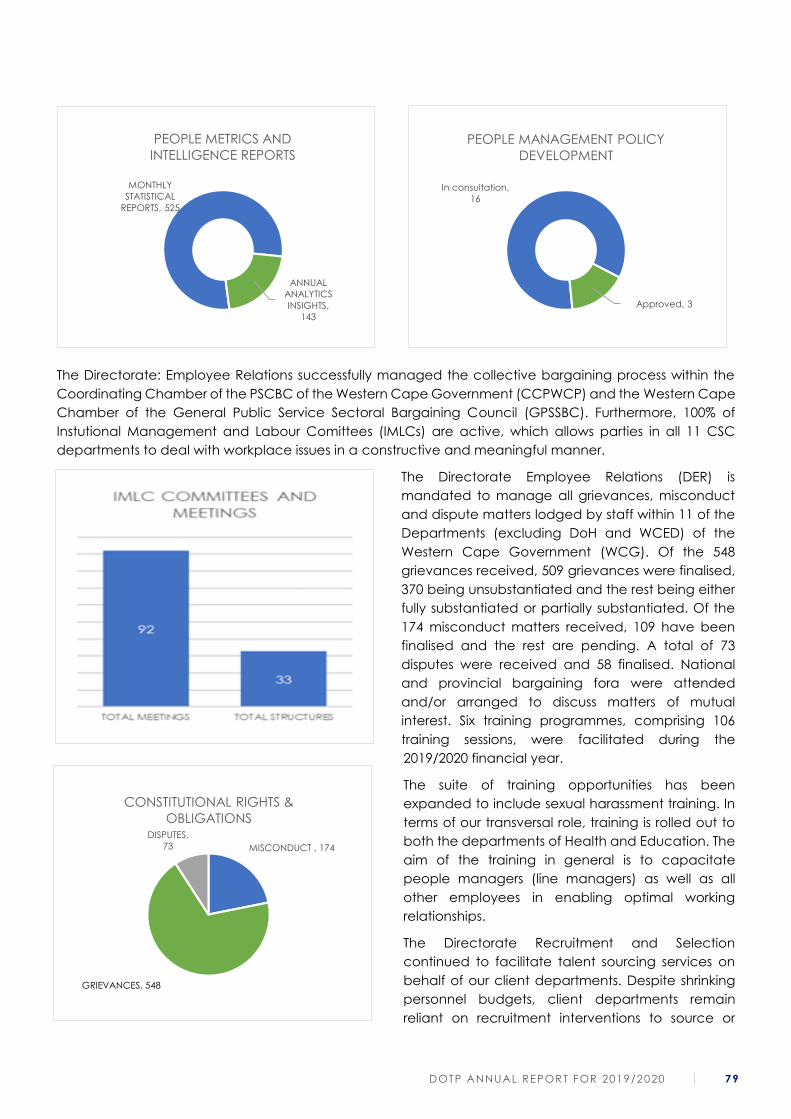
DOTP ANNUAL REPORT FOR 2019/2020 79
MISCONDUCT , 174
GRIEVANC
ES , 548
DISPUTES,
73
CONSTITUTIONAL RIGHTS &
OBLIGATIONS
In consultation,
16
Approved, 3
PEOPLE MANAGEMENT POLICY
DEVELOPMENT
MONTHLY
STATISTICAL
REPORTS, 525
ANNUAL
ANALYTICS
INSIGHTS,
143
PEOPLE METRICS AND
INTELLIGENCE REPORTS
The Directorate: Employee Relations successfully managed the collective bargaining process within the
Coordinating Chamber of the PSCBC of the Western Cape Government (CCPWCP) and the Western Cape
Chamber of the General Public Service Sectoral Bargaining Council (GPSSBC). Furthermore, 100% of
Instutional Management and Labour Comittees (IMLCs) are active, which allows parties in all 11 CSC
departments to deal with workplace issues in a constructive and meaningful manner.
The Directorate Employee Relations (DER) is
mandated to manage all grievances, misconduct
and dispute matters lodged by staff within 11 of the
Departments (excluding DoH and WCED) of the
Western Cape Government (WCG). Of the 548
grievances received, 509 grievances were finalised,
370 being unsubstantiated and the rest being either
fully substantiated or partially substantiated. Of the
174 misconduct matters received, 109 have been
finalised and the rest are pending. A total of 73
disputes were received and 58 finalised. National
and provincial bargaining fora were attended
and/or arranged to discuss matters of mutual
interest. Six training programmes, comprising 106
training sessions, were facilitated during the
2019/2020 financial year.
The suite of training opportunities has been
expanded to include sexual harassment training. In
terms of our transversal role, training is rolled out to
both the departments of Health and Education. The
aim of the training in general is to capacitate
people managers (line managers) as well as all
other employees in enabling optimal working
relationships.
The Directorate Recruitment and Selection
continued to facilitate talent sourcing services on
behalf of our client departments. Despite shrinking
personnel budgets, client departments remain
reliant on recruitment interventions to source or
GRIEVANCES, 548
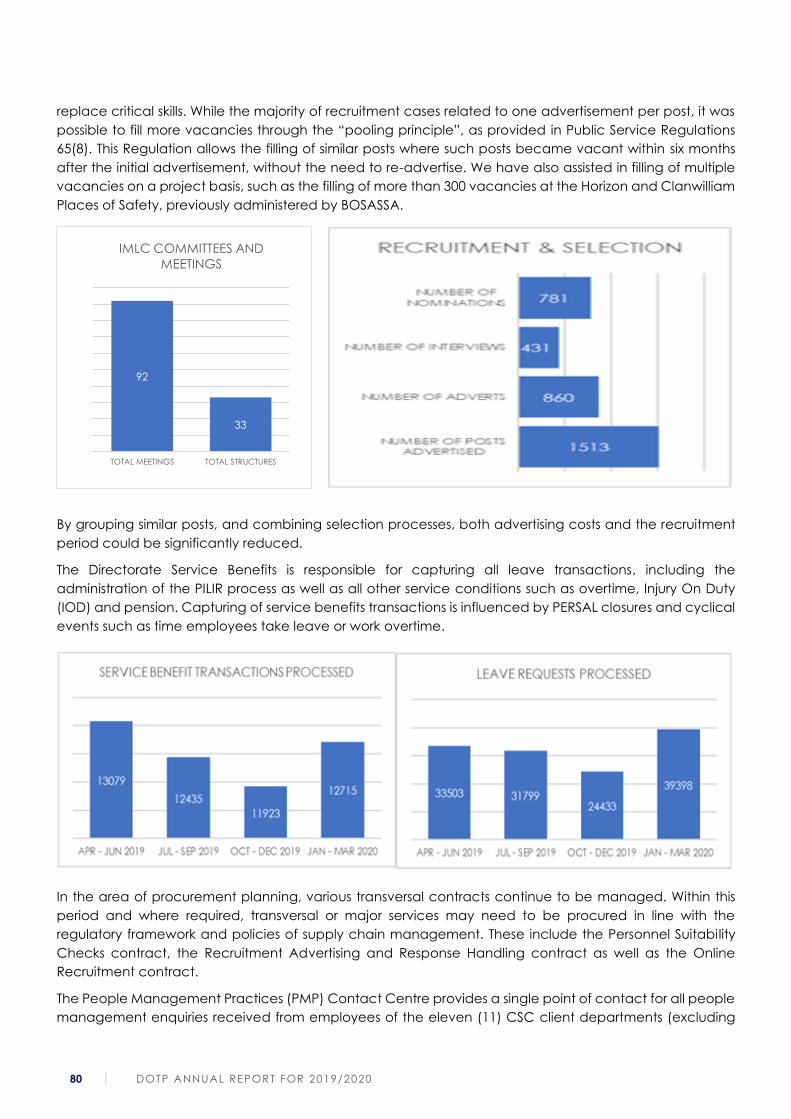
80 DOTP ANNUAL REPORT FOR 2019/2020
92
33
TOTAL MEETINGS TOTAL STRUCTURES
IMLC COMMITTEES AND
MEETINGS
replace critical skills. While the majority of recruitment cases related to one advertisement per post, it was
possible to fill more vacancies through the “pooling principle”, as provided in Public Service Regulations
65(8). This Regulation allows the filling of similar posts where such posts became vacant within six months
after the initial advertisement, without the need to re-advertise. We have also assisted in filling of multiple
vacancies on a project basis, such as the filling of more than 300 vacancies at the Horizon and Clanwilliam
Places of Safety, previously administered by BOSASSA.
By grouping similar posts, and combining selection processes, both advertising costs and the recruitment
period could be significantly reduced.
The Directorate Service Benefits is responsible for capturing all leave transactions, including the
administration of the PILIR process as well as all other service conditions such as overtime, Injury On Duty
(IOD) and pension. Capturing of service benefits transactions is influenced by PERSAL closures and cyclical
events such as time employees take leave or work overtime.
In the area of procurement planning, various transversal contracts continue to be managed. Within this
period and where required, transversal or major services may need to be procured in line with the
regulatory framework and policies of supply chain management. These include the Personnel Suitability
Checks contract, the Recruitment Advertising and Response Handling contract as well as the Online
Recruitment contract.
The People Management Practices (PMP) Contact Centre provides a single point of contact for all people
management enquiries received from employees of the eleven (11) CSC client departments (excluding
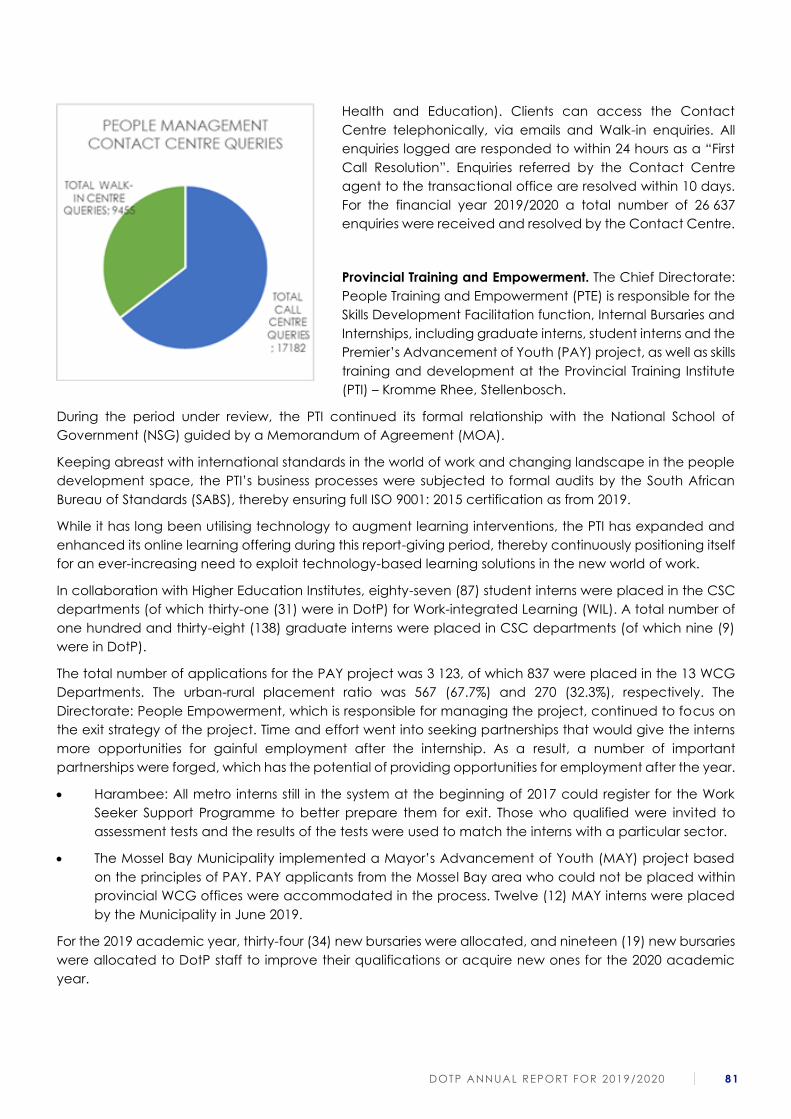
DOTP ANNUAL REPORT FOR 2019/2020 81
Health and Education). Clients can access the Contact
Centre telephonically, via emails and Walk-in enquiries. All
enquiries logged are responded to within 24 hours as a “First
Call Resolution”. Enquiries referred by the Contact Centre
agent to the transactional office are resolved within 10 days.
For the financial year 2019/2020 a total number of 26 637
enquiries were received and resolved by the Contact Centre.
Provincial Training and Empowerment. The Chief Directorate:
People Training and Empowerment (PTE) is responsible for the
Skills Development Facilitation function, Internal Bursaries and
Internships, including graduate interns, student interns and the
Premier’s Advancement of Youth (PAY) project, as well as skills
training and development at the Provincial Training Institute
(PTI) – Kromme Rhee, Stellenbosch.
During the period under review, the PTI continued its formal relationship with the National School of
Government (NSG) guided by a Memorandum of Agreement (MOA).
Keeping abreast with international standards in the world of work and changing landscape in the people
development space, the PTI’s business processes were subjected to formal audits by the South African
Bureau of Standards (SABS), thereby ensuring full ISO 9001: 2015 certification as from 2019.
While it has long been utilising technology to augment learning interventions, the PTI has expanded and
enhanced its online learning offering during this report-giving period, thereby continuously positioning itself
for an ever-increasing need to exploit technology-based learning solutions in the new world of work.
In collaboration with Higher Education Institutes, eighty-seven (87) student interns were placed in the CSC
departments (of which thirty-one (31) were in DotP) for Work-integrated Learning (WIL). A total number of
one hundred and thirty-eight (138) graduate interns were placed in CSC departments (of which nine (9)
were in DotP).
The total number of applications for the PAY project was 3 123, of which 837 were placed in the 13 WCG
Departments. The urban-rural placement ratio was 567 (67.7%) and 270 (32.3%), respectively. The
Directorate: People Empowerment, which is responsible for managing the project, continued to focus on
the exit strategy of the project. Time and effort went into seeking partnerships that would give the interns
more opportunities for gainful employment after the internship. As a result, a number of important
partnerships were forged, which has the potential of providing opportunities for employment after the year.
• Harambee: All metro interns still in the system at the beginning of 2017 could register for the Work
Seeker Support Programme to better prepare them for exit. Those who qualified were invited to
assessment tests and the results of the tests were used to match the interns with a particular sector.
• The Mossel Bay Municipality implemented a Mayor’s Advancement of Youth (MAY) project based
on the principles of PAY. PAY applicants from the Mossel Bay area who could not be placed within
provincial WCG offices were accommodated in the process. Twelve (12) MAY interns were placed
by the Municipality in June 2019.
For the 2019 academic year, thirty-four (34) new bursaries were allocated, and nineteen (19) new bursaries
were allocated to DotP staff to improve their qualifications or acquire new ones for the 2020 academic
year.
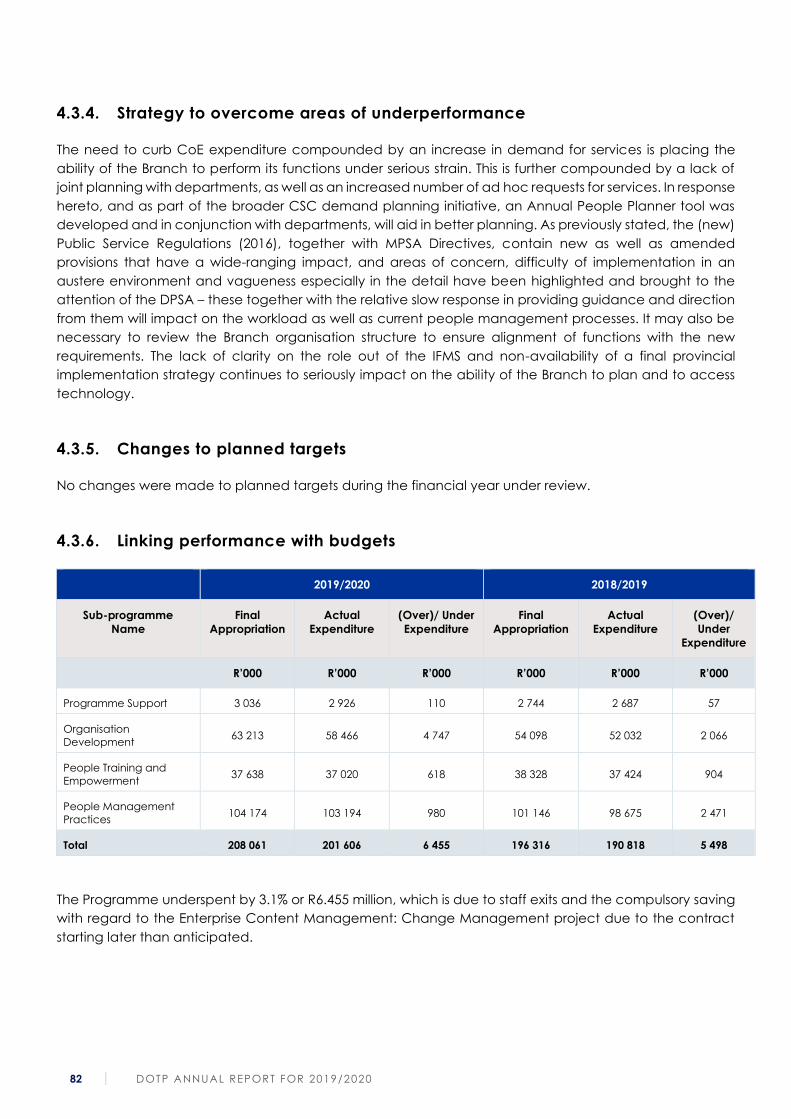
82 DOTP ANNUAL REPORT FOR 2019/2020
4.3.4. Strategy to overcome areas of underperformance
The need to curb CoE expenditure compounded by an increase in demand for services is placing the
ability of the Branch to perform its functions under serious strain. This is further compounded by a lack of
joint planning with departments, as well as an increased number of ad hoc requests for services. In response
hereto, and as part of the broader CSC demand planning initiative, an Annual People Planner tool was
developed and in conjunction with departments, will aid in better planning. As previously stated, the (new)
Public Service Regulations (2016), together with MPSA Directives, contain new as well as amended
provisions that have a wide-ranging impact, and areas of concern, difficulty of implementation in an
austere environment and vagueness especially in the detail have been highlighted and brought to the
attention of the DPSA – these together with the relative slow response in providing guidance and direction
from them will impact on the workload as well as current people management processes. It may also be
necessary to review the Branch organisation structure to ensure alignment of functions with the new
requirements. The lack of clarity on the role out of the IFMS and non-availability of a final provincial
implementation strategy continues to seriously impact on the ability of the Branch to plan and to access
technology.
4.3.5. Changes to planned targets
No changes were made to planned targets during the financial year under review.
4.3.6. Linking performance with budgets
2019/2020 2018/2019
Sub-programme
Name
Final
Appropriation
Actual
Expenditure
(Over)/ Under
Expenditure
Final
Appropriation
Actual
Expenditure
(Over)/
Under
Expenditure
R’000 R’000 R’000 R’000 R’000 R’000
Programme Support 3 036 2 926 110 2 744 2 687 57
Organisation
Development 63 213 58 466 4 747 54 098 52 032 2 066
People Training and
Empowerment 37 638 37 020 618 38 328 37 424 904
People Management
Practices 104 174 103 194 980 101 146 98 675 2 471
Total 208 061 201 606 6 455 196 316 190 818 5 498
The Programme underspent by 3.1% or R6.455 million, which is due to staff exits and the compulsory saving
with regard to the Enterprise Content Management: Change Management project due to the contract
starting later than anticipated.
DOTP ANNUAL REPORT FOR 2019/2020 83
4.4. Programme 4: Centre for e-Innovation
4.4.1. The purpose of the programme
Purpose: To enable service excellence to the people of the Western Cape through ICTs.
The Centre for e-Innovation will drive the optimisation of service delivery in the Western Cape Government
through the coordinated implementation of innovative information and communication technologies,
solutions and services with a focus on the delivery of Broadband connectivity across the Western Cape
Province, provincial transversal applications and major departmental applications and solutions.
The programme contributes to Provincial Strategic Goal 5, which is aimed at enhancing good governance
and specifically improving e-Governance Maturity and Connectivity. The Centre for e-Innovation is also
responsible for Streams 1 and 3 of the Broadband initiative. Stream 1 focuses on connectivity and Stream
3 on transversal applications for improved governance and efficiency.
This programme has linkages with South Africa Connect (South Africa’s Broadband Strategy) as well as the
National Development Plan in respect of contributing towards its vision for the ICT sector.
4.4.2. Sub-programmes
The programme provides for the following functions to be delivered:
Sub-programme 4.1: Programme support: to provide administrative support to the management of this
programme.
Sub-programme 4.2: Strategic ICT Services: renders strategic ICT services to the WCG focusing on planning
and development, the co-ordination of the Corporate Governance of ICTs as well as the e-Government
agenda, which includes the citizen interface.
Sub-programme 4.3: GITO Management Services: provides transversal ICT services to the WCG, which
includes the management of transversal infrastructure, the IT service desk as well as the IT service
management to the Ce-I client Departments. This sub-programme is also responsible for the distributed
computing environment, schools IT, as well as IT Service Management.
Sub-programme 4.4: Connected Government and Infrastructure Services: which is responsible for the
Broadband initiative that provides connectivity to WCG sites and leverages the provincial Broadband
infrastructure to provide limited free public Wi-Fi hotspots for citizens.
Sub-programme 4.5: Transversal Applications Services: which is primarily responsible for Stream 3 of the
Connected Cape initiative, which focuses on transversal applications development, implementation and
support.
Consistent with the Unit’s transversal role in respect of ICTs, the Centre for e-Innovation is responsible for a
number of ICT-related contracts. Amongst other, the Branch is responsible for the management of the
following contracts and service level agreements:
• numerous ICT-related services with the State Information Technology Agency (SITA);
• the Broadband Contract with SITA;
• the Public Wi-Fi Hotspot Agreement;
• the IT Service Desk;
• Business Analysis Services;
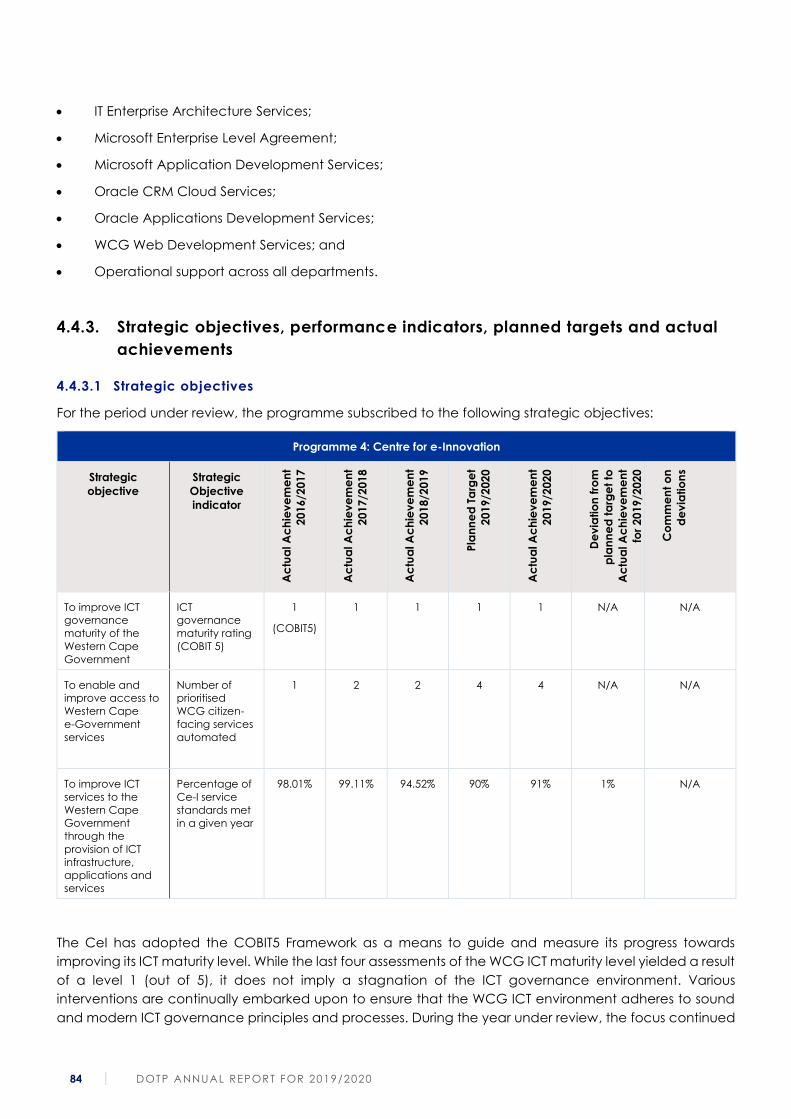
84 DOTP ANNUAL REPORT FOR 2019/2020
• IT Enterprise Architecture Services;
• Microsoft Enterprise Level Agreement;
• Microsoft Application Development Services;
• Oracle CRM Cloud Services;
• Oracle Applications Development Services;
• WCG Web Development Services; and
• Operational support across all departments.
4.4.3. Strategic objectives, performance indicators, planned targets and actual
achievements
4.4.3.1 Strategic objectives
For the period under review, the programme subscribed to the following strategic objectives:
Programme 4: Centre for e-Innovation
Strategic
objective
Strategic
Objective
indicator
Ac
tua
l A
ch
iev
em
en
t
20
16/2
01
7
Ac
tua
l A
ch
iev
em
en
t
20
17/2
01
8
Ac
tua
l A
ch
iev
em
en
t
20
18/2
01
9
Pla
nn
ed
Ta
rge
t
20
19/2
02
0
Ac
tua
l A
ch
iev
em
en
t
20
19/2
02
0
De
via
tio
n f
rom
pla
nn
ed
ta
rge
t to
Ac
tua
l A
ch
iev
em
en
t
for
20
19
/20
20
Co
mm
en
t o
n
de
via
tio
ns
To improve ICT
governance
maturity of the
Western Cape
Government
ICT
governance
maturity rating
(COBIT 5)
1
(COBIT5)
1 1 1 1 N/A N/A
To enable and
improve access to
Western Cape
e-Government
services
Number of
prioritised
WCG citizen-
facing services
automated
1 2 2 4 4 N/A N/A
To improve ICT
services to the
Western Cape
Government
through the
provision of ICT
infrastructure,
applications and
services
Percentage of
Ce-I service
standards met
in a given year
98.01% 99.11% 94.52% 90% 91% 1% N/A
The CeI has adopted the COBIT5 Framework as a means to guide and measure its progress towards
improving its ICT maturity level. While the last four assessments of the WCG ICT maturity level yielded a result
of a level 1 (out of 5), it does not imply a stagnation of the ICT governance environment. Various
interventions are continually embarked upon to ensure that the WCG ICT environment adheres to sound
and modern ICT governance principles and processes. During the year under review, the focus continued
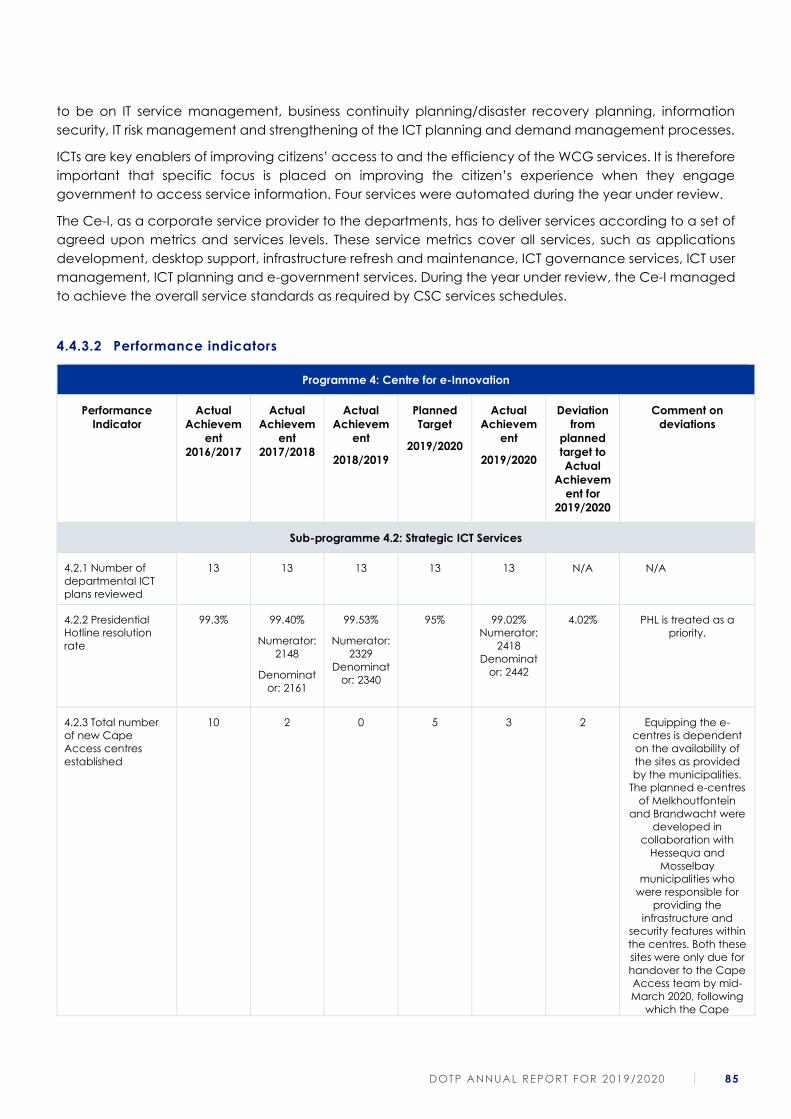
DOTP ANNUAL REPORT FOR 2019/2020 85
to be on IT service management, business continuity planning/disaster recovery planning, information
security, IT risk management and strengthening of the ICT planning and demand management processes.
ICTs are key enablers of improving citizens’ access to and the efficiency of the WCG services. It is therefore
important that specific focus is placed on improving the citizen’s experience when they engage
government to access service information. Four services were automated during the year under review.
The Ce-I, as a corporate service provider to the departments, has to deliver services according to a set of
agreed upon metrics and services levels. These service metrics cover all services, such as applications
development, desktop support, infrastructure refresh and maintenance, ICT governance services, ICT user
management, ICT planning and e-government services. During the year under review, the Ce-I managed
to achieve the overall service standards as required by CSC services schedules.
4.4.3.2 Performance indicators
Programme 4: Centre for e-Innovation
Performance
Indicator
Actual
Achievem
ent
2016/2017
Actual
Achievem
ent
2017/2018
Actual
Achievem
ent
2018/2019
Planned
Target
2019/2020
Actual
Achievem
ent
2019/2020
Deviation
from
planned
target to
Actual
Achievem
ent for
2019/2020
Comment on
deviations
Sub-programme 4.2: Strategic ICT Services
4.2.1 Number of
departmental ICT
plans reviewed
13 13 13 13 13 N/A N/A
4.2.2 Presidential
Hotline resolution
rate
99.3%
99.40%
Numerator:
2148
Denominat
or: 2161
99.53%
Numerator:
2329
Denominat
or: 2340
95% 99.02%
Numerator:
2418
Denominat
or: 2442
4.02% PHL is treated as a
priority.
4.2.3 Total number
of new Cape
Access centres
established
10 2 0 5 3 2 Equipping the e-
centres is dependent
on the availability of
the sites as provided
by the municipalities.
The planned e-centres
of Melkhoutfontein
and Brandwacht were
developed in
collaboration with
Hessequa and
Mosselbay
municipalities who
were responsible for
providing the
infrastructure and
security features within
the centres. Both these
sites were only due for
handover to the Cape
Access team by mid-
March 2020, following
which the Cape
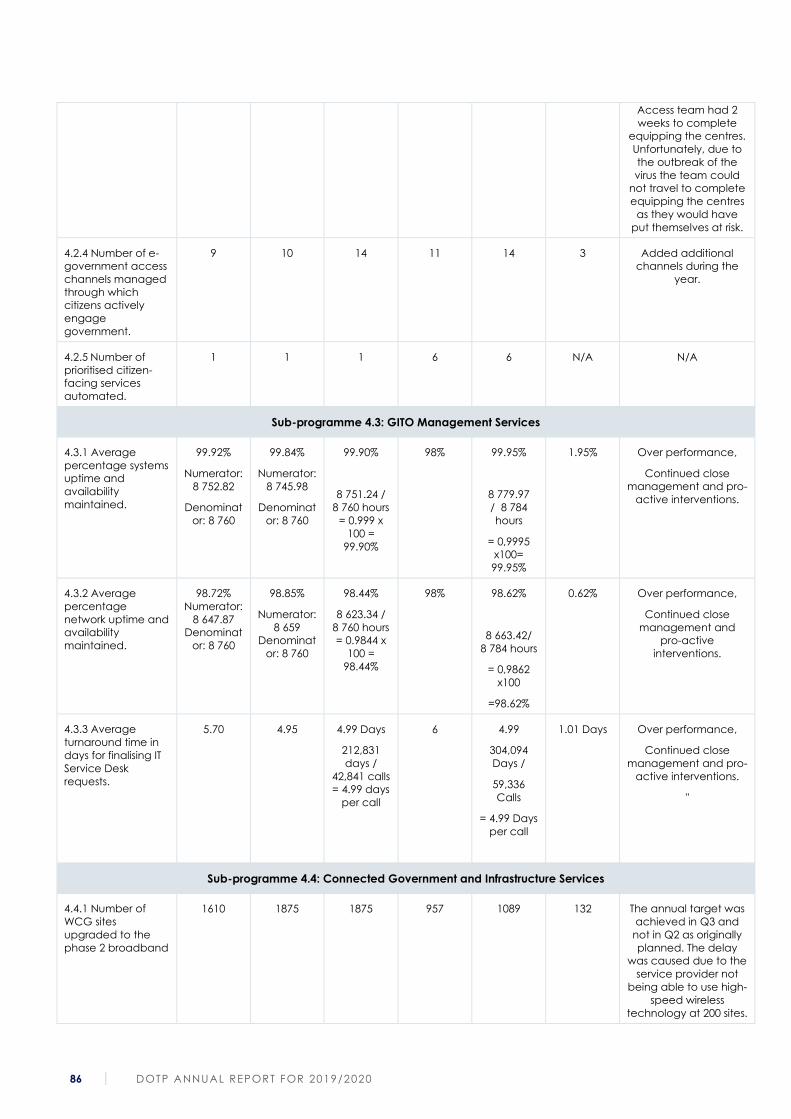
86 DOTP ANNUAL REPORT FOR 2019/2020
Access team had 2
weeks to complete
equipping the centres.
Unfortunately, due to
the outbreak of the
virus the team could
not travel to complete
equipping the centres
as they would have
put themselves at risk.
4.2.4 Number of e-
government access
channels managed
through which
citizens actively
engage
government.
9 10 14 11 14 3 Added additional
channels during the
year.
4.2.5 Number of
prioritised citizen-
facing services
automated.
1 1 1 6 6 N/A N/A
Sub-programme 4.3: GITO Management Services
4.3.1 Average
percentage systems
uptime and
availability
maintained.
99.92%
Numerator:
8 752.82
Denominat
or: 8 760
99.84%
Numerator:
8 745.98
Denominat
or: 8 760
99.90%
8 751.24 /
8 760 hours
= 0.999 x
100 =
99.90%
98% 99.95%
8 779.97
/ 8 784
hours
= 0,9995
x100=
99.95%
1.95% Over performance,
Continued close
management and pro-
active interventions.
4.3.2 Average
percentage
network uptime and
availability
maintained.
98.72%
Numerator:
8 647.87
Denominat
or: 8 760
98.85%
Numerator:
8 659
Denominat
or: 8 760
98.44%
8 623.34 /
8 760 hours
= 0.9844 x
100 =
98.44%
98% 98.62%
8 663.42/
8 784 hours
= 0,9862
x100
=98.62%
0.62% Over performance,
Continued close
management and
pro-active
interventions.
4.3.3 Average
turnaround time in
days for finalising IT
Service Desk
requests.
5.70 4.95 4.99 Days
212,831
days /
42,841 calls
= 4.99 days
per call
6 4.99
304,094
Days /
59,336
Calls
= 4.99 Days
per call
1.01 Days Over performance,
Continued close
management and pro-
active interventions.
"
Sub-programme 4.4: Connected Government and Infrastructure Services
4.4.1 Number of
WCG sites
upgraded to the
phase 2 broadband
1610 1875 1875 957 1089 132 The annual target was
achieved in Q3 and
not in Q2 as originally
planned. The delay
was caused due to the
service provider not
being able to use high-
speed wireless
technology at 200 sites.
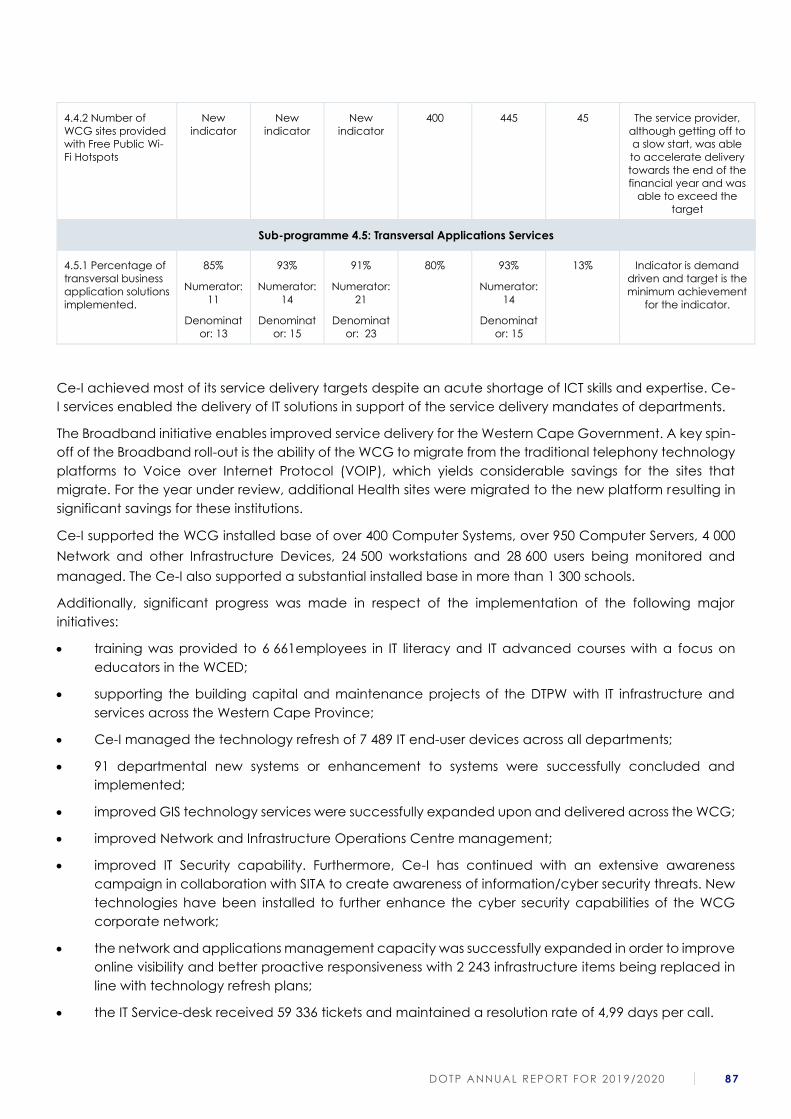
DOTP ANNUAL REPORT FOR 2019/2020 87
4.4.2 Number of
WCG sites provided
with Free Public Wi-
Fi Hotspots
New
indicator
New
indicator
New
indicator
400 445 45 The service provider,
although getting off to
a slow start, was able
to accelerate delivery
towards the end of the
financial year and was
able to exceed the
target
Sub-programme 4.5: Transversal Applications Services
4.5.1 Percentage of
transversal business
application solutions
implemented.
85%
Numerator:
11
Denominat
or: 13
93%
Numerator:
14
Denominat
or: 15
91%
Numerator:
21
Denominat
or: 23
80% 93%
Numerator:
14
Denominat
or: 15
13% Indicator is demand
driven and target is the
minimum achievement
for the indicator.
Ce-I achieved most of its service delivery targets despite an acute shortage of ICT skills and expertise. Ce-
I services enabled the delivery of IT solutions in support of the service delivery mandates of departments.
The Broadband initiative enables improved service delivery for the Western Cape Government. A key spin-
off of the Broadband roll-out is the ability of the WCG to migrate from the traditional telephony technology
platforms to Voice over Internet Protocol (VOIP), which yields considerable savings for the sites that
migrate. For the year under review, additional Health sites were migrated to the new platform resulting in
significant savings for these institutions.
Ce-I supported the WCG installed base of over 400 Computer Systems, over 950 Computer Servers, 4 000
Network and other Infrastructure Devices, 24 500 workstations and 28 600 users being monitored and
managed. The Ce-I also supported a substantial installed base in more than 1 300 schools.
Additionally, significant progress was made in respect of the implementation of the following major
initiatives:
• training was provided to 6 661employees in IT literacy and IT advanced courses with a focus on
educators in the WCED;
• supporting the building capital and maintenance projects of the DTPW with IT infrastructure and
services across the Western Cape Province;
• Ce-I managed the technology refresh of 7 489 IT end-user devices across all departments;
• 91 departmental new systems or enhancement to systems were successfully concluded and
implemented;
• improved GIS technology services were successfully expanded upon and delivered across the WCG;
• improved Network and Infrastructure Operations Centre management;
• improved IT Security capability. Furthermore, Ce-I has continued with an extensive awareness
campaign in collaboration with SITA to create awareness of information/cyber security threats. New
technologies have been installed to further enhance the cyber security capabilities of the WCG
corporate network;
• the network and applications management capacity was successfully expanded in order to improve
online visibility and better proactive responsiveness with 2 243 infrastructure items being replaced in
line with technology refresh plans;
• the IT Service-desk received 59 336 tickets and maintained a resolution rate of 4,99 days per call.

88 DOTP ANNUAL REPORT FOR 2019/2020
• the IT Business Continuity Plan and the IT Disaster Recovery Plan were enhanced;
• an average network and system uptime and availability of over 98 per cent was maintained;
• the review of departmental ICT strategic and operational plans as well as the completion of
implementation plans;
• improving the operations and roles of the Technology Review Board, Software Review Board and the
Enterprise Architecture Review Board to improve IT governance;
• development, enhancement and implementation of additional transversal application solutions,
including BI (BizBrain) deployments, as well as other implementations on the platform including the
I-CAN Learn or Operations Management Solution (OMS) system for the Department of Economic
Development and Tourism (DEDAT), NPO for the Department of Health (DOH) and Procurement Tool
for Provincial Treasury; and also enhancements to the NPO system for Department of Social
Development (DSD) and WCG Dashboard for the CSC;
• the standardisation of software configurations on end-user equipment across the WCG (including
software tools for remote management, support and software updates of end user equipment) have
also improved the level of ICT maturity in the organisation;
• the monitoring of service levels in respect of IT services provided to departments;
• monthly and quarterly Quality of Service Meetings held between Ce-I and the State Information
Technology Agency (SITA); and
• good progress was made to Cloud Services with the finalisation of various migrations.
4.4.4. Strategy to overcome areas of underperformance
The ICT Planning process will be reviewed in consultation with departments, to ensure that all ICT Plans are
completed.
The outstanding Cape Access Centres to be completed in the 2020/2021 financial year. In order to ensure
that targets are achieved, the branch plans to have all new centres completed by the end of the third
quarter of a financial year.
4.4.5. Changes to planned targets
No targets were changed during the year under review.

DOTP ANNUAL REPORT FOR 2019/2020 89
4.4.6. Linking performance with budgets
2019/2020 2018/2019
Sub-programme
Name
Final
Appropriation
Actual
Expenditure
(Over)/ Under
Expenditure
Final
Appropriation
Actual
Expenditure
(Over)/ Under
Expenditure
R’000 R’000 R’000 R’000 R’000 R’000
Programme Support 9 450 9 298 152 8 495 8 114 381
Strategic ICT
Services 112 104 111 582 522 102 154 99 501 2 653
GITO Management
Services 443 512 439 698 3 814 512 710 490 087 22 623
Connected
Government
Infrastructure
Services
430 795 430 767 28 311 746 306 713 5 033
Transversal
Applications
Services
74 857 73 202 1 655 63 233 63 219 14
Total 1 070 718 1 064 547 6 171 998 338 967 634 30 704
The Programme underspent by 0.6% or R6.171 million, which is due to staff exits. The Programme underspent
by 0.6% or R6.171 million, which is mainly due to staff exits, the cancelled bid process in respect of IT Security
and Cyber Strategy services and delays with the ECM project due to the finalisation of cross departmental
funding arrangements which led to a delay in the publishing of the tender.
4.5. Programme 5: Corporate Assurance
4.5.1. The purpose of the programme
The purpose of this programme is to render enterprise risk management, internal audit, provincial forensic
services, legal services and corporate communication services.
This Branch falls within the Corporate Services Centre of the Department and, through the services it offers,
contributes to the improvement of governance in the WCG. The strategic objective links directly to the
National Development Plan and the Medium-term Strategic Framework, particularly Outcome 12 (“an
efficient, effective and development-oriented public service”), and Outcome 3 (“all people in SA are and
feel safe”), particularly as it pertains to fighting corruption. Provincial Strategic Goal 5 (and more specifically
the output “efficient, effective and responsive provincial governance”) in this context focuses on improving
the maturity level for corporate governance in the WCG.
The Branch has defined its strategy to be a catalyst for corporate governance in the WCG and this was in
line with the Department’s approach of enabling corporate governance for improved service delivery.
The “governance for service delivery” holistic strategic approach was pursued in collaboration with a
number of stakeholders utilising the following strategic thrusts:
• Integrated and quality services – This entailed the identification of touch points across three business
units that drive an integrated approach to service delivery.

90 DOTP ANNUAL REPORT FOR 2019/2020
• Strategic partnering – The foundation of our strategic partnering approach is in the Corporate
Governance Framework. We took the lead in developing this framework (and will further do so in the
roll-out of the framework in the WCG) and through partnerships and collaboration drove the
governance agenda in the Province. We continued to deliver our services to the provincial
departments by partnering with them to determine work scope and improving the overall system of
internal control.
• Innovation – We encouraged innovation, and focused on the technological aspects and creating a
new set of skills (i.e. data analytics) that would benefit the units in the Branch collectively.
• People Centric – None of our achievements would be possible without having a resilient and
professional workforce. Developing and growing our staff at all levels is a strategic thrust that will
receive ongoing attention.
4.5.2. Sub-programmes
Programme 5’s contribution to governance was by means of the services delivered by its five sub-
programmes, namely:
5.1 Programme Support;
5.2 Enterprise Risk Management;
5.3 Internal Audit;
5.4 Provincial Forensic Services;
5.5 Legal Services; and
5.6 Corporate Communication.
Sub-programme 5.1: Programme support: to provide administrative support to the management of this
programmes.
The Directorate: Enterprise Risk Management renders risk management services to departments of the
WCG and ultimately executes the responsibilities of departmental Chief Risk Officers. Progress was made
in embedding risk management in the day-to-day activities of departments. The unit initiated the Control
Self-assessment (CSA) process through which the adequacy and effectiveness of controls are self-assessed
by management to determine its appropriateness to mitigate the risk to an appropriate level. This
evaluation of controls assists risk owners in deriving a more probable risk rating. There is ongoing focus on
categorising contributing factors to draw attention to those causes of risk that are more important and the
analysis of contributing factors and impacts of particular risks improved the understanding of line managers
about the risks that could prevent a department, programme, sub-programme or project from achieving
its objectives. It also enabled developing relevant responses and plans to manage these risks.
Provincial Top Management pioneered the compilation of a provincial risk profile that describes the WCG’s
key risks that could impact on the achievement of the provincial strategic goals. A provincial risk profile
enhances the WCG’s analysis and decision making related to priority setting and resource allocation
(especially in the current challenging economic climate). It provides a clear snapshot of the WCG’s key
risks and once sufficiently matured, can help to identify areas of efficiency and potential opportunity. This
Provincial risk profile formed the basis for the development of a Transversal Internal Audit Plan for 2019/2020,
which was accepted by PTM and subsequently approved by the Governance and Administration Audit
Committee that deals with transversal matters.
DOTP ANNUAL REPORT FOR 2019/2020 91
The Chief Directorate: Internal Audit independently evaluates the adequacy and effectiveness of risk
treatments for areas included in the Internal Audit Plans for all departments in the WCG. Internal Audit has
selected the following strategic imperatives over the five-year period to contribute to the Branch’s overall
strategic intent:
a) Delivering an integrated, quality internal audit service, compliant with the International Standards for
the Professional Practice of Internal Auditing. This ultimately entails developing internal audit plans
aligned to departmental strategies and issuing reports that contain value-add recommendations.
b) Implementation of Continuous Auditing and Data Analytics is a long-term objective to provide
organisational value in terms of innovative auditing practices and responding to the coverage
dilemma. There was increased integration of data analytics in internal audit activities which forms
the foundation for continuous auditing. Furthermore, information and communication technology
audits have been integrated with operational internal audits, resulting in the upskilling of operational
internal auditors in this technical area.
c) Strategic partnering with departments resulted in a better implementation rate of Internal Audit
Recommendations and played a pivotal role in provincial strategic projects (such as the
development of the Governance Framework and other key initiatives). Strategic engagements with
client departments focused on finding better ways and audit approaches to significantly address
contentious issues that are impacting on the control/governance environment, with the ultimate
intent to improve or contribute to its maturity.
d) Collaborated with key stakeholders such as Organisational Development and Internal Control Units,
to ensure synergy in methodologies to expedite the growth and improvement of the governance
environment.
e) Actively played a strategic and leadership role in facilitating the implementation of the Combined
Assurance Framework. This entailed engaging with key stakeholders to enable them to augment
their processes and embed the principles of the framework, ultimately realising the benefits in the
long term.
The Chief Directorate: Provincial Forensic Services (PFS) rendered reactive and proactive forensic services
to all departments in the WCG. It aimed to create a zero-tolerant environment towards fraud, theft and
corruption by means of its proactive programmes agreed upon with each department annually, which
include fraud risk assessments, fraud and corruption training sessions and issuing electronic newsletters and
other anti-fraud communications.
The PFS contributed to creating and inculcating a culture of responsible whistle-blowing and in its strive to
combat economic crime, played a pivotal role in ensuring that allegations of fraud, theft and corruption
were investigated and reported on to the relevant Accounting Officer and appropriate remedial action
was taken in this regard. It also facilitated training to employees on how to blow the whistle and those who
receive reports on how to handle a disclosure in terms of the Whistle-blowing Policy.
Legal Services promoted efficient and effective governance by rendering legal advice in support of
executive and administrative decision making. Both proactive and reactive advice was furnished, aimed
at ensuring legally sound decisions by the Provincial Cabinet, members of the Provincial Cabinet (when
exercising and performing the powers and functions associated with their respective executive portfolios),
provincial departments and a number of provincial public entities.
The objective of all legal advice is to safeguard decisions from irregularities and/or legal challenges, and
to avoid irregular and/or fruitless expenditure that is incurred if actions and decisions are non-compliant
with the Constitution and legislation. In this regard Legal Services exceeded its target by receiving and
attending to 2 315 requests for legal advice during the year under review, which was attended to by its
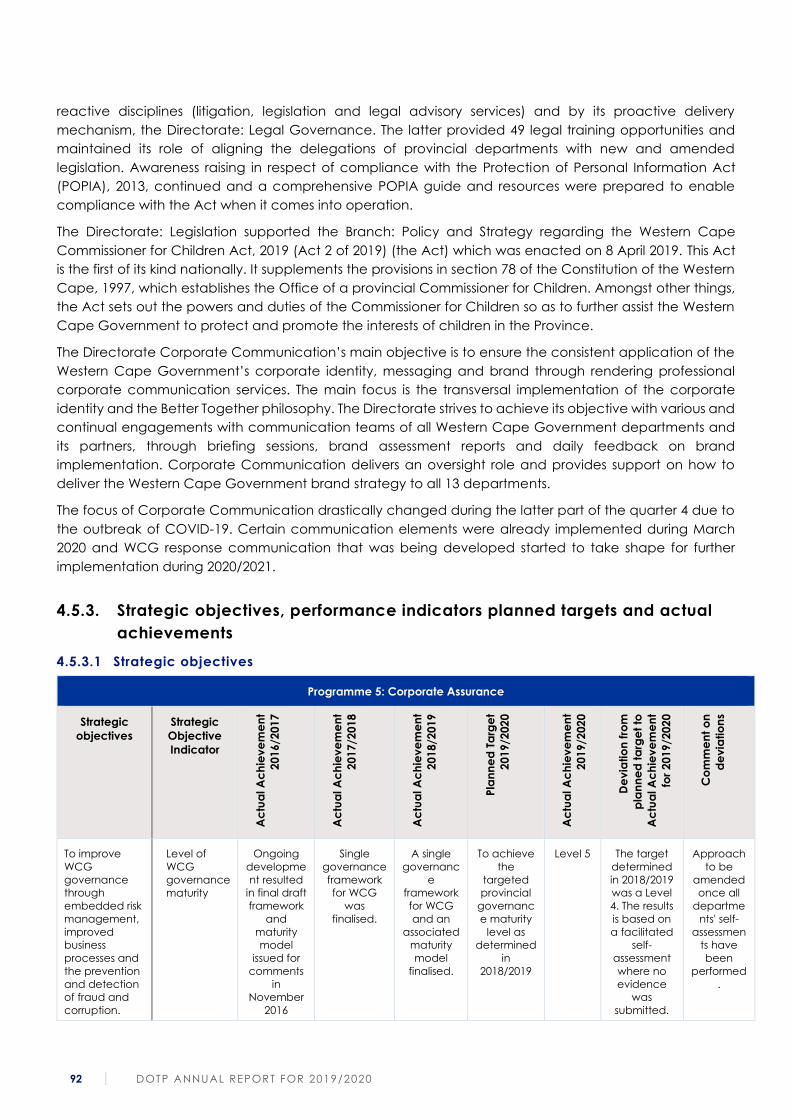
92 DOTP ANNUAL REPORT FOR 2019/2020
reactive disciplines (litigation, legislation and legal advisory services) and by its proactive delivery
mechanism, the Directorate: Legal Governance. The latter provided 49 legal training opportunities and
maintained its role of aligning the delegations of provincial departments with new and amended
legislation. Awareness raising in respect of compliance with the Protection of Personal Information Act
(POPIA), 2013, continued and a comprehensive POPIA guide and resources were prepared to enable
compliance with the Act when it comes into operation.
The Directorate: Legislation supported the Branch: Policy and Strategy regarding the Western Cape
Commissioner for Children Act, 2019 (Act 2 of 2019) (the Act) which was enacted on 8 April 2019. This Act
is the first of its kind nationally. It supplements the provisions in section 78 of the Constitution of the Western
Cape, 1997, which establishes the Office of a provincial Commissioner for Children. Amongst other things,
the Act sets out the powers and duties of the Commissioner for Children so as to further assist the Western
Cape Government to protect and promote the interests of children in the Province.
The Directorate Corporate Communication’s main objective is to ensure the consistent application of the
Western Cape Government’s corporate identity, messaging and brand through rendering professional
corporate communication services. The main focus is the transversal implementation of the corporate
identity and the Better Together philosophy. The Directorate strives to achieve its objective with various and
continual engagements with communication teams of all Western Cape Government departments and
its partners, through briefing sessions, brand assessment reports and daily feedback on brand
implementation. Corporate Communication delivers an oversight role and provides support on how to
deliver the Western Cape Government brand strategy to all 13 departments.
The focus of Corporate Communication drastically changed during the latter part of the quarter 4 due to
the outbreak of COVID-19. Certain communication elements were already implemented during March
2020 and WCG response communication that was being developed started to take shape for further
implementation during 2020/2021.
4.5.3. Strategic objectives, performance indicators planned targets and actual
achievements
4.5.3.1 Strategic objectives
Programme 5: Corporate Assurance
Strategic
objectives
Strategic
Objective
Indicator
Ac
tua
l A
ch
iev
em
en
t
20
16/2
01
7
Ac
tua
l A
ch
iev
em
en
t
20
17/2
01
8
Ac
tua
l A
ch
iev
em
en
t
20
18/2
01
9
Pla
nn
ed
Ta
rge
t
20
19/2
02
0
Ac
tua
l A
ch
iev
em
en
t
20
19/2
02
0
De
via
tio
n f
rom
pla
nn
ed
ta
rge
t to
Ac
tua
l A
ch
iev
em
en
t
for
20
19
/20
20
Co
mm
en
t o
n
de
via
tio
ns
To improve
WCG
governance
through
embedded risk
management,
improved
business
processes and
the prevention
and detection
of fraud and
corruption.
Level of
WCG
governance
maturity
Ongoing
developme
nt resulted
in final draft
framework
and
maturity
model
issued for
comments
in
November
2016
Single
governance
framework
for WCG
was
finalised.
A single
governanc
e
framework
for WCG
and an
associated
maturity
model
finalised.
To achieve
the
targeted
provincial
governanc
e maturity
level as
determined
in
2018/2019
Level 5 The target
determined
in 2018/2019
was a Level
4. The results
is based on
a facilitated
self-
assessment
where no
evidence
was
submitted.
Approach
to be
amended
once all
departme
nts' self-
assessmen
ts have
been
performed
.
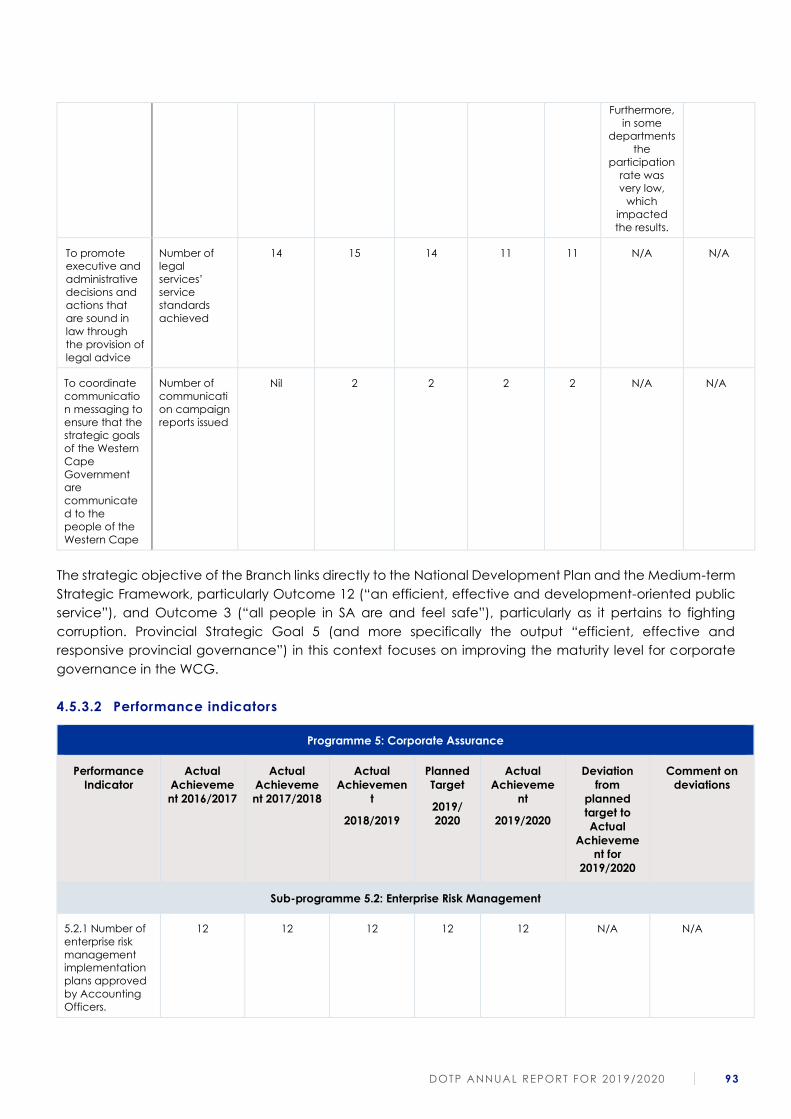
DOTP ANNUAL REPORT FOR 2019/2020 93
Furthermore,
in some
departments
the
participation
rate was
very low,
which
impacted
the results.
To promote
executive and
administrative
decisions and
actions that
are sound in
law through
the provision of
legal advice
Number of
legal
services’
service
standards
achieved
14 15 14 11 11 N/A N/A
To coordinate
communicatio
n messaging to
ensure that the
strategic goals
of the Western
Cape
Government
are
communicate
d to the
people of the
Western Cape
Number of
communicati
on campaign
reports issued
Nil 2 2 2 2 N/A N/A
The strategic objective of the Branch links directly to the National Development Plan and the Medium-term
Strategic Framework, particularly Outcome 12 (“an efficient, effective and development-oriented public
service”), and Outcome 3 (“all people in SA are and feel safe”), particularly as it pertains to fighting
corruption. Provincial Strategic Goal 5 (and more specifically the output “efficient, effective and
responsive provincial governance”) in this context focuses on improving the maturity level for corporate
governance in the WCG.
4.5.3.2 Performance indicators
Programme 5: Corporate Assurance
Performance
Indicator
Actual
Achieveme
nt 2016/2017
Actual
Achieveme
nt 2017/2018
Actual
Achievemen
t
2018/2019
Planned
Target
2019/
2020
Actual
Achieveme
nt
2019/2020
Deviation
from
planned
target to
Actual
Achieveme
nt for
2019/2020
Comment on
deviations
Sub-programme 5.2: Enterprise Risk Management
5.2.1 Number of
enterprise risk
management
implementation
plans approved
by Accounting
Officers.
12 12 12 12 12 N/A N/A
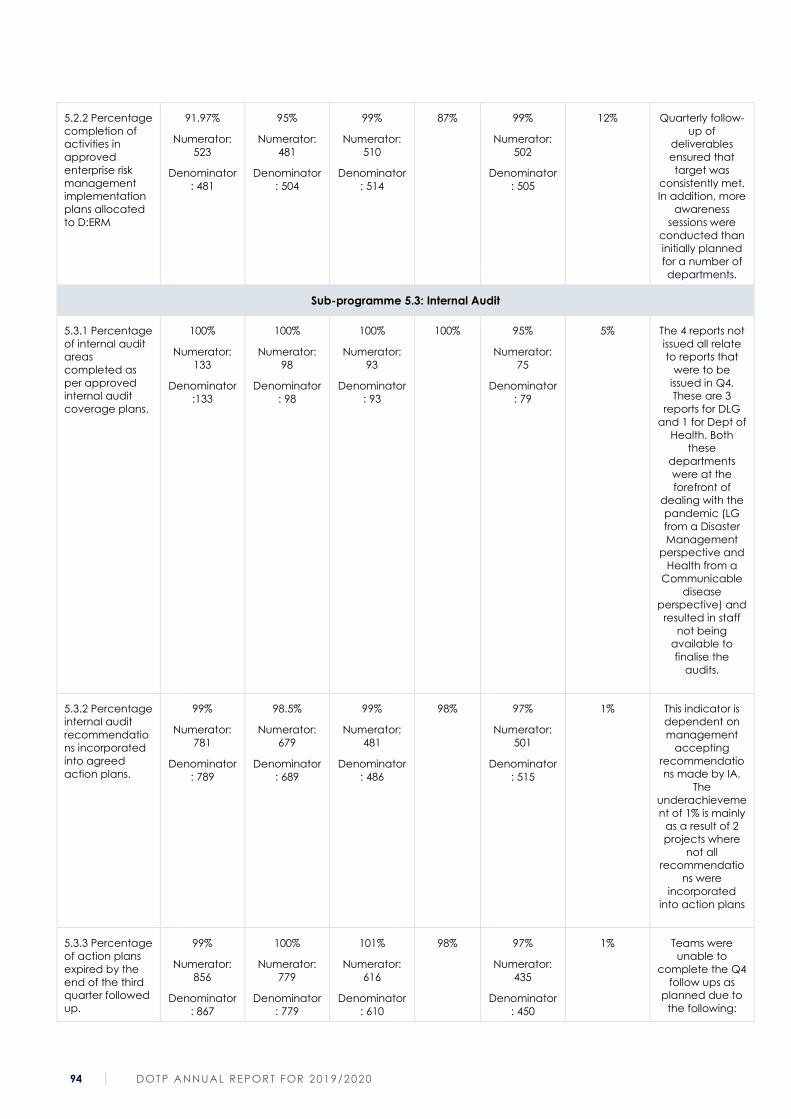
94 DOTP ANNUAL REPORT FOR 2019/2020
5.2.2 Percentage
completion of
activities in
approved
enterprise risk
management
implementation
plans allocated
to D:ERM
91.97%
Numerator:
523
Denominator
: 481
95%
Numerator:
481
Denominator
: 504
99%
Numerator:
510
Denominator
: 514
87% 99%
Numerator:
502
Denominator
: 505
12% Quarterly follow-
up of
deliverables
ensured that
target was
consistently met.
In addition, more
awareness
sessions were
conducted than
initially planned
for a number of
departments.
Sub-programme 5.3: Internal Audit
5.3.1 Percentage
of internal audit
areas
completed as
per approved
internal audit
coverage plans.
100%
Numerator:
133
Denominator
:133
100%
Numerator:
98
Denominator
: 98
100%
Numerator:
93
Denominator
: 93
100% 95%
Numerator:
75
Denominator
: 79
5% The 4 reports not
issued all relate
to reports that
were to be
issued in Q4.
These are 3
reports for DLG
and 1 for Dept of
Health. Both
these
departments
were at the
forefront of
dealing with the
pandemic (LG
from a Disaster
Management
perspective and
Health from a
Communicable
disease
perspective) and
resulted in staff
not being
available to
finalise the
audits.
5.3.2 Percentage
internal audit
recommendatio
ns incorporated
into agreed
action plans.
99%
Numerator:
781
Denominator
: 789
98.5%
Numerator:
679
Denominator
: 689
99%
Numerator:
481
Denominator
: 486
98% 97%
Numerator:
501
Denominator
: 515
1% This indicator is
dependent on
management
accepting
recommendatio
ns made by IA.
The
underachieveme
nt of 1% is mainly
as a result of 2
projects where
not all
recommendatio
ns were
incorporated
into action plans
5.3.3 Percentage
of action plans
expired by the
end of the third
quarter followed
up.
99%
Numerator:
856
Denominator
: 867
100%
Numerator:
779
Denominator
: 779
101%
Numerator:
616
Denominator
: 610
98% 97%
Numerator:
435
Denominator
: 450
1% Teams were
unable to
complete the Q4
follow ups as
planned due to
the following:
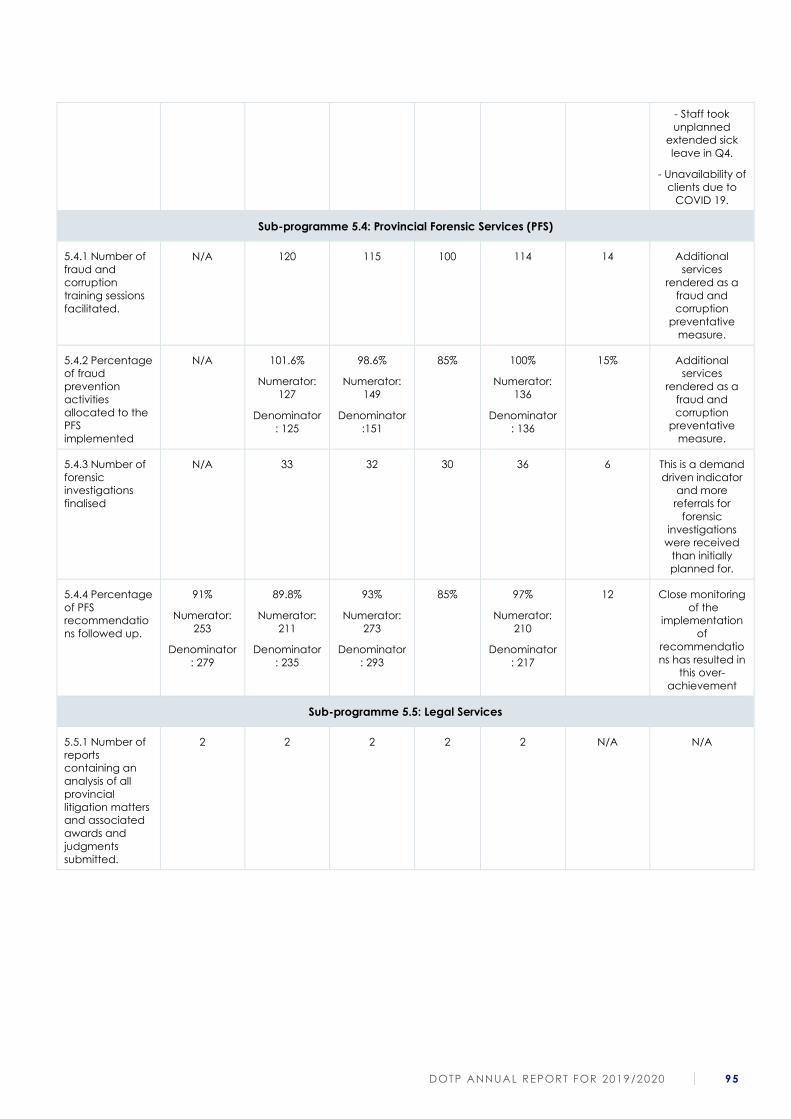
DOTP ANNUAL REPORT FOR 2019/2020 95
- Staff took
unplanned
extended sick
leave in Q4.
- Unavailability of
clients due to
COVID 19.
Sub-programme 5.4: Provincial Forensic Services (PFS)
5.4.1 Number of
fraud and
corruption
training sessions
facilitated.
N/A 120 115 100 114 14 Additional
services
rendered as a
fraud and
corruption
preventative
measure.
5.4.2 Percentage
of fraud
prevention
activities
allocated to the
PFS
implemented
N/A 101.6%
Numerator:
127
Denominator
: 125
98.6%
Numerator:
149
Denominator
:151
85% 100%
Numerator:
136
Denominator
: 136
15% Additional
services
rendered as a
fraud and
corruption
preventative
measure.
5.4.3 Number of
forensic
investigations
finalised
N/A 33 32 30 36 6 This is a demand
driven indicator
and more
referrals for
forensic
investigations
were received
than initially
planned for.
5.4.4 Percentage
of PFS
recommendatio
ns followed up.
91%
Numerator:
253
Denominator
: 279
89.8%
Numerator:
211
Denominator
: 235
93%
Numerator:
273
Denominator
: 293
85% 97%
Numerator:
210
Denominator
: 217
12 Close monitoring
of the
implementation
of
recommendatio
ns has resulted in
this over-
achievement
Sub-programme 5.5: Legal Services
5.5.1 Number of
reports
containing an
analysis of all
provincial
litigation matters
and associated
awards and
judgments
submitted.
2 2 2 2 2 N/A N/A
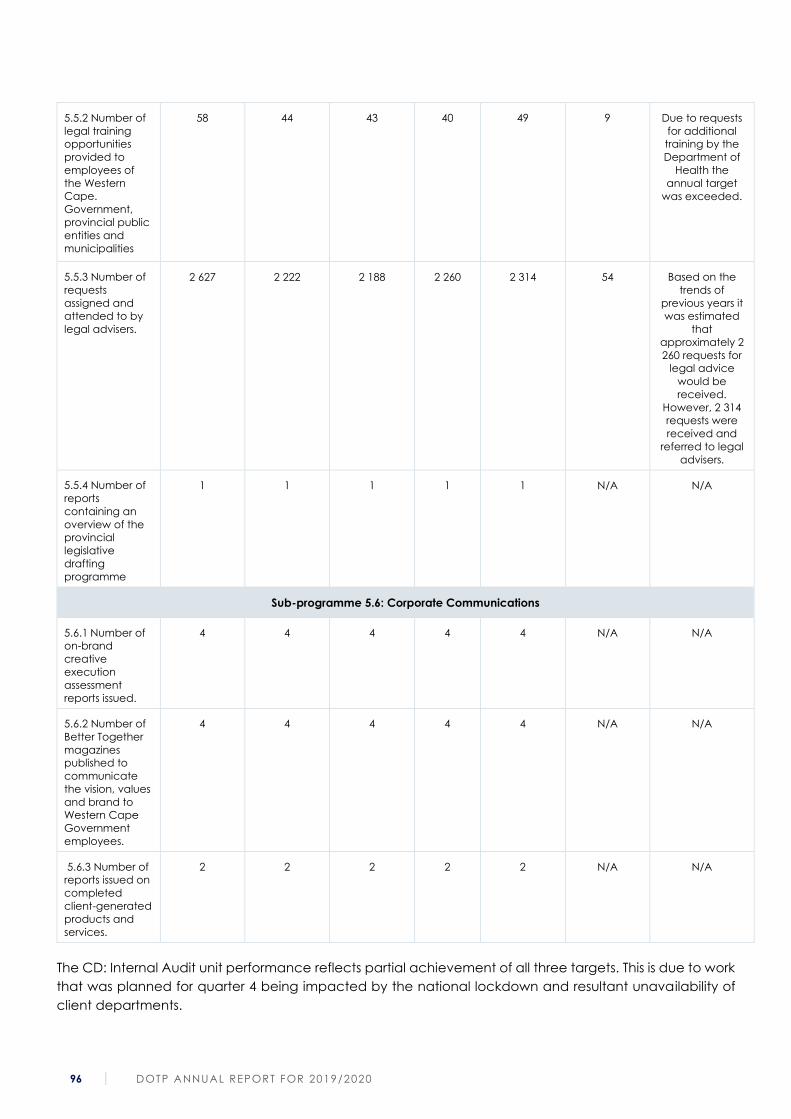
96 DOTP ANNUAL REPORT FOR 2019/2020
5.5.2 Number of
legal training
opportunities
provided to
employees of
the Western
Cape.
Government,
provincial public
entities and
municipalities
58 44 43 40 49 9 Due to requests
for additional
training by the
Department of
Health the
annual target
was exceeded.
5.5.3 Number of
requests
assigned and
attended to by
legal advisers.
2 627 2 222 2 188 2 260 2 314 54 Based on the
trends of
previous years it
was estimated
that
approximately 2
260 requests for
legal advice
would be
received.
However, 2 314
requests were
received and
referred to legal
advisers.
5.5.4 Number of
reports
containing an
overview of the
provincial
legislative
drafting
programme
1 1 1 1 1 N/A N/A
Sub-programme 5.6: Corporate Communications
5.6.1 Number of
on-brand
creative
execution
assessment
reports issued.
4 4 4 4 4 N/A N/A
5.6.2 Number of
Better Together
magazines
published to
communicate
the vision, values
and brand to
Western Cape
Government
employees.
4 4 4 4 4 N/A N/A
5.6.3 Number of
reports issued on
completed
client-generated
products and
services.
2 2 2 2 2 N/A N/A
The CD: Internal Audit unit performance reflects partial achievement of all three targets. This is due to work
that was planned for quarter 4 being impacted by the national lockdown and resultant unavailability of
client departments.

DOTP ANNUAL REPORT FOR 2019/2020 97
4.5.4. Strategy to overcome areas of underperformance
The Chief Directorate: Internal Audit will reconsider its quarterly project plan to reduce the number of areas
for finalisation in the last quarter. We will also engage with client departments on alternative solutions in
instances of unavailability and escalate interventions to the relevant Head of Department as soon as
possible.
4.5.5. Changes to planned targets
No targets were changed during the year under review.
4.5.6. Linking performance with budgets
2019/2020 2018/2019
Sub-programme
Name
Final
Appropriation
Actual
Expenditure
(Over)/ Under
Expenditure
Final
Appropriation
Actual
Expenditure
(Over)/ Under
Expenditure
R’000 R’000 R’000 R’000 R’000 R’000
Programme
Support 2 939 2 926 13 2 965 2 756 209
Enterprise Risk
Management 9 127 8 786 386 7 754 7 734 20
Internal Audit 43 542 42 625 917 42 851 41 346 1 505
Provincial Forensic
Services 14 817 14 098 719 15 844 15 039 805
Legal Services 46 640 46 495 145 44 702 44 300 402
Corporate
Communication 16 860 16 768 92 17 546 16 507 1 039
Total 133 970 131 698 2 272 131 662 127 682 3 980
The Programme underspent by 1.7% or R2.272 million, which is mainly due to staff exits.
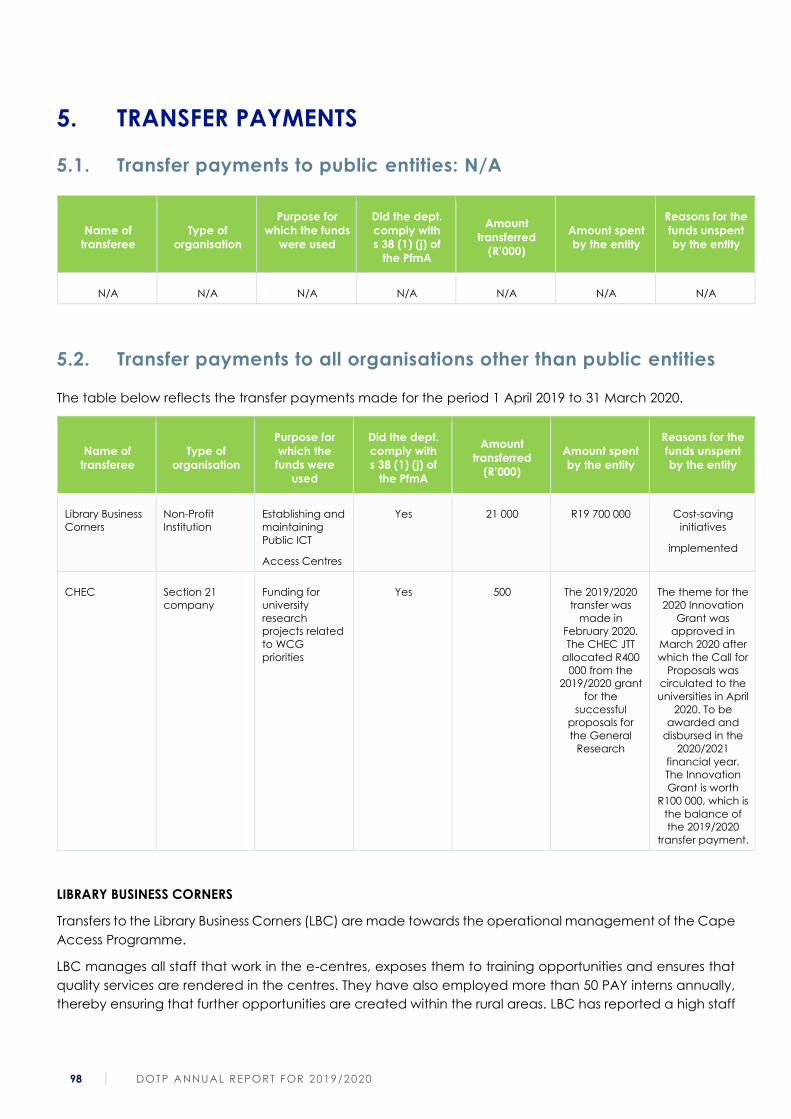
98 DOTP ANNUAL REPORT FOR 2019/2020
5. TRANSFER PAYMENTS
5.1. Transfer payments to public entities: N/A
Name of
transferee
Type of
organisation
Purpose for
which the funds
were used
Did the dept.
comply with
s 38 (1) (j) of
the PfmA
Amount
transferred
(R’000)
Amount spent
by the entity
Reasons for the
funds unspent
by the entity
N/A N/A N/A N/A N/A N/A N/A
5.2. Transfer payments to all organisations other than public entities
The table below reflects the transfer payments made for the period 1 April 2019 to 31 March 2020.
Name of
transferee
Type of
organisation
Purpose for
which the
funds were
used
Did the dept.
comply with
s 38 (1) (j) of
the PfmA
Amount
transferred
(R’000)
Amount spent
by the entity
Reasons for the
funds unspent
by the entity
Library Business
Corners
Non-Profit
Institution
Establishing and
maintaining
Public ICT
Access Centres
Yes 21 000 R19 700 000 Cost-saving
initiatives
implemented
CHEC Section 21
company
Funding for
university
research
projects related
to WCG
priorities
Yes 500 The 2019/2020
transfer was
made in
February 2020.
The CHEC JTT
allocated R400
000 from the
2019/2020 grant
for the
successful
proposals for
the General
Research
The theme for the
2020 Innovation
Grant was
approved in
March 2020 after
which the Call for
Proposals was
circulated to the
universities in April
2020. To be
awarded and
disbursed in the
2020/2021
financial year.
The Innovation
Grant is worth
R100 000, which is
the balance of
the 2019/2020
transfer payment.
LIBRARY BUSINESS CORNERS
Transfers to the Library Business Corners (LBC) are made towards the operational management of the Cape
Access Programme.
LBC manages all staff that work in the e-centres, exposes them to training opportunities and ensures that
quality services are rendered in the centres. They have also employed more than 50 PAY interns annually,
thereby ensuring that further opportunities are created within the rural areas. LBC has reported a high staff
DOTP ANNUAL REPORT FOR 2019/2020 99
turnover rate, but the WCG is encouraged by this situation as it points to the contract employees securing
either permanent or more financially beneficial employment elsewhere in the formal employment sector.
Apart from the operational management LBC also manages and engages selected stakeholders and
partners of the programme.
Bi-monthly management meetings are held between the Centre for e-Innovation and LBC to discuss
progress and spending against predetermined targets of the Cape Access programme.
CHEC
The Western Cape Government has allocated funds to CHEC to enable the implementation of the MOU
related to mutually approved plans. This partnership is guided by a Transfer Payment Agreement in
accordance with the Provincial Treasury regulations. The funds allocated to CHEC are used for projects
and research conducted at higher education institutions. The intent of this transfer payment is to
encourage researchers to undertake research that can contribute to positive societal outcomes aligned
to the Western Cape Provincial Strategic Priorities, as well as to foster relationship building and
collaboration between policy practitioners and researchers in the Western Cape Government and
academic researchers in Higher Education Institutions.
The CHEC/WCG Joint Task Team (JTT), which includes representatives of the WCG as well as representatives
of each Higher Education Institution and CHEC, oversees the research partnership, as well as additional
activities. During the period under review, the projects that were awarded funding were aligned to the
provincial strategic priorities themes and the research agendas of the four universities. Meetings of the JTT
were held regularly (eight meetings during 2019/2020) to discuss, plan and monitor projects and research
proposals. In the previous financial year, CHEC had undertaken an evaluation of the CHEC-WCG
Partnership and this has been used to begin a process of improving the partnership so as to strengthen the
work of the Joint Task Team.
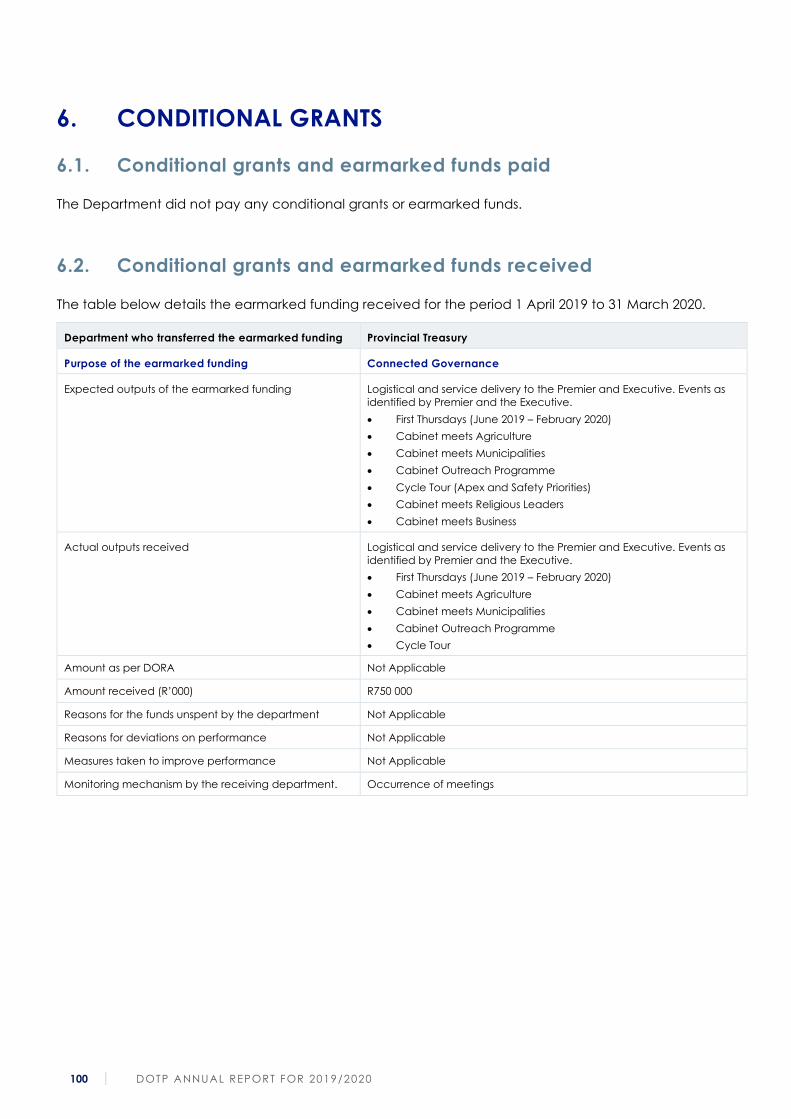
100 DOTP ANNUAL REPORT FOR 2019/2020
6. CONDITIONAL GRANTS
6.1. Conditional grants and earmarked funds paid
The Department did not pay any conditional grants or earmarked funds.
6.2. Conditional grants and earmarked funds received
The table below details the earmarked funding received for the period 1 April 2019 to 31 March 2020.
Department who transferred the earmarked funding Provincial Treasury
Purpose of the earmarked funding Connected Governance
Expected outputs of the earmarked funding Logistical and service delivery to the Premier and Executive. Events as
identified by Premier and the Executive.
• First Thursdays (June 2019 – February 2020)
• Cabinet meets Agriculture
• Cabinet meets Municipalities
• Cabinet Outreach Programme
• Cycle Tour (Apex and Safety Priorities)
• Cabinet meets Religious Leaders
• Cabinet meets Business
Actual outputs received Logistical and service delivery to the Premier and Executive. Events as
identified by Premier and the Executive.
• First Thursdays (June 2019 – February 2020)
• Cabinet meets Agriculture
• Cabinet meets Municipalities
• Cabinet Outreach Programme
• Cycle Tour
Amount as per DORA Not Applicable
Amount received (R’000) R750 000
Reasons for the funds unspent by the department Not Applicable
Reasons for deviations on performance Not Applicable
Measures taken to improve performance Not Applicable
Monitoring mechanism by the receiving department. Occurrence of meetings
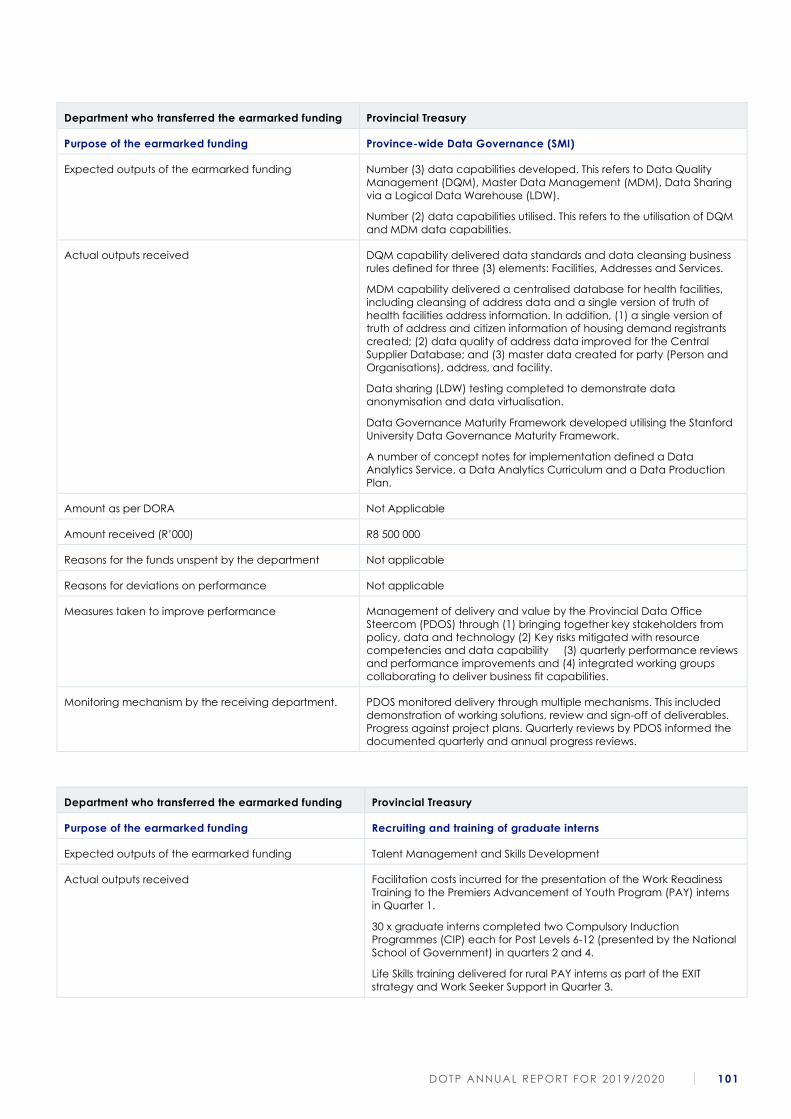
DOTP ANNUAL REPORT FOR 2019/2020 101
Department who transferred the earmarked funding Provincial Treasury
Purpose of the earmarked funding Province-wide Data Governance (SMI)
Expected outputs of the earmarked funding Number (3) data capabilities developed. This refers to Data Quality
Management (DQM), Master Data Management (MDM), Data Sharing
via a Logical Data Warehouse (LDW).
Number (2) data capabilities utilised. This refers to the utilisation of DQM
and MDM data capabilities.
Actual outputs received DQM capability delivered data standards and data cleansing business
rules defined for three (3) elements: Facilities, Addresses and Services.
MDM capability delivered a centralised database for health facilities,
including cleansing of address data and a single version of truth of
health facilities address information. In addition, (1) a single version of
truth of address and citizen information of housing demand registrants
created; (2) data quality of address data improved for the Central
Supplier Database; and (3) master data created for party (Person and
Organisations), address, and facility.
Data sharing (LDW) testing completed to demonstrate data
anonymisation and data virtualisation.
Data Governance Maturity Framework developed utilising the Stanford
University Data Governance Maturity Framework.
A number of concept notes for implementation defined a Data
Analytics Service, a Data Analytics Curriculum and a Data Production
Plan.
Amount as per DORA Not Applicable
Amount received (R’000) R8 500 000
Reasons for the funds unspent by the department Not applicable
Reasons for deviations on performance Not applicable
Measures taken to improve performance Management of delivery and value by the Provincial Data Office
Steercom (PDOS) through (1) bringing together key stakeholders from
policy, data and technology (2) Key risks mitigated with resource
competencies and data capability (3) quarterly performance reviews
and performance improvements and (4) integrated working groups
collaborating to deliver business fit capabilities.
Monitoring mechanism by the receiving department. PDOS monitored delivery through multiple mechanisms. This included
demonstration of working solutions, review and sign-off of deliverables.
Progress against project plans. Quarterly reviews by PDOS informed the
documented quarterly and annual progress reviews.
Department who transferred the earmarked funding Provincial Treasury
Purpose of the earmarked funding Recruiting and training of graduate interns
Expected outputs of the earmarked funding Talent Management and Skills Development
Actual outputs received Facilitation costs incurred for the presentation of the Work Readiness
Training to the Premiers Advancement of Youth Program (PAY) interns
in Quarter 1.
30 x graduate interns completed two Compulsory Induction
Programmes (CIP) each for Post Levels 6-12 (presented by the National
School of Government) in quarters 2 and 4.
Life Skills training delivered for rural PAY interns as part of the EXIT
strategy and Work Seeker Support in Quarter 3.
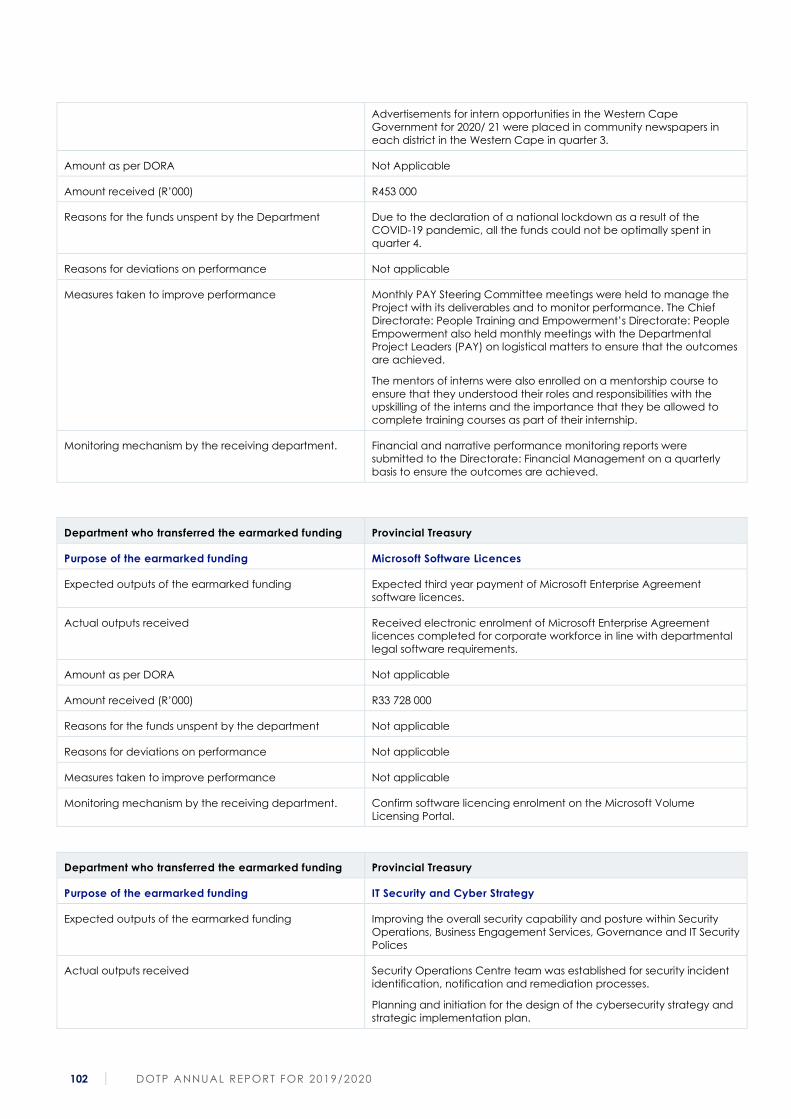
102 DOTP ANNUAL REPORT FOR 2019/2020
Advertisements for intern opportunities in the Western Cape
Government for 2020/ 21 were placed in community newspapers in
each district in the Western Cape in quarter 3.
Amount as per DORA Not Applicable
Amount received (R’000) R453 000
Reasons for the funds unspent by the Department Due to the declaration of a national lockdown as a result of the
COVID-19 pandemic, all the funds could not be optimally spent in
quarter 4.
Reasons for deviations on performance Not applicable
Measures taken to improve performance Monthly PAY Steering Committee meetings were held to manage the
Project with its deliverables and to monitor performance. The Chief
Directorate: People Training and Empowerment’s Directorate: People
Empowerment also held monthly meetings with the Departmental
Project Leaders (PAY) on logistical matters to ensure that the outcomes
are achieved.
The mentors of interns were also enrolled on a mentorship course to
ensure that they understood their roles and responsibilities with the
upskilling of the interns and the importance that they be allowed to
complete training courses as part of their internship.
Monitoring mechanism by the receiving department. Financial and narrative performance monitoring reports were
submitted to the Directorate: Financial Management on a quarterly
basis to ensure the outcomes are achieved.
Department who transferred the earmarked funding Provincial Treasury
Purpose of the earmarked funding Microsoft Software Licences
Expected outputs of the earmarked funding Expected third year payment of Microsoft Enterprise Agreement
software licences.
Actual outputs received Received electronic enrolment of Microsoft Enterprise Agreement
licences completed for corporate workforce in line with departmental
legal software requirements.
Amount as per DORA Not applicable
Amount received (R’000) R33 728 000
Reasons for the funds unspent by the department Not applicable
Reasons for deviations on performance Not applicable
Measures taken to improve performance Not applicable
Monitoring mechanism by the receiving department. Confirm software licencing enrolment on the Microsoft Volume
Licensing Portal.
Department who transferred the earmarked funding Provincial Treasury
Purpose of the earmarked funding IT Security and Cyber Strategy
Expected outputs of the earmarked funding Improving the overall security capability and posture within Security
Operations, Business Engagement Services, Governance and IT Security
Polices
Actual outputs received Security Operations Centre team was established for security incident
identification, notification and remediation processes.
Planning and initiation for the design of the cybersecurity strategy and
strategic implementation plan.

DOTP ANNUAL REPORT FOR 2019/2020 103
Gap assessment of Information Security Policies.
Design and launch of the Information Security Awareness Campaign.
IT Business Continuity and Disaster Recovery Plan Services
Implement a network security toolset services as it relates to routing
and switching in order to gain network insights.
Implement a Vulnerability Assessment Service tool to scan the network
for known software threats on endpoints.
Amount as per DORA Not applicable
Amount received (R’000) R14 000 000
Reasons for the funds unspent by the department Cancelled bid process in respect of IT Security and Cyber Strategy
services.
Reasons for deviations on performance Not applicable
Measures taken to improve performance Measurement through continual engagement with the Service
Provider. This includes providing feedback to the Department by
means of monthly progress reports.
Monitoring mechanism by the receiving department. DSCS monitored delivery through scheduled meetings with the service
provider in the form of operational and steerco meetings. Monthly SLA
meetings also held to monitor performance.
Department who transferred the earmarked funding Provincial Treasury
Purpose of the earmarked funding System Hosting and Technology Refresh
Expected outputs of the earmarked funding To address the current Infrastructure refresh backlog. The Infrastructure
domain primarily comprises devices, switches, wireless access points
and servers, while the system hosting component responds to the rising
costs associated with the increase in data generated and the increase
in systems being migrated to the cloud.
Actual outputs received System Hosting - allocation R11mil: The funds were used as part of the
Microsoft EA Annual Billing Renewal 2021 (Year 1 of 3) Accelerated
Payment of R117 215 872.97 (which includes the Azure Commit
(Consumption)). Year 1 payment was finalised in July 2019.
Technology Refresh - Allocation R14 mil: Invoices were paid i.r.o
network infrastructure and cabling to the value of R13.573 mil.
Amount as per DORA Not applicable
Amount received (R’000) R25 000 000
Reasons for the funds unspent by the department R427 000 not paid due to outstanding equipment still to be delivered
by SITA (to be delivered in 2020/2021 fin cycle).
Reasons for deviations on performance SITA procurement delays.
Measures taken to improve performance Monthly SITA procurement meetings. Liaison with SITA Snr Management
in Western Cape re procurement delays.
Monitoring mechanism by the receiving department. Monthly SITA procurement meetings, internal monthly budget status
feedback.
Monthly reports and monthly project meetings.
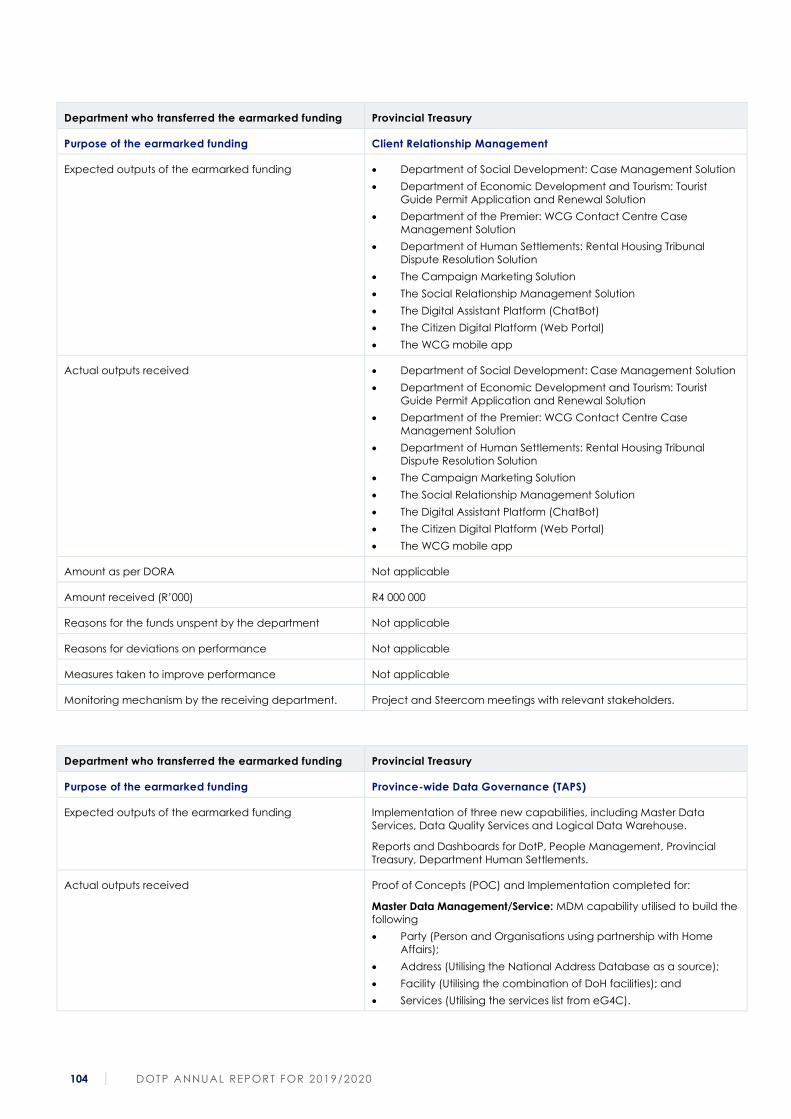
104 DOTP ANNUAL REPORT FOR 2019/2020
Department who transferred the earmarked funding Provincial Treasury
Purpose of the earmarked funding Client Relationship Management
Expected outputs of the earmarked funding • Department of Social Development: Case Management Solution
• Department of Economic Development and Tourism: Tourist
Guide Permit Application and Renewal Solution
• Department of the Premier: WCG Contact Centre Case
Management Solution
• Department of Human Settlements: Rental Housing Tribunal
Dispute Resolution Solution
• The Campaign Marketing Solution
• The Social Relationship Management Solution
• The Digital Assistant Platform (ChatBot)
• The Citizen Digital Platform (Web Portal)
• The WCG mobile app
Actual outputs received • Department of Social Development: Case Management Solution
• Department of Economic Development and Tourism: Tourist
Guide Permit Application and Renewal Solution
• Department of the Premier: WCG Contact Centre Case
Management Solution
• Department of Human Settlements: Rental Housing Tribunal
Dispute Resolution Solution
• The Campaign Marketing Solution
• The Social Relationship Management Solution
• The Digital Assistant Platform (ChatBot)
• The Citizen Digital Platform (Web Portal)
• The WCG mobile app
Amount as per DORA Not applicable
Amount received (R’000) R4 000 000
Reasons for the funds unspent by the department Not applicable
Reasons for deviations on performance Not applicable
Measures taken to improve performance Not applicable
Monitoring mechanism by the receiving department. Project and Steercom meetings with relevant stakeholders.
Department who transferred the earmarked funding Provincial Treasury
Purpose of the earmarked funding Province-wide Data Governance (TAPS)
Expected outputs of the earmarked funding Implementation of three new capabilities, including Master Data
Services, Data Quality Services and Logical Data Warehouse.
Reports and Dashboards for DotP, People Management, Provincial
Treasury, Department Human Settlements.
Actual outputs received Proof of Concepts (POC) and Implementation completed for:
Master Data Management/Service: MDM capability utilised to build the
following
• Party (Person and Organisations using partnership with Home
Affairs);
• Address (Utilising the National Address Database as a source);
• Facility (Utilising the combination of DoH facilities); and
• Services (Utilising the services list from eG4C).
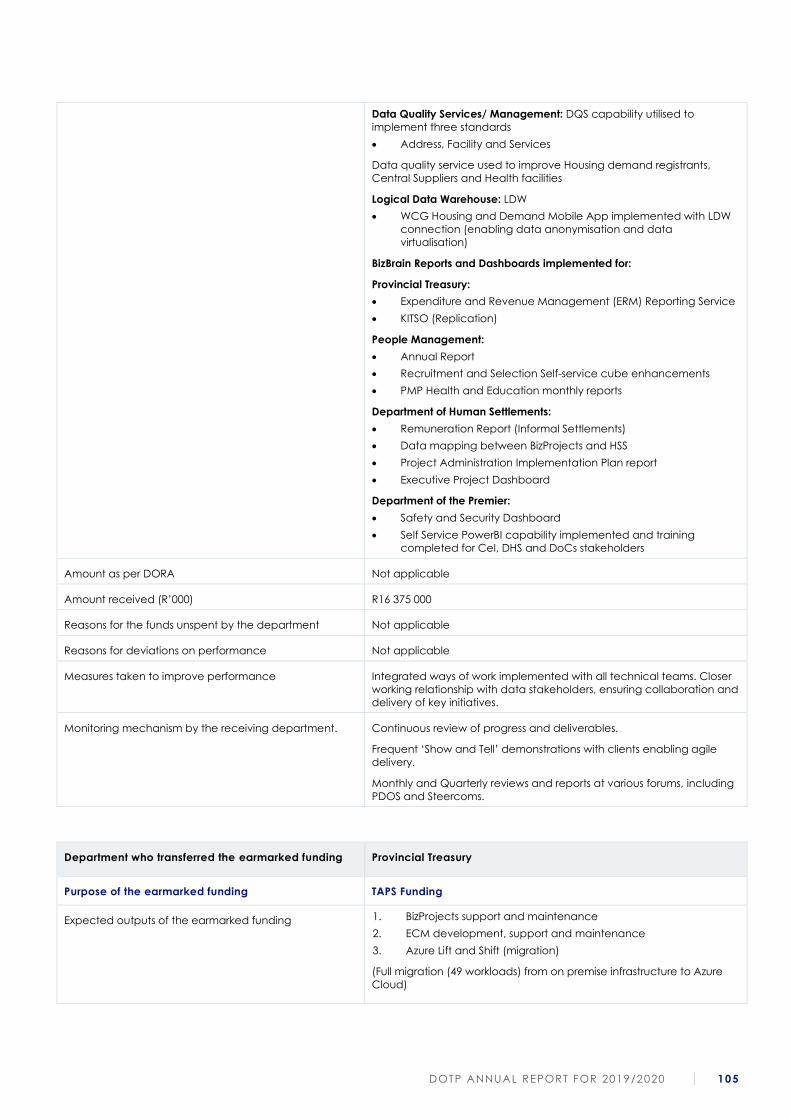
DOTP ANNUAL REPORT FOR 2019/2020 105
Data Quality Services/ Management: DQS capability utilised to
implement three standards
• Address, Facility and Services
Data quality service used to improve Housing demand registrants,
Central Suppliers and Health facilities
Logical Data Warehouse: LDW
• WCG Housing and Demand Mobile App implemented with LDW
connection (enabling data anonymisation and data
virtualisation)
BizBrain Reports and Dashboards implemented for:
Provincial Treasury:
• Expenditure and Revenue Management (ERM) Reporting Service
• KITSO (Replication)
People Management:
• Annual Report
• Recruitment and Selection Self-service cube enhancements
• PMP Health and Education monthly reports
Department of Human Settlements:
• Remuneration Report (Informal Settlements)
• Data mapping between BizProjects and HSS
• Project Administration Implementation Plan report
• Executive Project Dashboard
Department of the Premier:
• Safety and Security Dashboard
• Self Service PowerBI capability implemented and training
completed for CeI, DHS and DoCs stakeholders
Amount as per DORA Not applicable
Amount received (R’000) R16 375 000
Reasons for the funds unspent by the department Not applicable
Reasons for deviations on performance Not applicable
Measures taken to improve performance Integrated ways of work implemented with all technical teams. Closer
working relationship with data stakeholders, ensuring collaboration and
delivery of key initiatives.
Monitoring mechanism by the receiving department. Continuous review of progress and deliverables.
Frequent ‘Show and Tell’ demonstrations with clients enabling agile
delivery.
Monthly and Quarterly reviews and reports at various forums, including
PDOS and Steercoms.
Department who transferred the earmarked funding Provincial Treasury
Purpose of the earmarked funding TAPS Funding
Expected outputs of the earmarked funding 1. BizProjects support and maintenance
2. ECM development, support and maintenance
3. Azure Lift and Shift (migration)
(Full migration (49 workloads) from on premise infrastructure to Azure
Cloud)
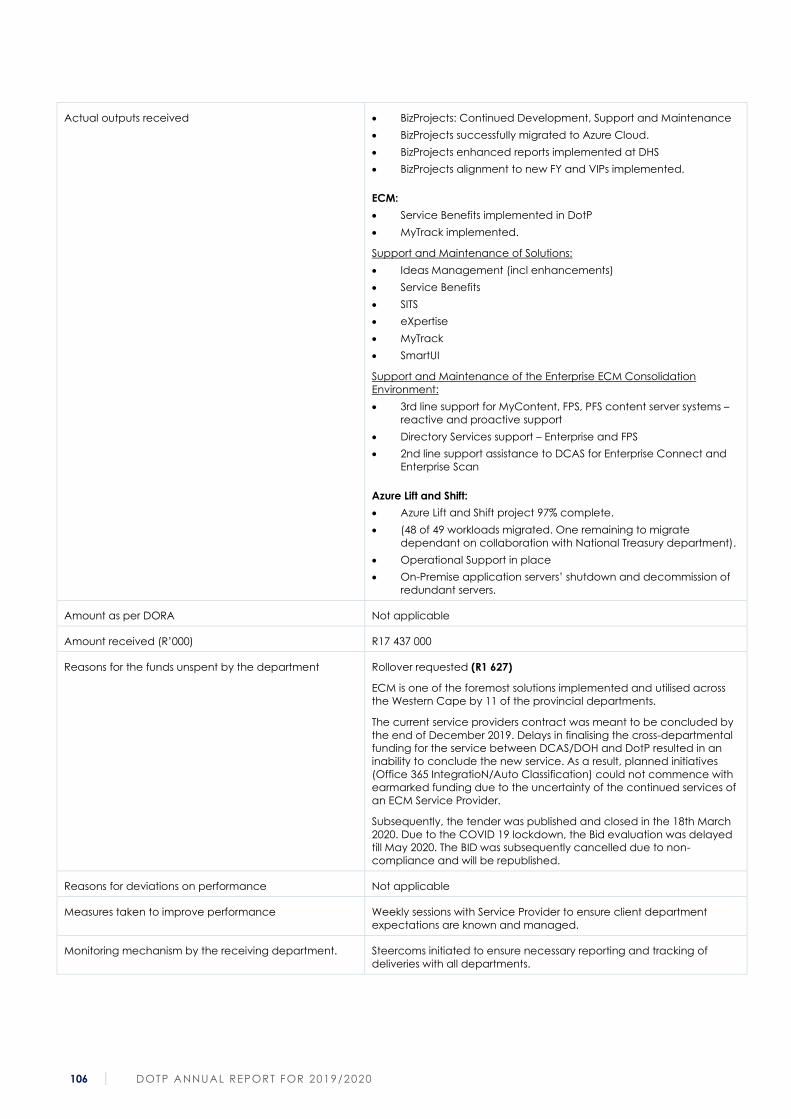
106 DOTP ANNUAL REPORT FOR 2019/2020
Actual outputs received • BizProjects: Continued Development, Support and Maintenance
• BizProjects successfully migrated to Azure Cloud.
• BizProjects enhanced reports implemented at DHS
• BizProjects alignment to new FY and VIPs implemented.
ECM:
• Service Benefits implemented in DotP
• MyTrack implemented.
Support and Maintenance of Solutions:
• Ideas Management (incl enhancements)
• Service Benefits
• SITS
• eXpertise
• MyTrack
• SmartUI
Support and Maintenance of the Enterprise ECM Consolidation
Environment:
• 3rd line support for MyContent, FPS, PFS content server systems –
reactive and proactive support
• Directory Services support – Enterprise and FPS
• 2nd line support assistance to DCAS for Enterprise Connect and
Enterprise Scan
Azure Lift and Shift:
• Azure Lift and Shift project 97% complete.
• (48 of 49 workloads migrated. One remaining to migrate
dependant on collaboration with National Treasury department).
• Operational Support in place
• On-Premise application servers’ shutdown and decommission of
redundant servers.
Amount as per DORA Not applicable
Amount received (R’000) R17 437 000
Reasons for the funds unspent by the department Rollover requested (R1 627)
ECM is one of the foremost solutions implemented and utilised across
the Western Cape by 11 of the provincial departments.
The current service providers contract was meant to be concluded by
the end of December 2019. Delays in finalising the cross-departmental
funding for the service between DCAS/DOH and DotP resulted in an
inability to conclude the new service. As a result, planned initiatives
(Office 365 IntegratioN/Auto Classification) could not commence with
earmarked funding due to the uncertainty of the continued services of
an ECM Service Provider.
Subsequently, the tender was published and closed in the 18th March
2020. Due to the COVID 19 lockdown, the Bid evaluation was delayed
till May 2020. The BID was subsequently cancelled due to non-
compliance and will be republished.
Reasons for deviations on performance Not applicable
Measures taken to improve performance Weekly sessions with Service Provider to ensure client department
expectations are known and managed.
Monitoring mechanism by the receiving department. Steercoms initiated to ensure necessary reporting and tracking of
deliveries with all departments.
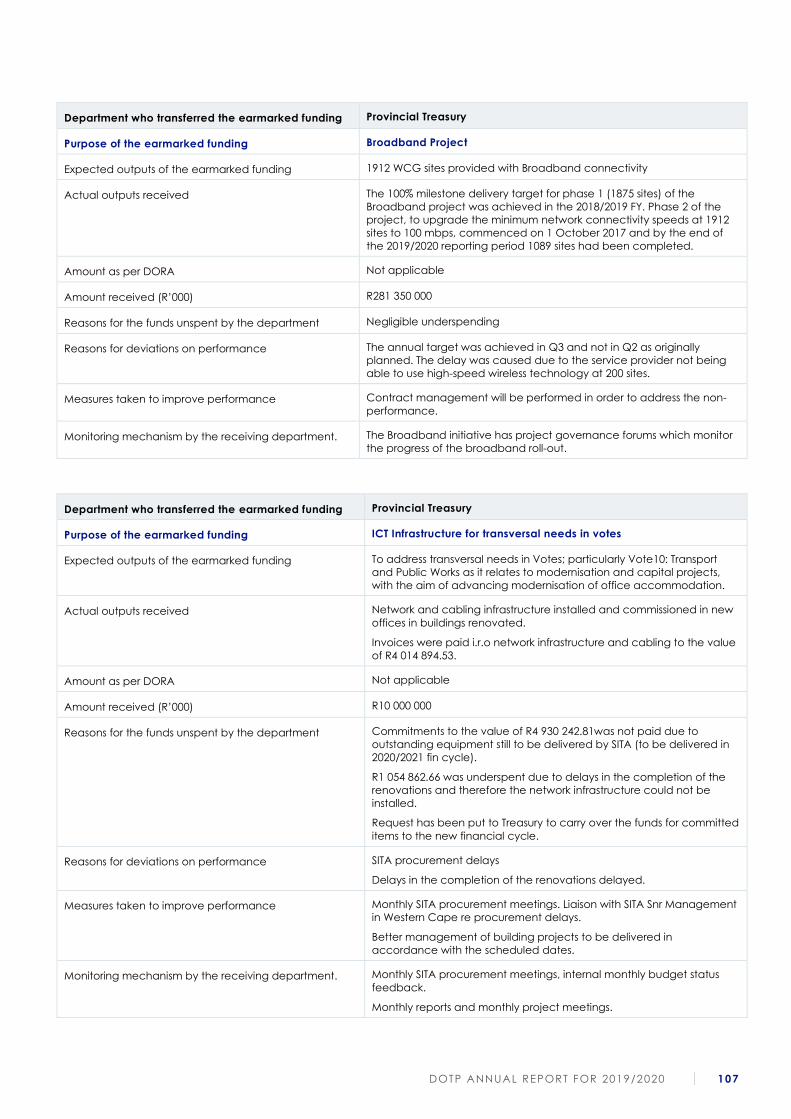
DOTP ANNUAL REPORT FOR 2019/2020 107
Department who transferred the earmarked funding Provincial Treasury
Purpose of the earmarked funding Broadband Project
Expected outputs of the earmarked funding 1912 WCG sites provided with Broadband connectivity
Actual outputs received The 100% milestone delivery target for phase 1 (1875 sites) of the
Broadband project was achieved in the 2018/2019 FY. Phase 2 of the
project, to upgrade the minimum network connectivity speeds at 1912
sites to 100 mbps, commenced on 1 October 2017 and by the end of
the 2019/2020 reporting period 1089 sites had been completed.
Amount as per DORA Not applicable
Amount received (R’000) R281 350 000
Reasons for the funds unspent by the department Negligible underspending
Reasons for deviations on performance The annual target was achieved in Q3 and not in Q2 as originally
planned. The delay was caused due to the service provider not being
able to use high-speed wireless technology at 200 sites.
Measures taken to improve performance Contract management will be performed in order to address the non-
performance.
Monitoring mechanism by the receiving department. The Broadband initiative has project governance forums which monitor
the progress of the broadband roll-out.
Department who transferred the earmarked funding Provincial Treasury
Purpose of the earmarked funding ICT Infrastructure for transversal needs in votes
Expected outputs of the earmarked funding To address transversal needs in Votes; particularly Vote10: Transport
and Public Works as it relates to modernisation and capital projects,
with the aim of advancing modernisation of office accommodation.
Actual outputs received Network and cabling infrastructure installed and commissioned in new
offices in buildings renovated.
Invoices were paid i.r.o network infrastructure and cabling to the value
of R4 014 894.53.
Amount as per DORA Not applicable
Amount received (R’000) R10 000 000
Reasons for the funds unspent by the department Commitments to the value of R4 930 242.81was not paid due to
outstanding equipment still to be delivered by SITA (to be delivered in
2020/2021 fin cycle).
R1 054 862.66 was underspent due to delays in the completion of the
renovations and therefore the network infrastructure could not be
installed.
Request has been put to Treasury to carry over the funds for committed
items to the new financial cycle.
Reasons for deviations on performance SITA procurement delays
Delays in the completion of the renovations delayed.
Measures taken to improve performance Monthly SITA procurement meetings. Liaison with SITA Snr Management
in Western Cape re procurement delays.
Better management of building projects to be delivered in
accordance with the scheduled dates.
Monitoring mechanism by the receiving department. Monthly SITA procurement meetings, internal monthly budget status
feedback.
Monthly reports and monthly project meetings.
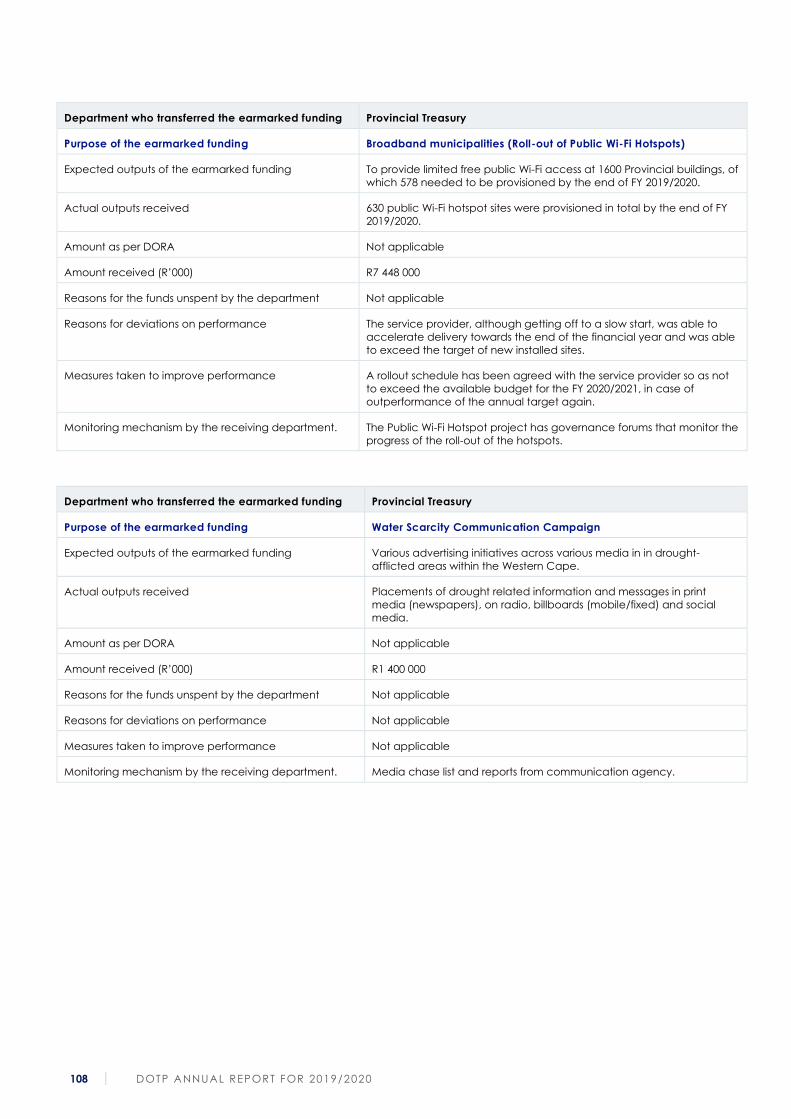
108 DOTP ANNUAL REPORT FOR 2019/2020
Department who transferred the earmarked funding Provincial Treasury
Purpose of the earmarked funding Broadband municipalities (Roll-out of Public Wi-Fi Hotspots)
Expected outputs of the earmarked funding To provide limited free public Wi-Fi access at 1600 Provincial buildings, of
which 578 needed to be provisioned by the end of FY 2019/2020.
Actual outputs received 630 public Wi-Fi hotspot sites were provisioned in total by the end of FY
2019/2020.
Amount as per DORA Not applicable
Amount received (R’000) R7 448 000
Reasons for the funds unspent by the department Not applicable
Reasons for deviations on performance The service provider, although getting off to a slow start, was able to
accelerate delivery towards the end of the financial year and was able
to exceed the target of new installed sites.
Measures taken to improve performance A rollout schedule has been agreed with the service provider so as not
to exceed the available budget for the FY 2020/2021, in case of
outperformance of the annual target again.
Monitoring mechanism by the receiving department. The Public Wi-Fi Hotspot project has governance forums that monitor the
progress of the roll-out of the hotspots.
Department who transferred the earmarked funding Provincial Treasury
Purpose of the earmarked funding Water Scarcity Communication Campaign
Expected outputs of the earmarked funding Various advertising initiatives across various media in in drought-
afflicted areas within the Western Cape.
Actual outputs received Placements of drought related information and messages in print
media (newspapers), on radio, billboards (mobile/fixed) and social
media.
Amount as per DORA Not applicable
Amount received (R’000) R1 400 000
Reasons for the funds unspent by the department Not applicable
Reasons for deviations on performance Not applicable
Measures taken to improve performance Not applicable
Monitoring mechanism by the receiving department. Media chase list and reports from communication agency.
DOTP ANNUAL REPORT FOR 2019/2020 109
7. DONOR FUNDS
7.1. Donor funds received
During the period under review the department received no donor funds.
8. CAPITAL INVESTMENT
8.1. Capital investment, maintenance and asset management plan
The Department’s capital investments are restricted to the movable assets in respect of computer
equipment (infrastructure and end user) and furniture.
Details regarding the amounts in respect of the movable assets of the Department can be found in
note 26 of the Annual Financial Statements. The asset register is updated immediately with acquisitions,
disposals and any other movements of assets. Information Technology assets include a three-year warranty
in the event that an asset breaks down.
The Department submitted its input in terms of the Government Immovable Asset Management Act, 2007
(GIAMA) to the provincial Department of Transport and Public Works.

110 DOTP ANNUAL REPORT FOR 2019/2020
PART C: GOVERNANCE

DOTP ANNUAL REPORT FOR 2019/2020 111
112 DOTP ANNUAL REPORT FOR 2019/2020
1. INTRODUCTION
The leadership team of the Department of the Premier is committed to maintaining the highest standards
of ethics and governance and therefore strives to conform to the governance principles highlighted in the
King IV Report on Corporate Governance for South Africa released in 2016. In terms of these principles, the
Department’s governance structures are made up as follows:
• an Executive Committee that facilitates decision making by top management on various strategic
and governance matters requiring joint consideration and decision making. This Executive
Committee also constitutes the Department’s Enterprise Risk Management Committee (which is
dealt with in more detail in paragraph 2), the Department’s Ethics Committee as well as the
Department’s Information Technology Strategic Committee. For this purpose, EXCO convenes for a
distinct meeting as the Department’s Governance Committee. An independent shared Audit
Committee provides independent oversight over governance, risk management and control
processes of the Department;
• an independent Internal Audit function providing independent assurance that the controls in place
to manage and mitigate risks are adequate and functioning effectively;
• a Departmental Information Technology Steering Committee that facilitates the implementation of
the Corporate Governance of Information Technology Charter and whose chairperson serves as the
Department’s IT Governance champion and represents the Department on the WCG Information
Technology Steering Committee. These structures are aligned to the Control Objectives for
Information and Related Technology (COBIT) framework; and
• a number of committees that assist the Accounting Officer and Executive Committee in governing
the business of the Department in a fair, responsible and transparent manner.
2. RISK MANAGEMENT
The Accounting Officer (AO) for the Department takes responsibility for implementing Enterprise Risk
Management (ERM) in accordance with the National Treasury Public Sector Risk Management Framework
(PSRMF) and the Directorate Enterprise Risk Management (D:ERM) in the Department of the Premier (DotP)
provides a centralised service to the Department. The Department established a Governance Committee
(GOVCOM) to assist the Accounting Officer in executing his responsibilities relating to risk management.
GOVERNANCE COMMITTEE RESPONSIBILITY
The Governance Committee (GOVCOM) reports that it has complied with its responsibilities arising from
Section 38 (1)(a)(i) of the Public Finance Management Act, Treasury Regulation 3.2.1 and Public Service
Regulations of 2016, Chapter 2, Part 1, 2 and 3. The GOVCOM also reports that it has adopted an
appropriate formal Terms of Reference (approved by the GOVCOM chairperson on 17 April 2018) and
regulated its affairs in compliance with this Terms of Reference and has discharged all its responsibilities as
contained therein.
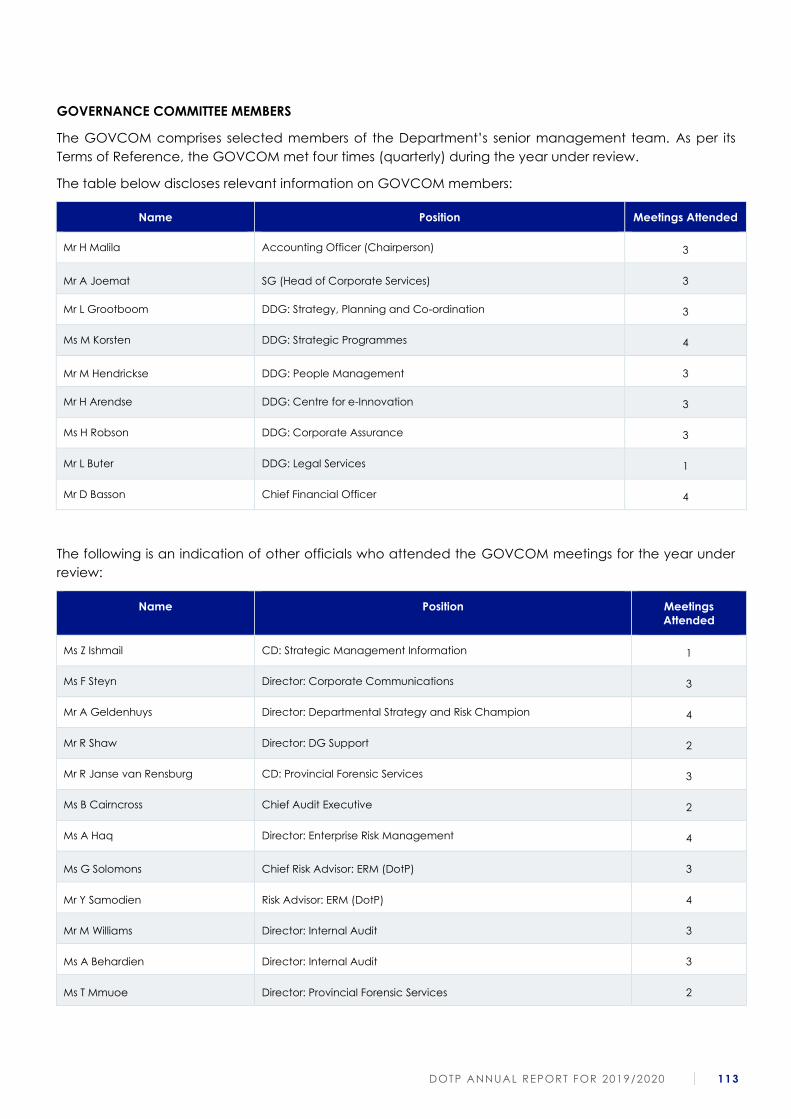
DOTP ANNUAL REPORT FOR 2019/2020 113
GOVERNANCE COMMITTEE MEMBERS
The GOVCOM comprises selected members of the Department’s senior management team. As per its
Terms of Reference, the GOVCOM met four times (quarterly) during the year under review.
The table below discloses relevant information on GOVCOM members:
Name Position Meetings Attended
Mr H Malila Accounting Officer (Chairperson) 3
Mr A Joemat SG (Head of Corporate Services) 3
Mr L Grootboom DDG: Strategy, Planning and Co-ordination 3
Ms M Korsten DDG: Strategic Programmes 4
Mr M Hendrickse DDG: People Management 3
Mr H Arendse DDG: Centre for e-Innovation 3
Ms H Robson DDG: Corporate Assurance 3
Mr L Buter DDG: Legal Services 1
Mr D Basson Chief Financial Officer 4
The following is an indication of other officials who attended the GOVCOM meetings for the year under
review:
Name Position Meetings
Attended
Ms Z Ishmail CD: Strategic Management Information 1
Ms F Steyn Director: Corporate Communications 3
Mr A Geldenhuys Director: Departmental Strategy and Risk Champion 4
Mr R Shaw Director: DG Support 2
Mr R Janse van Rensburg CD: Provincial Forensic Services 3
Ms B Cairncross Chief Audit Executive 2
Ms A Haq Director: Enterprise Risk Management 4
Ms G Solomons Chief Risk Advisor: ERM (DotP) 3
Mr Y Samodien Risk Advisor: ERM (DotP) 4
Mr M Williams Director: Internal Audit 3
Ms A Behardien Director: Internal Audit 3
Ms T Mmuoe Director: Provincial Forensic Services 2
114 DOTP ANNUAL REPORT FOR 2019/2020
GOVCOM COMMITTEE KEY ACTIVITIES
The Accounting Officer is the chairperson of the GOVCOM. In executing its function, the GOVCOM
performed the following key activities during the year:
• assessed the implementation of the departmental Risk Management Policy, Strategy and
Implementation Plan;
• reported to the Accounting Officer any material changes to the risk profile of the Department;
• evaluated the effectiveness and mitigating strategies to address the material strategic, programme,
ethics and economic crime risks;
• evaluated the effectiveness of the implementation of the Fraud and Corruption Prevention
Implementation Plan;
• assessed the implementation of the departmental Ethics Management Implementation Plan; and
• provided oversight on ethics management in the Department.
KEY RISKS CONSIDERED AND ADDRESSED DURING THE YEAR
The following are key strategic risks for the Department that were reviewed on a quarterly basis, including
assessing the mitigations in place:
• Inadequate financial resources resulting in risk to DotP fulfilling its mandate to enable service delivery
departments to effectively deliver services to citizens. This risk remains a key concern given the
economic conditions facing the country and the deteriorating national fiscal climate. The
Department implemented relevant cost containment measures across the Department and
continuously prioritised projects and posts to be filled.
• The inability of WCG stakeholders (e.g. citizen, National, Provincial, and Local SOEs) to access
services or related information that are dependent on critical ICT solutions. This risk was raised after
other SA organisations experienced cyber-attacks on their ICT systems. In the WCG context, ageing
ICT infrastructure, the sustained load shedding, and 3rd-party weaknesses contributed to this risk. The
WCG invested heavily in cloud-based ICT solutions, which is in the process of being implemented.
This risk will be reassessed after the successful migration to these cloud-based solutions and an
evaluation of third-party controls.
• Unauthorised access is obtained to WCG stakeholder information via an external or internal ICT-
enabled attack. In this regard the WCG invested in ICT security infrastructure and software to
proactively assess the security vulnerabilities in the ICT environment. The Ce-I continues to apply due
diligence and build on the necessary security capabilities to strengthen the WCG’s security posture.
• The inability of the Ce-I to deliver stable and reliable Broadband services that enable Departmental
services that are dependent on network connectivity. The Broadband project was one of the flagship
programmes of the Western Cape Government and impacted flagship projects from other
Departments (e.g. e-Learning). The key concerns with the Broadband project were the ability to
deliver key milestones in line with the project schedule within budget. The risk was managed through
oversight by the Broadband Steering Committee, the ICT Steering committee as well as the Audit
Committee. Further to this, a dedicated contract management unit was established to manage,
monitor and evaluate all aspects pertaining to the Broadband project.
Each programme’s risks were deliberated/debated at the quarterly GOVCOM meetings. Programme
managers were required to provide feedback on progress with implementation of action plans to reduce
DOTP ANNUAL REPORT FOR 2019/2020 115
the likelihood of risks materialising and/or the impact should they materialise. GOVCOM also referred risks
back that should be analysed more extensively and recommended additional mitigations or actions to
manage risks.
The Governance and Administration Cluster Audit Committee provided independent oversight of the
Department’s system of risk management. The Audit Committee was furnished with Quarterly ERM progress
reports and risk registers to execute their independent oversight role.
KEY EMERGING RISKS FOR THE FOLLOWING FINANCIAL YEAR
The emerging risk relating to recovering and continuing the business of the Department and the broader
WCG during and after the COVID-19 pandemic needs to be considered in the next financial year. The
Department also plays a leading role in coordinating the province’s response to the pandemic as well as
guidance towards provincial and departmental strategic plans that will have an impact on its service
delivery for the current financial year.
CONCLUSION
“The Department’s risk management processes continued to be embedded in the strategic and
operational processes. During the period under review, significant progress was made with the
implementation of action plans through focused management interventions. Enterprise risk management
contributed to the effective and efficient functioning of the Department.”
3. FRAUD AND CORRUPTION
Fraud and corruption represent significant potential risks to the Department’s assets and could negatively
impact on service delivery efficiency and the Department’s reputation.
The WCG adopted an Anti-Fraud and Corruption Strategy that confirms the Province’s zero-tolerance
stance towards fraud, theft and corruption. In line with this strategy the Department is committed to zero
tolerance with regard to corrupt, fraudulent or any other criminal activities, whether internal or external,
and vigorously pursues and prosecutes, by all legal means available, any parties who engage in such
practices or attempts to do so.
The Department has an approved Fraud and Corruption Prevention Plan and a concomitant
Implementation Plan that gives effect to the Prevention Plan.
Various channels for reporting allegations of fraud, theft and corruption exist and these are described in
detail in the Provincial Anti-Fraud and Corruption Strategy, the WCG Whistle-blowing Policy and the
Departmental Fraud and Corruption Prevention Plan. Each allegation received by the Provincial Forensic
Services (PFS) Unit is recorded in a Case Management System, which is used as a management tool to
report on progress made with cases relating to the Department and to generate statistics for the WCG and
the Department.
Employees and workers who blow the whistle on suspicions of fraud, corruption and theft are protected if
the disclosure is a protected disclosure (i.e. meets statutory requirements of the Protected Disclosures Act,
No. 26 of 2000 e.g. if the disclosure was made in good faith). The WCG Whistle-blowing Policy provides
guidelines to employees and workers on how to raise concerns with the appropriate line management,
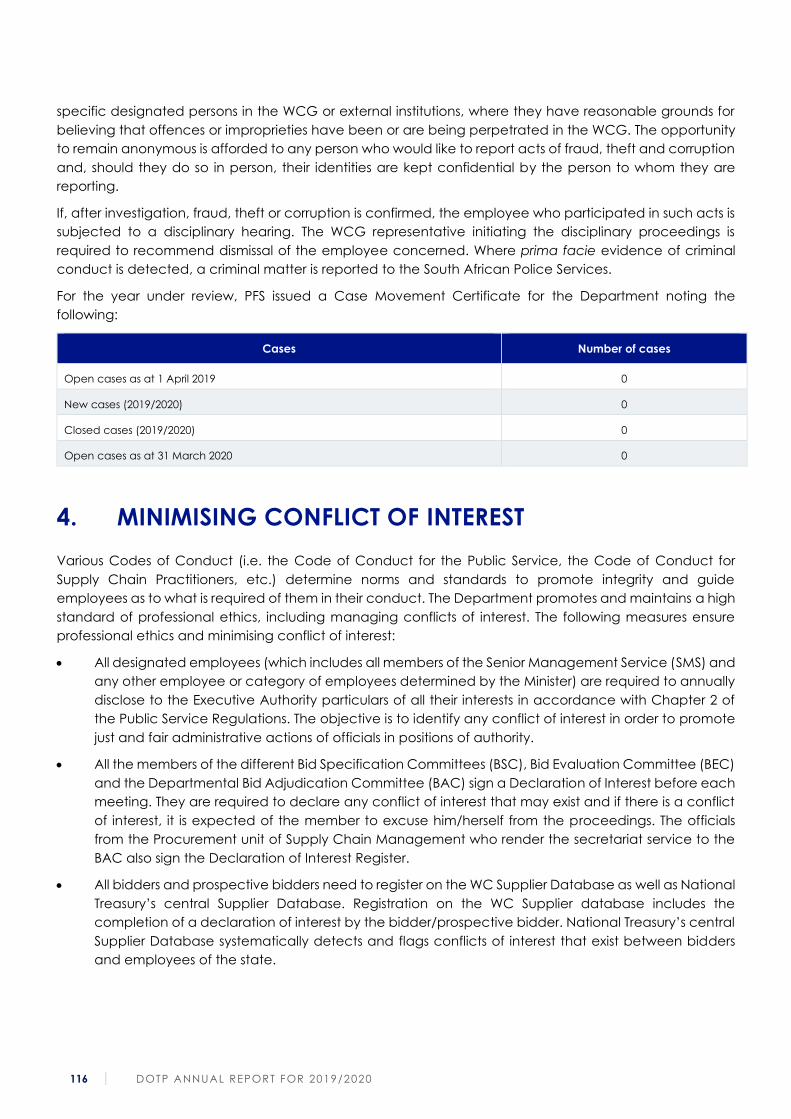
116 DOTP ANNUAL REPORT FOR 2019/2020
specific designated persons in the WCG or external institutions, where they have reasonable grounds for
believing that offences or improprieties have been or are being perpetrated in the WCG. The opportunity
to remain anonymous is afforded to any person who would like to report acts of fraud, theft and corruption
and, should they do so in person, their identities are kept confidential by the person to whom they are
reporting.
If, after investigation, fraud, theft or corruption is confirmed, the employee who participated in such acts is
subjected to a disciplinary hearing. The WCG representative initiating the disciplinary proceedings is
required to recommend dismissal of the employee concerned. Where prima facie evidence of criminal
conduct is detected, a criminal matter is reported to the South African Police Services.
For the year under review, PFS issued a Case Movement Certificate for the Department noting the
following:
Cases Number of cases
Open cases as at 1 April 2019 0
New cases (2019/2020) 0
Closed cases (2019/2020) 0
Open cases as at 31 March 2020 0
4. MINIMISING CONFLICT OF INTEREST
Various Codes of Conduct (i.e. the Code of Conduct for the Public Service, the Code of Conduct for
Supply Chain Practitioners, etc.) determine norms and standards to promote integrity and guide
employees as to what is required of them in their conduct. The Department promotes and maintains a high
standard of professional ethics, including managing conflicts of interest. The following measures ensure
professional ethics and minimising conflict of interest:
• All designated employees (which includes all members of the Senior Management Service (SMS) and
any other employee or category of employees determined by the Minister) are required to annually
disclose to the Executive Authority particulars of all their interests in accordance with Chapter 2 of
the Public Service Regulations. The objective is to identify any conflict of interest in order to promote
just and fair administrative actions of officials in positions of authority.
• All the members of the different Bid Specification Committees (BSC), Bid Evaluation Committee (BEC)
and the Departmental Bid Adjudication Committee (BAC) sign a Declaration of Interest before each
meeting. They are required to declare any conflict of interest that may exist and if there is a conflict
of interest, it is expected of the member to excuse him/herself from the proceedings. The officials
from the Procurement unit of Supply Chain Management who render the secretariat service to the
BAC also sign the Declaration of Interest Register.
• All bidders and prospective bidders need to register on the WC Supplier Database as well as National
Treasury’s central Supplier Database. Registration on the WC Supplier database includes the
completion of a declaration of interest by the bidder/prospective bidder. National Treasury’s central
Supplier Database systematically detects and flags conflicts of interest that exist between bidders
and employees of the state.
DOTP ANNUAL REPORT FOR 2019/2020 117
• The Provincial Treasury compares the identity numbers of all officials on the PERSAL salary system of
Departments to those of service providers registered on the Western Cape Supplier Database on a
quarterly basis.
• Employees who wish to perform remunerative work outside of the public service must apply for
relevant approval, in line with the Public Service regulations, and more specifically the Directive on
Other Remunerative Work Outside the employee’s employment in the relevant department issued
by the Minister for Public Service and Administration on 30 September 2016.
• Last, the Department has a gift policy that indicates that all gifts must be declared in a gift register
per Chief Directorate, and gifts above R350 must receive prior approval from the delegated
authority. This is in addition to the declaration of gifts and hospitality from sources other than a family
member that is part of the financial disclosure process indicated in the first bullet.
Should a conflict of interest be identified in any of the abovementioned processes, this will be investigated
and the results of the investigation will determine the most appropriate action to be taken by the
Department in line with the Disciplinary Code and Procedures for Public Service.
5. CODE OF CONDUCT
The Department fully supports the Public Sector Code of Conduct as per the Public Service Regulations
issued in 2016, and all employees are expected to comply with its standards. The Public Sector Code of
Conduct addresses employee behaviour in the workplace and contributes to the Department’s drive to
maintain the highest levels of ethics, the eradication of incidents of corruption and the promotion of good
governance. During the induction, new appointees are made aware of the Code of Conduct, and they
receive a copy thereof. All new employees are furthermore informed in their letters of appointment that
the Code of Conduct is available on the WCG website.
It is noted that the primary purpose of the Code of Conduct is a positive one, namely to promote exemplary
conduct. Notwithstanding this, an employee shall be guilty of misconduct and may be subject to
disciplinary action if he or she contravenes any provision of the Code of Conduct.
There are a number of “profession-specific” codes of conduct, including the Code of Conduct for Supply
Chain Management Practitioners and the relevant practitioners/ professionals are required to
acknowledge that they will abide by these Codes.
6. HEALTH SAFETY AND ENVIRONMENTAL ISSUES
During the year under review the Department of the Premier put various measures in place to ensure a
healthy and safe environment at the workplace. These measures contributed indirectly to the
achievement of the Provincial Strategic Goal 5 (PSG 5) and “embedded good governance and
integrated service delivery through partnerships and spatial alignment”. The interventions contributed to
“ensuring efficient, effective and responsive Provincial Government Governance” and thus PSG5.
Most of the interventions implemented during the course of the year were aimed at increasing minimum
levels of compliance to the provisions of Occupational Health and Safety Act, 1993 (Act 85 of 1993) and
its Regulations.
In respect of Occupational Health and Safety Administration, the database of emergency team members
was continuously updated and maintained as incumbents moved in and out of the Department. The
118 DOTP ANNUAL REPORT FOR 2019/2020
emergency teams consist of fire marshals, floor marshals, first aiders, emergency controllers and evacuation
chair handlers and were maintained for every floor in all the buildings where the Department occupies
space. The drafting of a departmental Occupational Health and Safety Policy commenced with guidance
from the newly appointed Deputy Director, WCG Occupational Health and Safety at the Department of
Community Safety. Four (4) meetings of the Departmental Occupational Health and Safety Committee
were held to consider Health, Safety and Environmental matters.
A major milestone was the appointment of two coordinating Occupational Health and Safety Committees;
one each for multi-tenanted buildings at 4 Dorp Street between the Departments of the Premier, Health
and the Provincial Treasury and one at 7 Wale Street between the Department of the Premier, the
Provincial Treasury and the Western Cape Provincial Parliament. These liaison committees are aimed at
streamlining health and safety related matters at these buildings and to draft a consolidated contingency
plan for each of the buildings.
Fourteen (14) formal and informal OHS-related incidences were reported and attended to during the year
under review. These ranged from employees involved in trip and fall incidents; a small fire in a dustbin on
the balcony; an employee passing away at the office due to a heart attack; complaints received during
extreme heat conditions; an official injuring himself with office equipment; water damages in the office
due to burst pipes; and assisting a contractor who fell ill at work and was assisted and supported to hospital.
In respect of contingency planning, the Department conducted evacuations and dry runs in eleven (11)
buildings on forty-four (44) floors where employees were accommodated. Employees displayed excellent
cooperation during these exercises. Effective dry run planning was done and meetings were scheduled
and diarised to ensure successful evacuations on all the floors in all the buildings in collaboration with the
Department of Community Safety. A significant improvement has been observed in how staff responded
to calls to evacuate the building. Emergency team members were equipped with two-way radios for
better communication and were supplied with the necessary personal protective equipment.
Eleven (11) awareness/information sharing interventions on occupational health and safety matters were
conducted. This included information sharing i.e. guidance on Injury on duty, how to use an evacuation chair,
information on COVID-19 and other OHS related matters to all the business units within the Department.
Six (6) Occupational Health and Safety Representatives received training on the duties and functions of
these representatives. Two (2) representatives attended the Hazard Identification and Risk Assessment
training, and five (5) representatives attended the Preliminary Incident Investigation training. Occupational
Health and Safety Representatives also applied this training by conducting basic Hazard Identification and
Risk Assessments in the work areas that they are responsible for.
Ten (10) first aiders, twelve (12) floor marshals and six (6) fire marshals also underwent portfolio-related
training.
Five (5) OHS Reps resigned/retired/left service and the democratic election process which was developed
in-house was applied to elect and appoint new Health and Safety Representatives.
Workshops continued with the Department of Community Safety on the development of various specific
contingency plans.
With the onset of COVID-19, the Department developed, signed off and implemented a Pandemic Business
Continuity Plan. It also invoked emergency procurement measures to ensure that essential employees were
issued with masks and that alcohol-based hand sanitiser was made available to employees as a first
response. Biometric access was disabled, face-to-face meetings and travel were suspended prior to
lockdown. In the lead-up to lockdown, essential employees were identified and measures were put in
place to enable employees to work from home where possible.
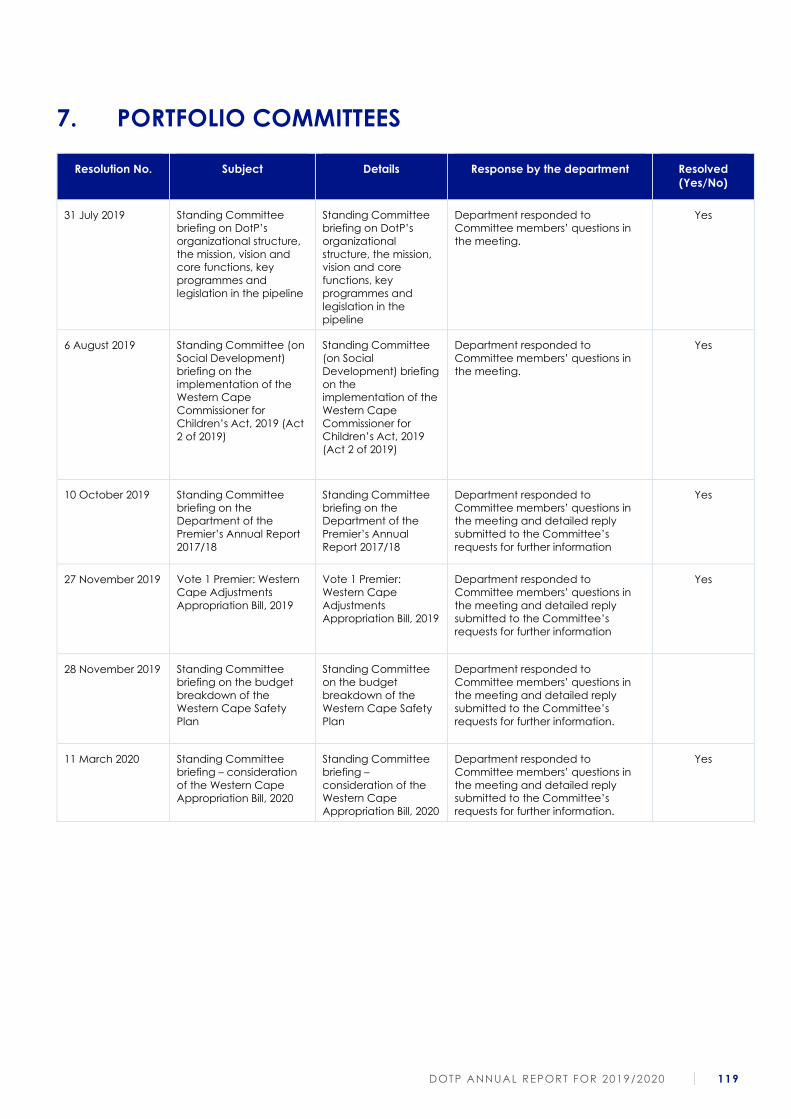
DOTP ANNUAL REPORT FOR 2019/2020 119
7. PORTFOLIO COMMITTEES
Resolution No. Subject Details Response by the department Resolved
(Yes/No)
31 July 2019 Standing Committee
briefing on DotP’s
organizational structure,
the mission, vision and
core functions, key
programmes and
legislation in the pipeline
Standing Committee
briefing on DotP’s
organizational
structure, the mission,
vision and core
functions, key
programmes and
legislation in the
pipeline
Department responded to
Committee members’ questions in
the meeting.
Yes
6 August 2019 Standing Committee (on
Social Development)
briefing on the
implementation of the
Western Cape
Commissioner for
Children’s Act, 2019 (Act
2 of 2019)
Standing Committee
(on Social
Development) briefing
on the
implementation of the
Western Cape
Commissioner for
Children’s Act, 2019
(Act 2 of 2019)
Department responded to
Committee members’ questions in
the meeting.
Yes
10 October 2019 Standing Committee
briefing on the
Department of the
Premier’s Annual Report
2017/18
Standing Committee
briefing on the
Department of the
Premier’s Annual
Report 2017/18
Department responded to
Committee members’ questions in
the meeting and detailed reply
submitted to the Committee’s
requests for further information
Yes
27 November 2019 Vote 1 Premier: Western
Cape Adjustments
Appropriation Bill, 2019
Vote 1 Premier:
Western Cape
Adjustments
Appropriation Bill, 2019
Department responded to
Committee members’ questions in
the meeting and detailed reply
submitted to the Committee’s
requests for further information
Yes
28 November 2019 Standing Committee
briefing on the budget
breakdown of the
Western Cape Safety
Plan
Standing Committee
on the budget
breakdown of the
Western Cape Safety
Plan
Department responded to
Committee members’ questions in
the meeting and detailed reply
submitted to the Committee’s
requests for further information.
11 March 2020 Standing Committee
briefing – consideration
of the Western Cape
Appropriation Bill, 2020
Standing Committee
briefing –
consideration of the
Western Cape
Appropriation Bill, 2020
Department responded to
Committee members’ questions in
the meeting and detailed reply
submitted to the Committee’s
requests for further information.
Yes
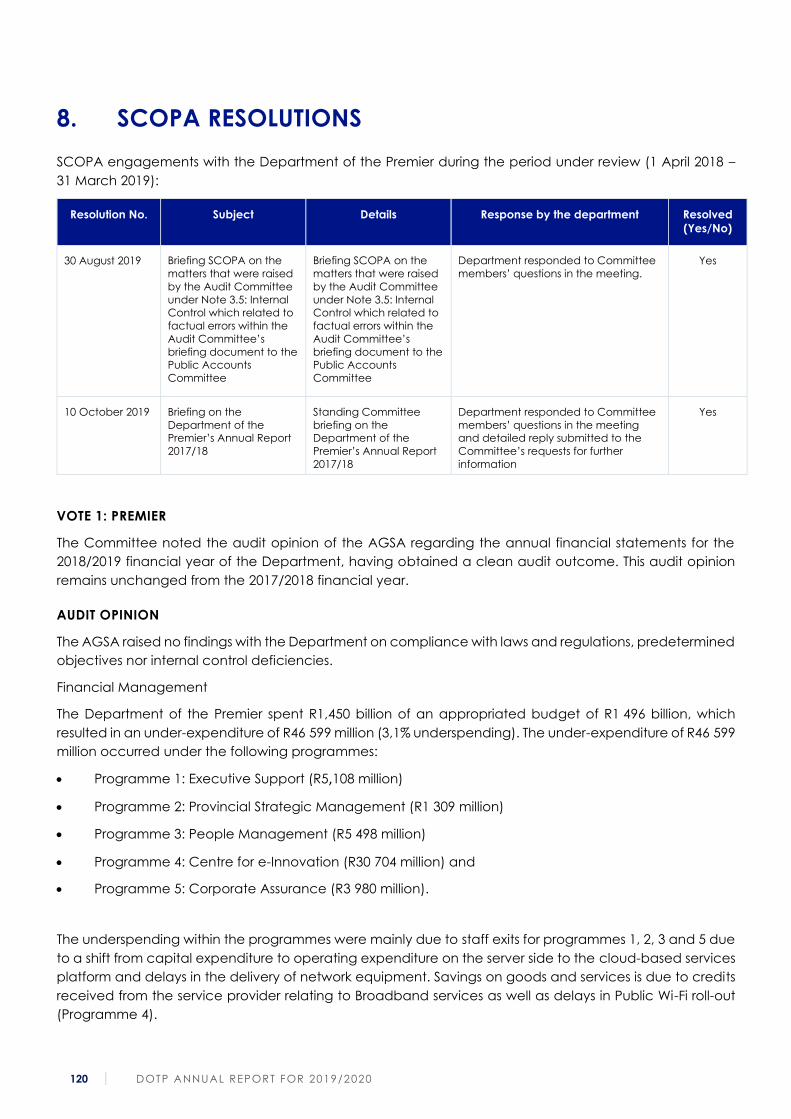
120 DOTP ANNUAL REPORT FOR 2019/2020
8. SCOPA RESOLUTIONS
SCOPA engagements with the Department of the Premier during the period under review (1 April 2018 –
31 March 2019):
Resolution No. Subject Details Response by the department Resolved
(Yes/No)
30 August 2019 Briefing SCOPA on the
matters that were raised
by the Audit Committee
under Note 3.5: Internal
Control which related to
factual errors within the
Audit Committee’s
briefing document to the
Public Accounts
Committee
Briefing SCOPA on the
matters that were raised
by the Audit Committee
under Note 3.5: Internal
Control which related to
factual errors within the
Audit Committee’s
briefing document to the
Public Accounts
Committee
Department responded to Committee
members’ questions in the meeting.
Yes
10 October 2019 Briefing on the
Department of the
Premier’s Annual Report
2017/18
Standing Committee
briefing on the
Department of the
Premier’s Annual Report
2017/18
Department responded to Committee
members’ questions in the meeting
and detailed reply submitted to the
Committee’s requests for further
information
Yes
VOTE 1: PREMIER
The Committee noted the audit opinion of the AGSA regarding the annual financial statements for the
2018/2019 financial year of the Department, having obtained a clean audit outcome. This audit opinion
remains unchanged from the 2017/2018 financial year.
AUDIT OPINION
The AGSA raised no findings with the Department on compliance with laws and regulations, predetermined
objectives nor internal control deficiencies.
Financial Management
The Department of the Premier spent R1,450 billion of an appropriated budget of R1 496 billion, which
resulted in an under-expenditure of R46 599 million (3,1% underspending). The under-expenditure of R46 599
million occurred under the following programmes:
• Programme 1: Executive Support (R5,108 million)
• Programme 2: Provincial Strategic Management (R1 309 million)
• Programme 3: People Management (R5 498 million)
• Programme 4: Centre for e-Innovation (R30 704 million) and
• Programme 5: Corporate Assurance (R3 980 million).
The underspending within the programmes were mainly due to staff exits for programmes 1, 2, 3 and 5 due
to a shift from capital expenditure to operating expenditure on the server side to the cloud-based services
platform and delays in the delivery of network equipment. Savings on goods and services is due to credits
received from the service provider relating to Broadband services as well as delays in Public Wi-Fi roll-out
(Programme 4).
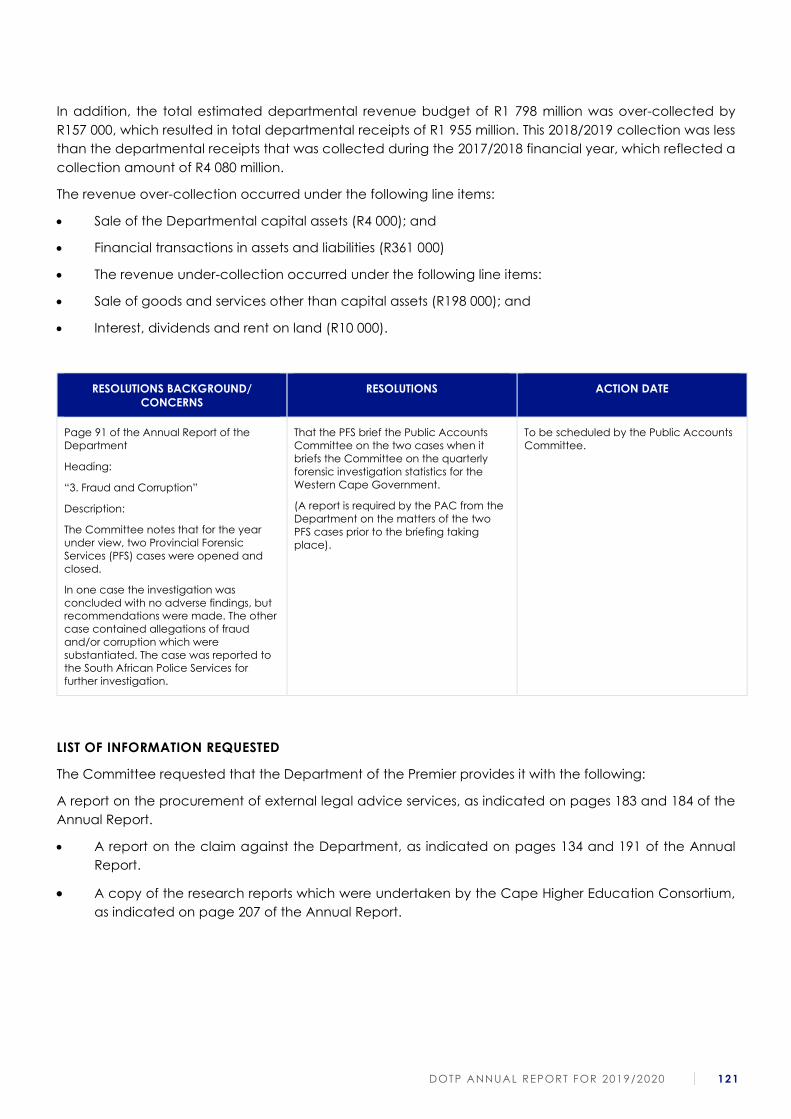
DOTP ANNUAL REPORT FOR 2019/2020 121
In addition, the total estimated departmental revenue budget of R1 798 million was over-collected by
R157 000, which resulted in total departmental receipts of R1 955 million. This 2018/2019 collection was less
than the departmental receipts that was collected during the 2017/2018 financial year, which reflected a
collection amount of R4 080 million.
The revenue over-collection occurred under the following line items:
• Sale of the Departmental capital assets (R4 000); and
• Financial transactions in assets and liabilities (R361 000)
• The revenue under-collection occurred under the following line items:
• Sale of goods and services other than capital assets (R198 000); and
• Interest, dividends and rent on land (R10 000).
RESOLUTIONS BACKGROUND/
CONCERNS
RESOLUTIONS ACTION DATE
Page 91 of the Annual Report of the
Department
Heading:
“3. Fraud and Corruption”
Description:
The Committee notes that for the year
under view, two Provincial Forensic
Services (PFS) cases were opened and
closed.
In one case the investigation was
concluded with no adverse findings, but
recommendations were made. The other
case contained allegations of fraud
and/or corruption which were
substantiated. The case was reported to
the South African Police Services for
further investigation.
That the PFS brief the Public Accounts
Committee on the two cases when it
briefs the Committee on the quarterly
forensic investigation statistics for the
Western Cape Government.
(A report is required by the PAC from the
Department on the matters of the two
PFS cases prior to the briefing taking
place).
To be scheduled by the Public Accounts
Committee.
LIST OF INFORMATION REQUESTED
The Committee requested that the Department of the Premier provides it with the following:
A report on the procurement of external legal advice services, as indicated on pages 183 and 184 of the
Annual Report.
• A report on the claim against the Department, as indicated on pages 134 and 191 of the Annual
Report.
• A copy of the research reports which were undertaken by the Cape Higher Education Consortium,
as indicated on page 207 of the Annual Report.
122 DOTP ANNUAL REPORT FOR 2019/2020
9. INTERNAL AUDIT AND AUDIT COMMITTEES
Internal Audit provides management with independent, objective assurance and consulting services
designed to add value and to continuously improve the operations of the Department. It should assist the
Department to accomplish its objectives by bringing a systematic, disciplined approach to evaluate and
improve the effectiveness of Governance, Risk Management and Control processes. The following key
activities are performed in this regard:
• Assess and make appropriate recommendations for improving the governance processes in
achieving the department’s objectives;
• Evaluate the adequacy and effectiveness and contribute to the improvement of the risk
management process;
• Assist the Accounting Officer in maintaining efficient and effective controls by evaluating those
controls to determine their effectiveness and efficiency, and by developing recommendations for
enhancement or improvement.
Internal Audit work completed during the year under review for the Department included six assurance
audits, two consulting engagements and 14 follow-up audits. The details of these engagements are
included in the Audit Committee report.
The Audit Committee is established as an oversight body, providing independent oversight over
governance, risk management and control processes in the Department, which include oversight and
review of the following:
• Internal Audit function;
• External Audit function (Auditor-General of South Africa - AGSA);
• Departmental Accounting and reporting;
• Departmental Accounting Policies;
• AGSA management and audit report;
• Departmental In year Monitoring;
• Departmental Risk Management;
• Internal Control;
• Pre-determined objectives;
• Ethics and Forensic Investigations.
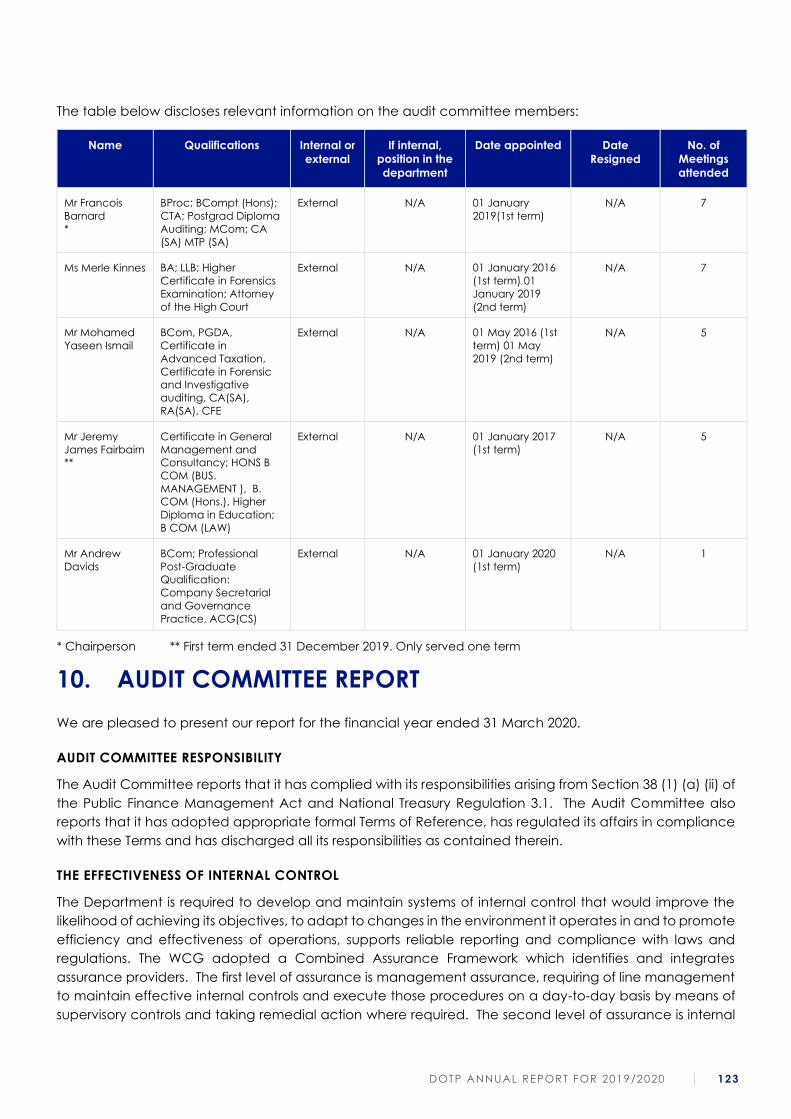
DOTP ANNUAL REPORT FOR 2019/2020 123
The table below discloses relevant information on the audit committee members:
Name Qualifications Internal or
external
If internal,
position in the
department
Date appointed Date
Resigned
No. of
Meetings
attended
Mr Francois
Barnard
*
BProc; BCompt (Hons);
CTA; Postgrad Diploma
Auditing; MCom; CA
(SA) MTP (SA)
External N/A 01 January
2019(1st term)
N/A 7
Ms Merle Kinnes BA; LLB; Higher
Certificate in Forensics
Examination; Attorney
of the High Court
External N/A 01 January 2016
(1st term) 01
January 2019
(2nd term)
N/A 7
Mr Mohamed
Yaseen Ismail
BCom, PGDA,
Certificate in
Advanced Taxation,
Certificate in Forensic
and Investigative
auditing, CA(SA),
RA(SA), CFE
External N/A 01 May 2016 (1st
term) 01 May
2019 (2nd term)
N/A 5
Mr Jeremy
James Fairbairn
**
Certificate in General
Management and
Consultancy; HONS B
COM (BUS.
MANAGEMENT ), B.
COM (Hons.), Higher
Diploma in Education;
B COM (LAW)
External N/A 01 January 2017
(1st term)
N/A 5
Mr Andrew
Davids
BCom; Professional
Post-Graduate
Qualification:
Company Secretarial
and Governance
Practice, ACG(CS)
External N/A 01 January 2020
(1st term)
N/A 1
* Chairperson ** First term ended 31 December 2019. Only served one term
10. AUDIT COMMITTEE REPORT
We are pleased to present our report for the financial year ended 31 March 2020.
AUDIT COMMITTEE RESPONSIBILITY
The Audit Committee reports that it has complied with its responsibilities arising from Section 38 (1) (a) (ii) of
the Public Finance Management Act and National Treasury Regulation 3.1. The Audit Committee also
reports that it has adopted appropriate formal Terms of Reference, has regulated its affairs in compliance
with these Terms and has discharged all its responsibilities as contained therein.
THE EFFECTIVENESS OF INTERNAL CONTROL
The Department is required to develop and maintain systems of internal control that would improve the
likelihood of achieving its objectives, to adapt to changes in the environment it operates in and to promote
efficiency and effectiveness of operations, supports reliable reporting and compliance with laws and
regulations. The WCG adopted a Combined Assurance Framework which identifies and integrates
assurance providers. The first level of assurance is management assurance, requiring of line management
to maintain effective internal controls and execute those procedures on a day-to-day basis by means of
supervisory controls and taking remedial action where required. The second level of assurance is internal
124 DOTP ANNUAL REPORT FOR 2019/2020
assurance provided by functions separate from direct line management, entrusted with assessing
adherence to policies, procedures, norms, standards and frameworks. The third level of assurance is
independent assurance providers that are guided by professional standards requiring the highest levels of
independence.
A risk-based Combined Assurance Plan was developed for the Department, facilitated by Internal Audit,
who is also an independent assurance provider. Internal Audit provides the Audit Committee and
Management with reasonable assurance that the internal controls are adequate and effective. This is
achieved by an approved risk-based internal audit plan, Internal Audit assessing the adequacy of controls
mitigating the risks and the Audit Committee monitoring implementation of corrective actions.
The following internal audit engagements were approved by the audit committee and completed by
Internal Audit during the year under review:
ASSURANCE ENGAGEMENTS:
• DPSA Delegations Framework;
• Service Excellence Awards;
• Risk Management;
• Transfer Payments;
• IT Project Management and BIZ Projects Application Controls (ICT Audit Plan); and
• WCG Cloud Computing Implementation and Management (ICT Audit Plan).
CONSULTING ENGAGEMENTS:
• Electronic Records and Information Management; and
• Integrated Provincial Strategic Planning.
The above assignments were completed during the year.
The areas for improvement, as noted by Internal Audit during performance of their work, were agreed to by
management. The Audit Committee monitors the implementation of the agreed actions on a quarterly basis.
IN-YEAR MANAGEMENT AND MONTHLY/QUARTERLY REPORT
The Audit Committee is satisfied with the content and quality of the quarterly in-year management and
performance reports issued during the year under review by the Accounting Officer of the Department in
terms of the National Treasury Regulations and the Division of Revenue Act.
EVALUATION OF FINANCIAL STATEMENTS
The Audit Committee has:
• reviewed and discussed the Audited Annual Financial Statements to be included in the Annual
Report, with the Auditor-General South Africa (AGSA) and the Accounting Officer;
• reviewed the AGSA’s Management Report and Management’s responses thereto;
• reviewed changes to accounting policies and practices as reported in the Annual Financial
Statements; and
• reviewed adjustments resulting from the audit of the Department.
DOTP ANNUAL REPORT FOR 2019/2020 125
COMPLIANCE
The Audit Committee has reviewed the Department’s processes for compliance with legal and regulatory
provisions.
PERFORMANCE INFORMATION
The Audit Committee has reviewed the information on predetermined objectives as reported in the Annual
Report.
AUDITOR-GENERAL’S REPORT
We have on a quarterly basis reviewed the Department’s implementation plan for audit issues raised in the
prior year. The Audit Committee has met with the AGSA to ensure that there are no unresolved issues that
emanated from the regulatory audit.
Corrective actions on the detailed findings raised by the AGSA are monitored by the Audit Committee on
a quarterly basis.
The Audit Committee concurs and accepts the AGSA’s opinion regarding the Annual Financial Statements
and proposes that these Audited Annual Financial Statements be accepted and read together with their
report.
The Audit Committee commends the department for maintaining an unqualified audit opinion with no
findings.
________________
Mr Francois Barnard
Chairperson of the Governance & Administration Cluster Audit Committee
Western Cape Department of the Premier
12 October 2020
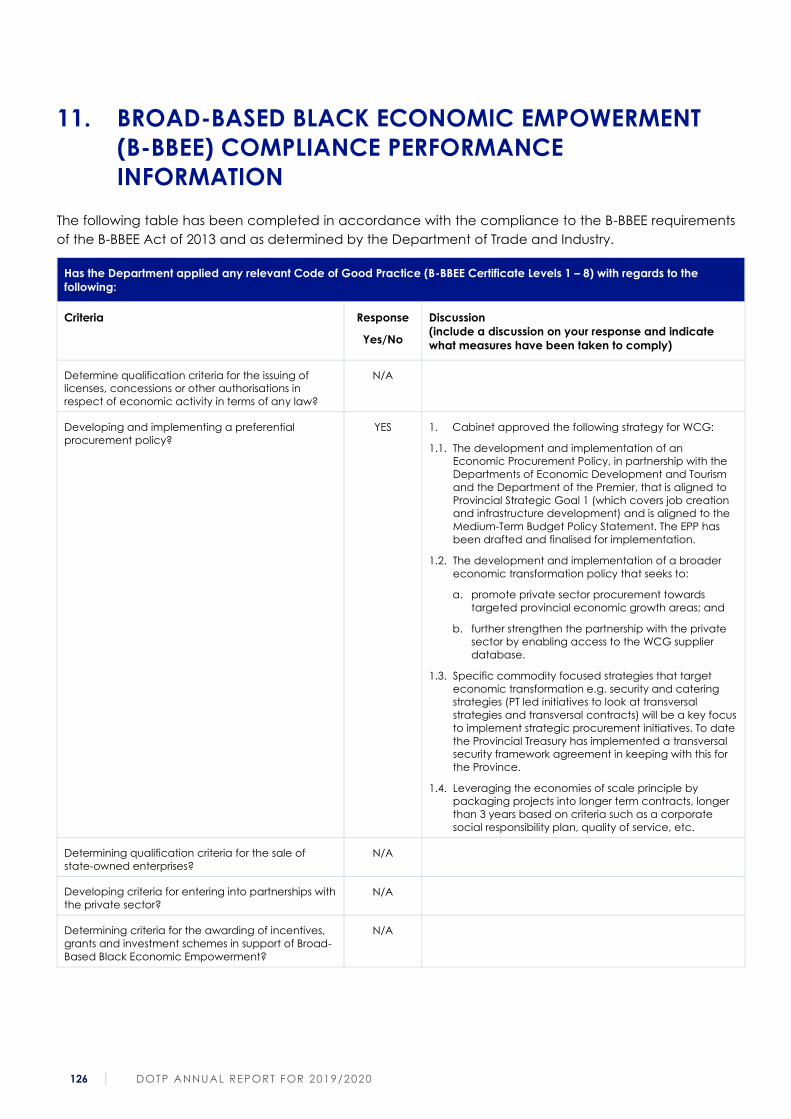
126 DOTP ANNUAL REPORT FOR 2019/2020
11. BROAD-BASED BLACK ECONOMIC EMPOWERMENT
(B-BBEE) COMPLIANCE PERFORMANCE
INFORMATION
The following table has been completed in accordance with the compliance to the B-BBEE requirements
of the B-BBEE Act of 2013 and as determined by the Department of Trade and Industry.
Has the Department applied any relevant Code of Good Practice (B-BBEE Certificate Levels 1 – 8) with regards to the
following:
Criteria Response
Yes/No
Discussion
(include a discussion on your response and indicate
what measures have been taken to comply)
Determine qualification criteria for the issuing of
licenses, concessions or other authorisations in
respect of economic activity in terms of any law?
N/A
Developing and implementing a preferential
procurement policy?
YES 1. Cabinet approved the following strategy for WCG:
1.1. The development and implementation of an
Economic Procurement Policy, in partnership with the
Departments of Economic Development and Tourism
and the Department of the Premier, that is aligned to
Provincial Strategic Goal 1 (which covers job creation
and infrastructure development) and is aligned to the
Medium-Term Budget Policy Statement. The EPP has
been drafted and finalised for implementation.
1.2. The development and implementation of a broader
economic transformation policy that seeks to:
a. promote private sector procurement towards
targeted provincial economic growth areas; and
b. further strengthen the partnership with the private
sector by enabling access to the WCG supplier
database.
1.3. Specific commodity focused strategies that target
economic transformation e.g. security and catering
strategies (PT led initiatives to look at transversal
strategies and transversal contracts) will be a key focus
to implement strategic procurement initiatives. To date
the Provincial Treasury has implemented a transversal
security framework agreement in keeping with this for
the Province.
1.4. Leveraging the economies of scale principle by
packaging projects into longer term contracts, longer
than 3 years based on criteria such as a corporate
social responsibility plan, quality of service, etc.
Determining qualification criteria for the sale of
state-owned enterprises?
N/A
Developing criteria for entering into partnerships with
the private sector?
N/A
Determining criteria for the awarding of incentives,
grants and investment schemes in support of Broad-
Based Black Economic Empowerment?
N/A
DOTP ANNUAL REPORT FOR 2019/2020 127

128 DOTP ANNUAL REPORT FOR 2019/2020
PART D: PEOPLE MANAGEMENT OVERSIGHT

DOTP ANNUAL REPORT FOR 2019/2020 129

130 DOTP ANNUAL REPORT FOR 2019/2020
1. INTRODUCTION
Our contribution to the work of the Western Cape Government is as a result of the persistent, and often
selfless, efforts of the people within the Department of the Premier.
To consistently deliver improved services to the citizens of the Western Cape Province is not without its own
challenges. The modern people management landscape has shifted significantly in recent years and
requires complex navigation between a range of competing variables.
Apart from the fact that these variables are interdependent and interrelated, they are also governed by
stringent rules and regulations, which prove difficult when retention and attraction initiatives are explored.
These include balancing service delivery imperatives, the attraction and retention of critical and scarce
skills, workforce empowerment, career management, succession planning, employment equity and
creating an enabling environment where employees are able to thrive. Further to this, the Department is
required to function within an austere environment, which demands that managers consider the impact
of “doing more with less”.
Despite the changing patterns and demands impacting on the modern workplace, the consistent hard
work of our people has resulted in remarkable achievements and service delivery improvement during the
year under review.
2. STATUS OF PEOPLE MANAGEMENT AT THE
DEPARTMENT
2.1. Departmental workforce planning priorities
• The role of Workforce Planning is important to ensure that the Department has the required number
of people with the requisite skills, knowledge and attitudes to perform the work. Through this process
the Department annually assesses its workforce profile against current and future organisational
needs.
• The aim of this assessment is to identify to what extent the current workforce profile addresses the key
people management outcomes that would guarantee service continuity and value.
• The Workforce Plan 2015–2020, is therefore aligned to the vision and mission of the Department’s
Strategic Plan, as well as the People Management Strategy.
• The assumptions on which this Workforce Plan was developed are still valid and the Action Plan was
reviewed to ensure that strategies (as per the listed priorities) would achieve its outcomes:
✓ an equitable workforce;
✓ competent people in the right numbers at the right place at the right time with the right
attitude;
✓ leaders that are exemplars of the behaviours associated with the organisations values, highly
engaged people;
✓ a citizen-centric performance culture;
DOTP ANNUAL REPORT FOR 2019/2020 131
✓ increased staff morale; and
✓ an upward curve achieved in effectively managed in Employee Health and Wellness issues,
which in turn, would assist the Department to achieve its strategic mandate.
• The Workforce Plan has been reviewed in consultation with CSC stakeholders, as well as the
Department of the Premier’s Executive Committee (EXCO). There were no adjustments made to the
Workforce Plan during the period under review. The current Workforce Plan expires on 31 March 2020.
2.2. Employee Performance Management
The purpose of Performance Management is to increase performance by encouraging individual
commitment, accountability and motivation.
All employees are required to complete a performance agreement before 31 May each year. The
agreement is in essence a contract between the employer and the employee containing the projects,
programmes, activities, expectations and standards for the required delivery. In order to facilitate a
standardised administration process, the Western Cape Government has devised an electronic system,
namely PERMIS (Performance Management Information System), which allows for the entire performance
management process to be captured, monitored and managed.
The performance management process requires that a mid-year review and an annual assessment be
conducted, but that the operational targets and achievements linked to the performance agreement be
monitored and communicated on an ongoing basis. In instances where targets or performance
expectations are not met, the gaps are addressed through the management of poor performance. In this
context, a performance consulting unit has been established within the Corporate Services Centre (Chief
Directorate: People Management Practices) to assist line managers (people managers) in dealing with
poor performance. The process is developmental, however, in instances where individuals have been
identified as poor performers in terms of the legislative framework, and they are required to subject
themselves to a developmental plan or alternatively to disciplinary action.
2.3. Employee wellness
The WCG’s transversal Employee Health and Wellness Programme (EHW) follows a holistic approach to
employee well-being and is largely preventative in nature, offering both primary and secondary services.
The EHW Programme is monitored in the Department through monthly utilisation reports for primary services
(24/7/365 telephonic counselling service, online e-Care service and reporting) and secondary services
(face-to-face counselling, trauma and critical incidents, training and targeted intervention, executive
coaching, advocacy).
A quarterly report is prepared by the Directorate: Organisational Behaviour within the Corporate Service
Centre that provides a trend analysis of utilisation, risk identification and its impact on productivity.
Furthermore, on-going reporting to the Department of Public Service and Administration (DPSA) is a
requirement and such reporting focuses on four areas namely, HIV/AIDS, Health and Productivity, Wellness
Management and SHERQ (Safety Health Environment Risk and Quality).
132 DOTP ANNUAL REPORT FOR 2019/2020
2.4. People management monitoring
The Department, in collaboration with the CSC, monitors the implementation of a range of people
management compliance indicators. The monthly Barometer Fact File, which is developed by the Chief-
Directorate: People Management Practices within the CSC, provides the Department with regular updates
on the workforce profile and other relevant people management data to enable decision making. The
indicators include, inter alia, staff establishment information, headcount, people expenditure projections,
sick leave patterns, the monetary value of annual leave credits, disciplinary cases, vacancy rates, staff
movement, employment equity, etc.

DOTP ANNUAL REPORT FOR 2019/2020 133
3. PEOPLE MANAGEMENT OVERSIGHT STATISTICS
3.1. Personnel-related expenditure
The following tables summarise final audited expenditure by programme (Table 3.1.1) and by salary bands
(Table 3.1.2).
The figures in Table 3.1.1 are drawn from the Basic Accounting System and the figures in Table 3.1.2 are
drawn from the PERSAL [Personnel Salary] system. The two systems are not synchronised for salary refunds
in respect of staff appointments and resignations and/or transfers to and from other departments. This
means there may be a difference in the total expenditure reflected on these systems.
The key in the table below is a description of the Programmes within the Department. Programmes will be
referred to by their number from this point forward.
Programme Programme Designation
Programme 1 Executive Governance and Integration
Programme 2 Provincial Strategic Management
Programme 3 People Management (Corporate Services Centre)
Programme 4 Centre for e-Innovation (Corporate Services Centre)
Programme 5 Corporate Assurance (Corporate Services Centre)
Table 3.1.1: Personnel expenditure by programme, 2019/2020
Programme
Total
Expenditur
e (R’000)
Personnel
Expenditure
(R’000)
Training
Expenditure
(R’000)
Goods and
Services
(R’000)
Personnel
expenditure
as a % of
total
expenditure
Average
personnel
expenditure
per
employee
(R’000)
Number of
Employees
remunerated
Programme 1 105 659 82 610 331 18 996 78.19 469 176
Programme 2 57 521 40 905 85 15 985 71.11 493 83
Programme 3 201 606 170 441 2 219 27 699 84.54 425 401
Programme 4 1 064 546 202 155 1 761 809 869 18.99 480 421
Programme 5 131 698 112 597 564 17 385 85.50 640 176
Total 1 561 031 608 708 4 960 889 907 38.99 484 1 257
NOTE: The number of employees refers to all individuals remunerated during the reporting period, including
interns, but excluding the Premier. The number is accumulative and not a snapshot as at a specific date.
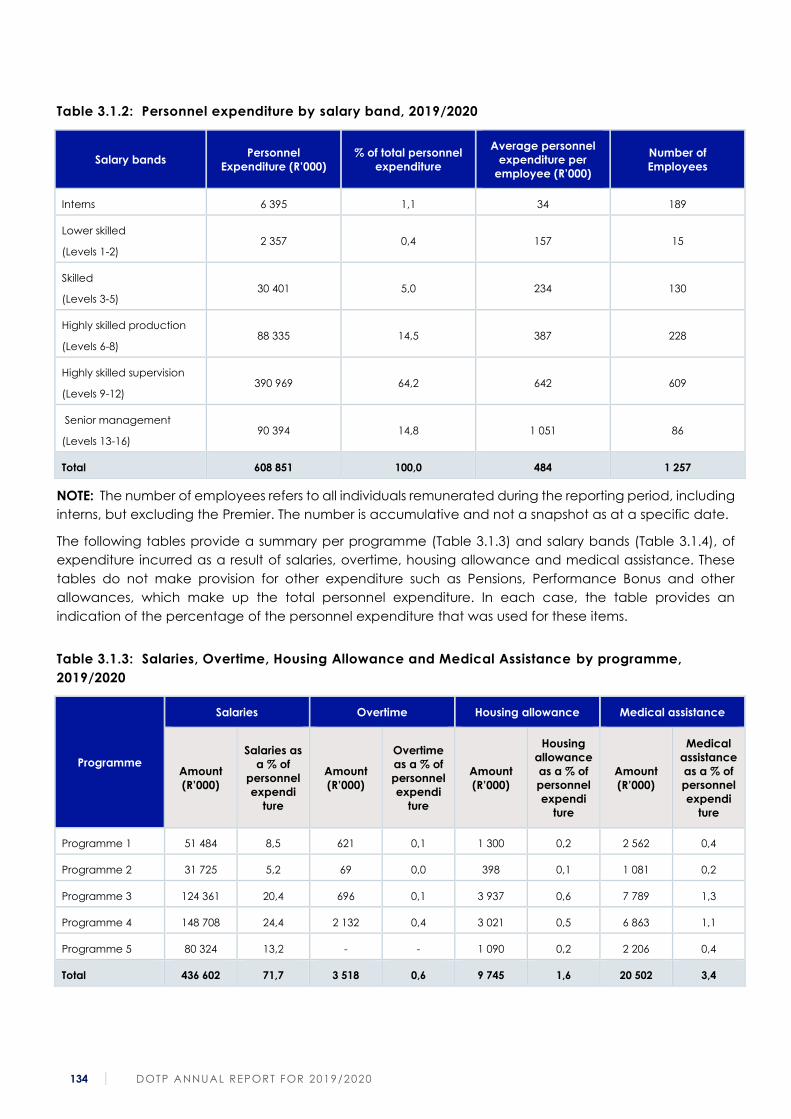
134 DOTP ANNUAL REPORT FOR 2019/2020
Table 3.1.2: Personnel expenditure by salary band, 2019/2020
Salary bands Personnel
Expenditure (R’000)
% of total personnel
expenditure
Average personnel
expenditure per
employee (R’000)
Number of
Employees
Interns 6 395 1,1 34 189
Lower skilled
(Levels 1-2) 2 357 0,4 157 15
Skilled
(Levels 3-5) 30 401 5,0 234 130
Highly skilled production
(Levels 6-8) 88 335 14,5 387 228
Highly skilled supervision
(Levels 9-12) 390 969 64,2 642 609
Senior management
(Levels 13-16) 90 394 14,8 1 051 86
Total 608 851 100,0 484 1 257
NOTE: The number of employees refers to all individuals remunerated during the reporting period, including
interns, but excluding the Premier. The number is accumulative and not a snapshot as at a specific date.
The following tables provide a summary per programme (Table 3.1.3) and salary bands (Table 3.1.4), of
expenditure incurred as a result of salaries, overtime, housing allowance and medical assistance. These
tables do not make provision for other expenditure such as Pensions, Performance Bonus and other
allowances, which make up the total personnel expenditure. In each case, the table provides an
indication of the percentage of the personnel expenditure that was used for these items.
Table 3.1.3: Salaries, Overtime, Housing Allowance and Medical Assistance by programme,
2019/2020
Programme
Salaries Overtime Housing allowance Medical assistance
Amount
(R’000)
Salaries as
a % of
personnel
expendi
ture
Amount
(R’000)
Overtime
as a % of
personnel
expendi
ture
Amount
(R’000)
Housing
allowance
as a % of
personnel
expendi
ture
Amount
(R’000)
Medical
assistance
as a % of
personnel
expendi
ture
Programme 1 51 484 8,5 621 0,1 1 300 0,2 2 562 0,4
Programme 2 31 725 5,2 69 0,0 398 0,1 1 081 0,2
Programme 3 124 361 20,4 696 0,1 3 937 0,6 7 789 1,3
Programme 4 148 708 24,4 2 132 0,4 3 021 0,5 6 863 1,1
Programme 5 80 324 13,2 - - 1 090 0,2 2 206 0,4
Total 436 602 71,7 3 518 0,6 9 745 1,6 20 502 3,4
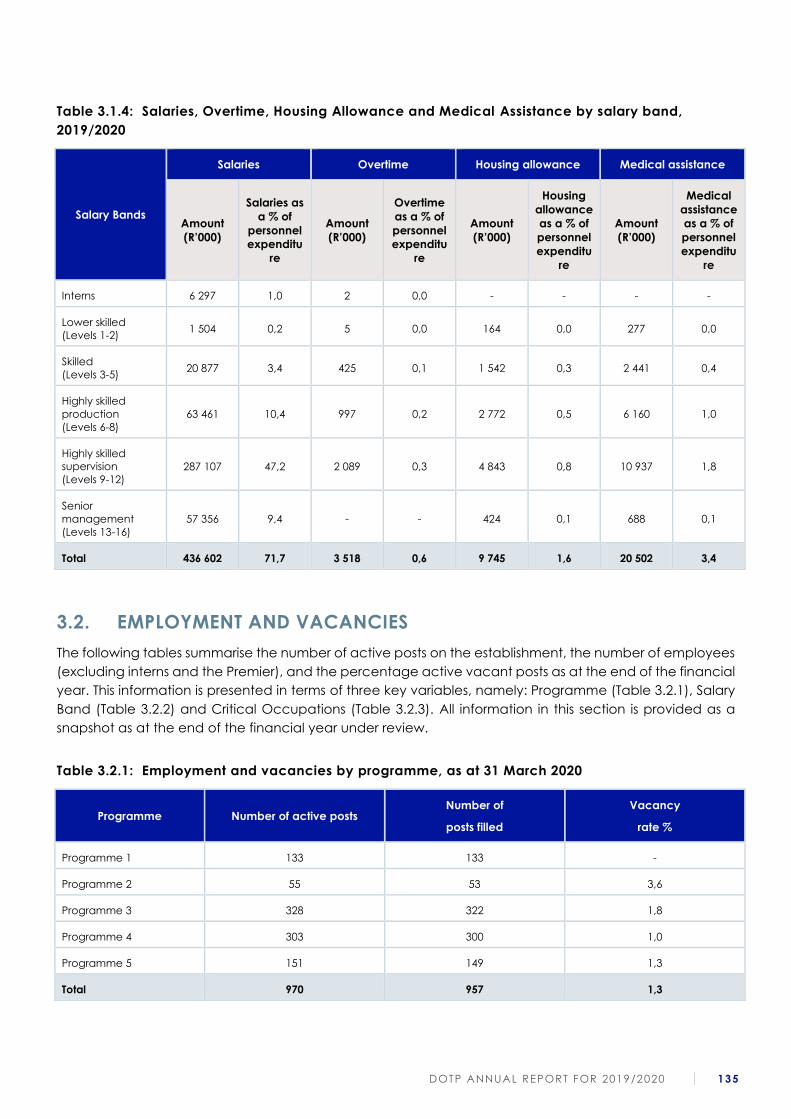
DOTP ANNUAL REPORT FOR 2019/2020 135
Table 3.1.4: Salaries, Overtime, Housing Allowance and Medical Assistance by salary band,
2019/2020
Salary Bands
Salaries Overtime Housing allowance Medical assistance
Amount
(R’000)
Salaries as
a % of
personnel
expenditu
re
Amount
(R’000)
Overtime
as a % of
personnel
expenditu
re
Amount
(R’000)
Housing
allowance
as a % of
personnel
expenditu
re
Amount
(R’000)
Medical
assistance
as a % of
personnel
expenditu
re
Interns 6 297 1,0 2 0,0 - - - -
Lower skilled
(Levels 1-2) 1 504 0,2 5 0,0 164 0,0 277 0,0
Skilled
(Levels 3-5) 20 877 3,4 425 0,1 1 542 0,3 2 441 0,4
Highly skilled
production
(Levels 6-8)
63 461 10,4 997 0,2 2 772 0,5 6 160 1,0
Highly skilled
supervision
(Levels 9-12)
287 107 47,2 2 089 0,3 4 843 0,8 10 937 1,8
Senior
management
(Levels 13-16)
57 356 9,4 - - 424 0,1 688 0,1
Total 436 602 71,7 3 518 0,6 9 745 1,6 20 502 3,4
3.2. EMPLOYMENT AND VACANCIES
The following tables summarise the number of active posts on the establishment, the number of employees
(excluding interns and the Premier), and the percentage active vacant posts as at the end of the financial
year. This information is presented in terms of three key variables, namely: Programme (Table 3.2.1), Salary
Band (Table 3.2.2) and Critical Occupations (Table 3.2.3). All information in this section is provided as a
snapshot as at the end of the financial year under review.
Table 3.2.1: Employment and vacancies by programme, as at 31 March 2020
Programme Number of active posts Number of
posts filled
Vacancy
rate %
Programme 1 133 133 -
Programme 2 55 53 3,6
Programme 3 328 322 1,8
Programme 4 303 300 1,0
Programme 5 151 149 1,3
Total 970 957 1,3
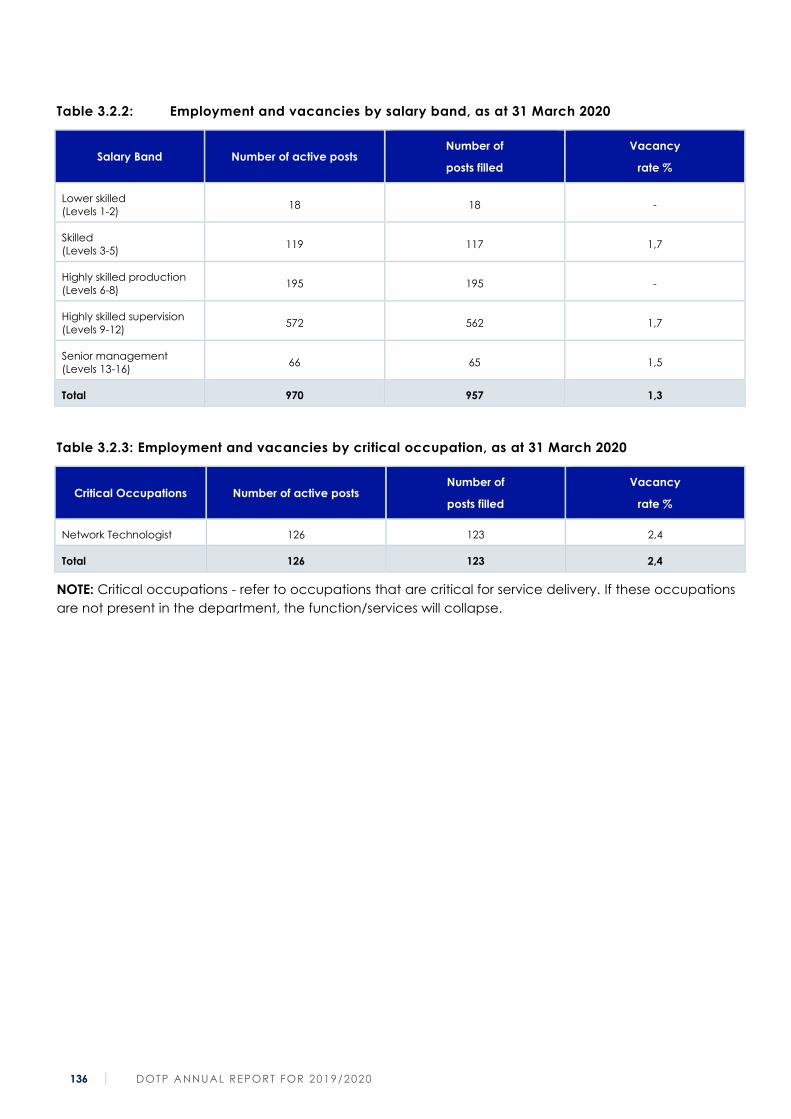
136 DOTP ANNUAL REPORT FOR 2019/2020
Table 3.2.2: Employment and vacancies by salary band, as at 31 March 2020
Salary Band Number of active posts Number of
posts filled
Vacancy
rate %
Lower skilled
(Levels 1-2) 18 18 -
Skilled
(Levels 3-5) 119 117 1,7
Highly skilled production
(Levels 6-8) 195 195 -
Highly skilled supervision
(Levels 9-12) 572 562 1,7
Senior management
(Levels 13-16) 66 65 1,5
Total 970 957 1,3
Table 3.2.3: Employment and vacancies by critical occupation, as at 31 March 2020
Critical Occupations Number of active posts Number of
posts filled
Vacancy
rate %
Network Technologist 126 123 2,4
Total 126 123 2,4
NOTE: Critical occupations - refer to occupations that are critical for service delivery. If these occupations
are not present in the department, the function/services will collapse.
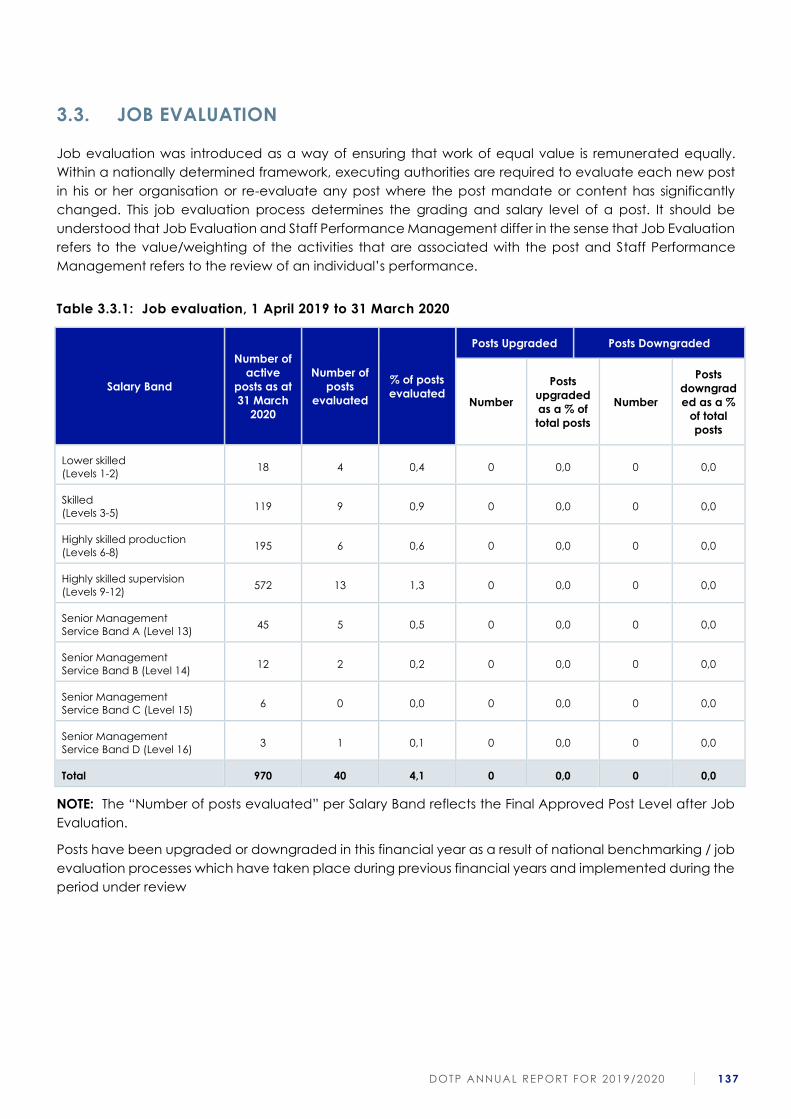
DOTP ANNUAL REPORT FOR 2019/2020 137
3.3. JOB EVALUATION
Job evaluation was introduced as a way of ensuring that work of equal value is remunerated equally.
Within a nationally determined framework, executing authorities are required to evaluate each new post
in his or her organisation or re-evaluate any post where the post mandate or content has significantly
changed. This job evaluation process determines the grading and salary level of a post. It should be
understood that Job Evaluation and Staff Performance Management differ in the sense that Job Evaluation
refers to the value/weighting of the activities that are associated with the post and Staff Performance
Management refers to the review of an individual’s performance.
Table 3.3.1: Job evaluation, 1 April 2019 to 31 March 2020
Salary Band
Number of
active
posts as at
31 March
2020
Number of
posts
evaluated
% of posts
evaluated
Posts Upgraded Posts Downgraded
Number
Posts
upgraded
as a % of
total posts
Number
Posts
downgrad
ed as a %
of total
posts
Lower skilled
(Levels 1-2) 18 4 0,4 0 0,0 0 0,0
Skilled
(Levels 3-5) 119 9 0,9 0 0,0 0 0,0
Highly skilled production
(Levels 6-8) 195 6 0,6 0 0,0 0 0,0
Highly skilled supervision
(Levels 9-12) 572 13 1,3 0 0,0 0 0,0
Senior Management
Service Band A (Level 13) 45 5 0,5 0 0,0 0 0,0
Senior Management
Service Band B (Level 14) 12 2 0,2 0 0,0 0 0,0
Senior Management
Service Band C (Level 15) 6 0 0,0 0 0,0 0 0,0
Senior Management
Service Band D (Level 16) 3 1 0,1 0 0,0 0 0,0
Total 970 40 4,1 0 0,0 0 0,0
NOTE: The “Number of posts evaluated” per Salary Band reflects the Final Approved Post Level after Job
Evaluation.
Posts have been upgraded or downgraded in this financial year as a result of national benchmarking / job
evaluation processes which have taken place during previous financial years and implemented during the
period under review
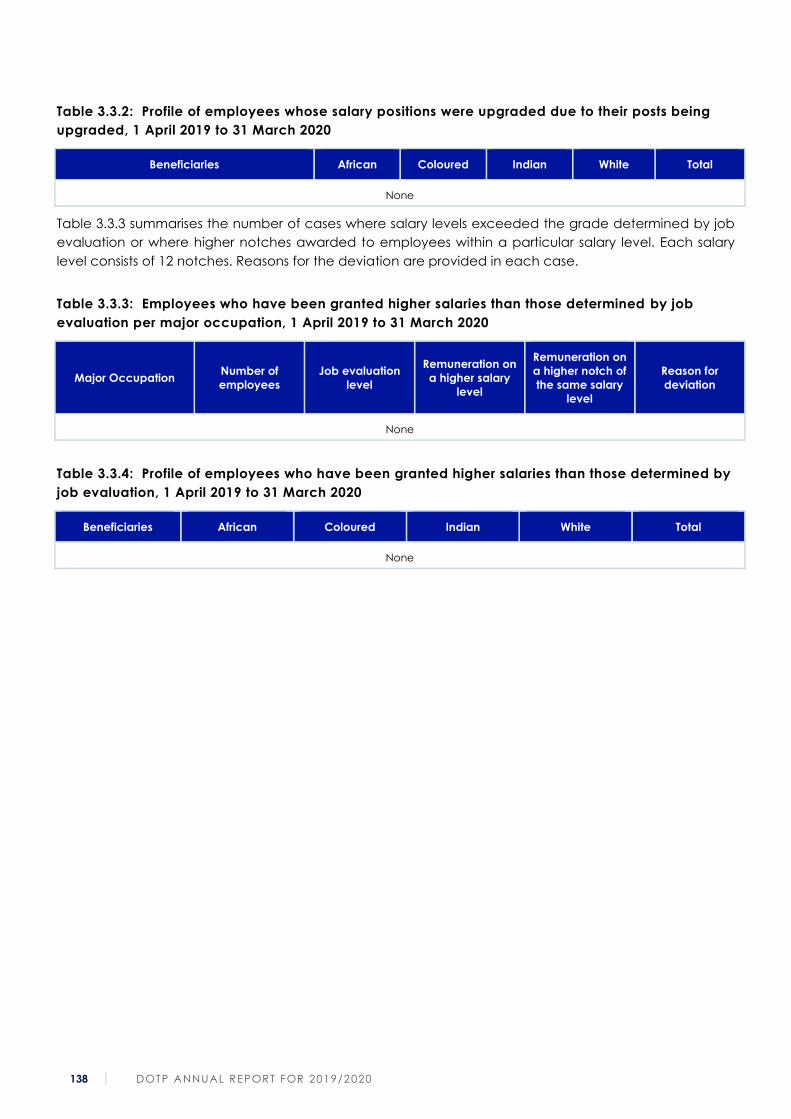
138 DOTP ANNUAL REPORT FOR 2019/2020
Table 3.3.2: Profile of employees whose salary positions were upgraded due to their posts being
upgraded, 1 April 2019 to 31 March 2020
Beneficiaries African Coloured Indian White Total
None
Table 3.3.3 summarises the number of cases where salary levels exceeded the grade determined by job
evaluation or where higher notches awarded to employees within a particular salary level. Each salary
level consists of 12 notches. Reasons for the deviation are provided in each case.
Table 3.3.3: Employees who have been granted higher salaries than those determined by job
evaluation per major occupation, 1 April 2019 to 31 March 2020
Major Occupation Number of
employees
Job evaluation
level
Remuneration on
a higher salary
level
Remuneration on
a higher notch of
the same salary
level
Reason for
deviation
None
Table 3.3.4: Profile of employees who have been granted higher salaries than those determined by
job evaluation, 1 April 2019 to 31 March 2020
Beneficiaries African Coloured Indian White Total
None
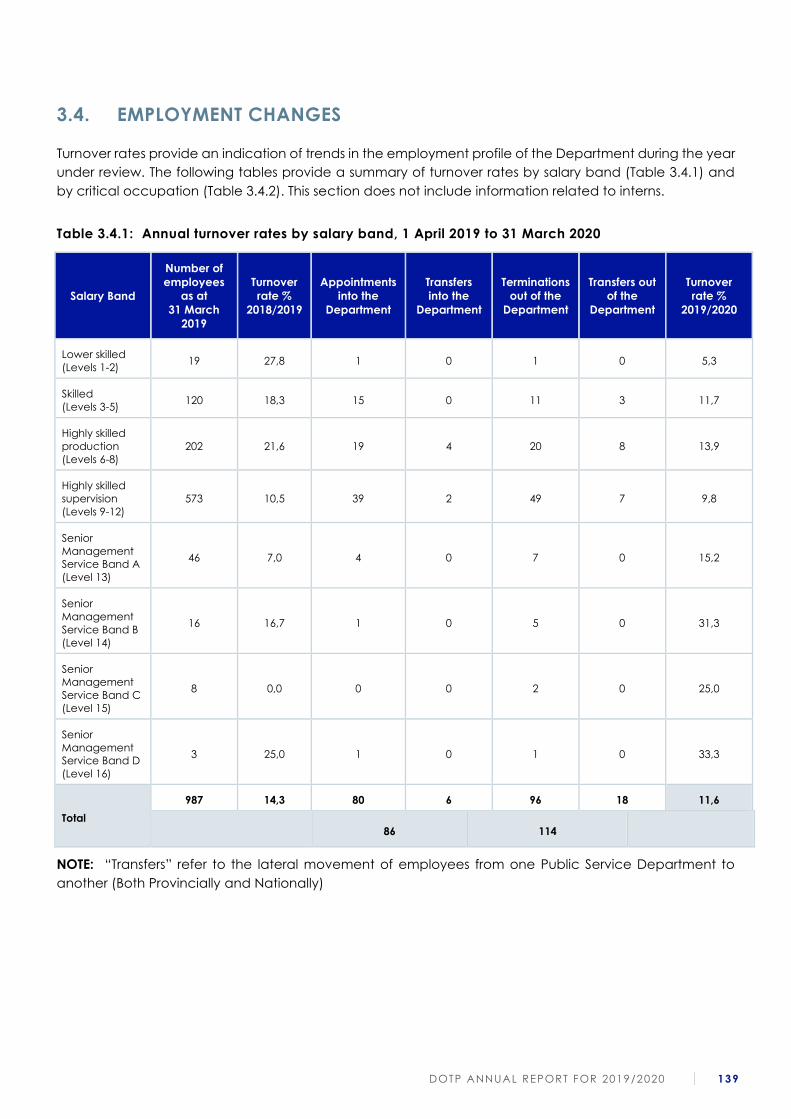
DOTP ANNUAL REPORT FOR 2019/2020 139
3.4. EMPLOYMENT CHANGES
Turnover rates provide an indication of trends in the employment profile of the Department during the year
under review. The following tables provide a summary of turnover rates by salary band (Table 3.4.1) and
by critical occupation (Table 3.4.2). This section does not include information related to interns.
Table 3.4.1: Annual turnover rates by salary band, 1 April 2019 to 31 March 2020
Salary Band
Number of
employees
as at
31 March
2019
Turnover
rate %
2018/2019
Appointments
into the
Department
Transfers
into the
Department
Terminations
out of the
Department
Transfers out
of the
Department
Turnover
rate %
2019/2020
Lower skilled
(Levels 1-2) 19 27,8 1 0 1 0 5,3
Skilled
(Levels 3-5) 120 18,3 15 0 11 3 11,7
Highly skilled
production
(Levels 6-8)
202 21,6 19 4 20 8 13,9
Highly skilled
supervision
(Levels 9-12)
573 10,5 39 2 49 7 9,8
Senior
Management
Service Band A
(Level 13)
46 7,0 4 0 7 0 15,2
Senior
Management
Service Band B
(Level 14)
16 16,7 1 0 5 0 31,3
Senior
Management
Service Band C
(Level 15)
8 0,0 0 0 2 0 25,0
Senior
Management
Service Band D
(Level 16)
3 25,0 1 0 1 0 33,3
Total
987 14,3 80 6 96 18 11,6
86 114
NOTE: “Transfers” refer to the lateral movement of employees from one Public Service Department to
another (Both Provincially and Nationally)
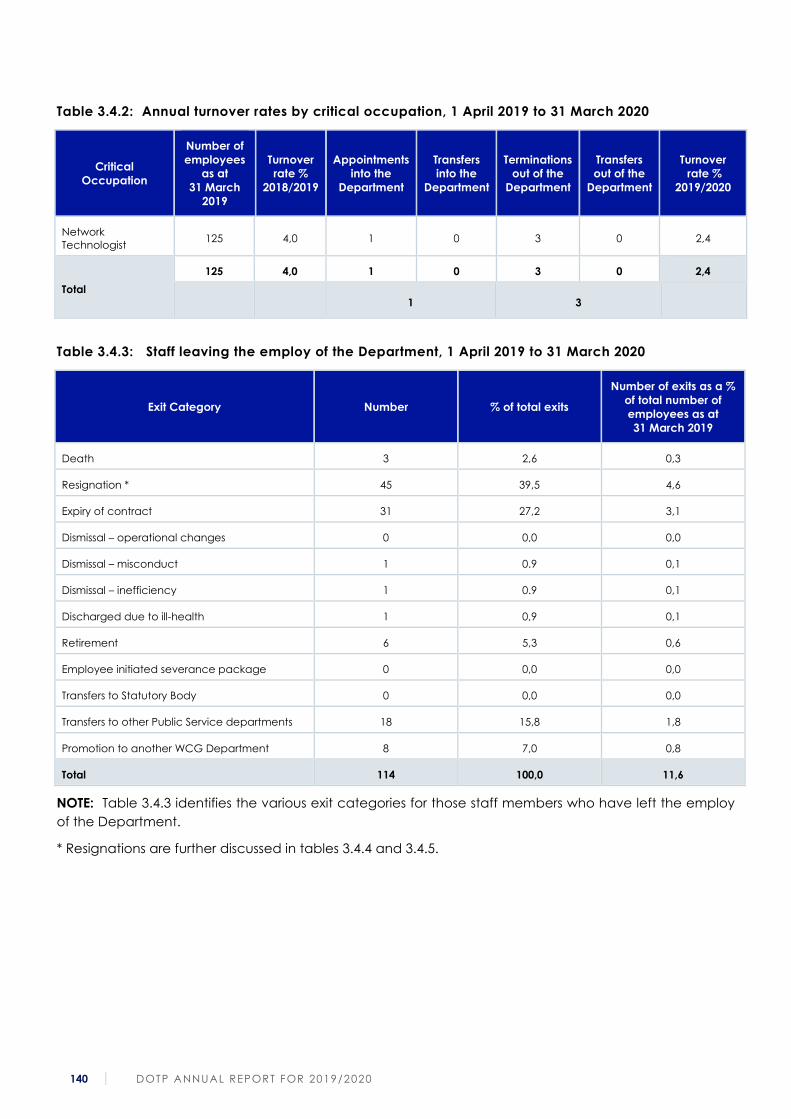
140 DOTP ANNUAL REPORT FOR 2019/2020
Table 3.4.2: Annual turnover rates by critical occupation, 1 April 2019 to 31 March 2020
Critical
Occupation
Number of
employees
as at
31 March
2019
Turnover
rate %
2018/2019
Appointments
into the
Department
Transfers
into the
Department
Terminations
out of the
Department
Transfers
out of the
Department
Turnover
rate %
2019/2020
Network
Technologist 125 4,0 1 0 3 0 2,4
Total
125 4,0 1 0 3 0 2,4
1 3
Table 3.4.3: Staff leaving the employ of the Department, 1 April 2019 to 31 March 2020
Exit Category Number % of total exits
Number of exits as a %
of total number of
employees as at
31 March 2019
Death 3 2,6 0,3
Resignation * 45 39,5 4,6
Expiry of contract 31 27,2 3,1
Dismissal – operational changes 0 0,0 0,0
Dismissal – misconduct 1 0.9 0,1
Dismissal – inefficiency 1 0.9 0,1
Discharged due to ill-health 1 0,9 0,1
Retirement 6 5,3 0,6
Employee initiated severance package 0 0,0 0,0
Transfers to Statutory Body 0 0,0 0,0
Transfers to other Public Service departments 18 15,8 1,8
Promotion to another WCG Department 8 7,0 0,8
Total 114 100,0 11,6
NOTE: Table 3.4.3 identifies the various exit categories for those staff members who have left the employ
of the Department.
* Resignations are further discussed in tables 3.4.4 and 3.4.5.
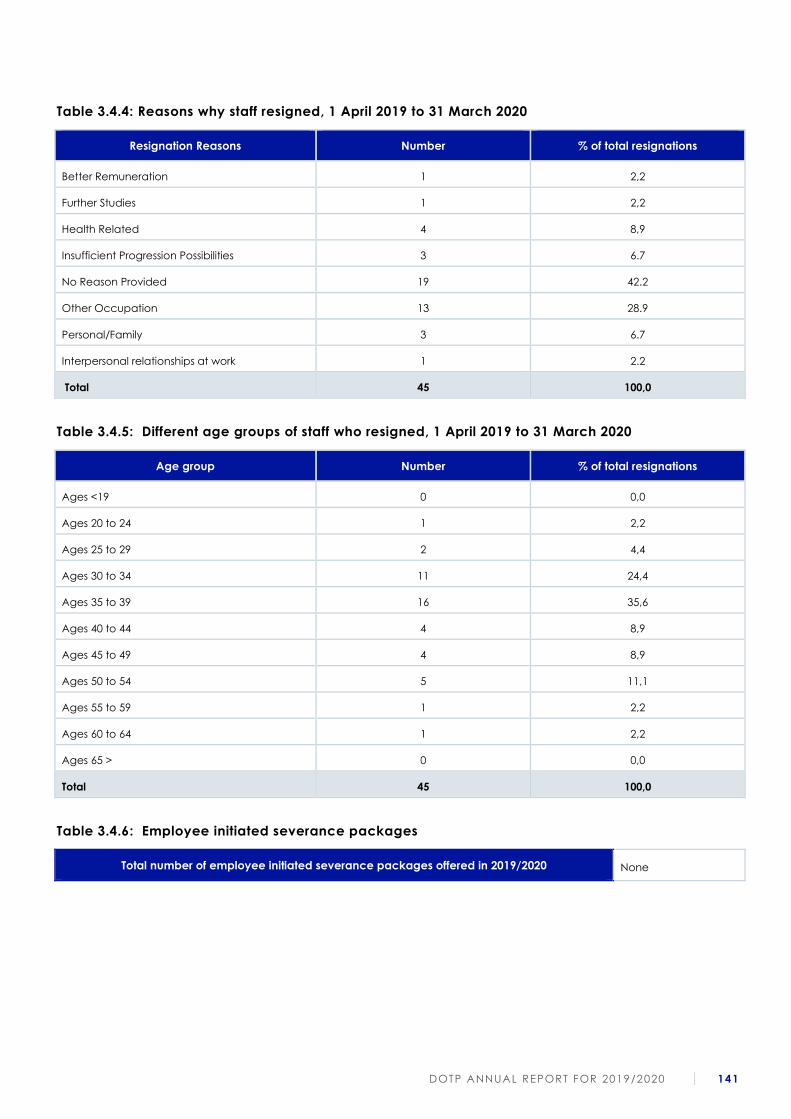
DOTP ANNUAL REPORT FOR 2019/2020 141
Table 3.4.4: Reasons why staff resigned, 1 April 2019 to 31 March 2020
Resignation Reasons Number % of total resignations
Better Remuneration 1 2,2
Further Studies 1 2,2
Health Related 4 8,9
Insufficient Progression Possibilities 3 6.7
No Reason Provided 19 42.2
Other Occupation 13 28.9
Personal/Family 3 6.7
Interpersonal relationships at work 1 2.2
Total 45 100,0
Table 3.4.5: Different age groups of staff who resigned, 1 April 2019 to 31 March 2020
Age group Number % of total resignations
Ages <19 0 0,0
Ages 20 to 24 1 2,2
Ages 25 to 29 2 4,4
Ages 30 to 34 11 24,4
Ages 35 to 39 16 35,6
Ages 40 to 44 4 8,9
Ages 45 to 49 4 8,9
Ages 50 to 54 5 11,1
Ages 55 to 59 1 2,2
Ages 60 to 64 1 2,2
Ages 65 > 0 0,0
Total 45 100,0
Table 3.4.6: Employee initiated severance packages
Total number of employee initiated severance packages offered in 2019/2020 None
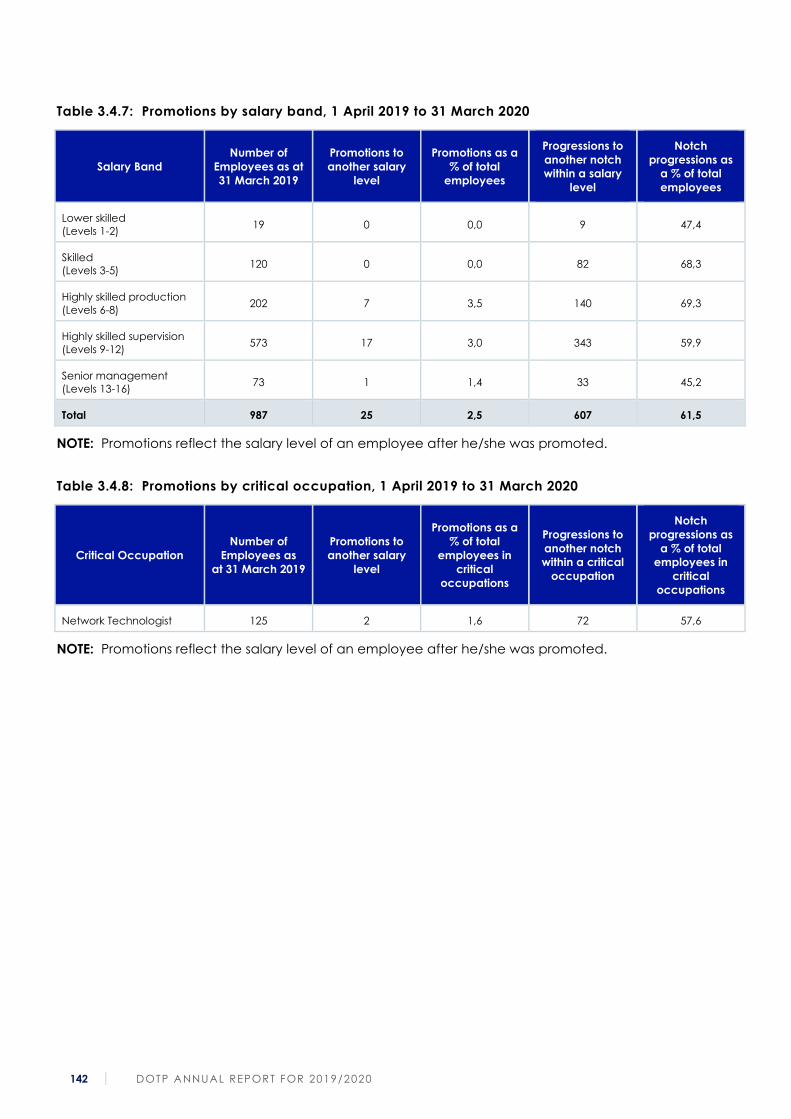
142 DOTP ANNUAL REPORT FOR 2019/2020
Table 3.4.7: Promotions by salary band, 1 April 2019 to 31 March 2020
Salary Band
Number of
Employees as at
31 March 2019
Promotions to
another salary
level
Promotions as a
% of total
employees
Progressions to
another notch
within a salary
level
Notch
progressions as
a % of total
employees
Lower skilled
(Levels 1-2) 19 0 0,0 9 47,4
Skilled
(Levels 3-5) 120 0 0,0 82 68,3
Highly skilled production
(Levels 6-8) 202 7 3,5 140 69,3
Highly skilled supervision
(Levels 9-12) 573 17 3,0 343 59,9
Senior management
(Levels 13-16) 73 1 1,4 33 45,2
Total 987 25 2,5 607 61,5
NOTE: Promotions reflect the salary level of an employee after he/she was promoted.
Table 3.4.8: Promotions by critical occupation, 1 April 2019 to 31 March 2020
Critical Occupation
Number of
Employees as
at 31 March 2019
Promotions to
another salary
level
Promotions as a
% of total
employees in
critical
occupations
Progressions to
another notch
within a critical
occupation
Notch
progressions as
a % of total
employees in
critical
occupations
Network Technologist 125 2 1,6 72 57,6
NOTE: Promotions reflect the salary level of an employee after he/she was promoted.
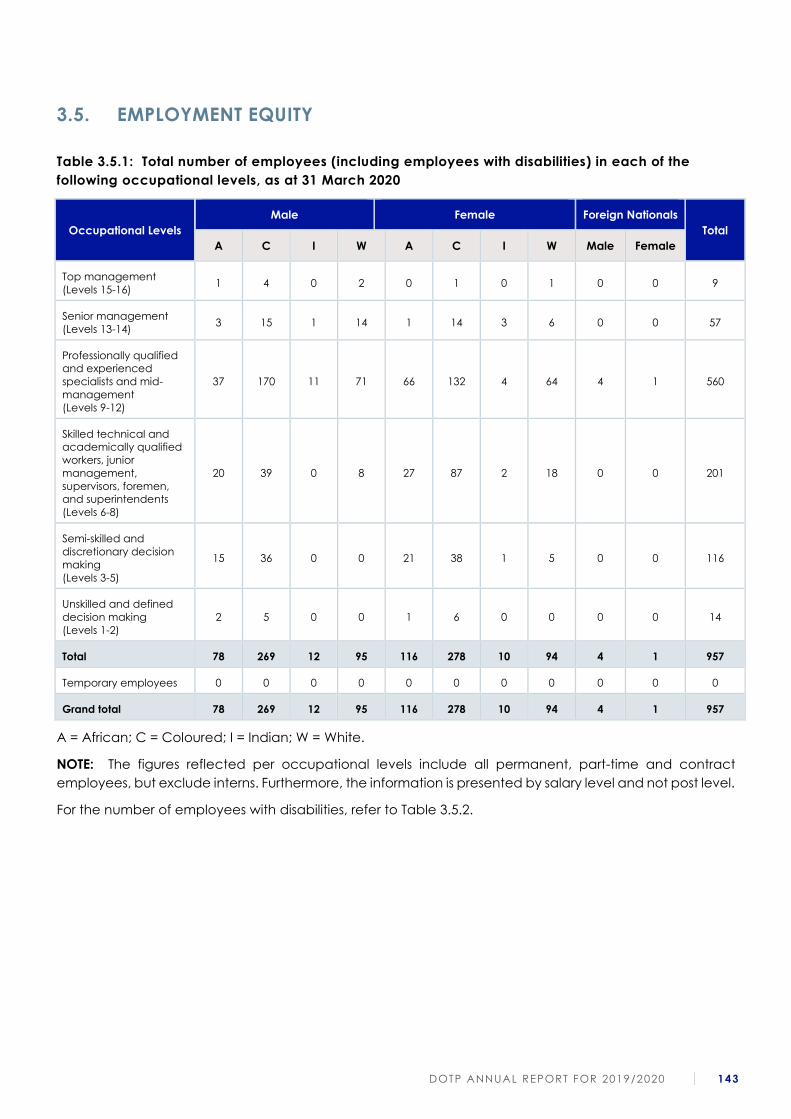
DOTP ANNUAL REPORT FOR 2019/2020 143
3.5. EMPLOYMENT EQUITY
Table 3.5.1: Total number of employees (including employees with disabilities) in each of the
following occupational levels, as at 31 March 2020
Occupational Levels
Male Female Foreign Nationals
Total
A C I W A C I W Male Female
Top management
(Levels 15-16) 1 4 0 2 0 1 0 1 0 0 9
Senior management
(Levels 13-14) 3 15 1 14 1 14 3 6 0 0 57
Professionally qualified
and experienced
specialists and mid-
management
(Levels 9-12)
37 170 11 71 66 132 4 64 4 1 560
Skilled technical and
academically qualified
workers, junior
management,
supervisors, foremen,
and superintendents
(Levels 6-8)
20 39 0 8 27 87 2 18 0 0 201
Semi-skilled and
discretionary decision
making
(Levels 3-5)
15 36 0 0 21 38 1 5 0 0 116
Unskilled and defined
decision making
(Levels 1-2)
2 5 0 0 1 6 0 0 0 0 14
Total 78 269 12 95 116 278 10 94 4 1 957
Temporary employees 0 0 0 0 0 0 0 0 0 0 0
Grand total 78 269 12 95 116 278 10 94 4 1 957
A = African; C = Coloured; I = Indian; W = White.
NOTE: The figures reflected per occupational levels include all permanent, part-time and contract
employees, but exclude interns. Furthermore, the information is presented by salary level and not post level.
For the number of employees with disabilities, refer to Table 3.5.2.

144 DOTP ANNUAL REPORT FOR 2019/2020
Table 3.5.2: Total number of employees (with disabilities only) in each of the following
occupational levels, as at 31 March 2020
Occupational Levels
Male Female Foreign Nationals
Total
A C I W A C I W Male Female
Top management
(Levels 15-16) 0 0 0 0 0 0 0 0 0 0 0
Senior management
(Levels 13-14) 0 0 0 0 0 0 0 0 0 0 0
Professionally qualified
and experienced
specialists and mid-
management
(Levels 9-12)
0 3 0 7 2 3 0 3 0 0 18
Skilled technical and
academically qualified
workers, junior
management,
supervisors, foremen,
and superintendents
(Levels 6-8)
1 0 0 2 1 0 0 2 0 0 6
Semi-skilled and
discretionary decision
making
(Levels 3-5)
0 0 0 0 0 2 0 0 0 0 2
Unskilled and defined
decision making
(Levels 1-2)
0 0 0 0 0 0 0 0 0 0 0
Total 1 3 0 9 3 5 0 5 0 0 26
Temporary employees 0 0 0 0 0 0 0 0 0 0 0
Grand total 1 3 0 9 3 5 0 5 0 0 26
A = African; C = Coloured; I = Indian; W = White.
NOTE: The figures reflected per occupational level include all permanent, part-time and contract
employees, but exclude interns. Furthermore, the information is presented by salary level and not post level.

DOTP ANNUAL REPORT FOR 2019/2020 145
Table 3.5.3: Recruitment, 1 April 2019 to 31 March 2020
Occupational Levels
Male Female Foreign Nationals
Total
A C I W A C I W Male Female
Top management
(Levels 15-16) 0 1 0 0 0 0 0 0 0 0 1
Senior management
(Levels 13-14) 0 1 0 1 1 0 0 1 0 1 5
Professionally qualified
and experienced
specialists and mid-
management
(Levels 9-12)
2 7 0 4 7 10 0 10 1 0 41
Skilled technical and
academically qualified
workers, junior
management,
supervisors, foremen,
and superintendents
(Levels 6-8)
2 5 0 0 4 9 1 2 0 0 23
Semi-skilled and
discretionary decision
making
(Levels 3-5)
2 5 0 0 4 3 1 0 0 0 15
Unskilled and defined
decision making
(Levels 1-2)
0 1 0 0 0 0 0 0 0 0 1
Total 6 20 0 5 16 22 2 13 1 1 86
Temporary employees 0 0 0 0 0 0 0 0 0 0 0
Grand total 6 20 0 5 16 22 2 13 1 1 86
A = African; C = Coloured; I = Indian; W = White.
NOTE: Recruitment refers to the appointment of new employees to the staff establishment of the
Department, but exclude interns. The totals include transfers from other government departments and / or
institutions, as per Table 3.4.1.
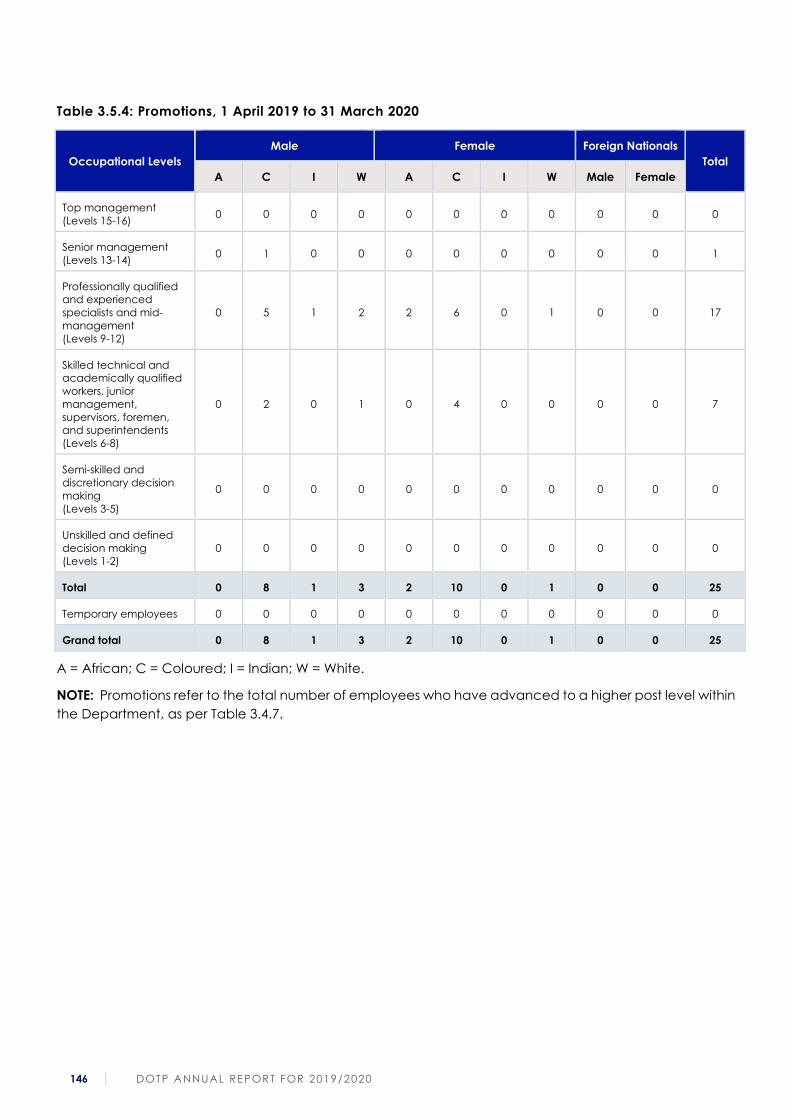
146 DOTP ANNUAL REPORT FOR 2019/2020
Table 3.5.4: Promotions, 1 April 2019 to 31 March 2020
Occupational Levels
Male Female Foreign Nationals
Total
A C I W A C I W Male Female
Top management
(Levels 15-16) 0 0 0 0 0 0 0 0 0 0 0
Senior management
(Levels 13-14) 0 1 0 0 0 0 0 0 0 0 1
Professionally qualified
and experienced
specialists and mid-
management
(Levels 9-12)
0 5 1 2 2 6 0 1 0 0 17
Skilled technical and
academically qualified
workers, junior
management,
supervisors, foremen,
and superintendents
(Levels 6-8)
0 2 0 1 0 4 0 0 0 0 7
Semi-skilled and
discretionary decision
making
(Levels 3-5)
0 0 0 0 0 0 0 0 0 0 0
Unskilled and defined
decision making
(Levels 1-2)
0 0 0 0 0 0 0 0 0 0 0
Total 0 8 1 3 2 10 0 1 0 0 25
Temporary employees 0 0 0 0 0 0 0 0 0 0 0
Grand total 0 8 1 3 2 10 0 1 0 0 25
A = African; C = Coloured; I = Indian; W = White.
NOTE: Promotions refer to the total number of employees who have advanced to a higher post level within
the Department, as per Table 3.4.7.
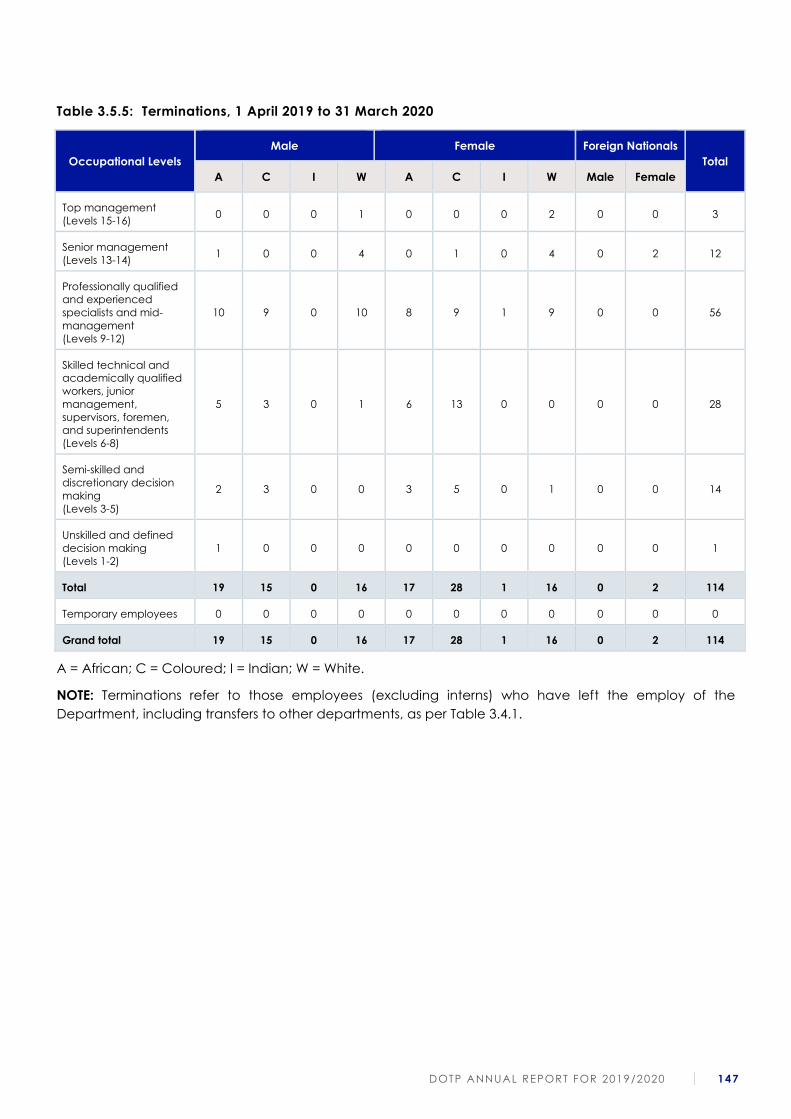
DOTP ANNUAL REPORT FOR 2019/2020 147
Table 3.5.5: Terminations, 1 April 2019 to 31 March 2020
Occupational Levels
Male Female Foreign Nationals
Total
A C I W A C I W Male Female
Top management
(Levels 15-16) 0 0 0 1 0 0 0 2 0 0 3
Senior management
(Levels 13-14) 1 0 0 4 0 1 0 4 0 2 12
Professionally qualified
and experienced
specialists and mid-
management
(Levels 9-12)
10 9 0 10 8 9 1 9 0 0 56
Skilled technical and
academically qualified
workers, junior
management,
supervisors, foremen,
and superintendents
(Levels 6-8)
5 3 0 1 6 13 0 0 0 0 28
Semi-skilled and
discretionary decision
making
(Levels 3-5)
2 3 0 0 3 5 0 1 0 0 14
Unskilled and defined
decision making
(Levels 1-2)
1 0 0 0 0 0 0 0 0 0 1
Total 19 15 0 16 17 28 1 16 0 2 114
Temporary employees 0 0 0 0 0 0 0 0 0 0 0
Grand total 19 15 0 16 17 28 1 16 0 2 114
A = African; C = Coloured; I = Indian; W = White.
NOTE: Terminations refer to those employees (excluding interns) who have left the employ of the
Department, including transfers to other departments, as per Table 3.4.1.
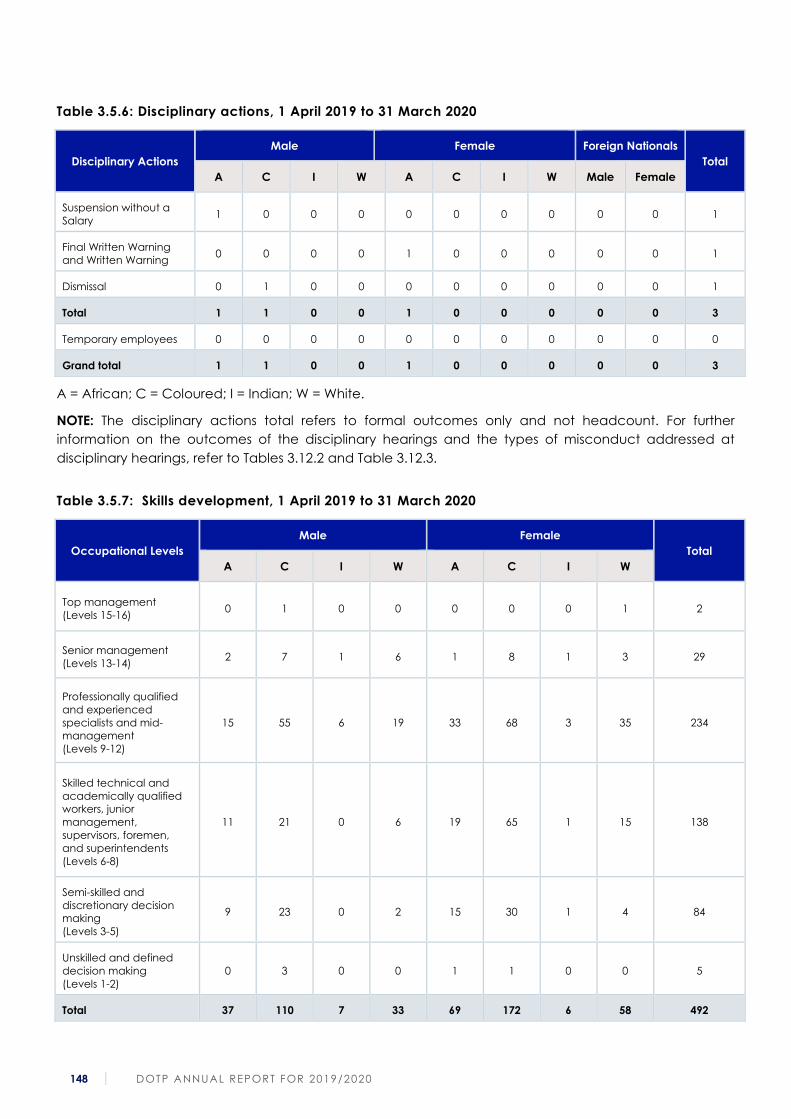
148 DOTP ANNUAL REPORT FOR 2019/2020
Table 3.5.6: Disciplinary actions, 1 April 2019 to 31 March 2020
Disciplinary Actions
Male Female Foreign Nationals
Total
A C I W A C I W Male Female
Suspension without a
Salary 1 0 0 0 0 0 0 0 0 0 1
Final Written Warning
and Written Warning 0 0 0 0 1 0 0 0 0 0 1
Dismissal 0 1 0 0 0 0 0 0 0 0 1
Total 1 1 0 0 1 0 0 0 0 0 3
Temporary employees 0 0 0 0 0 0 0 0 0 0 0
Grand total 1 1 0 0 1 0 0 0 0 0 3
A = African; C = Coloured; I = Indian; W = White.
NOTE: The disciplinary actions total refers to formal outcomes only and not headcount. For further
information on the outcomes of the disciplinary hearings and the types of misconduct addressed at
disciplinary hearings, refer to Tables 3.12.2 and Table 3.12.3.
Table 3.5.7: Skills development, 1 April 2019 to 31 March 2020
Occupational Levels
Male Female
Total
A C I W A C I W
Top management
(Levels 15-16) 0 1 0 0 0 0 0 1 2
Senior management
(Levels 13-14) 2 7 1 6 1 8 1 3 29
Professionally qualified
and experienced
specialists and mid-
management
(Levels 9-12)
15 55 6 19 33 68 3 35 234
Skilled technical and
academically qualified
workers, junior
management,
supervisors, foremen,
and superintendents
(Levels 6-8)
11 21 0 6 19 65 1 15 138
Semi-skilled and
discretionary decision
making
(Levels 3-5)
9 23 0 2 15 30 1 4 84
Unskilled and defined
decision making
(Levels 1-2)
0 3 0 0 1 1 0 0 5
Total 37 110 7 33 69 172 6 58 492
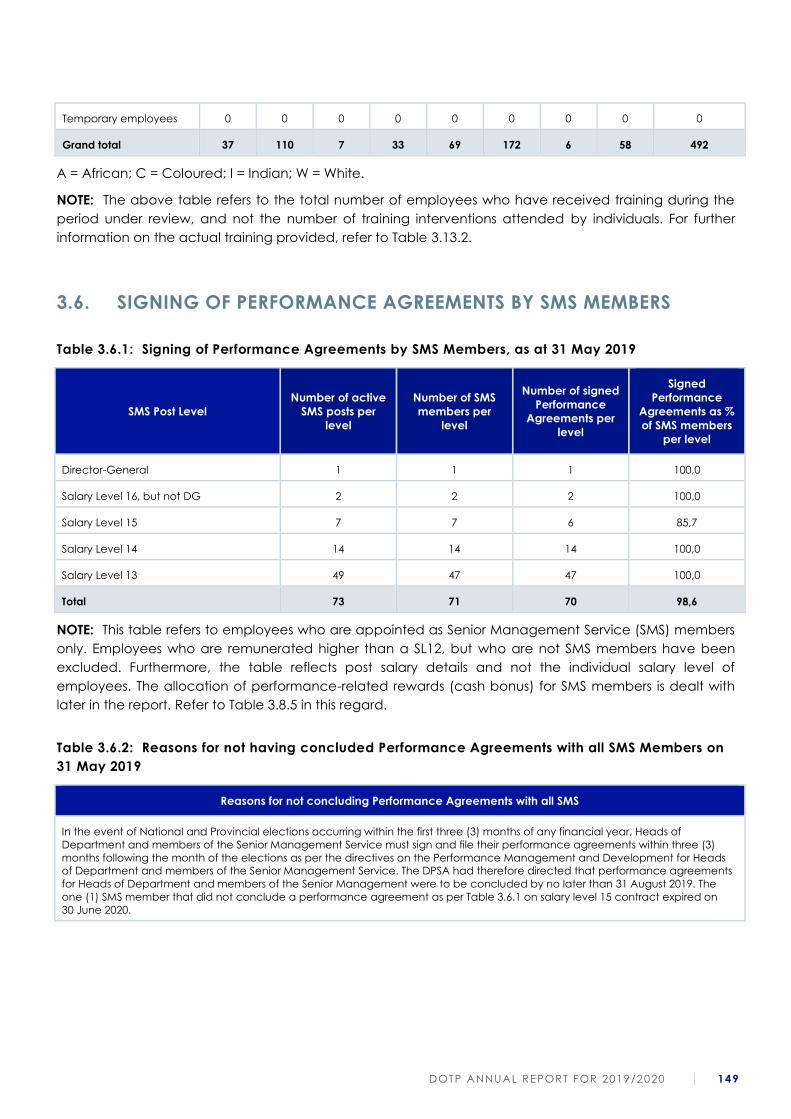
DOTP ANNUAL REPORT FOR 2019/2020 149
Temporary employees 0 0 0 0 0 0 0 0 0
Grand total 37 110 7 33 69 172 6 58 492
A = African; C = Coloured; I = Indian; W = White.
NOTE: The above table refers to the total number of employees who have received training during the
period under review, and not the number of training interventions attended by individuals. For further
information on the actual training provided, refer to Table 3.13.2.
3.6. SIGNING OF PERFORMANCE AGREEMENTS BY SMS MEMBERS
Table 3.6.1: Signing of Performance Agreements by SMS Members, as at 31 May 2019
SMS Post Level
Number of active
SMS posts per
level
Number of SMS
members per
level
Number of signed
Performance
Agreements per
level
Signed
Performance
Agreements as %
of SMS members
per level
Director-General 1 1 1 100,0
Salary Level 16, but not DG 2 2 2 100,0
Salary Level 15 7 7 6 85,7
Salary Level 14 14 14 14 100,0
Salary Level 13 49 47 47 100,0
Total 73 71 70 98,6
NOTE: This table refers to employees who are appointed as Senior Management Service (SMS) members
only. Employees who are remunerated higher than a SL12, but who are not SMS members have been
excluded. Furthermore, the table reflects post salary details and not the individual salary level of
employees. The allocation of performance-related rewards (cash bonus) for SMS members is dealt with
later in the report. Refer to Table 3.8.5 in this regard.
Table 3.6.2: Reasons for not having concluded Performance Agreements with all SMS Members on
31 May 2019
Reasons for not concluding Performance Agreements with all SMS
In the event of National and Provincial elections occurring within the first three (3) months of any financial year, Heads of
Department and members of the Senior Management Service must sign and file their performance agreements within three (3)
months following the month of the elections as per the directives on the Performance Management and Development for Heads
of Department and members of the Senior Management Service. The DPSA had therefore directed that performance agreements
for Heads of Department and members of the Senior Management were to be concluded by no later than 31 August 2019. The
one (1) SMS member that did not conclude a performance agreement as per Table 3.6.1 on salary level 15 contract expired on
30 June 2020.
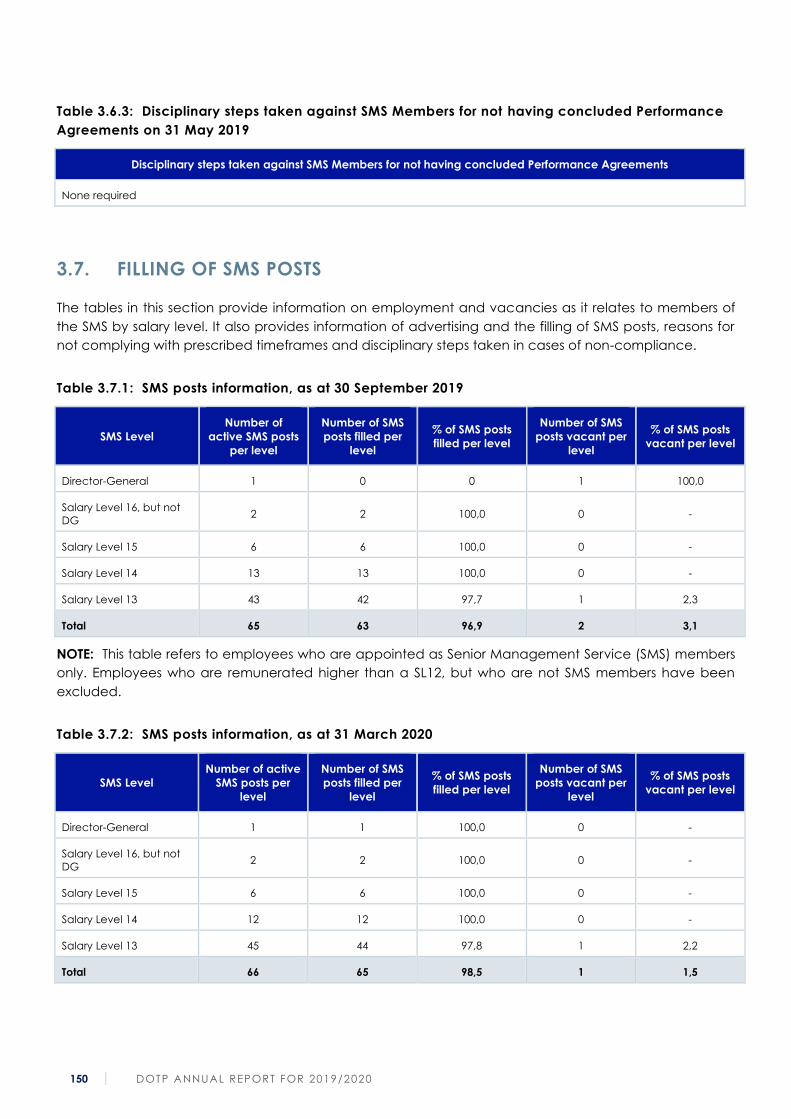
150 DOTP ANNUAL REPORT FOR 2019/2020
Table 3.6.3: Disciplinary steps taken against SMS Members for not having concluded Performance
Agreements on 31 May 2019
Disciplinary steps taken against SMS Members for not having concluded Performance Agreements
None required
3.7. FILLING OF SMS POSTS
The tables in this section provide information on employment and vacancies as it relates to members of
the SMS by salary level. It also provides information of advertising and the filling of SMS posts, reasons for
not complying with prescribed timeframes and disciplinary steps taken in cases of non-compliance.
Table 3.7.1: SMS posts information, as at 30 September 2019
SMS Level
Number of
active SMS posts
per level
Number of SMS
posts filled per
level
% of SMS posts
filled per level
Number of SMS
posts vacant per
level
% of SMS posts
vacant per level
Director-General 1 0 0 1 100,0
Salary Level 16, but not
DG 2 2 100,0 0 -
Salary Level 15 6 6 100,0 0 -
Salary Level 14 13 13 100,0 0 -
Salary Level 13 43 42 97,7 1 2,3
Total 65 63 96,9 2 3,1
NOTE: This table refers to employees who are appointed as Senior Management Service (SMS) members
only. Employees who are remunerated higher than a SL12, but who are not SMS members have been
excluded.
Table 3.7.2: SMS posts information, as at 31 March 2020
SMS Level
Number of active
SMS posts per
level
Number of SMS
posts filled per
level
% of SMS posts
filled per level
Number of SMS
posts vacant per
level
% of SMS posts
vacant per level
Director-General 1 1 100,0 0 -
Salary Level 16, but not
DG 2 2 100,0 0 -
Salary Level 15 6 6 100,0 0 -
Salary Level 14 12 12 100,0 0 -
Salary Level 13 45 44 97,8 1 2,2
Total 66 65 98,5 1 1,5
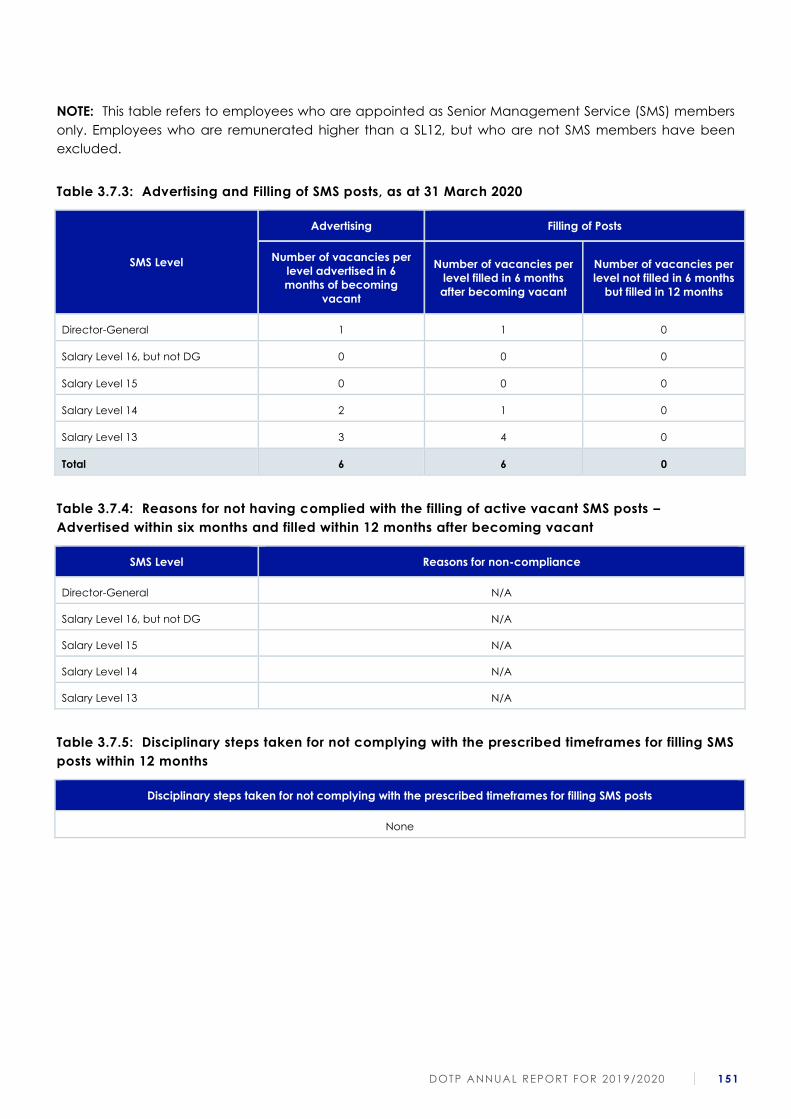
DOTP ANNUAL REPORT FOR 2019/2020 151
NOTE: This table refers to employees who are appointed as Senior Management Service (SMS) members
only. Employees who are remunerated higher than a SL12, but who are not SMS members have been
excluded.
Table 3.7.3: Advertising and Filling of SMS posts, as at 31 March 2020
SMS Level
Advertising Filling of Posts
Number of vacancies per
level advertised in 6
months of becoming
vacant
Number of vacancies per
level filled in 6 months
after becoming vacant
Number of vacancies per
level not filled in 6 months
but filled in 12 months
Director-General 1 1 0
Salary Level 16, but not DG 0 0 0
Salary Level 15 0 0 0
Salary Level 14 2 1 0
Salary Level 13 3 4 0
Total 6 6 0
Table 3.7.4: Reasons for not having complied with the filling of active vacant SMS posts –
Advertised within six months and filled within 12 months after becoming vacant
SMS Level Reasons for non-compliance
Director-General N/A
Salary Level 16, but not DG N/A
Salary Level 15 N/A
Salary Level 14 N/A
Salary Level 13 N/A
Table 3.7.5: Disciplinary steps taken for not complying with the prescribed timeframes for filling SMS
posts within 12 months
Disciplinary steps taken for not complying with the prescribed timeframes for filling SMS posts
None
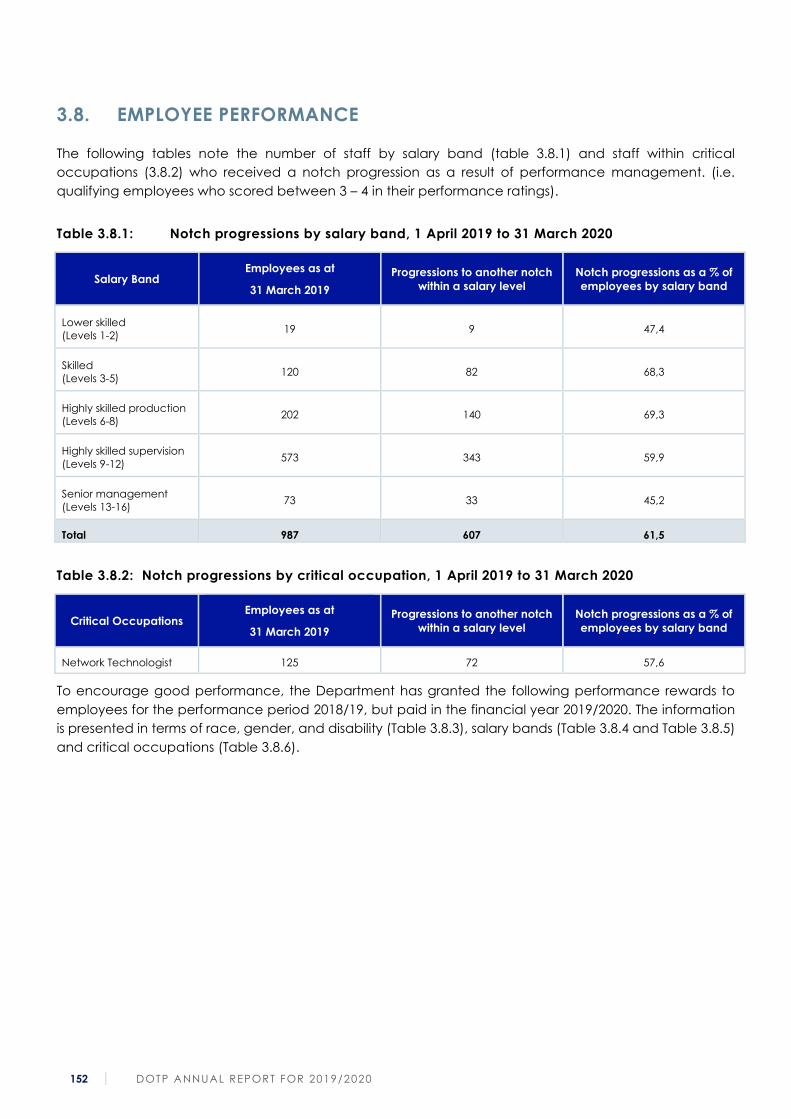
152 DOTP ANNUAL REPORT FOR 2019/2020
3.8. EMPLOYEE PERFORMANCE
The following tables note the number of staff by salary band (table 3.8.1) and staff within critical
occupations (3.8.2) who received a notch progression as a result of performance management. (i.e.
qualifying employees who scored between 3 – 4 in their performance ratings).
Table 3.8.1: Notch progressions by salary band, 1 April 2019 to 31 March 2020
Salary Band Employees as at
31 March 2019
Progressions to another notch
within a salary level
Notch progressions as a % of
employees by salary band
Lower skilled
(Levels 1-2) 19 9 47,4
Skilled
(Levels 3-5) 120 82 68,3
Highly skilled production
(Levels 6-8) 202 140 69,3
Highly skilled supervision
(Levels 9-12) 573 343 59,9
Senior management
(Levels 13-16) 73 33 45,2
Total 987 607 61,5
Table 3.8.2: Notch progressions by critical occupation, 1 April 2019 to 31 March 2020
Critical Occupations Employees as at
31 March 2019
Progressions to another notch
within a salary level
Notch progressions as a % of
employees by salary band
Network Technologist 125 72 57,6
To encourage good performance, the Department has granted the following performance rewards to
employees for the performance period 2018/19, but paid in the financial year 2019/2020. The information
is presented in terms of race, gender, and disability (Table 3.8.3), salary bands (Table 3.8.4 and Table 3.8.5)
and critical occupations (Table 3.8.6).
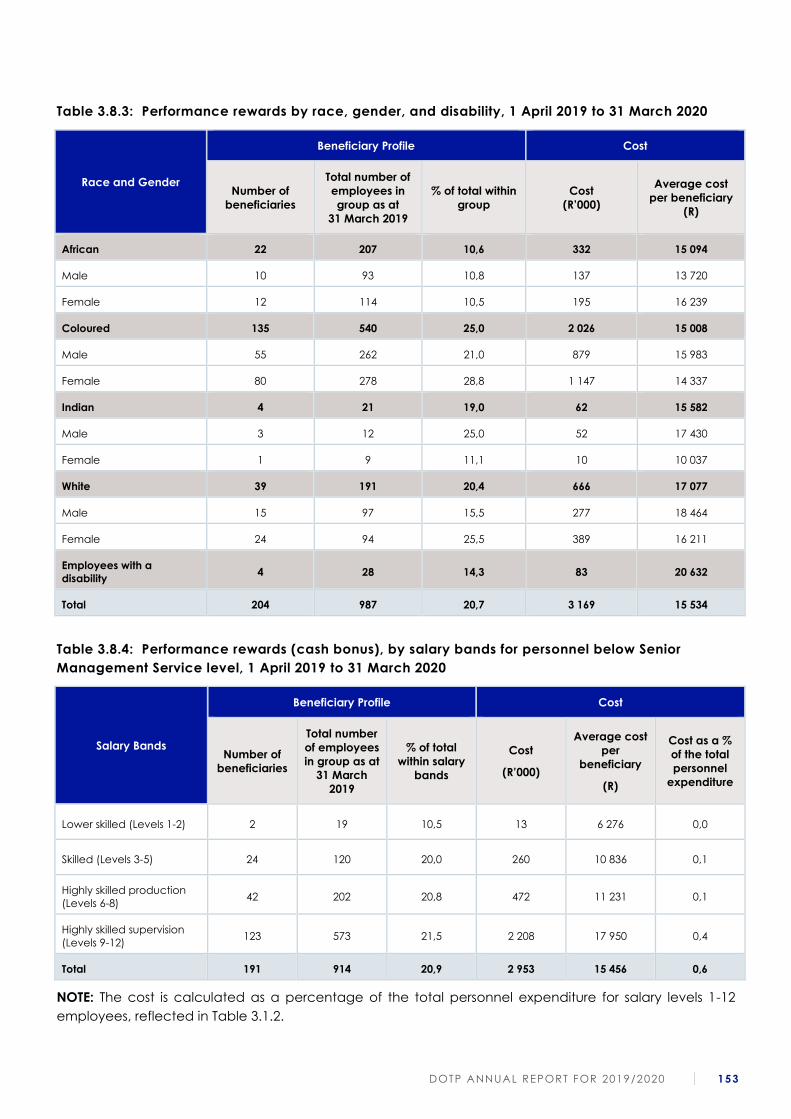
DOTP ANNUAL REPORT FOR 2019/2020 153
Table 3.8.3: Performance rewards by race, gender, and disability, 1 April 2019 to 31 March 2020
Race and Gender
Beneficiary Profile Cost
Number of
beneficiaries
Total number of
employees in
group as at
31 March 2019
% of total within
group
Cost
(R’000)
Average cost
per beneficiary
(R)
African 22 207 10,6 332 15 094
Male 10 93 10,8 137 13 720
Female 12 114 10,5 195 16 239
Coloured 135 540 25,0 2 026 15 008
Male 55 262 21,0 879 15 983
Female 80 278 28,8 1 147 14 337
Indian 4 21 19,0 62 15 582
Male 3 12 25,0 52 17 430
Female 1 9 11,1 10 10 037
White 39 191 20,4 666 17 077
Male 15 97 15,5 277 18 464
Female 24 94 25,5 389 16 211
Employees with a
disability 4 28 14,3 83 20 632
Total 204 987 20,7 3 169 15 534
Table 3.8.4: Performance rewards (cash bonus), by salary bands for personnel below Senior
Management Service level, 1 April 2019 to 31 March 2020
Salary Bands
Beneficiary Profile Cost
Number of
beneficiaries
Total number
of employees
in group as at
31 March
2019
% of total
within salary
bands
Cost
(R’000)
Average cost
per
beneficiary
(R)
Cost as a %
of the total
personnel
expenditure
Lower skilled (Levels 1-2) 2 19 10,5 13 6 276 0,0
Skilled (Levels 3-5) 24 120 20,0 260 10 836 0,1
Highly skilled production
(Levels 6-8) 42 202 20,8 472 11 231 0,1
Highly skilled supervision
(Levels 9-12) 123 573 21,5 2 208 17 950 0,4
Total 191 914 20,9 2 953 15 456 0,6
NOTE: The cost is calculated as a percentage of the total personnel expenditure for salary levels 1-12
employees, reflected in Table 3.1.2.
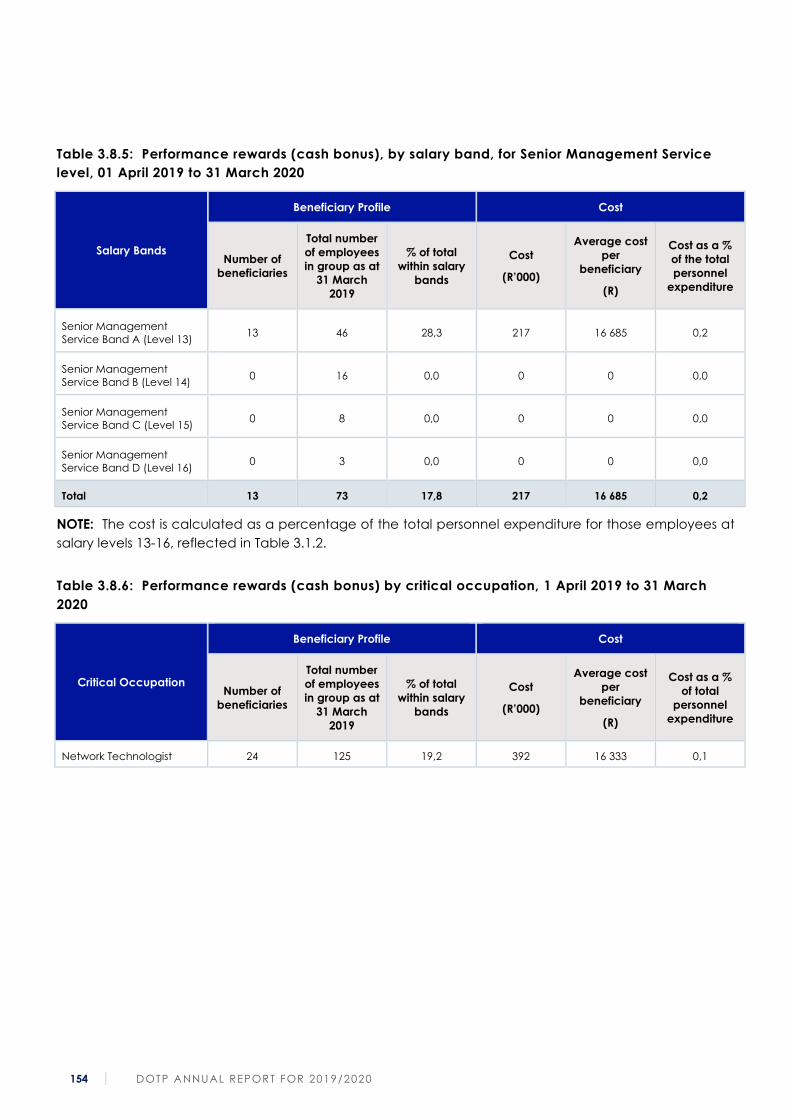
154 DOTP ANNUAL REPORT FOR 2019/2020
Table 3.8.5: Performance rewards (cash bonus), by salary band, for Senior Management Service
level, 01 April 2019 to 31 March 2020
Salary Bands
Beneficiary Profile Cost
Number of
beneficiaries
Total number
of employees
in group as at
31 March
2019
% of total
within salary
bands
Cost
(R’000)
Average cost
per
beneficiary
(R)
Cost as a %
of the total
personnel
expenditure
Senior Management
Service Band A (Level 13) 13 46 28,3 217 16 685 0,2
Senior Management
Service Band B (Level 14) 0 16 0,0 0 0 0,0
Senior Management
Service Band C (Level 15) 0 8 0,0 0 0 0,0
Senior Management
Service Band D (Level 16) 0 3 0,0 0 0 0,0
Total 13 73 17,8 217 16 685 0,2
NOTE: The cost is calculated as a percentage of the total personnel expenditure for those employees at
salary levels 13-16, reflected in Table 3.1.2.
Table 3.8.6: Performance rewards (cash bonus) by critical occupation, 1 April 2019 to 31 March
2020
Critical Occupation
Beneficiary Profile Cost
Number of
beneficiaries
Total number
of employees
in group as at
31 March
2019
% of total
within salary
bands
Cost
(R’000)
Average cost
per
beneficiary
(R)
Cost as a %
of total
personnel
expenditure
Network Technologist 24 125 19,2 392 16 333 0,1
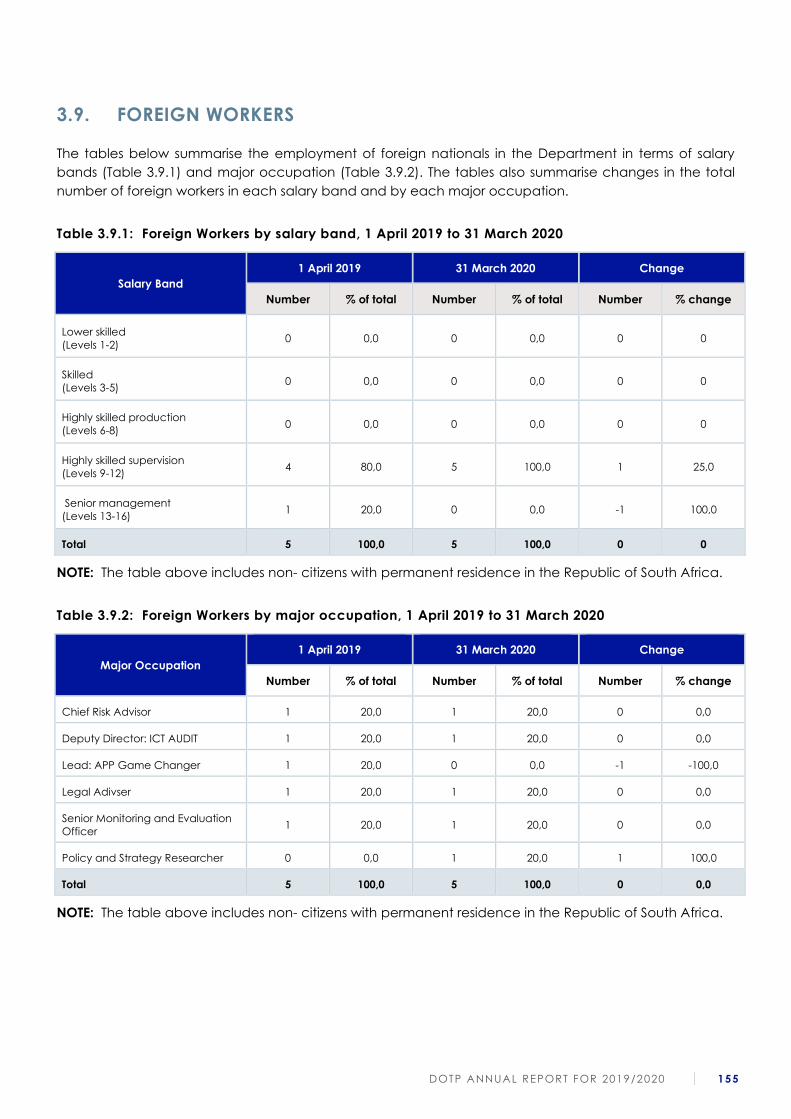
DOTP ANNUAL REPORT FOR 2019/2020 155
3.9. FOREIGN WORKERS
The tables below summarise the employment of foreign nationals in the Department in terms of salary
bands (Table 3.9.1) and major occupation (Table 3.9.2). The tables also summarise changes in the total
number of foreign workers in each salary band and by each major occupation.
Table 3.9.1: Foreign Workers by salary band, 1 April 2019 to 31 March 2020
Salary Band
1 April 2019 31 March 2020 Change
Number % of total Number % of total Number % change
Lower skilled
(Levels 1-2) 0 0,0 0 0,0 0 0
Skilled
(Levels 3-5) 0 0,0 0 0,0 0 0
Highly skilled production
(Levels 6-8) 0 0,0 0 0,0 0 0
Highly skilled supervision
(Levels 9-12) 4 80,0 5 100,0 1 25,0
Senior management
(Levels 13-16) 1 20,0 0 0,0 -1 100,0
Total 5 100,0 5 100,0 0 0
NOTE: The table above includes non- citizens with permanent residence in the Republic of South Africa.
Table 3.9.2: Foreign Workers by major occupation, 1 April 2019 to 31 March 2020
Major Occupation
1 April 2019 31 March 2020 Change
Number % of total Number % of total Number % change
Chief Risk Advisor 1 20,0 1 20,0 0 0,0
Deputy Director: ICT AUDIT 1 20,0 1 20,0 0 0,0
Lead: APP Game Changer 1 20,0 0 0,0 -1 -100,0
Legal Adivser 1 20,0 1 20,0 0 0,0
Senior Monitoring and Evaluation
Officer 1 20,0 1 20,0 0 0,0
Policy and Strategy Researcher 0 0,0 1 20,0 1 100,0
Total 5 100,0 5 100,0 0 0,0
NOTE: The table above includes non- citizens with permanent residence in the Republic of South Africa.
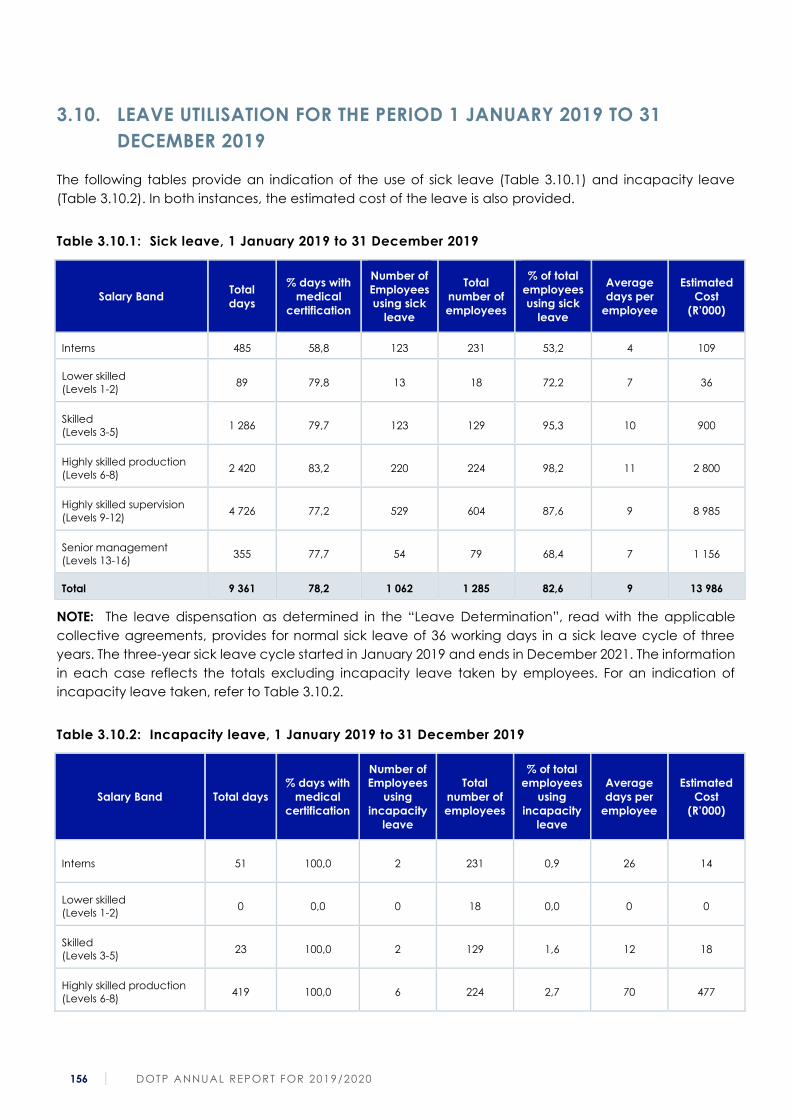
156 DOTP ANNUAL REPORT FOR 2019/2020
3.10. LEAVE UTILISATION FOR THE PERIOD 1 JANUARY 2019 TO 31
DECEMBER 2019
The following tables provide an indication of the use of sick leave (Table 3.10.1) and incapacity leave
(Table 3.10.2). In both instances, the estimated cost of the leave is also provided.
Table 3.10.1: Sick leave, 1 January 2019 to 31 December 2019
Salary Band Total
days
% days with
medical
certification
Number of
Employees
using sick
leave
Total
number of
employees
% of total
employees
using sick
leave
Average
days per
employee
Estimated
Cost
(R’000)
Interns 485 58,8 123 231 53,2 4 109
Lower skilled
(Levels 1-2) 89 79,8 13 18 72,2 7 36
Skilled
(Levels 3-5) 1 286 79,7 123 129 95,3 10 900
Highly skilled production
(Levels 6-8) 2 420 83,2 220 224 98,2 11 2 800
Highly skilled supervision
(Levels 9-12) 4 726 77,2 529 604 87,6 9 8 985
Senior management
(Levels 13-16) 355 77,7 54 79 68,4 7 1 156
Total 9 361 78,2 1 062 1 285 82,6 9 13 986
NOTE: The leave dispensation as determined in the “Leave Determination”, read with the applicable
collective agreements, provides for normal sick leave of 36 working days in a sick leave cycle of three
years. The three-year sick leave cycle started in January 2019 and ends in December 2021. The information
in each case reflects the totals excluding incapacity leave taken by employees. For an indication of
incapacity leave taken, refer to Table 3.10.2.
Table 3.10.2: Incapacity leave, 1 January 2019 to 31 December 2019
Salary Band Total days
% days with
medical
certification
Number of
Employees
using
incapacity
leave
Total
number of
employees
% of total
employees
using
incapacity
leave
Average
days per
employee
Estimated
Cost
(R’000)
Interns 51 100,0 2 231 0,9 26 14
Lower skilled
(Levels 1-2) 0 0,0 0 18 0,0 0 0
Skilled
(Levels 3-5) 23 100,0 2 129 1,6 12 18
Highly skilled production
(Levels 6-8) 419 100,0 6 224 2,7 70 477
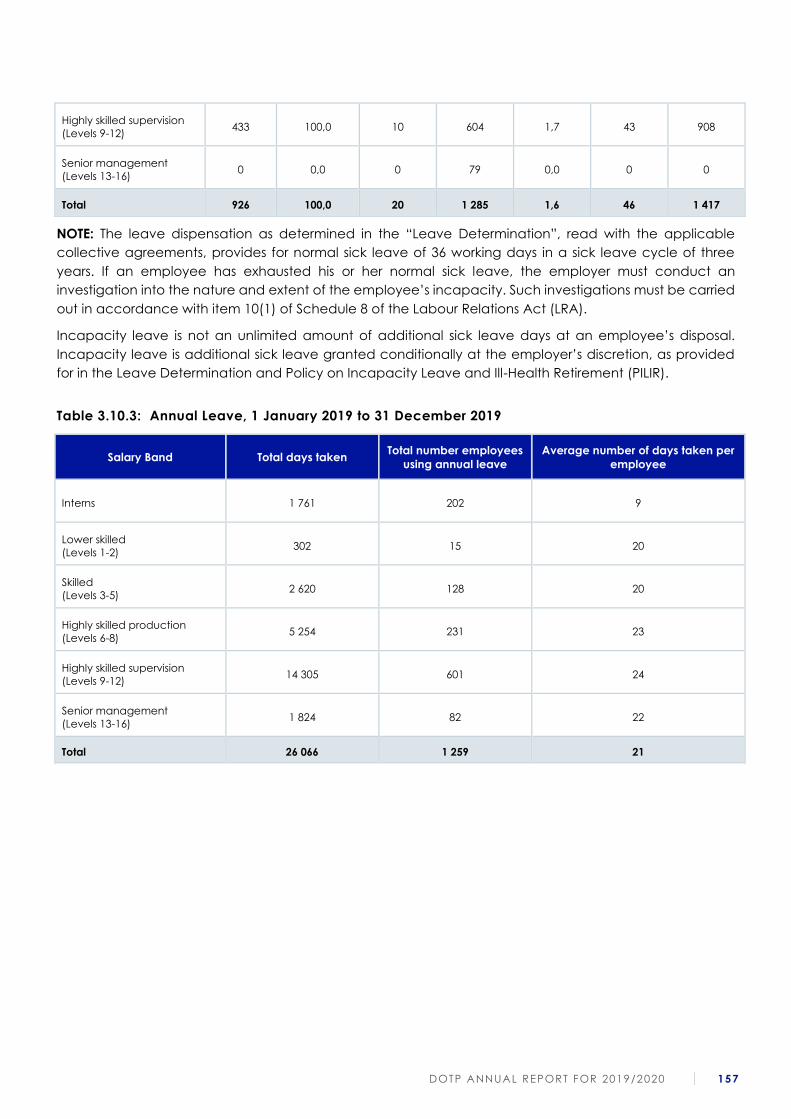
DOTP ANNUAL REPORT FOR 2019/2020 157
Highly skilled supervision
(Levels 9-12) 433 100,0 10 604 1,7 43 908
Senior management
(Levels 13-16) 0 0,0 0 79 0,0 0 0
Total 926 100,0 20 1 285 1,6 46 1 417
NOTE: The leave dispensation as determined in the “Leave Determination”, read with the applicable
collective agreements, provides for normal sick leave of 36 working days in a sick leave cycle of three
years. If an employee has exhausted his or her normal sick leave, the employer must conduct an
investigation into the nature and extent of the employee’s incapacity. Such investigations must be carried
out in accordance with item 10(1) of Schedule 8 of the Labour Relations Act (LRA).
Incapacity leave is not an unlimited amount of additional sick leave days at an employee’s disposal.
Incapacity leave is additional sick leave granted conditionally at the employer’s discretion, as provided
for in the Leave Determination and Policy on Incapacity Leave and Ill-Health Retirement (PILIR).
Table 3.10.3: Annual Leave, 1 January 2019 to 31 December 2019
Salary Band Total days taken Total number employees
using annual leave
Average number of days taken per
employee
Interns 1 761 202 9
Lower skilled
(Levels 1-2) 302 15 20
Skilled
(Levels 3-5) 2 620 128 20
Highly skilled production
(Levels 6-8) 5 254 231 23
Highly skilled supervision
(Levels 9-12) 14 305 601 24
Senior management
(Levels 13-16) 1 824 82 22
Total 26 066 1 259 21
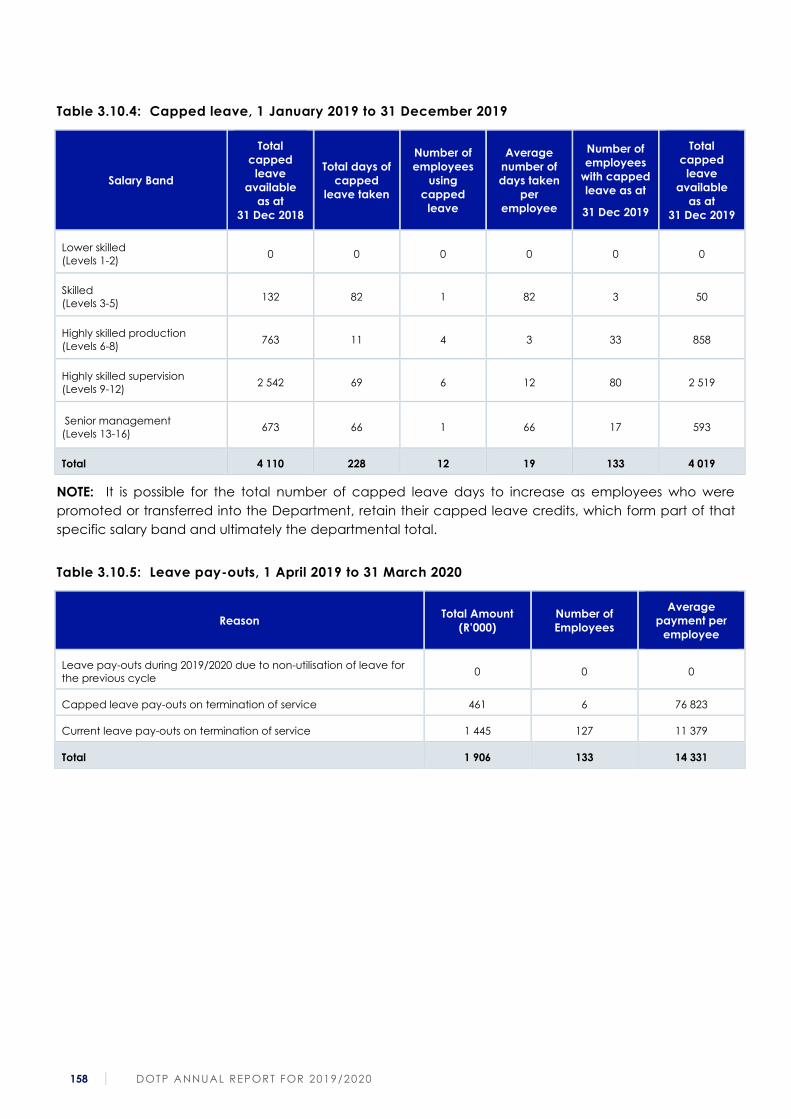
158 DOTP ANNUAL REPORT FOR 2019/2020
Table 3.10.4: Capped leave, 1 January 2019 to 31 December 2019
Salary Band
Total
capped
leave
available
as at
31 Dec 2018
Total days of
capped
leave taken
Number of
employees
using
capped
leave
Average
number of
days taken
per
employee
Number of
employees
with capped
leave as at
31 Dec 2019
Total
capped
leave
available
as at
31 Dec 2019
Lower skilled
(Levels 1-2) 0 0 0 0 0 0
Skilled
(Levels 3-5) 132 82 1 82 3 50
Highly skilled production
(Levels 6-8) 763 11 4 3 33 858
Highly skilled supervision
(Levels 9-12) 2 542 69 6 12 80 2 519
Senior management
(Levels 13-16) 673 66 1 66 17 593
Total 4 110 228 12 19 133 4 019
NOTE: It is possible for the total number of capped leave days to increase as employees who were
promoted or transferred into the Department, retain their capped leave credits, which form part of that
specific salary band and ultimately the departmental total.
Table 3.10.5: Leave pay-outs, 1 April 2019 to 31 March 2020
Reason Total Amount
(R’000)
Number of
Employees
Average
payment per
employee
Leave pay-outs during 2019/2020 due to non-utilisation of leave for
the previous cycle 0 0 0
Capped leave pay-outs on termination of service 461 6 76 823
Current leave pay-outs on termination of service 1 445 127 11 379
Total 1 906 133 14 331
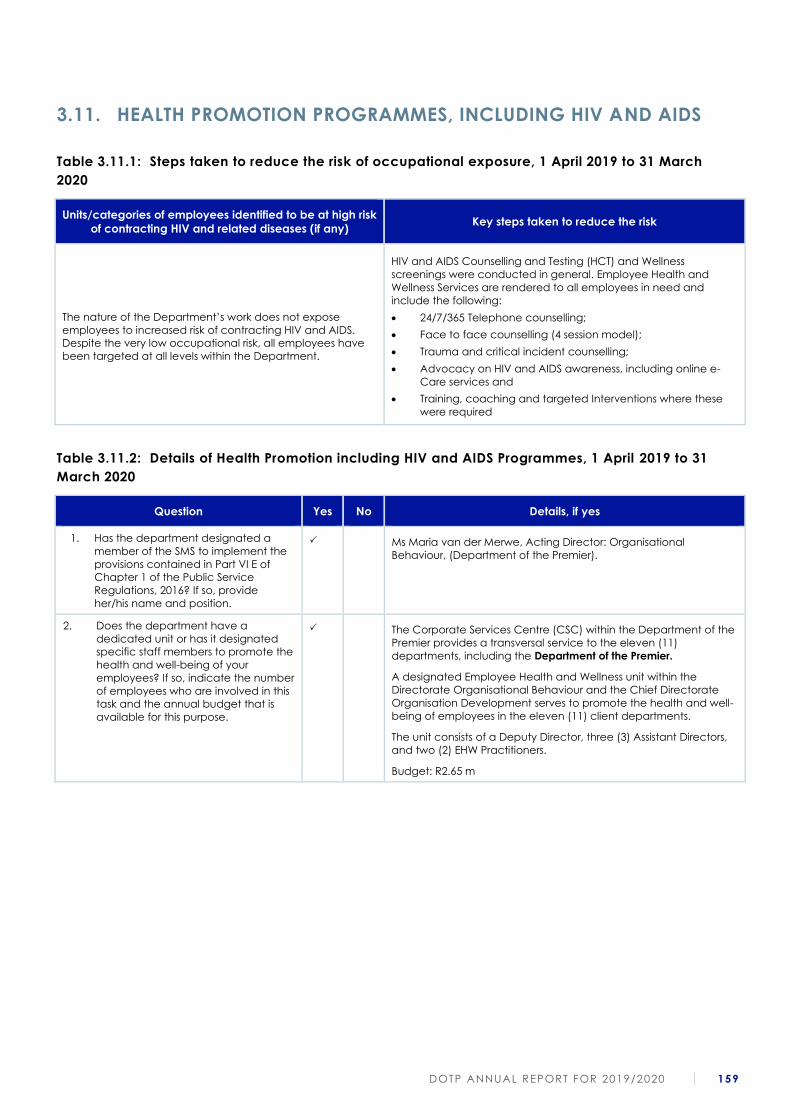
DOTP ANNUAL REPORT FOR 2019/2020 159
3.11. HEALTH PROMOTION PROGRAMMES, INCLUDING HIV AND AIDS
Table 3.11.1: Steps taken to reduce the risk of occupational exposure, 1 April 2019 to 31 March
2020
Units/categories of employees identified to be at high risk
of contracting HIV and related diseases (if any) Key steps taken to reduce the risk
The nature of the Department’s work does not expose
employees to increased risk of contracting HIV and AIDS.
Despite the very low occupational risk, all employees have
been targeted at all levels within the Department.
HIV and AIDS Counselling and Testing (HCT) and Wellness
screenings were conducted in general. Employee Health and
Wellness Services are rendered to all employees in need and
include the following:
• 24/7/365 Telephone counselling;
• Face to face counselling (4 session model);
• Trauma and critical incident counselling;
• Advocacy on HIV and AIDS awareness, including online e-
Care services and
• Training, coaching and targeted Interventions where these
were required
Table 3.11.2: Details of Health Promotion including HIV and AIDS Programmes, 1 April 2019 to 31
March 2020
Question Yes No Details, if yes
1. Has the department designated a
member of the SMS to implement the
provisions contained in Part VI E of
Chapter 1 of the Public Service
Regulations, 2016? If so, provide
her/his name and position.
Ms Maria van der Merwe, Acting Director: Organisational
Behaviour, (Department of the Premier).
2. Does the department have a
dedicated unit or has it designated
specific staff members to promote the
health and well-being of your
employees? If so, indicate the number
of employees who are involved in this
task and the annual budget that is
available for this purpose.
The Corporate Services Centre (CSC) within the Department of the
Premier provides a transversal service to the eleven (11)
departments, including the Department of the Premier.
A designated Employee Health and Wellness unit within the
Directorate Organisational Behaviour and the Chief Directorate
Organisation Development serves to promote the health and well-
being of employees in the eleven (11) client departments.
The unit consists of a Deputy Director, three (3) Assistant Directors,
and two (2) EHW Practitioners.
Budget: R2.65 m
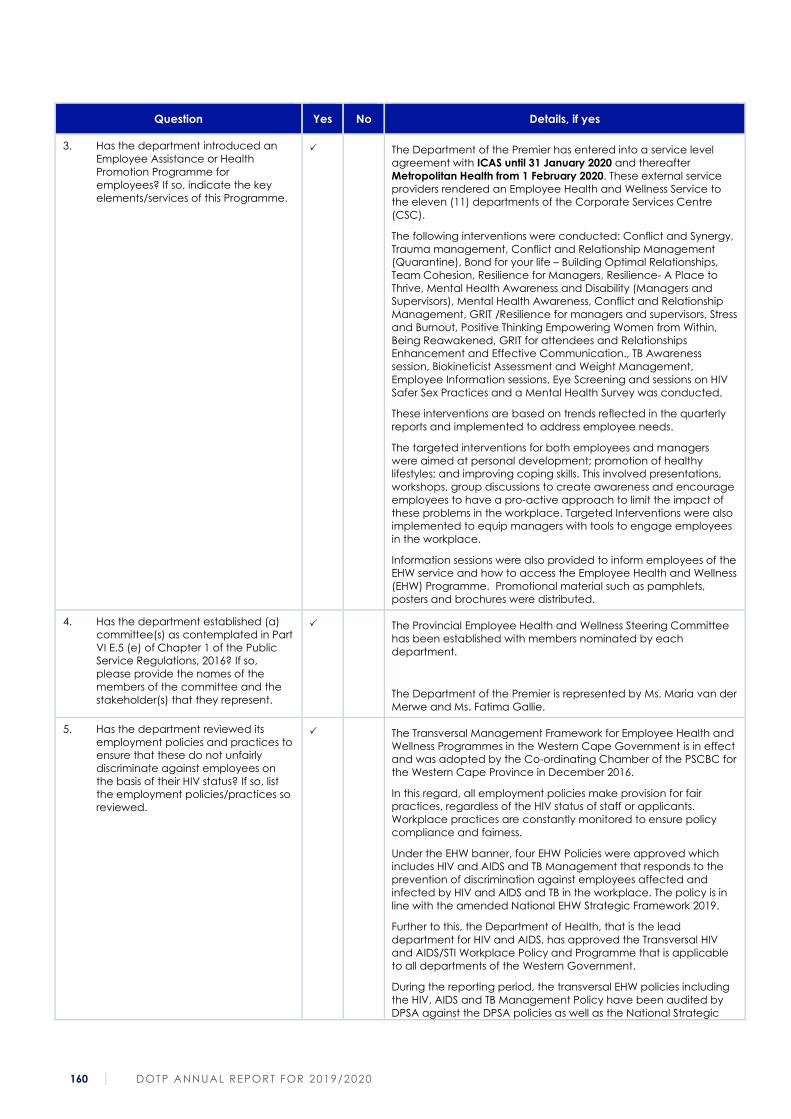
160 DOTP ANNUAL REPORT FOR 2019/2020
Question Yes No Details, if yes
3. Has the department introduced an
Employee Assistance or Health
Promotion Programme for
employees? If so, indicate the key
elements/services of this Programme.
The Department of the Premier has entered into a service level
agreement with ICAS until 31 January 2020 and thereafter
Metropolitan Health from 1 February 2020. These external service
providers rendered an Employee Health and Wellness Service to
the eleven (11) departments of the Corporate Services Centre
(CSC).
The following interventions were conducted: Conflict and Synergy,
Trauma management, Conflict and Relationship Management
(Quarantine), Bond for your life – Building Optimal Relationships,
Team Cohesion, Resilience for Managers, Resilience- A Place to
Thrive, Mental Health Awareness and Disability (Managers and
Supervisors), Mental Health Awareness, Conflict and Relationship
Management, GRIT /Resilience for managers and supervisors, Stress
and Burnout, Positive Thinking Empowering Women from Within,
Being Reawakened, GRIT for attendees and Relationships
Enhancement and Effective Communication., TB Awareness
session, Biokineticist Assessment and Weight Management,
Employee Information sessions, Eye Screening and sessions on HIV
Safer Sex Practices and a Mental Health Survey was conducted.
These interventions are based on trends reflected in the quarterly
reports and implemented to address employee needs.
The targeted interventions for both employees and managers
were aimed at personal development; promotion of healthy
lifestyles; and improving coping skills. This involved presentations,
workshops, group discussions to create awareness and encourage
employees to have a pro-active approach to limit the impact of
these problems in the workplace. Targeted Interventions were also
implemented to equip managers with tools to engage employees
in the workplace.
Information sessions were also provided to inform employees of the
EHW service and how to access the Employee Health and Wellness
(EHW) Programme. Promotional material such as pamphlets,
posters and brochures were distributed.
4. Has the department established (a)
committee(s) as contemplated in Part
VI E.5 (e) of Chapter 1 of the Public
Service Regulations, 2016? If so,
please provide the names of the
members of the committee and the
stakeholder(s) that they represent.
The Provincial Employee Health and Wellness Steering Committee
has been established with members nominated by each
department.
The Department of the Premier is represented by Ms. Maria van der
Merwe and Ms. Fatima Gallie.
5. Has the department reviewed its
employment policies and practices to
ensure that these do not unfairly
discriminate against employees on
the basis of their HIV status? If so, list
the employment policies/practices so
reviewed.
The Transversal Management Framework for Employee Health and
Wellness Programmes in the Western Cape Government is in effect
and was adopted by the Co-ordinating Chamber of the PSCBC for
the Western Cape Province in December 2016.
In this regard, all employment policies make provision for fair
practices, regardless of the HIV status of staff or applicants.
Workplace practices are constantly monitored to ensure policy
compliance and fairness.
Under the EHW banner, four EHW Policies were approved which
includes HIV and AIDS and TB Management that responds to the
prevention of discrimination against employees affected and
infected by HIV and AIDS and TB in the workplace. The policy is in
line with the amended National EHW Strategic Framework 2019.
Further to this, the Department of Health, that is the lead
department for HIV and AIDS, has approved the Transversal HIV
and AIDS/STI Workplace Policy and Programme that is applicable
to all departments of the Western Government.
During the reporting period, the transversal EHW policies including
the HIV, AIDS and TB Management Policy have been audited by
DPSA against the DPSA policies as well as the National Strategic
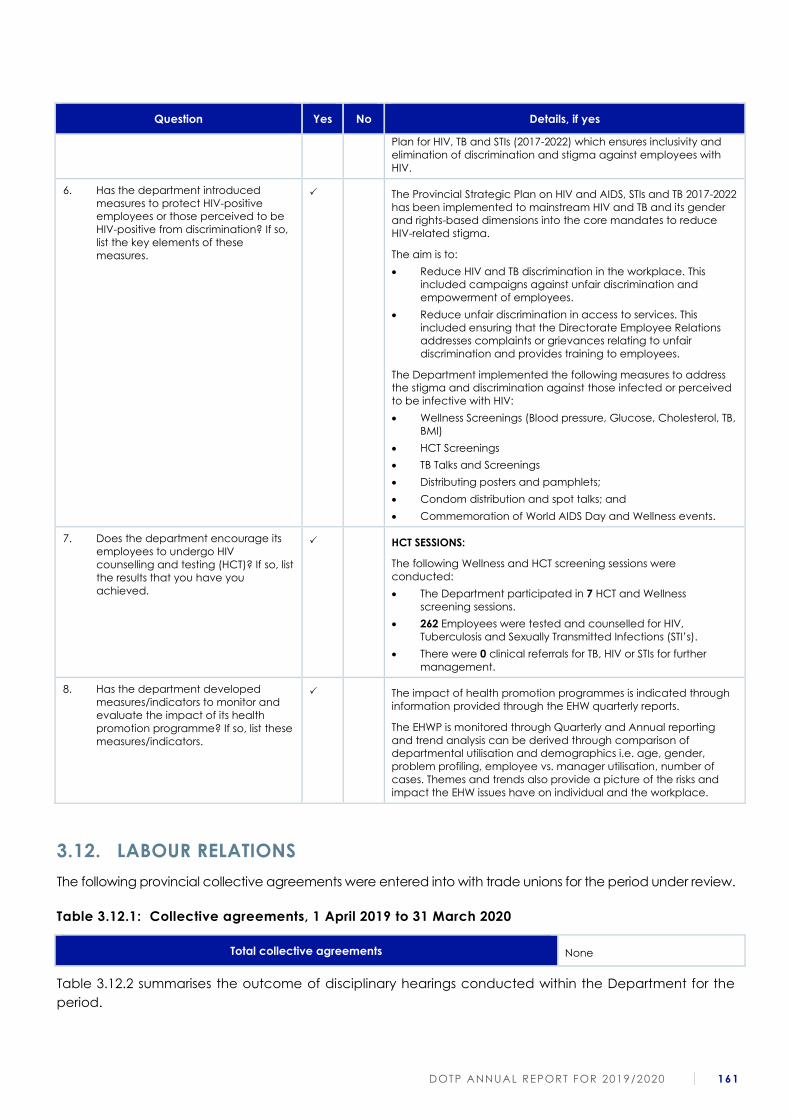
DOTP ANNUAL REPORT FOR 2019/2020 161
Question Yes No Details, if yes
Plan for HIV, TB and STIs (2017-2022) which ensures inclusivity and
elimination of discrimination and stigma against employees with
HIV.
6. Has the department introduced
measures to protect HIV-positive
employees or those perceived to be
HIV-positive from discrimination? If so,
list the key elements of these
measures.
The Provincial Strategic Plan on HIV and AIDS, STIs and TB 2017-2022
has been implemented to mainstream HIV and TB and its gender
and rights-based dimensions into the core mandates to reduce
HIV-related stigma.
The aim is to:
• Reduce HIV and TB discrimination in the workplace. This
included campaigns against unfair discrimination and
empowerment of employees.
• Reduce unfair discrimination in access to services. This
included ensuring that the Directorate Employee Relations
addresses complaints or grievances relating to unfair
discrimination and provides training to employees.
The Department implemented the following measures to address
the stigma and discrimination against those infected or perceived
to be infective with HIV:
• Wellness Screenings (Blood pressure, Glucose, Cholesterol, TB,
BMI)
• HCT Screenings
• TB Talks and Screenings
• Distributing posters and pamphlets;
• Condom distribution and spot talks; and
• Commemoration of World AIDS Day and Wellness events.
7. Does the department encourage its
employees to undergo HIV
counselling and testing (HCT)? If so, list
the results that you have you
achieved.
HCT SESSIONS:
The following Wellness and HCT screening sessions were
conducted:
• The Department participated in 7 HCT and Wellness
screening sessions.
• 262 Employees were tested and counselled for HIV,
Tuberculosis and Sexually Transmitted Infections (STI’s).
• There were 0 clinical referrals for TB, HIV or STIs for further
management.
8. Has the department developed
measures/indicators to monitor and
evaluate the impact of its health
promotion programme? If so, list these
measures/indicators.
The impact of health promotion programmes is indicated through
information provided through the EHW quarterly reports.
The EHWP is monitored through Quarterly and Annual reporting
and trend analysis can be derived through comparison of
departmental utilisation and demographics i.e. age, gender,
problem profiling, employee vs. manager utilisation, number of
cases. Themes and trends also provide a picture of the risks and
impact the EHW issues have on individual and the workplace.
3.12. LABOUR RELATIONS
The following provincial collective agreements were entered into with trade unions for the period under review.
Table 3.12.1: Collective agreements, 1 April 2019 to 31 March 2020
Total collective agreements None
Table 3.12.2 summarises the outcome of disciplinary hearings conducted within the Department for the
period.
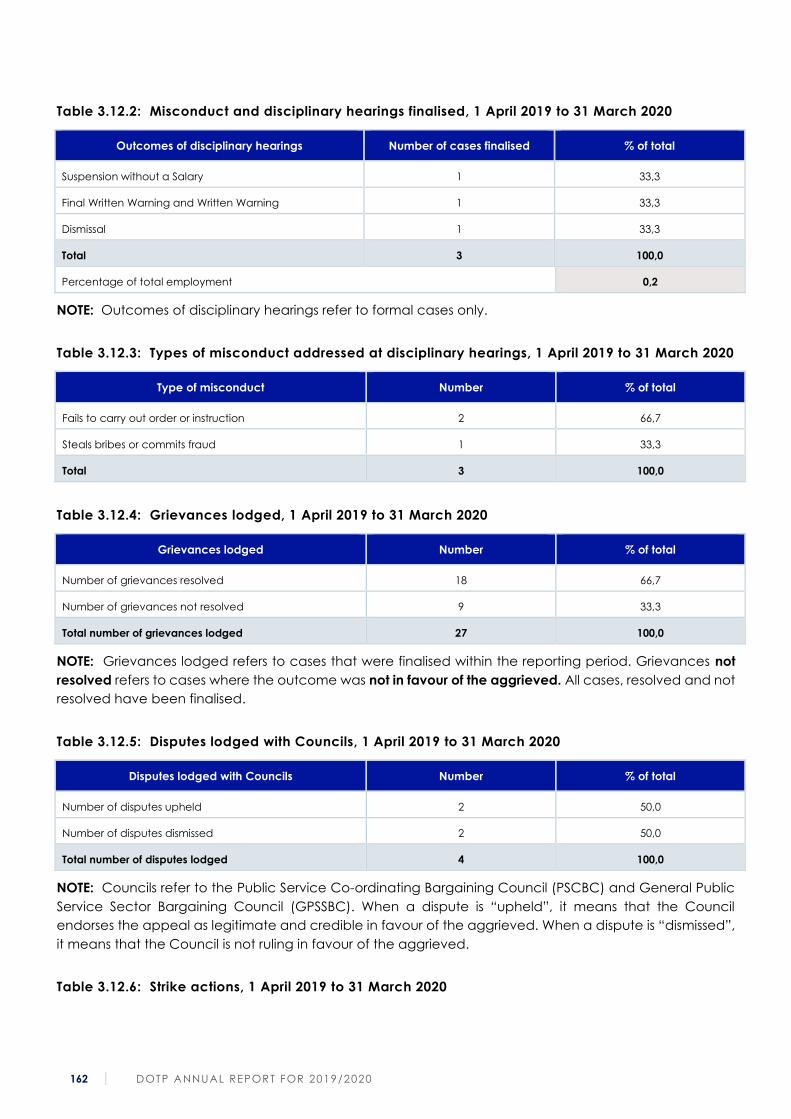
162 DOTP ANNUAL REPORT FOR 2019/2020
Table 3.12.2: Misconduct and disciplinary hearings finalised, 1 April 2019 to 31 March 2020
Outcomes of disciplinary hearings Number of cases finalised % of total
Suspension without a Salary 1 33,3
Final Written Warning and Written Warning 1 33,3
Dismissal 1 33,3
Total 3 100,0
Percentage of total employment 0,2
NOTE: Outcomes of disciplinary hearings refer to formal cases only.
Table 3.12.3: Types of misconduct addressed at disciplinary hearings, 1 April 2019 to 31 March 2020
Type of misconduct Number % of total
Fails to carry out order or instruction 2 66,7
Steals bribes or commits fraud 1 33,3
Total 3 100,0
Table 3.12.4: Grievances lodged, 1 April 2019 to 31 March 2020
Grievances lodged Number % of total
Number of grievances resolved 18 66,7
Number of grievances not resolved 9 33,3
Total number of grievances lodged 27 100,0
NOTE: Grievances lodged refers to cases that were finalised within the reporting period. Grievances not
resolved refers to cases where the outcome was not in favour of the aggrieved. All cases, resolved and not
resolved have been finalised.
Table 3.12.5: Disputes lodged with Councils, 1 April 2019 to 31 March 2020
Disputes lodged with Councils Number % of total
Number of disputes upheld 2 50,0
Number of disputes dismissed 2 50,0
Total number of disputes lodged 4 100,0
NOTE: Councils refer to the Public Service Co-ordinating Bargaining Council (PSCBC) and General Public
Service Sector Bargaining Council (GPSSBC). When a dispute is “upheld”, it means that the Council
endorses the appeal as legitimate and credible in favour of the aggrieved. When a dispute is “dismissed”,
it means that the Council is not ruling in favour of the aggrieved.
Table 3.12.6: Strike actions, 1 April 2019 to 31 March 2020

DOTP ANNUAL REPORT FOR 2019/2020 163
Strike actions Number
Total number of person working days lost 0
Total cost (R’000) of working days lost 0
Amount (R’000) recovered as a result of no work no pay 0
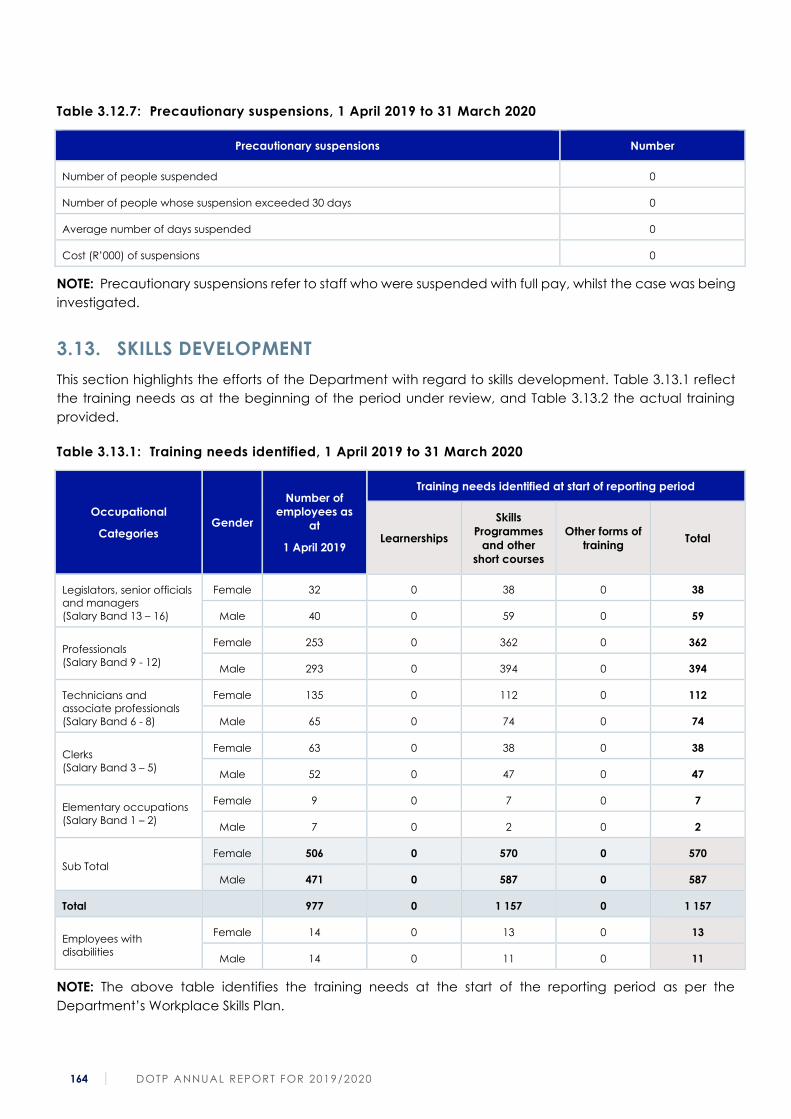
164 DOTP ANNUAL REPORT FOR 2019/2020
Table 3.12.7: Precautionary suspensions, 1 April 2019 to 31 March 2020
Precautionary suspensions Number
Number of people suspended 0
Number of people whose suspension exceeded 30 days 0
Average number of days suspended 0
Cost (R’000) of suspensions 0
NOTE: Precautionary suspensions refer to staff who were suspended with full pay, whilst the case was being
investigated.
3.13. SKILLS DEVELOPMENT
This section highlights the efforts of the Department with regard to skills development. Table 3.13.1 reflect
the training needs as at the beginning of the period under review, and Table 3.13.2 the actual training
provided.
Table 3.13.1: Training needs identified, 1 April 2019 to 31 March 2020
Occupational
Categories Gender
Number of
employees as
at
1 April 2019
Training needs identified at start of reporting period
Learnerships
Skills
Programmes
and other
short courses
Other forms of
training Total
Legislators, senior officials
and managers
(Salary Band 13 – 16)
Female 32 0 38 0 38
Male 40 0 59 0 59
Professionals
(Salary Band 9 - 12)
Female 253 0 362 0 362
Male 293 0 394 0 394
Technicians and
associate professionals
(Salary Band 6 - 8)
Female 135 0 112 0 112
Male 65 0 74 0 74
Clerks
(Salary Band 3 – 5)
Female 63 0 38 0 38
Male 52 0 47 0 47
Elementary occupations
(Salary Band 1 – 2)
Female 9 0 7 0 7
Male 7 0 2 0 2
Sub Total
Female 506 0 570 0 570
Male 471 0 587 0 587
Total 977 0 1 157 0 1 157
Employees with
disabilities
Female 14 0 13 0 13
Male 14 0 11 0 11
NOTE: The above table identifies the training needs at the start of the reporting period as per the
Department’s Workplace Skills Plan.
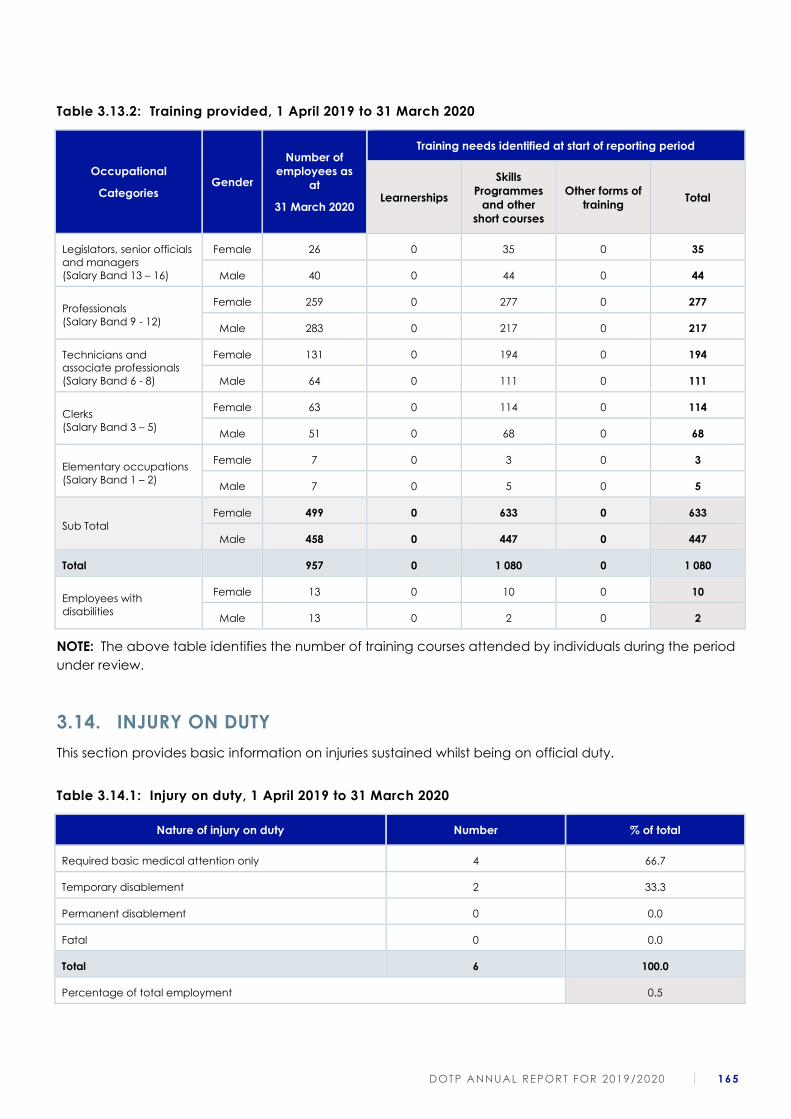
DOTP ANNUAL REPORT FOR 2019/2020 165
Table 3.13.2: Training provided, 1 April 2019 to 31 March 2020
Occupational
Categories Gender
Number of
employees as
at
31 March 2020
Training needs identified at start of reporting period
Learnerships
Skills
Programmes
and other
short courses
Other forms of
training Total
Legislators, senior officials
and managers
(Salary Band 13 – 16)
Female 26 0 35 0 35
Male 40 0 44 0 44
Professionals
(Salary Band 9 - 12)
Female 259 0 277 0 277
Male 283 0 217 0 217
Technicians and
associate professionals
(Salary Band 6 - 8)
Female 131 0 194 0 194
Male 64 0 111 0 111
Clerks
(Salary Band 3 – 5)
Female 63 0 114 0 114
Male 51 0 68 0 68
Elementary occupations
(Salary Band 1 – 2)
Female 7 0 3 0 3
Male 7 0 5 0 5
Sub Total
Female 499 0 633 0 633
Male 458 0 447 0 447
Total 957 0 1 080 0 1 080
Employees with
disabilities
Female 13 0 10 0 10
Male 13 0 2 0 2
NOTE: The above table identifies the number of training courses attended by individuals during the period
under review.
3.14. INJURY ON DUTY
This section provides basic information on injuries sustained whilst being on official duty.
Table 3.14.1: Injury on duty, 1 April 2019 to 31 March 2020
Nature of injury on duty Number % of total
Required basic medical attention only 4 66.7
Temporary disablement 2 33.3
Permanent disablement 0 0.0
Fatal 0 0.0
Total 6 100.0
Percentage of total employment 0.5
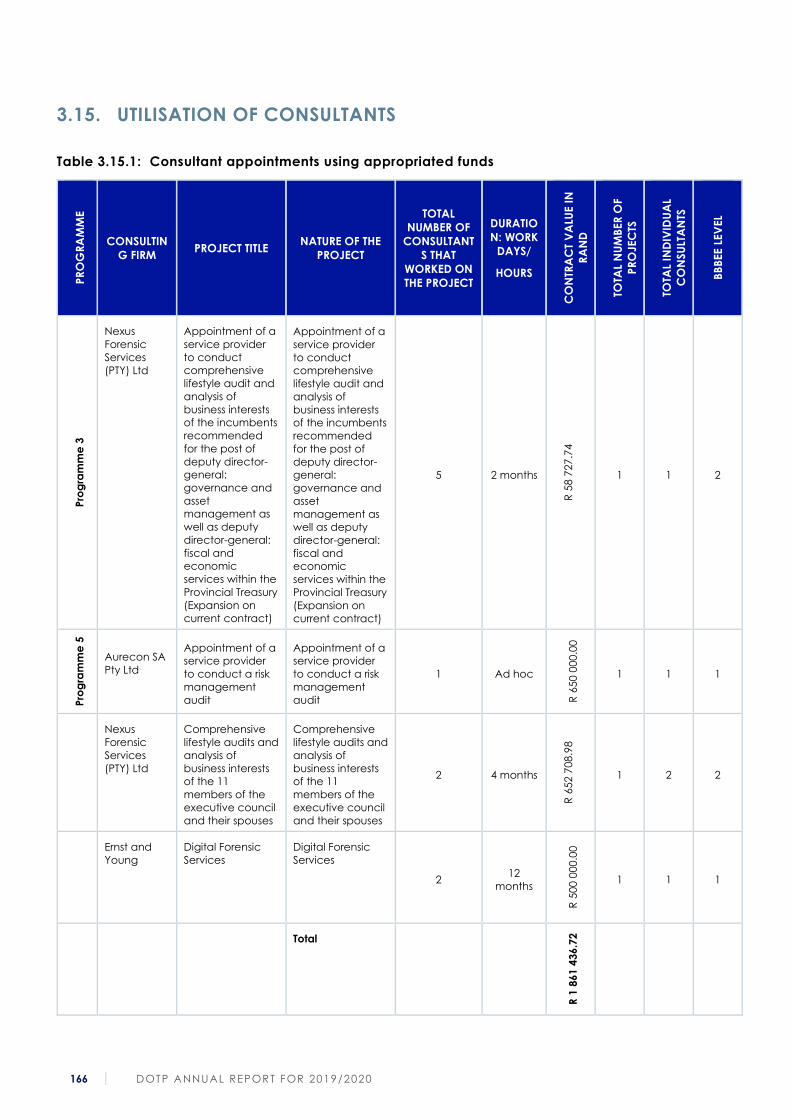
166 DOTP ANNUAL REPORT FOR 2019/2020
3.15. UTILISATION OF CONSULTANTS
Table 3.15.1: Consultant appointments using appropriated funds
PR
OG
RA
MM
E
CONSULTIN
G FIRM PROJECT TITLE
NATURE OF THE
PROJECT
TOTAL
NUMBER OF
CONSULTANT
S THAT
WORKED ON
THE PROJECT
DURATIO
N: WORK
DAYS/
HOURS
CO
NTR
AC
T V
ALU
E I
N
RA
ND
TOTA
L N
UM
BER
OF
PR
OJEC
TS
TOTA
L IN
DIV
IDU
AL
CO
NSU
LTA
NTS
BB
BEE L
EV
EL
Pro
gra
mm
e 3
Nexus
Forensic
Services
(PTY) Ltd
Appointment of a
service provider
to conduct
comprehensive
lifestyle audit and
analysis of
business interests
of the incumbents
recommended
for the post of
deputy director-
general:
governance and
asset
management as
well as deputy
director-general:
fiscal and
economic
services within the
Provincial Treasury
(Expansion on
current contract)
5 2 months
R 5
8 7
27
.74
1 1 2
Pro
gra
mm
e 5
Aurecon SA
Pty Ltd
Appointment of a
service provider
to conduct a risk
management
audit
Appointment of a
service provider
to conduct a risk
management
audit
1 Ad hoc
R 6
50 0
00
.00
1 1 1
Nexus
Forensic
Services
(PTY) Ltd
Comprehensive
lifestyle audits and
analysis of
business interests
of the 11
members of the
executive council
and their spouses
Comprehensive
lifestyle audits and
analysis of
business interests
of the 11
members of the
executive council
and their spouses
2 4 months
R 6
52 7
08
.98
1 2 2
Ernst and
Young
Digital Forensic
Services
Digital Forensic
Services
2 12
months
R 5
00 0
00
.00
1 1 1
Total
R 1
861
436
.72
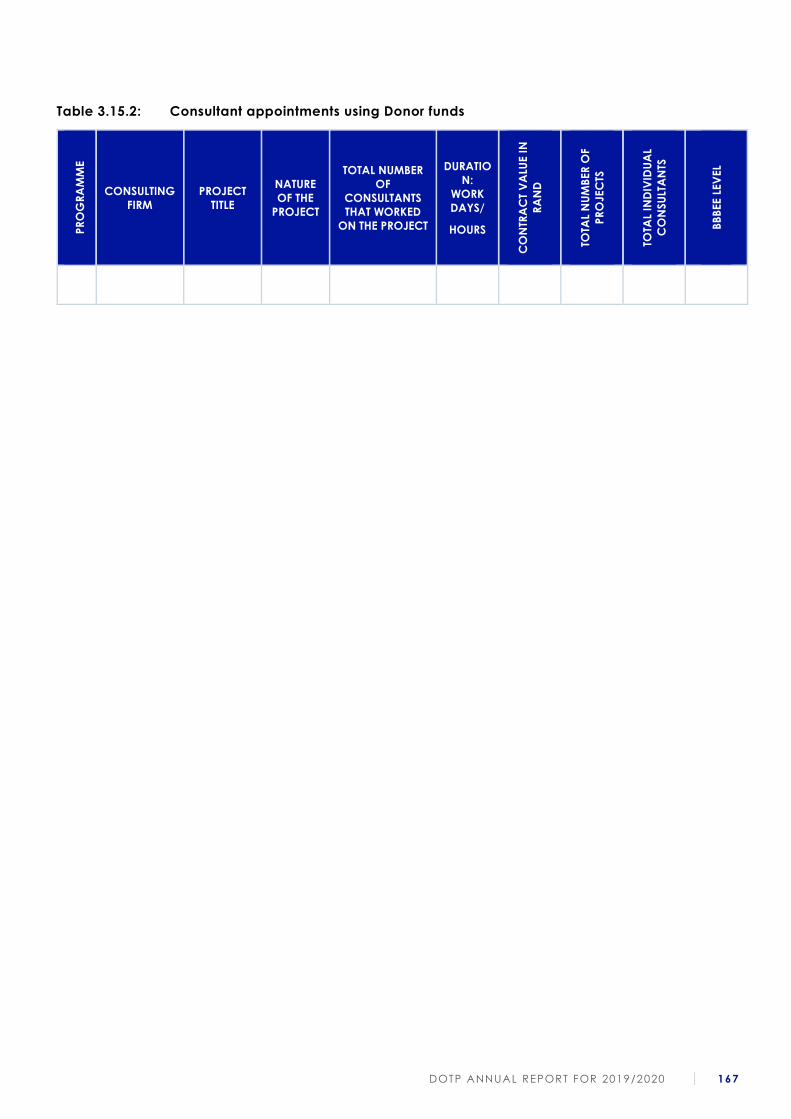
DOTP ANNUAL REPORT FOR 2019/2020 167
Table 3.15.2: Consultant appointments using Donor funds
PR
OG
RA
MM
E
CONSULTING
FIRM
PROJECT
TITLE
NATURE
OF THE
PROJECT
TOTAL NUMBER
OF
CONSULTANTS
THAT WORKED
ON THE PROJECT
DURATIO
N:
WORK
DAYS/
HOURS
CO
NTR
AC
T V
ALU
E I
N
RA
ND
TOTA
L N
UM
BER
OF
PR
OJEC
TS
TOTA
L IN
DIV
IDU
AL
CO
NSU
LTA
NTS
BB
BEE L
EV
EL

168 DOTP ANNUAL REPORT FOR 2019/2020
PART E: FINANCIAL INFORMATION

DOTP ANNUAL REPORT FOR 2019/2020 169
170 DOTP ANNUAL REPORT FOR 2019/2020
4. Table of Contents
1. REPORT OF THE AUDITOR-GENERAL TO WESTERN CAPE PROVINCIAL PARLIAMENT ON
VOTE NO. 1: WESTERN CAPE DEPARTMENT OF THE PREMIER .............................................................. 171
1.1. Report on the audit of the financial statements .................................................................... 171
1.2. Report on the audit of the annual performance report ....................................................... 172
1.3. Report on the audit of compliance with legislation .............................................................. 173
1.4. Other information ....................................................................................................................... 173
1.5. Internal control deficiencies ..................................................................................................... 174
2. ANNEXURE – AUDITOR-GENERAL’S RESPONSIBILITY FOR THE AUDIT .................................................. 175
3. APPROPRIATION STATEMENT ................................................................................................................... 176
4. NOTES TO THE APPROPRIATION STATEMENT ........................................................................................... 205
5. STATEMENT OF THE FINANCIAL PERFORMANCE .................................................................................... 207
6. STATEMENT OF THE FINANCIAL POSITION ............................................................................................... 208
7. STATEMENT OF CHANGES IN NET ASSETS ................................................................................................ 209
8. CASH FLOW STATEMENT ........................................................................................................................... 210
9. NOTES TO THE ANNUAL FINANCIAL STATEMENTS (INCLUDING ACCOUNTING POLICIES) ................. 211
10. ANNEXURES .......................................................................................................................................... 248
DOTP ANNUAL REPORT FOR 2019/2020 171
1. Report of the auditor-general to Western Cape
Provincial Parliament on vote no. 1: Western Cape
Department of the Premier
1.1. Report on the audit of the financial statements
OPINION
1. I have audited the financial statements of the Western Cape Department of the Premier set out on
pages 3 to 76, which comprise the appropriation statement, statement of financial position as at 31
March 2020, statement of financial performance, statement of changes in net assets and cash flow
statement for the year then ended, as well as the notes to the financial statements, including a
summary of significant accounting policies.
2. In my opinion, the financial statements present fairly, in all material respects, the financial position of
the Western Cape Department of the Premier as at 31 March 2020, and its financial performance
and cash flows for the year then ended in accordance with the Modified Cash Standards (MCS)
prescribed by the National Treasury and the requirements of the Public Finance Management Act of
South Africa, 1999 (Act No. 1 of 1999) (PFMA) and the Division of Revenue Act of South Africa, 2019
(Act No. 16 of 2019) (Dora).
BASIS FOR OPINION
3. I conducted my audit in accordance with the International Standards on Auditing (ISAs). My
responsibilities under those standards are further described in the auditor-general’s responsibilities for
the audit of the financial statements section of this auditor’s report.
4. I am independent of the department in accordance with sections 290 and 291 of the Code of ethics
for professional accountants and parts 1 and 3 of the International Code of Ethics for Professional
Accountants (including International Independence Standards) of the International Ethics Standards
Board for Accountants (IESBA codes) as well as the ethical requirements that are relevant to my audit
in South Africa. I have fulfilled my other ethical responsibilities in accordance with these requirements
and the IESBA codes.
5. I believe that the audit evidence I have obtained is sufficient and appropriate to provide a basis for
my opinion.
EMPHASIS OF MATTERS
6. I draw attention to the matters below. My opinion is not modified in respect of these matters.
Uncertainty relating to future outcome of claim against department
7. With reference to note 16.1 to the financial statements, the department is the defendant in a
property damages claim to the value of R184,8 million. The department is defending the claim, as it
believes the summons is materially defective as it fails to disclose a legitimate cause of action on
which to hold the department liable for the damages claimed.
OTHER MATTER
8. I draw attention to the matter below. My opinion is not modified in respect of
this matter.
172 DOTP ANNUAL REPORT FOR 2019/2020
UNAUDITED SUPPLEMENTARY SCHEDULES
9. The supplementary information set out on pages 77 to 90 does not form part of the financial
statements and is presented as additional information. I have not audited these schedules and,
accordingly, I do not express an opinion on them.
RESPONSIBILITIES OF ACCOUNTING OFFICER FOR THE FINANCIAL STATEMENTS
10. The accounting officer is responsible for the preparation and fair presentation of the financial
statements in accordance with the MCS prescribed by the National Treasury and the requirements
of the PFMA and Dora, and for such internal control as the accounting officer determines is necessary
to enable the preparation of financial statements that are free from material misstatement, whether
due to fraud or error.
11. In preparing the financial statements, the accounting officer is responsible for assessing the
department’s ability to continue as a going concern, disclosing, as applicable, matters relating to
going concern and using the going concern basis of accounting unless the appropriate governance
structure either intends to liquidate the department or to cease operations, or has no realistic
alternative but to do so.
AUDITOR-GENERAL’S RESPONSIBILITIES FOR THE AUDIT OF THE FINANC IAL STATEMENTS
12. My objectives are to obtain reasonable assurance about whether the financial statements as a
whole are free from material misstatement, whether due to fraud or error, and to issue an auditor’s
report that includes my opinion. Reasonable assurance is a high level of assurance but is not a
guarantee that an audit conducted in accordance with the ISAs will always detect a material
misstatement when it exists. Misstatements can arise from fraud or error and are considered material
if, individually or in aggregate, they could reasonably be expected to influence the economic
decisions of users taken on the basis of these financial statements.
13. A further description of my responsibilities for the audit of the financial statements is included in the
annexure to this auditor’s report.
1.2. Report on the audit of the annual performance report
INTRODUCTION AND SCOPE
14. In accordance with the Public Audit Act of South Africa 2004 (Act No. 25 of 2004) (PAA) and the
general notice issued in terms thereof, I have a responsibility to report on the usefulness and reliability
of the reported performance information against predetermined objectives for selected
programmes presented in the annual performance report. I performed procedures to identify
material findings but not to gather evidence to express assurance.
15. My procedures address the usefulness and reliability of the reported performance information, which
must be based on the approved performance planning documents of the department. I have not
evaluated the completeness and appropriateness of the performance indicators included in the
planning documents. My procedures do not examine whether the actions taken by the department
enabled service delivery. My procedures also do not extend to any disclosures or assertions relating
to planned performance strategies and information in respect of future periods that may be included
as part of the reported performance information. Accordingly, my findings do not extend to these
matters.
16. I evaluated the usefulness and reliability of the reported performance information in accordance
with the criteria developed from the performance management and reporting framework, as
DOTP ANNUAL REPORT FOR 2019/2020 173
defined in the general notice, for the following selected programme presented in the annual
performance report of the department for the year ended 31 March 2020:
Programme Pages in the Annual Performance Report
Programme 4 – centre for e-innovation 102 - 106
17. I performed procedures to determine whether the reported performance information was properly
presented and whether performance was consistent with the approved performance planning
documents. I performed further procedures to determine whether the indicators and related targets
were measurable and relevant, and assessed the reliability of the reported performance information
to determine whether it was valid, accurate and complete.
18. I did not identify any material findings on the usefulness and reliability of the reported performance
information for programme 4 – centre for e-innovation.
OTHER MATTER
19. I draw attention to the matter below.
Achievement of planned targets
20. Refer to the annual performance report on pages 102 to 106 for information on the achievement of
planned targets for the year and explanations provided for the overachievement of a number of
targets.
1.3. Report on the audit of compliance with legislation
INTRODUCTION AND SCOPE
21. In accordance with the PAA and the general notice issued in terms thereof, I have a responsibility to
report material findings on the department’s compliance with specific matters in key legislation. I
performed procedures to identify findings but not to gather evidence to express assurance.
22. I did not identify any material findings on compliance with the specific matters in key legislation set
out in the general notice issued in terms of the PAA.
1.4. Other information
23. The accounting officer is responsible for the other information. The other information comprises the
information included in the annual report. The other information does not include the financial
statements, the auditor’s report and the selected programme presented in the annual performance
report that have been specifically reported in this auditor’s report.
24. My opinion on the financial statements and findings on the reported performance information and
compliance with legislation do not cover the other information and I do not express an audit opinion
or any form of assurance conclusion thereon.
25. In connection with my audit, my responsibility is to read the other information and, in doing so,
consider whether the other information is materially inconsistent with the financial statements and
the selected programme presented in the annual performance report, or my knowledge obtained
in the audit, or otherwise appears to be materially misstated.
26. If, based on the work I have performed, I conclude that there is a material misstatement in this other
information, I am required to report that fact.

174 DOTP ANNUAL REPORT FOR 2019/2020
27. I have nothing to report in this regard.
1.5. Internal control deficiencies
28. I considered internal control relevant to my audit of the financial statements, reported performance
information and compliance with applicable legislation; however, my objective was not to express
any form of assurance on it. I did not identify any significant deficiencies in internal control.
Cape Town
30 September 2020

DOTP ANNUAL REPORT FOR 2019/2020 175
2. Annexure – Auditor-General’s responsibility for
the audit
1. As part of an audit in accordance with the ISAs, I exercise professional judgement and maintain
professional scepticism throughout my audit of the financial statements and the procedures
performed on reported performance information for the selected programme and on the
department’s compliance with respect to the selected subject matters.
FINANCIAL STATEMENTS
2. In addition to my responsibility for the audit of the financial statements as described in this auditor’s
report, I also:
o identify and assess the risks of material misstatement of the financial statements, whether due
to fraud or error; design and perform audit procedures responsive to those risks; and obtain
audit evidence that is sufficient and appropriate to provide a basis for my opinion. The risk of
not detecting a material misstatement resulting from fraud is higher than for one resulting from
error, as fraud may involve collusion, forgery, intentional omissions, misrepresentations or the
override of internal control
o obtain an understanding of internal control relevant to the audit in order to design audit
procedures that are appropriate in the circumstances, but not for the purpose of expressing
an opinion on the effectiveness of the department’s internal control
o evaluate the appropriateness of accounting policies used and the reasonableness of
accounting estimates and related disclosures made by the accounting officer.
o conclude on the appropriateness of the accounting officer’s use of the going concern basis
of accounting in the preparation of the financial statements. I also conclude, based on the
audit evidence obtained, whether a material uncertainty exists relating to events or conditions
that may cast significant doubt on the ability of the Western Cape Department of the Premier
to continue as a going concern. If I conclude that a material uncertainty exists, I am required
to draw attention in my auditor’s report to the related disclosures in the financial statements
about the material uncertainty or, if such disclosures are inadequate, to modify my opinion on
the financial statements. My conclusions are based on the information available to me at the
date of this auditor’s report. However, future events or conditions may cause a department to
cease operating as a going concern
o evaluate the overall presentation, structure and content of the financial statements, including
the disclosures, and determine whether the financial statements represent the underlying
transactions and events in a manner that achieves fair presentation
COMMUNICATION WITH THOSE CHARGED WITH GOVERNANCE
3. I communicate with the accounting officer regarding, among other matters, the planned scope and
timing of the audit and significant audit findings, including any significant deficiencies in internal
control that I identify during my audit.
4. I also confirm to the accounting officer that I have complied with relevant ethical requirements
regarding independence, and communicate all relationships and other matters that may
reasonably be thought to have a bearing on my independence and, where applicable, actions
taken to eliminate threats or safeguards applied.
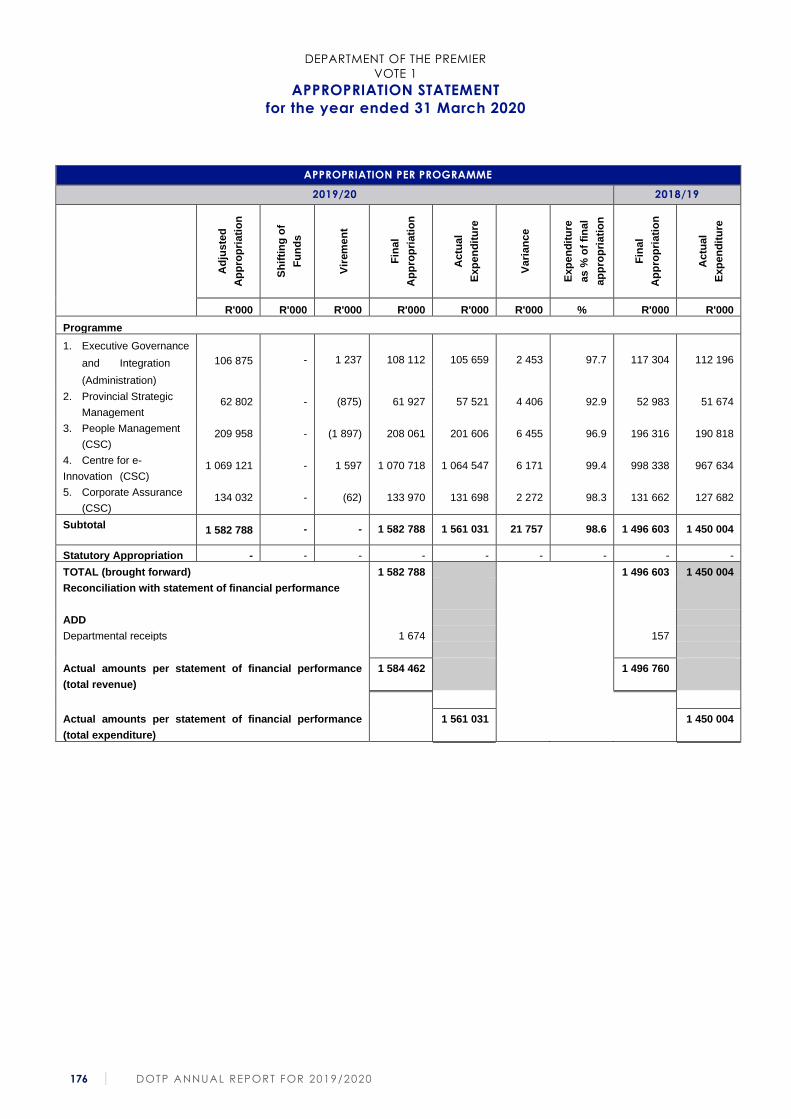
DEPARTMENT OF THE PREMIER
VOTE 1
APPROPRIATION STATEMENT
for the year ended 31 March 2020
176 DOTP ANNUAL REPORT FOR 2019/2020
APPROPRIATION PER PROGRAMME
2019/20 2018/19
Ad
jus
ted
Ap
pro
pri
ati
on
Sh
ifti
ng
of
Fu
nd
s
Vir
em
en
t
Fin
al
Ap
pro
pri
ati
on
Actu
al
Exp
en
dit
ure
Vari
an
ce
Exp
en
dit
ure
as %
of
fin
al
ap
pro
pri
ati
on
Fin
al
Ap
pro
pri
ati
on
Actu
al
Exp
en
dit
ure
R'000 R'000 R'000 R'000 R'000 R'000 % R'000 R'000
Programme
1. Executive Governance
and Integration
(Administration)
106 875 - 1 237 108 112 105 659 2 453 97.7 117 304 112 196
2. Provincial Strategic
Management 62 802 - (875) 61 927 57 521 4 406 92.9 52 983 51 674
3. People Management
(CSC) 209 958 - (1 897) 208 061 201 606 6 455 96.9 196 316 190 818
4. Centre for e-
Innovation (CSC) 1 069 121 - 1 597 1 070 718 1 064 547 6 171 99.4 998 338 967 634
5. Corporate Assurance
(CSC) 134 032 - (62) 133 970 131 698 2 272 98.3 131 662 127 682
Subtotal 1 582 788 - - 1 582 788 1 561 031 21 757 98.6 1 496 603 1 450 004
Statutory Appropriation - - - - - - - - -
TOTAL (brought forward) 1 582 788 1 496 603 1 450 004
Reconciliation with statement of financial performance
ADD
Departmental receipts 1 674 157
Actual amounts per statement of financial performance
(total revenue)
1 584 462 1 496 760
Actual amounts per statement of financial performance
(total expenditure)
1 561 031 1 450 004
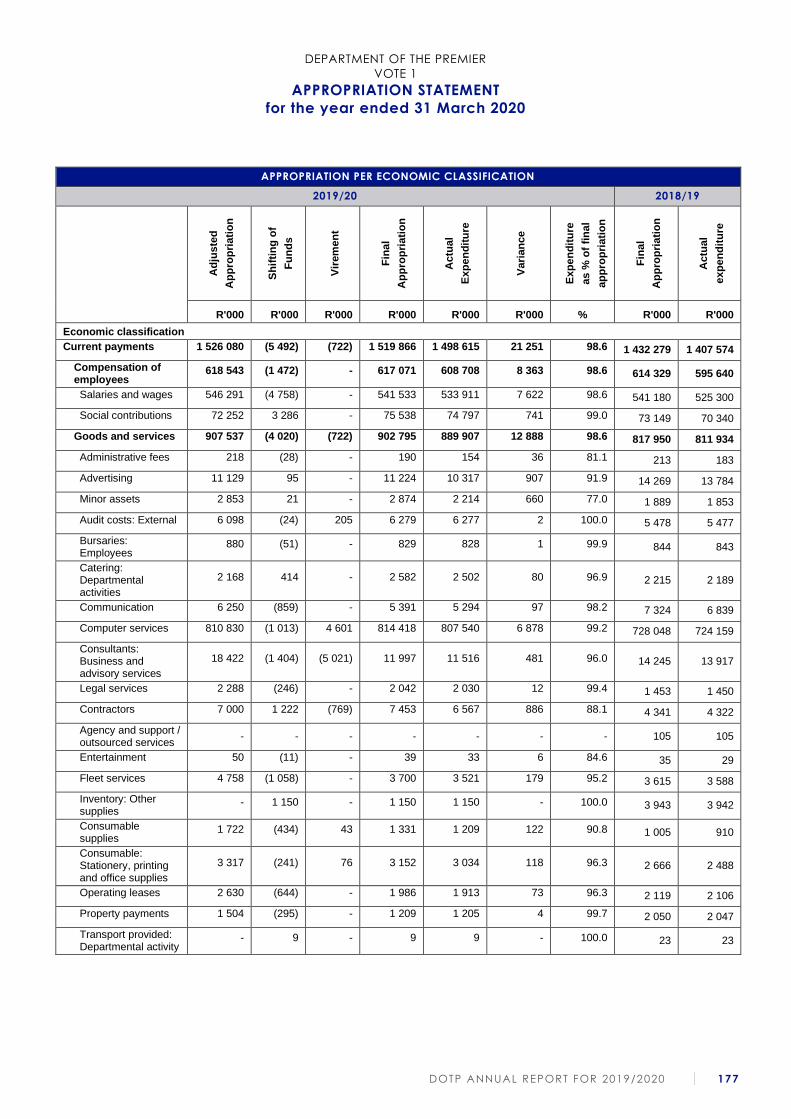
DEPARTMENT OF THE PREMIER
VOTE 1
APPROPRIATION STATEMENT
for the year ended 31 March 2020
DOTP ANNUAL REPORT FOR 2019/2020 177
APPROPRIATION PER ECONOMIC CLASSIFICATION
2019/20 2018/19
Ad
jus
ted
Ap
pro
pri
ati
on
Sh
ifti
ng
of
Fu
nd
s
Vir
em
en
t
Fin
al
Ap
pro
pri
ati
on
Actu
al
Exp
en
dit
ure
Vari
an
ce
Exp
en
dit
ure
as %
of
fin
al
ap
pro
pri
ati
on
Fin
al
Ap
pro
pri
ati
on
Actu
al
exp
en
dit
ure
R'000 R'000 R'000 R'000 R'000 R'000 % R'000 R'000
Economic classification
Current payments 1 526 080 (5 492) (722) 1 519 866 1 498 615 21 251 98.6 1 432 279 1 407 574
Compensation of employees
618 543 (1 472) - 617 071 608 708 8 363 98.6 614 329 595 640
Salaries and wages 546 291 (4 758) - 541 533 533 911 7 622 98.6 541 180 525 300
Social contributions 72 252 3 286 - 75 538 74 797 741 99.0 73 149 70 340
Goods and services 907 537 (4 020) (722) 902 795 889 907 12 888 98.6 817 950 811 934
Administrative fees 218 (28) - 190 154 36 81.1 213 183
Advertising 11 129 95 - 11 224 10 317 907 91.9 14 269 13 784
Minor assets 2 853 21 - 2 874 2 214 660 77.0 1 889 1 853
Audit costs: External 6 098 (24) 205 6 279 6 277 2 100.0 5 478 5 477
Bursaries: Employees
880 (51) - 829 828 1 99.9 844 843
Catering: Departmental activities
2 168 414 - 2 582 2 502 80 96.9 2 215 2 189
Communication 6 250 (859) - 5 391 5 294 97 98.2 7 324 6 839
Computer services 810 830 (1 013) 4 601 814 418 807 540 6 878 99.2 728 048 724 159
Consultants: Business and advisory services
18 422 (1 404) (5 021) 11 997 11 516 481 96.0 14 245 13 917
Legal services 2 288 (246) - 2 042 2 030 12 99.4 1 453 1 450
Contractors 7 000 1 222 (769) 7 453 6 567 886 88.1 4 341 4 322
Agency and support / outsourced services
- - - - - - - 105 105
Entertainment 50 (11) - 39 33 6 84.6 35 29
Fleet services 4 758 (1 058) - 3 700 3 521 179 95.2 3 615 3 588
Inventory: Other supplies
- 1 150 - 1 150 1 150 - 100.0 3 943 3 942
Consumable supplies
1 722 (434) 43 1 331 1 209 122 90.8 1 005 910
Consumable: Stationery, printing and office supplies
3 317 (241) 76 3 152 3 034 118 96.3 2 666 2 488
Operating leases 2 630 (644) - 1 986 1 913 73 96.3 2 119 2 106
Property payments 1 504 (295) - 1 209 1 205 4 99.7 2 050 2 047
Transport provided: Departmental activity
- 9 - 9 9 - 100.0 23 23
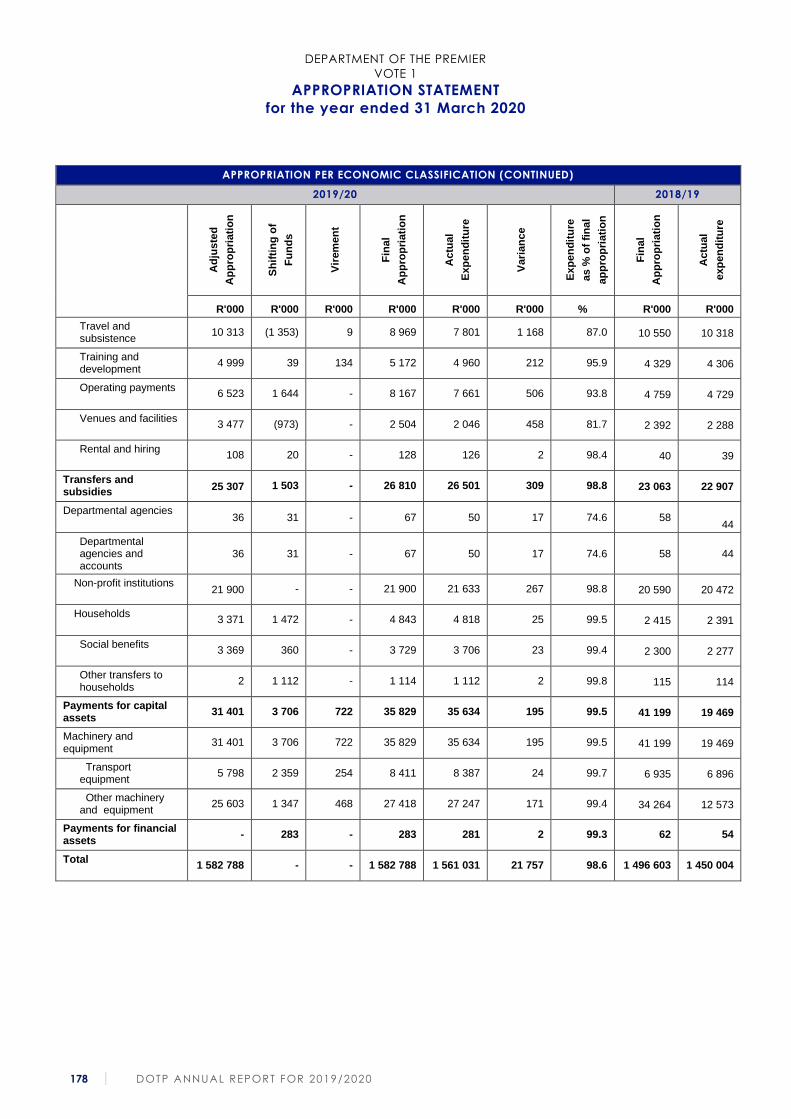
DEPARTMENT OF THE PREMIER
VOTE 1
APPROPRIATION STATEMENT
for the year ended 31 March 2020
178 DOTP ANNUAL REPORT FOR 2019/2020
APPROPRIATION PER ECONOMIC CLASSIFICATION (CONTINUED)
2019/20 2018/19
Ad
jus
ted
Ap
pro
pri
ati
on
Sh
ifti
ng
of
Fu
nd
s
Vir
em
en
t
Fin
al
Ap
pro
pri
ati
on
Actu
al
Exp
en
dit
ure
Vari
an
ce
Exp
en
dit
ure
as %
of
fin
al
ap
pro
pri
ati
on
Fin
al
Ap
pro
pri
ati
on
Actu
al
exp
en
dit
ure
R'000 R'000 R'000 R'000 R'000 R'000 % R'000 R'000
Travel and subsistence
10 313 (1 353) 9 8 969 7 801 1 168 87.0 10 550 10 318
Training and development
4 999 39 134 5 172 4 960 212 95.9 4 329 4 306
Operating payments 6 523 1 644 - 8 167 7 661 506 93.8 4 759 4 729
Venues and facilities 3 477 (973) - 2 504 2 046 458 81.7 2 392 2 288
Rental and hiring 108 20 - 128 126 2 98.4 40 39
Transfers and subsidies
25 307 1 503 - 26 810 26 501 309 98.8 23 063 22 907
Departmental agencies 36 31 - 67 50 17 74.6 58
44
Departmental agencies and accounts
36 31 - 67 50 17 74.6 58 44
Non-profit institutions 21 900 - - 21 900 21 633 267 98.8 20 590 20 472
Households 3 371 1 472 - 4 843 4 818 25 99.5 2 415 2 391
Social benefits 3 369 360 - 3 729 3 706 23 99.4 2 300 2 277
Other transfers to households
2 1 112 - 1 114 1 112 2 99.8 115 114
Payments for capital assets
31 401 3 706 722 35 829 35 634 195 99.5 41 199 19 469
Machinery and equipment
31 401 3 706 722 35 829 35 634 195 99.5 41 199 19 469
Transport equipment
5 798 2 359 254 8 411 8 387 24 99.7 6 935 6 896
Other machinery and equipment
25 603 1 347 468 27 418 27 247 171 99.4 34 264 12 573
Payments for financial assets
- 283 - 283 281 2 99.3 62 54
Total 1 582 788 - - 1 582 788 1 561 031 21 757 98.6 1 496 603 1 450 004
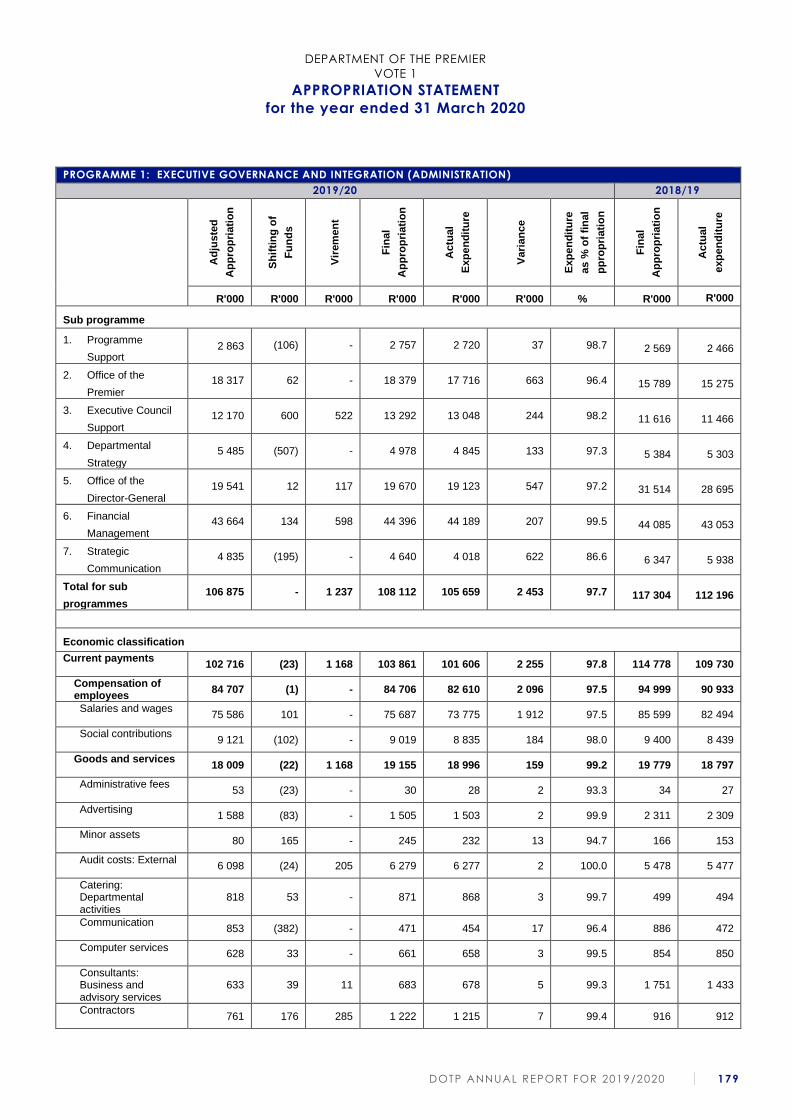
DEPARTMENT OF THE PREMIER
VOTE 1
APPROPRIATION STATEMENT
for the year ended 31 March 2020
DOTP ANNUAL REPORT FOR 2019/2020 179
PROGRAMME 1: EXECUTIVE GOVERNANCE AND INTEGRATION (ADMINISTRATION)
2019/20 2018/19
Ad
jus
ted
Ap
pro
pri
ati
on
Sh
ifti
ng
of
Fu
nd
s
Vir
em
en
t
Fin
al
Ap
pro
pri
ati
on
Actu
al
Exp
en
dit
ure
Vari
an
ce
Exp
en
dit
ure
as %
of
fin
al
pp
rop
riati
on
Fin
al
Ap
pro
pri
ati
on
Actu
al
exp
en
dit
ure
R'000 R'000 R'000 R'000 R'000 R'000 % R'000 R'000
Sub programme
1. Programme
Support 2 863 (106) - 2 757 2 720 37 98.7 2 569 2 466
2. Office of the
Premier 18 317 62 - 18 379 17 716 663 96.4 15 789 15 275
3. Executive Council
Support 12 170 600 522 13 292 13 048 244 98.2 11 616 11 466
4. Departmental
Strategy 5 485 (507) - 4 978 4 845 133 97.3 5 384 5 303
5. Office of the
Director-General 19 541 12 117 19 670 19 123 547 97.2 31 514 28 695
6. Financial
Management 43 664 134 598 44 396 44 189 207 99.5 44 085 43 053
7. Strategic
Communication 4 835 (195) - 4 640 4 018 622 86.6 6 347 5 938
Total for sub
programmes 106 875 - 1 237 108 112 105 659 2 453 97.7 117 304 112 196
Economic classification
Current payments 102 716 (23) 1 168 103 861 101 606 2 255 97.8 114 778 109 730
Compensation of employees
84 707 (1) - 84 706 82 610 2 096 97.5 94 999 90 933
Salaries and wages 75 586 101 - 75 687 73 775 1 912 97.5 85 599 82 494
Social contributions 9 121 (102) - 9 019 8 835 184 98.0 9 400 8 439
Goods and services 18 009 (22) 1 168 19 155 18 996 159 99.2 19 779 18 797
Administrative fees 53 (23) - 30 28 2 93.3 34 27
Advertising 1 588 (83) - 1 505 1 503 2 99.9 2 311 2 309
Minor assets 80 165 - 245 232 13 94.7 166 153
Audit costs: External 6 098 (24) 205 6 279 6 277 2 100.0 5 478 5 477
Catering: Departmental activities
818 53 - 871 868 3 99.7 499 494
Communication 853 (382) - 471 454 17 96.4 886 472
Computer services 628 33 - 661 658 3 99.5 854 850
Consultants: Business and advisory services
633 39 11 683 678 5 99.3 1 751 1 433
Contractors 761 176 285 1 222 1 215 7 99.4 916 912
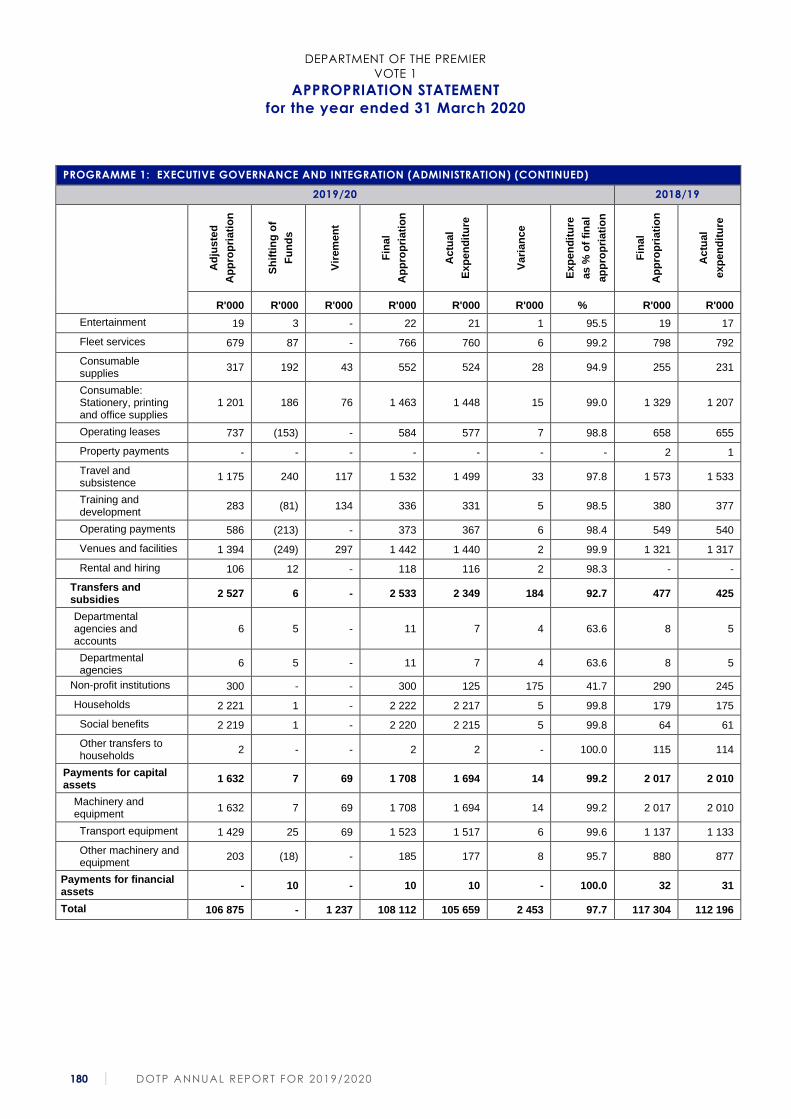
DEPARTMENT OF THE PREMIER
VOTE 1
APPROPRIATION STATEMENT
for the year ended 31 March 2020
180 DOTP ANNUAL REPORT FOR 2019/2020
PROGRAMME 1: EXECUTIVE GOVERNANCE AND INTEGRATION (ADMINISTRATION) (CONTINUED)
2019/20 2018/19
Ad
jus
ted
Ap
pro
pri
ati
on
Sh
ifti
ng
of
Fu
nd
s
Vir
em
en
t
Fin
al
Ap
pro
pri
ati
on
Actu
al
Exp
en
dit
ure
Vari
an
ce
Exp
en
dit
ure
as %
of
fin
al
ap
pro
pri
ati
on
Fin
al
Ap
pro
pri
ati
on
Actu
al
exp
en
dit
ure
R'000 R'000 R'000 R'000 R'000 R'000 % R'000 R'000
Entertainment 19 3 - 22 21 1 95.5 19 17
Fleet services 679 87 - 766 760 6 99.2 798 792
Consumable supplies
317 192 43 552 524 28 94.9 255 231
Consumable: Stationery, printing and office supplies
1 201 186 76 1 463 1 448 15 99.0 1 329 1 207
Operating leases 737 (153) - 584 577 7 98.8 658 655
Property payments - - - - - - - 2 1
Travel and subsistence
1 175 240 117 1 532 1 499 33 97.8 1 573 1 533
Training and development
283 (81) 134 336 331 5 98.5 380 377
Operating payments 586 (213) - 373 367 6 98.4 549 540
Venues and facilities 1 394 (249) 297 1 442 1 440 2 99.9 1 321 1 317
Rental and hiring 106 12 - 118 116 2 98.3 - -
Transfers and subsidies
2 527 6 - 2 533 2 349 184 92.7 477 425
Departmental agencies and accounts
6 5 - 11 7 4 63.6 8 5
Departmental agencies
6 5 - 11 7 4 63.6 8 5
Non-profit institutions 300 - - 300 125 175 41.7 290 245
Households 2 221 1 - 2 222 2 217 5 99.8 179 175
Social benefits 2 219 1 - 2 220 2 215 5 99.8 64 61
Other transfers to households
2 - - 2 2 - 100.0 115 114
Payments for capital assets
1 632 7 69 1 708 1 694 14 99.2 2 017 2 010
Machinery and equipment
1 632 7 69 1 708 1 694 14 99.2 2 017 2 010
Transport equipment 1 429 25 69 1 523 1 517 6 99.6 1 137 1 133
Other machinery and equipment
203 (18) - 185 177 8 95.7 880 877
Payments for financial assets
- 10 - 10 10 - 100.0 32 31
Total 106 875 - 1 237 108 112 105 659 2 453 97.7 117 304 112 196
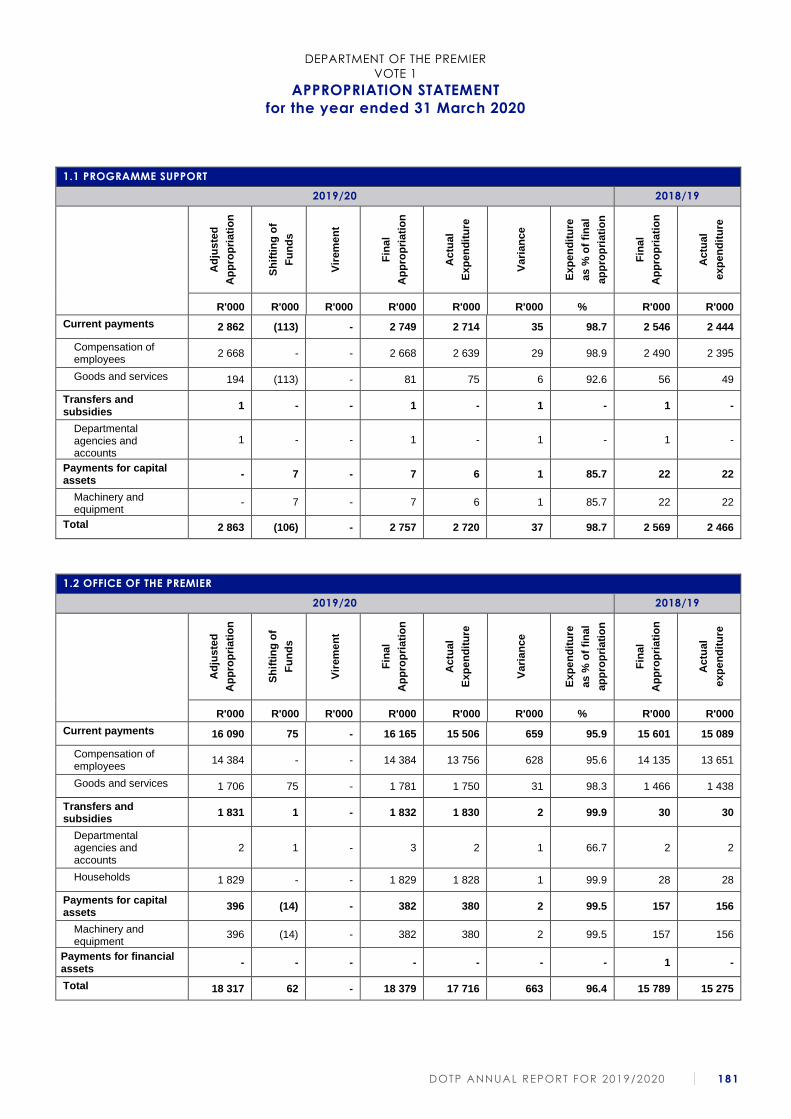
DEPARTMENT OF THE PREMIER
VOTE 1
APPROPRIATION STATEMENT
for the year ended 31 March 2020
DOTP ANNUAL REPORT FOR 2019/2020 181
1.1 PROGRAMME SUPPORT
2019/20 2018/19
Ad
jus
ted
Ap
pro
pri
ati
on
Sh
ifti
ng
of
Fu
nd
s
Vir
em
en
t
Fin
al
Ap
pro
pri
ati
on
Actu
al
Exp
en
dit
ure
Vari
an
ce
Exp
en
dit
ure
as %
of
fin
al
ap
pro
pri
ati
on
Fin
al
Ap
pro
pri
ati
on
Actu
al
exp
en
dit
ure
R'000 R'000 R'000 R'000 R'000 R'000 % R'000 R'000
Current payments 2 862 (113) - 2 749 2 714 35 98.7 2 546 2 444
Compensation of employees
2 668 - - 2 668 2 639 29 98.9 2 490 2 395
Goods and services 194 (113) - 81 75 6 92.6 56 49
Transfers and subsidies
1 - - 1 - 1 - 1 -
Departmental agencies and accounts
1 - - 1 - 1 - 1 -
Payments for capital assets
- 7 - 7 6 1 85.7 22 22
Machinery and equipment
- 7 - 7 6 1 85.7 22 22
Total 2 863 (106) - 2 757 2 720 37 98.7 2 569 2 466
1.2 OFFICE OF THE PREMIER
2019/20 2018/19
Ad
jus
ted
Ap
pro
pri
ati
on
Sh
ifti
ng
of
Fu
nd
s
Vir
em
en
t
Fin
al
Ap
pro
pri
ati
on
Actu
al
Exp
en
dit
ure
Vari
an
ce
Exp
en
dit
ure
as %
of
fin
al
ap
pro
pri
ati
on
Fin
al
Ap
pro
pri
ati
on
Actu
al
exp
en
dit
ure
R'000 R'000 R'000 R'000 R'000 R'000 % R'000 R'000
Current payments 16 090 75 - 16 165 15 506 659 95.9 15 601 15 089
Compensation of employees
14 384 - - 14 384 13 756 628 95.6 14 135 13 651
Goods and services 1 706 75 - 1 781 1 750 31 98.3 1 466 1 438
Transfers and subsidies
1 831 1 - 1 832 1 830 2 99.9 30 30
Departmental agencies and accounts
2 1 - 3 2 1 66.7 2 2
Households 1 829 - - 1 829 1 828 1 99.9 28 28
Payments for capital assets
396 (14) - 382 380 2 99.5 157 156
Machinery and equipment
396 (14) - 382 380 2 99.5 157 156
Payments for financial assets
- - - - - - - 1 -
Total 18 317 62 - 18 379 17 716 663 96.4 15 789 15 275
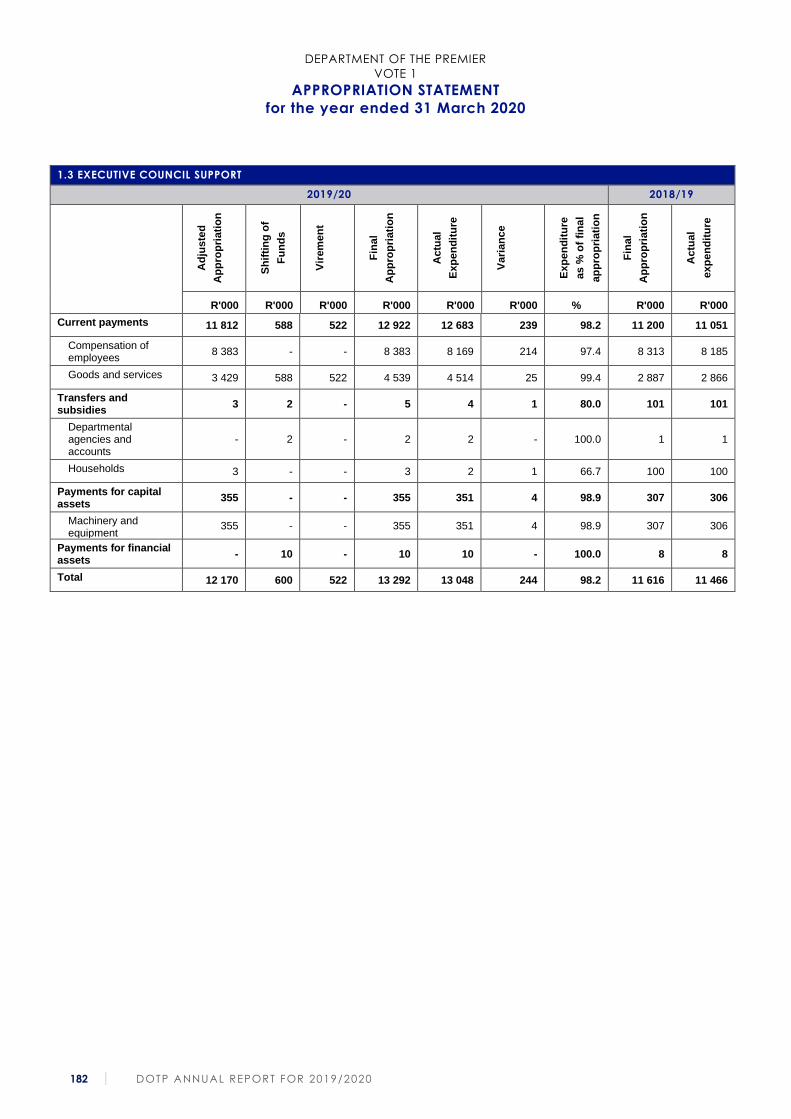
DEPARTMENT OF THE PREMIER
VOTE 1
APPROPRIATION STATEMENT
for the year ended 31 March 2020
182 DOTP ANNUAL REPORT FOR 2019/2020
1.3 EXECUTIVE COUNCIL SUPPORT
2019/20 2018/19
Ad
jus
ted
Ap
pro
pri
ati
on
Sh
ifti
ng
of
Fu
nd
s
Vir
em
en
t
Fin
al
Ap
pro
pri
ati
on
Actu
al
Exp
en
dit
ure
Vari
an
ce
Exp
en
dit
ure
as %
of
fin
al
ap
pro
pri
ati
on
Fin
al
Ap
pro
pri
ati
on
Actu
al
exp
en
dit
ure
R'000 R'000 R'000 R'000 R'000 R'000 % R'000 R'000
Current payments 11 812 588 522 12 922 12 683 239 98.2 11 200 11 051
Compensation of employees
8 383 - - 8 383 8 169 214 97.4 8 313 8 185
Goods and services 3 429 588 522 4 539 4 514 25 99.4 2 887 2 866
Transfers and subsidies
3 2 - 5 4 1 80.0 101 101
Departmental agencies and accounts
- 2 - 2 2 - 100.0 1 1
Households 3 - - 3 2 1 66.7 100 100
Payments for capital assets
355 - - 355 351 4 98.9 307 306
Machinery and equipment
355 - - 355 351 4 98.9 307 306
Payments for financial assets
- 10 - 10 10 - 100.0 8 8
Total 12 170 600 522 13 292 13 048 244 98.2 11 616 11 466
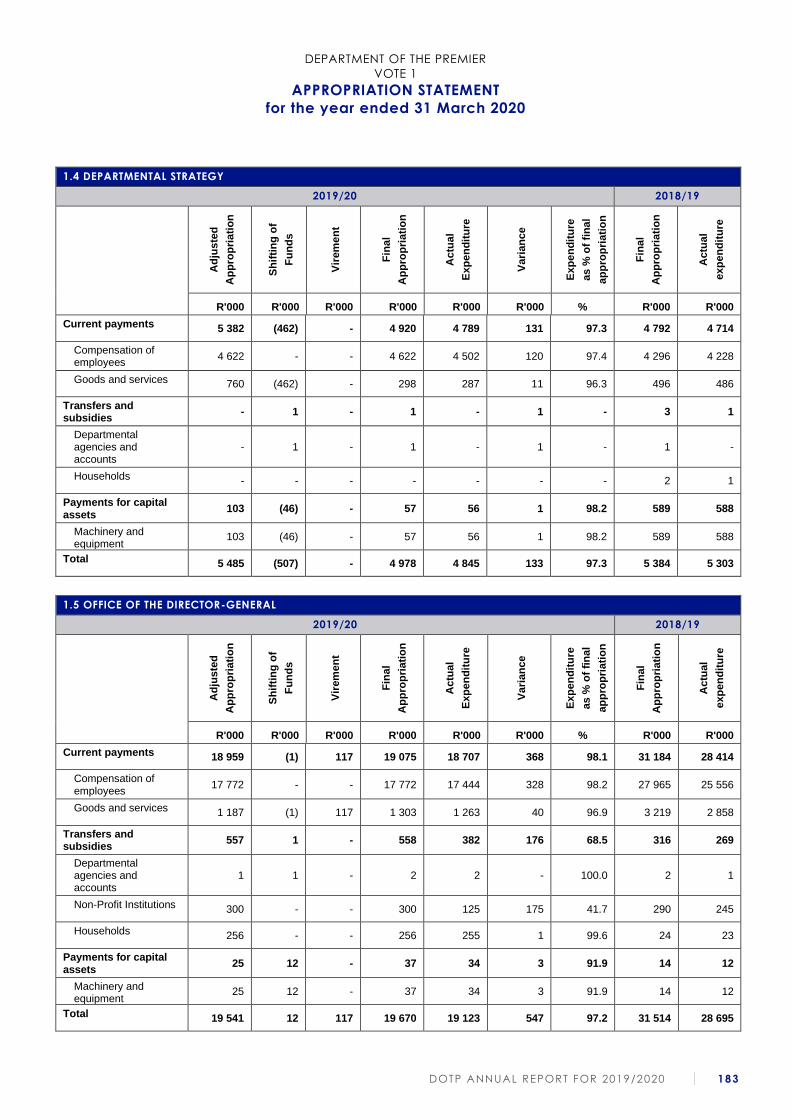
DEPARTMENT OF THE PREMIER
VOTE 1
APPROPRIATION STATEMENT
for the year ended 31 March 2020
DOTP ANNUAL REPORT FOR 2019/2020 183
1.4 DEPARTMENTAL STRATEGY
2019/20 2018/19
Ad
juste
d
Ap
pro
pri
ati
on
Sh
ifti
ng
of
Fu
nd
s
Vir
em
en
t
Fin
al
Ap
pro
pri
ati
on
Actu
al
Exp
en
dit
ure
Vari
an
ce
Exp
en
dit
ure
as %
of
fin
al
ap
pro
pri
ati
on
Fin
al
Ap
pro
pri
ati
on
Actu
al
exp
en
dit
ure
R'000 R'000 R'000 R'000 R'000 R'000 % R'000 R'000
Current payments 5 382 (462) - 4 920 4 789 131 97.3 4 792 4 714
Compensation of employees
4 622 - - 4 622 4 502 120 97.4 4 296 4 228
Goods and services 760 (462) - 298 287 11 96.3 496 486
Transfers and subsidies
- 1 - 1 - 1 - 3 1
Departmental agencies and accounts
- 1 - 1 - 1 - 1 -
Households - - - - - - - 2 1
Payments for capital assets
103 (46) - 57 56 1 98.2 589 588
Machinery and equipment
103 (46) - 57 56 1 98.2 589 588
Total 5 485 (507) - 4 978 4 845 133 97.3 5 384 5 303
1.5 OFFICE OF THE DIRECTOR-GENERAL
2019/20 2018/19
Ad
jus
ted
Ap
pro
pri
ati
on
Sh
ifti
ng
of
Fu
nd
s
Vir
em
en
t
Fin
al
Ap
pro
pri
ati
on
Actu
al
Exp
en
dit
ure
Vari
an
ce
Exp
en
dit
ure
as %
of
fin
al
ap
pro
pri
ati
on
Fin
al
Ap
pro
pri
ati
on
Actu
al
exp
en
dit
ure
R'000 R'000 R'000 R'000 R'000 R'000 % R'000 R'000
Current payments 18 959 (1) 117 19 075 18 707 368 98.1 31 184 28 414
Compensation of employees
17 772 - - 17 772 17 444 328 98.2 27 965 25 556
Goods and services 1 187 (1) 117 1 303 1 263 40 96.9 3 219 2 858
Transfers and subsidies
557 1 - 558 382 176 68.5 316 269
Departmental agencies and accounts
1 1 - 2 2 - 100.0 2 1
Non-Profit Institutions 300 - - 300 125 175 41.7 290 245
Households 256 - - 256 255 1 99.6 24 23
Payments for capital assets
25 12 - 37 34 3 91.9 14 12
Machinery and equipment
25 12 - 37 34 3 91.9 14 12
Total 19 541 12 117 19 670 19 123 547 97.2 31 514 28 695
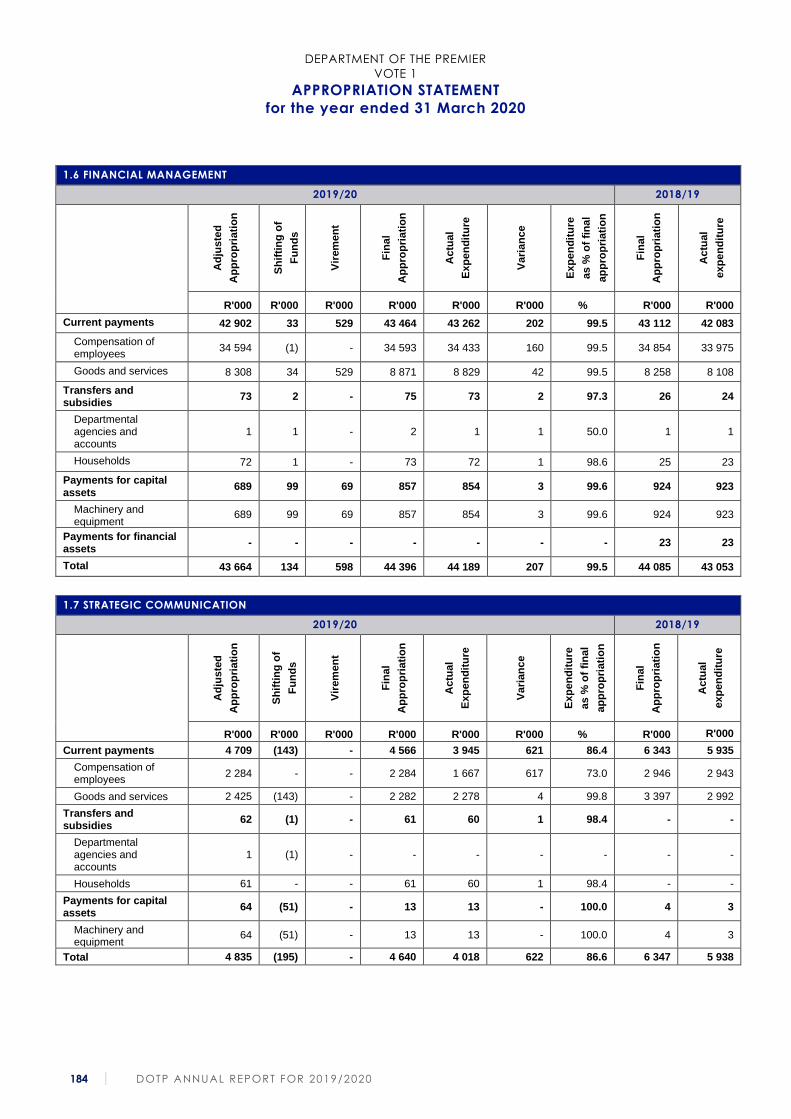
DEPARTMENT OF THE PREMIER
VOTE 1
APPROPRIATION STATEMENT
for the year ended 31 March 2020
184 DOTP ANNUAL REPORT FOR 2019/2020
1.6 FINANCIAL MANAGEMENT
2019/20 2018/19
Ad
jus
ted
Ap
pro
pri
ati
on
Sh
ifti
ng
of
Fu
nd
s
Vir
em
en
t
Fin
al
Ap
pro
pri
ati
on
Actu
al
Exp
en
dit
ure
Vari
an
ce
Exp
en
dit
ure
as %
of
fin
al
ap
pro
pri
ati
on
Fin
al
Ap
pro
pri
ati
on
Actu
al
exp
en
dit
ure
R'000 R'000 R'000 R'000 R'000 R'000 % R'000 R'000
Current payments 42 902 33 529 43 464 43 262 202 99.5 43 112 42 083
Compensation of employees
34 594 (1) - 34 593 34 433 160 99.5 34 854 33 975
Goods and services 8 308 34 529 8 871 8 829 42 99.5 8 258 8 108
Transfers and subsidies
73 2 - 75 73 2 97.3 26 24
Departmental agencies and accounts
1 1 - 2 1 1 50.0 1 1
Households 72 1 - 73 72 1 98.6 25 23
Payments for capital assets
689 99 69 857 854 3 99.6 924 923
Machinery and equipment
689 99 69 857 854 3 99.6 924 923
Payments for financial assets
- - - - - - - 23 23
Total 43 664 134 598 44 396 44 189 207 99.5 44 085 43 053
1.7 STRATEGIC COMMUNICATION
2019/20 2018/19
Ad
jus
ted
Ap
pro
pri
ati
on
Sh
ifti
ng
of
Fu
nd
s
Vir
em
en
t
Fin
al
Ap
pro
pri
ati
on
Actu
al
Exp
en
dit
ure
Vari
an
ce
Exp
en
dit
ure
as %
of
fin
al
ap
pro
pri
ati
on
Fin
al
Ap
pro
pri
ati
on
Actu
al
exp
en
dit
ure
R'000 R'000 R'000 R'000 R'000 R'000 % R'000 R'000
Current payments 4 709 (143) - 4 566 3 945 621 86.4 6 343 5 935
Compensation of employees
2 284 - - 2 284 1 667 617 73.0 2 946 2 943
Goods and services 2 425 (143) - 2 282 2 278 4 99.8 3 397 2 992
Transfers and subsidies
62 (1) - 61 60 1 98.4 - -
Departmental agencies and accounts
1 (1) - - - - - - -
Households 61 - - 61 60 1 98.4 - -
Payments for capital assets
64 (51) - 13 13 - 100.0 4 3
Machinery and equipment
64 (51) - 13 13 - 100.0 4 3
Total 4 835 (195) - 4 640 4 018 622 86.6 6 347 5 938
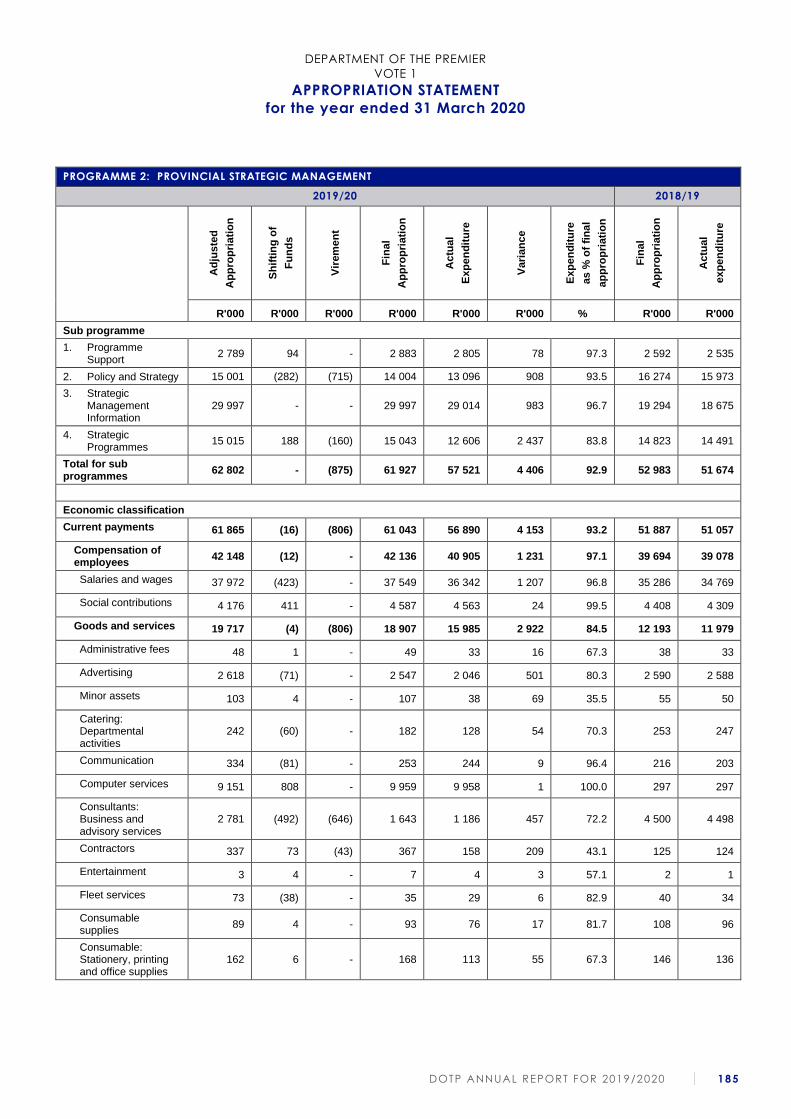
DEPARTMENT OF THE PREMIER
VOTE 1
APPROPRIATION STATEMENT
for the year ended 31 March 2020
DOTP ANNUAL REPORT FOR 2019/2020 185
PROGRAMME 2: PROVINCIAL STRATEGIC MANAGEMENT
2019/20 2018/19
Ad
jus
ted
Ap
pro
pri
ati
on
Sh
ifti
ng
of
Fu
nd
s
Vir
em
en
t
Fin
al
Ap
pro
pri
ati
on
Actu
al
Exp
en
dit
ure
Vari
an
ce
Exp
en
dit
ure
as %
of
fin
al
ap
pro
pri
ati
on
Fin
al
Ap
pro
pri
ati
on
Actu
al
exp
en
dit
ure
R'000 R'000 R'000 R'000 R'000 R'000 % R'000 R'000
Sub programme
1. Programme Support
2 789 94 - 2 883 2 805 78 97.3 2 592 2 535
2. Policy and Strategy 15 001 (282) (715) 14 004 13 096 908 93.5 16 274 15 973
3. Strategic Management Information
29 997 - - 29 997 29 014 983 96.7 19 294 18 675
4. Strategic Programmes
15 015 188 (160) 15 043 12 606 2 437 83.8 14 823 14 491
Total for sub programmes
62 802 - (875) 61 927 57 521 4 406 92.9 52 983 51 674
Economic classification
Current payments 61 865 (16) (806) 61 043 56 890 4 153 93.2 51 887 51 057
Compensation of employees
42 148 (12) - 42 136 40 905 1 231 97.1 39 694 39 078
Salaries and wages 37 972 (423) - 37 549 36 342 1 207 96.8 35 286 34 769
Social contributions 4 176 411 - 4 587 4 563 24 99.5 4 408 4 309
Goods and services 19 717 (4) (806) 18 907 15 985 2 922 84.5 12 193 11 979
Administrative fees 48 1 - 49 33 16 67.3 38 33
Advertising 2 618 (71) - 2 547 2 046 501 80.3 2 590 2 588
Minor assets 103 4 - 107 38 69 35.5 55 50
Catering: Departmental activities
242 (60) - 182 128 54 70.3 253 247
Communication 334 (81) - 253 244 9 96.4 216 203
Computer services 9 151 808 - 9 959 9 958 1 100.0 297 297
Consultants: Business and advisory services
2 781 (492) (646) 1 643 1 186 457 72.2 4 500 4 498
Contractors 337 73 (43) 367 158 209 43.1 125 124
Entertainment 3 4 - 7 4 3 57.1 2 1
Fleet services 73 (38) - 35 29 6 82.9 40 34
Consumable supplies
89 4 - 93 76 17 81.7 108 96
Consumable: Stationery, printing and office supplies
162 6 - 168 113 55 67.3 146 136
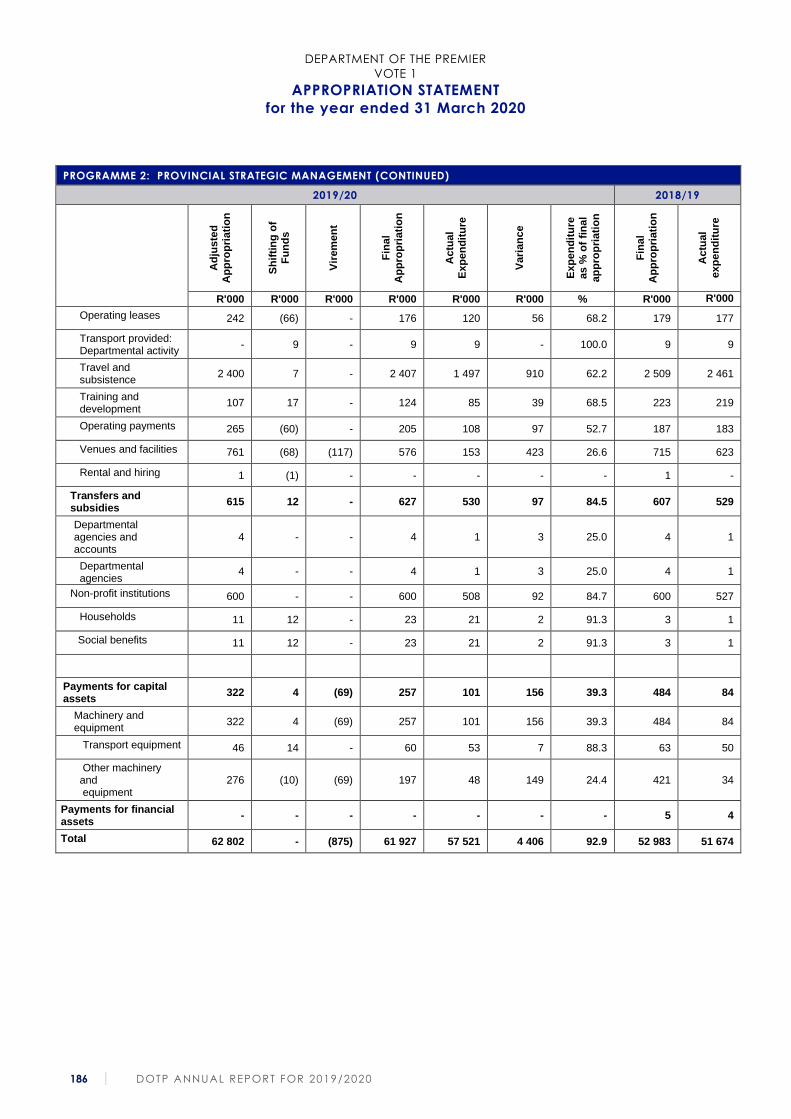
DEPARTMENT OF THE PREMIER
VOTE 1
APPROPRIATION STATEMENT
for the year ended 31 March 2020
186 DOTP ANNUAL REPORT FOR 2019/2020
PROGRAMME 2: PROVINCIAL STRATEGIC MANAGEMENT (CONTINUED)
2019/20 2018/19
Ad
jus
ted
Ap
pro
pri
ati
on
Sh
ifti
ng
of
Fu
nd
s
Vir
em
en
t
Fin
al
Ap
pro
pri
ati
on
Actu
al
Exp
en
dit
ure
Vari
an
ce
Exp
en
dit
ure
as %
of
fin
al
ap
pro
pri
ati
on
Fin
al
Ap
pro
pri
ati
on
Actu
al
exp
en
dit
ure
R'000 R'000 R'000 R'000 R'000 R'000 % R'000 R'000
Operating leases 242 (66) - 176 120 56 68.2 179 177
Transport provided: Departmental activity
- 9 - 9 9 - 100.0 9 9
Travel and subsistence
2 400 7 - 2 407 1 497 910 62.2 2 509 2 461
Training and development
107 17 - 124 85 39 68.5 223 219
Operating payments 265 (60) - 205 108 97 52.7 187 183
Venues and facilities 761 (68) (117) 576 153 423 26.6 715 623
Rental and hiring 1 (1) - - - - - 1 -
Transfers and subsidies
615 12 - 627 530 97 84.5 607 529
Departmental agencies and accounts
4 - - 4 1 3 25.0 4 1
Departmental agencies
4 - - 4 1 3 25.0 4 1
Non-profit institutions 600 - - 600 508 92 84.7 600 527
Households 11 12 - 23 21 2 91.3 3 1
Social benefits 11 12 - 23 21 2 91.3 3 1
Payments for capital assets
322 4 (69) 257 101 156 39.3 484 84
Machinery and equipment
322 4 (69) 257 101 156 39.3 484 84
Transport equipment 46 14 - 60 53 7 88.3 63 50
Other machinery and equipment
276 (10) (69) 197 48 149 24.4 421 34
Payments for financial assets
- - - - - - - 5 4
Total 62 802 - (875) 61 927 57 521 4 406 92.9 52 983 51 674
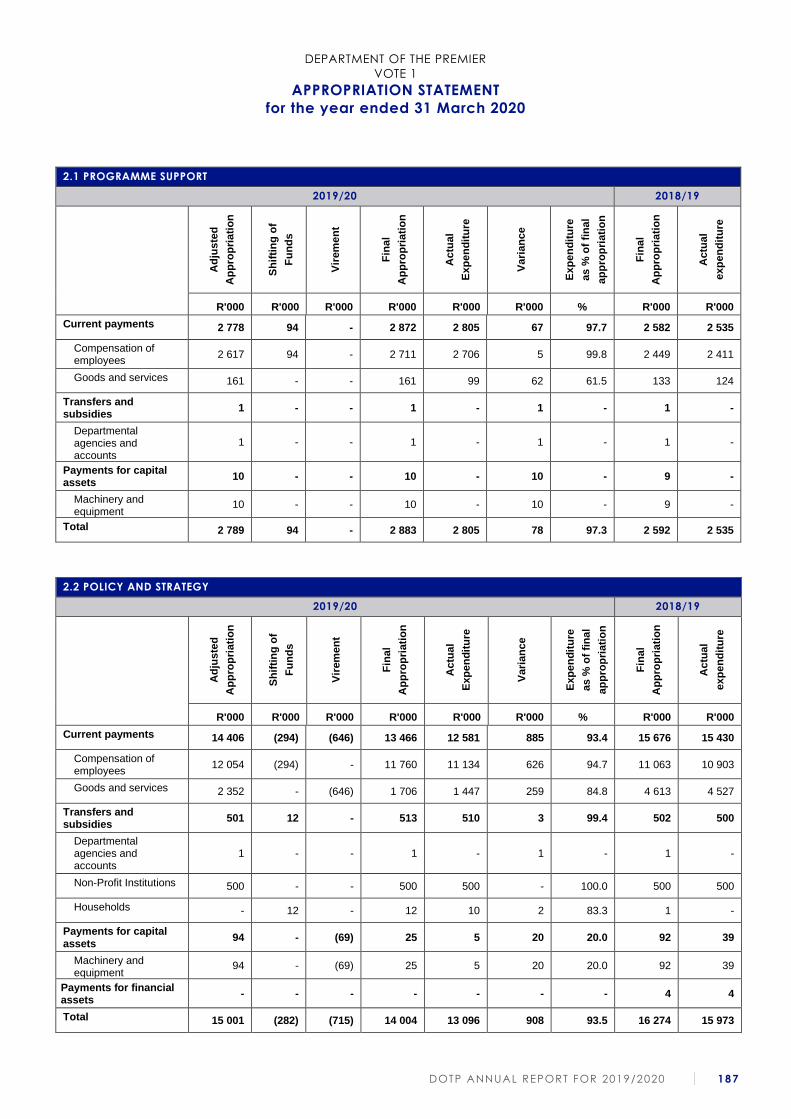
DEPARTMENT OF THE PREMIER
VOTE 1
APPROPRIATION STATEMENT
for the year ended 31 March 2020
DOTP ANNUAL REPORT FOR 2019/2020 187
2.1 PROGRAMME SUPPORT
2019/20 2018/19
Ad
jus
ted
Ap
pro
pri
ati
on
Sh
ifti
ng
of
Fu
nd
s
Vir
em
en
t
Fin
al
Ap
pro
pri
ati
on
Actu
al
Exp
en
dit
ure
Vari
an
ce
Exp
en
dit
ure
as %
of
fin
al
ap
pro
pri
ati
on
Fin
al
Ap
pro
pri
ati
on
Actu
al
exp
en
dit
ure
R'000 R'000 R'000 R'000 R'000 R'000 % R'000 R'000
Current payments 2 778 94 - 2 872 2 805 67 97.7 2 582 2 535
Compensation of employees
2 617 94 - 2 711 2 706 5 99.8 2 449 2 411
Goods and services 161 - - 161 99 62 61.5 133 124
Transfers and subsidies
1 - - 1 - 1 - 1 -
Departmental agencies and accounts
1 - - 1 - 1 - 1 -
Payments for capital assets
10 - - 10 - 10 - 9 -
Machinery and equipment
10 - - 10 - 10 - 9 -
Total 2 789 94 - 2 883 2 805 78 97.3 2 592 2 535
2.2 POLICY AND STRATEGY
2019/20 2018/19
Ad
jus
ted
Ap
pro
pri
ati
on
Sh
ifti
ng
of
Fu
nd
s
Vir
em
en
t
Fin
al
Ap
pro
pri
ati
on
Actu
al
Exp
en
dit
ure
Vari
an
ce
Exp
en
dit
ure
as %
of
fin
al
ap
pro
pri
ati
on
Fin
al
Ap
pro
pri
ati
on
Actu
al
exp
en
dit
ure
R'000 R'000 R'000 R'000 R'000 R'000 % R'000 R'000
Current payments 14 406 (294) (646) 13 466 12 581 885 93.4 15 676 15 430
Compensation of employees
12 054 (294) - 11 760 11 134 626 94.7 11 063 10 903
Goods and services 2 352 - (646) 1 706 1 447 259 84.8 4 613 4 527
Transfers and subsidies
501 12 - 513 510 3 99.4 502 500
Departmental agencies and accounts
1 - - 1 - 1 - 1 -
Non-Profit Institutions 500 - - 500 500 - 100.0 500 500
Households - 12 - 12 10 2 83.3 1 -
Payments for capital assets
94 - (69) 25 5 20 20.0 92 39
Machinery and equipment
94 - (69) 25 5 20 20.0 92 39
Payments for financial assets
- - - - - - - 4 4
Total 15 001 (282) (715) 14 004 13 096 908 93.5 16 274 15 973
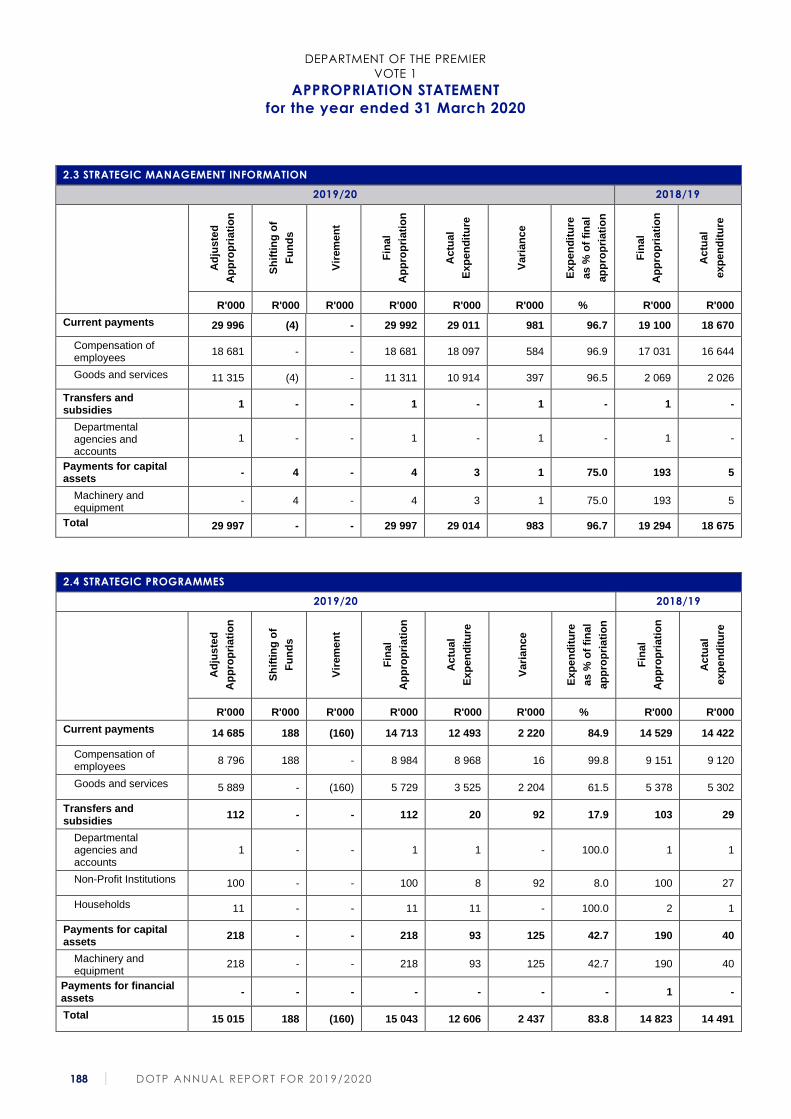
DEPARTMENT OF THE PREMIER
VOTE 1
APPROPRIATION STATEMENT
for the year ended 31 March 2020
188 DOTP ANNUAL REPORT FOR 2019/2020
2.3 STRATEGIC MANAGEMENT INFORMATION
2019/20 2018/19
Ad
jus
ted
Ap
pro
pri
ati
on
Sh
ifti
ng
of
Fu
nd
s
Vir
em
en
t
Fin
al
Ap
pro
pri
ati
on
Actu
al
Exp
en
dit
ure
Vari
an
ce
Exp
en
dit
ure
as %
of
fin
al
ap
pro
pri
ati
on
Fin
al
Ap
pro
pri
ati
on
Actu
al
exp
en
dit
ure
R'000 R'000 R'000 R'000 R'000 R'000 % R'000 R'000
Current payments 29 996 (4) - 29 992 29 011 981 96.7 19 100 18 670
Compensation of employees
18 681 - - 18 681 18 097 584 96.9 17 031 16 644
Goods and services 11 315 (4) - 11 311 10 914 397 96.5 2 069 2 026
Transfers and subsidies
1 - - 1 - 1 - 1 -
Departmental agencies and accounts
1 - - 1 - 1 - 1 -
Payments for capital assets
- 4 - 4 3 1 75.0 193 5
Machinery and equipment
- 4 - 4 3 1 75.0 193 5
Total 29 997 - - 29 997 29 014 983 96.7 19 294 18 675
2.4 STRATEGIC PROGRAMMES
2019/20 2018/19
Ad
jus
ted
Ap
pro
pri
ati
on
Sh
ifti
ng
of
Fu
nd
s
Vir
em
en
t
Fin
al
Ap
pro
pri
ati
on
Actu
al
Exp
en
dit
ure
Vari
an
ce
Exp
en
dit
ure
as %
of
fin
al
ap
pro
pri
ati
on
Fin
al
Ap
pro
pri
ati
on
Actu
al
exp
en
dit
ure
R'000 R'000 R'000 R'000 R'000 R'000 % R'000 R'000
Current payments 14 685 188 (160) 14 713 12 493 2 220 84.9 14 529 14 422
Compensation of employees
8 796 188 - 8 984 8 968 16 99.8 9 151 9 120
Goods and services 5 889 - (160) 5 729 3 525 2 204 61.5 5 378 5 302
Transfers and subsidies
112 - - 112 20 92 17.9 103 29
Departmental agencies and accounts
1 - - 1 1 - 100.0 1 1
Non-Profit Institutions 100 - - 100 8 92 8.0 100 27
Households 11 - - 11 11 - 100.0 2 1
Payments for capital assets
218 - - 218 93 125 42.7 190 40
Machinery and equipment
218 - - 218 93 125 42.7 190 40
Payments for financial assets
- - - - - - - 1 -
Total 15 015 188 (160) 15 043 12 606 2 437 83.8 14 823 14 491
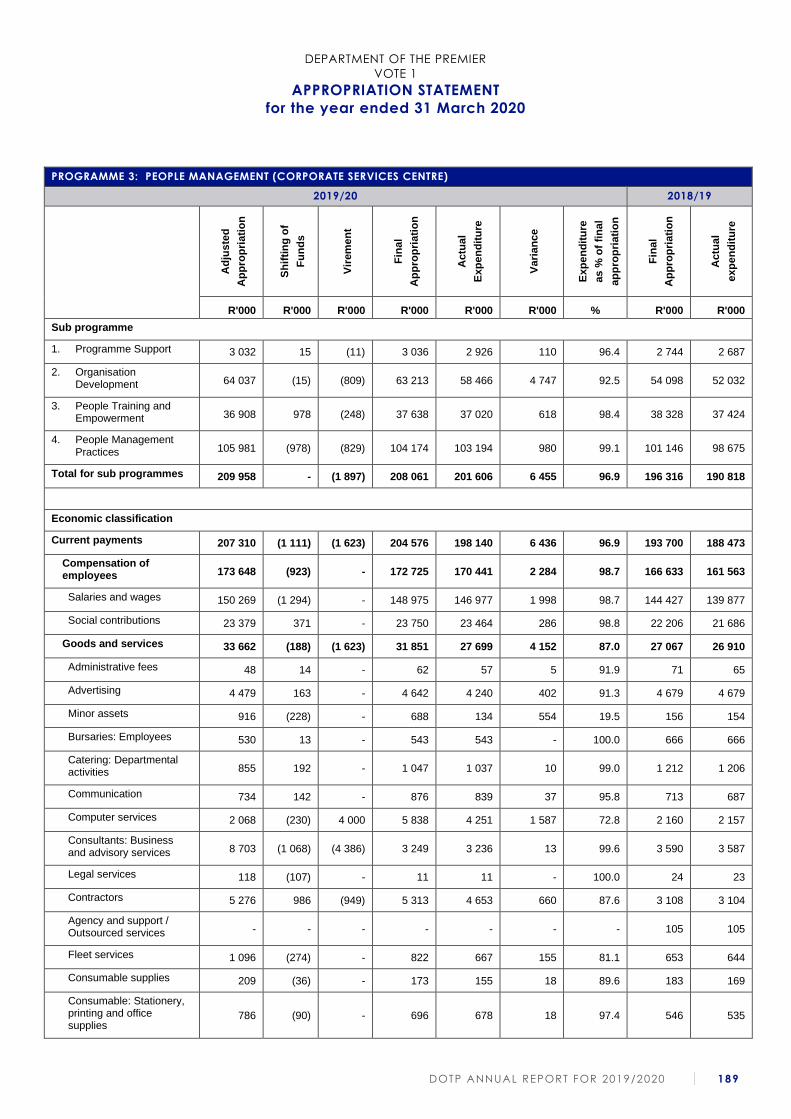
DEPARTMENT OF THE PREMIER
VOTE 1
APPROPRIATION STATEMENT
for the year ended 31 March 2020
DOTP ANNUAL REPORT FOR 2019/2020 189
PROGRAMME 3: PEOPLE MANAGEMENT (CORPORATE SERVICES CENTRE)
2019/20 2018/19
Ad
jus
ted
Ap
pro
pri
ati
on
Sh
ifti
ng
of
Fu
nd
s
Vir
em
en
t
Fin
al
Ap
pro
pri
ati
on
Actu
al
Exp
en
dit
ure
Vari
an
ce
Exp
en
dit
ure
as %
of
fin
al
ap
pro
pri
ati
on
Fin
al
Ap
pro
pri
ati
on
Actu
al
exp
en
dit
ure
R'000 R'000 R'000 R'000 R'000 R'000 % R'000 R'000
Sub programme
1. Programme Support 3 032 15 (11) 3 036 2 926 110 96.4 2 744 2 687
2. Organisation Development 64 037 (15) (809) 63 213 58 466 4 747 92.5 54 098 52 032
3. People Training and Empowerment 36 908 978 (248) 37 638 37 020 618 98.4 38 328 37 424
4. People Management Practices 105 981 (978) (829) 104 174 103 194 980 99.1 101 146 98 675
Total for sub programmes 209 958 - (1 897) 208 061 201 606 6 455 96.9 196 316 190 818
Economic classification
Current payments 207 310 (1 111) (1 623) 204 576 198 140 6 436 96.9 193 700 188 473
Compensation of employees 173 648 (923) - 172 725 170 441 2 284 98.7 166 633 161 563
Salaries and wages 150 269 (1 294) - 148 975 146 977 1 998 98.7 144 427 139 877
Social contributions 23 379 371 - 23 750 23 464 286 98.8 22 206 21 686
Goods and services 33 662 (188) (1 623) 31 851 27 699 4 152 87.0 27 067 26 910
Administrative fees 48 14 - 62 57 5 91.9 71 65
Advertising 4 479 163 - 4 642 4 240 402 91.3 4 679 4 679
Minor assets 916 (228) - 688 134 554 19.5 156 154
Bursaries: Employees 530 13 - 543 543 - 100.0 666 666
Catering: Departmental activities 855 192 - 1 047 1 037 10 99.0 1 212 1 206
Communication 734 142 - 876 839 37 95.8 713 687
Computer services 2 068 (230) 4 000 5 838 4 251 1 587 72.8 2 160 2 157
Consultants: Business and advisory services 8 703 (1 068) (4 386) 3 249 3 236 13 99.6 3 590 3 587
Legal services 118 (107) - 11 11 - 100.0 24 23
Contractors 5 276 986 (949) 5 313 4 653 660 87.6 3 108 3 104
Agency and support / Outsourced services - - - - - - - 105 105
Fleet services 1 096 (274) - 822 667 155 81.1 653 644
Consumable supplies 209 (36) - 173 155 18 89.6 183 169
Consumable: Stationery, printing and office supplies
786 (90) - 696 678 18 97.4 546 535
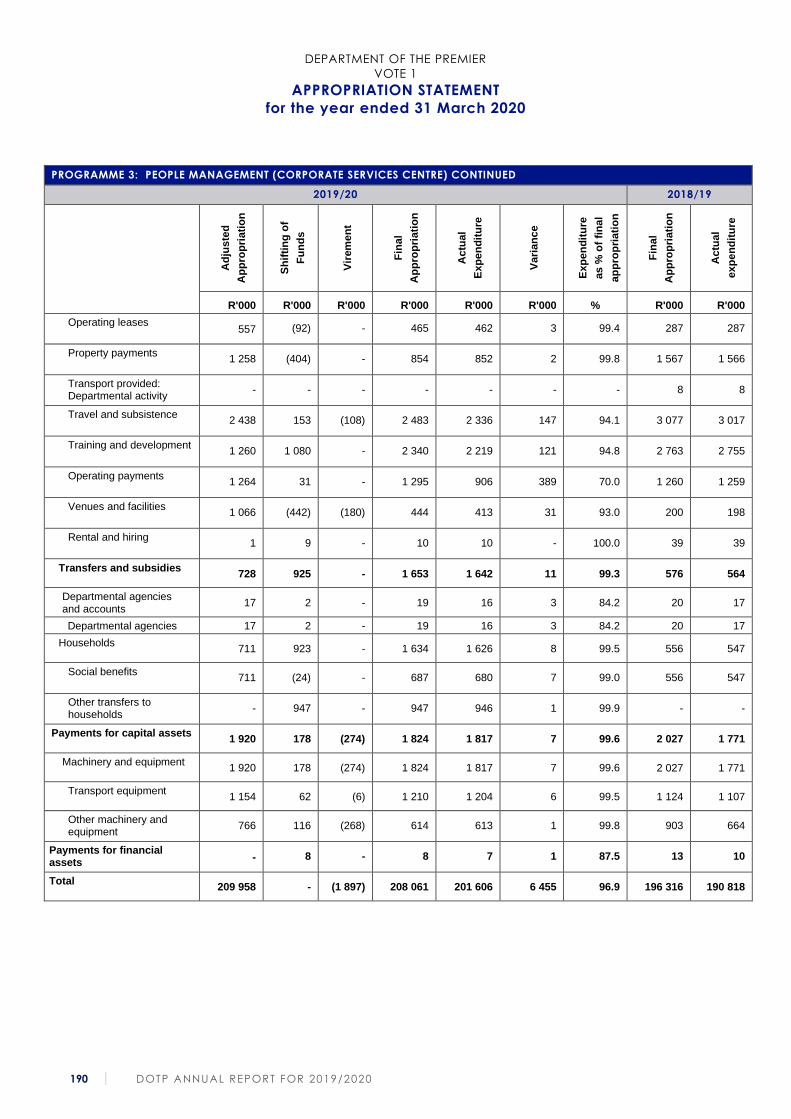
DEPARTMENT OF THE PREMIER
VOTE 1
APPROPRIATION STATEMENT
for the year ended 31 March 2020
190 DOTP ANNUAL REPORT FOR 2019/2020
PROGRAMME 3: PEOPLE MANAGEMENT (CORPORATE SERVICES CENTRE) CONTINUED
2019/20 2018/19
Ad
jus
ted
Ap
pro
pri
ati
on
Sh
ifti
ng
of
Fu
nd
s
Vir
em
en
t
Fin
al
Ap
pro
pri
ati
on
Actu
al
Exp
en
dit
ure
Vari
an
ce
Exp
en
dit
ure
as %
of
fin
al
ap
pro
pri
ati
on
Fin
al
Ap
pro
pri
ati
on
Actu
al
exp
en
dit
ure
R'000 R'000 R'000 R'000 R'000 R'000 % R'000 R'000
Operating leases 557 (92) - 465 462 3 99.4 287 287
Property payments 1 258 (404) - 854 852 2 99.8 1 567 1 566
Transport provided: Departmental activity
- - - - - - - 8 8
Travel and subsistence 2 438 153 (108) 2 483 2 336 147 94.1 3 077 3 017
Training and development 1 260 1 080 - 2 340 2 219 121 94.8 2 763 2 755
Operating payments 1 264 31 - 1 295 906 389 70.0 1 260 1 259
Venues and facilities 1 066 (442) (180) 444 413 31 93.0 200 198
Rental and hiring 1 9 - 10 10 - 100.0 39 39
Transfers and subsidies 728 925 - 1 653 1 642 11 99.3 576 564
Departmental agencies and accounts
17 2 - 19 16 3 84.2 20 17
Departmental agencies 17 2 - 19 16 3 84.2 20 17
Households 711 923 - 1 634 1 626 8 99.5 556 547
Social benefits 711 (24) - 687 680 7 99.0 556 547
Other transfers to households
- 947 - 947 946 1 99.9 - -
Payments for capital assets 1 920 178 (274) 1 824 1 817 7 99.6 2 027 1 771
Machinery and equipment 1 920 178 (274) 1 824 1 817 7 99.6 2 027 1 771
Transport equipment 1 154 62 (6) 1 210 1 204 6 99.5 1 124 1 107
Other machinery and equipment
766 116 (268) 614 613 1 99.8 903 664
Payments for financial assets
- 8 - 8 7 1 87.5 13 10
Total 209 958 - (1 897) 208 061 201 606 6 455 96.9 196 316 190 818
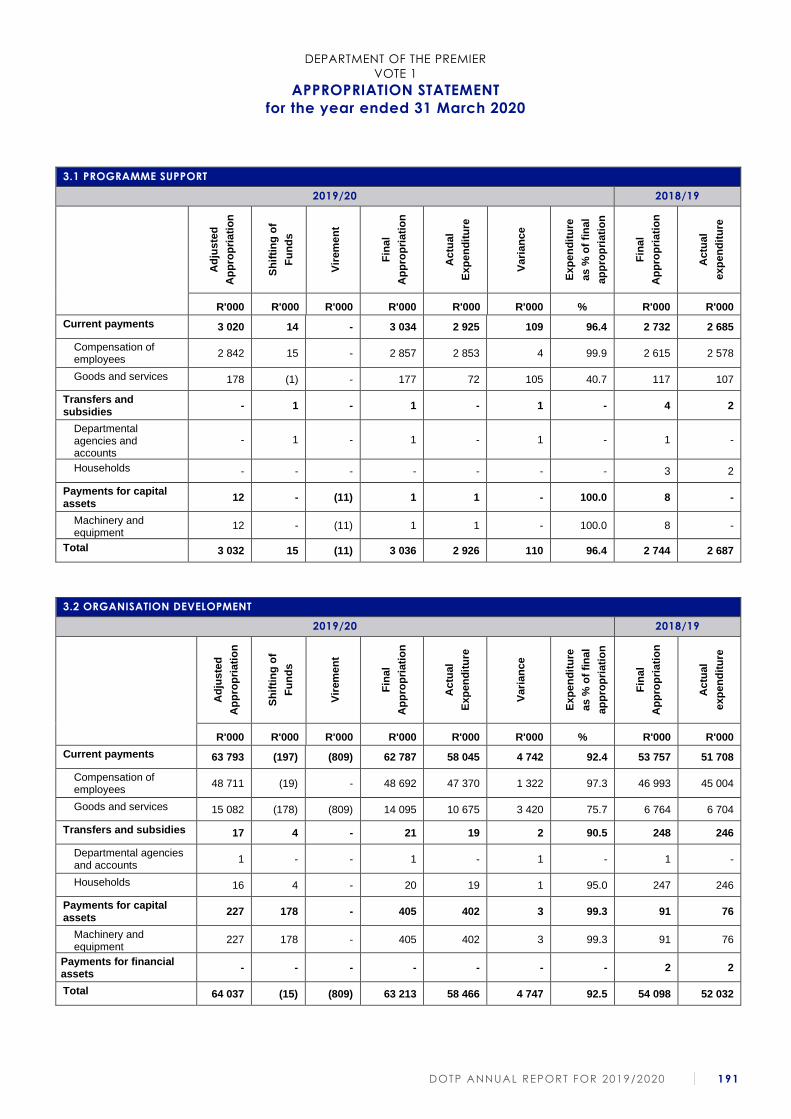
DEPARTMENT OF THE PREMIER
VOTE 1
APPROPRIATION STATEMENT
for the year ended 31 March 2020
DOTP ANNUAL REPORT FOR 2019/2020 191
3.1 PROGRAMME SUPPORT
2019/20 2018/19
Ad
jus
ted
Ap
pro
pri
ati
on
Sh
ifti
ng
of
Fu
nd
s
Vir
em
en
t
Fin
al
Ap
pro
pri
ati
on
Actu
al
Exp
en
dit
ure
Vari
an
ce
Exp
en
dit
ure
as %
of
fin
al
ap
pro
pri
ati
on
Fin
al
Ap
pro
pri
ati
on
Actu
al
exp
en
dit
ure
R'000 R'000 R'000 R'000 R'000 R'000 % R'000 R'000
Current payments 3 020 14 - 3 034 2 925 109 96.4 2 732 2 685
Compensation of employees
2 842 15 - 2 857 2 853 4 99.9 2 615 2 578
Goods and services 178 (1) - 177 72 105 40.7 117 107
Transfers and subsidies
- 1 - 1 - 1 - 4 2
Departmental agencies and accounts
- 1 - 1 - 1 - 1 -
Households - - - - - - - 3 2
Payments for capital assets
12 - (11) 1 1 - 100.0 8 -
Machinery and equipment
12 - (11) 1 1 - 100.0 8 -
Total 3 032 15 (11) 3 036 2 926 110 96.4 2 744 2 687
3.2 ORGANISATION DEVELOPMENT
2019/20 2018/19
Ad
jus
ted
Ap
pro
pri
ati
on
Sh
ifti
ng
of
Fu
nd
s
Vir
em
en
t
Fin
al
Ap
pro
pri
ati
on
Actu
al
Exp
en
dit
ure
Vari
an
ce
Exp
en
dit
ure
as %
of
fin
al
ap
pro
pri
ati
on
Fin
al
Ap
pro
pri
ati
on
Actu
al
exp
en
dit
ure
R'000 R'000 R'000 R'000 R'000 R'000 % R'000 R'000
Current payments 63 793 (197) (809) 62 787 58 045 4 742 92.4 53 757 51 708
Compensation of employees
48 711 (19) - 48 692 47 370 1 322 97.3 46 993 45 004
Goods and services 15 082 (178) (809) 14 095 10 675 3 420 75.7 6 764 6 704
Transfers and subsidies 17 4 - 21 19 2 90.5 248 246
Departmental agencies and accounts
1 - - 1 - 1 - 1 -
Households 16 4 - 20 19 1 95.0 247 246
Payments for capital assets
227 178 - 405 402 3 99.3 91 76
Machinery and equipment
227 178 - 405 402 3 99.3 91 76
Payments for financial assets
- - - - - - - 2 2
Total 64 037 (15) (809) 63 213 58 466 4 747 92.5 54 098 52 032
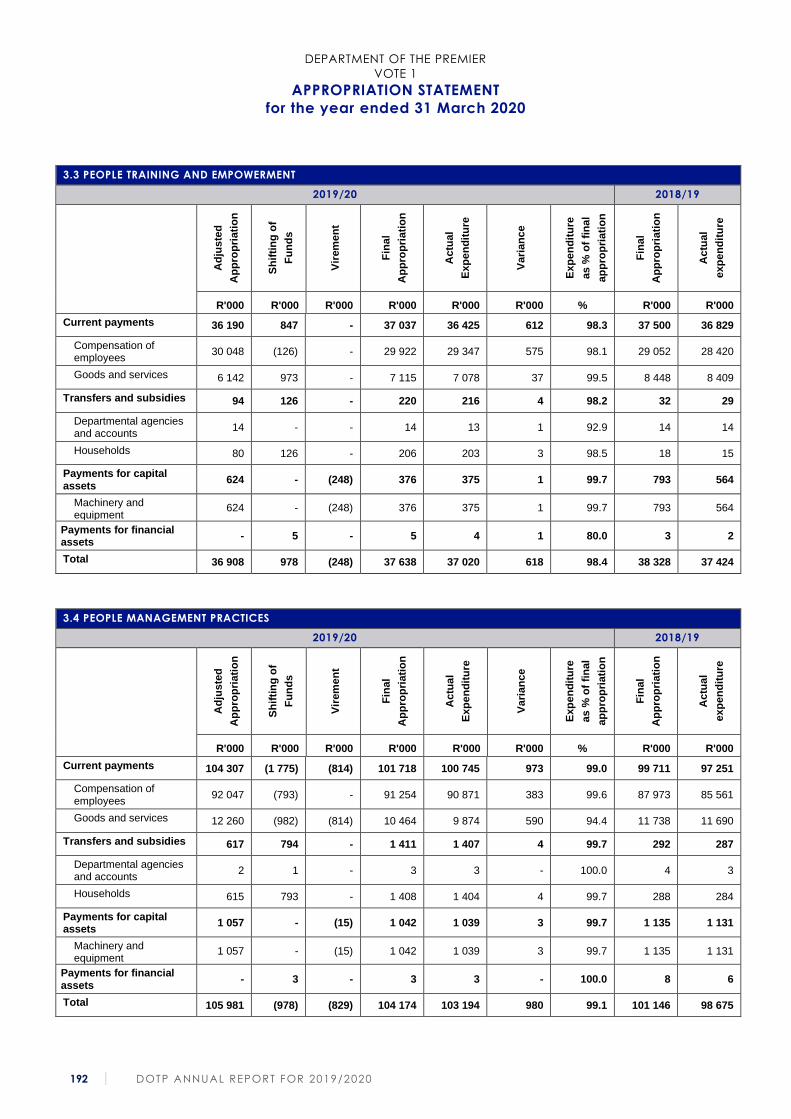
DEPARTMENT OF THE PREMIER
VOTE 1
APPROPRIATION STATEMENT
for the year ended 31 March 2020
192 DOTP ANNUAL REPORT FOR 2019/2020
3.3 PEOPLE TRAINING AND EMPOWERMENT
2019/20 2018/19
Ad
jus
ted
Ap
pro
pri
ati
on
Sh
ifti
ng
of
Fu
nd
s
Vir
em
en
t
Fin
al
Ap
pro
pri
ati
on
Actu
al
Exp
en
dit
ure
Vari
an
ce
Exp
en
dit
ure
as %
of
fin
al
ap
pro
pri
ati
on
Fin
al
Ap
pro
pri
ati
on
Actu
al
exp
en
dit
ure
R'000 R'000 R'000 R'000 R'000 R'000 % R'000 R'000
Current payments 36 190 847 - 37 037 36 425 612 98.3 37 500 36 829
Compensation of employees
30 048 (126) - 29 922 29 347 575 98.1 29 052 28 420
Goods and services 6 142 973 - 7 115 7 078 37 99.5 8 448 8 409
Transfers and subsidies 94 126 - 220 216 4 98.2 32 29
Departmental agencies and accounts
14 - - 14 13 1 92.9 14 14
Households 80 126 - 206 203 3 98.5 18 15
Payments for capital assets
624 - (248) 376 375 1 99.7 793 564
Machinery and equipment
624 - (248) 376 375 1 99.7 793 564
Payments for financial assets
- 5 - 5 4 1 80.0 3 2
Total 36 908 978 (248) 37 638 37 020 618 98.4 38 328 37 424
3.4 PEOPLE MANAGEMENT PRACTICES
2019/20 2018/19
Ad
jus
ted
Ap
pro
pri
ati
on
Sh
ifti
ng
of
Fu
nd
s
Vir
em
en
t
Fin
al
Ap
pro
pri
ati
on
Actu
al
Exp
en
dit
ure
Vari
an
ce
Exp
en
dit
ure
as %
of
fin
al
ap
pro
pri
ati
on
Fin
al
Ap
pro
pri
ati
on
Actu
al
exp
en
dit
ure
R'000 R'000 R'000 R'000 R'000 R'000 % R'000 R'000
Current payments 104 307 (1 775) (814) 101 718 100 745 973 99.0 99 711 97 251
Compensation of employees
92 047 (793) - 91 254 90 871 383 99.6 87 973 85 561
Goods and services 12 260 (982) (814) 10 464 9 874 590 94.4 11 738 11 690
Transfers and subsidies 617 794 - 1 411 1 407 4 99.7 292 287
Departmental agencies and accounts
2 1 - 3 3 - 100.0 4 3
Households 615 793 - 1 408 1 404 4 99.7 288 284
Payments for capital assets
1 057 - (15) 1 042 1 039 3 99.7 1 135 1 131
Machinery and equipment
1 057 - (15) 1 042 1 039 3 99.7 1 135 1 131
Payments for financial assets
- 3 - 3 3 - 100.0 8 6
Total 105 981 (978) (829) 104 174 103 194 980 99.1 101 146 98 675
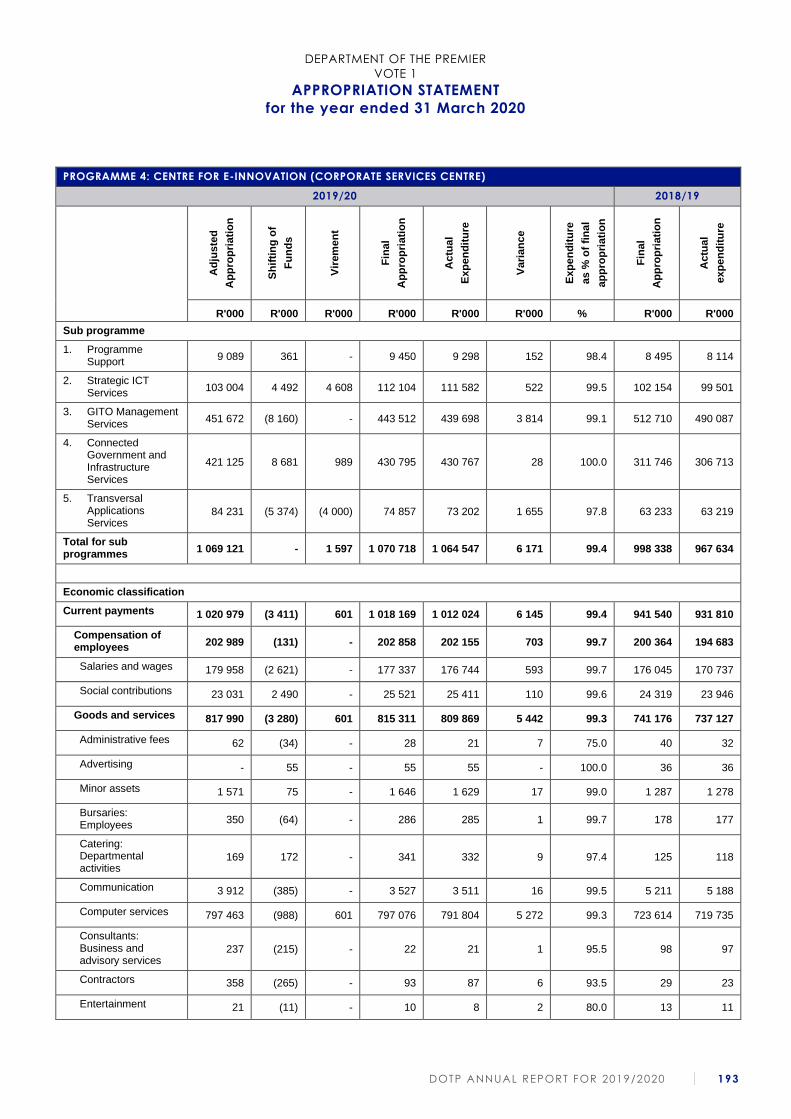
DEPARTMENT OF THE PREMIER
VOTE 1
APPROPRIATION STATEMENT
for the year ended 31 March 2020
DOTP ANNUAL REPORT FOR 2019/2020 193
PROGRAMME 4: CENTRE FOR E-INNOVATION (CORPORATE SERVICES CENTRE)
2019/20 2018/19
Ad
jus
ted
Ap
pro
pri
ati
on
Sh
ifti
ng
of
Fu
nd
s
Vir
em
en
t
Fin
al
Ap
pro
pri
ati
on
Actu
al
Exp
en
dit
ure
Vari
an
ce
Exp
en
dit
ure
as %
of
fin
al
ap
pro
pri
ati
on
Fin
al
Ap
pro
pri
ati
on
Actu
al
exp
en
dit
ure
R'000 R'000 R'000 R'000 R'000 R'000 % R'000 R'000
Sub programme
1. Programme Support
9 089 361 - 9 450 9 298 152 98.4 8 495 8 114
2. Strategic ICT Services
103 004 4 492 4 608 112 104 111 582 522 99.5 102 154 99 501
3. GITO Management Services
451 672 (8 160) - 443 512 439 698 3 814 99.1 512 710 490 087
4. Connected Government and Infrastructure Services
421 125 8 681 989 430 795 430 767 28 100.0 311 746 306 713
5. Transversal Applications Services
84 231 (5 374) (4 000) 74 857 73 202 1 655 97.8 63 233 63 219
Total for sub programmes
1 069 121 - 1 597 1 070 718 1 064 547 6 171 99.4 998 338 967 634
Economic classification
Current payments 1 020 979 (3 411) 601 1 018 169 1 012 024 6 145 99.4 941 540 931 810
Compensation of employees
202 989 (131) - 202 858 202 155 703 99.7 200 364 194 683
Salaries and wages 179 958 (2 621) - 177 337 176 744 593 99.7 176 045 170 737
Social contributions 23 031 2 490 - 25 521 25 411 110 99.6 24 319 23 946
Goods and services 817 990 (3 280) 601 815 311 809 869 5 442 99.3 741 176 737 127
Administrative fees 62 (34) - 28 21 7 75.0 40 32
Advertising - 55 - 55 55 - 100.0 36 36
Minor assets 1 571 75 - 1 646 1 629 17 99.0 1 287 1 278
Bursaries: Employees
350 (64) - 286 285 1 99.7 178 177
Catering: Departmental activities
169 172 - 341 332 9 97.4 125 118
Communication 3 912 (385) - 3 527 3 511 16 99.5 5 211 5 188
Computer services 797 463 (988) 601 797 076 791 804 5 272 99.3 723 614 719 735
Consultants: Business and advisory services
237 (215) - 22 21 1 95.5 98 97
Contractors 358 (265) - 93 87 6 93.5 29 23
Entertainment 21 (11) - 10 8 2 80.0 13 11
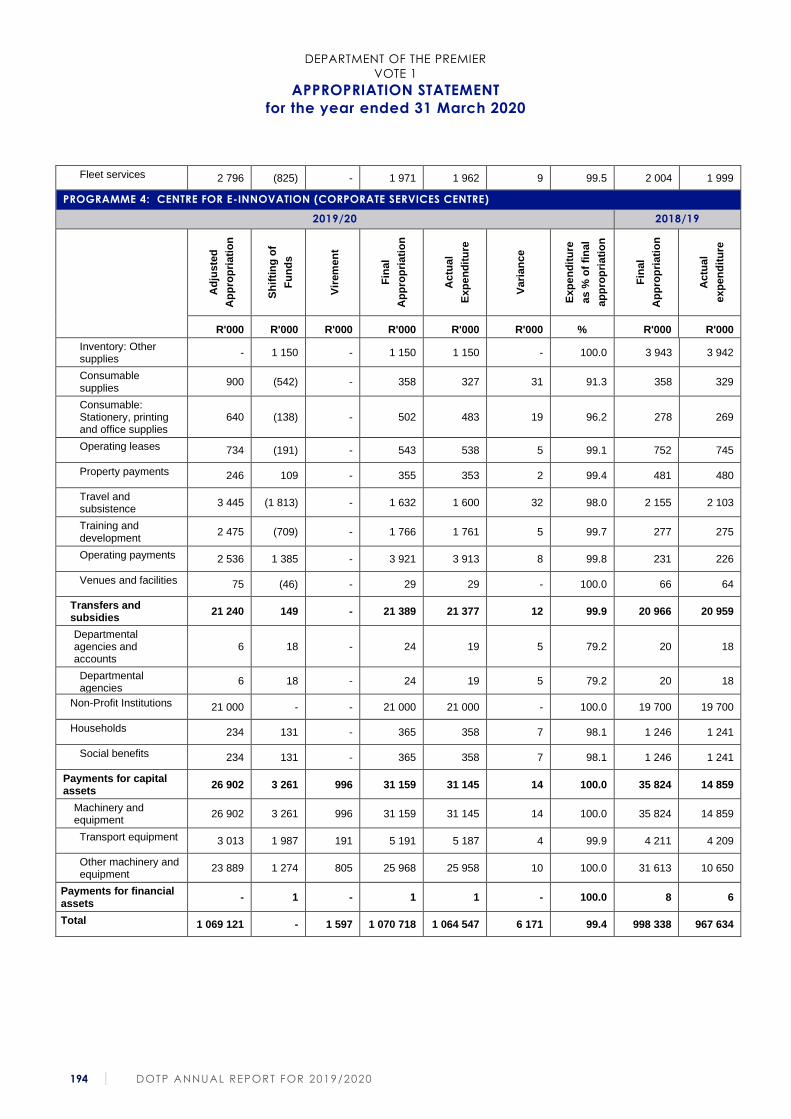
DEPARTMENT OF THE PREMIER
VOTE 1
APPROPRIATION STATEMENT
for the year ended 31 March 2020
194 DOTP ANNUAL REPORT FOR 2019/2020
Fleet services 2 796 (825) - 1 971 1 962 9 99.5 2 004 1 999
PROGRAMME 4: CENTRE FOR E-INNOVATION (CORPORATE SERVICES CENTRE)
2019/20 2018/19
Ad
jus
ted
Ap
pro
pri
ati
on
Sh
ifti
ng
of
Fu
nd
s
Vir
em
en
t
Fin
al
Ap
pro
pri
ati
on
Actu
al
Exp
en
dit
ure
Vari
an
ce
Exp
en
dit
ure
as %
of
fin
al
ap
pro
pri
ati
on
Fin
al
Ap
pro
pri
ati
on
Actu
al
exp
en
dit
ure
R'000 R'000 R'000 R'000 R'000 R'000 % R'000 R'000
Inventory: Other supplies
- 1 150 - 1 150 1 150 - 100.0 3 943 3 942
Consumable supplies
900 (542) - 358 327 31 91.3 358 329
Consumable: Stationery, printing and office supplies
640 (138) - 502 483 19 96.2 278 269
Operating leases 734 (191) - 543 538 5 99.1 752 745
Property payments 246 109 - 355 353 2 99.4 481 480
Travel and subsistence
3 445 (1 813) - 1 632 1 600 32 98.0 2 155 2 103
Training and development
2 475 (709) - 1 766 1 761 5 99.7 277 275
Operating payments 2 536 1 385 - 3 921 3 913 8 99.8 231 226
Venues and facilities 75 (46) - 29 29 - 100.0 66 64
Transfers and subsidies
21 240 149 - 21 389 21 377 12 99.9 20 966 20 959
Departmental agencies and accounts
6 18 - 24 19 5 79.2 20 18
Departmental agencies
6 18 - 24 19 5 79.2 20 18
Non-Profit Institutions 21 000 - - 21 000 21 000 - 100.0 19 700 19 700
Households 234 131 - 365 358 7 98.1 1 246 1 241
Social benefits 234 131 - 365 358 7 98.1 1 246 1 241
Payments for capital assets
26 902 3 261 996 31 159 31 145 14 100.0 35 824 14 859
Machinery and equipment
26 902 3 261 996 31 159 31 145 14 100.0 35 824 14 859
Transport equipment 3 013 1 987 191 5 191 5 187 4 99.9 4 211 4 209
Other machinery and equipment
23 889 1 274 805 25 968 25 958 10 100.0 31 613 10 650
Payments for financial assets
- 1 - 1 1 - 100.0 8 6
Total 1 069 121 - 1 597 1 070 718 1 064 547 6 171 99.4 998 338 967 634
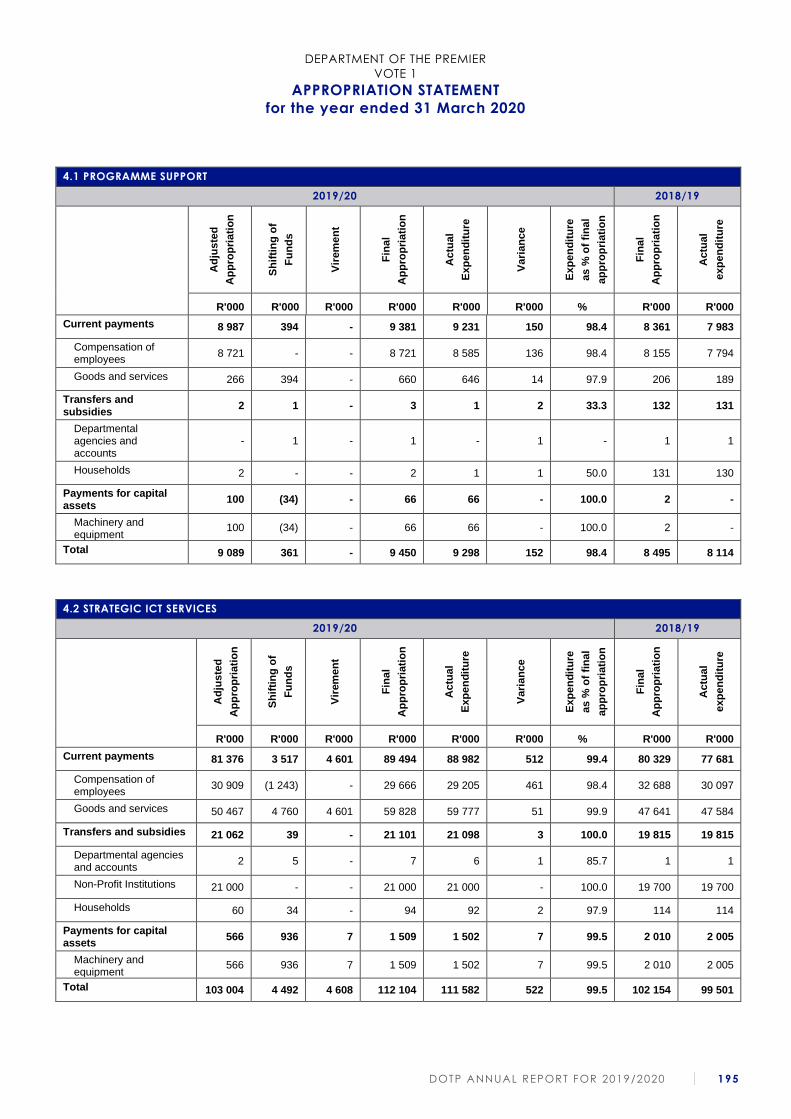
DEPARTMENT OF THE PREMIER
VOTE 1
APPROPRIATION STATEMENT
for the year ended 31 March 2020
DOTP ANNUAL REPORT FOR 2019/2020 195
4.1 PROGRAMME SUPPORT
2019/20 2018/19
Ad
jus
ted
Ap
pro
pri
ati
on
Sh
ifti
ng
of
Fu
nd
s
Vir
em
en
t
Fin
al
Ap
pro
pri
ati
on
Actu
al
Exp
en
dit
ure
Vari
an
ce
Exp
en
dit
ure
as %
of
fin
al
ap
pro
pri
ati
on
Fin
al
Ap
pro
pri
ati
on
Actu
al
exp
en
dit
ure
R'000 R'000 R'000 R'000 R'000 R'000 % R'000 R'000
Current payments 8 987 394 - 9 381 9 231 150 98.4 8 361 7 983
Compensation of employees
8 721 - - 8 721 8 585 136 98.4 8 155 7 794
Goods and services 266 394 - 660 646 14 97.9 206 189
Transfers and subsidies
2 1 - 3 1 2 33.3 132 131
Departmental agencies and accounts
- 1 - 1 - 1 - 1 1
Households 2 - - 2 1 1 50.0 131 130
Payments for capital assets
100 (34) - 66 66 - 100.0 2 -
Machinery and equipment
100 (34) - 66 66 - 100.0 2 -
Total 9 089 361 - 9 450 9 298 152 98.4 8 495 8 114
4.2 STRATEGIC ICT SERVICES
2019/20 2018/19
Ad
jus
ted
Ap
pro
pri
ati
on
Sh
ifti
ng
of
Fu
nd
s
Vir
em
en
t
Fin
al
Ap
pro
pri
ati
on
Actu
al
Exp
en
dit
ure
Vari
an
ce
Exp
en
dit
ure
as %
of
fin
al
ap
pro
pri
ati
on
Fin
al
Ap
pro
pri
ati
on
Actu
al
exp
en
dit
ure
R'000 R'000 R'000 R'000 R'000 R'000 % R'000 R'000
Current payments 81 376 3 517 4 601 89 494 88 982 512 99.4 80 329 77 681
Compensation of employees
30 909 (1 243) - 29 666 29 205 461 98.4 32 688 30 097
Goods and services 50 467 4 760 4 601 59 828 59 777 51 99.9 47 641 47 584
Transfers and subsidies 21 062 39 - 21 101 21 098 3 100.0 19 815 19 815
Departmental agencies and accounts
2 5 - 7 6 1 85.7 1 1
Non-Profit Institutions 21 000 - - 21 000 21 000 - 100.0 19 700 19 700
Households 60 34 - 94 92 2 97.9 114 114
Payments for capital assets
566 936 7 1 509 1 502 7 99.5 2 010 2 005
Machinery and equipment
566 936 7 1 509 1 502 7 99.5 2 010 2 005
Total 103 004 4 492 4 608 112 104 111 582 522 99.5 102 154 99 501
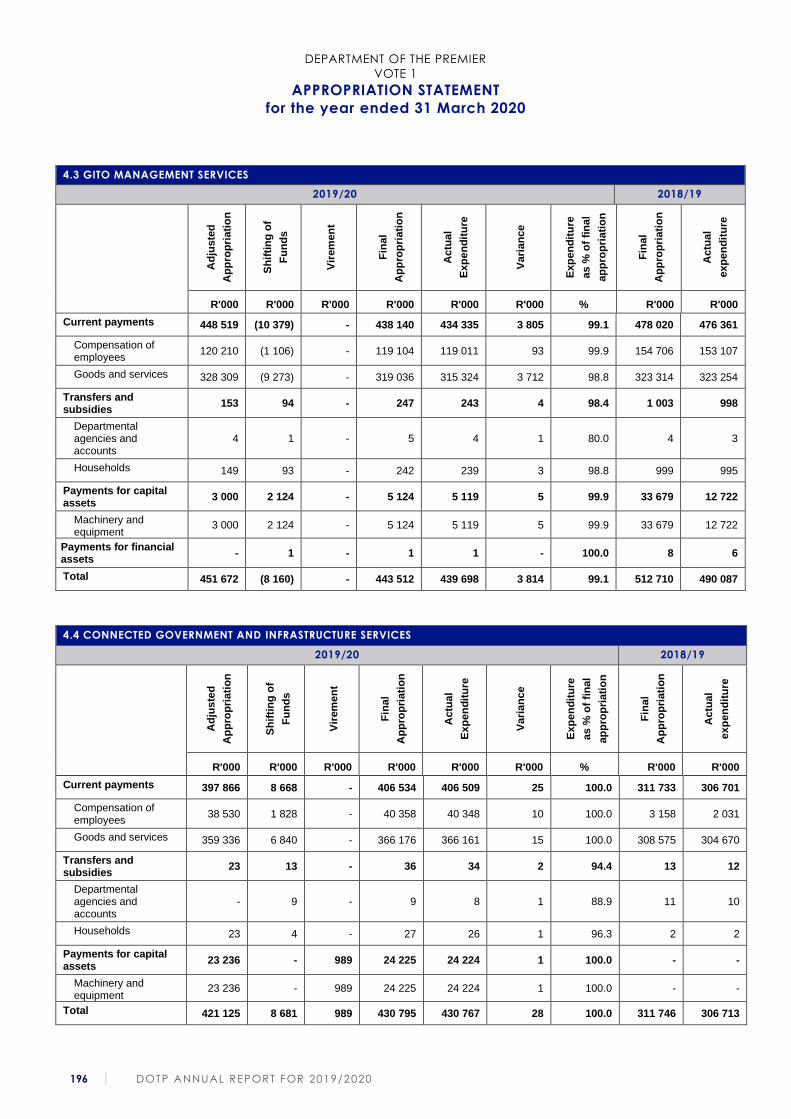
DEPARTMENT OF THE PREMIER
VOTE 1
APPROPRIATION STATEMENT
for the year ended 31 March 2020
196 DOTP ANNUAL REPORT FOR 2019/2020
4.3 GITO MANAGEMENT SERVICES
2019/20 2018/19
Ad
jus
ted
Ap
pro
pri
ati
on
Sh
ifti
ng
of
Fu
nd
s
Vir
em
en
t
Fin
al
Ap
pro
pri
ati
on
Actu
al
Exp
en
dit
ure
Vari
an
ce
Exp
en
dit
ure
as %
of
fin
al
ap
pro
pri
ati
on
Fin
al
Ap
pro
pri
ati
on
Actu
al
exp
en
dit
ure
R'000 R'000 R'000 R'000 R'000 R'000 % R'000 R'000
Current payments 448 519 (10 379) - 438 140 434 335 3 805 99.1 478 020 476 361
Compensation of employees
120 210 (1 106) - 119 104 119 011 93 99.9 154 706 153 107
Goods and services 328 309 (9 273) - 319 036 315 324 3 712 98.8 323 314 323 254
Transfers and subsidies
153 94 - 247 243 4 98.4 1 003 998
Departmental agencies and accounts
4 1 - 5 4 1 80.0 4 3
Households 149 93 - 242 239 3 98.8 999 995
Payments for capital assets
3 000 2 124 - 5 124 5 119 5 99.9 33 679 12 722
Machinery and equipment
3 000 2 124 - 5 124 5 119 5 99.9 33 679 12 722
Payments for financial assets
- 1 - 1 1 - 100.0 8 6
Total 451 672 (8 160) - 443 512 439 698 3 814 99.1 512 710 490 087
4.4 CONNECTED GOVERNMENT AND INFRASTRUCTURE SERVICES
2019/20 2018/19
Ad
jus
ted
Ap
pro
pri
ati
on
Sh
ifti
ng
of
Fu
nd
s
Vir
em
en
t
Fin
al
Ap
pro
pri
ati
on
Actu
al
Exp
en
dit
ure
Vari
an
ce
Exp
en
dit
ure
as %
of
fin
al
ap
pro
pri
ati
on
Fin
al
Ap
pro
pri
ati
on
Actu
al
exp
en
dit
ure
R'000 R'000 R'000 R'000 R'000 R'000 % R'000 R'000
Current payments 397 866 8 668 - 406 534 406 509 25 100.0 311 733 306 701
Compensation of employees
38 530 1 828 - 40 358 40 348 10 100.0 3 158 2 031
Goods and services 359 336 6 840 - 366 176 366 161 15 100.0 308 575 304 670
Transfers and subsidies
23 13 - 36 34 2 94.4 13 12
Departmental agencies and accounts
- 9 - 9 8 1 88.9 11 10
Households 23 4 - 27 26 1 96.3 2 2
Payments for capital assets
23 236 - 989 24 225 24 224 1 100.0 - -
Machinery and equipment
23 236 - 989 24 225 24 224 1 100.0 - -
Total 421 125 8 681 989 430 795 430 767 28 100.0 311 746 306 713
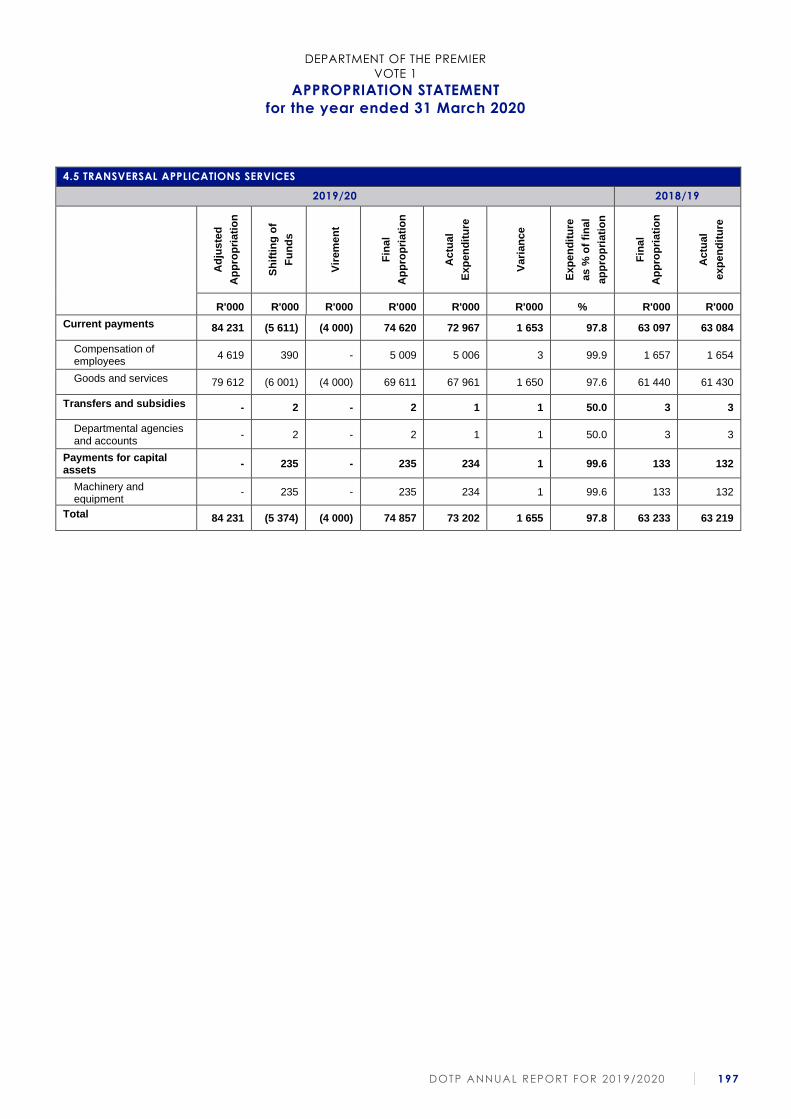
DEPARTMENT OF THE PREMIER
VOTE 1
APPROPRIATION STATEMENT
for the year ended 31 March 2020
DOTP ANNUAL REPORT FOR 2019/2020 197
4.5 TRANSVERSAL APPLICATIONS SERVICES
2019/20 2018/19
Ad
jus
ted
Ap
pro
pri
ati
on
Sh
ifti
ng
of
Fu
nd
s
Vir
em
en
t
Fin
al
Ap
pro
pri
ati
on
Actu
al
Exp
en
dit
ure
Vari
an
ce
Exp
en
dit
ure
as %
of
fin
al
ap
pro
pri
ati
on
Fin
al
Ap
pro
pri
ati
on
Actu
al
exp
en
dit
ure
R'000 R'000 R'000 R'000 R'000 R'000 % R'000 R'000
Current payments 84 231 (5 611) (4 000) 74 620 72 967 1 653 97.8 63 097 63 084
Compensation of employees
4 619 390 - 5 009 5 006 3 99.9 1 657 1 654
Goods and services 79 612 (6 001) (4 000) 69 611 67 961 1 650 97.6 61 440 61 430
Transfers and subsidies - 2 - 2 1 1 50.0 3 3
Departmental agencies and accounts
- 2 - 2 1 1 50.0 3 3
Payments for capital assets
- 235 - 235 234 1 99.6 133 132
Machinery and equipment
- 235 - 235 234 1 99.6 133 132
Total 84 231 (5 374) (4 000) 74 857 73 202 1 655 97.8 63 233 63 219
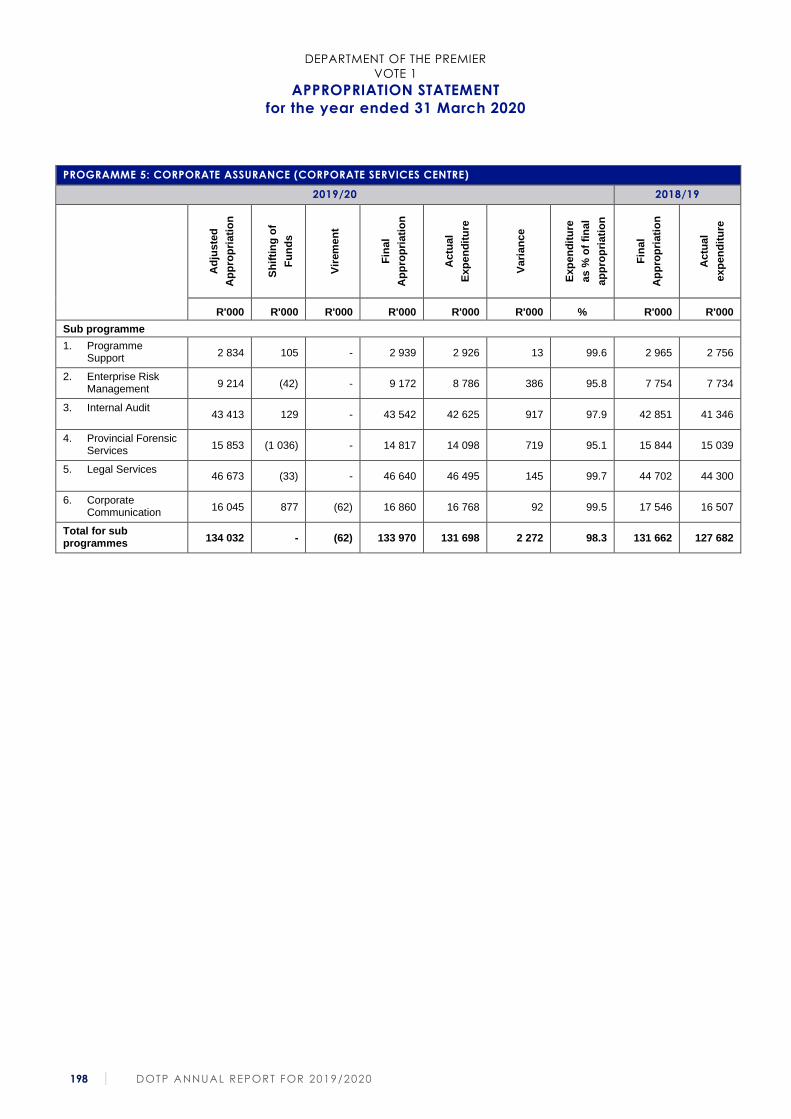
DEPARTMENT OF THE PREMIER
VOTE 1
APPROPRIATION STATEMENT
for the year ended 31 March 2020
198 DOTP ANNUAL REPORT FOR 2019/2020
PROGRAMME 5: CORPORATE ASSURANCE (CORPORATE SERVICES CENTRE)
2019/20 2018/19
Ad
jus
ted
Ap
pro
pri
ati
on
Sh
ifti
ng
of
Fu
nd
s
Vir
em
en
t
Fin
al
Ap
pro
pri
ati
on
Actu
al
Exp
en
dit
ure
Vari
an
ce
Exp
en
dit
ure
as %
of
fin
al
ap
pro
pri
ati
on
Fin
al
Ap
pro
pri
ati
on
Actu
al
exp
en
dit
ure
R'000 R'000 R'000 R'000 R'000 R'000 % R'000 R'000
Sub programme
1. Programme Support
2 834 105 - 2 939 2 926 13 99.6 2 965 2 756
2. Enterprise Risk Management
9 214 (42) - 9 172 8 786 386 95.8 7 754 7 734
3. Internal Audit 43 413 129 - 43 542 42 625 917 97.9 42 851 41 346
4. Provincial Forensic Services
15 853 (1 036) - 14 817 14 098 719 95.1 15 844 15 039
5. Legal Services 46 673 (33) - 46 640 46 495 145 99.7 44 702 44 300
6. Corporate Communication
16 045 877 (62) 16 860 16 768 92 99.5 17 546 16 507
Total for sub programmes
134 032 - (62) 133 970 131 698 2 272 98.3 131 662 127 682

DEPARTMENT OF THE PREMIER
VOTE 1
APPROPRIATION STATEMENT
for the year ended 31 March 2020
DOTP ANNUAL REPORT FOR 2019/2020 199
PROGRAMME 5: CORPORATE ASSURANCE
2019/20 2018/19
Ad
jus
ted
Ap
pro
pri
ati
on
Sh
ifti
ng
of
Fu
nd
s
Vir
em
en
t
Fin
al
Ap
pro
pri
ati
on
Actu
al
Exp
en
dit
ure
Vari
an
ce
Exp
en
dit
ure
as %
of
fin
al
ap
pro
pri
ati
on
Fin
al
Ap
pro
pri
ati
on
Actu
al
exp
en
dit
ure
R'000 R'000 R'000 R'000 R'000 R'000 % R'000 R'000
Economic classification
Current payments 133 210 (931) (62) 132 217 129 955 2 262 98.3 130 374 126 504
Compensation of employees
115 051 (405) - 114 646 112 597 2 049 98.2 112 639 109 383
Salaries and wages 102 506 (521) - 101 985 100 073 1 912 98.1 99 823 97 423
Social contributions 12 545 116 - 12 661 12 524 137 98.9 12 816 11 960
Goods and services 18 159 (526) (62) 17 571 17 358 213 98.8 17 735 17 121
Administrative fees 7 14 - 21 15 6 71.4 30 26
Advertising 2 444 31 - 2 475 2 473 2 99.9 4 653 4 172
Minor assets 183 5 - 188 181 7 96.3 225 218
Catering: Departmental activities
84 57 - 141 137 4 97.2 126 124
Communication 417 (153) - 264 246 18 93.2 298 289
Computer services 1 520 (636) - 884 869 15 98.3 1 123 1 120
Consultants: Business and advisory services
6 068 332 - 6 400 6 395 5 99.9 4 306 4 302
Legal Services 2 170 (139) - 2 031 2 019 12 99.4 1 429 1 427
Contractors 268 252 (62) 458 454 4 99.1 163 159
Entertainment 7 (7) - - - - - 1 -
Fleet services 114 (8) - 106 103 3 97.2 120 119
Consumable supplies 207 (52) - 155 127 28 81.9 101 85
Consumable: Stationery, printing and office supplies
528 (205) - 323 312 11 96.6 367 341
Operating leases 360 (142) - 218 216 2 99.1 243 242
Transport provided: Departmental activity
- - - - - - - 6 6
Travel and subsistence
855 60 - 915 869 46 95.0 1 236 1 204
Training and development
874 (268) - 606 564 42 93.1 686 680
Operating payments 1 872 501 - 2 373 2 367 6 99.7 2 532 2 521
Venues and facilities 181 (168) - 13 11 2 84.6 90 86
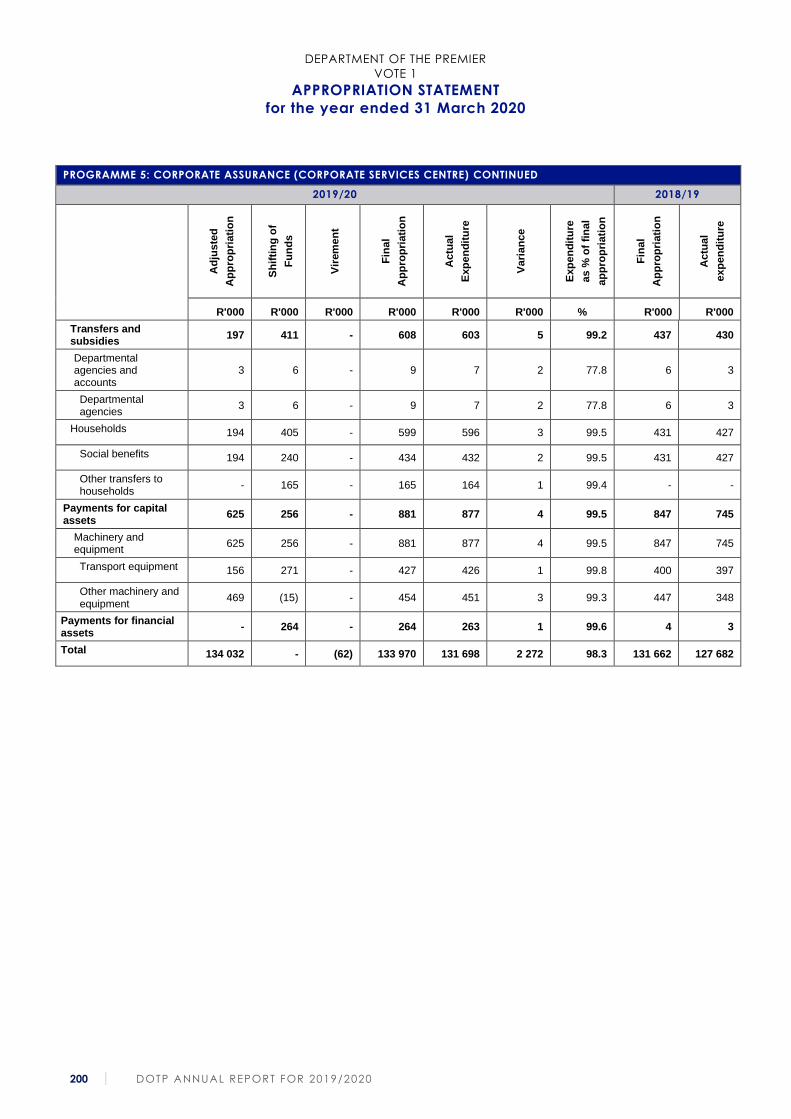
DEPARTMENT OF THE PREMIER
VOTE 1
APPROPRIATION STATEMENT
for the year ended 31 March 2020
200 DOTP ANNUAL REPORT FOR 2019/2020
PROGRAMME 5: CORPORATE ASSURANCE (CORPORATE SERVICES CENTRE) CONTINUED
2019/20 2018/19
Ad
jus
ted
Ap
pro
pri
ati
on
Sh
ifti
ng
of
Fu
nd
s
Vir
em
en
t
Fin
al
Ap
pro
pri
ati
on
Actu
al
Exp
en
dit
ure
Vari
an
ce
Exp
en
dit
ure
as %
of
fin
al
ap
pro
pri
ati
on
Fin
al
Ap
pro
pri
ati
on
Actu
al
exp
en
dit
ure
R'000 R'000 R'000 R'000 R'000 R'000 % R'000 R'000
Transfers and subsidies
197 411 - 608 603 5 99.2 437 430
Departmental agencies and accounts
3 6 - 9 7 2 77.8 6 3
Departmental agencies
3 6 - 9 7 2 77.8 6 3
Households 194 405 - 599 596 3 99.5 431 427
Social benefits 194 240 - 434 432 2 99.5 431 427
Other transfers to households
- 165 - 165 164 1 99.4 - -
Payments for capital assets
625 256 - 881 877 4 99.5 847 745
Machinery and equipment
625 256 - 881 877 4 99.5 847 745
Transport equipment 156 271 - 427 426 1 99.8 400 397
Other machinery and equipment
469 (15) - 454 451 3 99.3 447 348
Payments for financial assets
- 264 - 264 263 1 99.6 4 3
Total 134 032 - (62) 133 970 131 698 2 272 98.3 131 662 127 682
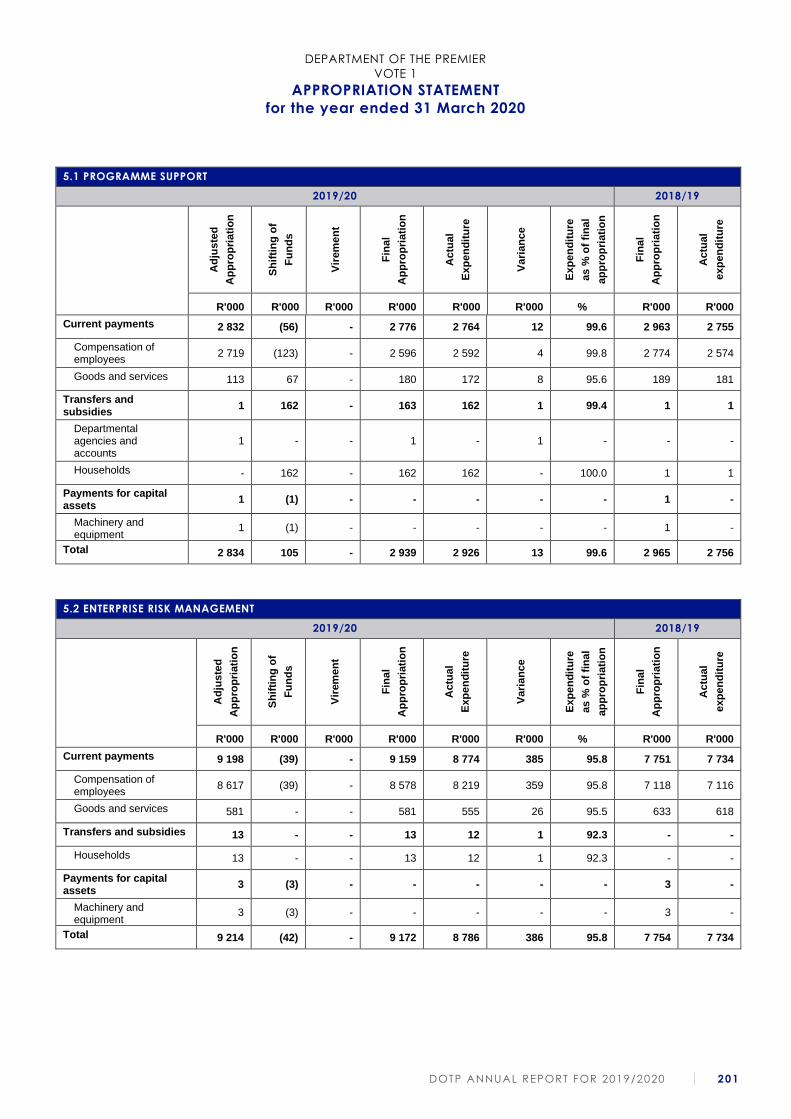
DEPARTMENT OF THE PREMIER
VOTE 1
APPROPRIATION STATEMENT
for the year ended 31 March 2020
DOTP ANNUAL REPORT FOR 2019/2020 201
5.1 PROGRAMME SUPPORT
2019/20 2018/19
Ad
jus
ted
Ap
pro
pri
ati
on
Sh
ifti
ng
of
Fu
nd
s
Vir
em
en
t
Fin
al
Ap
pro
pri
ati
on
Actu
al
Exp
en
dit
ure
Vari
an
ce
Exp
en
dit
ure
as %
of
fin
al
ap
pro
pri
ati
on
Fin
al
Ap
pro
pri
ati
on
Actu
al
exp
en
dit
ure
R'000 R'000 R'000 R'000 R'000 R'000 % R'000 R'000
Current payments 2 832 (56) - 2 776 2 764 12 99.6 2 963 2 755
Compensation of employees
2 719 (123) - 2 596 2 592 4 99.8 2 774 2 574
Goods and services 113 67 - 180 172 8 95.6 189 181
Transfers and subsidies
1 162 - 163 162 1 99.4 1 1
Departmental agencies and accounts
1 - - 1 - 1 - - -
Households - 162 - 162 162 - 100.0 1 1
Payments for capital assets
1 (1) - - - - - 1 -
Machinery and equipment
1 (1) - - - - - 1 -
Total 2 834 105 - 2 939 2 926 13 99.6 2 965 2 756
5.2 ENTERPRISE RISK MANAGEMENT
2019/20 2018/19
Ad
jus
ted
Ap
pro
pri
ati
on
Sh
ifti
ng
of
Fu
nd
s
Vir
em
en
t
Fin
al
Ap
pro
pri
ati
on
Actu
al
Exp
en
dit
ure
Vari
an
ce
Exp
en
dit
ure
as %
of
fin
al
ap
pro
pri
ati
on
Fin
al
Ap
pro
pri
ati
on
Actu
al
exp
en
dit
ure
R'000 R'000 R'000 R'000 R'000 R'000 % R'000 R'000
Current payments 9 198 (39) - 9 159 8 774 385 95.8 7 751 7 734
Compensation of employees
8 617 (39) - 8 578 8 219 359 95.8 7 118 7 116
Goods and services 581 - - 581 555 26 95.5 633 618
Transfers and subsidies 13 - - 13 12 1 92.3 - -
Households 13 - - 13 12 1 92.3 - -
Payments for capital assets
3 (3) - - - - - 3 -
Machinery and equipment
3 (3) - - - - - 3 -
Total 9 214 (42) - 9 172 8 786 386 95.8 7 754 7 734
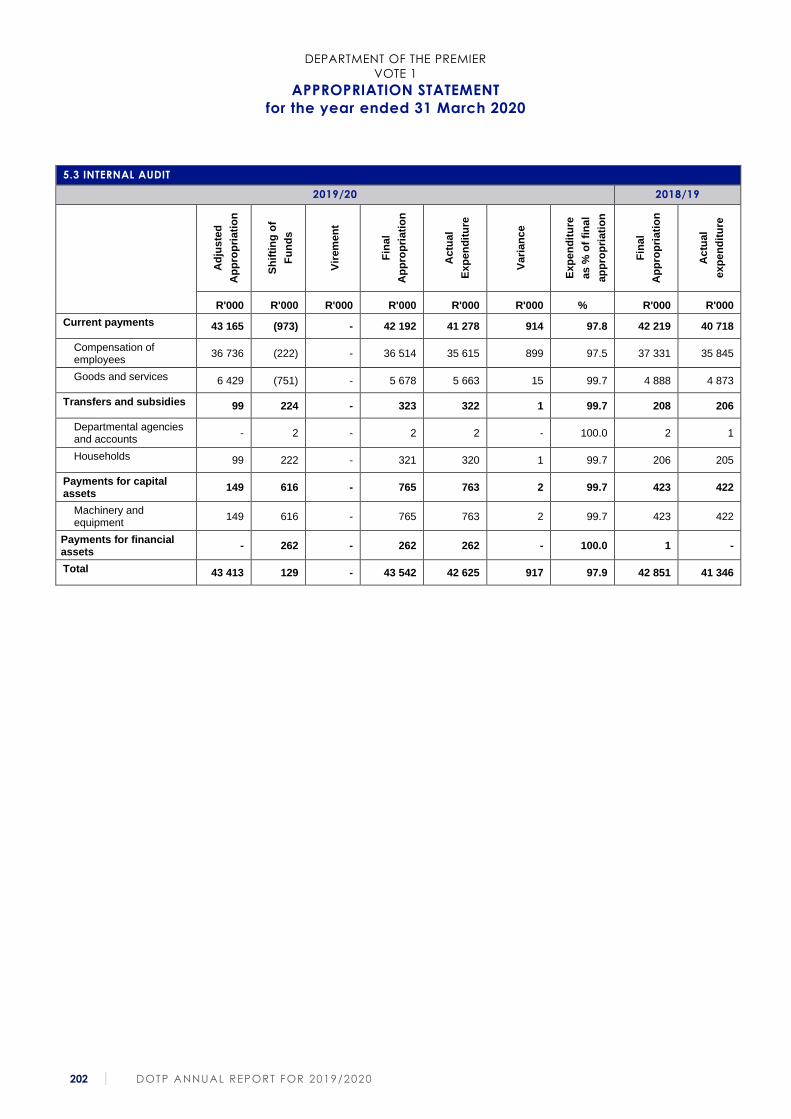
DEPARTMENT OF THE PREMIER
VOTE 1
APPROPRIATION STATEMENT
for the year ended 31 March 2020
202 DOTP ANNUAL REPORT FOR 2019/2020
5.3 INTERNAL AUDIT
2019/20 2018/19
Ad
jus
ted
Ap
pro
pri
ati
on
Sh
ifti
ng
of
Fu
nd
s
Vir
em
en
t
Fin
al
Ap
pro
pri
ati
on
Actu
al
Exp
en
dit
ure
Vari
an
ce
Exp
en
dit
ure
as %
of
fin
al
ap
pro
pri
ati
on
Fin
al
Ap
pro
pri
ati
on
Actu
al
exp
en
dit
ure
R'000 R'000 R'000 R'000 R'000 R'000 % R'000 R'000
Current payments 43 165 (973) - 42 192 41 278 914 97.8 42 219 40 718
Compensation of employees
36 736 (222) - 36 514 35 615 899 97.5 37 331 35 845
Goods and services 6 429 (751) - 5 678 5 663 15 99.7 4 888 4 873
Transfers and subsidies 99 224 - 323 322 1 99.7 208 206
Departmental agencies and accounts
- 2 - 2 2 - 100.0 2 1
Households 99 222 - 321 320 1 99.7 206 205
Payments for capital assets
149 616 - 765 763 2 99.7 423 422
Machinery and equipment
149 616 - 765 763 2 99.7 423 422
Payments for financial assets
- 262 - 262 262 - 100.0 1 -
Total 43 413 129 - 43 542 42 625 917 97.9 42 851 41 346
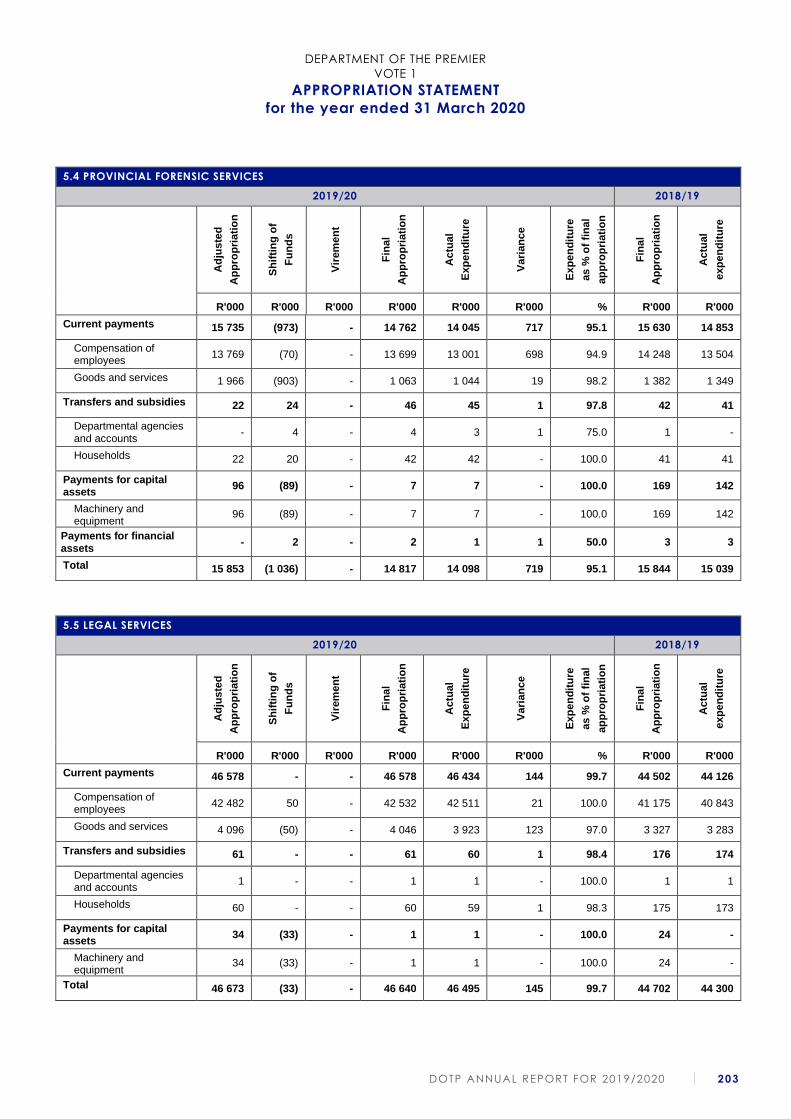
DEPARTMENT OF THE PREMIER
VOTE 1
APPROPRIATION STATEMENT
for the year ended 31 March 2020
DOTP ANNUAL REPORT FOR 2019/2020 203
5.4 PROVINCIAL FORENSIC SERVICES
2019/20 2018/19
Ad
jus
ted
Ap
pro
pri
ati
on
Sh
ifti
ng
of
Fu
nd
s
Vir
em
en
t
Fin
al
Ap
pro
pri
ati
on
Actu
al
Exp
en
dit
ure
Vari
an
ce
Exp
en
dit
ure
as %
of
fin
al
ap
pro
pri
ati
on
Fin
al
Ap
pro
pri
ati
on
Actu
al
exp
en
dit
ure
R'000 R'000 R'000 R'000 R'000 R'000 % R'000 R'000
Current payments 15 735 (973) - 14 762 14 045 717 95.1 15 630 14 853
Compensation of employees
13 769 (70) - 13 699 13 001 698 94.9 14 248 13 504
Goods and services 1 966 (903) - 1 063 1 044 19 98.2 1 382 1 349
Transfers and subsidies 22 24 - 46 45 1 97.8 42 41
Departmental agencies and accounts
- 4 - 4 3 1 75.0 1 -
Households 22 20 - 42 42 - 100.0 41 41
Payments for capital assets
96 (89) - 7 7 - 100.0 169 142
Machinery and equipment
96 (89) - 7 7 - 100.0 169 142
Payments for financial assets
- 2 - 2 1 1 50.0 3 3
Total 15 853 (1 036) - 14 817 14 098 719 95.1 15 844 15 039
5.5 LEGAL SERVICES
2019/20 2018/19
Ad
jus
ted
Ap
pro
pri
ati
on
Sh
ifti
ng
of
Fu
nd
s
Vir
em
en
t
Fin
al
Ap
pro
pri
ati
on
Actu
al
Exp
en
dit
ure
Vari
an
ce
Exp
en
dit
ure
as %
of
fin
al
ap
pro
pri
ati
on
Fin
al
Ap
pro
pri
ati
on
Actu
al
exp
en
dit
ure
R'000 R'000 R'000 R'000 R'000 R'000 % R'000 R'000
Current payments 46 578 - - 46 578 46 434 144 99.7 44 502 44 126
Compensation of employees
42 482 50 - 42 532 42 511 21 100.0 41 175 40 843
Goods and services 4 096 (50) - 4 046 3 923 123 97.0 3 327 3 283
Transfers and subsidies 61 - - 61 60 1 98.4 176 174
Departmental agencies and accounts
1 - - 1 1 - 100.0 1 1
Households 60 - - 60 59 1 98.3 175 173
Payments for capital assets
34 (33) - 1 1 - 100.0 24 -
Machinery and equipment
34 (33) - 1 1 - 100.0 24 -
Total 46 673 (33) - 46 640 46 495 145 99.7 44 702 44 300
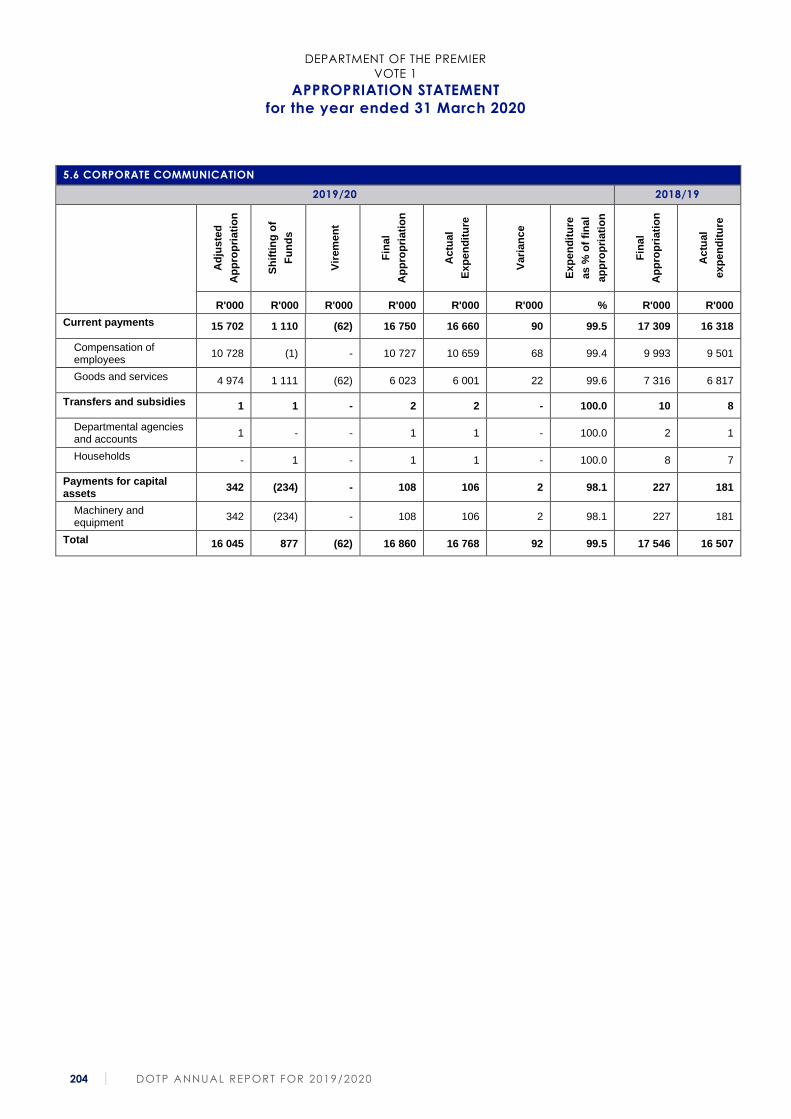
DEPARTMENT OF THE PREMIER
VOTE 1
APPROPRIATION STATEMENT
for the year ended 31 March 2020
204 DOTP ANNUAL REPORT FOR 2019/2020
5.6 CORPORATE COMMUNICATION
2019/20 2018/19
Ad
jus
ted
Ap
pro
pri
ati
on
Sh
ifti
ng
of
Fu
nd
s
Vir
em
en
t
Fin
al
Ap
pro
pri
ati
on
Actu
al
Exp
en
dit
ure
Vari
an
ce
Exp
en
dit
ure
as %
of
fin
al
ap
pro
pri
ati
on
Fin
al
Ap
pro
pri
ati
on
Actu
al
exp
en
dit
ure
R'000 R'000 R'000 R'000 R'000 R'000 % R'000 R'000
Current payments 15 702 1 110 (62) 16 750 16 660 90 99.5 17 309 16 318
Compensation of employees
10 728 (1) - 10 727 10 659 68 99.4 9 993 9 501
Goods and services 4 974 1 111 (62) 6 023 6 001 22 99.6 7 316 6 817
Transfers and subsidies 1 1 - 2 2 - 100.0 10 8
Departmental agencies and accounts
1 - - 1 1 - 100.0 2 1
Households - 1 - 1 1 - 100.0 8 7
Payments for capital assets
342 (234) - 108 106 2 98.1 227 181
Machinery and equipment
342 (234) - 108 106 2 98.1 227 181
Total 16 045 877 (62) 16 860 16 768 92 99.5 17 546 16 507

DEPARTMENT OF THE PREMIER
VOTE 1
NOTES TO THE APPROPRIATION STATEMENT
for the year ended 31 March 2020
DOTP ANNUAL REPORT FOR 2019/2020 205
1. Detail of transfers and subsidies as per Appropriation Act (after Virement):
Detail of these transactions can be viewed in note 6 (Transfers and subsidies) and Annexure
1-3 to the Annual Financial Statements.
2. Detail of specifically and exclusively appropriated amounts voted (after Virement):
Detail of these transactions can be viewed in note 1 (Annual Appropriation) to the Annual
Financial Statements.
3. Detail on payments for financial assets
Detail of these transactions per programme can be viewed in note 5 (Payments for financial
assets) to the Annual Financial Statements.
4. Explanations of material variances from Amounts Voted (after Virement):
4.1 Per programme Final
Appropriation
Actual
Expenditure
Variance R’000 Variance as a
% of Final
Appropriation
Executive Governance and
Integration (Administration) 108 112 105 659 2 453 2.27
Provincial Strategic Management 61 927 57 521 4 406 7.11
People Management (CSC) 208 061 201 606 6 455 3.10
Centre for e-Innovation (CSC) 1 070 718 1 064 547 6 171 0.58
Corporate Assurance (CSC) 133 970 131 698 2 272 1.70
Total 1 582 788 1 561 031 21 757 1.38
Underspending under Executive Governance and Integration (Administration) is mainly due
to staff exits.
Underspending under Provincial Strategic Management is mainly due to staff exits and
certain projects and events not materialising as planned.
Underspending under People Management is mainly due to staff exits and the compulsory
saving with regard to the Enterprise Content Management: Change Management project
due to the contract starting later than anticipated.
Underspending under Centre for e-Innovation is mainly due to staff exits, the cancelled bid
process in respect of IT Security and Cyber Strategy services and delays with the ECM project
due to the finalisation of cross departmental funding arrangements which led to a delay in
the publishing of the tender.
Underspending under Corporate Assurance is mainly due to staff exits.
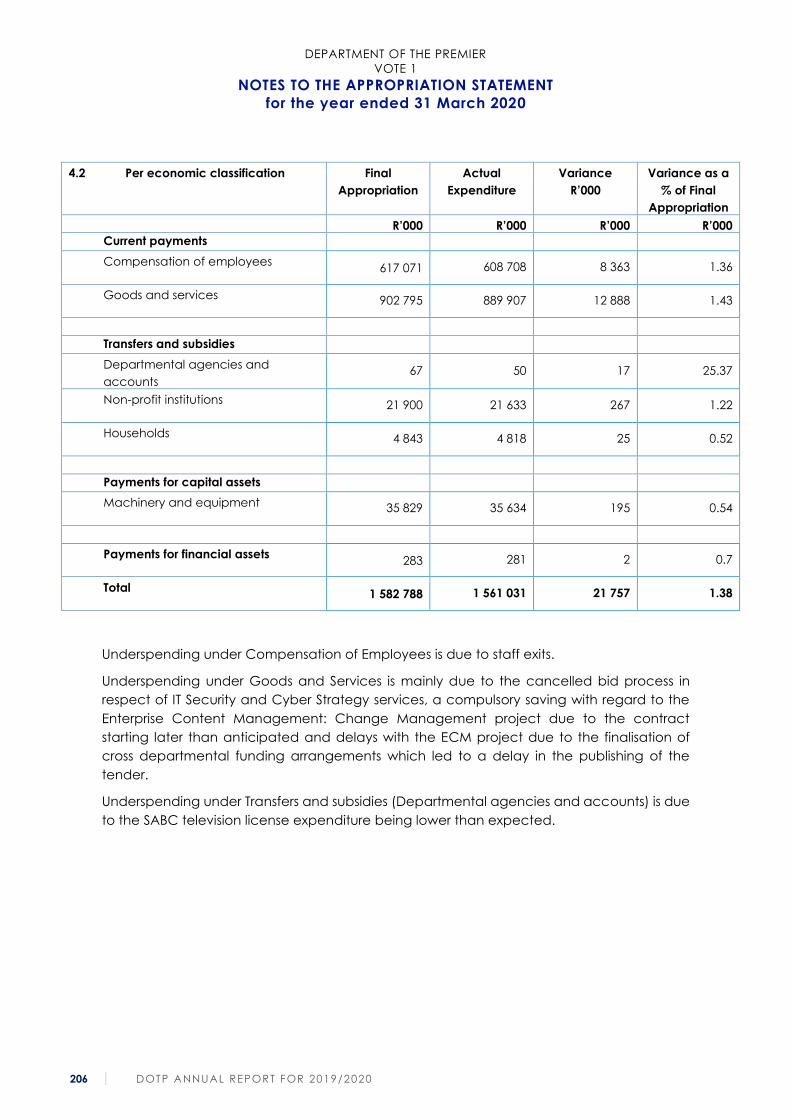
DEPARTMENT OF THE PREMIER
VOTE 1
NOTES TO THE APPROPRIATION STATEMENT
for the year ended 31 March 2020
206 DOTP ANNUAL REPORT FOR 2019/2020
4.2 Per economic classification Final
Appropriation
Actual
Expenditure
Variance
R’000
Variance as a
% of Final
Appropriation
R’000 R’000 R’000 R’000
Current payments
Compensation of employees 617 071 608 708 8 363 1.36
Goods and services 902 795 889 907 12 888 1.43
Transfers and subsidies
Departmental agencies and
accounts 67 50 17 25.37
Non-profit institutions 21 900 21 633 267 1.22
Households 4 843 4 818 25 0.52
Payments for capital assets
Machinery and equipment 35 829 35 634 195 0.54
Payments for financial assets 283 281 2 0.7
Total 1 582 788 1 561 031 21 757 1.38
Underspending under Compensation of Employees is due to staff exits.
Underspending under Goods and Services is mainly due to the cancelled bid process in
respect of IT Security and Cyber Strategy services, a compulsory saving with regard to the
Enterprise Content Management: Change Management project due to the contract
starting later than anticipated and delays with the ECM project due to the finalisation of
cross departmental funding arrangements which led to a delay in the publishing of the
tender.
Underspending under Transfers and subsidies (Departmental agencies and accounts) is due
to the SABC television license expenditure being lower than expected.
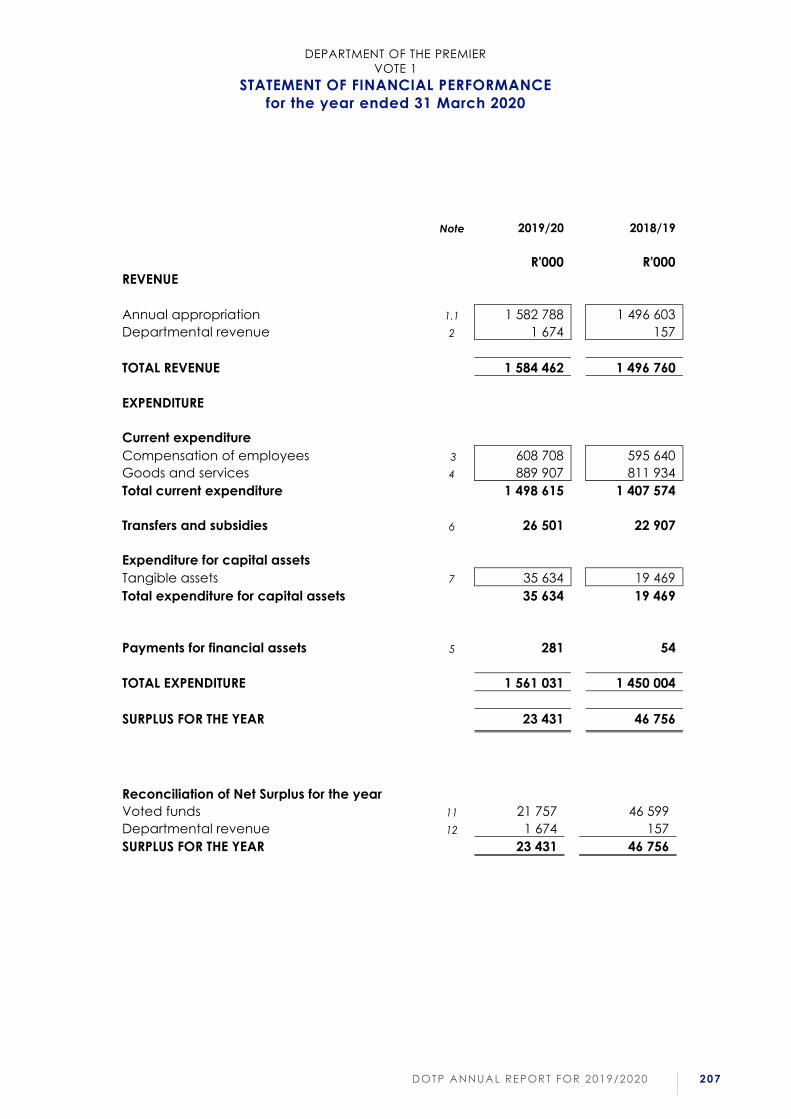
DEPARTMENT OF THE PREMIER
VOTE 1
STATEMENT OF FINANCIAL PERFORMANCE
for the year ended 31 March 2020
DOTP ANNUAL REPORT FOR 2019/2020 207
Note 2019/20 2018/19
R'000 R'000
REVENUE
Annual appropriation 1.1 1 582 788 1 496 603
Departmental revenue 2 1 674 157
TOTAL REVENUE 1 584 462 1 496 760
EXPENDITURE
Current expenditure
Compensation of employees 3 608 708 595 640
Goods and services 4 889 907 811 934
Total current expenditure 1 498 615 1 407 574
Transfers and subsidies 6 26 501 22 907
Expenditure for capital assets
Tangible assets 7 35 634 19 469
Total expenditure for capital assets 35 634 19 469
Payments for financial assets 5 281 54
TOTAL EXPENDITURE 1 561 031 1 450 004
SURPLUS FOR THE YEAR 23 431 46 756
Reconciliation of Net Surplus for the year
Voted funds 11 21 757 46 599
Departmental revenue 12 1 674 157
SURPLUS FOR THE YEAR 23 431 46 756
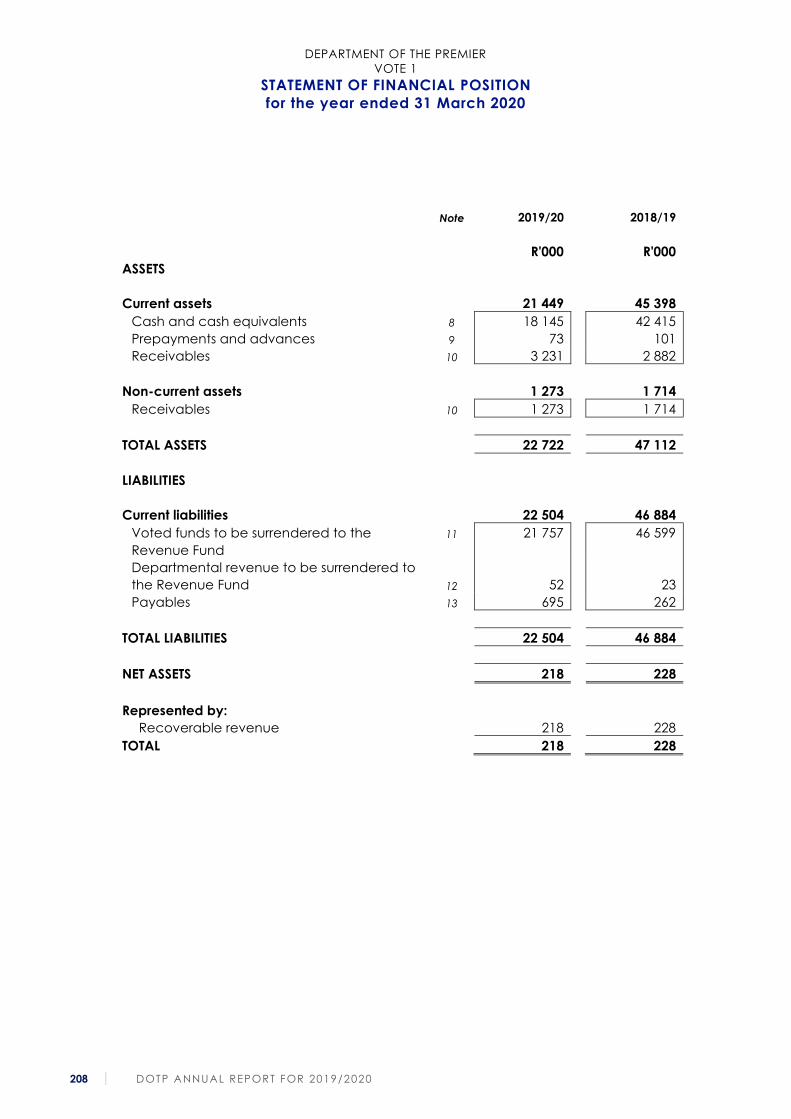
DEPARTMENT OF THE PREMIER
VOTE 1
STATEMENT OF FINANCIAL POSITION
for the year ended 31 March 2020
208 DOTP ANNUAL REPORT FOR 2019/2020
Note 2019/20 2018/19
R'000 R'000
ASSETS
Current assets 21 449 45 398
Cash and cash equivalents 8 18 145 42 415
Prepayments and advances 9 73 101
Receivables 10 3 231 2 882
Non-current assets 1 273 1 714
Receivables 10 1 273 1 714
TOTAL ASSETS 22 722 47 112
LIABILITIES
Current liabilities 22 504 46 884
Voted funds to be surrendered to the
Revenue Fund
11 21 757 46 599
Departmental revenue to be surrendered to
the Revenue Fund
12
52
23
Payables 13 695 262
TOTAL LIABILITIES 22 504 46 884
NET ASSETS 218 228
Represented by:
Recoverable revenue 218 228
TOTAL 218 228
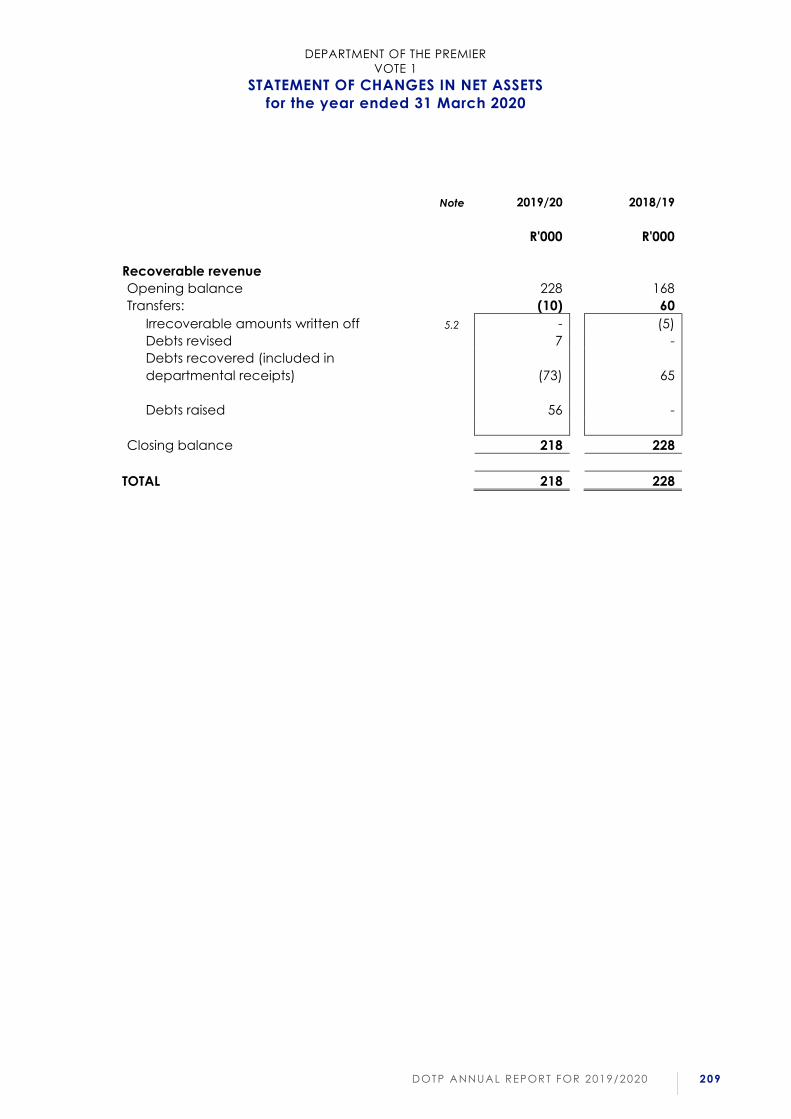
DEPARTMENT OF THE PREMIER
VOTE 1
STATEMENT OF CHANGES IN NET ASSETS
for the year ended 31 March 2020
DOTP ANNUAL REPORT FOR 2019/2020 209
Note 2019/20 2018/19
R'000 R'000
Recoverable revenue
Opening balance 228 168
Transfers: (10) 60
Irrecoverable amounts written off 5.2 - (5)
Debts revised 7 -
Debts recovered (included in
departmental receipts)
(73)
65
Debts raised 56 -
Closing balance 218 228
TOTAL 218 228
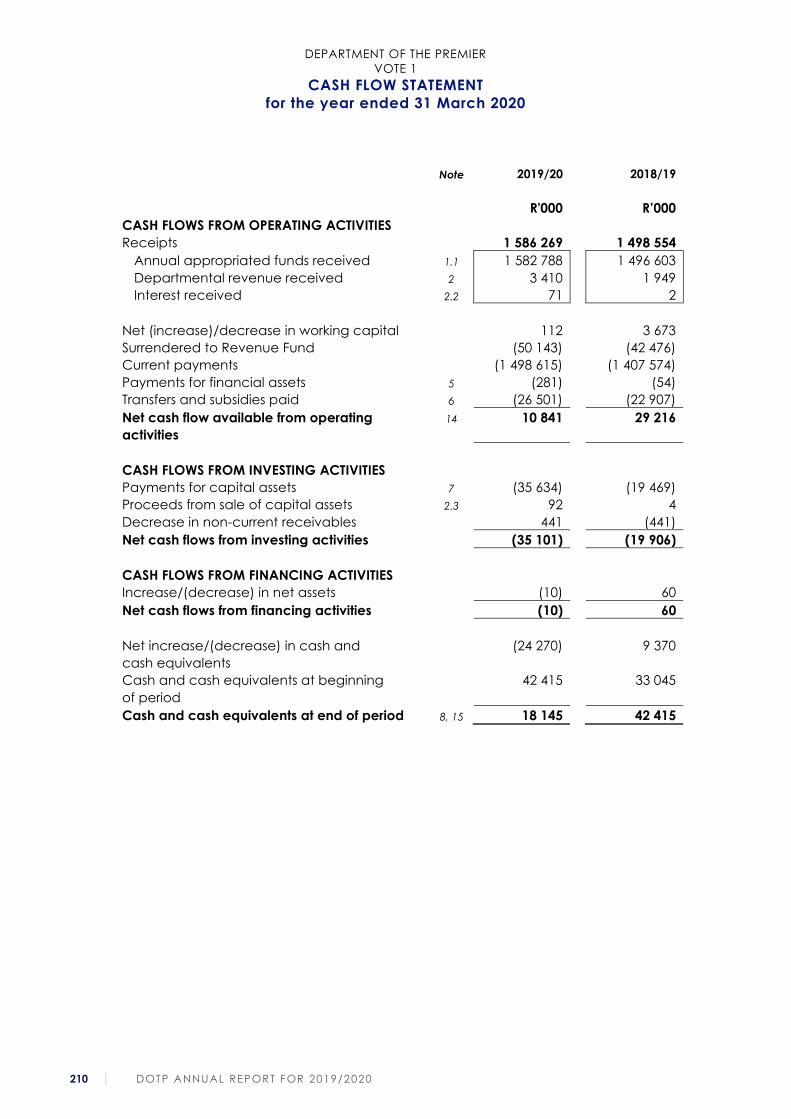
DEPARTMENT OF THE PREMIER
VOTE 1
CASH FLOW STATEMENT
for the year ended 31 March 2020
210 DOTP ANNUAL REPORT FOR 2019/2020
Note 2019/20 2018/19
R'000 R’000
CASH FLOWS FROM OPERATING ACTIVITIES
Receipts 1 586 269 1 498 554
Annual appropriated funds received 1.1 1 582 788 1 496 603
Departmental revenue received 2 3 410 1 949
Interest received 2.2 71 2
Net (increase)/decrease in working capital 112 3 673
Surrendered to Revenue Fund (50 143) (42 476)
Current payments (1 498 615) (1 407 574)
Payments for financial assets 5 (281) (54)
Transfers and subsidies paid 6 (26 501) (22 907)
Net cash flow available from operating
activities
14 10 841 29 216
CASH FLOWS FROM INVESTING ACTIVITIES
Payments for capital assets 7 (35 634) (19 469)
Proceeds from sale of capital assets 2.3 92 4
Decrease in non-current receivables 441 (441)
Net cash flows from investing activities (35 101) (19 906)
CASH FLOWS FROM FINANCING ACTIVITIES
Increase/(decrease) in net assets (10) 60
Net cash flows from financing activities (10) 60
Net increase/(decrease) in cash and
cash equivalents
(24 270) 9 370
Cash and cash equivalents at beginning
of period
42 415 33 045
Cash and cash equivalents at end of period 8, 15 18 145 42 415
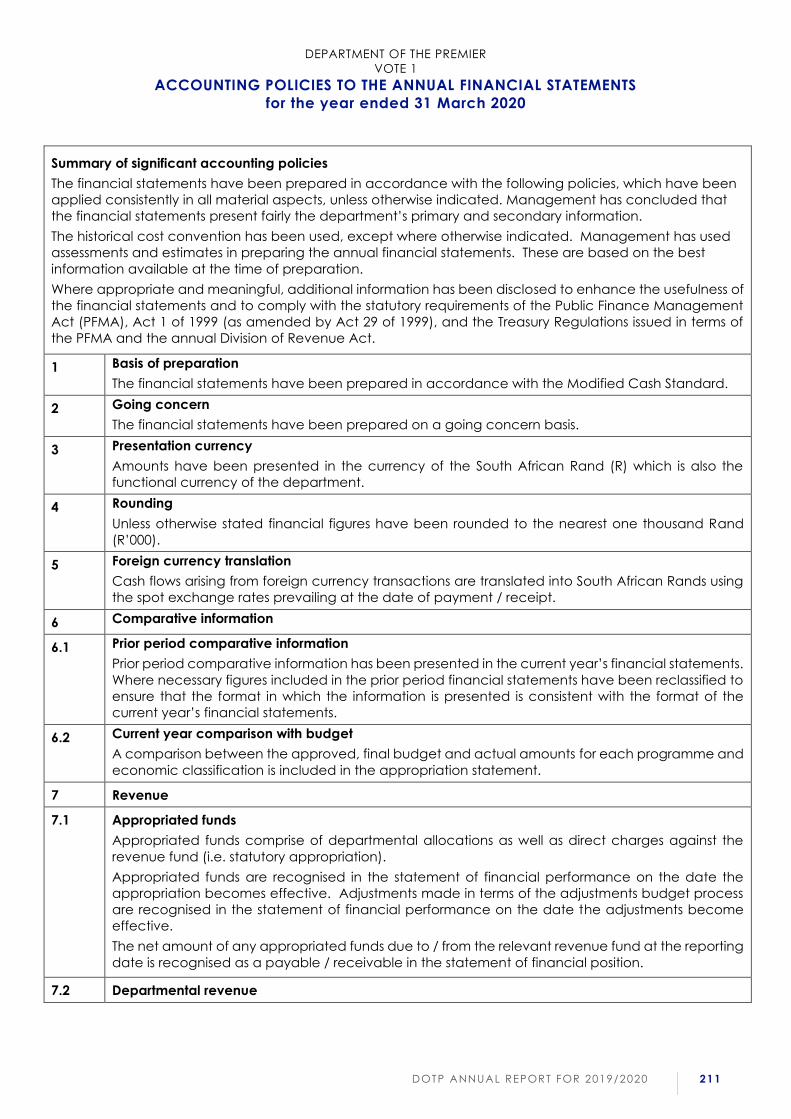
DEPARTMENT OF THE PREMIER
VOTE 1
ACCOUNTING POLICIES TO THE ANNUAL FINANCIAL STATEMENTS
for the year ended 31 March 2020
DOTP ANNUAL REPORT FOR 2019/2020 211
Summary of significant accounting policies
The financial statements have been prepared in accordance with the following policies, which have been
applied consistently in all material aspects, unless otherwise indicated. Management has concluded that
the financial statements present fairly the department’s primary and secondary information.
The historical cost convention has been used, except where otherwise indicated. Management has used
assessments and estimates in preparing the annual financial statements. These are based on the best
information available at the time of preparation.
Where appropriate and meaningful, additional information has been disclosed to enhance the usefulness of
the financial statements and to comply with the statutory requirements of the Public Finance Management
Act (PFMA), Act 1 of 1999 (as amended by Act 29 of 1999), and the Treasury Regulations issued in terms of
the PFMA and the annual Division of Revenue Act.
1 Basis of preparation
The financial statements have been prepared in accordance with the Modified Cash Standard.
2 Going concern
The financial statements have been prepared on a going concern basis.
3 Presentation currency
Amounts have been presented in the currency of the South African Rand (R) which is also the
functional currency of the department.
4 Rounding
Unless otherwise stated financial figures have been rounded to the nearest one thousand Rand
(R’000).
5 Foreign currency translation
Cash flows arising from foreign currency transactions are translated into South African Rands using
the spot exchange rates prevailing at the date of payment / receipt.
6 Comparative information
6.1 Prior period comparative information
Prior period comparative information has been presented in the current year’s financial statements.
Where necessary figures included in the prior period financial statements have been reclassified to
ensure that the format in which the information is presented is consistent with the format of the
current year’s financial statements.
6.2 Current year comparison with budget
A comparison between the approved, final budget and actual amounts for each programme and
economic classification is included in the appropriation statement.
7 Revenue
7.1 Appropriated funds
Appropriated funds comprise of departmental allocations as well as direct charges against the
revenue fund (i.e. statutory appropriation).
Appropriated funds are recognised in the statement of financial performance on the date the
appropriation becomes effective. Adjustments made in terms of the adjustments budget process
are recognised in the statement of financial performance on the date the adjustments become
effective.
The net amount of any appropriated funds due to / from the relevant revenue fund at the reporting
date is recognised as a payable / receivable in the statement of financial position.
7.2 Departmental revenue
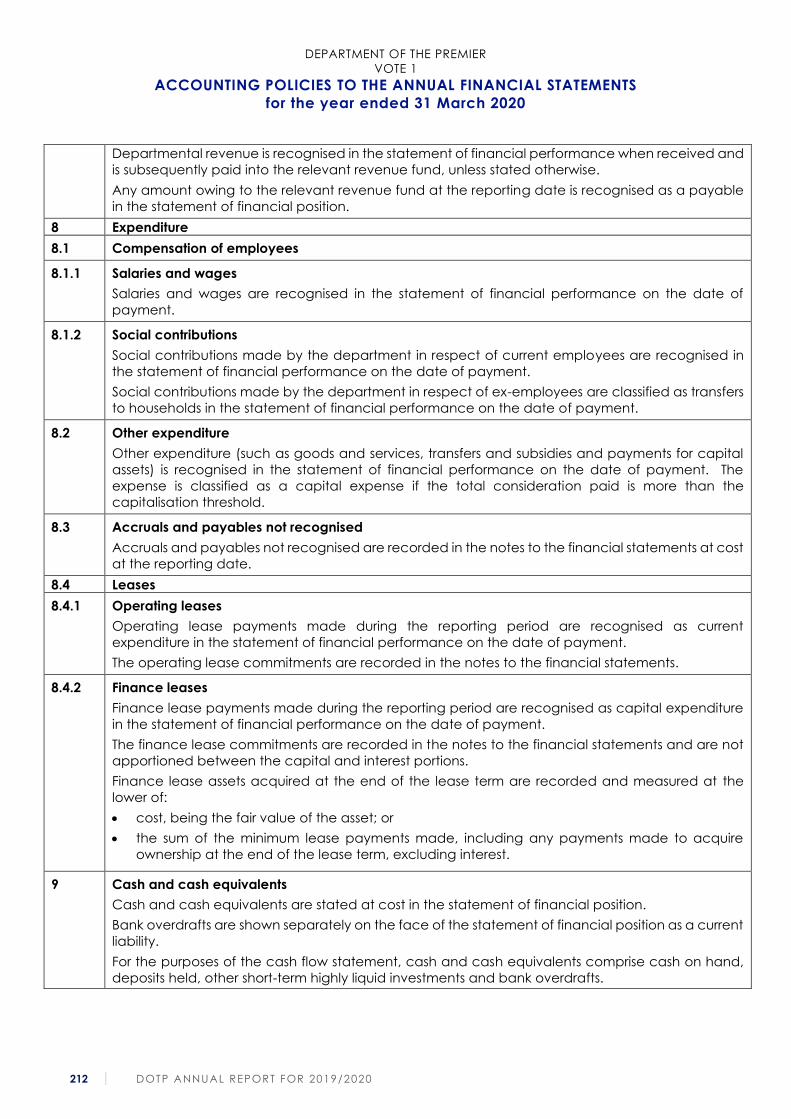
DEPARTMENT OF THE PREMIER
VOTE 1
ACCOUNTING POLICIES TO THE ANNUAL FINANCIAL STATEMENTS
for the year ended 31 March 2020
212 DOTP ANNUAL REPORT FOR 2019/2020
Departmental revenue is recognised in the statement of financial performance when received and
is subsequently paid into the relevant revenue fund, unless stated otherwise.
Any amount owing to the relevant revenue fund at the reporting date is recognised as a payable
in the statement of financial position.
8 Expenditure
8.1 Compensation of employees
8.1.1 Salaries and wages
Salaries and wages are recognised in the statement of financial performance on the date of
payment.
8.1.2 Social contributions
Social contributions made by the department in respect of current employees are recognised in
the statement of financial performance on the date of payment.
Social contributions made by the department in respect of ex-employees are classified as transfers
to households in the statement of financial performance on the date of payment.
8.2 Other expenditure
Other expenditure (such as goods and services, transfers and subsidies and payments for capital
assets) is recognised in the statement of financial performance on the date of payment. The
expense is classified as a capital expense if the total consideration paid is more than the
capitalisation threshold.
8.3 Accruals and payables not recognised
Accruals and payables not recognised are recorded in the notes to the financial statements at cost
at the reporting date.
8.4 Leases
8.4.1 Operating leases
Operating lease payments made during the reporting period are recognised as current
expenditure in the statement of financial performance on the date of payment.
The operating lease commitments are recorded in the notes to the financial statements.
8.4.2 Finance leases
Finance lease payments made during the reporting period are recognised as capital expenditure
in the statement of financial performance on the date of payment.
The finance lease commitments are recorded in the notes to the financial statements and are not
apportioned between the capital and interest portions.
Finance lease assets acquired at the end of the lease term are recorded and measured at the
lower of:
• cost, being the fair value of the asset; or
• the sum of the minimum lease payments made, including any payments made to acquire
ownership at the end of the lease term, excluding interest.
9 Cash and cash equivalents
Cash and cash equivalents are stated at cost in the statement of financial position.
Bank overdrafts are shown separately on the face of the statement of financial position as a current
liability.
For the purposes of the cash flow statement, cash and cash equivalents comprise cash on hand,
deposits held, other short-term highly liquid investments and bank overdrafts.
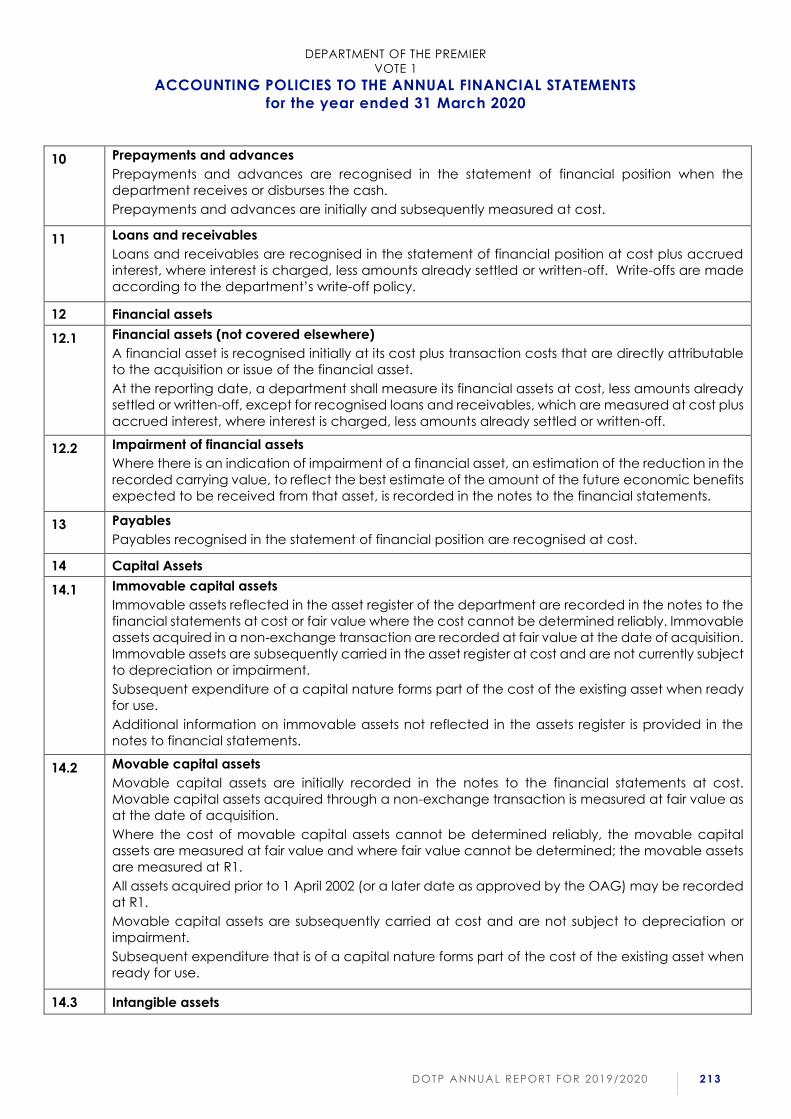
DEPARTMENT OF THE PREMIER
VOTE 1
ACCOUNTING POLICIES TO THE ANNUAL FINANCIAL STATEMENTS
for the year ended 31 March 2020
DOTP ANNUAL REPORT FOR 2019/2020 213
10 Prepayments and advances
Prepayments and advances are recognised in the statement of financial position when the
department receives or disburses the cash.
Prepayments and advances are initially and subsequently measured at cost.
11 Loans and receivables
Loans and receivables are recognised in the statement of financial position at cost plus accrued
interest, where interest is charged, less amounts already settled or written-off. Write-offs are made
according to the department’s write-off policy.
12 Financial assets
12.1 Financial assets (not covered elsewhere)
A financial asset is recognised initially at its cost plus transaction costs that are directly attributable
to the acquisition or issue of the financial asset.
At the reporting date, a department shall measure its financial assets at cost, less amounts already
settled or written-off, except for recognised loans and receivables, which are measured at cost plus
accrued interest, where interest is charged, less amounts already settled or written-off.
12.2 Impairment of financial assets
Where there is an indication of impairment of a financial asset, an estimation of the reduction in the
recorded carrying value, to reflect the best estimate of the amount of the future economic benefits
expected to be received from that asset, is recorded in the notes to the financial statements.
13 Payables
Payables recognised in the statement of financial position are recognised at cost.
14 Capital Assets
14.1 Immovable capital assets
Immovable assets reflected in the asset register of the department are recorded in the notes to the
financial statements at cost or fair value where the cost cannot be determined reliably. Immovable
assets acquired in a non-exchange transaction are recorded at fair value at the date of acquisition.
Immovable assets are subsequently carried in the asset register at cost and are not currently subject
to depreciation or impairment.
Subsequent expenditure of a capital nature forms part of the cost of the existing asset when ready
for use.
Additional information on immovable assets not reflected in the assets register is provided in the
notes to financial statements.
14.2 Movable capital assets
Movable capital assets are initially recorded in the notes to the financial statements at cost.
Movable capital assets acquired through a non-exchange transaction is measured at fair value as
at the date of acquisition.
Where the cost of movable capital assets cannot be determined reliably, the movable capital
assets are measured at fair value and where fair value cannot be determined; the movable assets
are measured at R1.
All assets acquired prior to 1 April 2002 (or a later date as approved by the OAG) may be recorded
at R1.
Movable capital assets are subsequently carried at cost and are not subject to depreciation or
impairment.
Subsequent expenditure that is of a capital nature forms part of the cost of the existing asset when
ready for use.
14.3 Intangible assets
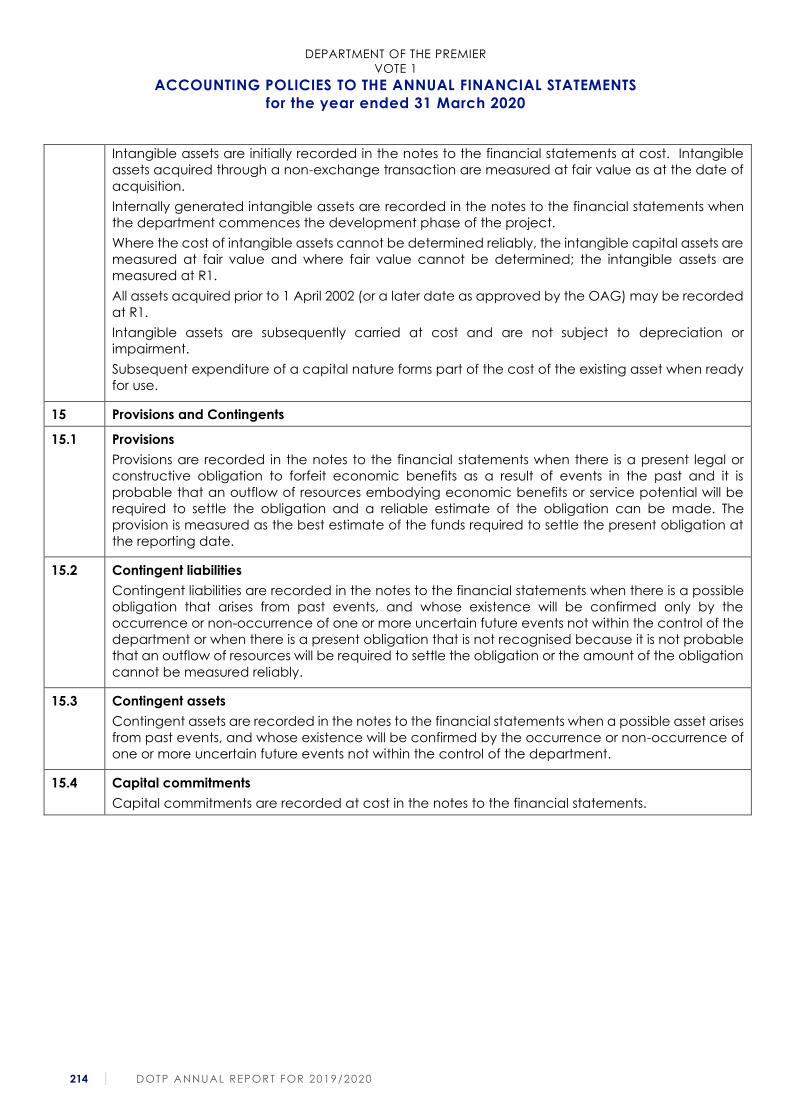
DEPARTMENT OF THE PREMIER
VOTE 1
ACCOUNTING POLICIES TO THE ANNUAL FINANCIAL STATEMENTS
for the year ended 31 March 2020
214 DOTP ANNUAL REPORT FOR 2019/2020
Intangible assets are initially recorded in the notes to the financial statements at cost. Intangible
assets acquired through a non-exchange transaction are measured at fair value as at the date of
acquisition.
Internally generated intangible assets are recorded in the notes to the financial statements when
the department commences the development phase of the project.
Where the cost of intangible assets cannot be determined reliably, the intangible capital assets are
measured at fair value and where fair value cannot be determined; the intangible assets are
measured at R1.
All assets acquired prior to 1 April 2002 (or a later date as approved by the OAG) may be recorded
at R1.
Intangible assets are subsequently carried at cost and are not subject to depreciation or
impairment.
Subsequent expenditure of a capital nature forms part of the cost of the existing asset when ready
for use.
15 Provisions and Contingents
15.1 Provisions
Provisions are recorded in the notes to the financial statements when there is a present legal or
constructive obligation to forfeit economic benefits as a result of events in the past and it is
probable that an outflow of resources embodying economic benefits or service potential will be
required to settle the obligation and a reliable estimate of the obligation can be made. The
provision is measured as the best estimate of the funds required to settle the present obligation at
the reporting date.
15.2 Contingent liabilities
Contingent liabilities are recorded in the notes to the financial statements when there is a possible
obligation that arises from past events, and whose existence will be confirmed only by the
occurrence or non-occurrence of one or more uncertain future events not within the control of the
department or when there is a present obligation that is not recognised because it is not probable
that an outflow of resources will be required to settle the obligation or the amount of the obligation
cannot be measured reliably.
15.3 Contingent assets
Contingent assets are recorded in the notes to the financial statements when a possible asset arises
from past events, and whose existence will be confirmed by the occurrence or non-occurrence of
one or more uncertain future events not within the control of the department.
15.4 Capital commitments
Capital commitments are recorded at cost in the notes to the financial statements.
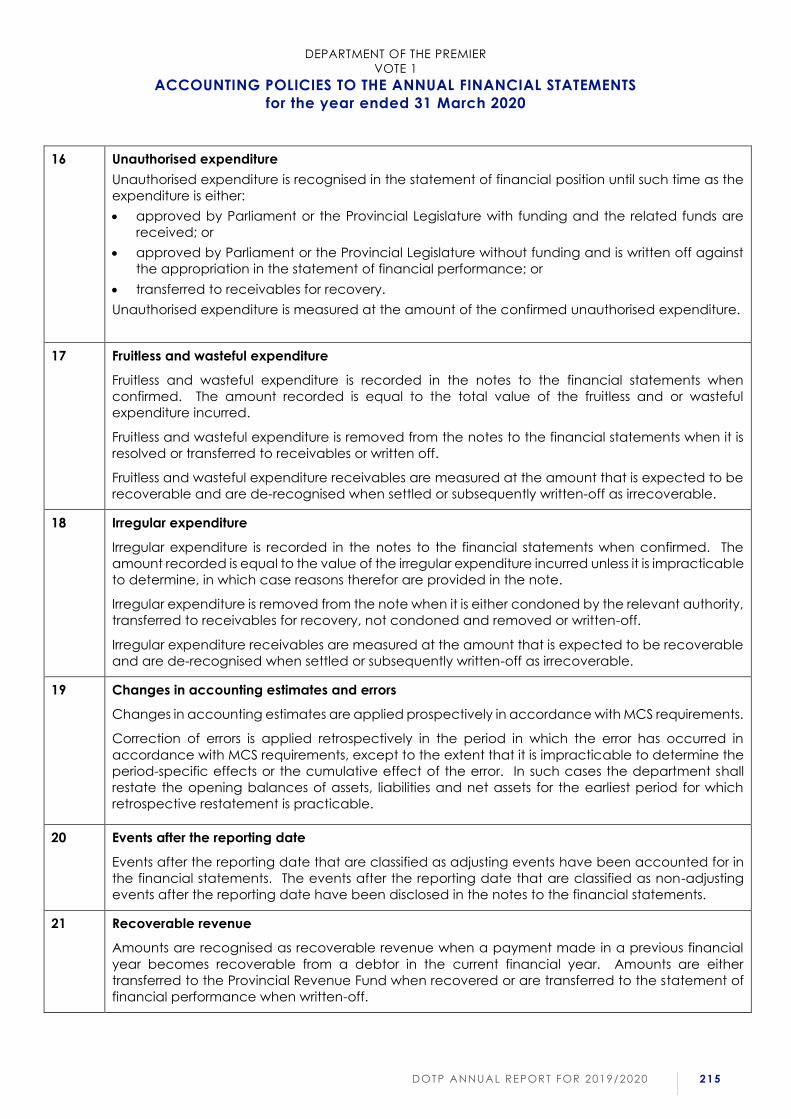
DEPARTMENT OF THE PREMIER
VOTE 1
ACCOUNTING POLICIES TO THE ANNUAL FINANCIAL STATEMENTS
for the year ended 31 March 2020
DOTP ANNUAL REPORT FOR 2019/2020 215
16 Unauthorised expenditure
Unauthorised expenditure is recognised in the statement of financial position until such time as the
expenditure is either:
• approved by Parliament or the Provincial Legislature with funding and the related funds are
received; or
• approved by Parliament or the Provincial Legislature without funding and is written off against
the appropriation in the statement of financial performance; or
• transferred to receivables for recovery.
Unauthorised expenditure is measured at the amount of the confirmed unauthorised expenditure.
17 Fruitless and wasteful expenditure
Fruitless and wasteful expenditure is recorded in the notes to the financial statements when
confirmed. The amount recorded is equal to the total value of the fruitless and or wasteful
expenditure incurred.
Fruitless and wasteful expenditure is removed from the notes to the financial statements when it is
resolved or transferred to receivables or written off.
Fruitless and wasteful expenditure receivables are measured at the amount that is expected to be
recoverable and are de-recognised when settled or subsequently written-off as irrecoverable.
18 Irregular expenditure
Irregular expenditure is recorded in the notes to the financial statements when confirmed. The
amount recorded is equal to the value of the irregular expenditure incurred unless it is impracticable
to determine, in which case reasons therefor are provided in the note.
Irregular expenditure is removed from the note when it is either condoned by the relevant authority,
transferred to receivables for recovery, not condoned and removed or written-off.
Irregular expenditure receivables are measured at the amount that is expected to be recoverable
and are de-recognised when settled or subsequently written-off as irrecoverable.
19 Changes in accounting estimates and errors
Changes in accounting estimates are applied prospectively in accordance with MCS requirements.
Correction of errors is applied retrospectively in the period in which the error has occurred in
accordance with MCS requirements, except to the extent that it is impracticable to determine the
period-specific effects or the cumulative effect of the error. In such cases the department shall
restate the opening balances of assets, liabilities and net assets for the earliest period for which
retrospective restatement is practicable.
20 Events after the reporting date
Events after the reporting date that are classified as adjusting events have been accounted for in
the financial statements. The events after the reporting date that are classified as non-adjusting
events after the reporting date have been disclosed in the notes to the financial statements.
21 Recoverable revenue
Amounts are recognised as recoverable revenue when a payment made in a previous financial
year becomes recoverable from a debtor in the current financial year. Amounts are either
transferred to the Provincial Revenue Fund when recovered or are transferred to the statement of
financial performance when written-off.
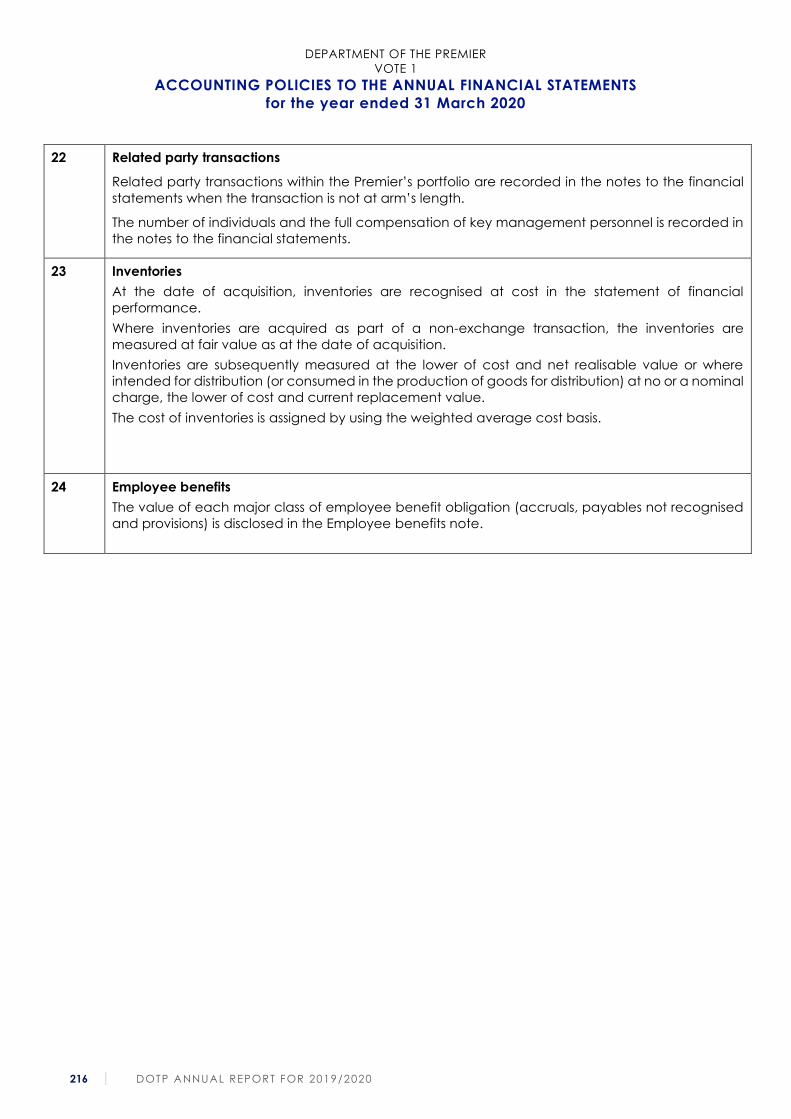
DEPARTMENT OF THE PREMIER
VOTE 1
ACCOUNTING POLICIES TO THE ANNUAL FINANCIAL STATEMENTS
for the year ended 31 March 2020
216 DOTP ANNUAL REPORT FOR 2019/2020
22 Related party transactions
Related party transactions within the Premier’s portfolio are recorded in the notes to the financial
statements when the transaction is not at arm’s length.
The number of individuals and the full compensation of key management personnel is recorded in
the notes to the financial statements.
23 Inventories
At the date of acquisition, inventories are recognised at cost in the statement of financial
performance.
Where inventories are acquired as part of a non-exchange transaction, the inventories are
measured at fair value as at the date of acquisition.
Inventories are subsequently measured at the lower of cost and net realisable value or where
intended for distribution (or consumed in the production of goods for distribution) at no or a nominal
charge, the lower of cost and current replacement value.
The cost of inventories is assigned by using the weighted average cost basis.
24 Employee benefits
The value of each major class of employee benefit obligation (accruals, payables not recognised
and provisions) is disclosed in the Employee benefits note.
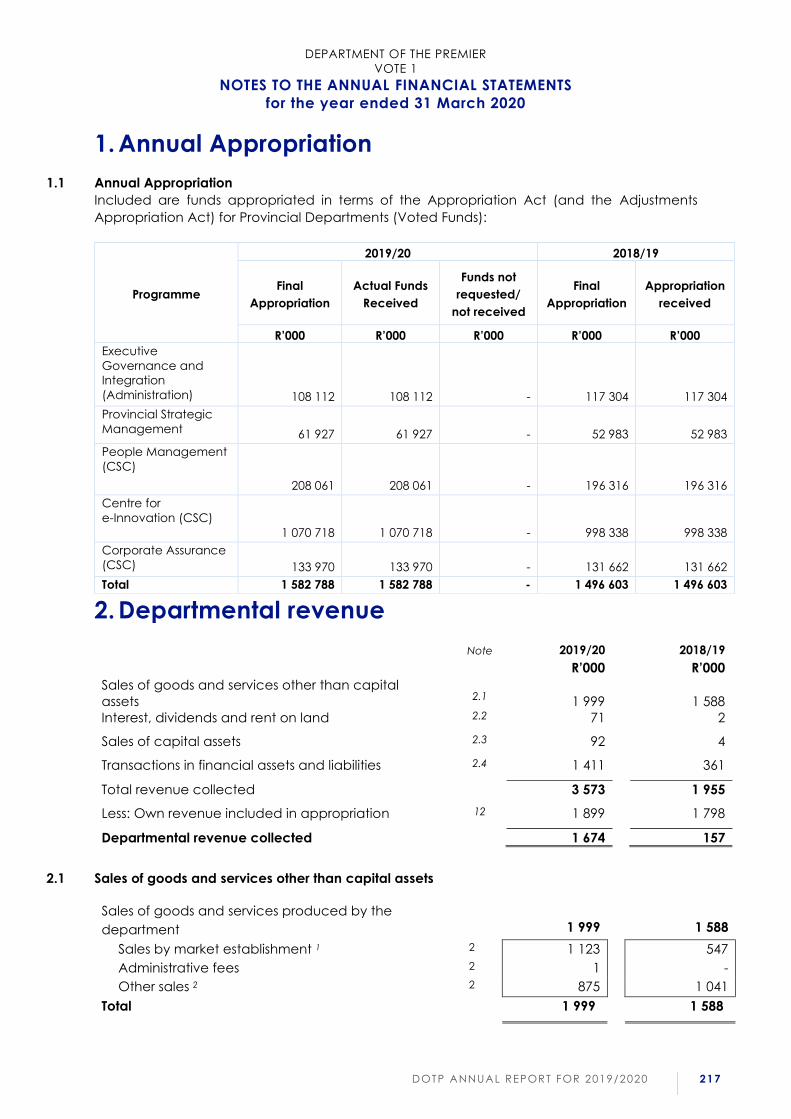
DEPARTMENT OF THE PREMIER
VOTE 1
NOTES TO THE ANNUAL FINANCIAL STATEMENTS
for the year ended 31 March 2020
DOTP ANNUAL REPORT FOR 2019/2020 217
1. Annual Appropriation
1.1 Annual Appropriation
Included are funds appropriated in terms of the Appropriation Act (and the Adjustments
Appropriation Act) for Provincial Departments (Voted Funds):
2. Departmental revenue
Note 2019/20 2018/19
R’000 R’000
Sales of goods and services other than capital
assets
2.1
1 999
1 588
Interest, dividends and rent on land 2.2 71 2
Sales of capital assets 2.3 92 4
Transactions in financial assets and liabilities 2.4 1 411 361
Total revenue collected 3 573 1 955
Less: Own revenue included in appropriation 12 1 899 1 798
Departmental revenue collected 1 674 157
2.1 Sales of goods and services other than capital assets
Sales of goods and services produced by the
department
1 999
1 588
Sales by market establishment 1 2 1 123 547
Administrative fees 2 1 -
Other sales 2 2 875 1 041
Total 1 999 1 588
Programme
2019/20 2018/19
Final
Appropriation
Actual Funds
Received
Funds not
requested/
not received
Final
Appropriation
Appropriation
received
R’000 R’000 R’000 R’000 R’000
Executive
Governance and
Integration
(Administration) 108 112 108 112 -
117 304
117 304
Provincial Strategic
Management 61 927 61 927 -
52 983 52 983
People Management
(CSC)
208 061 208 061 -
196 316
196 316
Centre for
e-Innovation (CSC)
1 070 718 1 070 718 -
998 338 998 338
Corporate Assurance
(CSC) 133 970 133 970 -
131 662
131 662
Total 1 582 788 1 582 788 - 1 496 603 1 496 603

DEPARTMENT OF THE PREMIER
VOTE 1
NOTES TO THE ANNUAL FINANCIAL STATEMENTS
for the year ended 31 March 2020
218 DOTP ANNUAL REPORT FOR 2019/2020
1. Increase is linked to the usage of venues and facilities at the Provincial Training Institute (PTI).
2. Includes amongst other commission on insurance received (R0,10m) and sales related to the
publication of the Provincial Government Gazette (R0,76m).
2.2 Interest, dividends and rent on land
Note 2019/20 2018/19
R’000 R’000
Interest 1 2 71 2
Total 71 2
1. Increase is as a result of debt which was written off. The interest portion was reversed and
included in interest income.
2.3 Sale of capital assets
Tangible assets 92 4
Machinery and equipment 1 26.2 92 4
Total 92 4
1. Increase is as a result of more disposal applications received in the current year.
2.4 Transactions in financial assets and liabilities
Receivables 2 4 5
Other Receipts including Recoverable Revenue 1 2 1 407 356
Total 1 411 361
1. Includes amounts recovered in respect of previous year`s expenditure claimed in the
current year for salaries, training events, meals and accommodation, and similar
expenses.
3. Compensation of employees
3.1 Salaries and Wages
Basic salary 3 436 796 424 265
Performance award 3 3 582 8 948
Service Based 3 554 534
Compensative/circumstantial 3 5 573 5 803
Periodic payments 3 945 1 571
Other non-pensionable allowances 3 86 461 84 179
Total 533 911 525 300
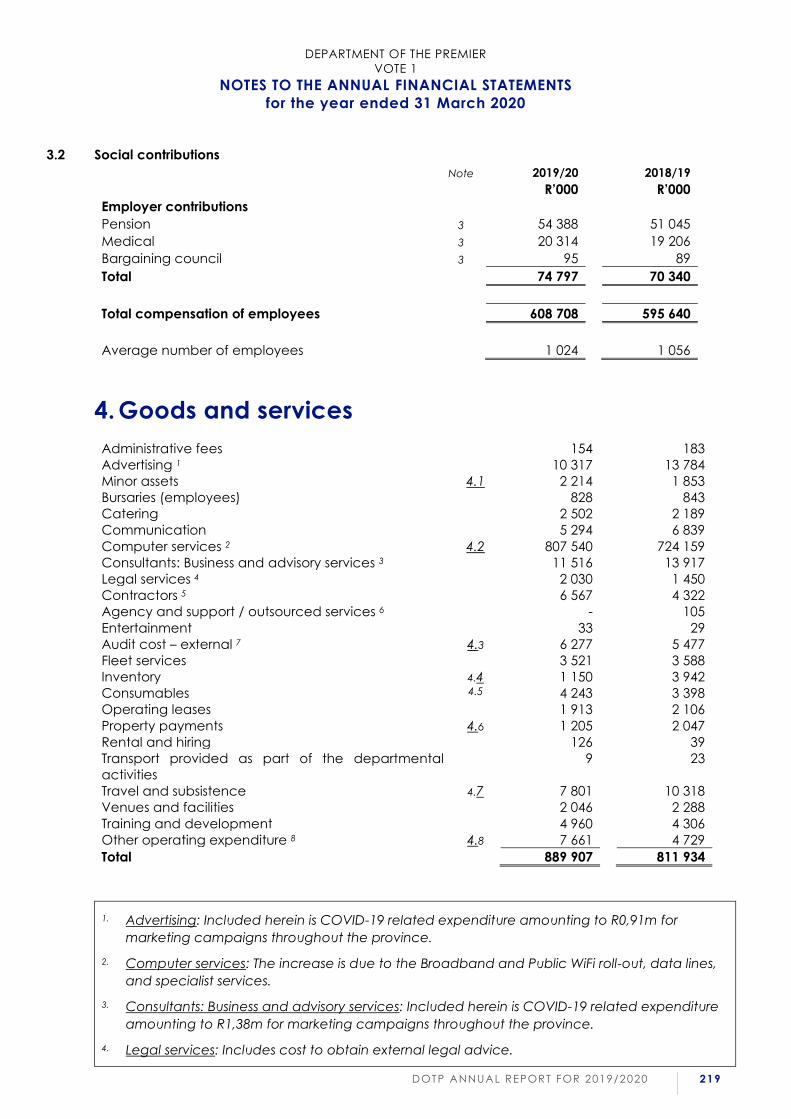
DEPARTMENT OF THE PREMIER
VOTE 1
NOTES TO THE ANNUAL FINANCIAL STATEMENTS
for the year ended 31 March 2020
DOTP ANNUAL REPORT FOR 2019/2020 219
3.2 Social contributions
Note 2019/20 2018/19
R’000 R’000
Employer contributions
Pension 3 54 388 51 045
Medical 3 20 314 19 206
Bargaining council 3 95 89
Total 74 797 70 340
Total compensation of employees 608 708 595 640
Average number of employees 1 024 1 056
4. Goods and services
Administrative fees 154 183
Advertising 1 10 317 13 784
Minor assets 4.1 2 214 1 853
Bursaries (employees) 828 843
Catering 2 502 2 189
Communication 5 294 6 839
Computer services 2 4.2 807 540 724 159
Consultants: Business and advisory services 3 11 516 13 917
Legal services 4 2 030 1 450
Contractors 5 6 567 4 322
Agency and support / outsourced services 6 - 105
Entertainment 33 29
Audit cost – external 7 4.3 6 277 5 477
Fleet services 3 521 3 588
Inventory 4.4 1 150 3 942
Consumables 4.5 4 243 3 398
Operating leases 1 913 2 106
Property payments 4.6 1 205 2 047
Rental and hiring 126 39
Transport provided as part of the departmental
activities
9 23
Travel and subsistence 4.7 7 801 10 318
Venues and facilities 2 046 2 288
Training and development 4 960 4 306
Other operating expenditure 8 4.8 7 661 4 729
Total 889 907 811 934
1. Advertising: Included herein is COVID-19 related expenditure amounting to R0,91m for
marketing campaigns throughout the province.
2. Computer services: The increase is due to the Broadband and Public WiFi roll-out, data lines,
and specialist services.
3. Consultants: Business and advisory services: Included herein is COVID-19 related expenditure
amounting to R1,38m for marketing campaigns throughout the province.
4. Legal services: Includes cost to obtain external legal advice.
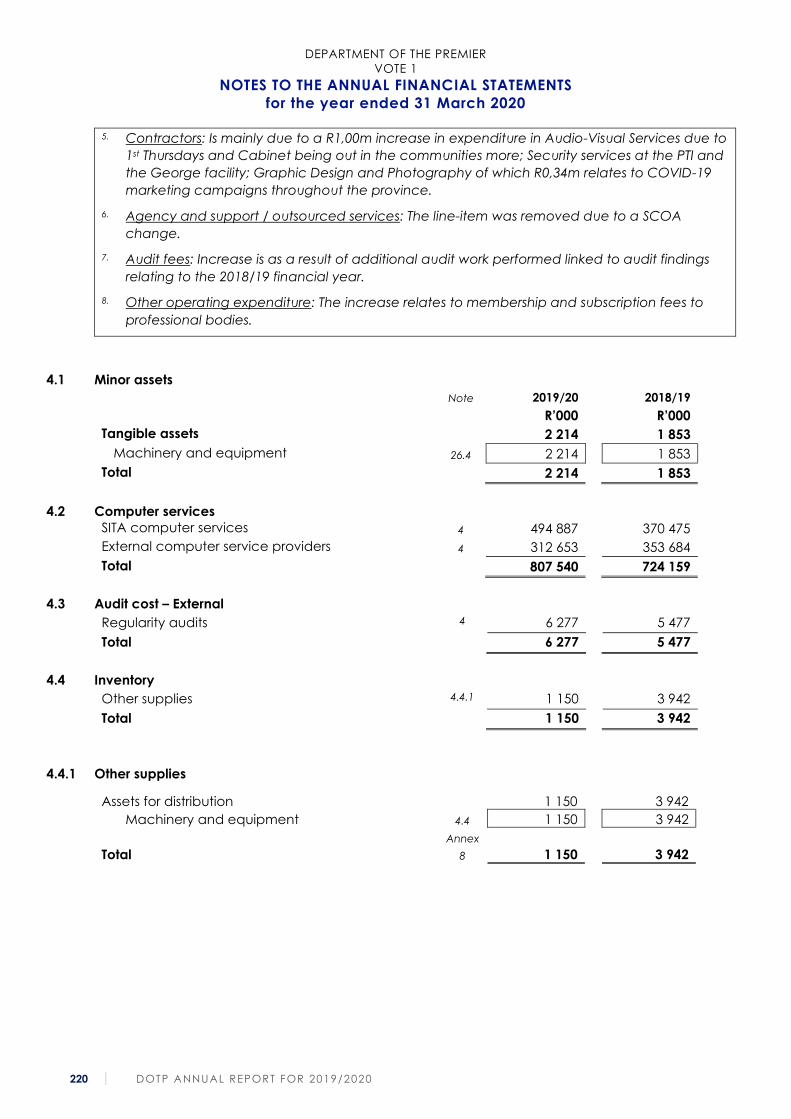
DEPARTMENT OF THE PREMIER
VOTE 1
NOTES TO THE ANNUAL FINANCIAL STATEMENTS
for the year ended 31 March 2020
220 DOTP ANNUAL REPORT FOR 2019/2020
5. Contractors: Is mainly due to a R1,00m increase in expenditure in Audio-Visual Services due to
1st Thursdays and Cabinet being out in the communities more; Security services at the PTI and
the George facility; Graphic Design and Photography of which R0,34m relates to COVID-19
marketing campaigns throughout the province.
6. Agency and support / outsourced services: The line-item was removed due to a SCOA
change.
7. Audit fees: Increase is as a result of additional audit work performed linked to audit findings
relating to the 2018/19 financial year.
8. Other operating expenditure: The increase relates to membership and subscription fees to
professional bodies.
4.1 Minor assets
Note 2019/20 2018/19
R’000 R’000
Tangible assets 2 214 1 853
Machinery and equipment 26.4 2 214 1 853
Total 2 214 1 853
4.2 Computer services
SITA computer services 4 494 887 370 475
External computer service providers 4 312 653 353 684
Total 807 540 724 159
4.3 Audit cost – External
Regularity audits 4 6 277 5 477
Total 6 277 5 477
4.4 Inventory
Other supplies 4.4.1 1 150 3 942
Total 1 150 3 942
4.4.1 Other supplies
Assets for distribution 1 150 3 942
Machinery and equipment 4.4 1 150 3 942
Total
Annex
8
1 150
3 942
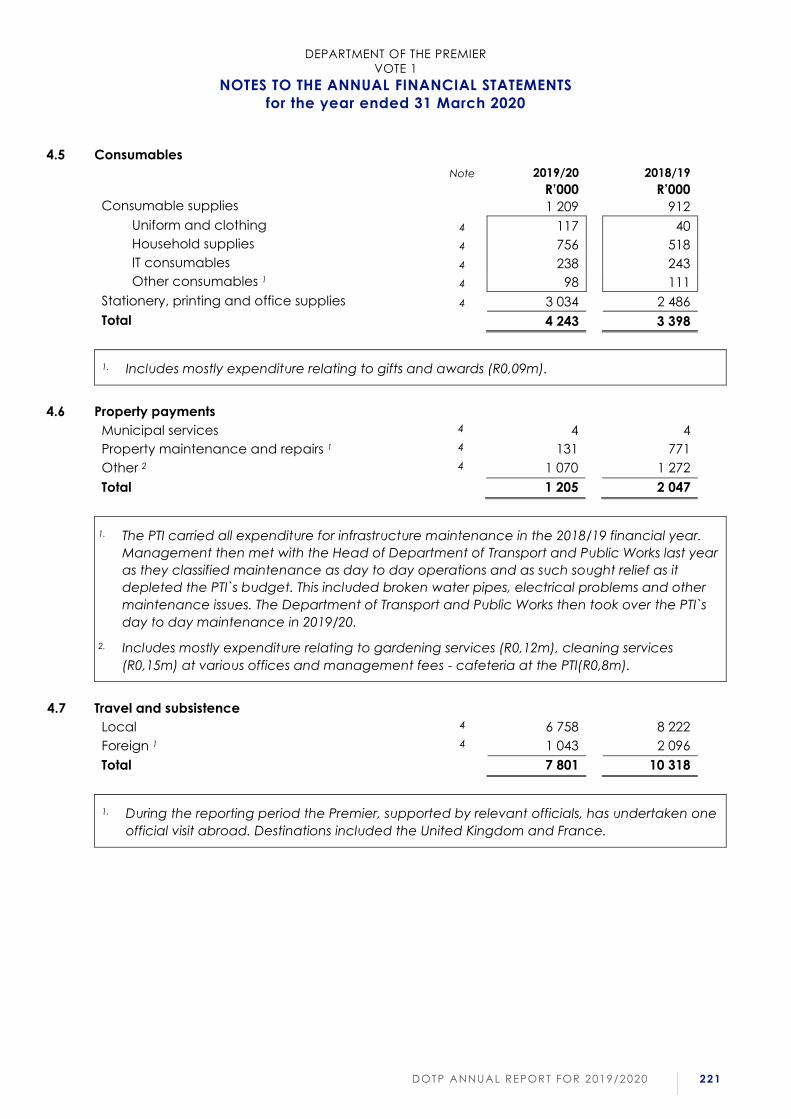
DEPARTMENT OF THE PREMIER
VOTE 1
NOTES TO THE ANNUAL FINANCIAL STATEMENTS
for the year ended 31 March 2020
DOTP ANNUAL REPORT FOR 2019/2020 221
4.5 Consumables
Note 2019/20 2018/19
R’000 R’000
Consumable supplies 1 209 912
Uniform and clothing 4 117 40
Household supplies 4 756 518
IT consumables 4 238 243
Other consumables 1 4 98 111
Stationery, printing and office supplies 4 3 034 2 486
Total 4 243 3 398
1. Includes mostly expenditure relating to gifts and awards (R0,09m).
4.6 Property payments
Municipal services 4 4 4
Property maintenance and repairs 1 4 131 771
Other 2 4 1 070 1 272
Total 1 205 2 047
1. The PTI carried all expenditure for infrastructure maintenance in the 2018/19 financial year.
Management then met with the Head of Department of Transport and Public Works last year
as they classified maintenance as day to day operations and as such sought relief as it
depleted the PTI`s budget. This included broken water pipes, electrical problems and other
maintenance issues. The Department of Transport and Public Works then took over the PTI`s
day to day maintenance in 2019/20.
2. Includes mostly expenditure relating to gardening services (R0,12m), cleaning services
(R0,15m) at various offices and management fees - cafeteria at the PTI(R0,8m).
4.7 Travel and subsistence
Local 4 6 758 8 222
Foreign 1 4 1 043 2 096
Total 7 801 10 318
1. During the reporting period the Premier, supported by relevant officials, has undertaken one
official visit abroad. Destinations included the United Kingdom and France.
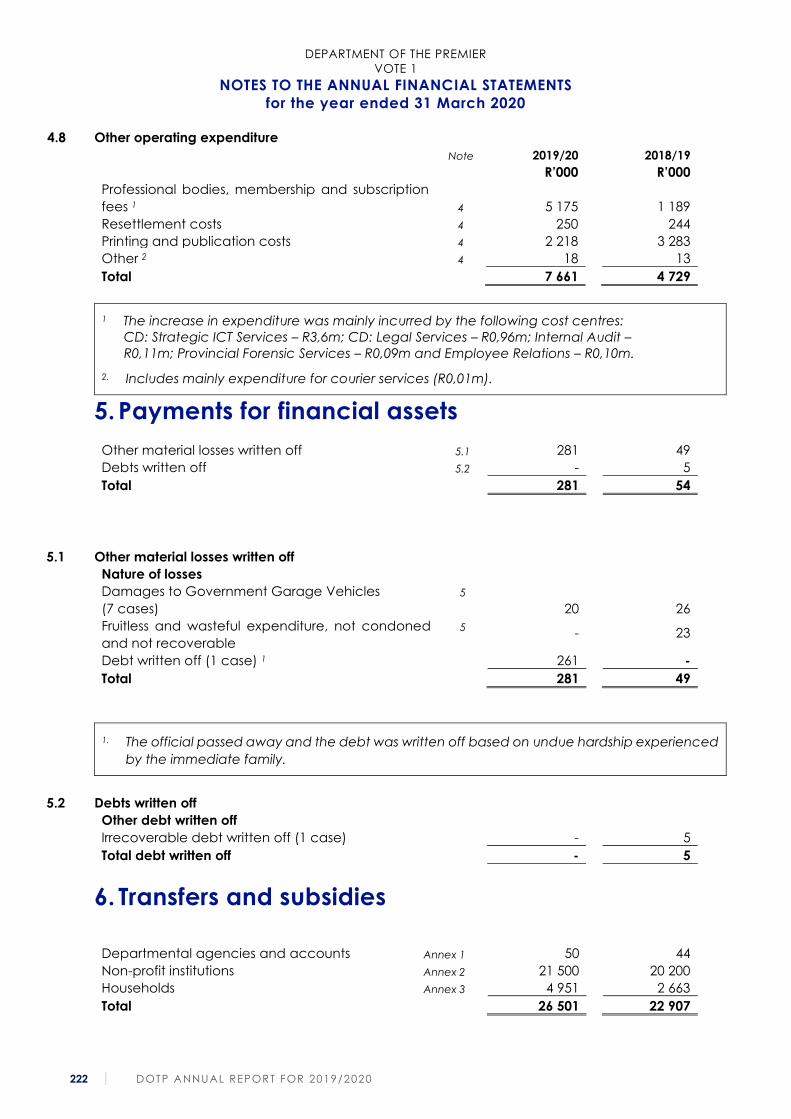
DEPARTMENT OF THE PREMIER
VOTE 1
NOTES TO THE ANNUAL FINANCIAL STATEMENTS
for the year ended 31 March 2020
222 DOTP ANNUAL REPORT FOR 2019/2020
4.8 Other operating expenditure
Professional bodies, membership and subscription
fees 1
Note
4
2019/20
R’000
5 175
2018/19
R’000
1 189
Resettlement costs 4 250 244
Printing and publication costs 4 2 218 3 283
Other 2 4 18 13
Total 7 661 4 729
1 The increase in expenditure was mainly incurred by the following cost centres:
CD: Strategic ICT Services – R3,6m; CD: Legal Services – R0,96m; Internal Audit –
R0,11m; Provincial Forensic Services – R0,09m and Employee Relations – R0,10m.
2. Includes mainly expenditure for courier services (R0,01m).
5. Payments for financial assets
Other material losses written off 5.1 281 49
Debts written off 5.2 - 5
Total 281 54
5.1 Other material losses written off
Nature of losses
Damages to Government Garage Vehicles
(7 cases)
5
20
26
Fruitless and wasteful expenditure, not condoned
and not recoverable
5 -
23
Debt written off (1 case) 1 261 -
Total 281 49
1. The official passed away and the debt was written off based on undue hardship experienced
by the immediate family.
5.2 Debts written off
Other debt written off
Irrecoverable debt written off (1 case) - 5
Total debt written off - 5
6. Transfers and subsidies
Departmental agencies and accounts Annex 1 50 44
Non-profit institutions Annex 2 21 500 20 200
Households Annex 3 4 951 2 663
Total 26 501 22 907
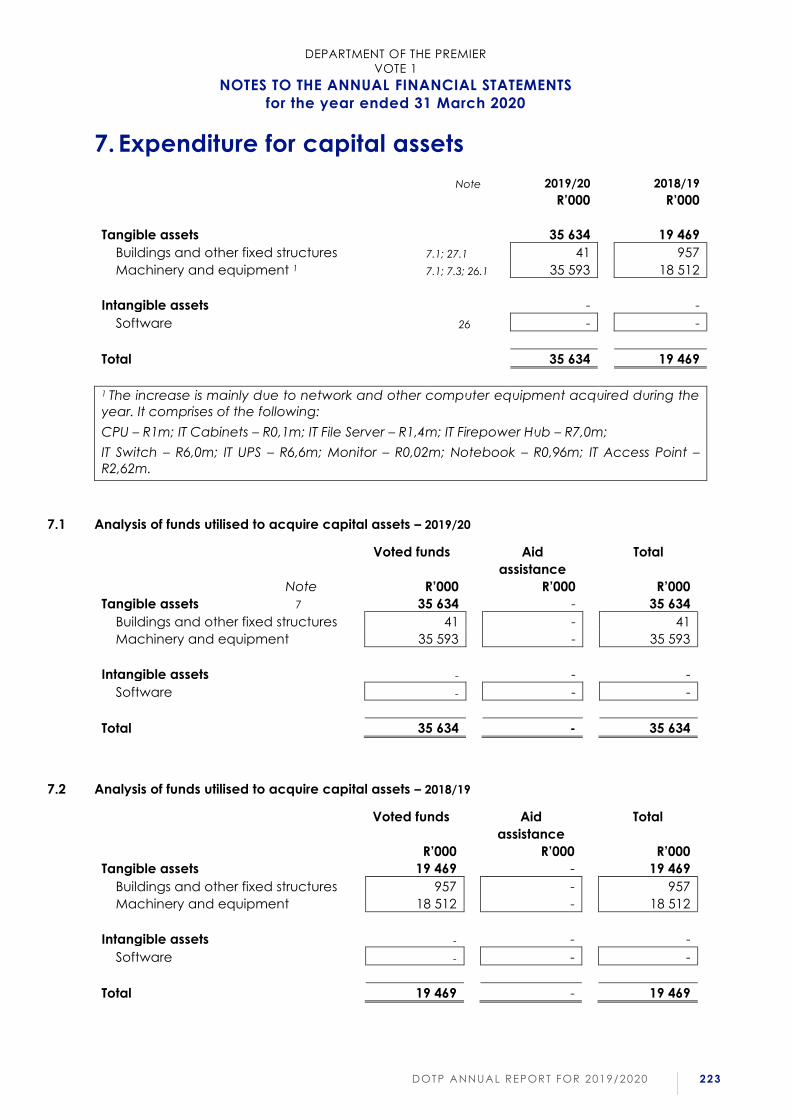
DEPARTMENT OF THE PREMIER
VOTE 1
NOTES TO THE ANNUAL FINANCIAL STATEMENTS
for the year ended 31 March 2020
DOTP ANNUAL REPORT FOR 2019/2020 223
7. Expenditure for capital assets
Note
2019/20
R’000
2018/19
R’000
Tangible assets 35 634 19 469
Buildings and other fixed structures 7.1; 27.1 41 957
Machinery and equipment 1 7.1; 7.3; 26.1 35 593 18 512
Intangible assets - -
Software 26 - -
Total 35 634 19 469
1 The increase is mainly due to network and other computer equipment acquired during the
year. It comprises of the following:
CPU – R1m; IT Cabinets – R0,1m; IT File Server – R1,4m; IT Firepower Hub – R7,0m;
IT Switch – R6,0m; IT UPS – R6,6m; Monitor – R0,02m; Notebook – R0,96m; IT Access Point –
R2,62m.
7.1 Analysis of funds utilised to acquire capital assets – 2019/20
Voted funds Aid
assistance
Total
Note R’000 R’000 R’000
Tangible assets 7 35 634 - 35 634
Buildings and other fixed structures 41 - 41
Machinery and equipment 35 593 - 35 593
Intangible assets - - -
Software - - -
Total 35 634 - 35 634
7.2 Analysis of funds utilised to acquire capital assets – 2018/19
Voted funds Aid
assistance
Total
R’000 R’000 R’000
Tangible assets 19 469 - 19 469
Buildings and other fixed structures 957 - 957
Machinery and equipment 18 512 - 18 512
Intangible assets - - -
Software - - -
Total 19 469 - 19 469
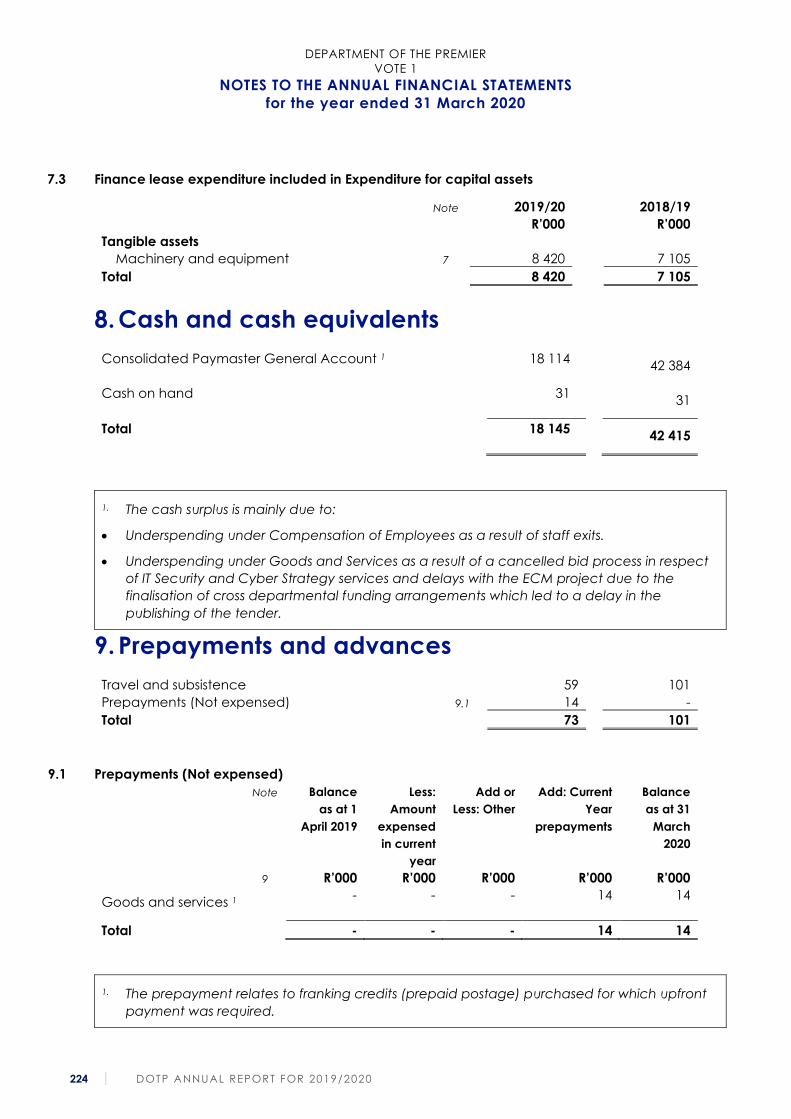
DEPARTMENT OF THE PREMIER
VOTE 1
NOTES TO THE ANNUAL FINANCIAL STATEMENTS
for the year ended 31 March 2020
224 DOTP ANNUAL REPORT FOR 2019/2020
7.3 Finance lease expenditure included in Expenditure for capital assets
Note 2019/20 2018/19
R’000 R’000
Tangible assets
Machinery and equipment 7 8 420 7 105
Total 8 420 7 105
8. Cash and cash equivalents
Consolidated Paymaster General Account 1 18 114 42 384
Cash on hand 31 31
Total 18 145 42 415
1. The cash surplus is mainly due to:
• Underspending under Compensation of Employees as a result of staff exits.
• Underspending under Goods and Services as a result of a cancelled bid process in respect
of IT Security and Cyber Strategy services and delays with the ECM project due to the
finalisation of cross departmental funding arrangements which led to a delay in the
publishing of the tender.
9. Prepayments and advances
Travel and subsistence 59 101
Prepayments (Not expensed) 9.1 14 -
Total 73 101
9.1 Prepayments (Not expensed)
Note Balance
as at 1
April 2019
Less:
Amount
expensed
in current
year
Add or
Less: Other
Add: Current
Year
prepayments
Balance
as at 31
March
2020
9 R’000 R’000 R’000 R’000 R’000
Goods and services 1 - - - 14 14
Total - - - 14 14
1. The prepayment relates to franking credits (prepaid postage) purchased for which upfront
payment was required.
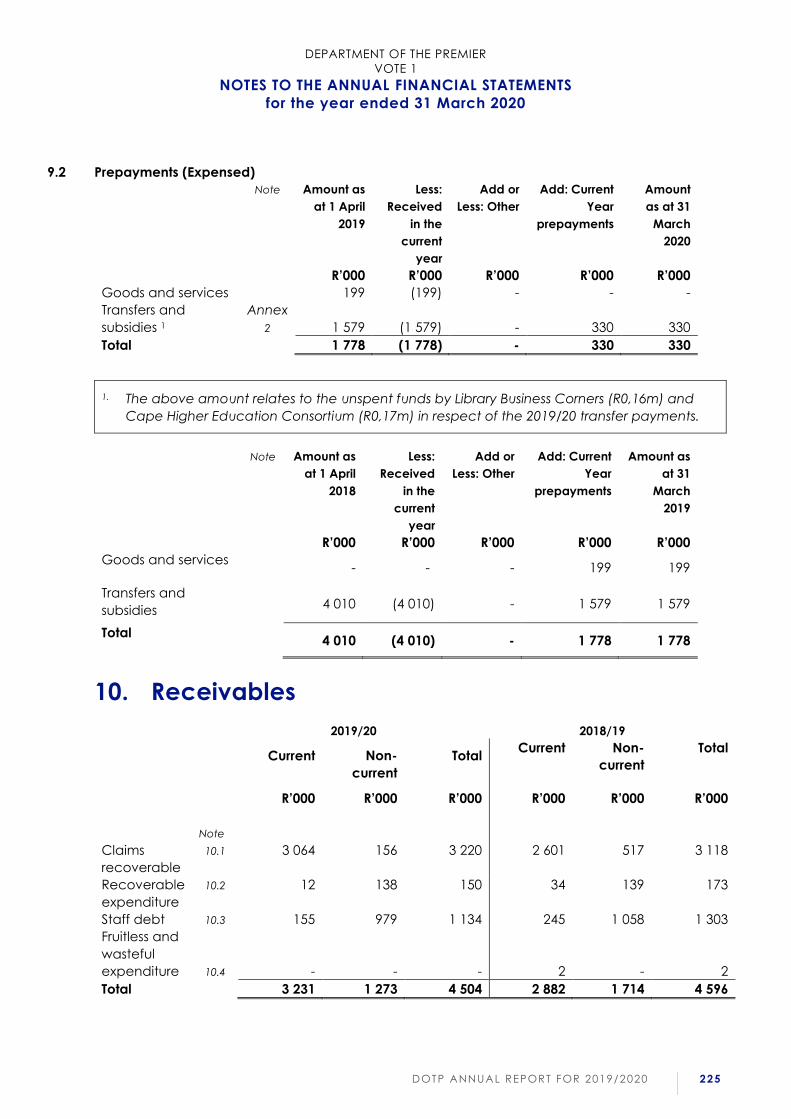
DEPARTMENT OF THE PREMIER
VOTE 1
NOTES TO THE ANNUAL FINANCIAL STATEMENTS
for the year ended 31 March 2020
DOTP ANNUAL REPORT FOR 2019/2020 225
9.2 Prepayments (Expensed)
Note Amount as
at 1 April
2019
Less:
Received
in the
current
year
Add or
Less: Other
Add: Current
Year
prepayments
Amount
as at 31
March
2020
R’000 R’000 R’000 R’000 R’000
Goods and services 199 (199) - - -
Transfers and
subsidies 1
Annex
2
1 579
(1 579)
-
330
330
Total 1 778 (1 778) - 330 330
1. The above amount relates to the unspent funds by Library Business Corners (R0,16m) and
Cape Higher Education Consortium (R0,17m) in respect of the 2019/20 transfer payments.
Note Amount as
at 1 April
2018
Less:
Received
in the
current
year
Add or
Less: Other
Add: Current
Year
prepayments
Amount as
at 31
March
2019
R’000 R’000 R’000 R’000 R’000
Goods and services - - - 199 199
Transfers and
subsidies
4 010 (4 010) - 1 579 1 579
Total 4 010 (4 010) - 1 778 1 778
10. Receivables
2019/20 2018/19
Current Non-
current
Total Current Non-
current
Total
Note
R’000 R’000 R’000 R’000 R’000 R’000
Claims
recoverable
10.1 3 064 156 3 220 2 601 517 3 118
Recoverable
expenditure
10.2 12 138 150 34 139 173
Staff debt 10.3 155 979 1 134 245 1 058 1 303
Fruitless and
wasteful
expenditure
10.4
-
-
-
2
-
2
Total 3 231 1 273 4 504 2 882 1 714 4 596
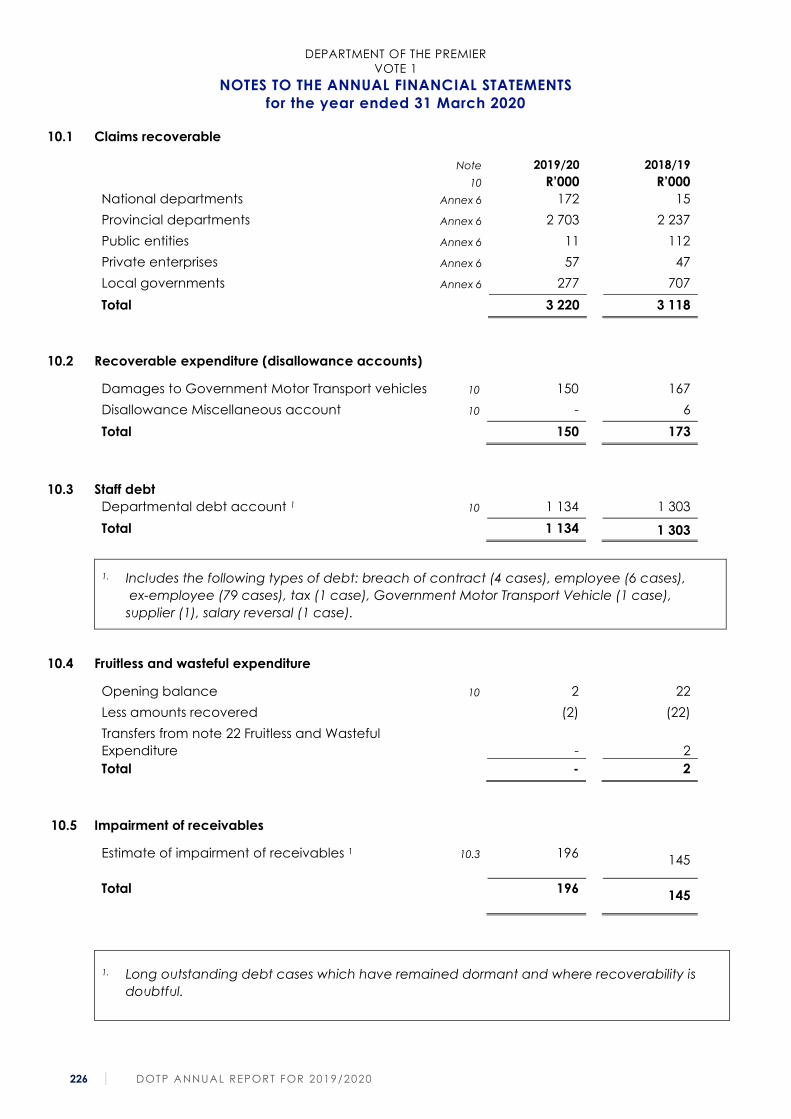
DEPARTMENT OF THE PREMIER
VOTE 1
NOTES TO THE ANNUAL FINANCIAL STATEMENTS
for the year ended 31 March 2020
226 DOTP ANNUAL REPORT FOR 2019/2020
10.1 Claims recoverable
Note 2019/20 2018/19
10 R’000 R’000
National departments Annex 6 172 15
Provincial departments Annex 6 2 703 2 237
Public entities Annex 6 11 112
Private enterprises Annex 6 57 47
Local governments Annex 6 277 707
Total 3 220 3 118
10.2 Recoverable expenditure (disallowance accounts)
Damages to Government Motor Transport vehicles 10 150 167
Disallowance Miscellaneous account 10 - 6
Total 150 173
10.3 Staff debt
Departmental debt account 1 10 1 134 1 303
Total 1 134 1 303
1. Includes the following types of debt: breach of contract (4 cases), employee (6 cases),
ex-employee (79 cases), tax (1 case), Government Motor Transport Vehicle (1 case),
supplier (1), salary reversal (1 case).
10.4 Fruitless and wasteful expenditure
Opening balance 10 2 22
Less amounts recovered (2) (22)
Transfers from note 22 Fruitless and Wasteful
Expenditure
-
2
Total - 2
10.5 Impairment of receivables
Estimate of impairment of receivables 1 10.3 196 145
Total 196 145
1. Long outstanding debt cases which have remained dormant and where recoverability is
doubtful.
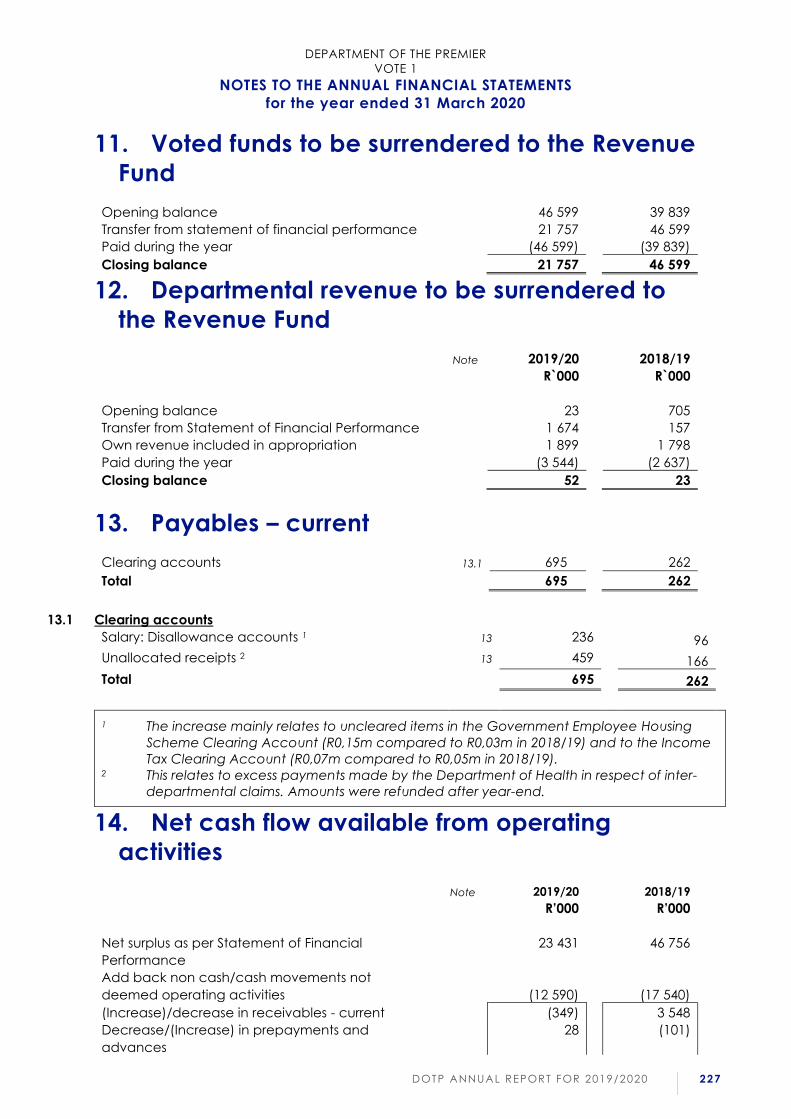
DEPARTMENT OF THE PREMIER
VOTE 1
NOTES TO THE ANNUAL FINANCIAL STATEMENTS
for the year ended 31 March 2020
DOTP ANNUAL REPORT FOR 2019/2020 227
11. Voted funds to be surrendered to the Revenue
Fund
Opening balance 46 599 39 839
Transfer from statement of financial performance 21 757 46 599
Paid during the year (46 599) (39 839)
Closing balance 21 757 46 599
12. Departmental revenue to be surrendered to
the Revenue Fund
Opening balance
Note 2019/20
R`000
23
2018/19
R`000
705
Transfer from Statement of Financial Performance 1 674 157
Own revenue included in appropriation 1 899 1 798
Paid during the year (3 544) (2 637)
Closing balance 52 23
13. Payables – current
Clearing accounts 13.1 695 262
Total 695 262
13.1 Clearing accounts
Salary: Disallowance accounts 1 13 236 96
Unallocated receipts 2 13 459 166
Total 695 262
1 The increase mainly relates to uncleared items in the Government Employee Housing
Scheme Clearing Account (R0,15m compared to R0,03m in 2018/19) and to the Income
Tax Clearing Account (R0,07m compared to R0,05m in 2018/19). 2 This relates to excess payments made by the Department of Health in respect of inter-
departmental claims. Amounts were refunded after year-end.
14. Net cash flow available from operating
activities
Note 2019/20 2018/19
R’000 R’000
Net surplus as per Statement of Financial
Performance
23 431 46 756
Add back non cash/cash movements not
deemed operating activities
(12 590)
(17 540)
(Increase)/decrease in receivables - current (349) 3 548
Decrease/(Increase) in prepayments and
advances
28 (101)
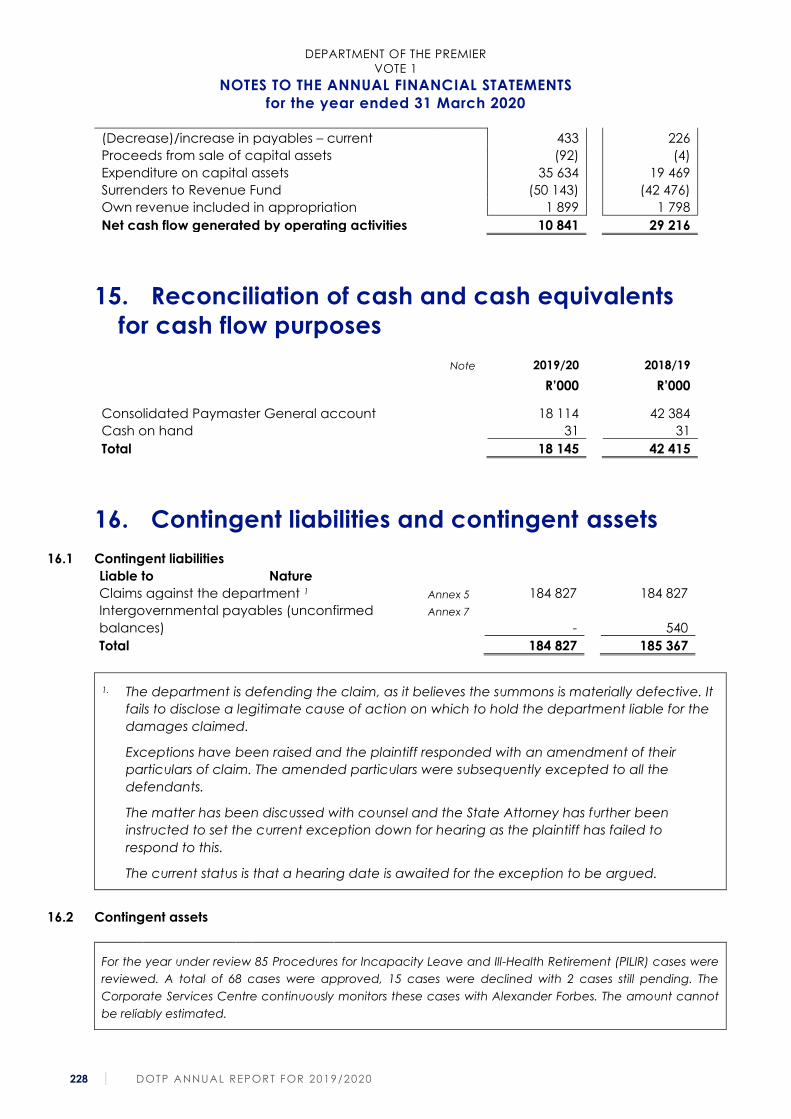
DEPARTMENT OF THE PREMIER
VOTE 1
NOTES TO THE ANNUAL FINANCIAL STATEMENTS
for the year ended 31 March 2020
228 DOTP ANNUAL REPORT FOR 2019/2020
(Decrease)/increase in payables – current 433 226
Proceeds from sale of capital assets (92) (4)
Expenditure on capital assets 35 634 19 469
Surrenders to Revenue Fund (50 143) (42 476)
Own revenue included in appropriation 1 899 1 798
Net cash flow generated by operating activities 10 841 29 216
15. Reconciliation of cash and cash equivalents
for cash flow purposes
Note 2019/20 2018/19
R’000 R’000
Consolidated Paymaster General account 18 114 42 384
Cash on hand 31 31
Total 18 145 42 415
16. Contingent liabilities and contingent assets
16.1 Contingent liabilities
Liable to Nature
Claims against the department 1 Annex 5 184 827 184 827
Intergovernmental payables (unconfirmed
balances)
Annex 7
-
540
Total 184 827 185 367
1. The department is defending the claim, as it believes the summons is materially defective. It
fails to disclose a legitimate cause of action on which to hold the department liable for the
damages claimed.
Exceptions have been raised and the plaintiff responded with an amendment of their
particulars of claim. The amended particulars were subsequently excepted to all the
defendants.
The matter has been discussed with counsel and the State Attorney has further been
instructed to set the current exception down for hearing as the plaintiff has failed to
respond to this.
The current status is that a hearing date is awaited for the exception to be argued.
16.2 Contingent assets
For the year under review 85 Procedures for Incapacity Leave and Ill-Health Retirement (PILIR) cases were
reviewed. A total of 68 cases were approved, 15 cases were declined with 2 cases still pending. The
Corporate Services Centre continuously monitors these cases with Alexander Forbes. The amount cannot
be reliably estimated.
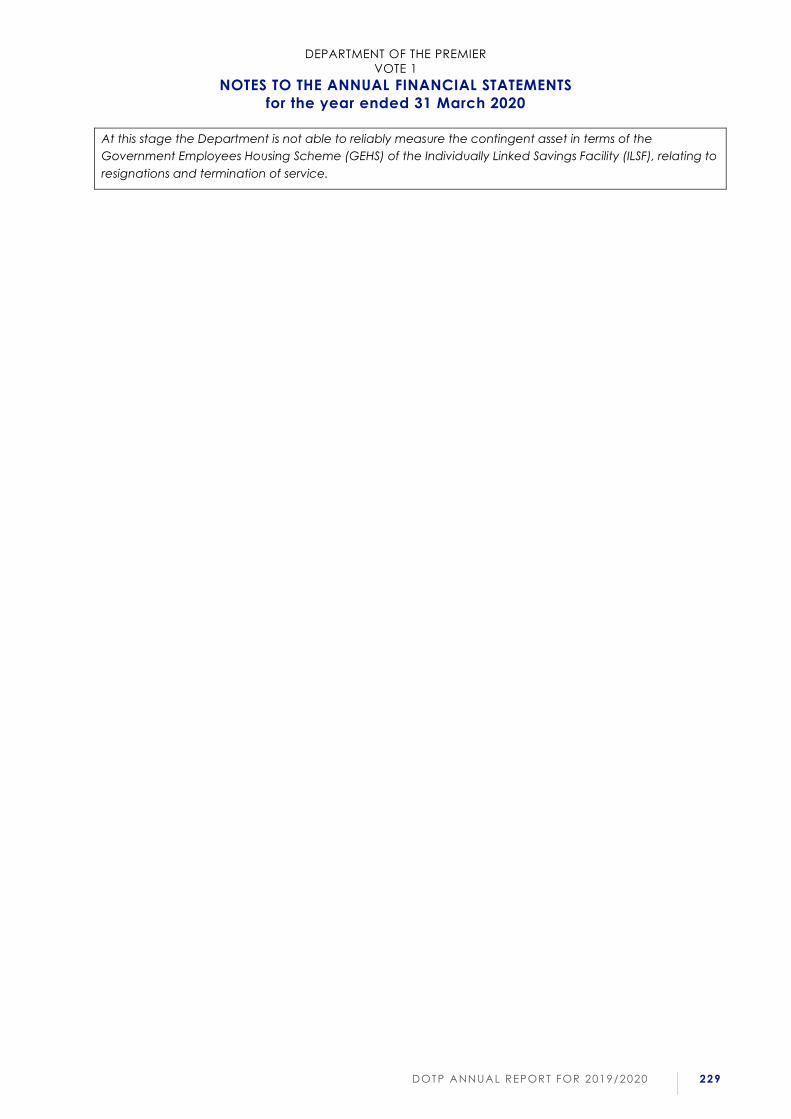
DEPARTMENT OF THE PREMIER
VOTE 1
NOTES TO THE ANNUAL FINANCIAL STATEMENTS
for the year ended 31 March 2020
DOTP ANNUAL REPORT FOR 2019/2020 229
At this stage the Department is not able to reliably measure the contingent asset in terms of the
Government Employees Housing Scheme (GEHS) of the Individually Linked Savings Facility (ILSF), relating to
resignations and termination of service.
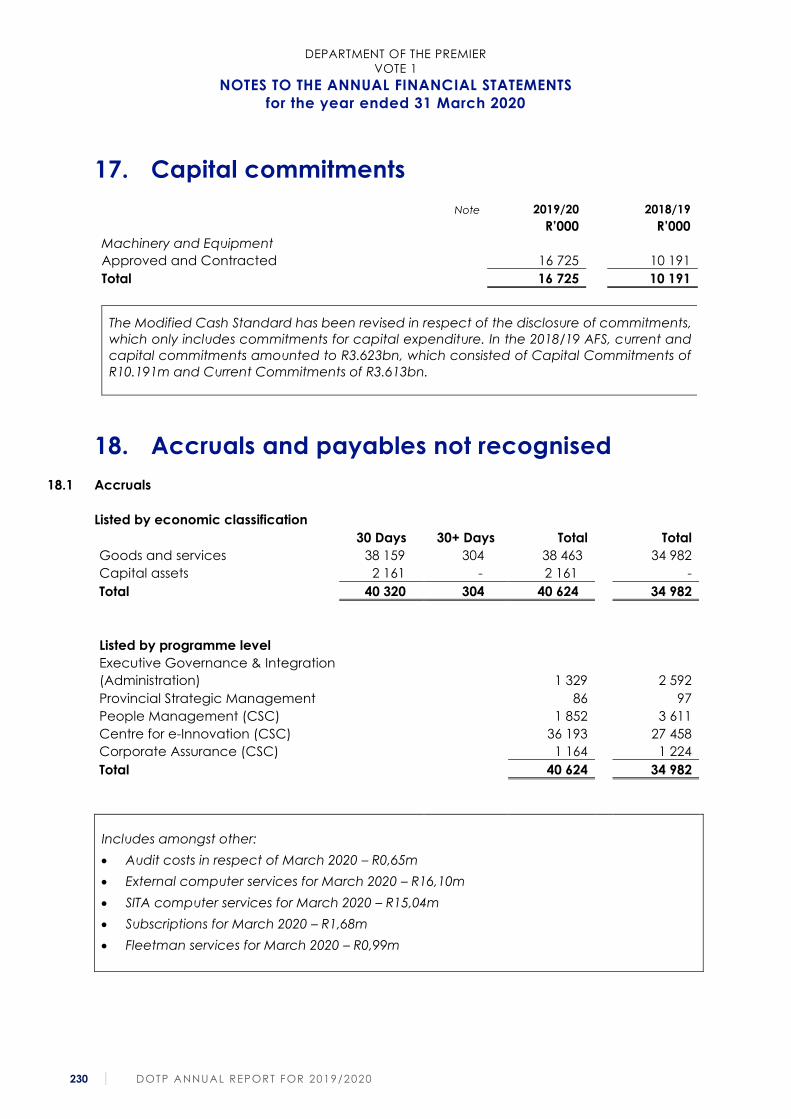
DEPARTMENT OF THE PREMIER
VOTE 1
NOTES TO THE ANNUAL FINANCIAL STATEMENTS
for the year ended 31 March 2020
230 DOTP ANNUAL REPORT FOR 2019/2020
17. Capital commitments
Note 2019/20 2018/19
R’000 R’000
Machinery and Equipment
Approved and Contracted 16 725 10 191
Total 16 725 10 191
The Modified Cash Standard has been revised in respect of the disclosure of commitments,
which only includes commitments for capital expenditure. In the 2018/19 AFS, current and
capital commitments amounted to R3.623bn, which consisted of Capital Commitments of
R10.191m and Current Commitments of R3.613bn.
18. Accruals and payables not recognised
18.1 Accruals
Listed by economic classification
30 Days 30+ Days Total Total
Goods and services 38 159 304 38 463 34 982
Capital assets 2 161 - 2 161 -
Total 40 320 304 40 624 34 982
Listed by programme level
Executive Governance & Integration
(Administration)
1 329
2 592
Provincial Strategic Management 86 97
People Management (CSC) 1 852 3 611
Centre for e-Innovation (CSC) 36 193 27 458
Corporate Assurance (CSC) 1 164 1 224
Total 40 624 34 982
Includes amongst other:
• Audit costs in respect of March 2020 – R0,65m
• External computer services for March 2020 – R16,10m
• SITA computer services for March 2020 – R15,04m
• Subscriptions for March 2020 – R1,68m
• Fleetman services for March 2020 – R0,99m
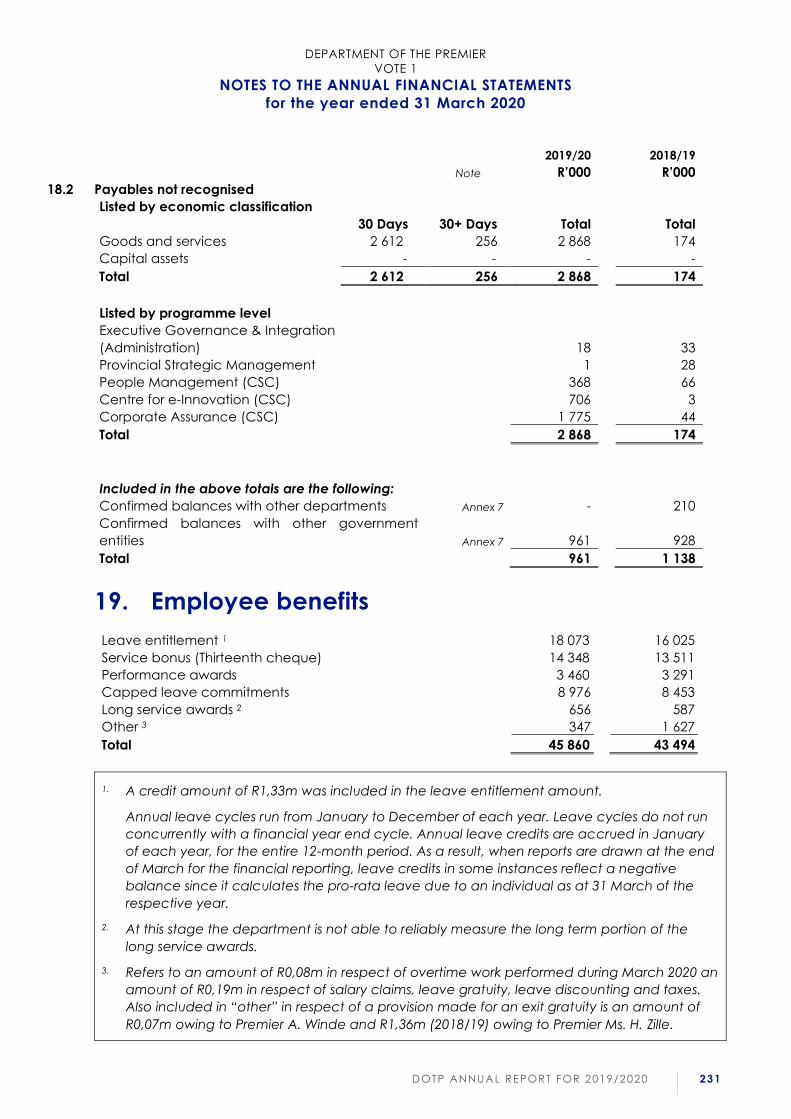
DEPARTMENT OF THE PREMIER
VOTE 1
NOTES TO THE ANNUAL FINANCIAL STATEMENTS
for the year ended 31 March 2020
DOTP ANNUAL REPORT FOR 2019/2020 231
2019/20 2018/19
Note R’000 R’000
18.2 Payables not recognised
Listed by economic classification
30 Days 30+ Days Total Total
Goods and services 2 612 256 2 868 174
Capital assets - - - -
Total 2 612 256 2 868 174
Listed by programme level
Executive Governance & Integration
(Administration)
18
33
Provincial Strategic Management 1 28
People Management (CSC) 368 66
Centre for e-Innovation (CSC) 706 3
Corporate Assurance (CSC) 1 775 44
Total 2 868 174
Included in the above totals are the following:
Confirmed balances with other departments Annex 7 - 210
Confirmed balances with other government
entities
Annex 7
961
928
Total 961 1 138
19. Employee benefits
Leave entitlement 1 18 073 16 025
Service bonus (Thirteenth cheque) 14 348 13 511
Performance awards 3 460 3 291
Capped leave commitments 8 976 8 453
Long service awards 2 656 587
Other 3 347 1 627
Total 45 860 43 494
1. A credit amount of R1,33m was included in the leave entitlement amount.
Annual leave cycles run from January to December of each year. Leave cycles do not run
concurrently with a financial year end cycle. Annual leave credits are accrued in January
of each year, for the entire 12-month period. As a result, when reports are drawn at the end
of March for the financial reporting, leave credits in some instances reflect a negative
balance since it calculates the pro-rata leave due to an individual as at 31 March of the
respective year.
2. At this stage the department is not able to reliably measure the long term portion of the
long service awards.
3. Refers to an amount of R0,08m in respect of overtime work performed during March 2020 an
amount of R0,19m in respect of salary claims, leave gratuity, leave discounting and taxes.
Also included in “other” in respect of a provision made for an exit gratuity is an amount of
R0,07m owing to Premier A. Winde and R1,36m (2018/19) owing to Premier Ms. H. Zille.
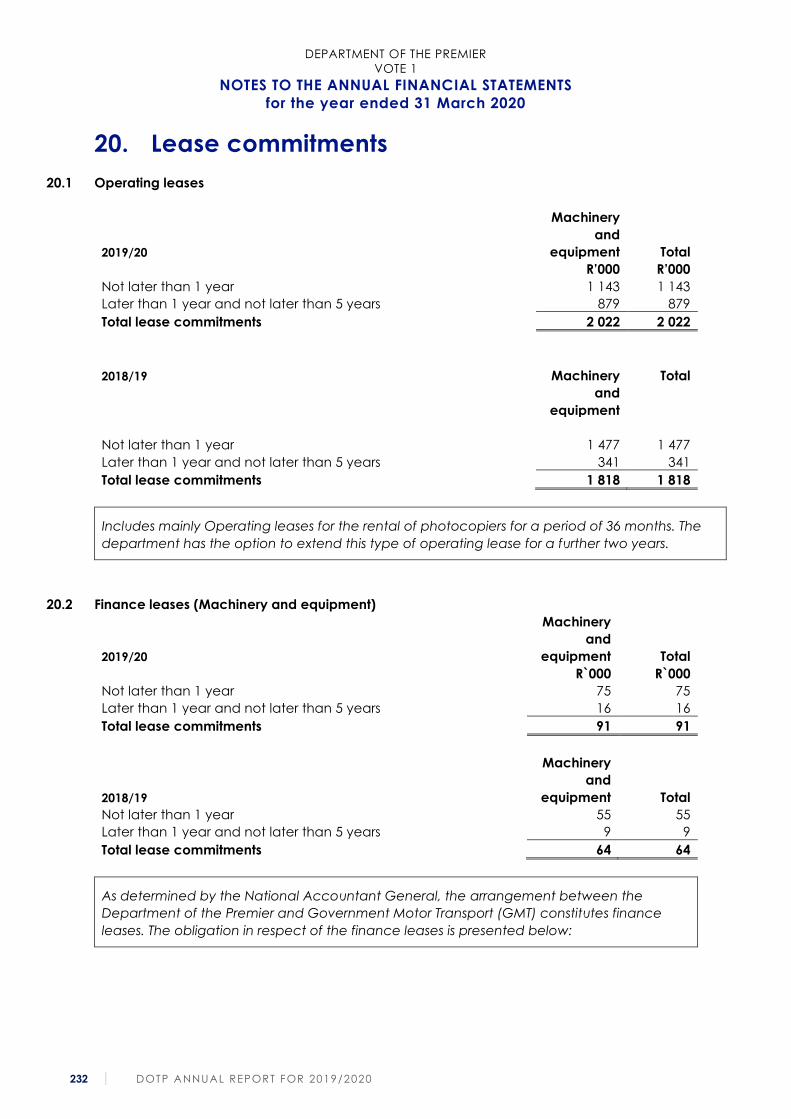
DEPARTMENT OF THE PREMIER
VOTE 1
NOTES TO THE ANNUAL FINANCIAL STATEMENTS
for the year ended 31 March 2020
232 DOTP ANNUAL REPORT FOR 2019/2020
20. Lease commitments
20.1 Operating leases
2019/20
Machinery
and
equipment
Total
R’000 R’000
Not later than 1 year 1 143 1 143
Later than 1 year and not later than 5 years 879 879
Total lease commitments 2 022 2 022
2018/19
Machinery
and
equipment
Total
Not later than 1 year 1 477 1 477
Later than 1 year and not later than 5 years 341 341
Total lease commitments 1 818 1 818
Includes mainly Operating leases for the rental of photocopiers for a period of 36 months. The
department has the option to extend this type of operating lease for a further two years.
20.2 Finance leases (Machinery and equipment)
2019/20
Machinery
and
equipment
Total
R`000 R`000
Not later than 1 year 75 75
Later than 1 year and not later than 5 years 16 16
Total lease commitments 91 91
2018/19
Machinery
and
equipment
Total
Not later than 1 year 55 55
Later than 1 year and not later than 5 years 9 9
Total lease commitments 64 64
As determined by the National Accountant General, the arrangement between the
Department of the Premier and Government Motor Transport (GMT) constitutes finance
leases. The obligation in respect of the finance leases is presented below:
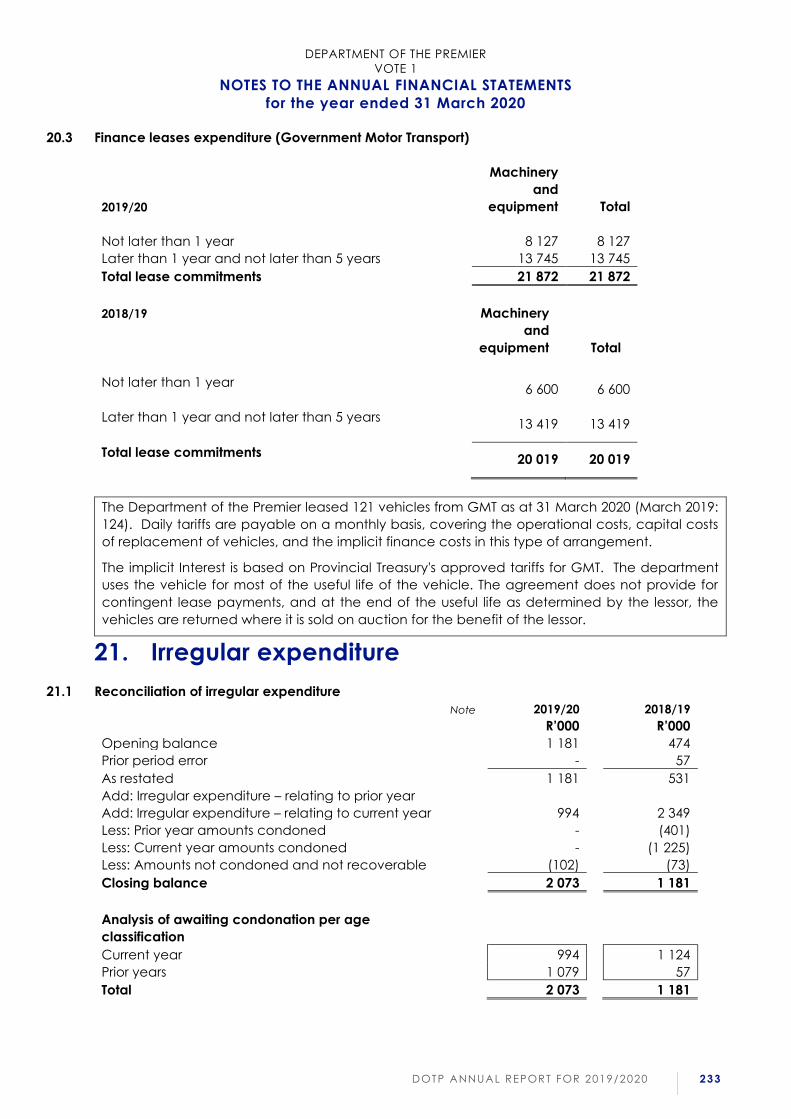
DEPARTMENT OF THE PREMIER
VOTE 1
NOTES TO THE ANNUAL FINANCIAL STATEMENTS
for the year ended 31 March 2020
DOTP ANNUAL REPORT FOR 2019/2020 233
20.3 Finance leases expenditure (Government Motor Transport)
2019/20
Machinery
and
equipment
Total
Not later than 1 year 8 127 8 127
Later than 1 year and not later than 5 years 13 745 13 745
Total lease commitments 21 872 21 872
2018/19 Machinery
and
equipment
Total
Not later than 1 year 6 600 6 600
Later than 1 year and not later than 5 years 13 419 13 419
Total lease commitments 20 019 20 019
The Department of the Premier leased 121 vehicles from GMT as at 31 March 2020 (March 2019:
124). Daily tariffs are payable on a monthly basis, covering the operational costs, capital costs
of replacement of vehicles, and the implicit finance costs in this type of arrangement.
The implicit Interest is based on Provincial Treasury's approved tariffs for GMT. The department
uses the vehicle for most of the useful life of the vehicle. The agreement does not provide for
contingent lease payments, and at the end of the useful life as determined by the lessor, the
vehicles are returned where it is sold on auction for the benefit of the lessor.
21. Irregular expenditure
21.1 Reconciliation of irregular expenditure
Note 2019/20 2018/19
R’000 R’000
Opening balance 1 181 474
Prior period error - 57
As restated 1 181 531
Add: Irregular expenditure – relating to prior year
Add: Irregular expenditure – relating to current year 994 2 349
Less: Prior year amounts condoned - (401)
Less: Current year amounts condoned - (1 225)
Less: Amounts not condoned and not recoverable (102) (73)
Closing balance 2 073 1 181
Analysis of awaiting condonation per age
classification
Current year 994 1 124
Prior years 1 079 57
Total 2 073 1 181
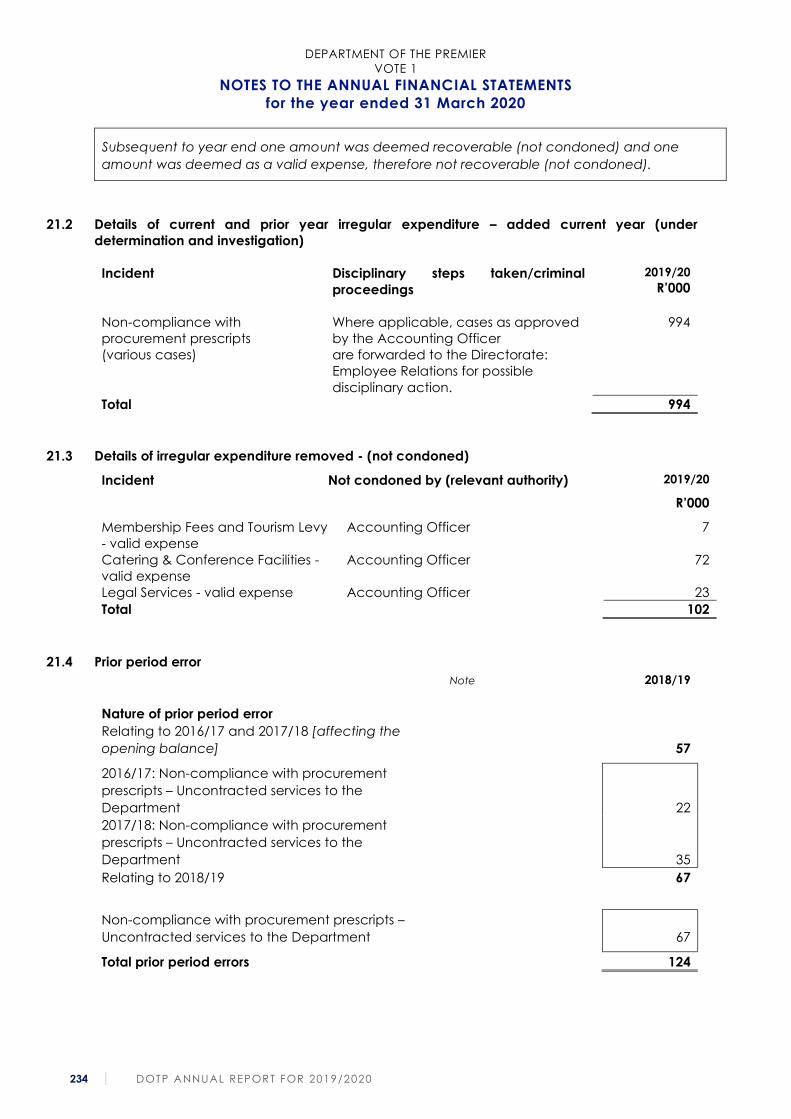
DEPARTMENT OF THE PREMIER
VOTE 1
NOTES TO THE ANNUAL FINANCIAL STATEMENTS
for the year ended 31 March 2020
234 DOTP ANNUAL REPORT FOR 2019/2020
Subsequent to year end one amount was deemed recoverable (not condoned) and one
amount was deemed as a valid expense, therefore not recoverable (not condoned).
21.2 Details of current and prior year irregular expenditure – added current year (under
determination and investigation)
Incident Disciplinary steps taken/criminal
proceedings
2019/20
R’000
Non-compliance with
procurement prescripts
(various cases)
Where applicable, cases as approved
by the Accounting Officer
are forwarded to the Directorate:
Employee Relations for possible
disciplinary action.
994
Total 994
21.3 Details of irregular expenditure removed - (not condoned)
Incident Not condoned by (relevant authority) 2019/20
R’000
Membership Fees and Tourism Levy
- valid expense
Accounting Officer 7
Catering & Conference Facilities -
valid expense
Accounting Officer 72
Legal Services - valid expense Accounting Officer 23
Total 102
21.4 Prior period error
Note 2018/19
Nature of prior period error
Relating to 2016/17 and 2017/18 [affecting the
opening balance]
57
2016/17: Non-compliance with procurement
prescripts – Uncontracted services to the
Department
22
2017/18: Non-compliance with procurement
prescripts – Uncontracted services to the
Department
35
Relating to 2018/19 67
Non-compliance with procurement prescripts –
Uncontracted services to the Department
67
Total prior period errors 124
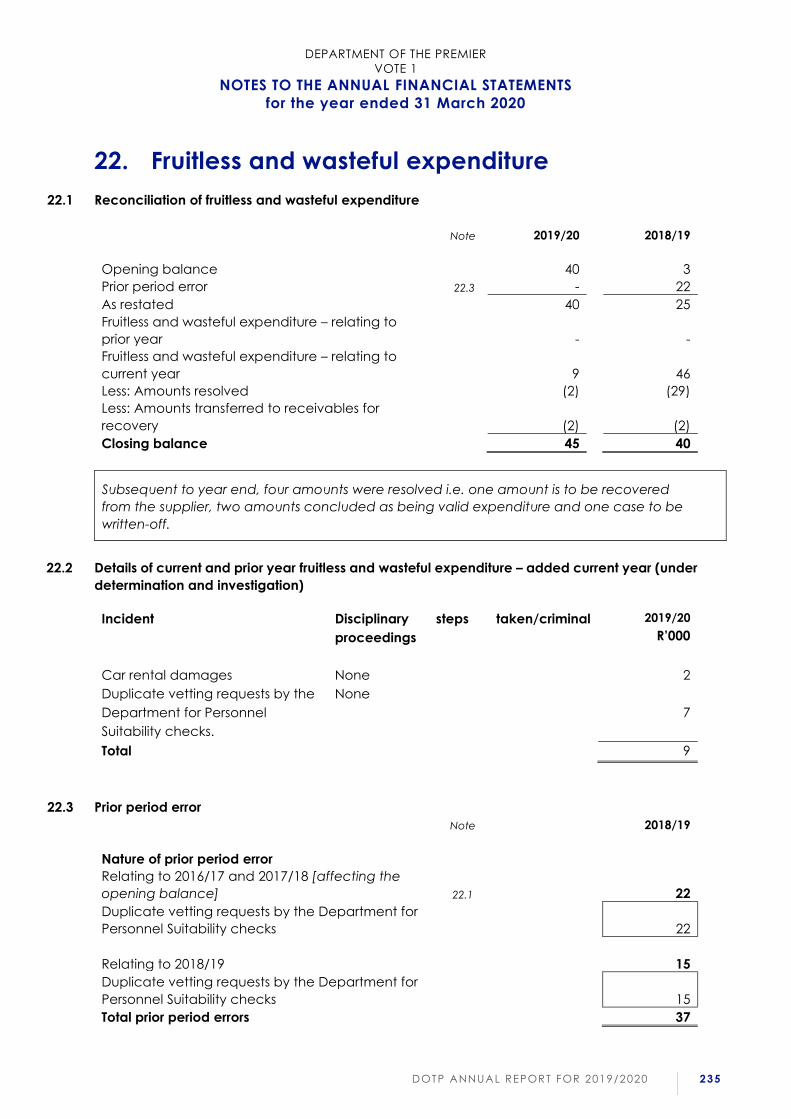
DEPARTMENT OF THE PREMIER
VOTE 1
NOTES TO THE ANNUAL FINANCIAL STATEMENTS
for the year ended 31 March 2020
DOTP ANNUAL REPORT FOR 2019/2020 235
22. Fruitless and wasteful expenditure
22.1 Reconciliation of fruitless and wasteful expenditure
Note 2019/20 2018/19
Opening balance 40 3
Prior period error 22.3 - 22
As restated 40 25
Fruitless and wasteful expenditure – relating to
prior year
-
-
Fruitless and wasteful expenditure – relating to
current year
9
46
Less: Amounts resolved (2) (29)
Less: Amounts transferred to receivables for
recovery
(2)
(2)
Closing balance 45 40
Subsequent to year end, four amounts were resolved i.e. one amount is to be recovered
from the supplier, two amounts concluded as being valid expenditure and one case to be
written-off.
22.2 Details of current and prior year fruitless and wasteful expenditure – added current year (under
determination and investigation)
Incident Disciplinary steps taken/criminal
proceedings
2019/20
R’000
Car rental damages None 2
Duplicate vetting requests by the
Department for Personnel
Suitability checks.
None
7
Total 9
22.3 Prior period error
Note 2018/19
Nature of prior period error
Relating to 2016/17 and 2017/18 [affecting the
opening balance]
22.1
22
Duplicate vetting requests by the Department for
Personnel Suitability checks
22
Relating to 2018/19
15
Duplicate vetting requests by the Department for
Personnel Suitability checks
15
Total prior period errors 37
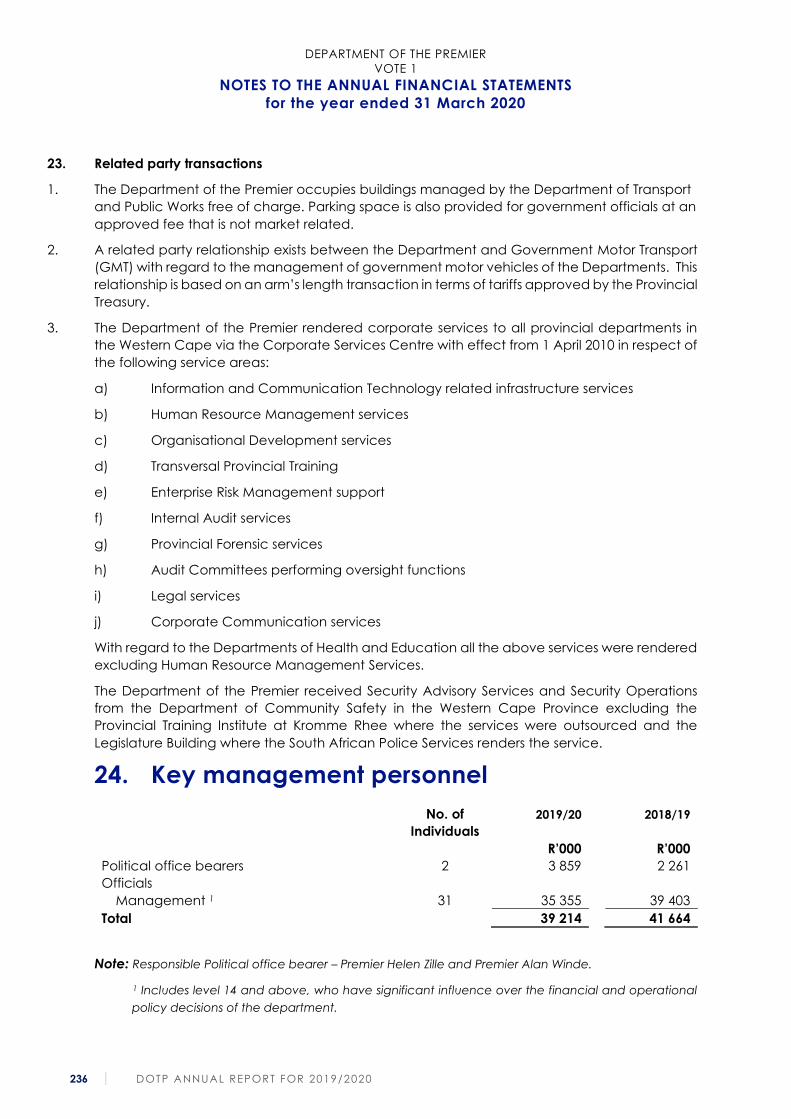
DEPARTMENT OF THE PREMIER
VOTE 1
NOTES TO THE ANNUAL FINANCIAL STATEMENTS
for the year ended 31 March 2020
236 DOTP ANNUAL REPORT FOR 2019/2020
23. Related party transactions
1. The Department of the Premier occupies buildings managed by the Department of Transport
and Public Works free of charge. Parking space is also provided for government officials at an
approved fee that is not market related.
2. A related party relationship exists between the Department and Government Motor Transport
(GMT) with regard to the management of government motor vehicles of the Departments. This
relationship is based on an arm’s length transaction in terms of tariffs approved by the Provincial
Treasury.
3. The Department of the Premier rendered corporate services to all provincial departments in
the Western Cape via the Corporate Services Centre with effect from 1 April 2010 in respect of
the following service areas:
a) Information and Communication Technology related infrastructure services
b) Human Resource Management services
c) Organisational Development services
d) Transversal Provincial Training
e) Enterprise Risk Management support
f) Internal Audit services
g) Provincial Forensic services
h) Audit Committees performing oversight functions
i) Legal services
j) Corporate Communication services
With regard to the Departments of Health and Education all the above services were rendered
excluding Human Resource Management Services.
The Department of the Premier received Security Advisory Services and Security Operations
from the Department of Community Safety in the Western Cape Province excluding the
Provincial Training Institute at Kromme Rhee where the services were outsourced and the
Legislature Building where the South African Police Services renders the service.
24. Key management personnel
No. of
Individuals
2019/20 2018/19
R’000 R’000
Political office bearers 2 3 859 2 261
Officials
Management 1 31 35 355 39 403
Total 39 214 41 664
Note: Responsible Political office bearer – Premier Helen Zille and Premier Alan Winde.
1 Includes level 14 and above, who have significant influence over the financial and operational
policy decisions of the department.
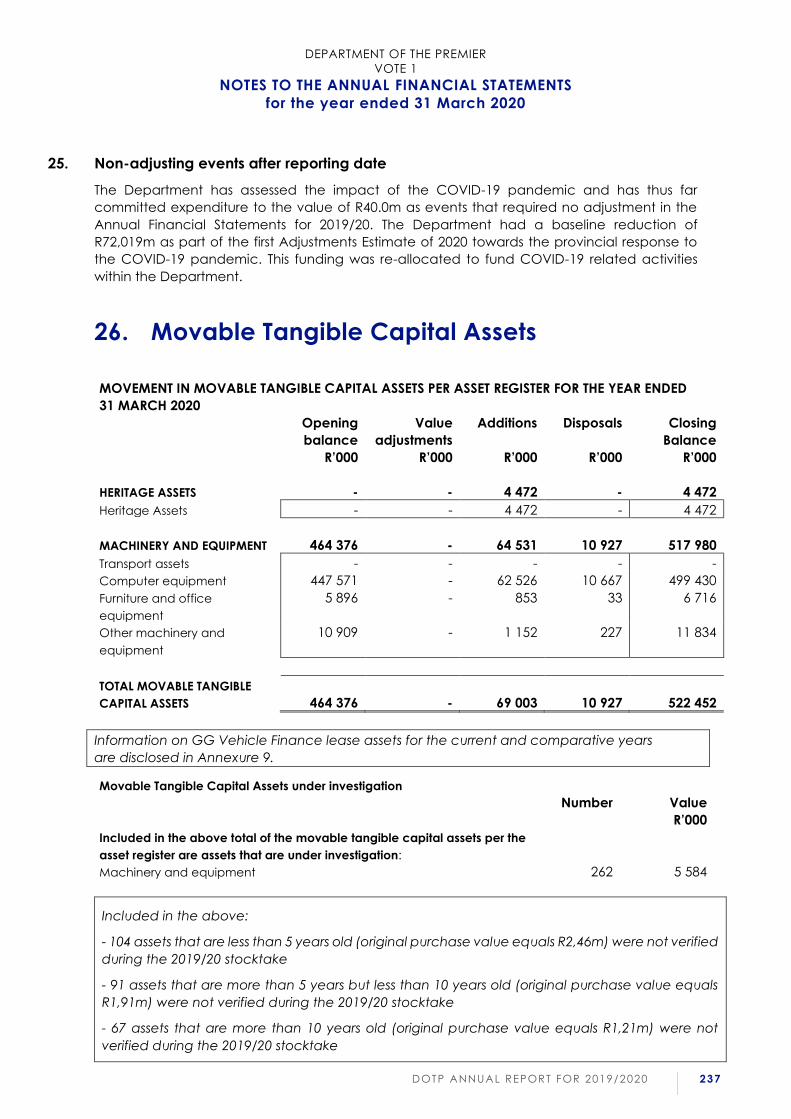
DEPARTMENT OF THE PREMIER
VOTE 1
NOTES TO THE ANNUAL FINANCIAL STATEMENTS
for the year ended 31 March 2020
DOTP ANNUAL REPORT FOR 2019/2020 237
25. Non-adjusting events after reporting date
The Department has assessed the impact of the COVID-19 pandemic and has thus far
committed expenditure to the value of R40.0m as events that required no adjustment in the
Annual Financial Statements for 2019/20. The Department had a baseline reduction of
R72,019m as part of the first Adjustments Estimate of 2020 towards the provincial response to
the COVID-19 pandemic. This funding was re-allocated to fund COVID-19 related activities
within the Department.
26. Movable Tangible Capital Assets
MOVEMENT IN MOVABLE TANGIBLE CAPITAL ASSETS PER ASSET REGISTER FOR THE YEAR ENDED
31 MARCH 2020
Opening
balance
Value
adjustments
Additions Disposals Closing
Balance
R’000 R’000 R’000 R’000 R’000
HERITAGE ASSETS - - 4 472 - 4 472
Heritage Assets - - 4 472 - 4 472
MACHINERY AND EQUIPMENT 464 376 - 64 531 10 927 517 980
Transport assets - - - - -
Computer equipment 447 571 - 62 526 10 667 499 430
Furniture and office
equipment
5 896 - 853 33 6 716
Other machinery and
equipment
10 909 - 1 152 227 11 834
TOTAL MOVABLE TANGIBLE
CAPITAL ASSETS
464 376
-
69 003
10 927
522 452
Information on GG Vehicle Finance lease assets for the current and comparative years
are disclosed in Annexure 9.
Movable Tangible Capital Assets under investigation
Number Value
R’000
Included in the above total of the movable tangible capital assets per the
asset register are assets that are under investigation:
Machinery and equipment 262 5 584
Included in the above:
- 104 assets that are less than 5 years old (original purchase value equals R2,46m) were not verified
during the 2019/20 stocktake
- 91 assets that are more than 5 years but less than 10 years old (original purchase value equals
R1,91m) were not verified during the 2019/20 stocktake
- 67 assets that are more than 10 years old (original purchase value equals R1,21m) were not
verified during the 2019/20 stocktake

DEPARTMENT OF THE PREMIER
VOTE 1
NOTES TO THE ANNUAL FINANCIAL STATEMENTS
for the year ended 31 March 2020
238 DOTP ANNUAL REPORT FOR 2019/2020
26.1 Additions
ADDITIONS TO MOVABLE TANGIBLE CAPITAL ASSETS PER ASSET REGISTER FOR THE YEAR ENDED
31 MARCH 2020
Cash Non-cash (Capital
Work in
Progress
current
costs and
finance
lease
payments)
Received
current,
not paid
(Paid
current
year,
received
prior year
Total
R’000 R’000 R’000 R’000 R’000
HERITAGE ASSETS - 4 472 - - 4 472
Heritage Assets - 4 472 - - 4 472
MACHINERY AND EQUIPMENT
35 593
35 893
(8 420)
1 465
64 531
Transport assets 8 388 - (8 388) - -
Computer equipment 25 863 35 351 - 1 312 62 526
Furniture and office
equipment
387 445 - 21 853
Other machinery and
equipment
955 97 (32) 132 1 152
TOTAL ADDITIONS TO
MOVABLE TANGIBLE CAPITAL
ASSETS
35 593
40 365
(8 420)
1 465
69 003
26.2 Disposals
DISPOSALS OF MOVABLE TANGIBLE CAPITAL ASSETS PER ASSET REGISTER FOR THE YEAR
ENDED 31 MARCH 2020
Sold for
cash
Non-cash
disposal
Total
disposals
Cash
Received
Actual
R’000 R’000 R’000 R’000
MACHINERY AND EQUIPMENT 3 165 7 762 10 927 92
Transport assets - - - -
Computer equipment 3 088 7 579 10 667 92
Furniture and office equipment 12 21 33 -
Other machinery and
equipment
65 162 227 -
TOTAL DISPOSAL OF MOVABLE
TANGIBLE CAPITAL ASSETS
3 165
10 985
10 927
92
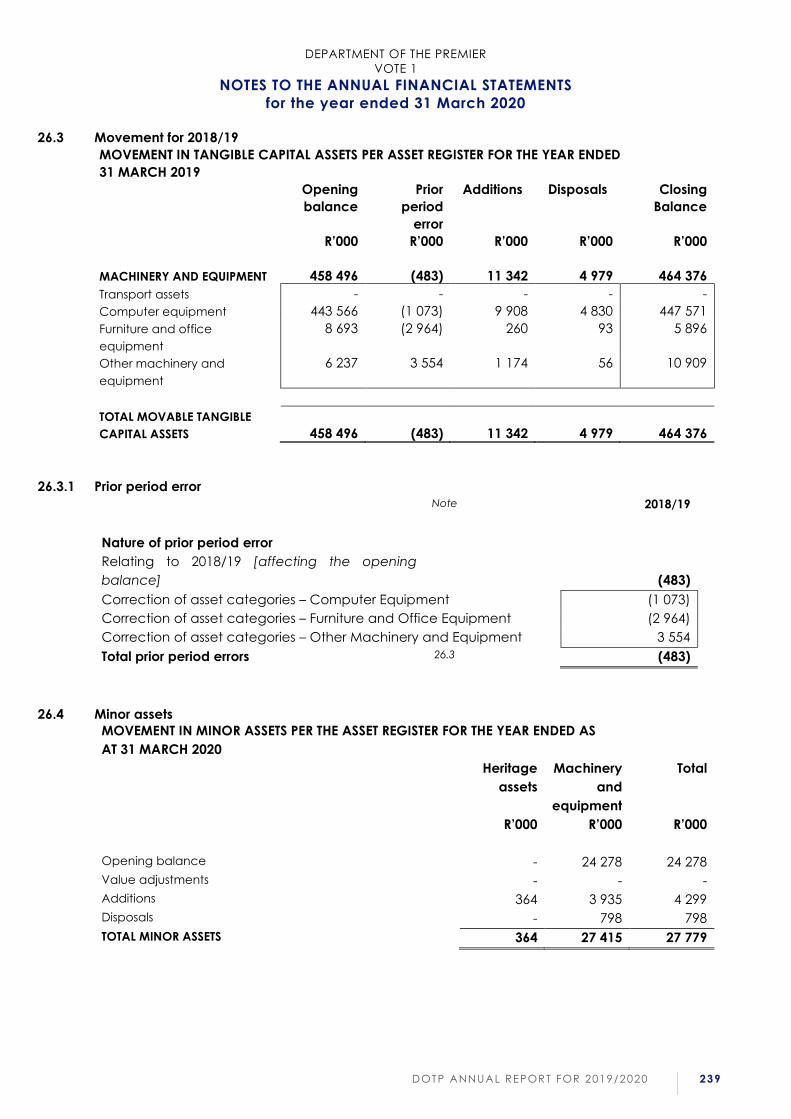
DEPARTMENT OF THE PREMIER
VOTE 1
NOTES TO THE ANNUAL FINANCIAL STATEMENTS
for the year ended 31 March 2020
DOTP ANNUAL REPORT FOR 2019/2020 239
26.3 Movement for 2018/19
MOVEMENT IN TANGIBLE CAPITAL ASSETS PER ASSET REGISTER FOR THE YEAR ENDED
31 MARCH 2019
Opening
balance
Prior
period
error
Additions Disposals Closing
Balance
R’000 R’000 R’000 R’000 R’000
MACHINERY AND EQUIPMENT 458 496 (483) 11 342 4 979 464 376
Transport assets - - - - -
Computer equipment 443 566 (1 073) 9 908 4 830 447 571
Furniture and office
equipment
8 693 (2 964) 260 93 5 896
Other machinery and
equipment
6 237 3 554 1 174 56 10 909
TOTAL MOVABLE TANGIBLE
CAPITAL ASSETS 458 496 (483) 11 342 4 979 464 376
26.3.1 Prior period error
Note 2018/19
Nature of prior period error
Relating to 2018/19 [affecting the opening
balance]
(483)
Correction of asset categories – Computer Equipment (1 073)
Correction of asset categories – Furniture and Office Equipment (2 964)
Correction of asset categories – Other Machinery and Equipment 3 554
Total prior period errors 26.3 (483)
26.4 Minor assets
MOVEMENT IN MINOR ASSETS PER THE ASSET REGISTER FOR THE YEAR ENDED AS
AT 31 MARCH 2020
Heritage
assets
Machinery
and
equipment
Total
R’000 R’000 R’000
Opening balance - 24 278 24 278
Value adjustments - - -
Additions 364 3 935 4 299
Disposals - 798 798
TOTAL MINOR ASSETS 364 27 415 27 779
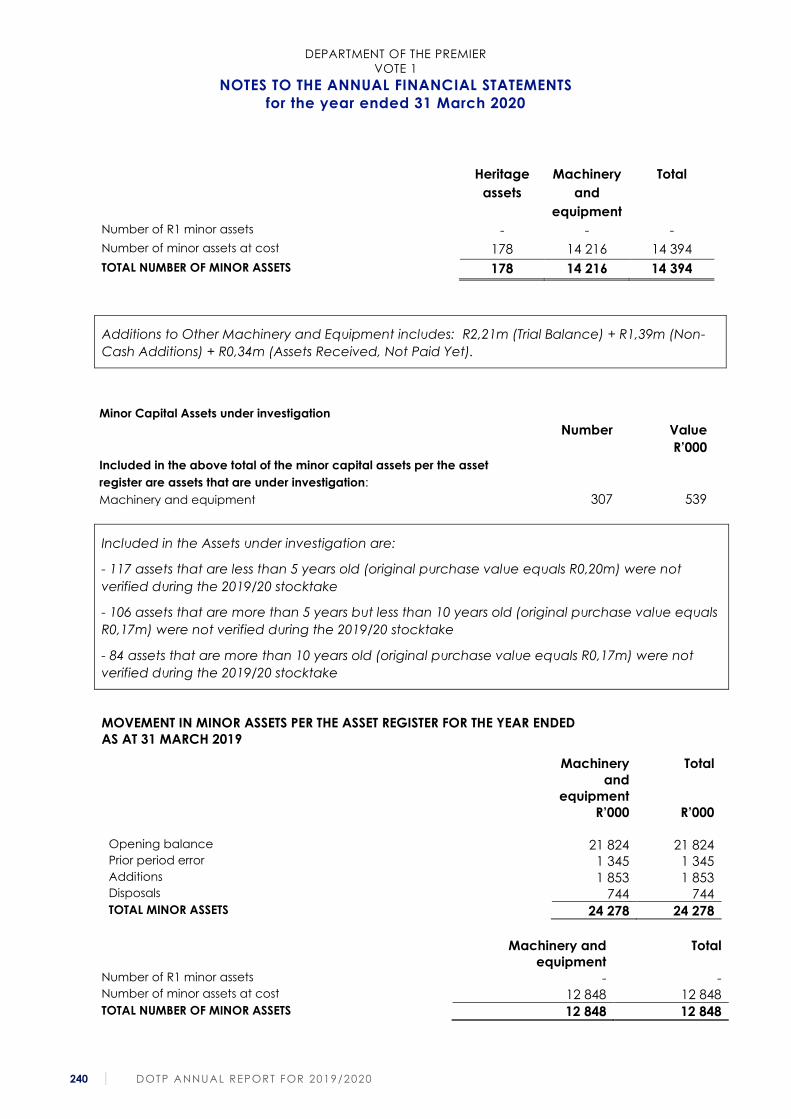
DEPARTMENT OF THE PREMIER
VOTE 1
NOTES TO THE ANNUAL FINANCIAL STATEMENTS
for the year ended 31 March 2020
240 DOTP ANNUAL REPORT FOR 2019/2020
Heritage
assets
Machinery
and
equipment
Total
Number of R1 minor assets - - -
Number of minor assets at cost 178 14 216 14 394
TOTAL NUMBER OF MINOR ASSETS 178 14 216 14 394
Additions to Other Machinery and Equipment includes: R2,21m (Trial Balance) + R1,39m (Non-
Cash Additions) + R0,34m (Assets Received, Not Paid Yet).
Minor Capital Assets under investigation
Number Value
R’000
Included in the above total of the minor capital assets per the asset
register are assets that are under investigation:
Machinery and equipment 307 539
Included in the Assets under investigation are:
- 117 assets that are less than 5 years old (original purchase value equals R0,20m) were not
verified during the 2019/20 stocktake
- 106 assets that are more than 5 years but less than 10 years old (original purchase value equals
R0,17m) were not verified during the 2019/20 stocktake
- 84 assets that are more than 10 years old (original purchase value equals R0,17m) were not
verified during the 2019/20 stocktake
MOVEMENT IN MINOR ASSETS PER THE ASSET REGISTER FOR THE YEAR ENDED
AS AT 31 MARCH 2019
Machinery
and
equipment
Total
R’000 R’000 Opening balance 21 824 21 824 Prior period error 1 345 1 345 Additions 1 853 1 853 Disposals 744 744 TOTAL MINOR ASSETS 24 278 24 278
Machinery and
equipment
Total
Number of R1 minor assets - - Number of minor assets at cost 12 848 12 848 TOTAL NUMBER OF MINOR ASSETS 12 848 12 848

DEPARTMENT OF THE PREMIER
VOTE 1
NOTES TO THE ANNUAL FINANCIAL STATEMENTS
for the year ended 31 March 2020
DOTP ANNUAL REPORT FOR 2019/2020 241
26.4.1 Prior period error
Note 2018/19
R’000
Nature of prior period error
Relating to 2018/19 [affecting the opening
balance]
1 345
Correction of 2018 / 2019 closing balance 1 345
Total prior period errors 1 345
The 2018/19 asset register totals were reviewed and it was identified that the closing Rand
values R1,35m were erroneously understated whilst the quantities recorded was correct.
26.5 Movable assets written off
MOVABLE ASSETS WRITTEN OFF FOR THE YEAR ENDED AS AT 31 MARCH 2020
Intangible
assets
Heritage
assets
Machinery
and
equipment
Total
R’000 R’000 R’000 R’000 Assets written off - - 1 754 1 754 TOTAL MOVABLE ASSETS WRITTEN OFF - - 1 754 1 754
MOVABLE ASSETS WRITTEN OFF FOR THE YEAR ENDED AS AT 31 MARCH 2019
Intangible
assets
Heritage
assets
Machinery
and
equipment
Total
R’000 R’000 R’000 R’000 Assets written off
- - 1 100 1 100
TOTAL MOVABLE ASSETS WRITTEN OFF - - 1 100 1 100
26.6 S42 Movable capital assets
MAJOR ASSETS TO BE TRANSFERRED IN TERMS OF S42 OF THE PFMA - 31 MARCH 2020
Intangible
assets
Heritage
assets
Machinery
and
equipment
Total
No. of Assets - - - - Value of the assets (R’000) - - - -
MINOR ASSETS TO BE TRANSFERRED IN TERMS OF S42 OF THE PFMA - 31 MARCH 2020
Intangible
assets
Heritage
assets
Machinery
and
equipment
Total
No. of Assets - - - - Value of the assets (R’000) - - - -
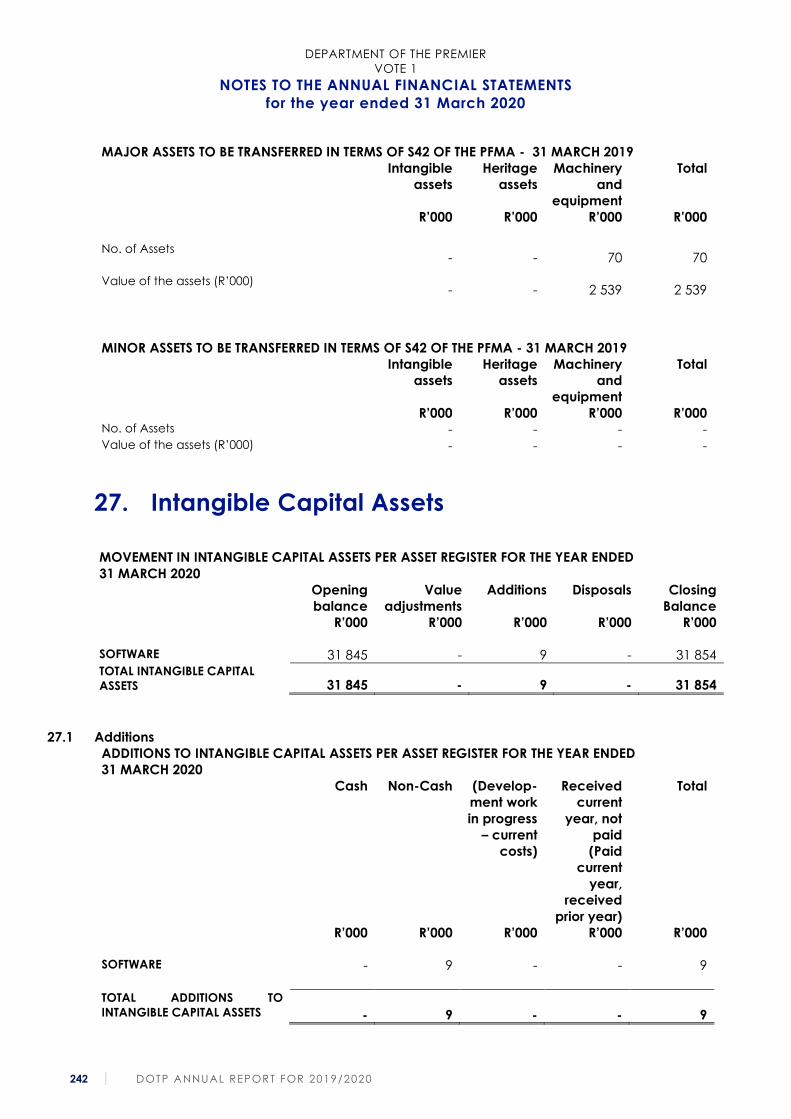
DEPARTMENT OF THE PREMIER
VOTE 1
NOTES TO THE ANNUAL FINANCIAL STATEMENTS
for the year ended 31 March 2020
242 DOTP ANNUAL REPORT FOR 2019/2020
MAJOR ASSETS TO BE TRANSFERRED IN TERMS OF S42 OF THE PFMA - 31 MARCH 2019
Intangible
assets
Heritage
assets
Machinery
and
equipment
Total
R’000 R’000 R’000 R’000 No. of Assets
- - 70 70
Value of the assets (R’000) - - 2 539 2 539
MINOR ASSETS TO BE TRANSFERRED IN TERMS OF S42 OF THE PFMA - 31 MARCH 2019
Intangible
assets
Heritage
assets
Machinery
and
equipment
Total
R’000 R’000 R’000 R’000 No. of Assets - - - - Value of the assets (R’000) - - - -
27. Intangible Capital Assets
MOVEMENT IN INTANGIBLE CAPITAL ASSETS PER ASSET REGISTER FOR THE YEAR ENDED
31 MARCH 2020
Opening
balance
Value
adjustments
Additions Disposals Closing
Balance
R’000 R’000 R’000 R’000 R’000
SOFTWARE 31 845 - 9 - 31 854 TOTAL INTANGIBLE CAPITAL
ASSETS 31 845 - 9 - 31 854
27.1 Additions
ADDITIONS TO INTANGIBLE CAPITAL ASSETS PER ASSET REGISTER FOR THE YEAR ENDED
31 MARCH 2020
Cash Non-Cash (Develop-
ment work
in progress
– current
costs)
Received
current
year, not
paid
(Paid
current
year,
received
prior year)
Total
R’000 R’000 R’000 R’000 R’000
SOFTWARE - 9 - - 9 TOTAL ADDITIONS TO
INTANGIBLE CAPITAL ASSETS
-
9
-
-
9
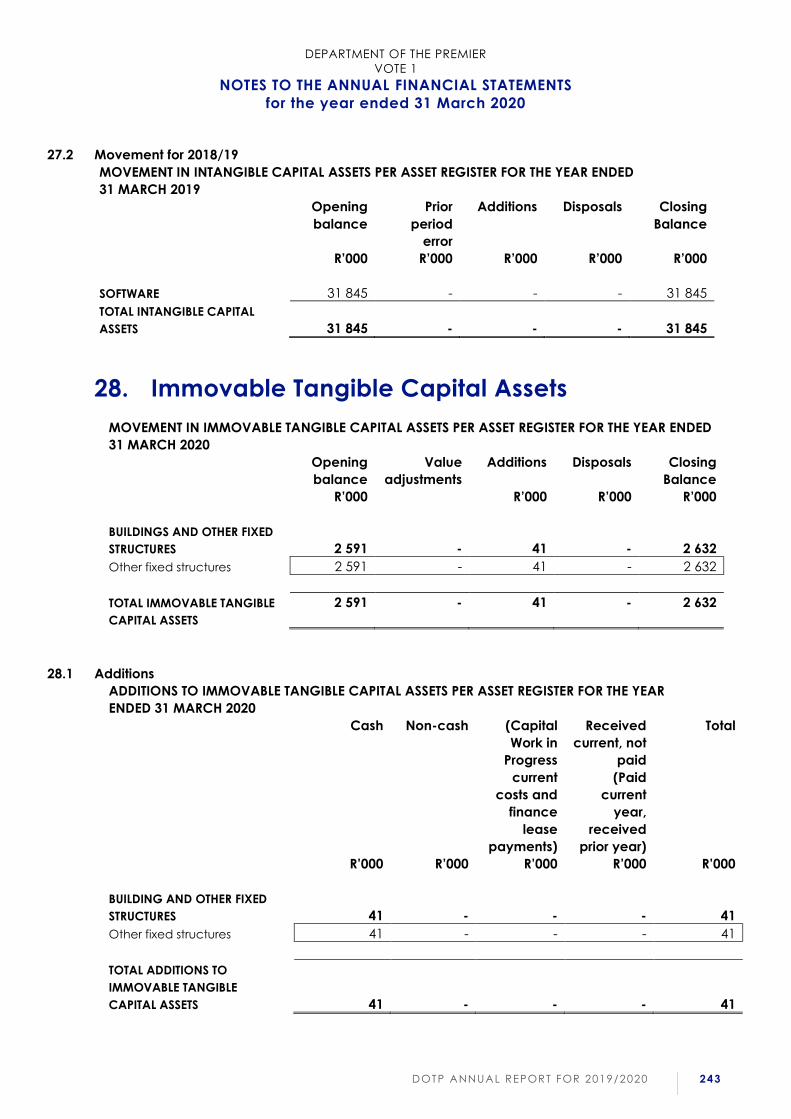
DEPARTMENT OF THE PREMIER
VOTE 1
NOTES TO THE ANNUAL FINANCIAL STATEMENTS
for the year ended 31 March 2020
DOTP ANNUAL REPORT FOR 2019/2020 243
27.2 Movement for 2018/19
MOVEMENT IN INTANGIBLE CAPITAL ASSETS PER ASSET REGISTER FOR THE YEAR ENDED
31 MARCH 2019
Opening
balance
Prior
period
error
Additions Disposals Closing
Balance
R’000 R’000 R’000 R’000 R’000
SOFTWARE 31 845 - - - 31 845
TOTAL INTANGIBLE CAPITAL
ASSETS 31 845 - - - 31 845
28. Immovable Tangible Capital Assets
MOVEMENT IN IMMOVABLE TANGIBLE CAPITAL ASSETS PER ASSET REGISTER FOR THE YEAR ENDED
31 MARCH 2020
Opening
balance
Value
adjustments
Additions Disposals Closing
Balance
R’000 R’000 R’000 R’000
BUILDINGS AND OTHER FIXED
STRUCTURES 2 591
-
41
-
2 632
Other fixed structures 2 591 - 41 - 2 632
TOTAL IMMOVABLE TANGIBLE
CAPITAL ASSETS
2 591 - 41 - 2 632
28.1 Additions
ADDITIONS TO IMMOVABLE TANGIBLE CAPITAL ASSETS PER ASSET REGISTER FOR THE YEAR
ENDED 31 MARCH 2020
Cash Non-cash (Capital
Work in
Progress
current
costs and
finance
lease
payments)
Received
current, not
paid
(Paid
current
year,
received
prior year)
Total
R’000 R’000 R’000 R’000 R’000
BUILDING AND OTHER FIXED
STRUCTURES
41
-
-
-
41
Other fixed structures 41 - - - 41
TOTAL ADDITIONS TO
IMMOVABLE TANGIBLE
CAPITAL ASSETS
41
-
-
-
41
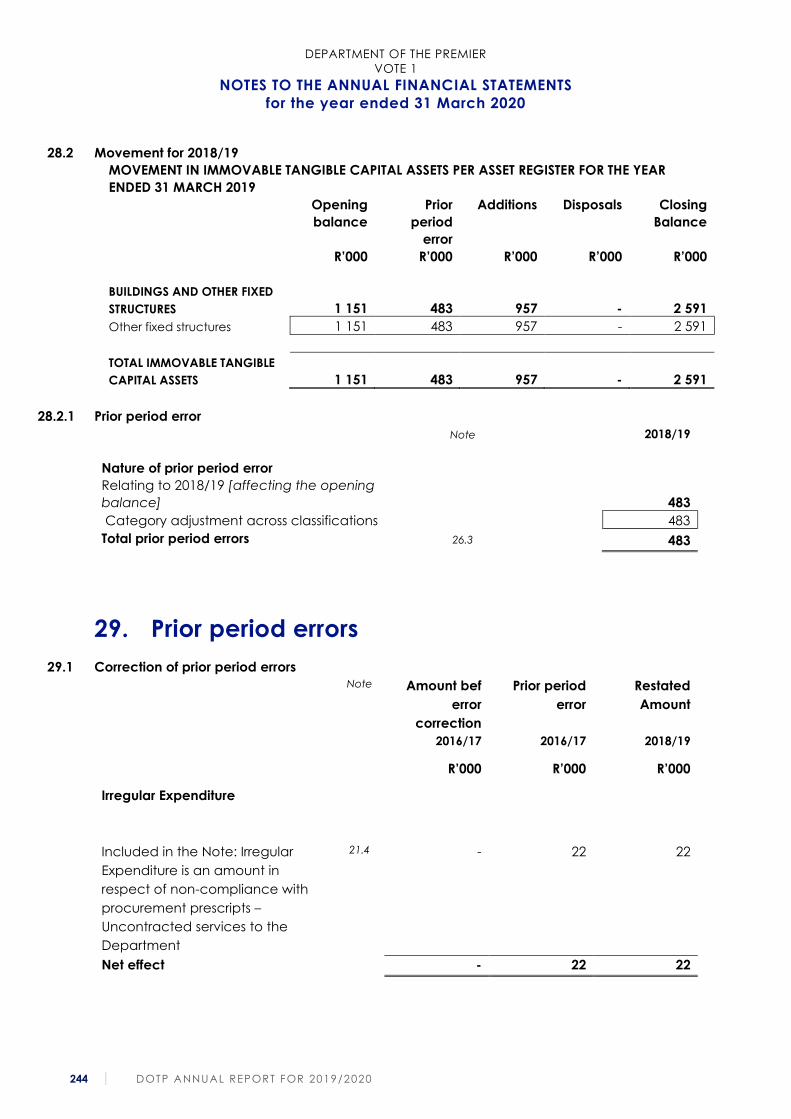
DEPARTMENT OF THE PREMIER
VOTE 1
NOTES TO THE ANNUAL FINANCIAL STATEMENTS
for the year ended 31 March 2020
244 DOTP ANNUAL REPORT FOR 2019/2020
28.2 Movement for 2018/19
MOVEMENT IN IMMOVABLE TANGIBLE CAPITAL ASSETS PER ASSET REGISTER FOR THE YEAR
ENDED 31 MARCH 2019
Opening
balance
Prior
period
error
Additions Disposals Closing
Balance
R’000 R’000 R’000 R’000 R’000
BUILDINGS AND OTHER FIXED
STRUCTURES 1 151 483 957 - 2 591
Other fixed structures 1 151 483 957 - 2 591
TOTAL IMMOVABLE TANGIBLE
CAPITAL ASSETS 1 151 483 957 - 2 591
28.2.1 Prior period error
Note 2018/19
Nature of prior period error
Relating to 2018/19 [affecting the opening
balance]
483
Category adjustment across classifications 483
Total prior period errors 26.3 483
29. Prior period errors
29.1 Correction of prior period errors
Note Amount bef
error
correction
Prior period
error
Restated
Amount
2016/17 2016/17 2018/19
R’000 R’000 R’000
Irregular Expenditure
Included in the Note: Irregular
Expenditure is an amount in
respect of non-compliance with
procurement prescripts –
Uncontracted services to the
Department
21.4 - 22 22
Net effect - 22 22

DEPARTMENT OF THE PREMIER
VOTE 1
NOTES TO THE ANNUAL FINANCIAL STATEMENTS
for the year ended 31 March 2020
DOTP ANNUAL REPORT FOR 2019/2020 245
Amount bef
error
correction
Prior period
error
Restated
Amount
2017/18 2017/18 2018/19
R’000 R’000 R’000
Included in the Note: Irregular
Expenditure is an amount in
respect of non-compliance with
procurement prescripts –
Uncontracted services to the
Department
21.4 - 35 35
Net effect - 35 35
Amount bef
error
correction
Prior period
error
Restated
Amount
2018/19 2018/19 2018/19
R’000 R’000 R’000
Included in the Note: Irregular
Expenditure is an amount in
respect of non-compliance with
procurement prescripts –
Uncontracted services to the
Department
21.4
-
67
67
Net effect - 67 67
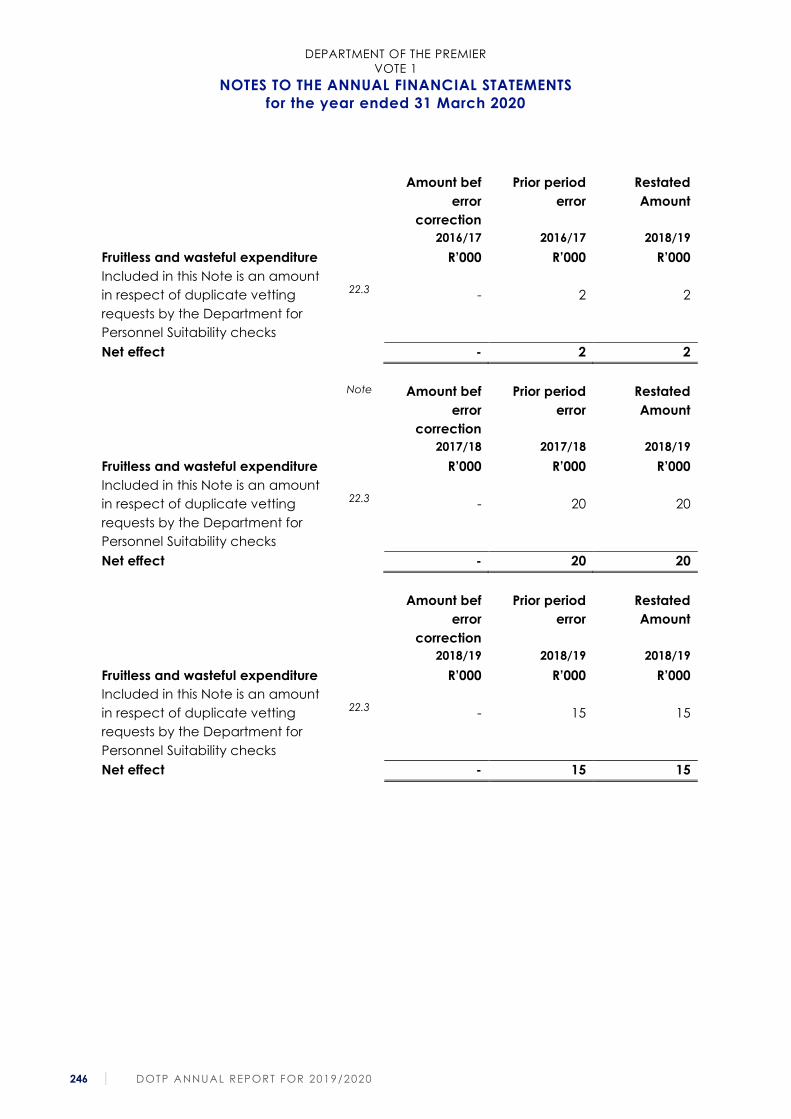
DEPARTMENT OF THE PREMIER
VOTE 1
NOTES TO THE ANNUAL FINANCIAL STATEMENTS
for the year ended 31 March 2020
246 DOTP ANNUAL REPORT FOR 2019/2020
Amount bef
error
correction
Prior period
error
Restated
Amount
2016/17 2016/17 2018/19
Fruitless and wasteful expenditure R’000 R’000 R’000
Included in this Note is an amount
in respect of duplicate vetting
requests by the Department for
Personnel Suitability checks
22.3
-
2
2
Net effect - 2 2
Note Amount bef
error
correction
Prior period
error
Restated
Amount
2017/18 2017/18 2018/19
Fruitless and wasteful expenditure R’000 R’000 R’000
Included in this Note is an amount
in respect of duplicate vetting
requests by the Department for
Personnel Suitability checks
22.3
-
20
20
Net effect - 20 20
Amount bef
error
correction
Prior period
error
Restated
Amount
2018/19 2018/19 2018/19
Fruitless and wasteful expenditure R’000 R’000 R’000
Included in this Note is an amount
in respect of duplicate vetting
requests by the Department for
Personnel Suitability checks
22.3
-
15
15
Net effect - 15 15

DEPARTMENT OF THE PREMIER
VOTE 1
NOTES TO THE ANNUAL FINANCIAL STATEMENTS
for the year ended 31 March 2020
DOTP ANNUAL REPORT FOR 2019/2020 247
Amount bef
error
correction
Prior period
error
Restated
Amount
2018/19 2018/19 2018/19
Expenditure
Minor Assets
R’000 R’000 R’000
Machinery and equipment
26.4
26.4.1
21 824
1 345
23 169
Net effect 21 824 1 345 23 169
Movable Tangible Capital Assets
Computer Equipment 443 566 (1 073) 442 493
Furniture and office equipment 8 693 (2 964) 5 729
Other machinery and equipment 6 237 3 554 9 791
Immovable Tangible Capital Assets
Machinery and equipment
1 151
483
1 634
Net effect 459 647 - 459 647
The amount of R0,48m was shifted to other fixed structures.
DEPARTMENT OF THE PREMIER
VOTE 1
NOTES TO THE ANNUAL FINANCIAL STATEMENTS
for the year ended 31 March 2020
248 DOTP ANNUAL REPORT FOR 2019/2020
30. BROAD BASED BLACK ECONOMIC
EMPOWERMENT PERFORMANCE
Information on compliance with the B-BBEE Act is included in the annual report under
the section titled B-BBEE Compliance Performance Information.
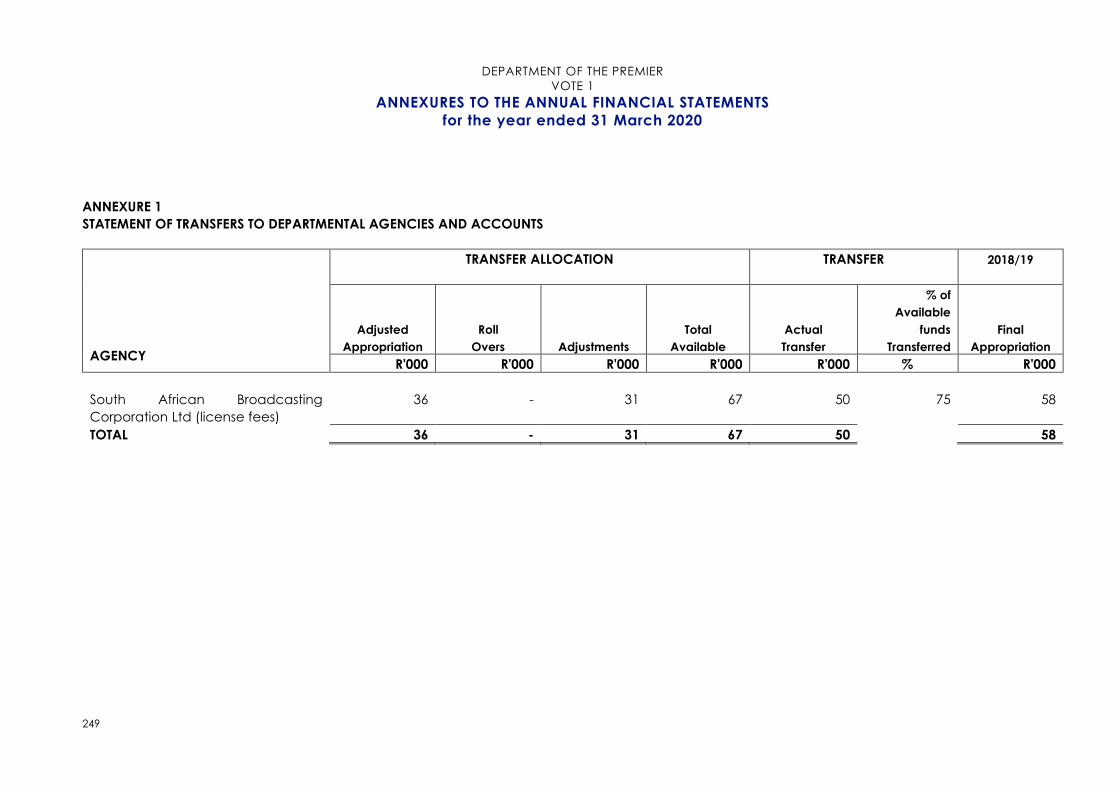
DEPARTMENT OF THE PREMIER
VOTE 1
ANNEXURES TO THE ANNUAL FINANCIAL STATEMENTS
for the year ended 31 March 2020
249
ANNEXURE 1
STATEMENT OF TRANSFERS TO DEPARTMENTAL AGENCIES AND ACCOUNTS
AGENCY
TRANSFER ALLOCATION
TRANSFER 2018/19
Adjusted
Appropriation
Roll
Overs Adjustments
Total
Available
Actual
Transfer
% of
Available
funds
Transferred
Final
Appropriation
R'000 R'000 R'000 R'000 R'000 % R'000
South African Broadcasting
Corporation Ltd (license fees)
36 - 31 67 50 75 58
TOTAL 36 - 31 67 50 58

DEPARTMENT OF THE PREMIER
VOTE 1
ANNEXURES TO THE ANNUAL FINANCIAL STATEMENTS
for the year ended 31 March 2020
250
ANNEXURE 2
STATEMENT OF TRANSFERS TO NON-PROFIT INSTITUTIONS
1 Library Business Corners - at the end of the year there was an unspent amount of R0,16m.
2 Cape Higher Education Consortium - at the end of the year there was an unspent amount of R0,17m.
NON-PROFIT INSTITUTIONS
TRANSFER ALLOCATION EXPENDITURE 2018/19
Adjusted
Appro-
priation
Act Roll overs
Adjust-
ments
Total
Available
Actual
Transfer
% of
Available
funds
transferred
Final
Appropria-
tion
R'000 R'000 R'000 R'000 R'000 % R'000
Transfers
Library Business Corners 1 21 000 - - 21 000 21 000 100 19 700
Cape Higher Education Consortium 2 500 - - 500 500 100 500
TOTAL 21 500 - - 21 500 21 500 20 200
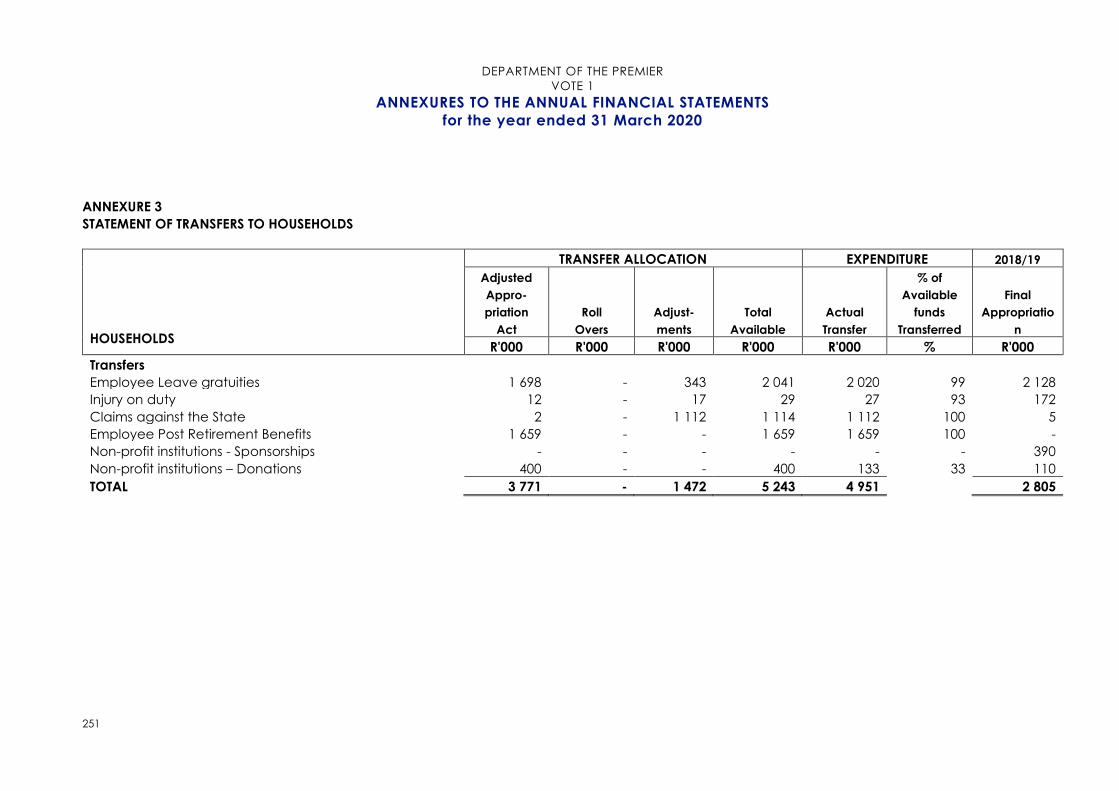
DEPARTMENT OF THE PREMIER
VOTE 1
ANNEXURES TO THE ANNUAL FINANCIAL STATEMENTS
for the year ended 31 March 2020
251
ANNEXURE 3
STATEMENT OF TRANSFERS TO HOUSEHOLDS
HOUSEHOLDS
TRANSFER ALLOCATION EXPENDITURE 2018/19
Adjusted
Appro-
priation
Act
Roll
Overs
Adjust-
ments
Total
Available
Actual
Transfer
% of
Available
funds
Transferred
Final
Appropriatio
n
R'000 R'000 R'000 R'000 R'000 % R'000
Transfers
Employee Leave gratuities 1 698 - 343 2 041 2 020 99 2 128
Injury on duty 12 - 17 29 27 93 172
Claims against the State 2 - 1 112 1 114 1 112 100 5
Employee Post Retirement Benefits 1 659 - - 1 659 1 659 100 -
Non-profit institutions - Sponsorships - - - - - - 390
Non-profit institutions – Donations 400 - - 400 133 33 110
TOTAL 3 771 - 1 472 5 243 4 951 2 805

DEPARTMENT OF THE PREMIER
VOTE 1
ANNEXURES TO THE ANNUAL FINANCIAL STATEMENTS
for the year ended 31 March 2020
252
ANNEXURE 4
STATEMENT OF GIFTS, DONATIONS AND SPONSORSHIPS RECEIVED
NAME OF ORGANISATION NATURE OF GIFT, DONATION OR SPONSORSHIP
2019/20 2018/19
R’000 R’000
Received in kind
Public Health and Social
Development Sectoral Bargaining
Council (PHSDSBC)
In Harmonie
Public Service Coordinating
Bargaining Council (PSCBC)
Donation to cover travel and accommodation cost for one official who attended the
Labour Law Conference held in Mauritius for the period 18 to 22 June 2019.
Donation to use the venue and services of In Harmonie for a capacity building
workshop for the Chief Directorate: Policy and Strategy.
Donation to cover travel and accommodation costs for one official who attended the
12th International Labour and Employment Relations Association (ILERA) European
Congress held in Dusseldorf, Germany for the period 5 to 7 September 2019.
45
12
121
Department of Health The Department of Health`s Medical Depot donated limited supplies of hand sanitizers
and gloves at the early stages of the onset of COVID-19 which was issued to
employees in the Department of the Premier while internal procurement processes
commenced to obtain additional supplies.
11
Huawei Technologies
Sponsorship to cover travel and accommodation costs for three officials who
attended the Huawei Connect Conference from 6 till 14 October 2018 in the People's
Republic of China.
180
Microsoft
Friedrich Naumann Foundation
Sponsorship to cover accommodation cost for one official who attended Microsoft's
Smart City Expo World Congress from 11 to 16 November 2018 in Barcelona.
Sponsorship to cover travel and accommodation costs for one official to co-facilitate
a seminar on translating values into policy, programmes and delivery in Government
from 25 November 2018 until 7 December 2018 in Germany.
40
16
TOTAL 189 236

DEPARTMENT OF THE PREMIER
VOTE 1
ANNEXURES TO THE ANNUAL FINANCIAL STATEMENTS
for the year ended 31 March 2020
253
ANNEXURE 5
STATEMENT OF CONTINGENT LIABILITIES AS AT 31 MARCH 2020
NATURE OF LIABILITY
Opening
Balance
Liabilities
incurred
during the
year
Liabilities
paid /
cancelled /
reduced
during the
year
Liabilities
recoverable
Closing
Balance
1 April 2019
31 March
2020
R’000 R’000 R’000 R’000 R’000
Claims against the department
Unfair dismissal dispute - 747 747 - -
JF van Niekerk and Others (Seemeeu Park) – Property damages claim1 184 827 - - - 184 827
TOTAL 184 827 747 747 - 184 827
Note: 1 The Plaintiffs have cited the Premier (as the First Defendant) for the payment of delictual damages suffered for pure economic loss following the
approval of a proposed development plan for portion 101 of the farm “Vyf Braamfontein” known as Seemeeu Park located in Hartenbos Mossel Bay. The
department is defending the claim, as it believes the summons is materially defective as it fails to disclose a legitimate cause of action on which to hold
the department liable for the damages claimed.
There have been exceptions raised and the plaintiff responded with an amendment of their particulars of claim. The amended particulars were
subsequently excepted to by all the defendants. The matter has been discussed with counsel and the state attorney has further been instructed to set the
current exception down for hearing as the plaintiff has failed to respond to this. The current status is that a hearing date is being awaited for the exception
to be argued.
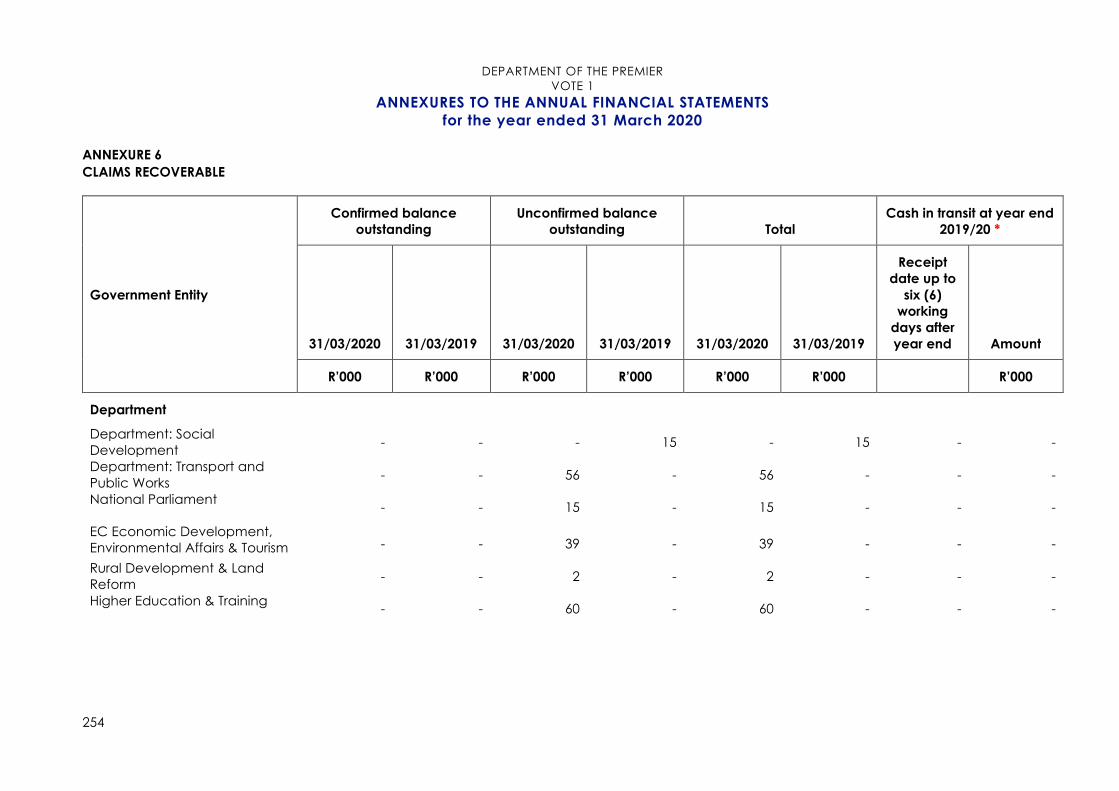
DEPARTMENT OF THE PREMIER
VOTE 1
ANNEXURES TO THE ANNUAL FINANCIAL STATEMENTS
for the year ended 31 March 2020
254
ANNEXURE 6
CLAIMS RECOVERABLE
Government Entity
Confirmed balance
outstanding
Unconfirmed balance
outstanding Total
Cash in transit at year end
2019/20 *
31/03/2020 31/03/2019 31/03/2020 31/03/2019 31/03/2020 31/03/2019
Receipt
date up to
six (6)
working
days after
year end Amount
R’000 R’000 R’000 R’000 R’000 R’000 R’000
Department
Department: Social
Development - - - 15 - 15 - -
Department: Transport and
Public Works - - 56 - 56 - - -
National Parliament - - 15 - 15 - - -
EC Economic Development,
Environmental Affairs & Tourism - - 39 - 39 - - -
Rural Development & Land
Reform - - 2 - 2 - - -
Higher Education & Training - - 60 - 60 - - -

DEPARTMENT OF THE PREMIER
VOTE 1
ANNEXURES TO THE ANNUAL FINANCIAL STATEMENTS
for the year ended 31 March 2020
255
ANNEXURE 6 (CONTINUED)
CLAIMS RECOVERABLE
Government Entity
Confirmed balance
outstanding
Unconfirmed balance
outstanding Total
Cash in transit at year end
2019/20
31/03/2020 31/03/2019 31/03/2020 31/03/2019 31/03/2020 31/03/2019
Receipt
date up to
six (6)
working
days after
year end Amount
R’000 R’000 R’000 R’000 R’000 R’000 R’000
WC Local Government - 1 9 - 9 1 - -
WC Provincial Treasury 24 170 - 7 24 177 - -
WC Social Development - 484 - - - 484 - -
WC Transport and Public Works 218 554 - - 218 554 - -
WC Economic Development
and Tourism 480 97 11 46 491 143 03.04.2020 480
WC Human Settlements 319 - 8 - 327 - - -
WC Agriculture - 73 - - - 73 - -
WC Health 1 601 440 - - 1 601 440 - -
WC Cultural Affairs and Sport - - 8 - 8 - - -
WC Community Safety - - 25 39 25 39 - -
WC Environmental Affairs and
Development Planning - 302 - - - 302 - -
WC Education - - - 25 - 25 - -
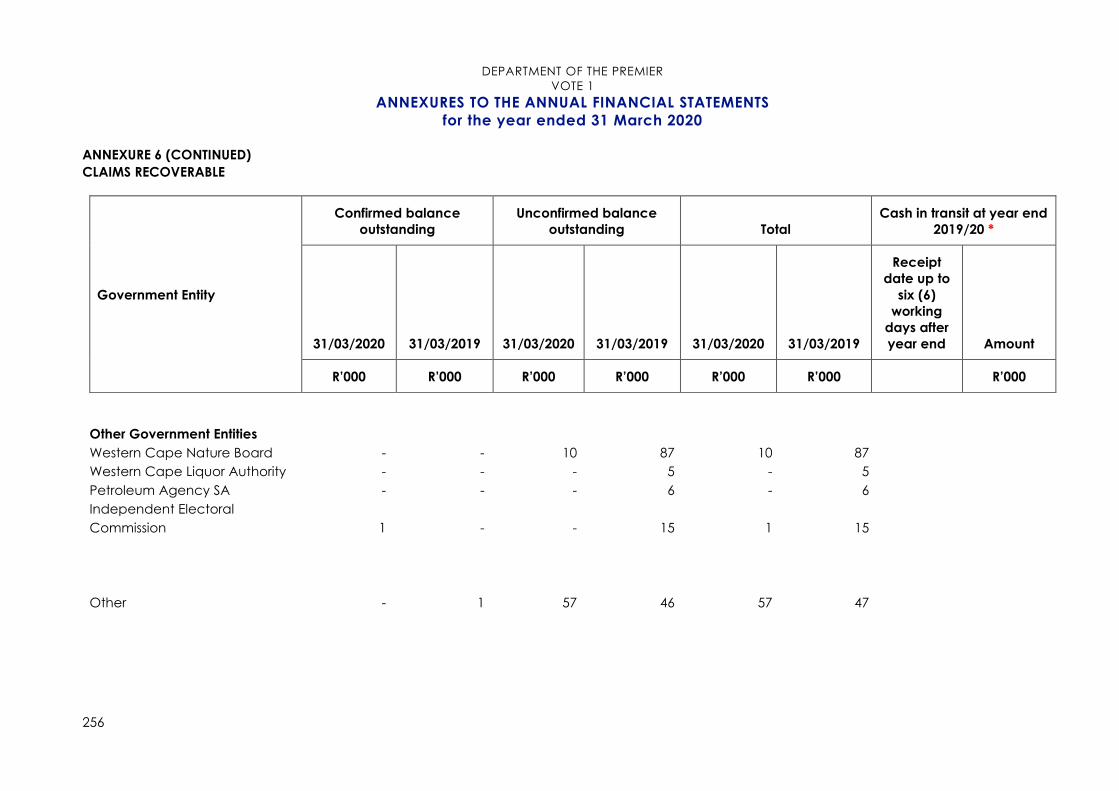
DEPARTMENT OF THE PREMIER
VOTE 1
ANNEXURES TO THE ANNUAL FINANCIAL STATEMENTS
for the year ended 31 March 2020
256
ANNEXURE 6 (CONTINUED)
CLAIMS RECOVERABLE
Government Entity
Confirmed balance
outstanding
Unconfirmed balance
outstanding Total
Cash in transit at year end
2019/20 *
31/03/2020 31/03/2019 31/03/2020 31/03/2019 31/03/2020 31/03/2019
Receipt
date up to
six (6)
working
days after
year end Amount
R’000 R’000 R’000 R’000 R’000 R’000 R’000
Other Government Entities
Western Cape Nature Board - - 10 87 10 87
Western Cape Liquor Authority - - - 5 - 5
Petroleum Agency SA - - - 6 - 6
Independent Electoral
Commission
1 - - 15 1 15
Other
- 1
57 46
57 47

DEPARTMENT OF THE PREMIER
VOTE 1
ANNEXURES TO THE ANNUAL FINANCIAL STATEMENTS
for the year ended 31 March 2020
257
ANNEXURE 6 (CONTINUED)
CLAIMS RECOVERABLE
Government Entity
Confirmed balance
outstanding
Unconfirmed balance
outstanding Total
Cash in transit at year
end 2019/20 *
31/03/2020 31/03/2019 31/03/2020 31/03/2019 31/03/2020 31/03/2019
Receipt
date up to
six (6)
working
days after
year end Amount
R’000 R’000 R’000 R’000 R’000 R’000 R’000
Beaufort West Municipality - - - 2 - 2
Bitou Municipality - - 32 31 32 31
Berg River Municipality - 2 - - - 2
Breede Valley Municipality - - 21 19 21 19
Cape Agulhas Municipality - - - 1 - 1
Cederberg Municipality - - 3 3 3 3
City of Cape Town
Municipality - - 45 383 45 383
Drakenstein Municipality - - 17 37 17 37
Eden District Municipality - - - 37 - 37
Garden Route Municipality - - - 10 - 10
George Municipality - - 7 4 7 4
Hessequa Municipality - - - 1 - 1
Kannaland Municipality - - 53 47 53 47
Langeberg Municipality - - 3 4 3 4
Matzikama Municipality - - 1 15 1 15
Mossel Bay Municipality - - 66 11 66 11
Municipal Demarcation Board - - - - - -
Oudtshoorn Municipality - - 7 4 7 4
Overstrand Municipality - - - 44 - 44
Prince Albert Municipality - - 2 1 2 1
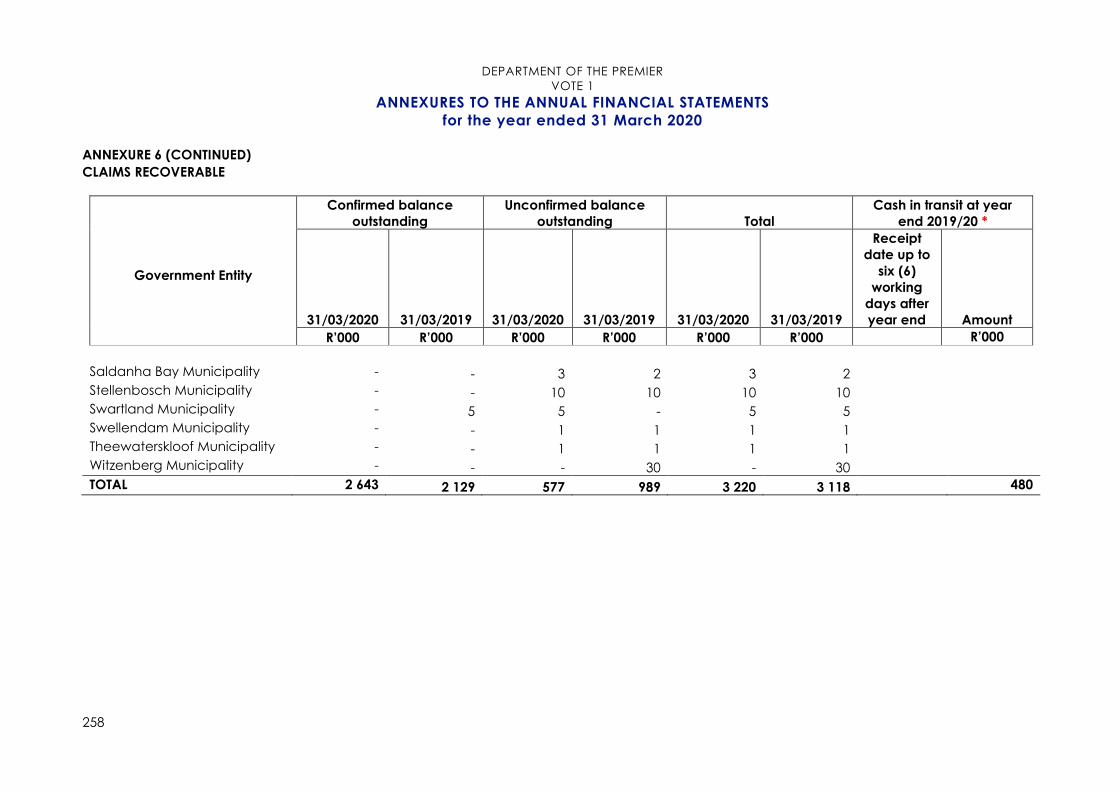
DEPARTMENT OF THE PREMIER
VOTE 1
ANNEXURES TO THE ANNUAL FINANCIAL STATEMENTS
for the year ended 31 March 2020
258
ANNEXURE 6 (CONTINUED)
CLAIMS RECOVERABLE
Government Entity
Confirmed balance
outstanding
Unconfirmed balance
outstanding Total
Cash in transit at year
end 2019/20 *
31/03/2020 31/03/2019 31/03/2020 31/03/2019 31/03/2020 31/03/2019
Receipt
date up to
six (6)
working
days after
year end Amount
R’000 R’000 R’000 R’000 R’000 R’000 R’000
Saldanha Bay Municipality - - 3 2 3 2
Stellenbosch Municipality - - 10 10 10 10
Swartland Municipality - 5 5 - 5 5
Swellendam Municipality - - 1 1 1 1
Theewaterskloof Municipality - - 1 1 1 1
Witzenberg Municipality - - - 30 - 30
TOTAL 2 643 2 129 577 989 3 220 3 118 480
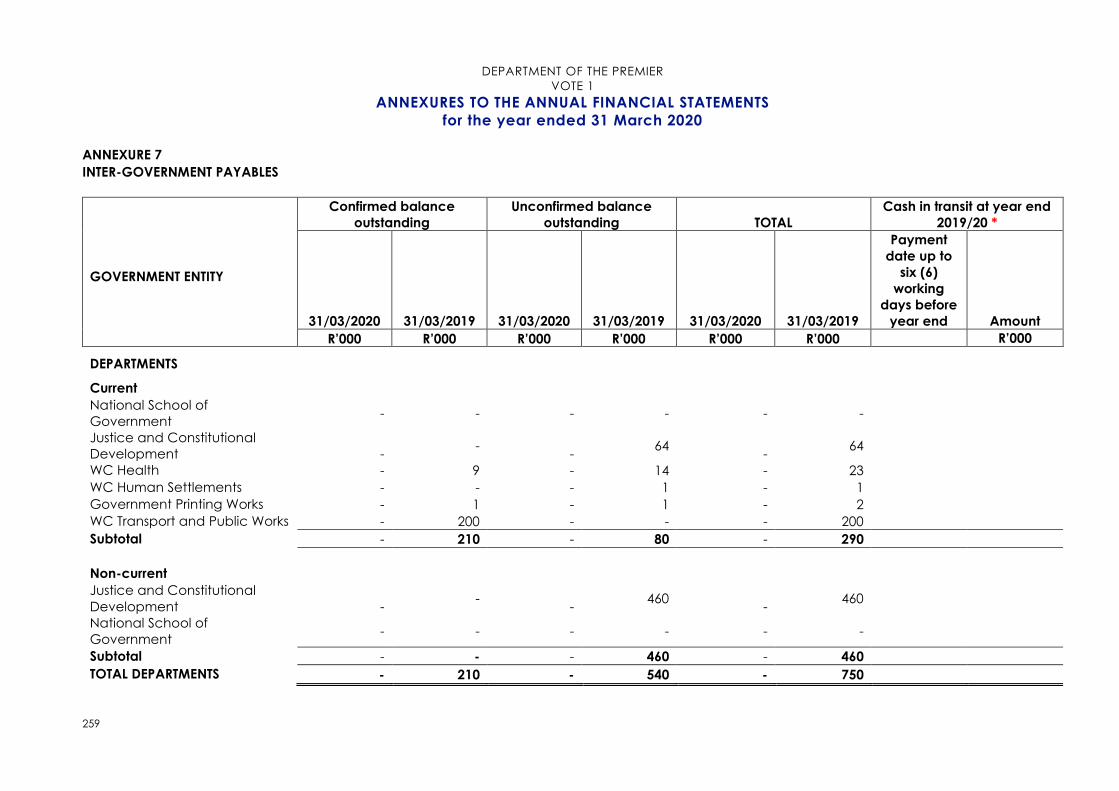
DEPARTMENT OF THE PREMIER
VOTE 1
ANNEXURES TO THE ANNUAL FINANCIAL STATEMENTS
for the year ended 31 March 2020
259
ANNEXURE 7
INTER-GOVERNMENT PAYABLES
GOVERNMENT ENTITY
Confirmed balance
outstanding
Unconfirmed balance
outstanding TOTAL
Cash in transit at year end
2019/20 *
31/03/2020 31/03/2019 31/03/2020 31/03/2019 31/03/2020 31/03/2019
Payment
date up to
six (6)
working
days before
year end Amount
R’000 R’000 R’000 R’000 R’000 R’000 R’000
DEPARTMENTS
Current
National School of
Government - - - - - -
Justice and Constitutional
Development
- -
- 64
- 64
WC Health - 9 - 14 - 23
WC Human Settlements - - - 1 - 1
Government Printing Works - 1 - 1 - 2
WC Transport and Public Works - 200 - - - 200
Subtotal - 210 - 80 - 290
Non-current
Justice and Constitutional
Development
- -
- 460
- 460
National School of
Government - - - - - -
Subtotal - - - 460 - 460
TOTAL DEPARTMENTS - 210 - 540 - 750
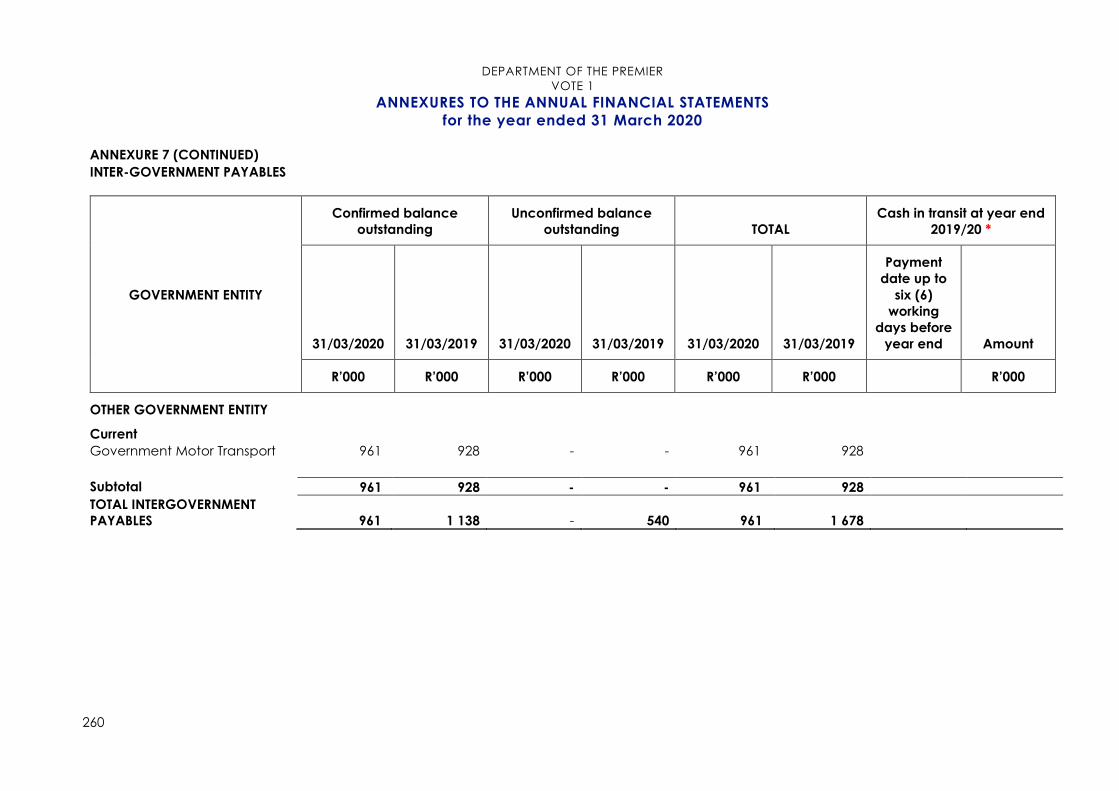
DEPARTMENT OF THE PREMIER
VOTE 1
ANNEXURES TO THE ANNUAL FINANCIAL STATEMENTS
for the year ended 31 March 2020
260
ANNEXURE 7 (CONTINUED)
INTER-GOVERNMENT PAYABLES
GOVERNMENT ENTITY
Confirmed balance
outstanding
Unconfirmed balance
outstanding TOTAL
Cash in transit at year end
2019/20 *
31/03/2020 31/03/2019 31/03/2020 31/03/2019 31/03/2020 31/03/2019
Payment
date up to
six (6)
working
days before
year end Amount
R’000 R’000 R’000 R’000 R’000 R’000 R’000
OTHER GOVERNMENT ENTITY
Current
Government Motor Transport
961 928 - - 961 928
Subtotal 961 928 - - 961 928
TOTAL INTERGOVERNMENT
PAYABLES 961 1 138 - 540 961 1 678
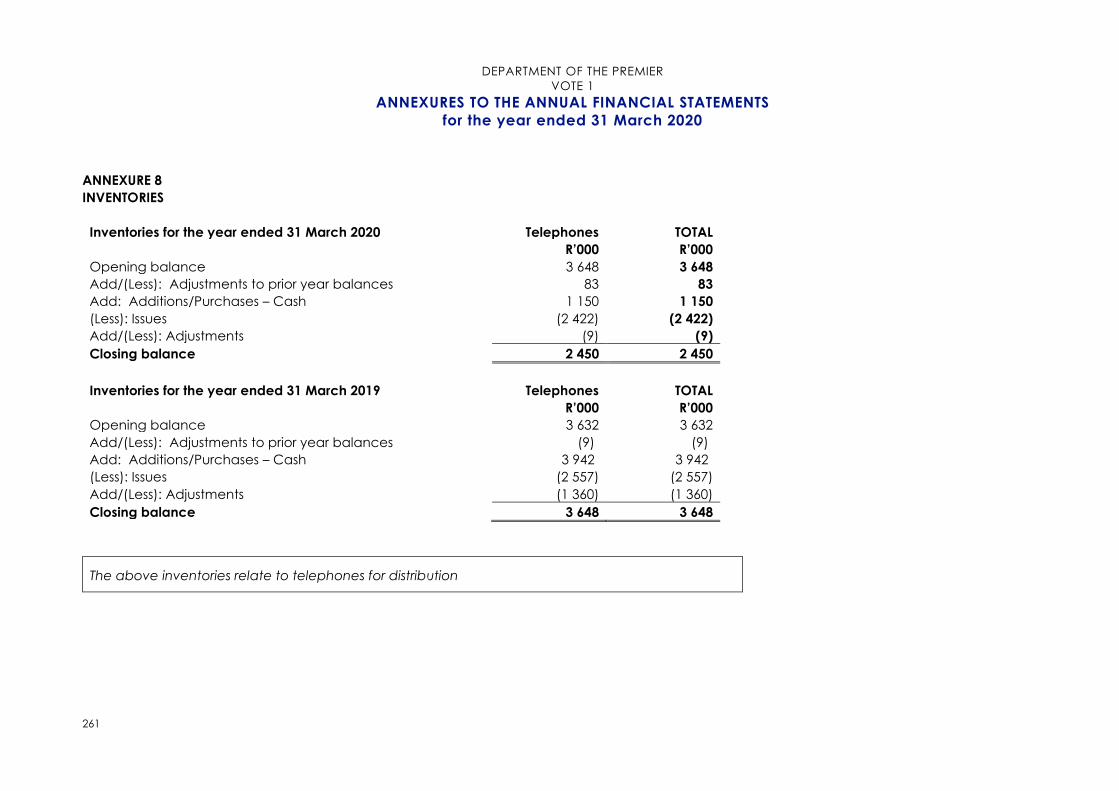
DEPARTMENT OF THE PREMIER
VOTE 1
ANNEXURES TO THE ANNUAL FINANCIAL STATEMENTS
for the year ended 31 March 2020
261
ANNEXURE 8
INVENTORIES
Inventories for the year ended 31 March 2020 Telephones TOTAL
R’000 R’000
Opening balance 3 648 3 648
Add/(Less): Adjustments to prior year balances 83 83
Add: Additions/Purchases – Cash 1 150 1 150
(Less): Issues (2 422) (2 422)
Add/(Less): Adjustments (9) (9)
Closing balance 2 450 2 450
Inventories for the year ended 31 March 2019 Telephones TOTAL
R’000 R’000
Opening balance 3 632 3 632
Add/(Less): Adjustments to prior year balances (9) (9)
Add: Additions/Purchases – Cash 3 942 3 942
(Less): Issues (2 557) (2 557)
Add/(Less): Adjustments (1 360) (1 360)
Closing balance 3 648 3 648
The above inventories relate to telephones for distribution
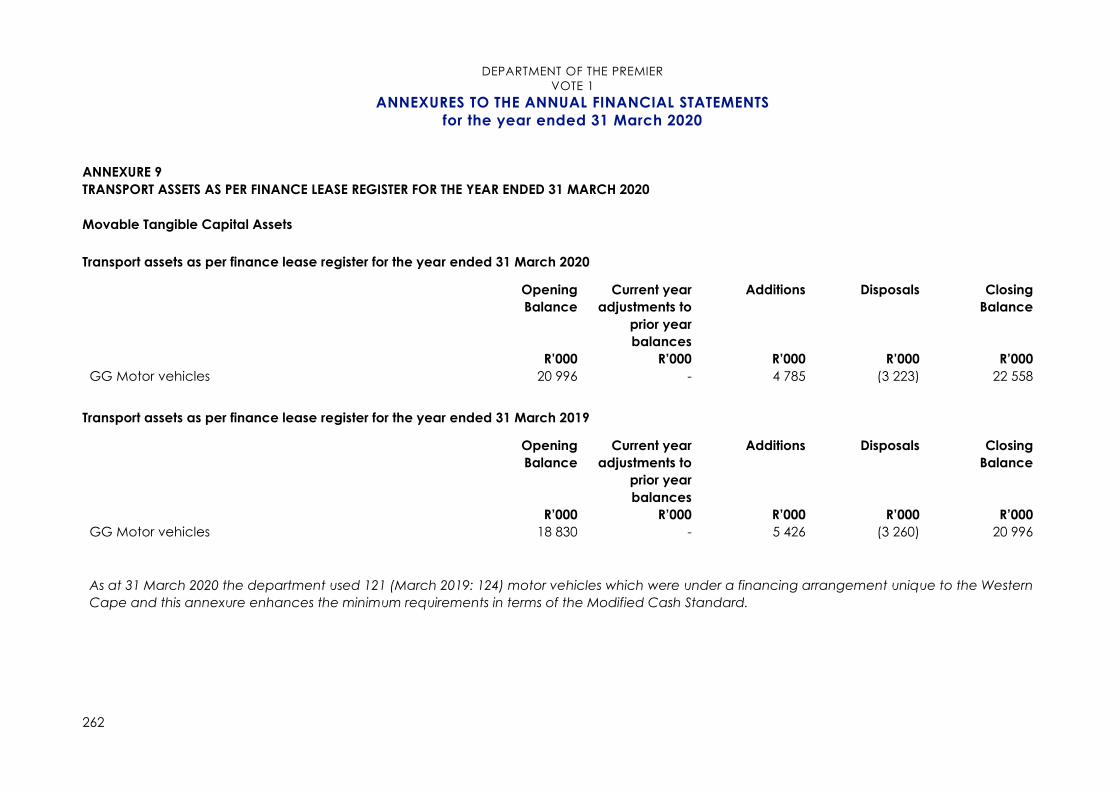
DEPARTMENT OF THE PREMIER
VOTE 1
ANNEXURES TO THE ANNUAL FINANCIAL STATEMENTS
for the year ended 31 March 2020
262
ANNEXURE 9
TRANSPORT ASSETS AS PER FINANCE LEASE REGISTER FOR THE YEAR ENDED 31 MARCH 2020
Movable Tangible Capital Assets
Transport assets as per finance lease register for the year ended 31 March 2020
Opening
Balance
Current year
adjustments to
prior year
balances
Additions Disposals Closing
Balance
R’000 R’000 R’000 R’000 R’000
GG Motor vehicles 20 996 - 4 785 (3 223) 22 558
Transport assets as per finance lease register for the year ended 31 March 2019
Opening
Balance
Current year
adjustments to
prior year
balances
Additions Disposals Closing
Balance
R’000 R’000 R’000 R’000 R’000
GG Motor vehicles 18 830 - 5 426 (3 260) 20 996
As at 31 March 2020 the department used 121 (March 2019: 124) motor vehicles which were under a financing arrangement unique to the Western
Cape and this annexure enhances the minimum requirements in terms of the Modified Cash Standard.

www.westerncape.gov.za
PR73/2020
ISBN: 978-0-621-48260-7
Contact person:
Ms Yolanda Christians
Departmental Strategy, Department of the Premier
Email address: [email protected]
Contact nr: 021-483 4424