DOT/FAA/AR-00/10 Statistical Loads Data for B-767-200ER ... · PDF fileDOT/FAA/AR-00/10 Office...
83
DOT/FAA/AR-00/10 Office of Aviation Research Washington, D.C. 20591 Statistical Loads Data for B-767-200ER Aircraft in Commercial Operations March 2000 Final Report This document is available to the U.S. public through the National Technical Information Service (NTIS), Springfield, Virginia 22161. U.S. Department of Transportation Federal Aviation Administration
Transcript of DOT/FAA/AR-00/10 Statistical Loads Data for B-767-200ER ... · PDF fileDOT/FAA/AR-00/10 Office...

DOT/FAA/AR-00/10
Office of Aviation ResearchWashington, D.C. 20591
Statistical Loads Data forB-767-200ER Aircraft inCommercial Operations
March 2000
Final Report
This document is available to the U.S. publicthrough the National Technical InformationService (NTIS), Springfield, Virginia 22161.
U.S. Department of TransportationFederal Aviation Administration

NOTICE
This document is disseminated under the sponsorship of the U.S.Department of Transportation in the interest of information exchange. TheUnited States Government assumes no liability for the contents or usethereof. The United States Government does not endorse products ormanufacturers. Trade or manufacturer's names appear herein solelybecause they are considered essential to the objective of this report. Thisdocument does not constitute FAA certification policy. Consult your localFAA aircraft certification office as to its use.
This report is available at the Federal Aviation Administration William J.Hughes Technical Center's Full-Text Technical Reports page:www.actlibrary.tc.faa.gov in Adobe Acrobat portable document format(PDF).

Technical Report Documentation Page
1. Report No.
DOT/FAA/AR-00/10
2. Government Accession No. 3. Recipient's Catalog No.
4. Title and Subtitle
STATISTICAL LOADS DATA FOR B-767-200ER AIRCRAFT IN
5. Report Date
March 2000COMMERCIAL OPERATIONS 6. Performing Organization Code
7. Author(s)
Daniel O. Tipps, John W. Rustenburg, and Donald A Skinn,
8. Performing Organization Report No.
URD-TR 99-000729. Performing Organization Name and Address
University of Dayton Research InstituteStructural Integrity Division
10. Work Unit No. (TRAIS)
RPD-510-1998-00032
300 College ParkDayton, OH 45469-0120
11. Contract or Grant No.
DTFA03-98-F-IA00212. Sponsoring Agency Name and Address
U.S. Department of TransportationFederal Aviation Administration
13. Type of Report and Period Covered
Final Report
Office of Aviation ResearchWashington, DC 20591
14. Sponsoring Agency Code
ANM-11015. Supplementary Notes
The Federal Aviation Administration William J. Hughes Technical Center COTR was Thomas DeFiore.
16. Abstract
The University of Dayton is supporting Federal Aviation Administration (FAA) research on the structural integrityrequirements for the US commercial transport airplane fleet. The primary objective of this research is to support the FAAAirborne Data Monitoring Systems Research Program by developing new and improved methods and criteria for processingand presenting large commercial transport airplane flight and ground loads usage data. The scope of activities performedinvolved (1) defining the service related factors which affect the operational life of commercial aircraft; (2) designing anefficient software system to reduce, store, and process large quantities of optical quick access recorder data; and (3) providingprocessed data in formats that will enable the FAA to reassess existing certification criteria. Equally important, these new datawill also enable the FAA, the aircraft manufacturers, and the airlines to better understand and control those factors whichinfluence the structural integrity of commercial transport aircraft. Presented herein are analyses and statistical summaries ofdata collected from 1285 flights representing 9164 flight hours of 10 typical B-767-200ER aircraft during operational usagerecorded by a single airline. The data include statistical information on accelerations, speeds, altitudes, flight duration anddistance, gross weights, speed brake/spoiler cycles, thrust reverser usage, and gust velocities encountered.
17. Key Words
Optical quick access recorder, Flight profiles, Flight loads,Ground loads, Miscellaneous loads, Statistical loads data
18. Distribution Statement
This document is available to the public through the NationalTechnical Information Service (NTIS), Springfield, Virginia22161.
19. Security Classif. (of this report)
Unclassified
20. Security Classif. (of this page)
Unclassified
21. No. of Pages
83
22. Price
N/AForm DOT F1700.7 (8-72) Reproduction of completed page authorized

iii/iv
PREFACE
The Flight Systems Integrity Group of the Structural Integrity Division of the University ofDayton Research Institute (URDI) performed this work under Federal Aviation Administration(FAA) Grant No. 96-G-020 entitled “Aircraft Operational Usage for Service Life Managementand Design Criteria Development.” The Program Manager for the FAA was Mr. ThomasDeFiore of the FAA William J. Hughes Technical Center at Atlantic City International Airport,New Jersey, and the Program Technical Advisor was Mr. Terence Barnes of the FAA AircraftCertification Office. Mr. Daniel Tipps was the Principal Investigator for the University ofDayton and provided oversight direction for this effort. Mr. Donald Skinn developed the datareduction algorithms, established data reduction criteria, and performed the data reduction. Mr.John Rustenburg created the graphical presentations, compiled and performed the data analysis,and formatted the report.

v
TABLE OF CONTENTS
Page
EXECUTIVE SUMMARY xi
1. INTRODUCTION 1
2. AIRCRAFT DESCRIPTION 1
3. AIRLINE DATA COLLECTION AND EDITING SYSTEMS 2
3.1 Data Collection System 33.2 Data Editing System 3
4. UNIVERSITY OF DAYTON RESEARCH INSTITUTE DATA PROCESSING 4
4.1 Data Reduction 44.2 Recorded Parameters 54.3 Computed Parameters 5
4.3.1 Atmospheric Density 64.3.2 Equivalent Airspeed 64.3.3 Dynamic Pressure (q) 64.3.4 Derived Gust Velocity (Ude) 74.3.5 Continuous Gust Intensity (Uσ) 7
4.4 Data Reduction Criteria 8
4.4.1 Phases of Flight 84.4.2 Flight Distance 104.4.3 Sign Convention 104.4.4 Peak-Valley Selection 114.4.5 Separation of Maneuver and Gust Load Factors 124.4.6 Flap Detents 13
5. DATA PRESENTATION 14
5.1 Aircraft Operational Usage Data 14
5.1.1 Weight Data 175.1.2 Altitude Data 185.1.3 Flight Distance Data 18
5.2 Ground Loads Data 19
5.2.1 Lateral Load Factor Data 19

vi
5.2.2 Longitudinal Load Factor Data 195.2.3 Vertical Load Factor Data 195.2.4 Ground Speed Data 205.2.5 Flare Data 205.2.6 Pitch/Rotation Data 20
5.3 Flight Loads Data 21
5.3.1 Gust Loads Data 215.3.2 Maneuver Loads Data 215.3.3 Combined Maneuver and Gust Loads Data 225.3.4 V-n Diagrams 22
5.3.4.1 Maneuver V-n Diagram Derivation 225.3.4.2 Gust V-n Diagram Derivation 225.3.4.3 Coincident Speed and Load Factor Data 23
5.4 Miscellaneous Operational Data 23
5.4.1 Flap Usage Data 235.4.2 Speed Brake/Spoiler Usage Data 245.4.3 Thrust Reverser Data 24
5.5 PROPULSION SYSTEM DATA 24
6. CONCLUSIONS 25
7. REFERENCES 25
APPENDICES
A Data PresentationB Great Circle Distance Calculation

vii
LIST OF FIGURES
Figure Page
1 Boeing 767-200ER Three-View Drawing 22 Airline Recording and Editing System 23 Description of Phases of Flight 94 Sign Convention for Airplane Accelerations 105 The Peak-Between-Means Classification Criteria 116a Current Acceleration Value Passes Into Deadband 126b Current Acceleration Value Passes Through Deadband 12
LIST OF TABLES
Table Page
1 Boeing 767-200ER Aircraft Characteristics 12 Recorded Parameters Provided to UDRI 33 Parameter Editing Values 44 Recorded Parameters Used in Data Reduction 55 Phase of Flight Starting Criteria 96 Peak Classification Criteria 127 Flap Detents (B-767-200) 148 Statistical Data Formats 159 FAR Requirements for Derived Discrete Gust Velocities 23

viii
LIST OF SYMBOLS AND ABBREVIATIONS
A aircraft PSD gust response factora speed of sound (ft/sec)
c wing mean geometric chord (ft)C aircraft discrete gust response factorCLα
aircraft lift curve slope per radian
CLmaxmaximum lift coefficient
CAS calibrated air speedc.g. center of gravity
EAS equivalent airspeed
F(PSD) continuous gust alleviation factor
g gravity constant, 32.17 ft/sec2
Hp pressure altitude, (ft)
Kg discrete gust alleviation factor, 0.88 µ/(5.3 + µ)KCAS knots calibrated air speedKEAS knots equivalent air speedKIAS knots indicated air speedkts knots
L turbulence scale length (ft)
n load factor (g)N number of occurrences for Uσ (PSD gust procedure)nm nautical milenx longitudinal load factor (g)ny lateral load factor (g)nz normal load factor (g)N0 number of zero crossings per nautical mile (PSD gust procedure)
q dynamic pressure (lbs/ft2)
S wing area (ft2)
TAS true airspeed
Ude derived gust velocity (ft/sec, EAS)
Uσ continuous turbulence gust intensity (ft/sec, TAS)

ix/x
VB design speed for maximum gustVC design cruise speedVD design dive speedVe equivalent airspeedVT true airspeed
W gross weight (lbs)
∆m incremental acceleration due to a turning maneuver
∆nz incremental normal load factor, nz - 1∆nzman
incremental maneuver load factor
∆nzgustincremental gust load factor
µ airplane mass ratio, ( )2 W S
gcCL
/
ρα
µp statistical mean of p (parameter on plots)
ρ air density, slugs/ft3 (at altitude)ρ0 standard sea level air density, 0.0023769 slugs/ft3
σp standard deviation of p (parameter on plots)
ϕ bank angle (degrees)

xi/xii
EXECUTIVE SUMMARY
The University of Dayton is supporting Federal Aviation Administration (FAA) research on thestructural integrity requirements for the US commercial transport airplane fleet. The primaryobjective of this research is to support the FAA Airborne Data Monitoring Systems ResearchProgram by developing new and improved methods and criteria for processing and presentinglarge commercial transport airplane flight and ground loads usage data. The scope of activitiesperformed involved (1) defining the service related factors which affect the operational life ofcommercial aircraft; (2) designing an efficient software system to reduce, store, and processlarge quantities of optical quick access recorder data; and (3) providing processed data in formatsthat will enable the FAA to reassess existing certification criteria. Equally important, these newdata will also enable the FAA, the aircraft manufacturers, and the airlines to better understandand control those factors which influence the structural integrity of commercial transport aircraft.Presented herein are analyses and statistical summaries of data collected from 1285 flightsrepresenting 9164 flight hours of 10 typical B-767-200ER aircraft during operational usagerecorded by a single airline. The data include statistical information on accelerations, speeds,altitudes, flight duration and distance, gross weights, speed brake/spoiler cycles, thrust reverserusage, and gust velocities encountered.

1
1. INTRODUCTION.
The Federal Aviation Administration (FAA) has an ongoing Airborne Data Monitoring SystemsResearch Program to collect, process, and evaluate statistical flight and ground loads data fromtransport aircraft used in normal commercial airline operations. The objectives of this programare (a) to acquire, evaluate, and utilize typical operational in-service data for comparison with theprior data used in the design and qualification testing of civil transport aircraft and (b) to providea basis to improve the structural criteria and methods of design, evaluation, and substantiation offuture airplanes. Since the inception of the FAA’s Airborne Data Monitoring Systems ResearchProgram, the scope of the program has steadily increased to include data collection on additionalaircraft, different aircraft models, and additional operators. The University of Dayton hassupported the FAA’s efforts and has responsibility for the data analysis and processing tasks andreport preparation. In consultation with airplane manufacturers and operators, the University hasenhanced and improved the data processing capabilities to reduce, analyze, and report additionalaircraft usage and statistical external loads data from the digital flight loads recorders in a formthat will fulfill the requests of the aircraft manufacturers, the airlines, and the FAA. The reportpresents data obtained from 10 airplanes over 1285 flights and 9164 hours of airline operationsfor the B-767-200ER aircraft of a single operator.
2. AIRCRAFT DESCRIPTION.
Table 1 presents certain operational characteristics and major physical dimensions of the 10Boeing 767-200ER aircraft which were equipped with optical-quick access recorders. Figure 1shows front, top, and side views of the aircraft.
TABLE 1. BOEING 767-200ER AIRCRAFT CHARACTERISTICS
Maximum Taxi WeightMaximum Takeoff WeightMaximum Landing WeightMaximum Zero-Fuel WeightMaximum Operating Empty Weight
352,200lb351,000 lb278,000 lb253,000 lb183,300 lb
Fuel Capacity 137,100 lb @ 6.7 lb/ U.S. gallons
2 GE CF6-80 C2 Engines @ 52,500 lbs static thrust @ sea leveleach
Wing SpanWing Reference AreaWing MACWing Sweep
156.33 ft3050 ft2
19.54 ft35 degrees
LengthHeightTreadWheel Base
159 ft 2 in52 ft 0 in30 ft 6 in64 ft 7 in

2
FIGURE 1. BOEING 767-200ER THREE-VIEW DRAWING
3. AIRLINE DATA COLLECTION AND EDITING SYSTEMS.
The airline data collection and editing system consists of two major components: (1) the datacollection system installed on board the aircraft and (2) the ground data editing station. Aschematic overview of the system is given in figure 2. The requirements for the data acquisitionand processing are defined in reference 1. The collection and editing systems are discussedbelow.
FIGURE 2. AIRLINE RECORDING AND EDITING SYSTEM
3
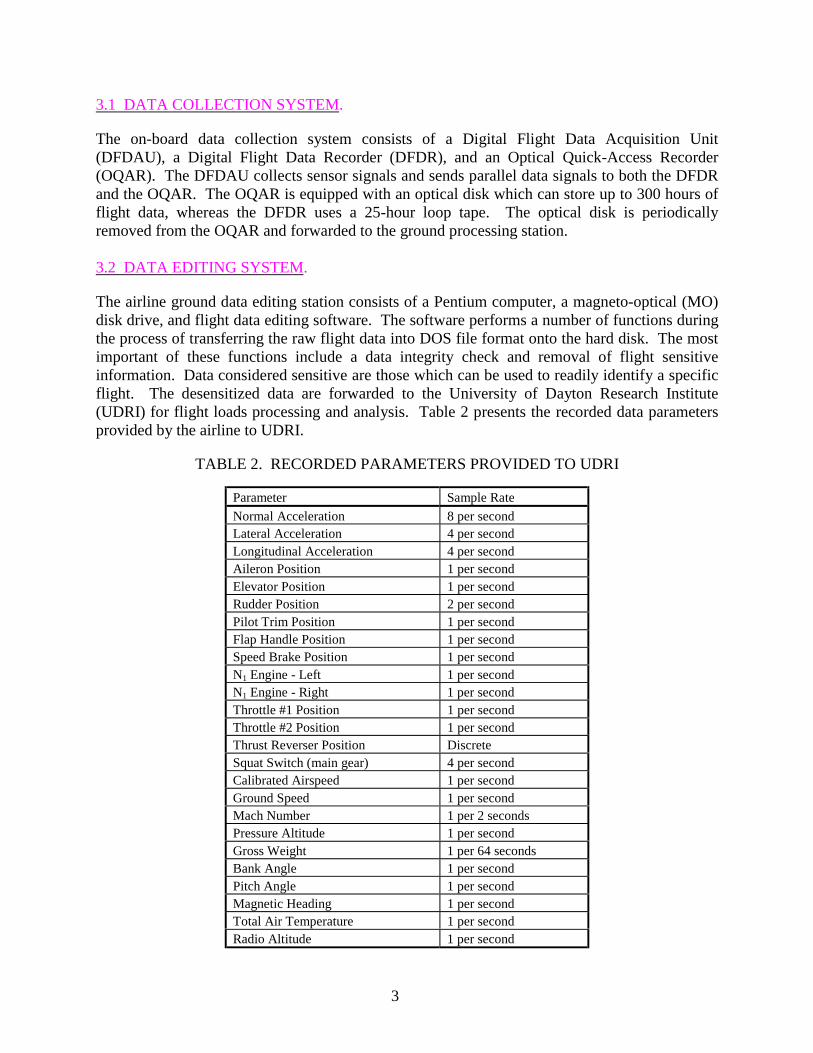
3.1 DATA COLLECTION SYSTEM.
The on-board data collection system consists of a Digital Flight Data Acquisition Unit(DFDAU), a Digital Flight Data Recorder (DFDR), and an Optical Quick-Access Recorder(OQAR). The DFDAU collects sensor signals and sends parallel data signals to both the DFDRand the OQAR. The OQAR is equipped with an optical disk which can store up to 300 hours offlight data, whereas the DFDR uses a 25-hour loop tape. The optical disk is periodicallyremoved from the OQAR and forwarded to the ground processing station.
3.2 DATA EDITING SYSTEM.
The airline ground data editing station consists of a Pentium computer, a magneto-optical (MO)disk drive, and flight data editing software. The software performs a number of functions duringthe process of transferring the raw flight data into DOS file format onto the hard disk. The mostimportant of these functions include a data integrity check and removal of flight sensitiveinformation. Data considered sensitive are those which can be used to readily identify a specificflight. The desensitized data are forwarded to the University of Dayton Research Institute(UDRI) for flight loads processing and analysis. Table 2 presents the recorded data parametersprovided by the airline to UDRI.
TABLE 2. RECORDED PARAMETERS PROVIDED TO UDRI
Parameter Sample Rate
Normal Acceleration 8 per secondLateral Acceleration 4 per secondLongitudinal Acceleration 4 per secondAileron Position 1 per secondElevator Position 1 per secondRudder Position 2 per secondPilot Trim Position 1 per secondFlap Handle Position 1 per secondSpeed Brake Position 1 per secondN1 Engine - Left 1 per secondN1 Engine - Right 1 per secondThrottle #1 Position 1 per secondThrottle #2 Position 1 per secondThrust Reverser Position DiscreteSquat Switch (main gear) 4 per secondCalibrated Airspeed 1 per secondGround Speed 1 per secondMach Number 1 per 2 secondsPressure Altitude 1 per secondGross Weight 1 per 64 secondsBank Angle 1 per secondPitch Angle 1 per secondMagnetic Heading 1 per secondTotal Air Temperature 1 per secondRadio Altitude 1 per second

4
4. UNIVERSITY OF DAYTON RESEARCH INSTITUTE DATA PROCESSING.
The data parameters of table 2 are provided by the airline to UDRI for each recorded flight. Thedata are provided on magneto-optical disks containing binary files for multiple flights fordifferent airplanes. These data are processed by UDRI to extract the parameters required forstatistical flight loads presentation. This section describes the reduction of the data and thederivation of required parameters.
4.1 DATA REDUCTION.
Each file provided by the airline contains multiple flights for each airplane. These files are firstseparated into individual flight files and subsequently into individual time history files for eachflight. The time history files are compressed and stored on the same 230-MB magneto-optical(MO) disks for later recall by the flight loads processing software.
These data are edited and verified as the time histories are being prepared. Messages alert theuser that obviously erroneous data have been removed and that questionable data have beenretained but need to be manually reviewed prior to their acceptance. Table 3 lists the limitsagainst which the data are compared.
TABLE 3. PARAMETER EDITING VALUES
Item Min Max
1. Gross Weight 75,000 lbs 500,500 lbs
2. Pressure Altitude (Hp) -5,000 ft 50,000 ft
3. Calibrated Airspeed 20 kts 600 kts
4. Normal Acceleration -2.0 g +4.0 g
5. Lateral Acceleration -1.0 g +1.0 g
6. Longitudinal Acceleration -1.0 g +1.0 g
7. Flap Handle Position 0° 60°8. Elevator Position -40° +40°9. Aileron Position -40° +40°
10. Rudder Position -40° +40°11. Trim Position -30° +30°12. Speed Brake Handle Position -1° 70°13. Throttles 1 and 2 All All
14. Engine N1 and N2 All All
15. Thrust Reverser Position 0 1
16. Squat Switch (main gear) 0 1
17. Pitch Attitude -30° +30°18. Bank Attitude -70° +70°19. Mach Number 0 1
20. Ground Speed 4 kts 800 kts

5
Important characteristics about each set of flights received from the airline are recorded in arelational database. Airline identifier, aircraft tail number, and disk identifier of the diskreceived from the airline are in the data. Each flight is assigned a unique flight sequencenumber. The flight sequence number assigned to the first flight of the set and the number offlights in the set are also entered. Also recorded is the disk identifier of the MO disk, whichcontains the compressed time history files of all flights in the set.
4.2 RECORDED PARAMETERS.
Not all parameters listed in table 2 are used for statistical analysis and data presentation. Theparameters used in the data reduction and for which time history files are created andcompressed on the MO disk are listed in table 4. These parameters are used by thesummarization software for statistical analysis and data presentation.
TABLE 4. RECORDED PARAMETERS USED IN DATA REDUCTION
Flight Parameter Sample Rate
Gross Weight 1 per 64 seconds
Pressure Altitude 1 per second
Calibrated Airspeed 1 per second
Normal Acceleration (nz) 8 per second
Lateral Acceleration (ny) 4 per second
Longitudinal Acceleration (nx) 4 per second
Flap Handle Position 1 per second
Speed Brake Handle Position 1 per second
Thrust Reverser Position Discrete
Squat Switch (main gear) Discrete
Pitch Angle 2 per second
Bank Angle 1 per second
Mach Number 1 per 2 seconds
Ground Speed 1 per second
Magnetic Heading 1 per second
N1 Engine - Left 1 per second
4.3 COMPUTED PARAMETERS.
Derived gust velocity, Ude, and continuous gust intensity, Uσ, are important statistical loadparameters which are derived from measured normal accelerations. This derivation of gustvelocity Ude and continuous gust intensity Uσ from measured normal accelerations requiresknowledge of atmospheric density, equivalent airspeed, and dynamic pressure. These values arecalculated using equations that express the rate of change of density as a function of altitudebased on the International Standard Atmosphere.

6
4.3.1 Atmospheric Density.
For altitudes below 36,089 feet, the density ρ is expressed as a function of altitude by
2564p
60 H1087661 .).( ××−= −ρρ (1)
where ρ0 is air density at sea level (0.0023769 slugs/ft3) and Hp is pressure altitude (ft). Pressurealtitude is a recorded parameter.
4.3.2 Equivalent Airspeed.
Equivalent air speed (Ve) is a function of true air speed (VT) and the square root of the ratio of airdensity at altitude (ρ) to air density at sea level (ρ0)
0ρρ= Te VV (2)
True airspeed is derived from Mach number (M) and speed of sound (a):
V MaT = . (3)
Mach number is a dimensionless, recorded parameter. The speed of sound (a) is a function ofpressure altitude (Hp) and the speed of sound at sea level and is
)H106.876(1aa p6
0 ××−= −
(4)
Substituting equations 1 and 4 into equation 2 gives
2.128p
60.5p
60e )H106.876(1)H106.876(1aMV ××−×××−××= −−
(5)
and
2.626
p6
0e )H106.876(1aMV ××−××= − (6)
where the speed of sound at sea level a0 is 1116.4 fps or 661.5 knots.
4.3.3 Dynamic Pressure (q).
The dynamic pressure (q) is calculated from the air density and velocity
2
2
1Vq ρ= (7)
where
ρ = air density at altitude (slugs/ft3)V = true air speed (ft/sec)
7
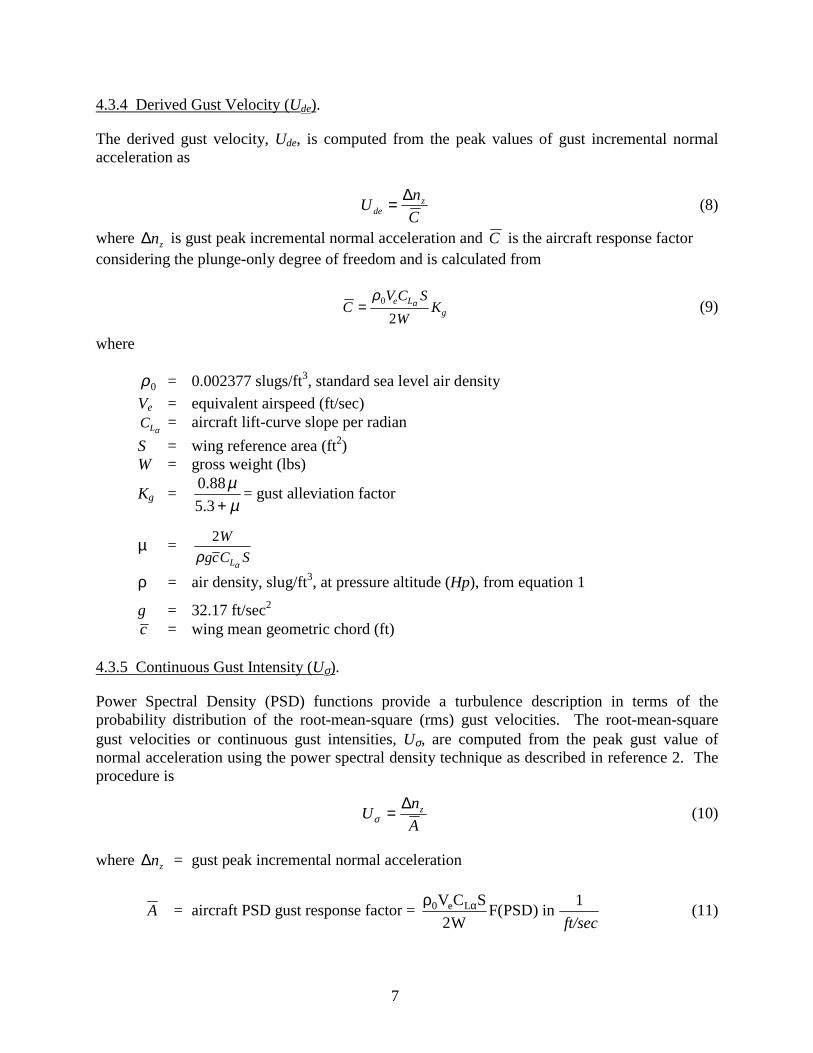
4.3.4 Derived Gust Velocity (Ude).
The derived gust velocity, Ude, is computed from the peak values of gust incremental normalacceleration as
Un
Cdez= ∆
(8)
where ∆nz is gust peak incremental normal acceleration and C is the aircraft response factorconsidering the plunge-only degree of freedom and is calculated from
CV C S
WK
e Lg=
ρα0
2(9)
where
ρ0 = 0.002377 slugs/ft3, standard sea level air density
Ve = equivalent airspeed (ft/sec)CLα
= aircraft lift-curve slope per radian
S = wing reference area (ft2)W = gross weight (lbs)
Kg =µµ
+3.5
88.0= gust alleviation factor
µ =2W
gcC SLρα
ρ = air density, slug/ft3, at pressure altitude (Hp), from equation 1
g = 32.17 ft/sec2
c = wing mean geometric chord (ft)
4.3.5 Continuous Gust Intensity (Uσ).
Power Spectral Density (PSD) functions provide a turbulence description in terms of theprobability distribution of the root-mean-square (rms) gust velocities. The root-mean-squaregust velocities or continuous gust intensities, Uσ, are computed from the peak gust value ofnormal acceleration using the power spectral density technique as described in reference 2. Theprocedure is
Un
Az
σ = ∆(10)
where ∆nz = gust peak incremental normal acceleration
A = aircraft PSD gust response factor = ft/sec
1in)PSD(F
W2
SCV Le0 αρ(11)

8
ρ0 = 0.002377 slugs/ft3, standard sea level air densityVe = equivalent airspeed (ft/sec)CLα
= aircraft lift-curve slope per radian
S = wing reference area (ft2)W = gross weight (lbs)
( )F PSDc
L=
+
118
2 110
1
3.,
πµ
µdimensionless (12)
c = wing mean geometric chord (ft)L = turbulence scale length, 2500 ft
µρ
α
=2W
gcC SL
, dimensionless (13)
ρ = air density (slugs/ft3)g = 32.17 ft/sec2
To determine the number of occurrences (N) for Uσ , calculate
460
00
0
203
.
)(
)(
== µ
ρρπc
oN
oNN ref , dimensionless (14)
where c , ρ, ρ0, and µ are defined above. Then each Uσ peak is counted as N counts at that Uσvalue. This number of counts is used to determine the number of counts per nautical mile (nm)
or
=
interval countingin flown distance
counts N
nm(15)
Finally, the number of such counts is summed from the largest plus or minus value toward thesmallest to produce the cumulative counts per nautical mile.
4.4 DATA REDUCTION CRITERIA.
To process the measured data into statistical flight loads format, specific data reduction criteriawere established for each parameter. These criteria are discussed in this section.
4.4.1 Phases of Flight.
Each flight is divided into nine phases four ground phases (taxi out, takeoff roll, landing rollwith and without thrust reverser, and taxi in), and five airborne phases (departure, climb, cruise,descent, and approach). Figure 3 shows these nine phases of a typical flight. The phases offlight were not defined by the airline but had to be determined from the data. Table 5 lists theconditions for determining the starting times for each phase. It should be noted that an airbornephase can occur several times per flight because it is determined by the rate of climb and the

9
position of the flaps. When this occurs the flight loads data are combined and presented in asingle flight phase. The UDRI software creates a file which chronologically lists the phases offlight and their corresponding starting times.
CLIMB
TAXIOUT
CRUISE
TAKEOFFROLL
DEPARTURE
DESCENT
APPROACH
TAXIIN
LANDINGROLL
FIGURE 3. DESCRIPTION OF PHASES OF FLIGHT
TABLE 5. PHASE OF FLIGHT STARTING CRITERIA
Phase of Flight Conditions at Start of Phase
Taxi Out Initial Aircraft Movement
Takeoff Roll Acceleration > 2 kts/sec for a minimum of 20 seconds
Departure Time at liftoff; flaps extended (squat switch off)
Climb Flaps retracted; rate of climb ≥ 250 ft/min. for at least 1 minute
Cruise Flaps retracted; rate of climb ≤ 250 ft/min. for at least 1 minute
Descent Flaps retracted; rate of descent ≥ 250 ft/min. for at least 1minute
Approach Flaps extended; rate of descent ≥ 250 ft/min. for at least 1 minute
Landing Roll Touchdown; (squat switch on)
Taxi In Magnetic heading change greater than 13.5 degrees after touchdown ordeviation from runway centerline greater than 100 feet
Should the above criteria fail the following additional secondary criteria are used.
The criteria for the start of the takeoff roll is defined as the earlier of (1) the time that thecomputed speed exceeds 45 knots or (2) the time that the longitudinal acceleration exceeds0.15 g prior to liftoff.
The criterion for the start of taxi in is defined as the time when the aircraft turns off the activerunway. Turnoff is detected by monitoring the magnetic heading for a change greater than 13.5degrees from the landing magnetic heading. The time when the heading starts to change in theturnoff direction is then identified as the start of the turn or the beginning of the taxi-in phase.This method can fail to detect a shallow turnoff onto a taxiway. In this case an average landingroll of 32 seconds duration is assumed and the turnoff is marked as 32 seconds after touchdown.

10
The criteria for determining the pitch angle at takeoff has been defined as the angle occurringjust prior to the airplane becoming airborne.
4.4.2 Flight Distance.
The flight distance can be obtained either by determining the stage length of the flight or byintegrating the range with respect to changes in aircraft velocity as a function of time.
The stage length is defined as the distance from departure airport to destination airport and isdetermined as the great circle distance in nautical miles between the point of liftoff (departure)and the point of touchdown (destination). Appendix B describes the calculation of great circledistance. The time histories of longitude and latitude are matched against the UDRI-generatedphase-of-flight file to determine the geographical location of the aircraft at the point of liftoff andthe point of touchdown.
The integrated flight distance D is obtained by the numerical integration from the time at liftoff(t0) to the time of touchdown (tn), and VT is the average true velocity during ∆t.
∑ ⋅∆=n
0
t
tTVtD (16)
4.4.3 Sign Convention.
Acceleration data are recorded in three directions: normal (z), lateral (y), and longitudinal (x). Asshown in figure 4, the positive z direction is up; the positive y direction is airplane starboard; andthe positive x direction is forward.
FIGURE 4. SIGN CONVENTION FOR AIRPLANE ACCELERATIONS
Forward
Up
Starboard
Parallel to FuselageReference Line
x
z
y

11
4.4.4 Peak-Valley Selection.
The peak-between-means method presented in reference 2 was used to select the peaks andvalleys in the acceleration data. This method is consistent with past practices and pertains to allaccelerations (nx, ny, ∆nz, ∆nzman
, ∆nzgust). Figure 5 depicts an example of the peak-between-mean
criteria. This method counts upward events as positive and downward events as negative. Onlyone peak or one valley is counted between two successive crossings of the mean. A thresholdzone is used in the data reduction to ignore irrelevant loads variations around the mean. For thenormal accelerations ∆nz, ∆nzgust
, and ∆nzman, the threshold zone is ±0.05 g; for lateral
acceleration ny, the threshold zone is ±0.005 g; and for longitudinal accelerations nx, thethreshold zone is ±0.0025 g.
Deadband
Threshold Zone
}√
Mean Crossing!!!! Classified Peak
οοοο Classified Valley⊕
FIGURE 5. THE PEAK-BETWEEN-MEANS CLASSIFICATION CRITERIA
A peak is generated only when the acceleration data cross into or through the deadband. Twosituations must be considered: the position of the current acceleration value relative to thedeadband and the position of the previous acceleration value relative to the deadband. In thepeak-between-means counting algorithm, the previous acceleration value is that value in aconsecutive set of values all of which lie either above the deadband or below the deadband. Theprevious value is established as a peak when the current value has crossed into or through thedeadband. Figures 6a and 6b demonstrate the concept of current and previous accelerationvalues. In figure 6a the current acceleration value passes into the deadband, whereas in figure 6bthe current value passes through the deadband.

12
FIGURE 6a. CURRENT ACCELERATION VALUE FIGURE 6b. CURRENT ACCELERATION VALUEPASSES INTO DEADBAND PASSES THROUGH DEADBAND
Italicized text in table 6 summarizes the action(s) taken when the various possibilities occur.Note that when a previous acceleration value is retained as a potential peak, its coincident time isalso retained.
TABLE 6. PEAK CLASSIFICATION CRITERIA
Previous AccelerationValue Relative to Current Acceleration Value Relative to Deadband
Deadband Below Within Above
AbovePrevious value ispotential positive peak
Current acceleration passesthrough deadband.Previous value classified asa positive peak.Current value retained as apotential negative peak.
Current accelerationpasses into deadband.Previous value classifiedas a positive peak.Acceleration valueflagged as being indeadband.
Current acceleration is onsame side of deadband asprevious.If current value >previous value, retaincurrent value as potentialpositive peak and releaseprevious.
WithinAt start of processing or apeak was established butcurrent acceleration valuehas not since gone outsideof deadband
Current acceleration passesdownward out of deadband.Current value is retained asa potential negative peak.
No ActionRequired
Current accelerationpasses upward out ofdeadband.Current value retained aspotential positive peak.
BelowPrevious value ispotential negative peak
Current acceleration is onsame side of deadband asprevious.If current value < previousvalue, retain current valueas potential negative peakand release previous value.
Current accelerationpasses into deadband.Previous value isestablished as a negativepeak.Acceleration valueflagged as being indeadband.
Current accelerationpasses through deadband.Previous value isclassified as a negativepeak.Current value retained aspotential positive peak.
4.4.5 Separation of Maneuver and Gust Load Factors.
The incremental acceleration measured at the center of gravity (c.g.) of the aircraft may be theresult of either maneuvers or gusts. In order to derive gust and maneuver statistics, the maneuver-induced acceleration and gust response accelerations must be separated from the total acceleration

13
history. Reference 3 reported the results of a UDRI study to evaluate methods of separatingmaneuver and gust load factors from measured acceleration time histories. As a result of this studyUDRI recommended and the FAA accepted that a cycle duration rule be used to separate gusts andmaneuvers. A cycle duration of 2.0 seconds was recommended for use with B-737 and MD-82/83aircraft. Review of the B-767-200 response characteristics has shown that this cycle duration valueis also appropriate for the B-767-200 data. In order to avoid the inclusion of peaks and valleysassociated with nonsignificant small load variations, a threshold zone of ∆nz = ±0.05 g wasestablished. An algorithm was then developed to extract the acceleration peaks and valleys.
For each flight the maximum and minimum total accelerations were determined from just afterliftoff to just before touchdown. For the in-flight phases, the ∆nz cumulative occurrences weredetermined as cumulative counts per nautical mile and cumulative counts per 1000 hours usingthe peak-between-means counting method of reference 2 as explained in section 4.4.3. Themeasurements of ∆nz, ∆nzgust
, and ∆nzman are maintained as three unique data streams. The ∆nz,
∆nzgust, and ∆nzman
data are plotted as cumulative occurrences of a given acceleration increment
per nautical mile and per 1000 flight hours. The incremental normal load factor ∆nz is theairplane limit load factor minus 1.0 g. As a result of the threshold zone, only accelerationsgreater than ±0.05 g (measured from a 1.0-g base) are counted for data presentation. Therecorded normal acceleration (nz) values included the 1-g flight condition. The 1-g conditionwas removed from each nz reading which was then recorded as ∆nz. In order to avoid theinclusion of peaks and valleys associated with nonsignificant small load variations, a thresholdzone of ∆nz = ±0.05 g was established. An algorithm was then developed to extract theacceleration peaks and valleys.
Once calculated, the measurements of ∆nz, ∆nzgust, and ∆nzman
are maintained as three unique data
streams. The ∆nzgust and ∆nzman
data are plotted as cumulative occurrences of incremental
accelerations per nautical mile and per 1000 flight hours. Separate plots are provided for eachphase of flight and all phases combined. The ∆nz value is the recorded incremental normal loadfactor (airplane limit load factor minus 1.0 g). As a result of the threshold zone, onlyaccelerations greater than ±0.05 g (measured from a 1.0-g base) are counted for datapresentation.
4.4.6 Flap Detents.
When flaps are extended, the effective deflection is considered to be that of the applicable detent,as indicated in table 7. The flap deflection ranges and placard speeds reflect the flap design andcockpit placards.
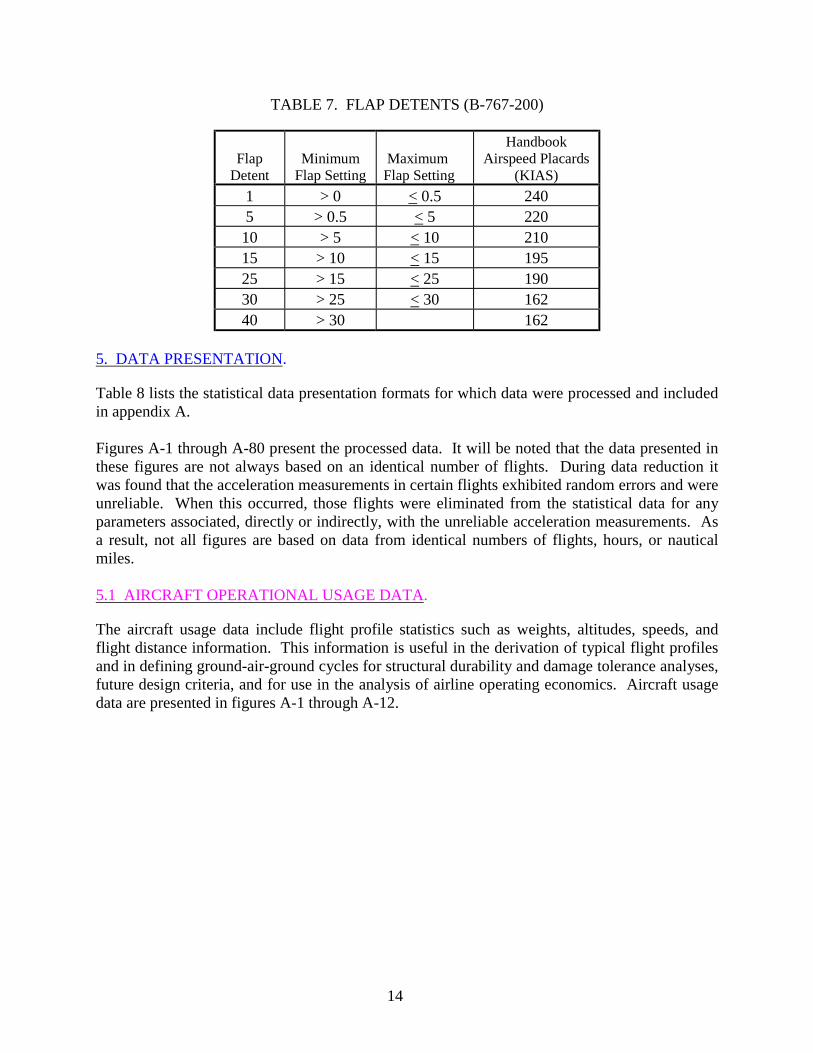
14
TABLE 7. FLAP DETENTS (B-767-200)
FlapDetent
MinimumFlap Setting
MaximumFlap Setting
HandbookAirspeed Placards
(KIAS)
1 > 0 < 0.5 2405 > 0.5 < 5 22010 > 5 < 10 21015 > 10 < 15 19525 > 15 < 25 19030 > 25 < 30 16240 > 30 162
5. DATA PRESENTATION.
Table 8 lists the statistical data presentation formats for which data were processed and includedin appendix A.
Figures A-1 through A-80 present the processed data. It will be noted that the data presented inthese figures are not always based on an identical number of flights. During data reduction itwas found that the acceleration measurements in certain flights exhibited random errors and wereunreliable. When this occurred, those flights were eliminated from the statistical data for anyparameters associated, directly or indirectly, with the unreliable acceleration measurements. Asa result, not all figures are based on data from identical numbers of flights, hours, or nauticalmiles.
5.1 AIRCRAFT OPERATIONAL USAGE DATA.
The aircraft usage data include flight profile statistics such as weights, altitudes, speeds, andflight distance information. This information is useful in the derivation of typical flight profilesand in defining ground-air-ground cycles for structural durability and damage tolerance analyses,future design criteria, and for use in the analysis of airline operating economics. Aircraft usagedata are presented in figures A-1 through A-12.

15
TABLE 8. STATISTICAL DATA FORMATS
Data Description Figure
AIRCRAFT USAGE DATAWEIGHT DATA
Cumulative Probability of Takeoff Gross Weight A-1Cumulative Probability of Takeoff Fuel Weight A-2Cumulative Probability of Landing Gross Weight A-3Takeoff Fuel Weight vs Flight Distance A-4Correlation of Takeoff Gross Weight and Flight Distance, Percent of Flights A-5Correlation of Gross Weight at Liftoff and Touchdown, Percent of Flights A-6ALTITUDE DATA
Correlation of Maximum Altitude and Flight Distance, Percent of Flights A-7Percent of Total Distance in Altitude Bands A-8Coincident Altitude at Maximum Mach Number, All Flight Phases A-9Coincident Altitude at Maximum Indicated Airspeed, All Flight Phases A-10FLIGHT DISTANCESCumulative Probability of Great Circle Flight Distance A-11Cumulative Probability of Integrated Flight Distance A-12
GROUND LOADS DATALATERAL LOAD FACTOR, ny
Cumulative Frequency of Maximum Side Load Factor During Ground Turns A-13LONGITUDINAL LOAD FACTOR, nx
Cumulative Frequency of Longitudinal Load Factor During Ground Taxi A-14Cumulative Frequency of Longitudinal Load Factor During Landing Roll A-15Cumulative Probability of Maximum Longitudinal Load Factor During Takeoff A-16Cumulative Probability of Minimum Longitudinal Load Factor During Landing A-17VERTICAL LOAD FACTOR, nz
Cumulative Frequency of Incremental Vertical Load Factor During Taxi Operations A-18Cumulative Frequency of Incremental Vertical Load Factor During Takeoff Roll A-19Cumulative Frequency of Incremental Vertical Load Factor During Landing Roll A-20Cumulative Probability of Minimum and Maximum Incremental Vertical Load Factor at Touchdown andSpoiler Deployment
A-21
Coincident Vertical Load Factor and Touchdown Gross Weight A-22GROUND SPEED DATACumulative Probability of Ground Speed During Taxi A-23Cumulative Probability of Airspeed at Liftoff and Touchdown A-24FLARE DATACumulative Probability of Airspeed at Flare A-25PITCH/ROTATION DATACumulative Probability of Pitch Angle at Liftoff and Touchdown A-26Cumulative Probability of Maximum Pitch Rate at Takeoff Rotation A-27Cumulative Probability of Pitch Angle at Touchdown Peak Vertical Load Factor A-28

16
TABLE 8. STATISTICAL DATA FORMATS (Continued)
Data Description Figure
FLIGHT LOADS DATAGUST LOADS DATA
Cumulative Occurrences of Incremental Vertical Gust Load Factor per 1000 Hours by Flight Phase A-29Cumulative Occurrences of Incremental Vertical Gust Load Factor per 1000 Hours, Combined FlightPhases
A-30
Cumulative Occurrences of Incremental Vertical Gust Load Factor per Nautical Mile by Flight Phase A-31Cumulative Occurrences of Incremental Vertical Gust Load Factor per Nautical Mile, Combined FlightPhases
A-32
Cumulative Occurrences of Derived Gust Velocity per Nautical Mile, < 500 Feet A-33Cumulative Occurrences of Derived Gust Velocity per Nautical Mile, 500-1,500 Feet A-34Cumulative Occurrences of Derived Gust Velocity per Nautical Mile, 1,500-4,500 Feet A-35Cumulative Occurrences of Derived Gust Velocity per Nautical Mile, 4,500-9,500 Feet A-36Cumulative Occurrences of Derived Gust Velocity per Nautical Mile, 9,500-19,500 Feet A-37Cumulative Occurrences of Derived Gust Velocity per Nautical Mile, 19,500-29,500 Feet A-38Cumulative Occurrences of Derived Gust Velocity per Nautical Mile, 29,500-39,500 Feet A-39Cumulative Occurrences of Derived Gust Velocity per Nautical Mile,39,500-49,500 Feet A-40Cumulative Occurrences of Derived Gust Velocity per Nautical Mile, Flaps Extended A-41Cumulative Occurrences of Derived Gust Velocity per Nautical Mile, Flaps Retracted A-42Cumulative Occurrences of Continuous Gust Intensity per Nautical Mile, Flaps Extended A-43Cumulative Occurrences of Continuous Gust Intensity per Nautical Mile, Flaps Retracted A-44MANEUVER LOADS DATACumulative Occurrences of Incremental Maneuver Load Factor per 1000 Hours During Departure byAltitude
A-45
Cumulative Occurrences of Incremental Maneuver Load Factor per 1000 Hours During Climb byAltitude
A-46
Cumulative Occurrences of Incremental Maneuver Load Factor per 1000 Hours During Cruise byAltitude
A-47
Cumulative Occurrences of Incremental Maneuver Load Factor per 1000 Hours During Descent byAltitude
A-48
Cumulative Occurrences of Incremental Maneuver Load Factor per 1000 Hours During Approach byAltitude
A-49
Cumulative Occurrences of Incremental Maneuver Load Factor per Nautical Mile During Departure byAltitude
A-50
Cumulative Occurrences of Incremental Maneuver Load Factor per Nautical Mile During Climb byAltitude
A-51
Cumulative Occurrences of Incremental Maneuver Load Factor per Nautical Mile During Cruise byAltitude
A-52
Cumulative Occurrences of Incremental Maneuver Load Factor per Nautical Mile During Descent byAltitude
A-53
Cumulative Occurrences of Incremental Maneuver Load Factor per Nautical Mile During Approach byAltitude
A-54
Cumulative Occurrences of Incremental Maneuver Load Factor per 1000 Hours by Flight Phase A-55Cumulative Occurrences of Incremental Maneuver Load Factor per 1000 Hours, Combined Flight Phases A-56Cumulative Occurrences of Incremental Maneuver Load Factor per Nautical Mile by Flight Phase A-57Cumulative Occurrences of Incremental Maneuver Load Factor per Nautical Mile, Combined FlightPhases
A-58

17
TABLE 8. STATISTICAL DATA FORMATS (Continued)
Data Description FigureCOMBINED MANEUVER AND GUST LOADS DATACumulative Occurrences of Combined Maneuver and Gust Incremental Vertical Load Factor per 1000Hours by Flight Phase
A-59
Cumulative Occurrences of Incremental Vertical Load Factor per 1000 Hours, Combined Flight Phases A-60Cumulative Occurrences of Incremental Vertical Load Factor per Nautical Mile by Flight Phase A-61Cumulative Occurrences of Incremental Vertical Load Factor per Nautical Mile, Combined Flight Phases A-62Cumulative Occurrences of Lateral Load Factor per 1000 Hours, Combined Flight Phases A-63Coincident Maneuver Load Factor and Speed Versus V-n Diagram for Flaps Retracted A-64Coincident Maneuver Load Factor and Speed Versus V-n Diagram for Flaps Extended A-65Coincident Gust Load Factor and Speed Versus V-n Diagram for Flaps Retracted A-66Coincident Gust Load Factor and Speed Versus V-n Diagram for Flaps Extended A-67
MISCELLANEOUS OPERATIONAL DATAFLAP USAGE DATA
Cumulative Probability of Maximum Airspeed in Flap Detent During Departure A-68Cumulative Probability of Maximum Airspeed in Flap Detent During Approach A-69Percent of Time in Flap Detent During Departure A-70Percent of Time in Flap Detent During Approach A-71SPEED BRAKE/FLIGHT SPOILER DATA
Cumulative Probability of Maximum Speed During Speed Brake Deployment A-72Cumulative Frequency of Speed at Speed Brake Deployment A-73Cumulative Frequency of Altitude at Speed Brake Deployment A-74Cumulative Probability of Maximum Deployment Angle During Speed Brake Deployment, FlapsRetracted
A-75
Cumulative Flight Hours for Coincident Speed Brake Deflection and Flap Handle Position A-76THRUST REVERSER DATA
Cumulative Probability of Time With Thrust Reversers Deployed A-77Cumulative Probability of Speed at Thrust Reverser Deployment and Stowage A-78
PROPULSION SYSTEM DATACumulative Probability of Percent of N1 at Takeoff A-79Cumulative Probability of Percent of N1 A-80
5.1.1 Weight Data.
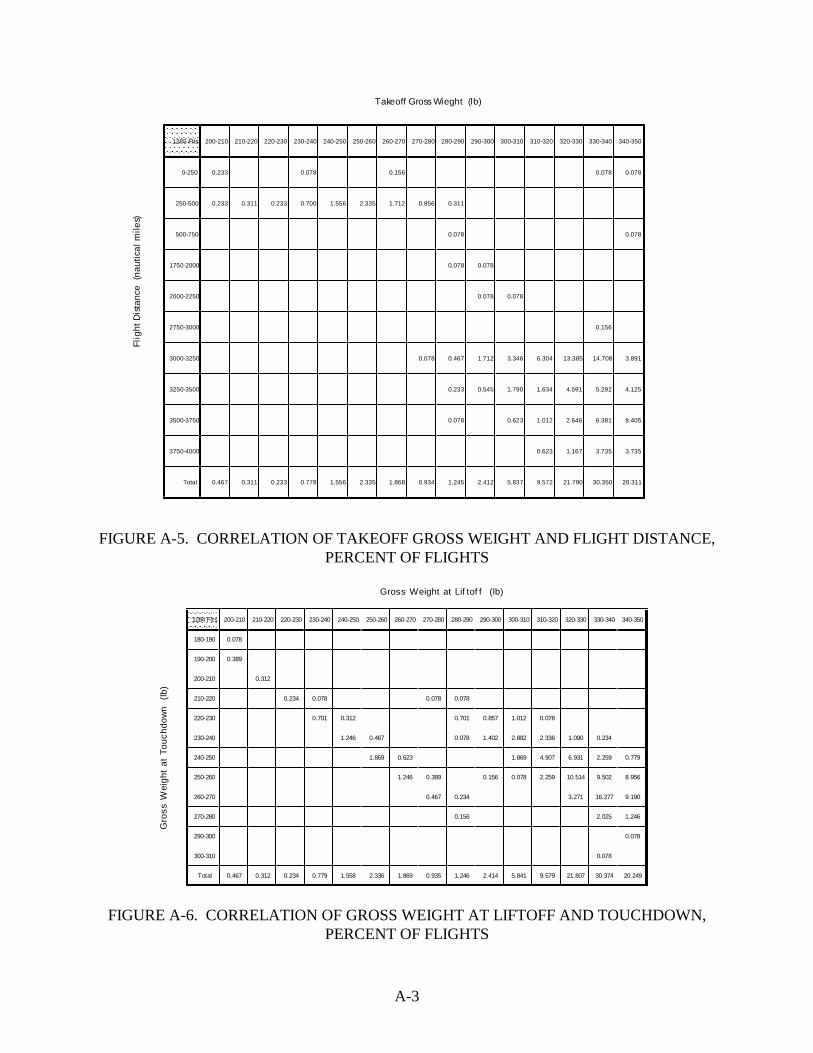
The cumulative probabilities of takeoff gross weight, takeoff fuel weight, and landing weight arepresented in figures A-1 through A-3 respectively. The correlation between fuel weight attakeoff and the flight distance is presented in figure A-4. A similar correlation for takeoff grossweight and flight distance is shown in tabular form as a percentage of flights in figure A-5. Theflight distances in figures A-4 and A-5 are based on the great circle distance between departureand arrival points.
Figure A-6 provides the correlation between the takeoff gross weight and the landing grossweight. The figure shows two distinct distributions, one for liftoff gross weights belowapproximately 280,000 pounds, and a second one for liftoff gross weights above approximately280,000 pounds. The correlation shows that for most flights with takeoff weights less than280,000 pounds the landing weight is within 10,000 to 20,000 pounds of the takeoff weight. For
18
the higher takeoff weights above 280,000 pounds the variation in landing weights is greater andmay vary from 60,000 to 100,000 pounds below liftoff weight. Not unexpectedly the highestvariations occur at the higher liftoff weights.
5.1.2 Altitude Data.
Measured operational altitudes and their correlation to flight distance and maximum speed arepresented. Figure A-7 shows the correlation between the maximum altitude attained in flight andthe flight distance flown in percent of flights. The data show that for shorter flights of less than500 nautical miles, the maximum altitude does not exceed 40,000 feet with the most flightsoccurring between 30,000-35,000 feet. For flights above 500 nautical miles the maximumaltitude will always be above 30,000 feet, with the vast majority of flights occurring at altitudesbetween 35,000 and 40,000 feet. It should be noted that the B-767-200ER data showed that noflights occurred in the flight distance range from 750-1,750 nautical miles, hence this distancerange is not shown in figure A-7.
Figure A-8 presents the percent of total flight distance spent in various altitude bands as afunction of flight distance. The flight distances in figure A-7 reflect the stage lengths; whereasthe flight distances in figure A-8 are based on the numerical integration approach mentioned inparagraph 4.4.2. Since the stage lengths reflect the straight line distance between departure andarrival points, this distance will almost always be less than the integrated distance. Theintegrated distance includes the effects of flying enroute navigation fixes from departure todestination that deviate from the straight line and the effects of tail or head winds encounteredduring the flight. Based on the integrated flight distance no flight distances in the range from1,000-1,500 nautical miles were observed, hence this distance range is not shown in figure A-8.This is consistent with the data shown in figure A-4. The combined information in figures A-7and A-8 provide a comprehensive picture of the flight profile distribution.
Figures A-9 and A-10 show the maximum Mach number or the maximum calibrated airspeedreached during the flight with respect to maximum airspeed limits as defined in the aircraft flightmanual. It is not known if these speeds represent the actual structural design speeds MMO orVMO. The maximum Mach number or airspeed data points represent the one speed that mostclosely approached the speed limit in a given flight during any of the flight phases. As anexample, in one flight the maximum speed with respect to the limit might have been attained inthe climb phase, while in another flight the maximum speed with respect to the limit speed mighthave occurred in the cruise phase. It should be noted that maximum Mach number andmaximum indicated airspeed do not necessarily occur simultaneously. Data points outside theoperational flight limits must be interpreted with some caution. The speed limit is provided interms of indicated airspeed. The data points reflect the calibrated airspeed. Information on thedifferences between the indicated airspeed and calibrated airspeed due to instrument and staticerror or which are a function of airplane flight attitude, Mach number or flap position is notavailable.
5.1.3 Flight Distance Data.
Flight distance statistics useful in the generation of flight profiles are presented. The cumulativeprobability of flight distances flown is presented in figures A-11 and A-12. The great circle

19
distance reflects the ground distance between two points as obtained from the great circledistance calculation, but does not necessarily reflect the actual distance flown. Deviation fromdirect flight between departure and arrival points resulting from traffic control requirements willincrease the actual distance flown by some unknown amount. To a much lesser extent, the climband descent distances are slightly larger than the level flight distance. Head or tail winds also areunknown contributors. The integrated distance accounts for such variables. The figure providesa graphical presentation of the differences in flight distance obtained by the two approaches.
5.2 GROUND LOADS DATA.
The ground loads data include frequency and probability information on vertical, lateral, andlongitudinal accelerations, speeds, and pitch rotation associated with takeoff, landing, andground operations. These data are of primary importance to landing gear and landing gearbackup structure and to a lesser extent to the wing, fuselage, and empennage.
5.2.1 Lateral Load Factor Data.
Lateral load factor statistics resulting from ground turning during taxi were derived and arepresented. Figure A-13 shows the cumulative frequency of the maximum side load factor duringground turns. The information is presented for pre- and postflight taxi as well as left and rightturns. The turning load factors during taxi in are shown to be more severe than thoseexperienced during turning while taxiing out. This is likely the result of higher taxi in speed asshown later in figure A-23. There is no significant difference between the number of left andright turns. It is interesting to note that the probability of exceeding given side load factor levelsduring ground turning is lower for the B-767-200ER as presented in this report when comparedwith the same data for the B-737-400 and MD-82/83 aircraft reported in references 5 and 6.
5.2.2 Longitudinal Load Factor Data.
Longitudinal load factor statistics were derived for all phases of ground operation, including pre-and postflight taxi and takeoff and landing roll. Figures A-14 presents the cumulative frequencyof longitudinal load factor during ground operations. The figure shows the data for pre- andpostflight taxi. Figure A-15 shows the cumulative frequency of longitudinal load factor duringthe landing rollout with and without thrust reverser deployment. It appears that the additionalbraking from deployment of thrust reversers changes the longitudinal load factor spectra byapproximately 0.1 g in the negative direction. The occurrence of positive longitudinal loadfactors may be due to variations in the overall retardation forces from thrust reversers, hydraulicbrakes, and rolling friction. Figures A-16 and A-17 present the cumulative probability of themaximum and minimum longitudinal load factor measured during the takeoff and landing rollsrespectively.
5.2.3 Vertical Load Factor Data.
Vertical load factor statistics during all phases of ground operation with and without thrustreverser are presented. Figure A-18 presents the cumulative frequency of incremental verticalload factor during pre- and postflight taxi. Figure A-19 presents the cumulative frequency ofincremental vertical load factor during the takeoff roll, while figure A-20 presents the cumulative

20
frequency of incremental vertical load factor during the landing roll for operation with andwithout thrust reverser. As can be seen, there are large differences in the frequency of verticalload factor occurrences between the taxi-in and taxi-out phases. This is a major departure fromwhat was observed on the B-737-400 and MD-82/83 aircraft as presented in references 5 and 6.These references show nearly identical frequency distributions of vertical accelerations for thetaxi-out and taxi-in phases.
Figure A-21 presents the cumulative probability of the minimum and maximum incrementalvertical load factors associated with touchdown and ground spoiler deployment. As can be seen,spoiler deployment increases the probability of encountering given levels of vertical acceleration.This is consistent with the B-737-400 data presented in reference 5, but opposite from the MD-82/83 data presented in reference 6.
Figure A-22 shows the coincident incremental vertical load factor and gross weight attouchdown for all flights. Six landing load factors occur at touchdown gross weights above themaximum landing gross weight of 278,000 pounds for the B-767-200ER as shown in table 1. Itis noteworthy that the maximum landing gross weight for the B-767-200ER varies from 278,000to 285,000 pounds depending on airplane/engine configuration. The basic B-767 airplane has amaximum landing gross weight that varies from 270,000 to 320,000 pounds depending onairplane/engine model. Although the actual airplane/engine configuration of the airplanes forwhich data was obtained is unknown, it may provide a clue to the higher landing gross weightsobserved. Detailed examination of the data for these landings did not surface any reasons tosuspect the validity of the data.
5.2.4 Ground Speed Data.
The cumulative probabilities of ground speed for taxi in and taxi out operations are presented infigure A-23. The taxi in speeds are seen to be considerably higher than the taxi out speeds.There can be several reasons for this difference. First, the airplane may still be moving at a fairlyhigh speed shortly after turning off the active runway. Departure from the active runway hasbeen used as the criterion for start of taxi in. Second, movement of inbound traffic to theterminal after landing is generally accomplished faster than similar movement from the terminalto the takeoff position. Figure A-24 shows the cumulative probabilities of airspeed at liftoff andtouchdown rotation. The liftoff speeds are approximately 30 knots higher than the touchdownspeeds.
5.2.5 Flare Data.
Figure A-25 presents the cumulative probability of airspeed at flare. Since the actual instant offlare is difficult to determine with any great accuracy, the start of flare was assumed to occur 3seconds prior to main gear squat switch closure.
5.2.6 Pitch/Rotation Data.
The cumulative probability of maximum pitch angle at takeoff and landing is presented infigure A-26. Figure A-27 presents the cumulative probability of maximum takeoff pitch rate attakeoff rotation. Figure A-28 presents the cumulative probability of pitch angle that occurs upon

21
encountering the maximum vertical load factor associated with touchdown. Comparison of thedata in figures A-26 and A-28 shows close agreement between the cumulative probability ofpitch angle at touchdown and at touchdown peak vertical load factor. This indicates that littlechange in pitch angle occurs between the time of initial touchdown and the time when themaximum vertical load factor occurs.
5.3 FLIGHT LOADS DATA.
The flight loads data include the statistical data that describe the gust and maneuverenvironment. The gust environment is presented in the form of cumulative occurrences ofderived gust velocity, continuous gust intensity, and vertical load factor. The derived gustvelocity and continuous gust intensity are computed values as described in section 4.3. Since the1950s, it has been common practice to present flight loads data as cumulative occurrences. Datathat were previously recorded on the B-737 and MD-82/83 are reported in references 4, 5, and 6as cumulative occurrences per 1000 hours. To compare to data from different references, thenormal acceleration data are plotted two ways, as cumulative occurrences per 1000 hours and ascumulative occurrences per nautical mile.
5.3.1 Gust Loads Data.
The gust data are presented in the form of incremental vertical accelerations, derived gustvelocity Ude, and continuous gust intensities Uσ. The magnitudes of the derived gust velocitiesand continuous gust intensities were derived from the measured accelerations in accordance withthe procedures presented in paragraphs 4.3.4 and 4.3.5. Figure A-29 presents the cumulativeoccurrences of incremental vertical gust load factor per 1000 hours. The data are presented byphase of flight. Figure A-30 shows cumulative occurrences of incremental vertical gust loadfactor for the total combined airborne phases per 1000 hours. Figure A-31 presents thecumulative occurrences of incremental vertical gust load factor per nautical mile by phase offlight, and figure A-32 shows the cumulative occurrences of incremental vertical gust load factorfor the total combined airborne phases per nautical mile. In figures A-33 through A-40, thederived gust velocity Ude is plotted as cumulative counts per nautical mile for altitudes from sealevel to 49,500 feet. The derived gust velocities are compared to the gust velocity distributionspresented in reference 7. The gust velocity data from reference 7 have frequently been used inestablishing structural design criteria for repeated gust loads. The gust experience at altitudesbelow 500 feet compares very well with the reference 7 predictions. The gusts experiencedbetween 500 and 4,500 feet are more severe than would be predicted by the reference 7approach. Above 9,500 feet reference 7 predicts increasingly more severe gust spectra than wasobtained form the B-767-200ER data. Figures A-41 and A-42 present the derived gust velocityUde as cumulative counts per nautical mile with flaps extended and retracted respectively.Figures A-43 and A-44 present the cumulative occurrences per nautical mile of the continuousgust intensities for the flaps extended and flaps retracted conditions respectively.
5.3.2 Maneuver Loads Data.
Figures A-45 through A-49 present the cumulative occurrences of incremental maneuver loadfactor per 1000 hours by altitude for each of the airborne flight phases, i.e., departure, climb,cruise, descent, and approach. Figures A-50 through A-54 present the cumulative occurrences of

22
incremental maneuver load factor by altitude per nautical mile in the airborne phases of flight.Figure A-55 presents the total cumulative occurrences of incremental maneuver load factor per1000 hours for each phase of flight regardless of altitude. Figure A-56 presents the totalcumulative occurrences of incremental maneuver load factor per 1000 hours for all flight phasescombined. Figure A-57 presents the total cumulative occurrences of incremental maneuver loadfactor per nautical mile for each phase of flight regardless of altitude. Figure A-58 presents thetotal cumulative occurrences of incremental maneuver load factor per nautical mile for all flightphases combined.
5.3.3 Combined Maneuver and Gust Loads Data.
For the data presented in this section, the maneuver and gust load factors were not separated, butthe total load factor occurrences regardless of the cause were used in the derivation of thefigures. Figure A-59 shows the cumulative occurrences of total combined maneuver and gustnormal load factor per 1000 hours by phases of flight, and figure A-60 shows the occurrences forall phases combined. Figures A-61 and A-62 show the data of figures A-59 and A-60 asoccurrences per nautical mile. Figure A-63 presents the cumulative occurrences of lateral loadfactor for the combined phases of flight.
5.3.4 V-n Diagrams.
Federal Aviation Regulation (FAR) 25.333 requires that strength requirements be met at eachcombination of airspeed and load factor on and within the boundaries of the representativemaneuvering and gust load envelopes (V-n diagrams). For purposes of displaying the coincidentmaneuver or gust accelerations, four representative V-n diagrams were developed from the FARrequirements. V-n diagrams are a function of altitude and gross weight. For illustrationpurposes a gross weight of 290,000 pounds and a sea level altitude were selected to developrepresentative V-n diagrams.
5.3.4.1 Maneuver V-n Diagram Derivation.
For the maneuver V-n diagram, the required limit load factors are specified in FAR 25.337. Thepositive limit maneuvering load factor (n) may not be less than 2.5, and the negative limitmaneuvering load factor may not be less than -1.0 at speeds up to VC, varying linearly with speedto zero at VD. FAR 25.345 specifies that the positive limit maneuver load factor is 2.0 g whenthe flaps are extended. The stall curve on the left side of the envelopes is determined by themaximum lift coefficient. The curve was estimated by using the 1-g stall speed to estimateCLmax
.
5.3.4.2 Gust V-n Diagram Derivation.
For the gust V-n diagram, the required limit load factors for gusts result from gust velocities asspecified in FAR 25.341. The FAR specifies positive (up) and negative (down) air gust designrequirements for three different aircraft design speeds: maximum gust intensity (VB), cruisingspeed (VC), and dive speed (VD). Between sea level and 20,000 feet, the gust requirement isconstant, varying linearly to the value given for 50,000 feet. FAR 25.345 sets a requirement of

23
positive, negative, and head-on for 25-fps gusts when flaps are extended. These gust designrequirements are shown in table 9.
TABLE 9. FAR REQUIREMENTS FOR DERIVED DISCRETE GUST VELOCITIES
Gust VelocityAircraft
Design Speed0-20,000 Feet
Altitude50,000 Feet
AltitudeVB 66 fps 38 fpsVC 50 fps 25 fpsVD 25 fps 12.5 fps
Flaps Extended 25 fps
5.3.4.3 Coincident Speed and Load Factor Data.
Figures A-64 through A-67 show the V-n diagrams for maneuver and for gust with flapsretracted and extended. Coincident acceleration and speed measurements are also plotted on theV-n diagrams. As can be seen in figure A-67, some gust accelerations occurred outside the gustV-n diagram for the flaps extended case. It must be kept in mind that the V-n diagram is for aspecific gross weight-altitude combination and may well be within the V-n diagram for the actualgross weight-altitude combination that existed at the time the acceleration was measured.Furthermore, the V-n diagram reflects only one static strength requirement. The actual structureis designed by many different strength and rigidity design requirements including static strength,durability, and damage tolerance. The exceedance of a single design requirement may indicate ashortcoming in the design requirement but does not necessarily translate into a deficiency in thedesign strength.
5.4 MISCELLANEOUS OPERATIONAL DATA.
The miscellaneous operational data includes statistical usage information for flaps, speedbrakes/spoilers, and thrust reverser operations. Although control information, such as aileronand rudder deflection, was available, it was not processed because it was deemed that the slowsampling rates for control deflection prevent the reduction of reliable statistical usageinformation for these components.
5.4.1 Flap Usage Data.
Flap usage statistics that characterize the sources of repeated loads on flap structure, backupstructure, and other flap components were reduced from the measured data. Figure A-68presents the cumulative probability of maximum airspeed encountered in various flap detentsduring the departure phase of the flights. The flap detents are defined in table 7. The cumulativeprobabilities for detents 20 and 25 are based on two occurrences each. The cumulativeprobability for detent 15 is based on three data occurrences. Because of the few data occurrencesunderlying these cumulative probabilities there is no statistical significance to these curves.Figure A-69 presents similar data for the approach phase of the flights. Figures A-70 and A-71present the percent of time spent in various flap detents during the departure and approach

24
phases of flight, respectively. The figures are presented in semilog format to provide a visibleindication of the very short exposure times. As shown in figure A-70, flap detent 5 was thedetent used in almost all cases during departure.
5.4.2 Speed Brake/Spoiler Usage Data.
Information on speed brake or symmetrical spoiler deflections during flight was determined to beof major interest to both aircraft manufacturers and operators. Therefore, statistics on speedbrake/spoiler usage as a function of speed, altitude, and deflection angle were derived from themeasured data. To be counted as a deployment cycle the speed brake/spoiler had to deflect morethan 7 degrees for a period of 3 seconds. Data on speed brake/spoiler operations occurringduring the landing roll are available, but were not reduced into statistical format. Figure A-72presents the cumulative occurrences of maximum speed encountered while the speed brakeswere deployed, while figure A-73 presents the cumulative occurrences of speed at the moment ofspeed brake deployment. Figure A-74 presents the cumulative occurrences of altitude at themoment of speed brake deployment. As can be seen in figures A-73 and A-74, speed brakecycles occur on average more than once per flight. This is opposite to the spoiler experience onthe B-737-400 as presented in reference 5, which shows that the speed brakes were deployed lessthan once per flight. Figure A-75 presents the cumulative probability of maximum deploymentangle reached during the time that the speed brakes were deployed for the flaps retractedconfiguration. No speed brake cycles were counted for the conditions of flaps deflected invarious detents. Figure A-76 provides information regarding the time spent in various coincidentspeed brake/flap settings.
5.4.3 Thrust Reverser Data.
Cumulative probabilities of duration and speed associated with thrust reverser operations werederived from the measured data. Figure A-77 presents the cumulative probability of total timethat thrust reversers are deployed. Figure A-78 presents the cumulative probability of the speedat the time when the thrust reversers were deployed or stowed. Although normally the thrustreversers are deployed and stowed a single time for each landing, the measured data showed twocycles of thrust reverser operation on a few occasions. This accounts for the rare occurrence ofthrust reverser deployment at speeds as low as 45 knots in figure A-78. The data processing didnot evaluate the engine power lever angles existing at these specific low-speed thrust reverserdeployments.
5.5 PROPULSION SYSTEM DATA.
The cumulative probability of engine fan speed N1 associated with thrust reverser operations wasderived from the measured N1 engine parameter. Figure A-79 presents the cumulativeprobability of percent of engine fan speed N1 at takeoff, while figure A-80 presents similar datafor the landing roll at the instant of thrust reverser deployment and the maximum percent of fanspeed N1 encountered during the time that the thrust reverser is deployed.

25
6. CONCLUSIONS.
The data in figure A-67 shows that the measured gust load factors for the flaps extendedconfiguration can occur outside the design V-n diagram. Identical data based on longer datacollection periods for other large transport aircraft as shown in references 5 and 6 show manymore occurrences outside the V-n diagram. This suggests that the present gust designrequirements for the flaps extended configuration may need to be reviewed for adequacy. Anassessment of the appropriateness of the continued use of Ude design values specified in FAR25.345 for high-lift devices appears to be justified.
Derived gust velocity, Ude, values recorded from this effort show deviation from the datapresented in reference 7. In general, for altitudes above 4,500 feet the B-767-200ER data showlower levels of occurrences for the upward and downward gusts than would be predicted by thedata in reference 7. This is consistent with the data from the B-737-200 and MD-82/83 inreferences 5 and 6. In as much as reference 7 represented a rather preliminary effort to defineatmospheric turbulence and the data from three different aircraft are relatively consistent, it isappropriate that the turbulence descriptions in reference 7 be used with caution. It is reasonableto expect that the gust intensity Uσ spectra would show a similar deviation from the spectrabased on the requirements in Appendix G of the FAR. Comparison of gust intensity spectra withthe requirements in the FAR is considered a desirable addition to the report. The FARrequirements for gust intensity spectra are specified in terms of turbulence field parametersP and b. Development of new values for the turbulence field parameters based on gust intensitydata from the B-767-200ER combined with similar data from other aircraft such as theB-737-400 and MD-82/83 is considered very desirable.
Statistical information on flight control surface activity is a valuable input to the designrequirements for these surfaces and their associated components. Flight control surfacedeflections are recorded at two samples per second (2 sps) and can easily be reduced to providethe desired information. Unfortunately, there are doubts about the adequacy of the samplingrates to provide reliable results. For this reason the flight control surface deflection data werenot processed.
7. REFERENCES.
1. Crabill, Norman L., “FAA/NASA Prototype Flight Loads Program SystemsRequirements, B737-400 Aircraft,” Eagle Aerospace Inc., Contract NAS1-19659,unpublished report, November 1994.
2. de Jonge, B., “Reduction of Incremental Load Factor Acceleration Data to GustStatistics,” DOT/FAA/CT-94/57, August 1994.
3. Rustenburg, John W., Skinn, Donald, and Tipps, Daniel O., “An Evaluation of Methodsto Separate Maneuver and Gust Load Factors From Measured Acceleration TimeHistories,” DOT/FAA/AR-99/14, April 1999.
4. “Flight Loads Data for a Boeing 737-400 in Commercial Operation,” DOT/FAA/AR-95/21, April 1996.

26
5. “Flight Loads Data for a Boeing 737-400 in Commercial Operation,” DOT/FAA/AR-98/28, August 1998.
6. “Flight Loads Data for a MD-82/83 in Commercial Operation,” DOT/FAA/AR-98/65,February 1999.
7. Press, Harry and Steiner, Roy, “An Approach to the Problem of Estimating Severe andRepeated Gust Loads for Missile Operations,” National Advisory Committee forAeronautics Technical Note 4332, September 1958, Langley Aeronautical Laboratory,Langley Field, Va.

FIG
UR
E A
-1.
CU
MU
LA
TIV
E P
RO
BA
BIL
ITY
OF
TA
KE
OF
FG
RO
SS
WE
IGH
T F
IGU
RE
A-2
. C
UM
UL
AT
IVE
PR
OB
AB
ILIT
Y O
F T
AK
EO
FF
FU
EL
WE
IGH
T
APPENDIX A DATA PRESENTATION
A-1
������������������������������������������������
������������������������������
���������������������������������������
�����������
�������������������������������
��������������
��������������
��������������
�������
��������������
��������������
�������
�������
�������
��������������
�������
�������
�������
������� �������
�������
�������
�������
�������
������� �������
�������
�������
�������
�������
�������
0
0.1
0.2
0.3
0.4
0.5
0.6
0.7
0.8
0.91
20
02
20
24
02
60
28
03
00
32
03
40
Cumulative Probability
Ta
keo
ff G
ross
We
igh
t (
10
00
Lb
)�������������������������������
�������������������������������
�������������������������������
B-7
67
-20
0E
R1
28
5 F
ligh
ts
����������������
����������������
���������������������������������������������������������������������������
������������
��������������������
��������
��������
�����������������
���������
���������
���������
�������������� ����
������
�����
�����
�����
�����
����������� ����
��������
������
������
������ ������ ����
��������
������ ������ ����
�� ������� ����
��������������
0
0.1
0.2
0.3
0.4
0.5
0.6
0.7
0.8
0.91
10
30
50
70
90
11
01
30
15
0
Cumulative Probability
Ta
keo
ff F
ue
l W
eig
ht
- (1
00
0 L
b)
����������������������������
����������������������������
����������������������������
B-7
67
-20
0E
R1
28
5 F
ligh
ts

FIG
UR
E A
-3.
CU
MU
LA
TIV
E P
RO
BA
BIL
ITY
OF
LA
ND
ING
GR
OS
S W
EIG
HT
FIG
UR
E A
-4.
CO
RR
EL
AT
ION
OF
TA
KE
OF
F F
UE
LW
EIG
HT
AN
D F
LIG
HT
DIS
TA
NC
E
A-2
����������������������������������������������������������
�����������
����������
�����
�������������
��������
��������
���������������
�������
�������
��������������
�������
�������
�������
�������������
������
������
������
������
������ �����
�����
�����
�����
�����
�����
����� ���� ���� ���� ���� ����
���������������
��������������
������������������������������������������������
0
0.1
0.2
0.3
0.4
0.5
0.6
0.7
0.8
0.91
150
200
250
300
350
Cumulative Probability
Land
ing
Gro
ss W
eigh
t - (
1000
Lb)
����������������������������
����������������������������
B-7
67-2
00E
R12
85 F
light
s
0
500
1000
1500
2000
2500
3000
3500
4000
020
000
4000
060
000
8000
010
0000
1200
0014
0000
Flight Distance (nautical miles)
Take
off
Fuel
Wei
ght
(lb)
������������������������������������
������������������������������������
������������������������������������
������������������������������������
B-7
67-2
00E
R12
85 F
light
s
A-3
FIGURE A-5. CORRELATION OF TAKEOFF GROSS WEIGHT AND FLIGHT DISTANCE,PERCENT OF FLIGHTS
FIGURE A-6. CORRELATION OF GROSS WEIGHT AT LIFTOFF AND TOUCHDOWN,PERCENT OF FLIGHTS
����������
��� �������
����������
����������
����������
����������
����������
����������
����������
����������
����������
����������
����������
����������
����������
����������
����������
����������
����������
����������
����������
����������
����������
����������
����������
����������
����������
��� �������
����������
����������
����������
����������
����������
����������
����������
����������
����������
����������
����������
����������
����������
����������
����������
����������
����������
����������
�����������
��� ��������
�����������
�����������
�����������
�����������
�����������
�����������
�����������
�����������
�����������
�����������
�����������
�����������
�����������
�����������
�����������
�����������
�����������
�����������
�����������
�����������
�����������
�����������
�����������
�����������
�����������
��� ��������
�����������
�����������
�����������
�����������
�����������
�����������
�����������
�����������
�����������
�����������
�����������
�����������
�����������
�����������
�����������
�����������
�����������
�����������
�����������
��� ��������
�����������
�����������
�����������
�����������
�����������
�����������
�����������
�����������
�����������
�����������
�����������
�����������
�����������
�����������
�����������
�����������
�����������
�����������
�����������
�����������
�����������
�����������
�����������
�����������
�����������
��� ��������
�����������
�����������
�����������
�����������
�����������
�����������
�����������
�����������
�����������
�����������
�����������
�����������
�����������
�����������
�����������
�����������
�����������
�����������
�����������
���� �������
�����������
�����������
�����������
�����������
�����������
�����������
�����������
�����������
�����������
�����������
�����������
�����������
�����������
�����������
�����������
�����������
�����������
�����������
�����������
�����������
�����������
�����������
�����������
�����������
�����������
�����������
�����������
�����������
�����������
�����������
�����������
�����������
�����������
�����������
�����������
�����������
�����������
�����������
�����������
�����������
�����������
�����������
�����������
�����������
�����������
�����������
�����������
�����������
�����������
�����������
�����������
�����������
�����������
�����������
�����������
�����������
�����������
�����������
�����������
�����������
�����������
�����������
�����������
�����������
������������
������������
������������
������������
������������
������������
������������
������������
������������
������������
������������
������������
������������
������������
������������
������������
������������
������������
������������
������������
������������
������������
������������
������������
������������
������������
������������
������������
������������
������������
������������
������������
������������
������������
������������
������������
������������
������������
������������
������������
������������
������������
������������
������������
������������
������������
��������
� �������
��������
��������
��������
��������
��������
��������
��������
��������
��������
��������
��������
��������
��������
��������
��������
��������
��������
��������
��������
��������
��������
��������
��������
��������
��������
� �������
��������
��������
��������
��������
��������
��������
��������
��������
��������
��������
��������
��������
��������
��������
��������
��������
��������
��������
��������
� �������
��������
��������
��������
��������
��������
��������
��������
��������
��������
��������
��������
��������
��������
��������
��������
��������
��������
��������
��������
��������
��������
��������
��������
��������
��������
� �������
��������
��������
��������
��������
��������
��������
��������
��������
��������
��������
��������
��������
��������
��������
��������
��������
��������
��������
��������
� �������
��������
��������
��������
��������
��������
��������
��������
��������
��������
��������
��������
��������
��������
��������
��������
��������
��������
��������
��������
��������
��������
��������
��������
��������
��������
� �������
��������
��������
��������
��������
��������
��������
��������
��������
��������
��������
��������
��������
��������
��������
��������
��������
��������
��������
���������
� ��������
���������
���������
���������
���������
���������
���������
���������
���������
���������
���������
���������
���������
���������
���������
���������
���������
���������
���������
���������
���������
���������
���������
���������
���������
���������
� ��������
���������
���������
���������
���������
���������
���������
���������
���������
���������
���������
���������
���������
���������
���������
���������
���������
���������
���������
���������
�� �������
���������
���������
���������
���������
���������
���������
���������
���������
���������
���������
���������
���������
���������
���������
���������
���������
���������
���������
���������
���������
���������
���������
���������
���������
���������
�� �������
���������
���������
���������
���������
���������
���������
���������
���������
���������
���������
���������
���������
���������
���������
���������
���������
���������
���������
���������
�� �������
���������
���������
���������
���������
���������
���������
���������
���������
���������
���������
���������
���������
���������
���������
���������
���������
���������
���������
���������
���������
���������
���������
���������
���������
���������
�� �������
���������
���������
���������
���������
���������
���������
���������
���������
���������
���������
���������
���������
���������
���������
���������
���������
���������
���������
����������
�� ��������
����������
����������
����������
����������
����������
����������
����������
����������
����������
����������
����������
����������
����������
����������
����������
����������
����������
����������
����������
����������
����������
����������
����������
����������
����������
�� ��������
����������
����������
����������
����������
����������
����������
����������
����������
����������
����������
����������
����������
����������
����������
����������
����������
����������
����������
����������
�� ��������
����������
����������
����������
����������
����������
����������
����������
����������
����������
����������
����������
����������
����������
����������
����������
����������
����������
����������
����������
����������
����������
����������
����������
����������
����������
�� ��������
����������
����������
����������
����������
����������
����������
����������
����������
����������
����������
����������
����������
����������
����������
����������
����������
����������
����������
340-350
��� ��� ���330-340
��� ��� �������������
320-330
��� ��� ��� ����������
310-320
��� ��� ��� ����������
300-310
��� ��� �������������
290-300
��� ��� ����������
280-290
��� ��� �������������
����������
270-280
��� ��� �������������
260-270
��� ��� ��� ����������
250-260
��� ��� ��� ����������
240-250
��� ��� �������������
230-240
��� ��� �������������
220-230
��� �������������
210-220
��� ��� �������������
����������
200-210
��� ��� �������������
1284 Flts
��� ��� �������������
��� ��� ������ ��� �������������
��� ��� ��� ����������
��� ��� ��� ����������
��� ��� �������������
��� ��� ����������
��� ��� �������������
����������
��� ��� �������������
��� ��� ��� ����������
��� ��� ��� ����������
��� ��� �������������
��� ��� �������������
��� �������������
��� ��� �������������
����������
0.078
��� ��� �������������
180-190
��� ��� �������������
��� ��� ������ ��� ��������������
��� ��� ��� �����������
��� ��� ��� �����������
��� ��� ��������������
��� ��� �����������
��� ��� ��������������
�����������
��� ��� ��������������
��� ��� ��� �����������
��� ��� ��� �����������
��� ��� ��������������
��� ��� ��������������
��� ��������������
��� ��� ��������������
�����������
0.389
��� ��� ��������������
190-200
��� ��� ��������������
��� ��� ������ ��� ��������������
��� ��� ��� �����������
��� ��� ��� �����������
��� ��� ��������������
��� ��� �����������
��� ��� ��������������
�����������
��� ��� ��������������
��� ��� ��� �����������
��� ��� ��� �����������
��� ��� ��������������
��� ��� ��������������
��� ��������������
0.312
��� ��� ��������������
�����������
��� ��� ��������������
200-210
��� ��� ��������������
���� ���� �������� ���� ���������������
���� ���� ���� �����������
���� ���� ���� �����������
���� ���� ���������������
���� ���� �����������
0.078
���� ���� ���������������
�����������
0.078
���� ���� ���������������
���� ���� ���� �����������
���� ���� ���� �����������
���� ���� ���������������
0.078
���� ���� ���������������
0.234
���� ���������������
���� ���� ���������������
�����������
���� ���� ���������������
210-220
���� ���� ���������������
���� ���� �������� ���� ���������������
���� ���� ���� �����������
0.078
���� ���� ���� �����������
1.012
���� ���� ���������������
0.857
���� ���� �����������
0.701
���� ���� ���������������
�����������
���� ���� ���������������
���� ���� ���� �����������
���� ���� ���� �����������
0.312
���� ���� ���������������
0.701
���� ���� ���������������
���� ���������������
���� ���� ���������������
�����������
���� ���� ���������������
220-230
���� ���� ���������������
���� ���� ����0.234
���� ���� ����������������
1.090
���� ���� ���� ������������
2.336
���� ���� ���� ������������
2.882
���� ���� ����������������
1.402
���� ���� ������������
0.078
���� ���� ����������������
������������
���� ���� ����������������
���� ���� ���� ������������
0.467
���� ���� ���� ������������
1.246
���� ���� ����������������
���� ���� ����������������
���� ����������������
���� ���� ����������������
������������
���� ���� ����������������
230-240
���� ���� ����������������
0.779
�����
�����
�����2.259
�����
�����
�����������������6.931
�����
�����
�����������������4.907
�����
�����
�����������������1.869
�����
�����
�����������������
�����
�����������������
�����
�����
�����
������������
������������
�����
�����
�����������������0.623
�����
�����
�����������������1.869
�����
�����
�����������������
�����
�����
�����������������
�����
�����
�����������������
�����
�����������������
�����
�����
�����
������������
������������
�����
�����
�����������������240-250
�����
�����
�����������������
8.956� � �
9.502� � �
������������10.514
� � �������������2.259
� � �������������0.078
� � �������������0.156
� �������������
� � �������������
������������0.389
� � �������������1.246
� � �������������
� � �������������
� � �������������
� � �������������
� �������������
� � �������������
������������
� � �������������250-260
� � �������������
9.190� � �
16.277� � �����
�����
3.271� � � ����
�����
� � � ���������
� � ����������
� � ���������
0.234� � �����
�����
���������
0.467� � �����
�����
� � � ���������
� � � ���������
� � ����������
� � ����������
� ����������
� � ����������
���������
� � ����������
260-270� � �����
�����
1.246
� � �2.025
� � ����������
� � � ���������
� � � ���������
� � ����������
� � ���������
0.156
� � ����������
���������
� � ����������
� � � ���������
� � � ���������
� � ����������
� � ����������
� ����������
� � ����������
���������
� � ����������
270-280
� � ����������
0.078
�� �� ���� �� �����������
�� �� �� ���������
�� �� �� ���������
�� �� �����������
�� �� ���������
�� �� �����������
���������
�� �� �����������
�� �� �� ���������
�� �� �� ���������
�� �� �����������
�� �� �����������
�� �����������
�� �� �����������
���������
�� �� �����������
290-300
�� �� �����������
�� �� ��0.078
�� �� �����������
�� �� �� ���������
�� �� �� ���������
�� �� �����������
�� �� ���������
�� �� �����������
���������
�� �� �����������
�� �� �� ���������
�� �� �� ���������
�� �� �����������
�� �� �����������
�� �����������
�� �� �����������
���������
�� �� �����������
300-310
�� �� �����������
20.24930.374
����������
21.807
����������
9.579
����������
5.841
����������
2.414
����������
1.246
����������
����������
0.935
����������
1.869
����������
2.336
����������
1.558
����������
0.779
����������
0.234
����������
0.312
����������
����������
0.467
����������
Total
����������
��� ��� ��� ��� ��� ��� ��� ��� ��� ��� ��� ��� ��� ��� ��� ��� ��� ��� ��� ��� ��� ��� ��� ��� ��� ��� ��� ��� ��� ��� ���
��������������������������������������������������������������������������������������������������������������
��� ��� ��� ��� ��� ��� ��� ��� ��� ��� ��� ��� ��� ��� ��� ��� ��� ��� ��� ��� ��� ��� ��� ��� ��� ��� ��� ��� ��� ��� ��� ��������������������������������������������������������������������������������������������������������������
Gross Weight at Lif tof f (lb)
Gro
ss
We
igh
t a
t T
ou
ch
do
wn
(l
b)
����������������
����������������
����������������
����������������
����������������
����������������
����������������
����������������
����������������
����������������
����������������
����������������
����������������
����������������
����������������
����������������
����������������
����������������
����������������
����������������
����������������
����������������
����������������
����������������
����������������
����������������
����������������
����������������
����������������
����������������
����������������
����������������
����������������
����������������
����������������
����������������
����������������
����������������
����������������
����������������
����������������
����������������
����������������
����������������
����������������
����������������
����������������
����������������
����������������
����������������
����������������
����������������
����������������
����������������
����������������
����������������
����������������
����������������
����������������
����������������
����������������
����������������
����������������
����������������
����������������
����������������
����������������
����������������
����������������
����������������
����������������
����������������
����������������
����������������
����������������
����������������
����������������
����������������
����������������
����������������
����������������
����������������
����������������
����������������
����������������
����������������
����������������
����������������
����������������
����������������
����������������
����������������
���������������
���������������
���������������
���������������
���������������
���������������
���������������
���������������
���������������
���������������
���������������
���������������
���������������
���������������
���������������
���������������
���������������
���������������
���������������
���������������
���������������
���������������
���������������
���������������
���������������
���������������
���������������
���������������
���������������
���������������
���������������
���������������
���������������
���������������
���������������
���������������
���������������
���������������
���������������
���������������
���������������
���������������
���������������
���������������
���������������
���������������
���������������
���������������
���������������
���������������
���������������
���������������
���������������
���������������
���������������
���������������
���������������
���������������
���������������
���������������
���������������
���������������
���������������
���������������
���������������
���������������
���������������
���������������
���������������
���������������
���������������
���������������
���������������
���������������
���������������
���������������
���������������
���������������
���������������
���������������
���������������
���������������
���������������
���������������
���������������
���������������
���������������
���������������
���������������
���������������
���������������
���������������
���������������
���������������
���������������
���������������
���������������
���������������
���������������
���������������
���������������
���������������
���������������
���������������
���������������
���������������
���������������
���������������
���������������
���������������
���������������
���������������
���������������
���������������
���������������
���������������
���������������
���������������
���������������
���������������
���������������
���������������
���������������
���������������
���������������
���������������
���������������
���������������
���������������
���������������
���������������
���������������
���������������
���������������
���������������
���������������
���������������
���������������
���������������
���������������
���������������
���������������
���������������
���������������
���������������
���������������
���������������
���������������
���������������
���������������
���������������
���������������
���������������
���������������
���������������
���������������
���������������
���������������
���������������
���������������
���������������
���������������
���������������
���������������
���������������
���������������
���������������
���������������
���������������
���������������
���������������
���������������
���������������
���������������
���������������
���������������
���������������
���������������
���������������
���������������
���������������
���������������
���������������
���������������
���������������
���������������
���������������
���������������
���������������
���������������
���������������
���������������
���������������
���������������
���������������
���������������
���������������
���������������
���������������
���������������
���������������
���������������
���������������
���������������
���������������
���������������
���������������
���������������
���������������
���������������
���������������
���������������
���������������
���������������
���������������
���������������
���������������
���������������
���������������
���������������
���������������
���������������
���������������
���������������
���������������
���������������
���������������
���������������
���������������
���������������
���������������
���������������
���������������
���������������
���������������
���������������
���������������
���������������
���������������
���������������
���������������
���������������
���������������
���������������
���������������
���������������
���������������
���������������
���������������
���������������
���������������
���������������
���������������
���������������
���������������
���������������
���������������
���������������
���������������
���������������
���������������
���������������
���������������
���������������
���������������
���������������
���������������
���������������
���������������
���������������
���������������
���������������
���������������
���������������
���������������
���������������
���������������
���������������
���������������
���������������
���������������
���������������
���������������
���������������
���������������
���������������
���������������
���������������
���������������
���������������
���������������
���������������
���������������
���������������
���������������
���������������
���������������
���������������
���������������
���������������
���������������
���������������
���������������
���������������
���������������
���������������
���������������
���������������
���������������
���������������
���������������
���������������
���������������
���������������
���������������
���������������
���������������
���������������
���������������
���������������
���������������
���������������
���������������
���������������
���������������
���������������
���������������
���������������
���������������
���������������
���������������
���������������
���������������
���������������
���������������
���������������
���������������
���������������
���������������
���������������
���������������
���������������
���������������
���������������
���������������
���������������
���������������
���������������
���������������
���������������
���������������
���������������
���������������
���������������
���������������
���������������
���������������
���������������
���������������
���������������
���������������
���������������
���������������
���������������
���������������
���������������
���������������
���������������
���������������
���������������
���������������
���������������
���������������
���������������
���������������
���������������
���������������
���������������
���������������
���������������
���������������
���������������
���������������
���������������
���������������
���������������
���������������
���������������
���������������
���������������
���������������
���������������
���������������
���������������
���������������
���������������
���������������
���������������
���������������
���������������
���������������
���������������
���������������
���������������
���������������
���������������
���������������
���������������
���������������
���������������
���������������
���������������
���������������
���������������
��������������
��������������
��������������
��������������
��������������
��������������
��������������
��������������
��������������
��������������
��������������
��������������
��������������
��������������
��������������
��������������
��������������
��������������
��������������
��������������
��������������
��������������
��������������
��������������
��������������
��������������
��������������
��������������
��������������
��������������
��������������
��������������
��������������
��������������
��������������
��������������
��������������
��������������
��������������
��������������
��������������
��������������
��������������
��������������
��������������
��������������
340-350
���� ���� ����330-340
���� ���� ��������������������
����������������
320-330
���� ���� ���� ����������������
310-320
���� ���� ���� ����������������
300-310
���� ���� ��������������������
290-300
���� ���� ���� ����������������
280-290
���� ���� ���� ����������������
270-280
���� ���� ���� ����������������
260-270
���� ���� ��������������������
250-260
���� ���� ���� ����������������
240-250
���� ���� ��������������������
230-240
���� ���� ��������������������
220-230
���� ���� ��������������������
210-220
���� ���� ��������������������
200-210
���� ���� ��������������������
1285 Flts
���� ���� ���� ��������������������
0.078
���� ���� ����0.078
���� ���� �������������������
���������������
���� ���� ���� ���������������
���� ���� ���� ���������������
���� ���� �������������������
���� ���� ���� ���������������
���� ���� ���� ���������������
���� ���� ���� ���������������
0.156
���� ���� �������������������
���� ���� ���� ���������������
���� ���� �������������������
0.078
���� ���� �������������������
���� ���� �������������������
���� ���� �������������������
0.233
���� ���� �������������������
0-250
���� ���� ���� �������������������
��� ��� ������ ��� ������������������
���������������
��� ��� ��� ���������������
��� ��� ��� ���������������
��� ��� ������������������
��� ��� ��� ���������������
0.311
��� ��� ��� ���������������
0.856
��� ��� ��� ���������������
1.712
��� ��� ������������������
2.335
��� ��� ��� ���������������
1.556
��� ��� ������������������
0.700
��� ��� ������������������
0.233
��� ��� ������������������
0.311
��� ��� ������������������
0.233
��� ��� ������������������
250-500
��� ��� ��� ������������������
0.078
��� ��� ������ ��� ������������������
���������������
��� ��� ��� ���������������
��� ��� ��� ���������������
��� ��� ������������������
��� ��� ��� ���������������
0.078
��� ��� ��� ���������������
��� ��� ��� ���������������
��� ��� ������������������
��� ��� ��� ���������������
��� ��� ������������������
��� ��� ������������������
��� ��� ������������������
��� ��� ������������������
��� ��� ������������������
500-750
��� ��� ��� ������������������
��� ��� ������ ��� ������������������
���������������
��� ��� ��� ���������������
��� ��� ��� ���������������
��� ��� ������������������
0.078
��� ��� ��� ���������������
0.078
��� ��� ��� ���������������
��� ��� ��� ���������������
��� ��� ������������������
��� ��� ��� ���������������
��� ��� ������������������
��� ��� ������������������
��� ��� ������������������
��� ��� ������������������
��� ��� ������������������
1750-2000
��� ��� ��� ������������������
��� ��� ������ ��� ������������������
���������������
��� ��� ��� ���������������
��� ��� ��� ���������������
0.078
��� ��� ������������������
0.078
��� ��� ��� ���������������
��� ��� ��� ���������������
��� ��� ��� ���������������
��� ��� ������������������
��� ��� ��� ���������������
��� ��� ������������������
��� ��� ������������������
��� ��� ������������������
��� ��� ������������������
��� ��� ������������������
2000-2250
��� ��� ��� ������������������
��� ��� ���0.156
��� ��� ������������������
���������������
��� ��� ��� ���������������
��� ��� ��� ���������������
��� ��� ������������������
��� ��� ��� ���������������
��� ��� ��� ���������������
��� ��� ��� ���������������
��� ��� ������������������
��� ��� ��� ���������������
��� ��� ������������������
��� ��� ������������������
��� ��� ������������������
��� ��� ������������������
��� ��� ������������������
2750-3000
��� ��� ��� ������������������
3.891
��� ��� ���14.708
��� ��� ������������������
���������������
13.385
��� ��� ��� ���������������
6.304
��� ��� ��� ���������������
3.346
��� ��� ������������������
1.712
��� ��� ��� ���������������
0.467
��� ��� ��� ���������������
0.078
��� ��� ��� ���������������
��� ��� ������������������
��� ��� ��� ���������������
��� ��� ������������������
��� ��� ������������������
��� ��� ������������������
��� ��� ������������������
��� ��� ������������������
3000-3250
��� ��� ��� ������������������
4.125
��� ��� ���5.292
��� ��� ������������������
���������������
4.591
��� ��� ��� ���������������
1.634
��� ��� ��� ���������������
1.790
��� ��� ������������������
0.545
��� ��� ��� ���������������
0.233
��� ��� ��� ���������������
��� ��� ��� ���������������
��� ��� ������������������
��� ��� ��� ���������������
��� ��� ������������������
��� ��� ������������������
��� ��� ������������������
��� ��� ������������������
��� ��� ������������������
3250-3500
��� ��� ��� ������������������
8.405
�� �� ��6.381
�� �� ����������������
��������������
2.646
�� �� �� ��������������
1.012
�� �� �� ��������������
0.623
�� �� ����������������
�� �� �� ��������������
0.078
�� �� �� ��������������
�� �� �� ��������������
�� �� ����������������
�� �� �� ��������������
�� �� ����������������
�� �� ����������������
�� �� ����������������
�� �� ����������������
�� �� ����������������
3500-3750
�� �� �� ����������������
3.735
�� �� ��3.735
�� �� ����������������
��������������
1.167
�� �� �� ��������������
0.623
�� �� �� ��������������
�� �� ����������������
�� �� �� ��������������
�� �� �� ��������������
�� �� �� ��������������
�� �� ����������������
�� �� �� ��������������
�� �� ����������������
�� �� ����������������
�� �� ����������������
�� �� ����������������
�� �� ����������������
3750-4000
�� �� �� ����������������
20.31130.350
��������������
��������������
21.790
��������������
9.572
��������������
5.837
��������������
2.412
��������������
1.245
��������������
0.934
��������������
1.868
��������������
2.335
��������������
1.556
��������������
0.778
��������������
0.233
��������������
0.311
��������������
0.467
��������������
Total
��������������
���� ���� ���� ���� ���� ���� ���� ���� ���� ���� ���� ���� ���� ���� ���� ���� ���� ���� ���� ���� ���� ���� ���� ���� ���� ���� ���� ���� ���� ���� ���� ���� ����
���������������������������������������������������������������������������������������������������������������������������������������������������
�� �� �� �� �� �� �� �� �� �� �� �� �� �� �� �� �� �� �� �� �� �� �� �� �� �� �� �� �� �� �� �� �����������������������������������������������������������������������������������������������������������������������������������������������������
���������������������������������������������������������������������������������������������������������������������������������������������������
Takeoff Gross Wieght (lb)
Fli
gh
t D
ista
nce
(n
au
tica
l m
ile
s)

A-4
FIGURE A-7. CORRELATION OF MAXIMUM ALTITUDE AND FLIGHT DISTANCE,PERCENT OF FLIGHTS
FIGURE A-8. PERCENT OF TOTAL DISTANCE IN ALTITUDE BANDS
��������������
��������������
��������������
��������������
��������������
��������������
��������������
��������������
��������������
��������������
��������������
��������������
��������������
��������������
��������������
��������������
��������������
��������������
��������������
��������������
��������������
��������������
��������������
��������������
��������������
��������������
��������������
��������������
��������������
������������
������������
������������
������������
������������
������������
������������
������������
������������
������������
������������
������������
������������
������������
������������
������������
������������
������������
������������
������������
������������
������������
������������
������������
������������
������������
������������
������������
������������
����������
����������
����������
����������
����������
����������
����������
����������
����������
����������
����������
����������
����������
����������
����������
����������
����������
����������
����������
����������
����������
����������
����������
����������
����������
����������
����������
����������
����������
������������
������������
������������
������������
������������
������������
������������
������������
������������
������������
������������
������������
������������
������������
������������
������������
������������
������������
������������
������������
������������
������������
������������
������������
������������
������������
������������
������������
������������
��������������
��������������
��������������
��������������
��������������
��������������
��������������
��������������
��������������
��������������
��������������
��������������
��������������
��������������
��������������
��������������
��������������
��������������
��������������
��������������
��������������
��������������
��������������
��������������
��������������
��������������
��������������
��������������
��������������
������������
������������
������������
������������
������������
������������
������������
������������
������������
������������
������������
������������
������������
������������
������������
������������
������������
������������
������������
������������
������������
������������
������������
������������
������������
������������
������������
������������
������������
����������
����������
����������
����������
����������
����������
����������
����������
����������
����������
����������
����������
����������
����������
����������
����������
����������
����������
����������
����������
����������
����������
����������
����������
����������
����������
����������
����������
����������
������������
������������
������������
������������
������������
������������
������������
������������
������������
������������
������������
������������
������������
������������
������������
������������
������������
������������
������������
������������
������������
������������
������������
������������
������������
������������
������������
������������
������������
����������
����������
����������
����������
����������
����������
����������
����������
����������
����������
����������
����������
����������
����������
����������
����������
����������
����������
����������
����������
����������
����������
����������
����������
����������
����������
����������
����������
����������
�������������
�������������
�������������
�������������
�������������
�������������
�������������
�������������
�������������
�������������
�������������
�������������
�������������
�������������
�������������
�������������
�������������
�������������
�������������
�������������
�������������
�������������
�������������
�������������
�������������
�������������
�������������
�������������
�������������
�����������
�����������
�����������
�����������
�����������
�����������
�����������
�����������
�����������
�����������
�����������
�����������
�����������
�����������
�����������
�����������
�����������
�����������
�����������
�����������
�����������
�����������
�����������
�����������
�����������
�����������
�����������
�����������
�����������
�������������
�������������
�������������
�������������
�������������
�������������
�������������
�������������
�������������
�������������
�������������
�������������
�������������
�������������
�������������
�������������
�������������
�������������
�������������
�������������
�������������
�������������
�������������
�������������
�������������
�������������
�������������
�������������
�������������
Total
���� ���� ����40-45
���� ���� ���� ���� ��������������
35-40
���� ���� ���� ��������������
30-35
���� ���� ���� ���� ��������������
25-30
���� ���� ���� ��������������
20-25
���� ���� ���� ���� ��������������
15-20
���� ���� ���� ������������������
1285 Flts
���� ���� ���� ���� ������������������
0.623�� �� ���� �� �� �� �����������
0.156�� �� �� ����
�������
0.078�� �� �� �� ����
�������
0.156�� �� �� ����
�������
0.078�� �� �� �� ����
�������
0.156�� �� �� ������
�������
0-250�� �� �� �� ������
�������
8.249
���� ���� �������� ���� ���� ���� ��������������
1.868
���� ���� ���� ��������������
4.436
���� ���� ���� ���� ��������������
1.868
���� ���� ���� ��������������
0.078
���� ���� ���� ���� ��������������
���� ���� ���� ������������������
250-500
���� ���� ���� ���� ������������������
0.156
�� �� ���� �� �� �� ������������
0.156
�� �� �� ������������
�� �� �� �� ������������
�� �� �� ������������
�� �� �� �� ������������
�� �� �� ��������������
500-750
�� �� �� �� ��������������
0.156
���� ���� ����0.078
���� ���� ���� ���� ��������������
0.078
���� ���� ���� ��������������
���� ���� ���� ���� ��������������
���� ���� ���� ��������������
���� ���� ���� ���� ��������������
���� ���� ���� ������������������
1750-2000
���� ���� ���� ���� ������������������
0.156
�� �� ���� �� �� �� ������������
0.156
�� �� �� ������������
�� �� �� �� ������������
�� �� �� ������������
�� �� �� �� ������������
�� �� �� ��������������
2000-2250
�� �� �� �� ��������������
0.156
���� ���� �������� ���� ���� ���� ��������������
0.156
���� ���� ���� ��������������
���� ���� ���� ���� ��������������
���� ���� ���� ��������������
���� ���� ���� ���� ��������������
���� ���� ���� ������������������
2750-3000
���� ���� ���� ���� ������������������
43.891
�� �� ��1.634
�� �� �� �� ������������
41.946
�� �� �� ������������
0.311
�� �� �� �� ������������
�� �� �� ������������
�� �� �� �� ������������
�� �� �� ��������������
3000-3250
�� �� �� �� ��������������
18.210
�����
�����
�����
1.245
�����
�����
�����
�������������������
16.965
�����
�����
�������������������
�����
�����
�����
�������������������
�����
�����
�������������������
�����
�����
�����
�������������������
�����
�����
�����
�����
��������������
3250-3500
�����
�����
�����
�����
�������������������
19.144
��� ��� ���0.856
��� ��� ��� ��� ������������
18.288
��� ��� ��� ������������
��� ��� ��� ��� ������������
��� ��� ��� ������������
��� ��� ��� ��� ������������
��� ��� ��� ���������������
3500-3750
��� ��� ��� ��� ���������������
9.261
�����
�����
�����
0.856
�����
�����
�����
�������������������
8.405
�����
�����
�������������������
�����
�����
�����
�������������������
�����
�����
�������������������
�����
�����
�����
�������������������
�����
�����
�����
�����
��������������
3750-4000
�����
�����
�����
�����
�������������������
1004.669
������������
88.171
������������
4.825
������������
2.023
������������
0.156
������������
0.156
������������
Total
������������
��� ��� ��� ��� ��� ��� ��� ��� ��� ��� ��� ��� ��� ��� ��� ��� ��� ��� ��� ��� ��� ���
�������������������������������������������������������������������������������������������������������������������������
��� ��� ��� ��� ��� ��� ��� ��� ��� ��� ��� ��� ��� ��� ��� ��� ��� ��� ��� ��� ��� ��� �������������������������������������������������������������������������������������������������������������������������
Maximum Altitude (1000 f eet)
Flig
ht
Dis
tan
ce
(n
au
tic
al
mile
s)
�������������
�������������
�� �����������
�������������
�������������
�������������
�� �����������
�������������
�������������
�������������
�������������
�������������
�������������
�������������
�������������
�������������
�������������
�������������
�������������
�������������
�������������
�� �����������
�������������
�������������
�������������
�������������
�������������
�������������
�������������
�������������
�������������
�������������
�������������
�������������
�������������
�������������
�������������
�������������
�������������
��������������
��������������
�� ������������
��������������
��������������
��������������
�� ������������
��������������
��������������
��������������
��������������
��������������
��������������
��������������
��������������
��������������
��������������
��������������
��������������
��������������
��������������
�� ������������
��������������
��������������
��������������
��������������
��������������
��������������
��������������
��������������
��������������
��������������
��������������
��������������
��������������
��������������
��������������
��������������
��������������
��������������
��������������
��� �����������
��������������
��������������
��������������
��� �����������
��������������
��������������
��������������
��������������
��������������
��������������
��������������
��������������
��������������
��������������
��������������
��������������
��������������
��������������
��� �����������
��������������
��������������
��������������
��������������
��������������
��������������
��������������
��������������
��������������
��������������
��������������
��������������
��������������
��������������
��������������
��������������
��������������
��������������
��������������
��� �����������
��������������
��������������
��������������
��� �����������
��������������
��������������
��������������
��������������
��������������
��������������
��������������
��������������
��������������
��������������
��������������
��������������
��������������
��������������
��� �����������
��������������
��������������
��������������
��������������
��������������
��������������
��������������
��������������
��������������
��������������
��������������
��������������
��������������
��������������
��������������
��������������
��������������
���������������
���������������
��� ������������
���������������
���������������
���������������
��� ������������
���������������
���������������
���������������
���������������
���������������
���������������
���������������
���������������
���������������
���������������
���������������
���������������
���������������
���������������
��� ������������
���������������
���������������
���������������
���������������
���������������
���������������
���������������
���������������
���������������
���������������
���������������
���������������
���������������
���������������
���������������
���������������
���������������
���������������
���������������
���������������
���������������
���������������
���������������
���������������
���������������
���������������
���������������
���������������
���������������
���������������
���������������
���������������
���������������
���������������
���������������
���������������
���������������
���������������
���������������
���������������
���������������
���������������
���������������
���������������
���������������
���������������
���������������
���������������
���������������
���������������
���������������
���������������
���������������
���������������
���������������
���������������
���������������
���������������
���������������
���������������
���������������
���������������
���������������
���������������
���������������
���������������
���������������
���������������
���������������
���������������
���������������
���������������
���������������
���������������
���������������
���������������
���������������
���������������
���������������
���������������
���������������
���������������
���������������
���������������
���������������
���������������
���������������
���������������
���������������
���������������
���������������
���������������
���������������
���������������
���������������
���������������
���������������
���������������
���������������
���������������
���������������
���������������
���������������
���������������
���������������
���������������
���������������
���������������
���������������
���������������
���������������
���������������
���������������
���������������
���������������
���������������
���������������
���������������
���������������
���������������
���������������
���������������
���������������
���������������
���������������
���������������
���������������
���������������
���������������
���������������
���������������
���������������
���������������
���������������
����������������
����������������
����������������
����������������
����������������
����������������
����������������
����������������
����������������
����������������
����������������
����������������
����������������
����������������
����������������
����������������
����������������
����������������
����������������
����������������
����������������
����������������
����������������
����������������
����������������
����������������
����������������
����������������
����������������
����������������
����������������
����������������
����������������
����������������
����������������
����������������
����������������
����������������
����������������
����������������
����������������
����������������
����������������
����������������
����������������
����������������
����������������
����������������
����������������
����������������
����������������
����������������
����������������
����������������
����������������
����������������
����������������
����������������
����������������
����������������
����������������
����������������
����������������
����������������
����������������
����������������
����������������
����������������
����������������
����������������
����������������
����������������
����������������
����������������
����������������
����������������
����������������
����������������
4500-5000
�� �� �� ��4000-4500
�� �� �� �� �������������
3500-4000
�� �� �� �� �������������
3000-3500
�� �� �� �� �������������
2500-3000
�� �� �� �� �������������
2000-2500
�� �� �� �� �������������
1500-2000
�� �� �� �� ���������������
�������������
500-1000
�� �� ���������������
0-500
�� �� �� ���������������
1285 Flts
�� �� �� �� ���������������
�������������
�� �� �� ��0.80
�� �� �� �� �������������
0.81
�� �� �� �� �������������
0.91
�� �� �� �� �������������
0.18
�� �� �� �� �������������
�� �� �� �� �������������
8.69
�� �� �� �� ���������������
�������������
�� �� ���������������
�� �� �� ���������������
39500-44500
�� �� �� �� ���������������
�������������
93.39
�� �� �� ��91.42
�� �� �� �� ��������������
90.34
�� �� �� �� ��������������
90.53
�� �� �� �� ��������������
91.45
�� �� �� �� ��������������
90.10
�� �� �� �� ��������������
77.62
�� �� �� �� ����������������
��������������
34.16
�� �� ����������������
25.91
�� �� �� ����������������
29500-39500
�� �� �� �� ����������������
��������������
2.97
��� ��� ��� ���3.77
��� ��� ��� ��� ��������������
4.66
��� ��� ��� ��� ��������������
4.02
��� ��� ��� ��� ��������������
3.29
��� ��� ��� ��� ��������������
3.13
��� ��� ��� ��� ��������������
5.18
��� ��� ��� ��� �����������������
��������������
37.62
��� ��� �����������������
38.44
��� ��� ��� �����������������
19500-29500
��� ��� ��� ��� �����������������
��������������
1.87
��� ��� ��� ���2.33
��� ��� ��� ��� ��������������
2.50
��� ��� ��� ��� ��������������
2.62
��� ��� ��� ��� ��������������
2.99
��� ��� ��� ��� ��������������
4.22
��� ��� ��� ��� ��������������
5.07
��� ��� ��� ��� �����������������
��������������
17.58
��� ��� �����������������
21.49
��� ��� ��� �����������������
9500-19500
��� ��� ��� ��� �����������������
��������������
1.14
��� ��� ��� ���1.07
��� ��� ��� ��� ��������������
1.05
��� ��� ��� ��� ��������������
1.16
��� ��� ��� ��� ��������������
1.14
��� ��� ��� ��� ��������������
1.34
��� ��� ��� ��� ��������������
2.06
��� ��� ��� ��� �����������������
��������������
6.35
��� ��� �����������������
8.81
��� ��� ��� �����������������
4500-9500
��� ��� ��� ��� �����������������
��������������
0.45
��� ��� ��� ���0.48
��� ��� ��� ��� ���������������
0.50
��� ��� ��� ��� ���������������
0.59
��� ��� ��� ��� ���������������
0.74
��� ��� ��� ��� ���������������
0.90
��� ��� ��� ��� ���������������
1.02
��� ��� ��� ��� ������������������
���������������
3.53
��� ��� ������������������
4.08
��� ��� ��� ������������������
1500-4500
��� ��� ��� ��� ������������������
���������������
0.10
���� ���� ���� ����0.09
���� ���� ���� ���� ���������������
0.10
���� ���� ���� ���� ���������������
0.11
���� ���� ���� ���� ���������������
0.14
���� ���� ���� ���� ���������������
0.20
���� ���� ���� ���� ���������������
0.27
���� ���� ���� ���� �������������������
���������������
0.59
���� ���� �������������������
0.94
���� ���� ���� �������������������
500-1500
���� ���� ���� ���� �������������������
���������������
0.07
���� ���� ���� ����0.05
���� ���� ���� ���� ���������������
0.05
���� ���� ���� ���� ���������������
0.05
���� ���� ���� ���� ���������������
0.06
���� ���� ���� ���� ���������������
0.10
���� ���� ���� ���� ���������������
0.08
���� ���� ���� ���� �������������������
���������������
0.17
���� ���� �������������������
0.32
���� ���� ���� �������������������
0-500
���� ���� ���� ���� �������������������
���������������
100100
����������������
100
����������������
100
����������������
100
����������������
100
����������������
100
����������������
����������������
100
����������������
100
����������������
Total
����������������
����������������
�� �� �� �� �� �� �� �� �� �� �� �� �� �� �� �� �� �� �� �� �� �� �� �� �� �� �� �� �� �� ��
���������������������������������������������������������������������������������������������������������������������
���� ���� ���� ���� ���� ���� ���� ���� ���� ���� ���� ���� ���� ���� ���� ���� ���� ���� ���� ���� ���� ���� ���� ���� ���� ���� ���� ���� ���� ���� �������������������������������������������������������������������������������������������������������������������������
Total Flight Distance (nautical miles)
Alti
tud
e B
an
d (
fee
t)
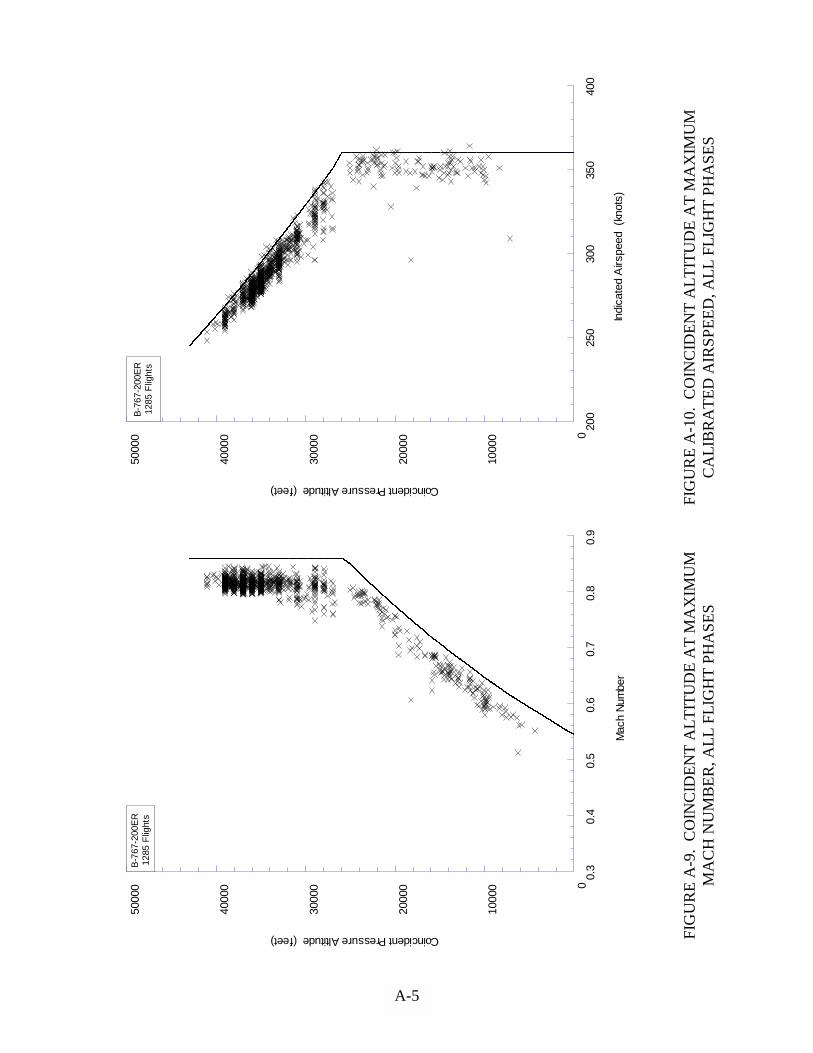
FIG
UR
E A
-9.
CO
INC
IDE
NT
AL
TIT
UD
E A
T M
AX
IMU
MM
AC
H N
UM
BE
R, A
LL
FL
IGH
T P
HA
SE
SF
IGU
RE
A-1
0. C
OIN
CID
EN
T A
LT
ITU
DE
AT
MA
XIM
UM
CA
LIB
RA
TE
D A
IRS
PE
ED
, AL
L F
LIG
HT
PH
AS
ES
A-5
��� ������������� ��������
������ ����������
����������
��������
����������
������
����
���������
����������
�����
���������
����������
��������
����������
������������
�������
��������
�����������
�������
������������
�������
�����
��������
�����������
������� ��������� ������ ������ ������ ��������� ��������� ��������� ��������� ��������� ������ ������
0
1000
0
2000
0
3000
0
4000
0
5000
0
0.3
0.4
0.5
0.6
0.7
0.8
0.9
Coincident Pressure Altitude (feet)
Mac
h N
umbe
r
�����������������������������
�����������������������������
�����������������������������
B-7
67-2
00E
R12
85 F
light
s� ��� ��� �� ��� ��� ��� �� ��� ��� �� �� �� ��� ��� �� ��
���������
���������
�������
������
������
������
������
���������
��������
��������
��������
�������
�������
�������
������
������
��������
������
������
������
������
�����
������
������
�����
�����
������
0
1000
0
2000
0
3000
0
4000
0
5000
0
200
250
300
350
400
Coincident Pressure Altitude (feet)
Indi
cate
d A
irspe
ed (
knot
s)
�����������������������������
�����������������������������
�����������������������������
B-7
67-2
00E
R12
85 F
light
s
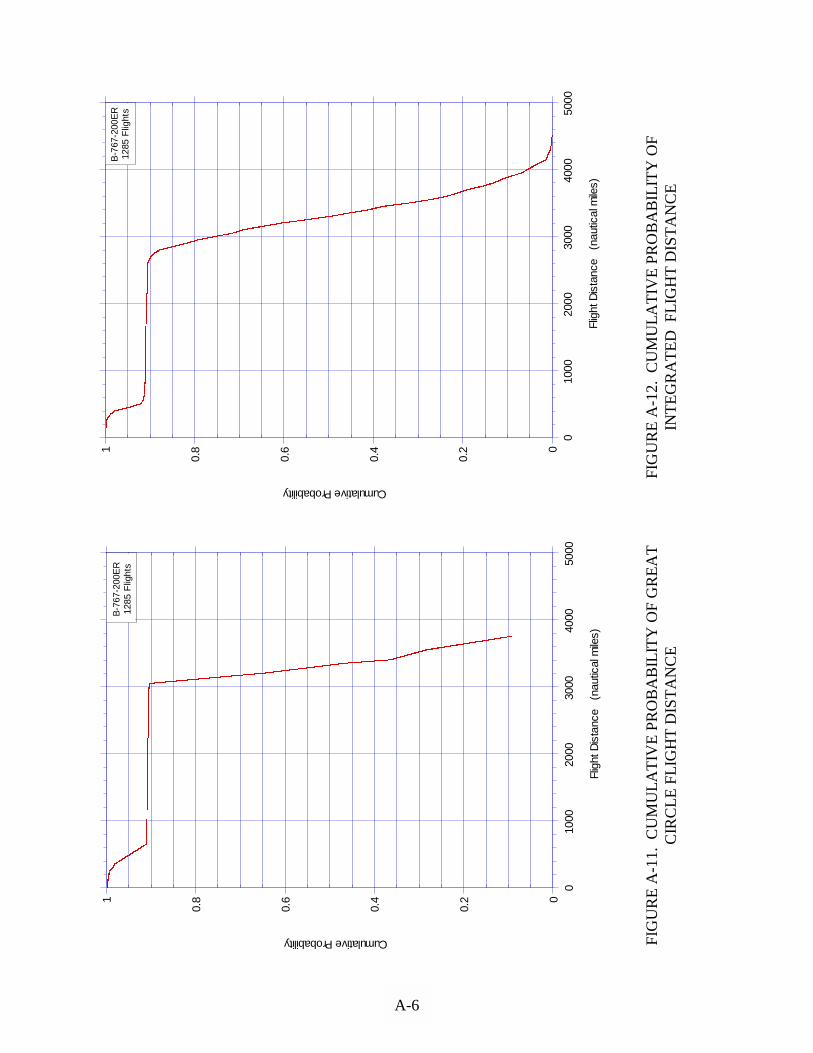
FIG
UR
E A
-11.
CU
MU
LA
TIV
E P
RO
BA
BIL
ITY
OF
GR
EA
TC
IRC
LE
FL
IGH
T D
IST
AN
CE
FIG
UR
E A
-12.
CU
MU
LA
TIV
E P
RO
BA
BIL
ITY
OF
INT
EG
RA
TE
D F
LIG
HT
DIS
TA
NC
E
A-6
����������
������������������
�������� ������
�������������������������������������������������������������������������������������������������������
������������� ��������
��������������� ���� ��������
��������
������������� ���� ��������
����������� ��� ������� ��������
����������� ��� ��� ���� ��������
��������
��������� ��� ��� ���� ��������
����� ��� ���� ���������
����� ������� ��������
������������������
����� �������������������� ����
���� ������� ����
0
0.2
0.4
0.6
0.81
010
0020
0030
0040
0050
00Cumulative Probability
����������������������������
����������������������������
����������������������������
B-7
67-2
00E
R12
85 F
light
s
Flig
ht D
ista
nce
(na
utic
al m
iles)
�����
�������������������������������
�����������
�������������������������������������������������������������������������������������������������
����
����
����
����
���������
�����
�����
����������
�����
�����
�����
�����
�������� ��� ��� ��� ���
����
�������
������� ��������
��������
��������
��������
��������
��������
��������
0
0.2
0.4
0.6
0.81
010
0020
0030
0040
0050
00
Cumulative Probability
����������������������������
����������������������������
����������������������������
B-7
67-2
00E
R12
85 F
light
s
Flig
ht D
ista
nce
(na
utic
al m
iles)

FIG
UR
E A
-13.
CU
MU
LA
TIV
E F
RE
QU
EN
CY
OF
MA
XIM
UM
SID
EL
OA
D F
AC
TO
R D
UR
ING
GR
OU
ND
TU
RN
S F
IGU
RE
A-1
4. C
UM
UL
AT
IVE
FR
EQ
UE
NC
Y O
FL
ON
GIT
UD
INA
L L
OA
D F
AC
TO
R D
UR
ING
GR
OU
ND
TA
XI
A-7
���� ���� ���� ���� �����������
�������
������������
�����
�����
�����
��� ��� ��� ���������
������
���������� ���� ����
������
������
�����������
�����
��� ������������ ����
�����������
�������� ���
�����
�����
��������� ����
������
������
������
������
������
������
������
������
��������� ��� ��� ��� ��� �������
������
�������� ��� ������� ���� ��������
��������
���������������
����� ��������� ����
�������� ����
������� ����
������������������������������
�������������������������������� ��� ���
���� ���� ��� ��� �� �������
�����
���� ���� ��� ��� �� �������
�����
�������� ������ ������� �������
��������� ������ ��
��������� ����
���� �����
����� � �� ���� �� ��� ��� ������ ���� ���� ����
������� � �� �� ���� �� ��������� ������� ���� ���� �������� ����
10-1
100
101
102
103
104
105 -0
.8-0
.6-0
.4-0
.20
0.2
0.4
0.6
0.8
�������������������������������������
�������������������������������������
�������������������������������������
�������������������������������������
�������������� Ta
xi In
������������� Ta
xi O
ut
Cumulative Occurrences per 1000 Flights
Long
itudi
nal L
oad
Fact
or, n
x (g)
�����������������������������
�����������������������������
�����������������������������
B-7
67-2
00E
R12
85 F
light
s
����� �������� ���
�����
��������� ���
�����
���� ������������
���� ��� �� ������
���� ���������
�����������������
������������ �������
�������� ���
������
���������� ����
������
������
�����������
�������� ��� ���
�����
�����
��������� ���� ����
������
������
�����������
�����
�������
����������� ���� ����
�������� ������� ��������
��������������� �� ��� ���
�����
������ ��� ������
����������� �� ����� ���
������ ���� ��� ��� ���
�� �� ���
�������������������
�������� ��������
�����
������
����������
����������
��������� ��� ������
�������������
������
����������
����
����������
������
������ ��� ������
�������
�����
����� ��� ��� ��� ���
10-1
100
101
102
103
104
-0.4
-0.3
-0.2
-0.1
00.
10.
20.
30.
4
������������������������������������
������������������������������������
������������������������������������
������������������������������������
���������� Ta
xi O
ut
����������������� Ta
xi In
Cumulative Occurrences per 1000 Flights
Sid
e Lo
ad F
acto
r, n
y (g)
���������������������������
���������������������������
���������������������������
B-7
67-2
00E
R11
96 F
light
s
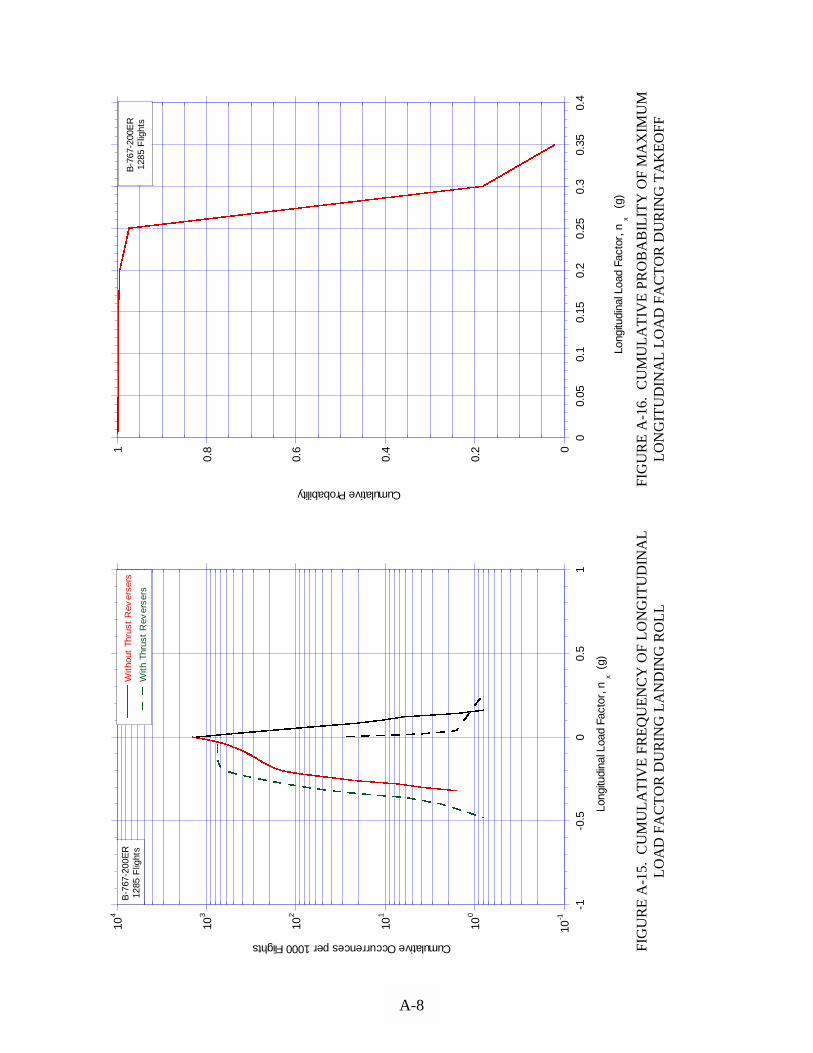
FIG
UR
E A
-15.
CU
MU
LA
TIV
E F
RE
QU
EN
CY
OF
LO
NG
ITU
DIN
AL
LO
AD
FA
CT
OR
DU
RIN
G L
AN
DIN
G R
OL
LF
IGU
RE
A-1
6. C
UM
UL
AT
IVE
PR
OB
AB
ILIT
Y O
F M
AX
IMU
ML
ON
GIT
UD
INA
L L
OA
D F
AC
TO
R D
UR
ING
TA
KE
OF
F
A-8
��������������������������������������������������������������������������������������������
����������������������������������������
��������������������
��������������������
��������������������
��������������������
��������������������
��������������������
��������������������
��������������������
��������������������
��������������������
��������������������
��������������������
��������������������
��������������������
��������������������
��������������������
��������������������
��������������������
��������������������
��������������������
��������������������
��������������������
�������������������� ��������������������
��������������������
��������������������
��������������������
��������������������
��������������������
0
0.2
0.4
0.6
0.81
00.
050.
10.
150.
20.
250.
30.
350.
4
Cumulative Probability
Long
itudi
nal L
oad
Fact
or, n
x (g
)�������������������������������������
�������������������������������������
�������������������������������������
B-7
67-2
00E
R12
85 F
light
s
���� ������� ���������
�������������� ���
�����������
�����
��� ��������������
�������� ���
������
������
�����������
�����
�������� ��� ��� ���
������
�����������
�����
�����
������
������
������
��������� ��� �������
������
�����
�����������
������
������
��������� ��� ���� ���� ��������
��������
������
������ ��� ��� ���
������������������������� ���
�����
��������� ������� ����� ��
�����
�����
�����
��������� ������� ������ ����� �� �� ��
�����
����������
��������� ��������� ��
�����
�������� ���
�����
�����
����������
����� � �� ��� �� �� ����� ����������
��������������
��������
10-1
100
101
102
103
104
-1-0
.50
0.5
1
��������������������������������������������������������������
��������������������������������������������������������������
��������������������������������������������������������������
�����������������
With
out
Thru
st R
ever
sers
���������� W
ith T
hrus
t R
ever
sers
Cumulative Occurrences per 1000 Flights
Long
itudi
nal L
oad
Fact
or, n
x (g)
����������������������������
����������������������������
����������������������������
B-7
67-2
00E
R12
85 F
light
s

FIG
UR
E A
-17.
CU
MU
LA
TIV
E P
RO
BA
BIL
ITY
OF
MIN
IMU
ML
ON
GIT
UD
INA
L L
OA
D F
AC
TO
R D
UR
ING
LA
ND
ING
FIG
UR
E A
-18.
CU
MU
LA
TIV
E F
RE
QU
EN
CY
OF
IN
CR
EM
EN
TA
LV
ER
TIC
AL
LO
AD
FA
CT
OR
DU
RIN
G T
AX
I O
PE
RA
TIO
NS
A-9
������������������������������
�����������������
�����������������
�����������������
���������������
���������������
���������������
���������������
���������������
���������������
���������������
���������������
���������������
���������������
��������������
��������������
��������������
��������������
��������������
��������������
��������������
��������������
��������������
��������������
��������������
��������������
��������������
��������������
�����������������
�����������������
�����������������
�����������������
�����������������
�����������������
�����������������
����������������
����������������
�������������������������������
0
0.2
0.4
0.6
0.81 -0
.5-0
.4-0
.3-0
.2-0
.10
Cumulative Probability
Long
itudi
nal L
oad
Fact
or, n
x (g
)
�����������������������������
�����������������������������
�����������������������������
B-7
67-2
00E
R12
82 F
light
s
�����������
�����������
�����������
�����������
�����������
�����������
�����������
�����������
�����������
�����������
�����������
�����������
�����������
�����������
���������������
��������
������
������
������
������
������
������
������
����������
����������
����������
����������
����������
����������
����������
����������
����������
����������
����������
����������
����������
����������
����������
��������
��������
��������
��������
��������
��������
��������
��������
�����
�����
�����
������� ������������������������
���������������������������������������
������� �� ��� ��
�� ���� �������
�����
�����
�����������������������
�����
��������������������������
�����
10-1
100
101
102
103
104
105
-1-0
.50
0.5
1
���������������������������������������
���������������������������������������
���������������������������������������
���������������������������������������
���������������
Taxi
In
������������
Taxi
Out
Cumulative Occurrences per 1000 Flights
Incr
emen
tal V
ertic
al L
oad
Fact
or,
∆nz
(g)
������������������������������
������������������������������
������������������������������
B-7
67-2
00E
R12
23 F
light
s

FIG
UR
E A
-19.
CU
MU
LA
TIV
E F
RE
QU
EN
CY
OF
IN
CR
EM
EN
TA
LV
ER
TIC
AL
LO
AD
FA
CT
OR
DU
RIN
G T
AK
EO
FF
RO
LL
FIG
UR
E A
-20.
CU
MU
LA
TIV
E F
RE
QU
EN
CY
OF
IN
CR
EM
EN
TA
LV
ER
TIC
AL
LO
AD
FA
CT
OR
DU
RIN
G L
AN
DIN
G R
OL
L
A-10
��������
��������
��������
��������
������������
������
����������
����������
����������
����������
��������������
�����
���������
���������
���������
���������
��������
��������
��������
�����������
�����������
�����������
�����������
�����������
�����������
�����������
��������
��������
��������
��������
��������
����������
����������
����������
����������
�����������
�����������
�����������
���������
���������
���������
���������
������
������
������
��� ������� �������� ���������
������� ����� ������ ������� ��������
�������� ������������
���� �������� ������� ������ ����� ���� �������
�����
�����
�����
���� �������� ������� ������ ����� ���� �������
�����
���� ������� ���
10-1
100
101
102
103
104
105
-1-0
.50
0.5
1
���������������������������������������������������������������������
���������������������������������������������������������������������
���������������������������������������������������������������������
������������� W
ithou
t Thr
ust R
ever
ser
������������ W
ith T
hrus
t Rev
erse
r
Cumulative Occurrences per 1000 Flights
Incr
emen
tal V
ertic
al L
oad
Fact
or,
∆nz
(g)
����������������������������
����������������������������
����������������������������
B-7
67-2
00E
R12
23 F
light
s
����������
����������
����������
����������
����������
����������
����������
����������
����������
����������
��������������
������������
��������
��������
��������
��������
������������
������������
��������
��������
��������
�����������
�����������
�����������
�����������
�����������
�����������
�����������
�����������
�����������
�����������
�����������
��������
��������
��������
��������
��������
��������
��������
��������
������
������
������
������
10-1
100
101
102
103
104
105
-1-0
.50
0.5
1
Cumulative Occurrences per 1000 Flights
Incr
emen
tal V
ertic
al L
oad
Fact
or,
∆nz
(g)���
�������������������������
����������������������������
����������������������������
B-7
67-2
00E
R12
23 F
light
s

FIG
UR
E A
-21.
CU
MU
LA
TIV
E P
RO
BA
BIL
ITY
OF
MIN
IMU
M A
ND
MA
XIM
UM
IN
CR
EM
EN
TA
L V
ER
TIC
AL
LO
AD
FA
CT
OR
AT
TO
UC
HD
OW
N A
ND
SP
OIL
ER
DE
PL
OY
ME
NT
FIG
UR
E A
-22.
CO
INC
IDE
NT
VE
RT
ICA
L L
OA
D F
AC
TO
R A
ND
TO
UC
HD
OW
N G
RO
SS
WE
IGH
T
A-11
��������
������������ ���
������ ���
�� ����
������ ��� ���
�� ���� �������
���������
������������ �����
����������
������� ����� ������
������� ��� ���������
���������
���������
������� ��
���������
�������������������� ���
�����
������������� ����������� �������� ����� �
����������
������������� ����������� ��������� ���������� ����� �
����������
������� ��������� ���� ���� ������
����������
�������� ����
�������������
������
���������
�������
�����
���������
����
����
����
����
������������
��������
��������
���������������
�������
�������
�������������
������
������
������
������
������
������
������������ ���
��������� ������� ����� �� �
�����
�����
������������ ������� ������ ����� ��������
�����������
�����
10-4
10-3
10-2
10-1
100
-1-0
.50
0.5
1
�����������������������������������������������������������������������������������������������������������������������������������
�����������������������������������������������������������������������������������������������������������������������������������
�����������������������������������������������������������������������������������������������������������������������������������
�����������������������������������������������������������������������������������������������������������������������������������
�����������������������������������������������������������������������������������������������������������������������������������
����������
Max
imum
Loa
d Fa
ctor
at S
poile
r D
eplo
ymen
t
����������������������� M
inim
um (
Reb
ound
) Lo
ad F
acto
r at
Spo
iler
Dep
loym
ent
����������������� M
axim
um L
oad
Fact
or a
t Tou
chdo
wn
�������������
Min
imum
(R
ebou
nd)
Load
Fac
tor
at T
ouch
dow
n
Cumulative Probability
Incr
emen
tal V
ertic
al L
oad
Fact
or,
∆nz
(g)���
�������������������������
����������������������������
����������������������������
B-7
67-2
00E
R12
23 F
light
s
0
0.51
1.52 15
0000
2000
0025
0000
3000
0035
0000
Incremental Vertical Load Factor, ∆nz (g)
Touc
hdow
n G
ross
Wei
ght
(lb
)
���������������������������������
���������������������������������
���������������������������������
B-7
67-2
00E
R12
23 F
light
s

FIG
UR
E A
-23.
CU
MU
LA
TIV
E P
RO
BA
BIL
ITY
OF
GR
OU
ND
SP
EE
D D
UR
ING
TA
XI
FIG
UR
E A
-24.
CU
MU
LA
TIV
E P
RO
BA
BIL
ITY
OF
AIR
SP
EE
DA
T L
IFT
OF
F A
ND
TO
UC
HD
OW
N
A-12
����������������������������������������������
�����������������
���������
�������������������
����������
����������
����������
���������������� ����
��������
������
������
������
������
������������� ����
����������
�������
�������
����������������������� ����
� ��� ���������� �� ��� ����
� ��� ��� ���� ����� ���� ���� ����
��� ����� �����������
�������� ��� ����
��������� �������
������ ��� �������
������
10-4
10-3
10-2
10-1
100
6080
100
120
140
160
180
200
��������������������������������������������
��������������������������������������������
��������������������������������������������
����������������� Li
ftof
f
�����������
Touc
hdow
n
Cumulative Probability
Cal
ibra
ted
Airs
peed
(k
nots
)
����������������������������
����������������������������
����������������������������
B-7
67-2
00E
R12
85 F
light
s
���������������������������������
�������������������������������
��������������
�����������������������������
���������������
���������������
��������������������������������
�����������������
�����������������
�����������������
�����������������������������������
������������������
������������������
������������������
������������������
������������������
������������������
���������������������
������������
���������������
��������������� ����������������
����������������
����������������
���������������� ��������
����� ���������
����������� ��������
�������� ������ ��������
��������� �������������� ��������
�� ������ ������� ���������� ��� ������� ������� �������� ���� ����
�������� ������ ���� ����
� �� ��
10-4
10-3
10-2
10-1
100
020
4060
8010
0
������������������������������������
������������������������������������
������������������������������������
����������������� Ta
xi In
���������� Ta
xi O
ut
Cumulative Probability
Gro
und
Spe
ed
(kno
ts)
�����������������������������
�����������������������������
�����������������������������
B-7
67-2
00E
R12
85 F
light
s
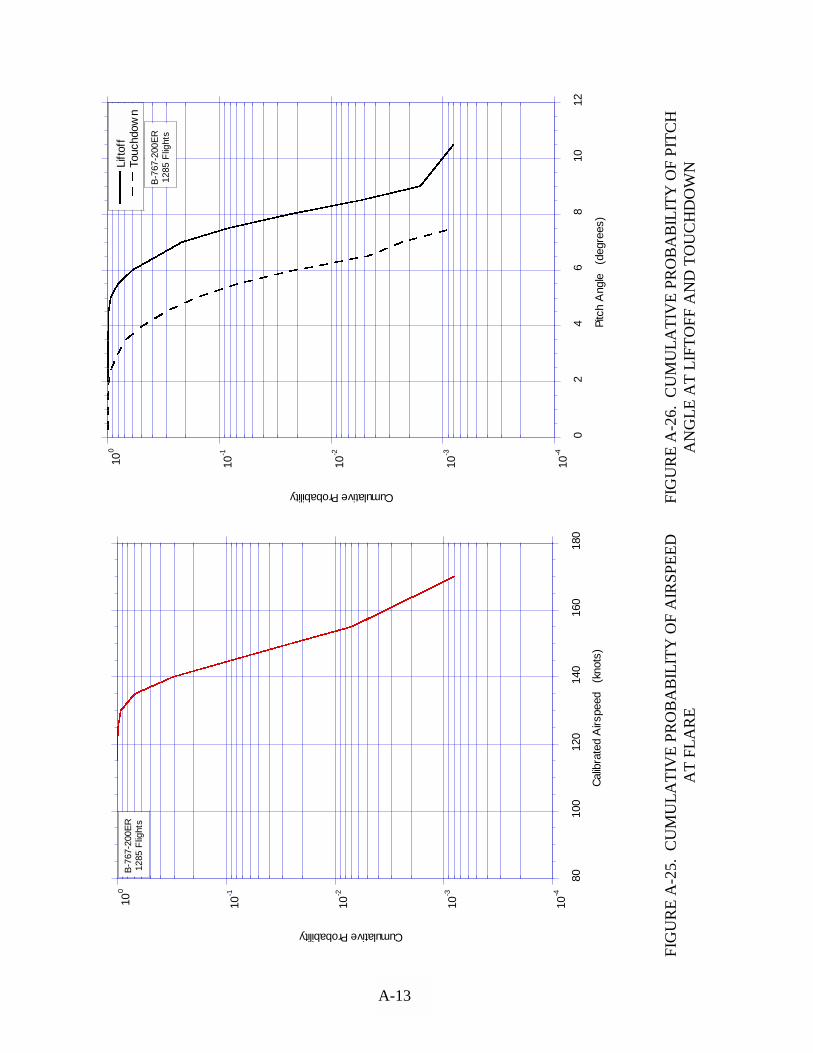
FIG
UR
E A
-25.
CU
MU
LA
TIV
E P
RO
BA
BIL
ITY
OF
AIR
SP
EE
DA
T F
LA
RE
FIG
UR
E A
-26.
CU
MU
LA
TIV
E P
RO
BA
BIL
ITY
OF
PIT
CH
AN
GL
E A
T L
IFT
OF
F A
ND
TO
UC
HD
OW
N
A-13
������������������������������������������������������������������ ����
������������
���������
�������������������
������������������
��������
��������
�����������������
���������
���������
���������
���������������� ����
����������
�������
�������
���������������
��������
��������
��������
�������� ���������������������
���������������������
���������������������
�������������������������������������������������������� ����
��� ��������� ����
�� ����� ����
������ ����������
��������� �������
�������� ����� �����������
�������� ����� ������� ��������
������
������
������ ���� ����
�� ������ ���� �����
�������� ���
10-4
10-3
10-2
10-1
100
02
46
810
12
��������������������������������������������
��������������������������������������������
��������������������������������������������
�������������� Li
ftof
f
������������� To
uchd
own
Cumulative Probability
Pitc
h A
ngle
(d
egre
es)
�����������������������������
�����������������������������
�����������������������������
B-7
67-2
00E
R12
85 F
light
s
��������������������������������������
�����������������
��������
��������
�������������������
�����������
�����������
�����������
��������������������
���������
���������
�����������������
��������
��������
��������
�������������������������������
�����������������������
�����������������������
�����������������������
�����������������������
�����������������������
�����������������������
�����������������������
10-4
10-3
10-2
10-1
100
8010
012
014
016
018
0
Cumulative Probability
Cal
ibra
ted
Airs
peed
(k
nots
)
���������������������������
���������������������������
���������������������������
B-7
67-2
00E
R12
85 F
light
s
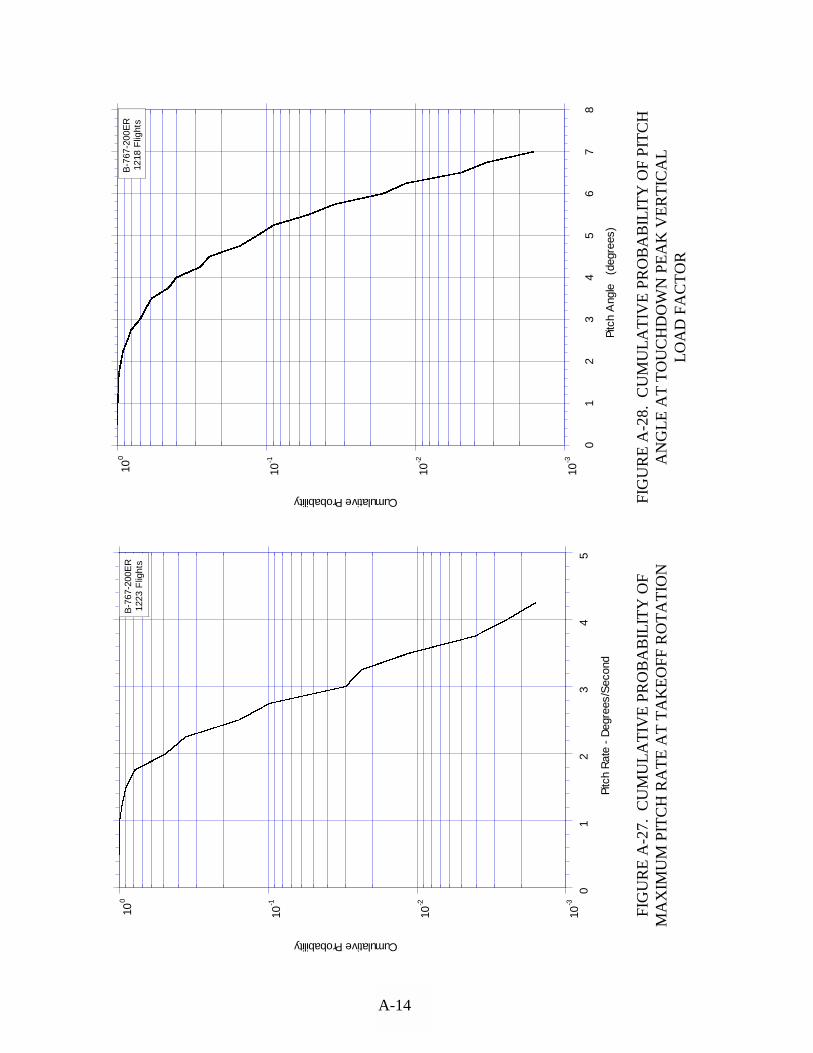
FIG
UR
E A
-27.
CU
MU
LA
TIV
E P
RO
BA
BIL
ITY
OF
MA
XIM
UM
PIT
CH
RA
TE
AT
TA
KE
OF
F R
OT
AT
ION
FIG
UR
E A
-28.
CU
MU
LA
TIV
E P
RO
BA
BIL
ITY
OF
PIT
CH
AN
GL
E A
T T
OU
CH
DO
WN
PE
AK
VE
RT
ICA
LL
OA
D F
AC
TO
R
A-14
����������������������������������������������������
������������
����������������������������
��������������������������������
��������
������������
�����
������������������
���������
���������������������������
���������
������������������
������������������
������������������
���������
���������
�������������� ����
������
�����
�����
�����
���������
������
����������� ����
��������
������
������ ������ ����
�������� ����
��������
������
10-3
10-2
10-1
100
01
23
45
67
8
Cumulative Probability
Pitc
h A
ngle
(d
egre
es)
������������������������������
������������������������������
������������������������������
B-7
67-2
00E
R12
18 F
light
s
���������������������������
��������������
�����
������������������������������
����������
������������������
��������
�������������������
�����������
�����������
���������������������
����������
������������������
��������
��������
��������
��������
�������������������
��������������������
���������
���������
��������� ��������
��������
��������
��������
��������
�����������
�������
����������
����������
���������� ���������
���������
10-3
10-2
10-1
100
01
23
45
Cumulative Probability
Pitc
h R
ate
- D
egre
es/S
econ
d����������������������������
����������������������������
����������������������������
B-7
67-2
00E
R12
23 F
light
s

FIG
UR
E A
-29.
CU
MU
LA
TIV
E O
CC
UR
RE
NC
ES
OF
INC
RE
ME
NT
AL
VE
RT
ICA
L G
US
T L
OA
D F
AC
TO
RP
ER
100
0 H
OU
RS
BY
FL
IGH
T P
HA
SE
FIG
UR
E A
-30.
CU
MU
LA
TIV
E O
CC
UR
RE
NC
ES
OF
INC
RE
ME
NT
AL
VE
RT
ICA
L G
US
T L
OA
D F
AC
TO
RP
ER
100
0 H
OU
RS
, CO
MB
INE
D F
LIG
HT
PH
AS
ES
A-15
��������
��������
��������
��������
���������
���������
���������
���������
���������
���������
���������
����������
����������
����������
����������
����������
��������
��������
��������
��������
��������
��������
��������
��������
��������
��������
��������
���������
���������
���������
���������
���������
���������
����������
����������
����������
����������
��������
��������
��������
��������
���������
���������
���������
��������
��������
��������
��������
��������
��������
��������
��������
��������
���������
���������
���������
���������
���������
���������
���������
���������
����������
����������
����������
����������
��������
��������
��������
��������
���������
���������
���������
��������
��������
��������
��������
��������
��������
���������
���������
���������
���������
���������
���������
����������
����������
����������
����������
����������
��������
��������
��������
��������
��������
��������
��������
��������
��������
��������
���������
���������
���������
���������
���������
����������
����������
����������
����������
����������
��������
��������
��������
��������
��������
��������
���������
���������
���������
�����
�����
��� ���
������
���
������
�����
���� ���
���
������������������������������������������������������������
������������������������������������������������������������
������������������������������������������������������������
������������������������������������������������������������
������������������������������������������������������������
��������������� D
epar
ture
;
29
Hou
rs
��������������� C
limb;
4
44 H
ours
��������������� C
ruis
e;
7636
Hou
rs
��������������� D
esce
nt;
45
3 H
ours
���������������
������
App
roac
h;
143
Hou
rs
10-1
100
101
102
103
104
105
106
107
-1-0
.50
0.5
1
Incr
emen
tal L
oad
Fact
or,
∆nz (
g)
Cumulative Occurrences per 1000 Hours
�������������������������������
�������������������������������
�������������������������������
B-7
67-2
00E
R12
23 F
light
s
��������
��������
��������
��������
��������
��������
��������
��������
���������
���������
���������
���������
���������
���������
���������
����������
����������
����������
����������
����������
��������
��������
��������
��������
���������
���������
���������
������
������
������
������
������
���������������
���������
���������
���������
���������
��������������������
�����������
�����������
�����������
���������������
������
����������
����������
���������� ��������
��������
�������� �����������
�����������
10-1
100
101
102
103
104
105
106
107
-1-0
.50
0.5
1
Incr
emen
tal L
oad
Fact
or,
∆nz (
g)
Cumulative Occurrences per 1000 Hours
�����������������������������
�����������������������������
�����������������������������
B-7
67-2
00E
R12
23 F
light
s

FIG
UR
E A
-31.
CU
MU
LA
TIV
E O
CC
UR
RE
NC
ES
OF
INC
RE
ME
NT
AL
VE
RT
ICA
L G
US
T L
OA
D F
AC
TO
RP
ER
NA
UT
ICA
L M
ILE
BY
FL
IGH
T P
HA
SE
FIG
UR
E A
-32.
CU
MU
LA
TIV
E O
CC
UR
RE
NC
ES
OF
INC
RE
ME
NT
AL
VE
RT
ICA
L G
US
T L
OA
D F
AC
TO
R P
ER
NA
UT
ICA
L M
ILE
, CO
MB
INE
D F
LIG
HT
PH
AS
ES
A-16
�����
�����
�����
�����
�����
�����
�����
�����
�����
�����
����������
����������
����������
����������
����������
����������
����������
�����������
�����������
�����������
�����������
�����������
���������
���������
���������
���������
���������
����������
����������
����������
�������
�������
�������
�������
�����������������
����������
����������
����������
����������
����������
����������
������������������
��������
��������
��������
�������� �����������
�����������
�����������
����������� ���������
���������
�����������������
��������
10-6
10-5
10-4
10-3
10-2
10-1
100
101
-1-0
.50
0.5
1
Incr
emen
tal L
oad
Fact
or,
∆nz
(g)
Cumulative Occurrences per Nautical Mile
����������������������������������
����������������������������������
����������������������������������
B-7
67-2
00E
R12
23 F
light
s
������
���
���� ����
���
����
����� ����
������
�����
�����
����
����������������������������������������������������������
����������������������������������������������������������
����������������������������������������������������������
����������������������������������������������������������
����������������������������������������������������������
����������������������������������������������������������
Dep
artu
re;
55
75 N
M
Clim
b;
1824
18 N
M
Cru
ise;
341
6405
NM
Des
cent
; 1
6920
3 N
M
���
App
roac
h;
252
59 N
M
10-6
10-5
10-4
10-3
10-2
10-1
100
101
-1-0
.50
0.5
1
Incr
emen
tal L
oad
Fact
or,
∆nz
(g)
Cumulative Occurrences per Nautical Mile
��������������������������������
��������������������������������
��������������������������������
B-7
67-2
00E
R12
23 F
light
s

FIG
UR
E A
-33.
CU
MU
LA
TIV
E O
CC
UR
RE
NC
ES
OF
DE
RIV
ED
GU
ST
VE
LO
CIT
Y P
ER
NA
UT
ICA
L M
ILE
, < 5
00 F
EE
T
A-17
���������� ��������
� ����� ����
������ ��������
� ������� ��������
�� ������ ����
��� ���������� ����
�� ������ ��������
��������
����������� ������� ����
����� ���
��������� ���
��� ������
��������
��������
������������������
������������������
������������������
������������������
�����������������
����������������
����������������
����������������
����������������
��������������������
�����������
�������������������
������������������
���������� �������������������������������
�������������������������������
�������������������������������
�������������������������������
�������������������������������
������������������������������� ���������
��������� �������
����������������
���������
������������
��������
�����������
��������������
�������
��������������������������������������������������
��������������������������������������������������
��������������������������������������������������
����������
B-7
67-2
00ER
����������������� N
AC
A T
N-4
332
10-6
10-5
10-4
10-3
10-2
10-1
100
101
010
2030
40
Der
ived
Gus
t Vel
ocity
, Ude
(F
t/Sec
)
Cumulative Occurrences per Nautical Mile
����������������������������
����������������������������
����������������������������
����������������������������
1223
flig
hts
14.0
67 h
ours
2083
.15
nm
Dow
nwar
d G
usts
�������� ���
�������� ���
��� �������� ���
���� ����
���������
��������� ����
��� ������������� ����
������������� ����
������� ����
����� ��������
������
���������� ����
� ����� ���������
�������� ���
����� ����
���
���������
���������
��������������������
��������������������
��������������������
�������������������
������������������
������������������
������������������
������������������
�����������������
���������������� ����
�������������������
���������������� ����
��� ��������������������������������
��������������������������������
��������������������������������
��������������������������������
��������������������������������
�������������������������������� ����������
���������� ��������
������������������
����������
��������������
����������
�����������
��������
���������������������������������������������������
���������������������������������������������������
���������������������������������������������������
������������ B
-767
-200
ER
������������� N
AC
A T
N-4
332
10-6
10-5
10-4
10-3
10-2
10-1
100
101
010
2030
40
Der
ived
Gus
t Vel
ocity
, Ude
(F
t/Sec
)
Cumulative Occurrences per Nautical Mile
���������������������������������
���������������������������������
���������������������������������
���������������������������������
1223
flig
hts
14.0
67 h
ours
2083
.15
nm
Upw
ard
Gus
ts

FIG
UR
E A
-34.
CU
MU
LA
TIV
E O
CC
UR
RE
NC
ES
OF
DE
RIV
ED
GU
ST
VE
LO
CIT
Y P
ER
NA
UT
ICA
L M
ILE
, 500
-1,5
00 F
EE
T
A-18
������� �����
� ���������� ���
� ���� ����� ����
� ��������� ����
���������
�������������� ���
��� ��� �������� ����
���� ���������
����� ����� ����
���� ���
���������
����������������
����������������
���������
��������������������
��������������������
���������
������������
�������
����������
������������������
������������������
����������
������������������
������������������
������������������
��������
�������� ���������
���������������� ����
��������������
�����
���������
���������������� ����
��� ���������
��������������������
�����������
���������������
������������
������������������
���������� ��������
������������������
������������������������
������
���������������������������������������������������
���������������������������������������������������
���������������������������������������������������
������������ B
-767
-200
ER
�������������� N
AC
A T
N-4
332
10-6
10-5
10-4
10-3
10-2
10-1
100
101
010
2030
40
Der
ived
Gus
t Vel
ocity
, Ude
(F
t/Sec
)
Cumulative Occurrences per Nautical Mile
���������������������������������
���������������������������������
���������������������������������
���������������������������������
1223
flig
hts
29.9
5 ho
urs
4598
.74
nm
Upw
ard
Gus
ts
������������
������������
�����������
���������������
����������
����������
��������������
����������
����������� ����
�� ���������
��������������� ��������
��������
������ ��������
����
�����
�����������
�������������
������� ���������������
�������������������������������
��������
������������������
������������������
��������
������������������
�����������������
�������
�����������
�����
���������
����������������
����������������
���������
����������������
����������������
�������������������
����������
���������� ��������
������������������
����������
�������������
�����
��������
������������������
���������� ��������
������������������
����������
�������������
����
�������
����������������
��������� �������
����������������
�������������������������
�����
��������������������������������������������������
��������������������������������������������������
��������������������������������������������������
����������
B-7
67-2
00ER
����������������� N
AC
A T
N-4
332
10-6
10-5
10-4
10-3
10-2
10-1
100
101
010
2030
40
Der
ived
Gus
t Vel
ocity
, Ude
(F
t/Sec
)
Cumulative Occurrences per Nautical Mile
��������������������������������
��������������������������������
��������������������������������
��������������������������������
1223
flig
hts
29.9
5 ho
urs
4598
.74
nm
Dow
nwar
d G
usts

FIG
UR
E A
-35.
CU
MU
LA
TIV
E O
CC
UR
RE
NC
ES
OF
DE
RIV
ED
GU
ST
VE
LO
CIT
Y P
ER
NA
UT
ICA
L M
ILE
, 1,5
00-4
,500
FE
ET
A-19
�����������
��������� ������
���������������
�����������
���������
������������ ������� ����
������ �������� ����
��������
���������������
��������������
������������ ����������
�������� ������ ����
��� ����� �������
������������
������������ ���
���������
���������
��������������������
��������������������
���������
�������������������
����������
�������������
�����
��������
������������������
������������������
��������
������������������
������������������
��������
�����������������
��������� ������� ����
��������������
�����
���������
��������� ������� ����
������������
��������������������
����������� ��������
������������������
���������� ��������
��������������������������
������������������
���������� ������� ����
���������
������
���������������������������������������������������
���������������������������������������������������
���������������������������������������������������
������������ B
-767
-200
ER
�������������
������������� N
AC
A T
N-4
332
10-6
10-5
10-4
10-3
10-2
10-1
100
101
010
2030
40
Der
ived
Gus
t Vel
ocity
, Ude
(F
t/Sec
)
Cumulative Occurrences per Nautical Mile
���������������������������������
���������������������������������
���������������������������������
���������������������������������
1223
flig
hts
120.
61 h
ours
2354
7.68
nm
Upw
ard
Gus
ts
������������
�������������
���������� ����
��� ���������
�������������� ����������
�� ������ ����
��� �������
��������
������ ���������
�������������
��������� �������
���������
��������������������� ���
��������
������ ����
���������
���������
����������������
����������������
���������
��������������������
�����������
���������������
������������
������������������
������������������
��������
������������������
������������������
��������
������������������
���������� �������
�������
�����������
�����
���������
��������� �������
����������������
����������������
������� ���������
��������������������
����������� ��������
��������������������������
������������������
���������� ��������
�����������
���������
���������������������������������������������������
���������������������������������������������������
���������������������������������������������������
������������ B
-767
-200
ER
��������������
�������������� N
AC
A T
N-4
332
10-6
10-5
10-4
10-3
10-2
10-1
100
101
010
2030
40
Der
ived
Gus
t Vel
ocity
, Ude
(F
t/Sec
)
Cumulative Occurrences per Nautical Mile
���������������������������������
���������������������������������
���������������������������������
���������������������������������
1223
flig
hts
120.
61 h
ours
2354
7.69
nm
Dow
nwar
d G
usts

FIG
UR
E A
-36.
CU
MU
LA
TIV
E O
CC
UR
RE
NC
ES
OF
DE
RIV
ED
GU
ST
VE
LO
CIT
Y P
ER
NA
UT
ICA
L M
ILE
, 4,5
00-9
,500
FE
ET
A-20
���� ����������
��������� ������ �������
���������� ������ ����
��� ��������
������������ ����
��� ����������
���������������� ���
��� ����������
����� �������
������ �������� ����
��������
����������
����� �������
����� ���
����
���������
���������
�������������
����������
����������������
���������
��������������������
�������������������
��������
������������������
������������������
��������
������������������
���������� ��������
������������������
����������
��������������
����������
�����������
�����
����������������
����������������
��������������������
������������������������������
���������� ��������
������������������
�������������
�����
������������������
���������� ��������
��������������
���������������������������������������������������
���������������������������������������������������
���������������������������������������������������
������������ B
-767
-200
ER
�������������� N
AC
A T
N-4
332
10-6
10-5
10-4
10-3
10-2
10-1
100
101
010
2030
40
Der
ived
Gus
t Vel
ocity
, Ude
(F
t/Sec
)
Cumulative Occurrences per Nautical Mile
���������������������������������
���������������������������������
���������������������������������
���������������������������������
���������������������������������
1223
flig
hts
180.
00 h
ours
4600
3.73
nm
Dow
nwar
d G
usts
�������
������������
�������� ������ ������
���������� ������
������
������������
����������
�����������
��������� ����
������� ��������
���������� ����
�������� ����
���������
������ ����� ����
�� ����� ���
���������
���������
������������
��������
�����������
�������������������
��������
������������������
������������������
��������
������������������
������������������
��������
������������������
���������� ������� ����
������������
���������
�������������
����������
�����������
�����
��������������������
��������������������
�������������������
����������������������������
���������� ��������
������������������
��������������
�������������������
��������� ������� ����
���������
���������������������������������������������������
���������������������������������������������������
���������������������������������������������������
������������ B
-767
-200
ER
����������������� N
AC
A T
N-4
332
10-6
10-5
10-4
10-3
10-2
10-1
100
101
010
2030
40
Der
ived
Gus
t Vel
ocity
, Ude
(F
t/Sec
)
Cumulative Occurrences per Nautical Mile
���������������������������������
���������������������������������
���������������������������������
���������������������������������
���������������������������������
1223
flig
hts
180.
00 h
ours
4600
3.73
nm
Upw
ard
Gus
ts

FIG
UR
E A
-37.
CU
MU
LA
TIV
E O
CC
UR
RE
NC
ES
OF
DE
RIV
ED
GU
ST
VE
LO
CIT
Y P
ER
NA
UT
ICA
L M
ILE
, 9,5
00-1
9,50
0 F
EE
T
A-21
������� ������ ��������
�������� ����� ���������� ��������
����������� ��������
�������������
���������� �������
��� �����������
����� ������� ����
������ ������������ ����
������� ������������� ����
�������������
�����������
������ ������
����������������
���������
���������
��������������������
�������������������
��������
������������������
����������
������������������
��������
������������
������
����������
������������������
��������
�������� ����������
�����������������
������� ���������
����������������
����������������
��������������������
���������������
�����
�������������������
���������� ��������
��������������������������
������������������
���������� ����������������
����������������
�������������
���������������������������������������������������
���������������������������������������������������
���������������������������������������������������
������������ B
-767
-200
ER
����������������� N
AC
A T
N-4
332
10-6
10-5
10-4
10-3
10-2
10-1
100
101
010
2030
40
Der
ived
Gus
t Vel
ocity
, Ude
(F
t/Sec
)
Cumulative Occurrences per Nautical Mile
���������������������������������
���������������������������������
���������������������������������
���������������������������������
���������������������������������
1223
flig
hts
308.
30 h
ours
1084
84.6
9 nm
Dow
nwar
d G
usts
�� ����� �������
����
����
������ ����� ���������
����������� �����
�����������
��������� ������
��������������
����� ��������
����������� ����
�������� �� ��������
����������������� ���
���������������������
������������������ ����
�� ������������� ����
�������������
�����
���������
���������
��������������������
��������������������
���������
�������������������
����������
������������������
��������
�����������
�������
����������
������������������
��������
�������� ����������
������������������
�������� ���������
���������������� ����
������������
��������� ������� ����
������������
��������������������
����������� ��������
��������������������������
������������������
���������� ������������������
����������������� ����
���������
���������������������������������������������������
���������������������������������������������������
���������������������������������������������������
������������ B
-767
-200
ER
������������� N
AC
A T
N-4
332
10-6
10-5
10-4
10-3
10-2
10-1
100
101
010
2030
40
Der
ived
Gus
t Vel
ocity
, Ude
(F
t/Sec
)
Cumulative Occurrences per Nautical Mile
���������������������������������
���������������������������������
���������������������������������
���������������������������������
���������������������������������
1223
flig
hts
308.
30 h
ours
1084
84.6
9 nm
Upw
ard
Gus
ts

FIG
UR
E A
-38.
CU
MU
LA
TIV
E O
CC
UR
RE
NC
ES
OF
DE
RIV
ED
GU
ST
VE
LO
CIT
Y P
ER
NA
UT
ICA
L M
ILE
, 19,
500-
29,5
00 F
EE
T
A-22
�����
������������ ����� ������
��������������
������� ����� ������
���������� ����� ��� ���
������
������������
����������
���� ���� ����
������� �������������� ����
���� ����������
������ ��������� ����
������� ����
�����
�����
���������
���������
��������������������
�����������
�������������������
��������
������������������
����������
������������������
��������
������������������
����������
���������� ��������
��������
�������� ����������
����������������� ����
��������������
�����
���������
��������� �������
������� ��������������������
��������������������
�������������������
���������� ������������������
������������������
�������������������������
������� �����
���������������������������������������������������
���������������������������������������������������
���������������������������������������������������
������������ B
-767
-200
ER
����������������� N
AC
A T
N-4
332
10-6
10-5
10-4
10-3
10-2
10-1
100
101
010
2030
40
Der
ived
Gus
t Vel
ocity
, Ude
(F
t/Sec
)
Cumulative Occurrences per Nautical Mile
���������������������������������
���������������������������������
���������������������������������
���������������������������������
1223
flig
hts
396.
14 h
ours
1728
79.0
6 nm
Upw
ard
Gus
ts
���� ����� �� ��� ������� ��������
�������� ������ ��������
��������� ������� ��������
��������� ��� ����
����������� �������
������
������
������ ���� ���������
������������ ����
��� ��� �������
������������
����� ���� ����
���� ������� ��� ����
�
��������
��������
������������������
����������
������������������
��������
������������������
����������
������������������
��������
������������������
����������
���������� ��������
��������
�������� ���������
����������������
�������
�����������
�����
���������
��������������������
����������� ��������������������
�������������������
������������������
���������� ������������������
������������������
�������������������������
������� �����
���������������������������������������������������
���������������������������������������������������
���������������������������������������������������
�����������
B-7
67-2
00ER
����������������� N
AC
A T
N-4
332
10-6
10-5
10-4
10-3
10-2
10-1
100
101
010
2030
40
Der
ived
Gus
t Vel
ocity
, Ude
(F
t/Sec
)
Cumulative Occurrences per Nautical Mile
���������������������������������
���������������������������������
���������������������������������
���������������������������������
1223
flig
hts
396.
14 h
ours
1728
79.0
6 nm
Dow
nwar
d G
usts

FIG
UR
E A
-39.
CU
MU
LA
TIV
E O
CC
UR
RE
NC
ES
OF
DE
RIV
ED
GU
ST
VE
LO
CIT
Y P
ER
NA
UT
ICA
L M
ILE
, 29,
500-
39,5
00 F
EE
T
A-23
�� ����� �������
�������������
������� ����� ������
����� �� ����� ������ ��� ���
����������
�������� ��� ���
����
��������������� �� ���
������� ���
������ ����
��������� �������
����� ����
��
���������
���������
���������
����������������
�������
����������������
���������
���������
������������
��������
�����������
�����������
��������������������
���������
��������� ����������
����������
����������
���������� ��������
��������
�������� ����������
����������
��������������
������������
�������� ����������
������������������
�������� ���������
���������������� ����
�������������������
������� ��������
��������
���������������������������������������������������
���������������������������������������������������
���������������������������������������������������
�������
�������
�����
����� B
-767
-200
ER
�������������� N
AC
A T
N-4
332
10-6
10-5
10-4
10-3
10-2
10-1
100
101
010
2030
40
Der
ived
Gus
t Vel
ocity
, Ude
(F
t/Sec
)
Cumulative Occurrences per Nautical Mile
�������������������������������������
�������������������������������������
�������������������������������������
�������������������������������������
1223
flig
hts
7590
.9 h
ours
3412
582.
5 nm
Upw
ard
Gus
ts
���� ����� �� �� ��� ������� ���� ����
��� ���� ����� ������� ���������
����� ���� ������� ��������
��� �� ���� ������ ��������
������ ��� �������
�������� �����
��������� ����
��� ������� �������� ����
���� ���������������� ���
��������
��������
��������
������������������
����������
������������������
��������
��������
������������
������
����������
����������
������������������
��������
�������� ����������
����������
����������
���������� �������
�������
������� ���������
���������
�������������
����������
������� ���������
��������������������
����������� ���������
�������������������
����������������������������
���������� �������
�������
��������������������������������������������������
��������������������������������������������������
��������������������������������������������������
�������
�������
���� ����
B-7
67-2
00ER
����������������� N
AC
A T
N-4
332
10-6
10-5
10-4
10-3
10-2
10-1
100
101
010
2030
40
Der
ived
Gus
t Vel
ocity
, Ude
(F
t/Sec
)
Cumulative Occurrences per Nautical Mile
�������������������������������������
�������������������������������������
�������������������������������������
�������������������������������������
1223
flig
hts
7590
.9 h
ours
3412
582.
5 nm
Dow
nwar
d G
usts

FIG
UR
E A
-40.
CU
MU
LA
TIV
E O
CC
UR
RE
NC
ES
OF
DE
RIV
ED
GU
ST
VE
LO
CIT
Y P
ER
NA
UT
ICA
L M
ILE
, 39,
500-
49,5
00 F
EE
T
A-24
����� �� �� ��� ���
���������
����� ����� ���������
����������
����� �� ����� ������ ��� ���
�����������
������������
������ ������
������
���������
����������������
����������������
���������
��������������������
�������������������
��������
�����������
�������
����������
������������������
������������������
����������
������������������
������������������
���������� ������� ����
��������������
�����
���������
��������� ������� ����
������������
���������������� ����
��� ���������
��������������������
����������� ��������
������������������
����������������������������
���������� ��������������
������
���������������������������������������������������
���������������������������������������������������
���������������������������������������������������
������������ B
-767
-200
ER
�������������� N
AC
A T
N-4
332
10-6
10-5
10-4
10-3
10-2
10-1
100
010
2030
40
Der
ived
Gus
t Vel
ocity
, Ude
(F
t/Sec
)
Cumulative Occurrences per Nautical Mile
�������������������������������������
�������������������������������������
�������������������������������������
�������������������������������������
1223
flig
hts
64.9
2 ho
urs
2868
0.03
nm
Upw
ard
Gus
ts
���������
����������
������� ���� ����� ���������� �������� ��������
�������� ���� ����� ������� ��������
������ �� ���� ��� ���� ����
�� �����������
��
��������
������������������
������������������
������������������
������������������
������������������
����������
�����������������
����������������
��������� �������
����������������
��������������������
����������� ���������
�������������������
����������
��������������
������������
�������� ����������
�������������
�����
�������� ����������
������������������
�������������������������
������� ����������������
�������������
��������������������������������������������������
��������������������������������������������������
��������������������������������������������������
�����������
B-7
67-2
00ER
����������������� N
AC
A T
N-4
332
10-6
10-5
10-4
10-3
10-2
10-1
100
101
010
2030
40
Der
ived
Gus
t Vel
ocity
, Ude
(F
t/Sec
)
Cumulative Occurrences per Nautical Mile
�������������������������������������
�������������������������������������
�������������������������������������
�������������������������������������
1223
flig
hts
64.9
2 ho
urs
2868
0.03
nm
Dow
nwar
d G
usts
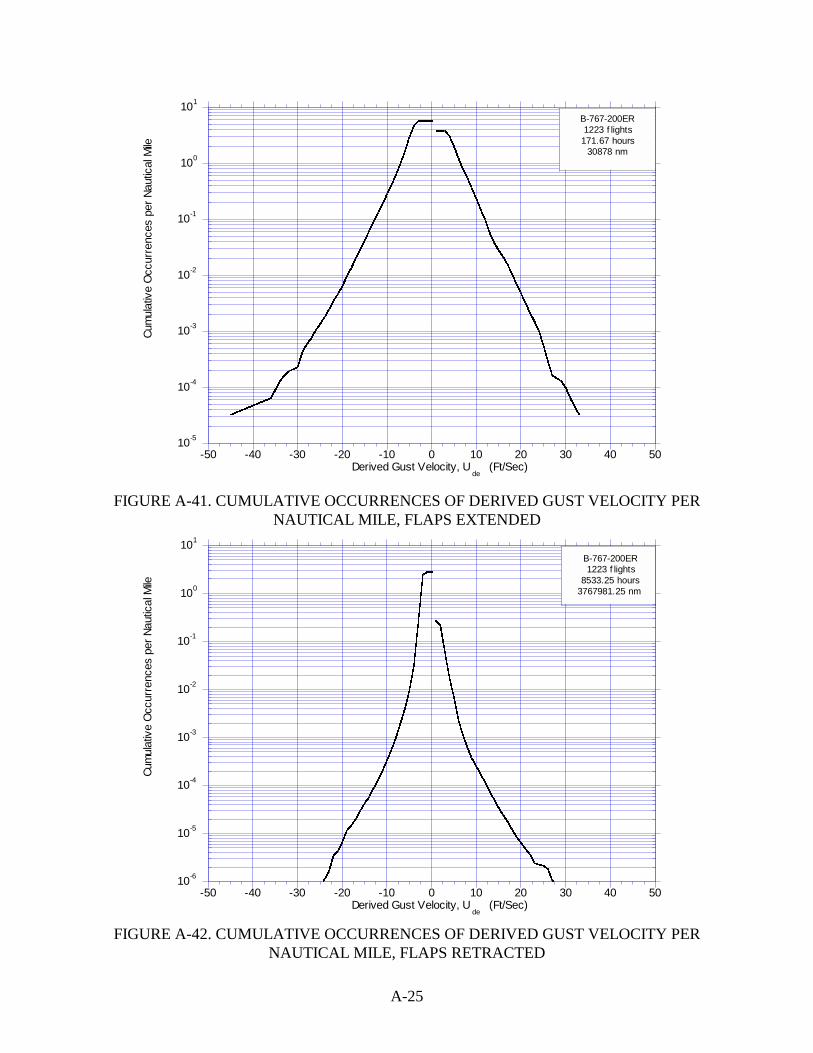
A-25
FIGURE A-41. CUMULATIVE OCCURRENCES OF DERIVED GUST VELOCITY PERNAUTICAL MILE, FLAPS EXTENDED
FIGURE A-42. CUMULATIVE OCCURRENCES OF DERIVED GUST VELOCITY PERNAUTICAL MILE, FLAPS RETRACTED
�� ������������
������
��������
��������
�������
������
���������
���������
���������
�����
�����
�����
�����
�����
������
������
�������
�������
�������
�������
��������
��������
�������������
�����
������
������
�������
��������
�����
�����
������
��������
�����
�����
������
������
�������
�����
�����
����������
��������
��������
���������
���������
���������
���� ��������
��������
��������
�������
�������
�������
�������
�������
�������
�������
�������
�������
�������
������
������
������
����������� ����
�����
������
������
������
������
������
������
�������
�������
�������
�������
����������
��������
��������
���������������
�����
���������
10-5
10-4
10-3
10-2
10-1
100
101
-50 -40 -30 -20 -10 0 10 20 30 40 50Derived Gust Velocity, U
de (Ft/Sec)
Cum
ulat
ive
Occ
urre
nces
per
Nau
tical
Mile
���������������������������
���������������������������
���������������������������
���������������������������
���������������������������
���������������������������
���������������������������
B-767-200ER1223 f lights
171.67 hours30878 nm
� ������
������������������������
���������������������
���������������������
������������
������������
�����������
��������
����������
����������
��������
��������
�������
�������
�������
�������
��������
���������
�����
�����
�������
�������
���� ����������
��������
�������
���� ����
����������
��������
������
������������
������������
�������������
������������
������������
�������
�������
���������
��������
��������
�������������
������
�������
�������
�������
�������
�������������
������
������
����������������
�����
�������
������������
���������� ���
������
���������
���������
����10-6
10-5
10-4
10-3
10-2
10-1
100
101
-50 -40 -30 -20 -10 0 10 20 30 40 50Derived Gust Velocity, U
de (Ft/Sec)
Cum
ulat
ive
Occ
urre
nces
per
Nau
tical
Mile
���������������������������
���������������������������
���������������������������
���������������������������
���������������������������
���������������������������
���������������������������
B-767-200ER1223 f lights
8533.25 hours3767981.25 nm

A-26
FIGURE A-43. CUMULATIVE OCCURRENCES OF CONTINUOUS GUST INTENSITYPER NAUTICAL MILE, FLAPS EXTENDED
FIGURE A-44. CUMULATIVE OCCURRENCES OF CONTINUOUS GUST INTENSITYPER NAUTICAL MILE, FLAPS RETRACTED
������ ���������������������
��������
�����
�����
������
������
�������������
����������
������
������
��������
���������������������
������
������
���������
������������
������������
������
������
���� ���������������
�����������
�������
�����
�����
��� ��������������������������������
�����
�����
���� ������������������������
������
������
�������������
�������
�������
�����������
�����������
�����������
���������������� ����������
���������������
�������������������� ��������
�����
�����������������
������������
������
������
�������
�������������������������������
�������
�������
�����
�����
���������������������������
��������
��������
�����
�����
��������������������������
�����
�������
�������
�������������������
�����
������
�����������
10-5
10-4
10-3
10-2
10-1
100
101
-100 -80 -60 -40 -20 0 20 40 60 80 100
Continuous Gust Intensity, Uσ (Ft/Sec)
Cum
ulat
ive
Occ
urre
nces
per
Nau
tical
Mile
��������������������������
��������������������������
��������������������������
��������������������������
��������������������������
��������������������������
��������������������������
B-767-200ER1223 f lights
171.67 hours30878.43 nm
����
����
����
����
��������
��������������
���������
���������
�������
������
�����
�����
������
����������������
������������
������
������
����������������������������
�����
�����
���� ���������������������������
�������
�������
���� ���������������������������
������������
������������
������������
������������
��������
������
���������
���������
��������
��������
�������
����������������
������
�������
�������
�����
�����
��������������������������������� ����
����������������������������������
������������������������������������ ���
�������������������
������
�������
��������
��������
10-7
10-6
10-5
10-4
10-3
10-2
10-1
100
101
-100 -80 -60 -40 -20 0 20 40 60 80 100
Continuous Gust Intensity, Uσ (Ft/Sec)
Cum
ulat
ive
Occ
urre
nces
per
Nau
tical
Mile
�����������������������
�����������������������
�����������������������
�����������������������
�����������������������
�����������������������
B-767-200ER1223 f lights
8533.25 hours3767981.25 nm

FIG
UR
E A
-45.
CU
MU
LA
TIV
E O
CC
UR
RE
NC
ES
OF
INC
RE
ME
NT
AL
MA
NE
UV
ER
LO
AD
FA
CT
OR
PE
R10
00 H
OU
RS
DU
RIN
G D
EP
AR
TU
RE
BY
AL
TIT
UD
E
FIG
UR
E A
-46.
CU
MU
LA
TIV
E O
CC
UR
RE
NC
ES
OF
INC
RE
ME
NT
AL
MA
NE
UV
ER
LO
AD
FA
CT
OR
PE
R10
00 H
OU
RS
DU
RIN
G C
LIM
B B
Y A
LT
ITU
DE
A-27
�����
�����
��� ������
������
101
102
103
104
105
106
107
-1-0
.50
0.5
1
�����������������������������������������������������������������
�����������������������������������������������������������������
�����������������������������������������������������������������
�����������������������������������������������������������������
�����������������������������������������������������������������
< 5
00 F
T;
3.
80 H
R
500-
1500
FT
;
6.68
HR
1500
-450
0 F
T;
16.
3 H
R
4500
-950
0 F
T;
1.
74 H
R
������
9500
-195
00 F
T;
0.
04 H
R
Cumulative Occurrences per 1000 Hours
Incr
emen
tal L
oad
Fact
or,
∆nz,
(g)
�����������������������������
�����������������������������
B-7
67-2
00E
R
�������
�����
������
������ ����
���� ���
����
100
101
102
103
104
105
106
-1-0
.50
0.5
1
�������������������������������������������������������������������
�������������������������������������������������������������������
�������������������������������������������������������������������
�������������������������������������������������������������������
�������������������������������������������������������������������
1500
-450
0 F
T;
12.
19 H
R45
00-9
500
FT
; 3
9.94
HR
9500
-195
00 F
T;
97.
64 H
R19
500-
2950
0 F
T;
121
.03
HR
�����
2950
0-39
500
FT
; 1
70.6
9 H
R
Cumulative Occurrences per 1000 Hours
Incr
emen
tal L
oad
Fact
or,
∆nz,
(g)
����������������������������
����������������������������
B-7
67-2
00E
R

FIG
UR
E A
-47.
CU
MU
LA
TIV
E O
CC
UR
RE
NC
ES
OF
INC
RE
ME
NT
AL
MA
NE
UV
ER
LO
AD
FA
CT
OR
PE
R10
00 H
OU
RS
DU
RIN
G C
RU
ISE
BY
AL
TIT
UD
E
FIG
UR
E A
-48.
CU
MU
LA
TIV
E O
CC
UR
RE
NC
ES
OF
INC
RE
ME
NT
AL
MA
NE
UV
ER
LO
AD
FA
CT
OR
PE
R10
00 H
OU
RS
DU
RIN
G D
ES
CE
NT
BY
AL
TIT
UD
E
A-28
���������
���
������
���
��� ������
������
�����
����
����
10-1
100
101
102
103
104
105
106
-1-0
.50
0.5
1
�����������������������������������������������������������������
�����������������������������������������������������������������
�����������������������������������������������������������������
�����������������������������������������������������������������
�����������������������������������������������������������������
1500
-450
0 F
T;
2.
24 H
R45
00-9
500
FT
; 2
6.97
HR
9500
-195
00 F
T;
68.
33 H
R19
500-
2950
0 F
T;
153
.70
HR
�������
2950
0-39
500
FT
; 73
23.3
8 H
R
Cumulative Occurrences per 1000 Hours
Incr
emen
tal L
oad
Fact
or,
∆nz,
(g)
�����������������������������
�����������������������������
B-7
67-2
00E
R
�����
�����
������
��� ���
���� ����
�����
������
���
����
������ ���
�����
���� ����
������
�����
�����
����
100
101
102
103
104
105
106
-1-0
.50
0.5
1
����������������������������������������������������������������
����������������������������������������������������������������
����������������������������������������������������������������
����������������������������������������������������������������
����������������������������������������������������������������
500-
1500
FT
;
0.04
HR
1500
-450
0 F
T;
10.
70 H
R45
00-9
500
FT
; 8
1.60
HR
9500
-195
00 F
T;
141
.82
HR
���
1950
0-29
500
FT
; 1
21.4
2 H
R
���
2950
0-39
500
FT
; 9
6.85
HR
Cumulative Occurrences per 1000 Hours
Incr
emen
tal L
oad
Fact
or,
∆nz,
(g)
������������������������������
������������������������������
B-7
67-2
00E
R

FIG
UR
E A
-49.
CU
MU
LA
TIV
E O
CC
UR
RE
NC
ES
OF
INC
RE
ME
NT
AL
MA
NE
UV
ER
LO
AD
FA
CT
OR
PE
R10
00 H
OU
RS
DU
RIN
G A
PP
RO
AC
H B
Y A
LT
ITU
DE
FIG
UR
E A
-50.
CU
MU
LA
TIV
E O
CC
UR
RE
NC
ES
OF
INC
RE
ME
NT
AL
MA
NE
UV
ER
LO
AD
FA
CT
OR
PE
RN
AU
TIC
AL
MIL
E D
UR
ING
DE
PA
RT
UR
E B
Y A
LT
ITU
DE
A-29
�����
�����
������
���� �������
10-4
10-3
10-2
10-1
100
101
-1-0
.50
0.5
1
�����������������������������������������������������������������
�����������������������������������������������������������������
�����������������������������������������������������������������
�����������������������������������������������������������������
< 5
00 F
T;
6
66.1
NM
500-
1500
FT
;
1222
.00
NM
1500
-450
0 F
T;
32
94.1
NM
4500
-950
0 F
T;
38
2.2
NM
����
9500
-195
00 F
T;
1
0.4
NM
Cumulative Occurrences per Nautical Mile
Incr
emen
tal L
oad
Fact
or,
∆nz,
(g)����
������������������������
����������������������������
B-7
67-2
00E
R
�����
�����
�����
���
������
�����
101
102
103
104
105
106
-1-0
.50
0.5
1
����������������������������������������������������������������
����������������������������������������������������������������
����������������������������������������������������������������
����������������������������������������������������������������
����������������������������������������������������������������
< 5
00 F
T;
10.
26 H
R50
0-15
00 F
T;
23.
23 H
R15
00-4
500
FT
; 7
9.18
HR
4500
-950
0 F
T;
29.
76 H
R
������
9500
-195
00 F
T;
0.
48 H
R
Cumulative Occurrences per 1000 Hours
Incr
emen
tal L
oad
Fact
or,
∆nz,
(g)
������������������������������
������������������������������
B-7
67-2
00E
R

FIG
UR
E A
-51.
CU
MU
LA
TIV
E O
CC
UR
RE
NC
ES
OF
INC
RE
ME
NT
AL
MA
NE
UV
ER
LO
AD
FA
CT
OR
PE
RN
AU
TIC
AL
MIL
E D
UR
ING
CL
IMB
BY
AL
TIT
UD
E
FIG
UR
E A
-52.
CU
MU
LA
TIV
E O
CC
UR
RE
NC
ES
OF
INC
RE
ME
NT
AL
MA
NE
UV
ER
LO
AD
FA
CT
OR
PE
RN
AU
TIC
AL
MIL
E D
UR
ING
CR
UIS
E B
Y A
LT
ITU
DE
A-30
�����
�����
�����
���
���� ����
��� ������
������
�����
�����
������
������
10-5
10-4
10-3
10-2
10-1
100
101
-1-0
.50
0.5
1
���������������������������������������������������������������������
���������������������������������������������������������������������
���������������������������������������������������������������������
���������������������������������������������������������������������
���������������������������������������������������������������������
1500
-450
0 F
T;
29
58.9
NM
4500
-950
0 F
T;
110
42.1
NM
9500
-195
00 F
T;
361
90.8
NM
1950
0-29
500
FT
; 5
3988
.2 N
M
����
2950
0-39
500
FT
; 7
7192
.8 N
M
Cumulative Occurrences per Nautical Mile
Incr
emen
tal L
oad
Fact
or,
∆nz,
(g)���
������������������������
���������������������������
B-7
67-2
00E
R
�����
�����
�����
�����
��� ���
������
���
��� ������
�����
�����
����
10-7
10-6
10-5
10-4
10-3
10-2
10-1
100
101
-1-0
.50
0.5
1
�������������������������������������������������������������������������
�������������������������������������������������������������������������
�������������������������������������������������������������������������
�������������������������������������������������������������������������
�������������������������������������������������������������������������
1500
-450
0 F
T;
5
36.7
NM
4500
-950
0 F
T;
69
95.7
NM
9500
-195
00 F
T;
227
71.9
NM
1950
0-29
500
FT
; 6
7218
.8 N
M
��� ���
2950
0-39
500
FT
; 32
9166
6.8
NM
Cumulative Occurrences per Nautical Mile
Incr
emen
tal L
oad
Fact
or,
∆nz,
(g)
������������������������������
������������������������������
������������������������������
B-7
67-2
00E
R

FIG
UR
E A
-53.
CU
MU
LA
TIV
E O
CC
UR
RE
NC
ES
OF
INC
RE
ME
NT
AL
MA
NE
UV
ER
LO
AD
FA
CT
OR
PE
RN
AU
TIC
AL
MIL
E D
UR
ING
DE
SC
EN
T B
Y A
LT
ITU
DE
FIG
UR
E A
-54.
CU
MU
LA
TIV
E O
CC
UR
RE
NC
ES
OF
INC
RE
ME
NT
AL
MA
NE
UV
ER
LO
AD
FA
CT
OR
PE
RN
AU
TIC
AL
MIL
E D
UR
ING
AP
PR
OA
CH
BY
AL
TIT
UD
E
A-31
���������
��� ���
���� ����
���������
�����
��
����
��� ������
������
�����
����
����
��� ��� �������
�����
���
10-5
10-4
10-3
10-2
10-1
100
101
-1-0
.50
0.5
1
�����������������������������������������������������������������������
�����������������������������������������������������������������������
�����������������������������������������������������������������������
�����������������������������������������������������������������������
�����������������������������������������������������������������������
500-
1500
FT
;
9.
1 N
M15
00-4
500
FT
;
2559
.2 N
M45
00-9
500
FT
; 2
1418
.1 N
M95
00-1
9500
FT
; 4
9400
.6 N
M
�������
1950
0-29
500
FT
; 5
1672
.0 N
M
�������
2950
0-39
500
FT
; 4
3722
.7 N
M
Cumulative Occurrences per Nautical Mile
Incr
emen
tal L
oad
Fact
or,
∆nz,
(g)
�����������������������������
�����������������������������
B-7
67-2
00E
R
�����
������
������
��� ���
�������
������
������
10-4
10-3
10-2
10-1
100
101
-1-0
.50
0.5
1
�����������������������������������������������������������������
�����������������������������������������������������������������
�����������������������������������������������������������������
�����������������������������������������������������������������
�����������������������������������������������������������������
< 5
00 F
T;
14
17.0
NM
500-
1500
FT
;
3366
.6 N
M15
00-4
500
FT
; 1
4198
.8 N
M45
00-9
500
FT
;
6165
.7 N
M
��� ���
9500
-195
00 F
T;
1
11.1
NM
Cumulative Occurrences per Nautical Mile
Incr
emen
tal L
oad
Fact
or,
∆nz,
(g)����
�����������������������
���������������������������
B-7
67-2
00E
R

FIG
UR
E A
-55.
CU
MU
LA
TIV
E O
CC
UR
RE
NC
ES
OF
INC
RE
ME
NT
AL
MA
NE
UV
ER
LO
AD
FA
CT
OR
PE
R 1
000
HO
UR
S B
Y F
LIG
HT
PH
AS
E
FIG
UR
E A
-56.
CU
MU
LA
TIV
E O
CC
UR
RE
NC
ES
OF
INC
RE
ME
NT
AL
MA
NE
UV
ER
LO
AD
FA
CT
OR
PE
R 1
000
HO
UR
S, C
OM
BIN
ED
FL
IGH
T P
HA
SE
S
A-32
��������� ���
�����
�����
������
��� ���
���������
��� ���
����
����
��� ���
10-1
100
101
102
103
104
105
106
-1-0
.50
0.5
1
������������������������������������������������������
������������������������������������������������������
������������������������������������������������������
������������������������������������������������������
������������������������������������������������������
Dep
artu
re;
28.
56 H
RC
limb;
44
3.85
HR
Cru
ise;
763
6.23
HR
Des
cent
; 4
53.3
7 H
R
���
App
roac
h;
142.
91 H
R
Cumulative Occurrences per 1000 Hours
Incr
emen
tal L
oad
Fact
or,
∆nz,
(g)
������������������������������
������������������������������
������������������������������
B-7
67-2
00E
R
10-1
100
101
102
103
104
-1-0
.50
0.5
1
Cumulative Occurrences per 1000 Hours
Incr
emen
tal L
oad
Fact
or,
∆nz,
(g)����
��������������������������������
������������������������������������
������������������������������������
8704
.92
Hou
rsB
-767
-200
ER

FIG
UR
E A
-57.
CU
MU
LA
TIV
E O
CC
UR
RE
NC
ES
OF
INC
RE
ME
NT
AL
MA
NE
UV
ER
LO
AD
FA
CT
OR
PE
R N
AU
TIC
AL
MIL
E B
Y F
LIG
HT
PH
AS
E
FIG
UR
E A
-58.
CU
MU
LA
TIV
E O
CC
UR
RE
NC
ES
OF
INC
RE
ME
NT
AL
MA
NE
UV
ER
LO
AD
FA
CT
OR
PE
R N
AU
TIC
AL
MIL
E, C
OM
BIN
ED
FL
IGH
T P
HA
SE
S
A-33
���������
������
������
����
�����
��� ���������
�����
������
������
����
����
10-7
10-6
10-5
10-4
10-3
10-2
10-1
100
101
-1-0
.50
0.5
1
������������������������������������������������������������
������������������������������������������������������������
������������������������������������������������������������
������������������������������������������������������������
������������������������������������������������������������
Dep
artu
re;
55
74.8
NM
Clim
b;
1824
18.0
NM
Cru
ise;
341
6404
.5 N
MD
esce
nt;
169
202.
8 N
M
������
������
App
roac
h;
252
59.4
NM
Cumulative Occurrences per Nautical Mile
Incr
emen
tal L
oad
Fact
or,
∆nz,
(g)���
�������������������������
����������������������������
B-7
67-2
00E
R
10-7
10-6
10-5
10-4
10-3
10-2
10-1
-1-0
.50
0.5
1
Cumulative Occurrences per Nautical Mile
Incr
emen
tal L
oad
Fact
or,
∆nz,
(g)����
��������������������������������
������������������������������������
������������������������������������
3798
859.
5 N
MB
-767
-200
ER

FIG
UR
E A
-59.
CU
MU
LA
TIV
E O
CC
UR
RE
NC
ES
OF
CO
MB
INE
D M
AN
EU
VE
R A
ND
GU
ST
IN
CR
EM
EN
TA
LL
OA
D F
AC
TO
R P
ER
100
0 H
OU
RS
BY
FL
IGH
T P
HA
SE
FIG
UR
E A
-60.
CU
MU
LA
TIV
E O
CC
UR
RE
NC
ES
OF
INC
RE
ME
NT
AL
VE
RT
ICA
L L
OA
D F
AC
TO
RP
ER
100
0 H
OU
RS
,CO
MB
INE
D F
LIG
HT
PH
AS
ES
A-34
�����
��� ���
����
������
��� ���
��� ������
�����
�����
������
�����
�����
10-1
100
101
102
103
104
105
106
-1-0
.50
0.5
1
�������������������������������������������������������
�������������������������������������������������������
�������������������������������������������������������
�������������������������������������������������������
�������������������������������������������������������
�������������������������������������������������������
Dep
artu
re;
29
Hou
rs
Clim
b;
444
Hou
rs
Cru
ise;
763
6 H
ours
Des
cent
; 4
53 H
ours
�����
App
roac
h;
143
Hou
rs
Cumulative Occurrences per 1000 Hours
Incr
emen
tal L
oad
Fact
or,
∆nz,
(g)���
������������������������
���������������������������
B-7
67-2
00E
R
10-1
100
101
102
103
104
105
106
-1-0
.50
0.5
1
Cumulative Occurrences per 1000 Hours
Incr
emen
tal L
oad
Fact
or,
∆nz,
(g)����
��������������������������������
������������������������������������
������������������������������������
8705
Hou
rsB
-767
-200
ER
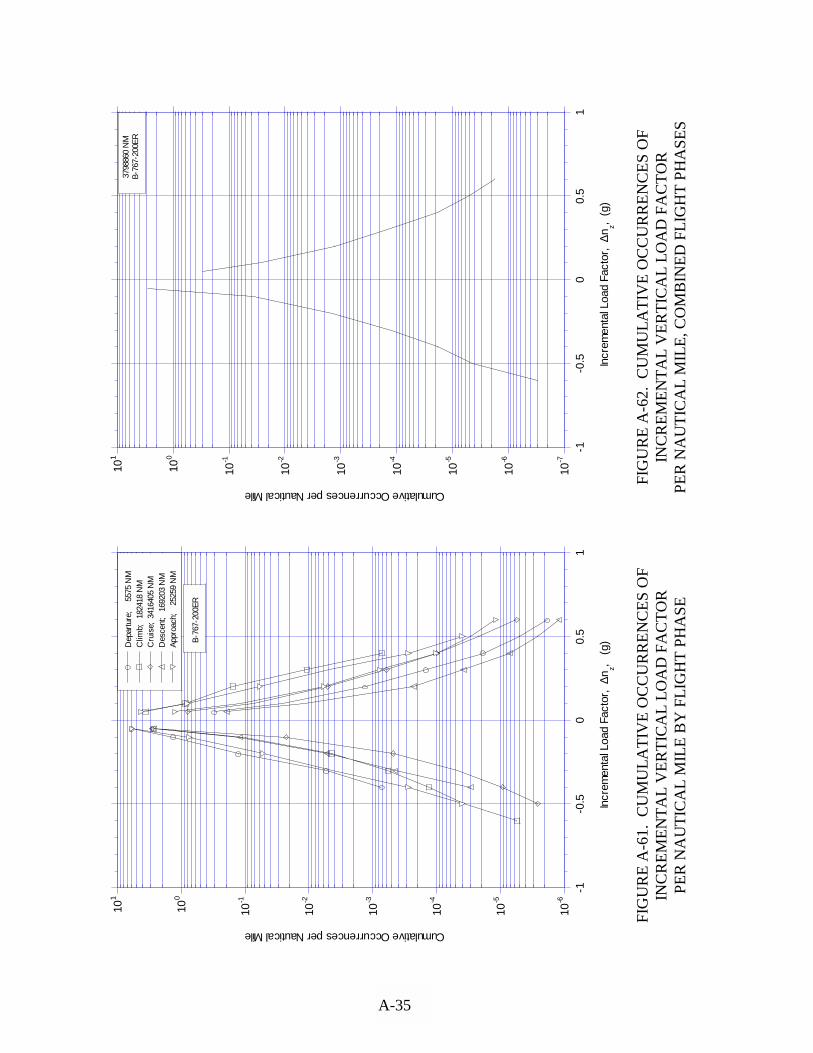
FIG
UR
E A
-61.
CU
MU
LA
TIV
E O
CC
UR
RE
NC
ES
OF
INC
RE
ME
NT
AL
VE
RT
ICA
L L
OA
D F
AC
TO
RP
ER
NA
UT
ICA
L M
ILE
BY
FL
IGH
T P
HA
SE
FIG
UR
E A
-62.
CU
MU
LA
TIV
E O
CC
UR
RE
NC
ES
OF
INC
RE
ME
NT
AL
VE
RT
ICA
L L
OA
D F
AC
TO
RP
ER
NA
UT
ICA
L M
ILE
, CO
MB
INE
D F
LIG
HT
PH
AS
ES
A-35
�����
�����
���
������
���
��������
�����
���� ���
���
���
��� ������
�����
�����
������
�����
10-6
10-5
10-4
10-3
10-2
10-1
100
101
-1-0
.50
0.5
1
��������������������������������������������������������
��������������������������������������������������������
��������������������������������������������������������
��������������������������������������������������������
��������������������������������������������������������
Dep
artu
re;
55
75 N
MC
limb;
18
2418
NM
Cru
ise;
341
6405
NM
Des
cent
; 1
6920
3 N
M
�����
App
roac
h;
252
59 N
M
Cumulative Occurrences per Nautical Mile
Incr
emen
tal L
oad
Fact
or,
∆nz,
(g)���
�������������������������
����������������������������
����������������������������
B-7
67-2
00E
R
10-7
10-6
10-5
10-4
10-3
10-2
10-1
100
101
-1-0
.50
0.5
1
Cumulative Occurrences per Nautical Mile
Incr
emen
tal L
oad
Fact
or,
∆nz,
(g)
���������������������������������
���������������������������������
���������������������������������
3798
860
NM
B-7
67-2
00E
R
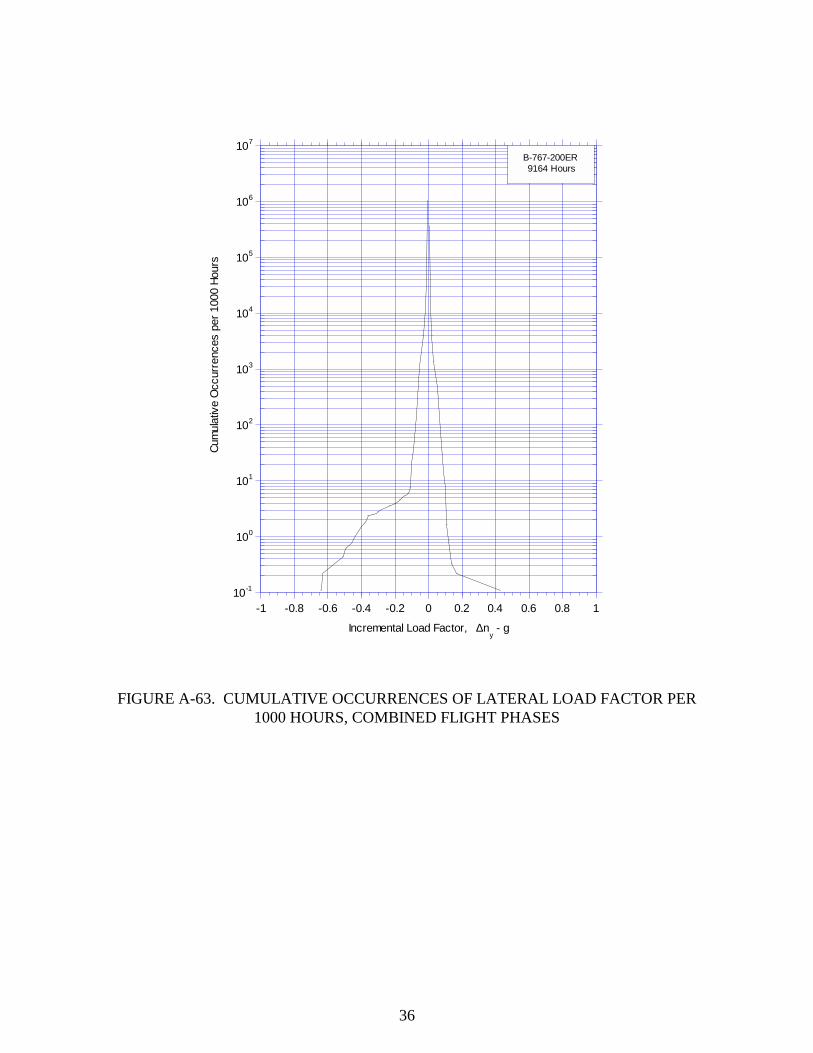
36
FIGURE A-63. CUMULATIVE OCCURRENCES OF LATERAL LOAD FACTOR PER1000 HOURS, COMBINED FLIGHT PHASES
10-1
100
101
102
103
104
105
106
107
-1 -0.8 -0.6 -0.4 -0.2 0 0.2 0.4 0.6 0.8 1
Incremental Load Factor, ∆ny - g
Cum
ulat
ive
Occ
urre
nces
per
100
0 H
ours
����������������
����������������
����������������
����������������
����������������
����������������
B-767-200ER9164 Hours

37
FIGURE A-64. COINCIDENT MANEUVER LOAD FACTOR AND SPEED VERSUS V-nDIAGRAM FOR FLAPS RETRACTED
FIGURE A-65. COINCIDENT MANEUVER LOAD FACTOR AND SPEED VERSUS V-nDIAGRAM FOR FLAPS EXTENDED
���� ���� ���� ���� ���� ���� ���� ���������������� ���� ���� ���� ���� ���� ���������������� ���� ���� ���� ���� ���� ���� ���� ������������ ���� ���� ���� ���� ���� ���� ������������ �������� ���������
�������� �������
��������
�������������
��������������� ��������
������������������������������
����������������
�������������������������
������������������
����������������
��������
����
����
��������
������������
��������
����
��������������������������������������������������������
-2
-1
0
1
2
3
0 100 200 300 400Load
Fac
tor,
nz
(g)
Velocity(KEAS)
����������������
����������������
����������������
�� ��������������
����������������
�� ��������������
����������������
�� ��������������
����������������
����������������
����������������
�� ��������������
����������������
�� ��������������
����������������
����������������
V-n Diagram For Illustration Only
B-767-200ER
� ���� ����� ������������
�������� �������
��������
������������ ����
�����������
������������ ����
�������
�������������
������������������������
����������������
����������������������� ����
�� ������� ����
���������������������
������������� ��� ������ ������ ��������� ��� ��� ������ ������ ��� ������ ������ ��������� ��� ��� ��� ���
�������������������������������������������������������������������
� �����������
��������� ����������� ����� ��
��������� ������� ���
�������� ���
������
������
���� ����������
���������������
�����
�������
�������������� ��� ��� ��������� ������ ��� ������ ������ ��������� ��� ��� ������ ������ ��� ������ ������ ����������
�������������������������
�����������������������������
�����������������������������
�����������������������������
����������������������������� �������������������������������������������������������������������
� � � � � � � ������������ � � � � � �
����������� � � � � � � �
�����
�����
�����
������ � � � � � � �
����������� � � �
-2
-1
0
1
2
3
0 100 200 300 400Load
Fac
tor,
nz
(g)
Velocity(KEAS)
�����������������
�����������������
�����������������
�����������������
��� ��������������
�����������������
�����������������
�����������������
��� ��������������
�����������������
�����������������
��� ��������������
�����������������
��� ��������������
�����������������
�����������������
V-n Diagram For Illustration Only
B-767-200ER

38
FIGURE A-66. COINCIDENT GUST LOAD FACTOR AND SPEED VERSUS V-nDIAGRAM FOR FLAPS RETRACTED
FIGURE A-67. COINCIDENT GUST LOAD FACTOR AND SPEED VERSUS V-nDIAGRAM FOR FLAPS EXTENDED
��� ��� ��� ��� ��� ��� ���
�����������
�������������� ��� ��� ��� ��� ��� ��� ���
�����������
�������������� ��� ��� ��� ��� ��� ���
�����������
�������������� ��� ��� ��� ��� ��� ��� ���
�����������
�����������
�������������������������������������
�������������������������������������
�������������������������������������
�������������������������������������
�������������������������������������
�������������������������������������
�������������������������������������
�������������������������������������
�������������������������������������
�������������������������������������
�������������������������������������
�������������������������������������
�������������������������������������
�������������������������������������
�������������������������������������
�������������������������������������
���������������������������������������������������������������������
�������������������������������������
�������������������������������������
�������������������������������������
�������������������������������������
�������������������������������������
�������������������������������������
�������������������������������������
�������������������������������������
�������������������������������������
�������������������������������������
�������������������������������������
�������������������������������������
�������������������������������������
�������������������������������������
�������������������������������������
�������������������������������������
-0.5
0
0.5
1
1.5
0 100 200 300 400
Load
Fac
tor,
nz
(g)
Velocity(KEAS)
�����������������
�����������������
�����������������
�����������������
�����������������
�����������������
��� ��������������
�����������������
�����������������
�����������������
��� ��������������
�����������������
��� ��������������
�����������������
�����������������
�����������������
V-n Diagram For Illustration Only
B-767-200ER
�����
�����
�����
�����
�����
�����
�����
�����
���������
��������������
�����
�����
�����
�����
�����
�����
���������
��������������
�����
�����
�����
�����
�����
�����
�����
���������
��������������
�����
�����
�����
�����
�����
�����
���������
��������������
�����
�����
�����
�����
�������������������������������������������������������������������
�������������������������������������������������������������������
�������������������������������������������������������������������
�������������������������������������������������������������������
�������������������������������������������������������������������
�������������������������������������������������������������������
�������������������������������������������������������������������
�������������������������������������������������������������������
�������������������������������������������������������������������
�������������������������������������������������������������������
�������������������������������������������������������������������
�������������������������������������������������������������������
�������������������������������������������������������������������
�������������������������������������������������������������������
�������������������������������������������������������������������
�������������������������������������������������������������������
�������������������������������������������������������������������
�������������������������������������������������������������������
�������������������������������������������������������������������
��������������������������������������������������������������������������
�������
�������
�������
�������
�������
����������������������������
����������������������������
����������������������������
����������������������������
����������������������������
���������������������������������������������������������������������
���������������������������
���������������������������
���������������������������
���������������������������
���������������������������
�����
�����
�����
�����
�����
�����
����������������������������������������������������������������
����������������������������������������������������������������
����������������������������������������������������������������
����������������������������������������������������������������
����������������������������������������������������������������
����������������������������������������������������������������
����������������������������������������������������������������
����������������������������������������������������������������
����������������������������������������������������������������
����������������������������������������������������������������
����������������������������������������������������������������
����������������������������������������������������������������
����������������������������������������������������������������
����������������������������������������������������������������
����������������������������������������������������������������
����������������������������������������������������������������
����������������������������������������������������������������
����������������������������������������������������������������
����������������������������������������������������������������
����������������������������������������������������������������
-0.5
0
0.5
1
1.5
2
2.5
0 100 200 300 400
Load
Fac
tor,
nz
(g)
Velocity(KEAS)
������������������
������������������
������������������
������������������
������������������
������������������
������������������
������������������
������������������
������������������
������������������
������������������
������������������
������������������
������������������
V-n Diagram For Illustration Only
B-767-200ER

FIGURE A-68. CUMULATIVE PROBABILITY OF MAXIMUM AIRSPEED IN FLAPDETENT DURING DEPARTURE
FIGURE A-69. CUMULATIVE PROBABILITY OF MAXIMUM AIRSPEED IN FLAPDETENT DURING APPROACH
����
�������������� ������������������ �������
����������������
�������
��������
���������
��������
�������
���������
���������
�������
���������
��������
�����������
�����������
�����������
�������������
�������������
�����������
��������
������
����������
����������
���������
���������
������������������
������������
�����
���������������������
�������������������� ������������� ��
��� ������ ����������������������
�����
��������������������
������
���������������
�������������
������
�����
���������
�����
���������� ��
��������������������
�������������
������������
����������������� ���������
���������������������� ���
�����
������� ����������������� ��� ��������� ���
��� ������ �����������
�����
��� ����������������������
�����
���������
�������
�����������
�����
�����������������
��������������������������
������
�����
�������
������������
�����
������� ��
������
�����
������
������
������
�����
�����
���������
�������������������������� ����������� �� �� ���� ���� �� �� �� �� �� ���� �� �� ���� ���� ��
����
��������������� ��
�������������������
���������������������������������������� ��
������������������������������������������
�����
���� ��������������������������������
��������������������������
��������������������
����������������������
����������������� ��� ������ ��
��� ���������
������������������������������ ��
������������������������������������������������
�������������������������������������������������� �����
���������������
������� ������ ��0
0.2
0.4
0.6
0.8
1
140 160 180 200 220 240 260 280
��������������������������������
��������������������������������
��������������������������������
��������������������������������
��������������������������������
��������������������������������
��� ��� ��� Detent 5���� �� Detent 15
��������
���� Detent 20
��� ��������� ������ Detent 25�� ������ ���� Detent 30
Cu
mu
lati
ve P
rob
ab
ilit
y
Calibrated Airspeed (Knots)
���������
���������
� ��������
���������
���������
B-767-200ER
��� ��� ��������� ������������� ������������������ ��� �����
�����������
�����
��� �����������������
�������
�������
�������
��������
�������
������
������
���������
���������
��������
�����������
���������
�������
�������
���������
��������
����������
��������
��������
�������
�������
�������
��������
��������
��������
�������������
����������������
������������������������
����������������� ������������ ���� ��
�����
����������
������
�������
�������
���
��������
���� ����
����������
�����
�������
�������
�������
�����
�������
������
������
����
�������
�������
������
�������
�������
�����
����
�������
�����
����
������
�����
����
��������
�����
��������������
�����
������������� ����
�������������
�������������
�������������
������������
������������
0
0.2
0.4
0.6
0.8
1
140 160 180 200 220 240 260
�������������������������������
�������������������������������
�������������������������������
�������������������������������
�������������������������������
�������������������������������
�������������������������������
��� ��� ��� Detent 5
�������� ���� Detent 15
�����
����� Detent 20
�� ������ ���� Detent 25
Cu
mu
lati
ve P
rob
ab
ilit
y
Calibrated Airspeed (Knots)
�������������
�������������
�������������
�������������
�������������
B-767-200ER
A-39
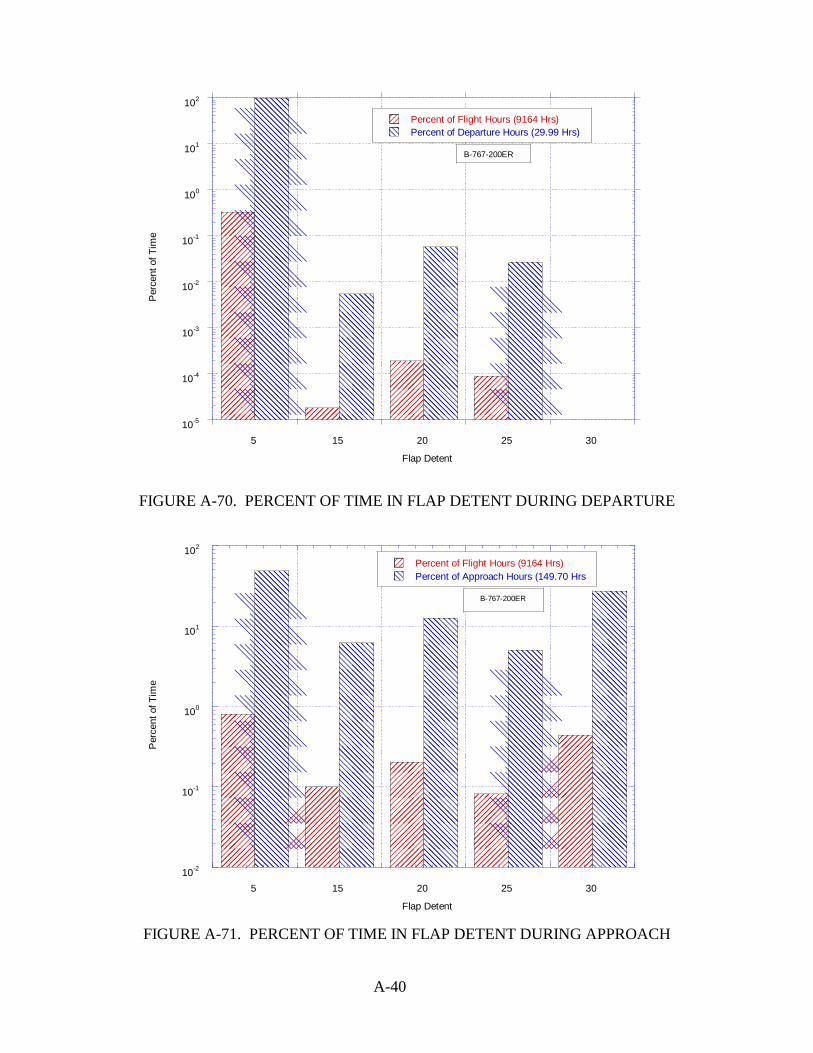
FIGURE A-70. PERCENT OF TIME IN FLAP DETENT DURING DEPARTURE
FIGURE A-71. PERCENT OF TIME IN FLAP DETENT DURING APPROACH
�������
�������
������������
������������
������������
����
����
����
����������
����������
�����
�����
�����������
�����������
����
����
���������
���������
���������
������
������
������
������������
������������
10-2
10-1
100
101
102
5 15 20 25 30
� Percent of Flight Hours (9164 Hrs)
�
Percent of Approach Hours (149.70 Hrs
Per
cent
of T
ime
Flap Detent
B-767-200ER
���������
���������
��������������
��������������
��������������
������
������
������
����
����
��������
��������
���
���
�������
�������
�������
10-5
10-4
10-3
10-2
10-1
100
101
102
5 15 20 25 30
� Percent of Flight Hours (9164 Hrs)
�� Percent of Departure Hours (29.99 Hrs)
Per
cent
of T
ime
Flap Detent
B-767-200ER
A-40

FIG
UR
E A
-72.
CU
MU
LA
TIV
E P
RO
BA
BIL
ITY
OF
MA
XIM
UM
SP
EE
D D
UR
ING
SP
EE
D B
RA
KE
DE
PL
OY
ME
NT
FIG
UR
E A
-73.
CU
MU
LA
TIV
E F
RE
QU
EN
CY
OF
SP
EE
D A
TS
PE
ED
BR
AK
E D
EP
LO
YM
EN
T
A-41
������������������������������������������������������������������������������������������������������������������������������������������������������������� ���� ����� ������ �������������������
����������������������������������������������������������������������������������� ���������
������������������������������������
�����
�����
������������������������������������������������������������
�����
�����
������ ��� ������������������������������������������������������������� ����� ���������
�������������������������������� ������
���������������������������� ������
������������������������ ���������
����������
������������������� ���������
�����
����
�����
������������� �������������
�������������
���������� ����� ����� ��� ��� ������
�����������
������ ����
����
����
����
10-4
10-3
10-2
10-1
100 10
015
020
025
030
035
040
0
Cal
ibra
ted
Airs
peed
- k
nots
Cumulative Probability
���������������������������������������������
���������������������������������������������
���������������������������������������������
���������������������������������������������
B-7
67-2
00E
R14
87 D
eplo
ym
ents
1285
Flig
hts
���������������������������������������������������������������������������������������������������������������������������������������������������������������������������������������������������������������������������������������������������� �������� �������� ���������
�����
�����
����������������������������������������������������� �������� ��������
��������������������������������������������������������������������� ���� ����� ����������������������
�������������������������������������� ������ �������������������
����������������������� �������� ��������
��������������������������� ���������
������������������� ������������������
������
������� ������������ ���������������
������������������� ��� ��������������� ��������
�� � � ����� ��� ��� ���������
������
������
10-4
10-3
10-2
10-1
100
101 10
015
020
025
030
035
040
0
Cal
ibra
ted
Airs
peed
- k
nots
Cumulative Occurrences per Flight
�������������������������������������
�������������������������������������
�������������������������������������
�������������������������������������
B-7
67-2
00E
R12
85 F
light
s14
87 D
eplo
ym
ents

FIG
UR
E A
-74.
CU
MU
LA
TIV
E F
RE
QU
EN
CY
OF
AL
TIT
UD
EA
T S
PE
ED
BR
AK
E D
EP
LO
YM
EN
TF
IGU
RE
A-7
5. C
UM
UL
AT
IVE
PR
OB
AB
ILIT
Y O
FM
AX
IMU
M D
EP
LO
YM
EN
T A
NG
LE
DU
RIN
G S
PE
ED
BR
AK
E D
EP
LO
YM
EN
T, F
LA
PS
RE
TR
AC
TE
D
A-42
��������������������������������������������������������
������������������������
��������������������� �������
��������������
���������������������������������������
��������� ��������������������������������
�������� ���������������������������� ����������
�����������������������������
�������������������������������
������� �������������������������
����
������
������������������ ��������
���������������
������������ ������
��������
����������
������������� ��� ��� ��� ���
�������
10-3
10-2
10-1
100
101
050
0010
000
1500
020
000
2500
030
000
3500
040
000
Alti
tude
(F
eet)
Cumulative Occurrences per Flight
�������������������������������������
�������������������������������������
�������������������������������������
�������������������������������������
B-7
67-2
00E
R12
85 F
light
s14
87 D
eplo
ym
ents
���������������������������������������������������������������������������� ����
����������������������������������������������
��������������������������������
��������� �������������������� ��������
�������������
�������� �����������
��������� ��� ������� ���� ��������
������
�������� ��� ��� ������� ���� ���� ���� ����
������
�����
�����
�����
�����
0
0.1
0.2
0.3
0.4
0.5
0.6
0.7
0.8
0.91
020
4060
8010
0
Dep
loym
ent A
ngle
(D
egre
es)
Cumulative Probability
�������������������������������������
�������������������������������������
�������������������������������������
B-7
67-2
00E
R12
85 F
light
s14
87 D
eplo
ym
ents

FIG
UR
E A
-76.
CU
MU
LA
TIV
E F
LIG
HT
HO
UR
S F
OR
CO
INC
IDE
NT
SP
EE
D B
RA
KE
DE
FL
EC
TIO
NA
ND
FL
AP
HA
ND
LE
PO
SIT
ION
������������������������������
������������������������������
������������������������������
������������������������������
������������������������������
������������������������������
������������������������������
������������������������������
������������������������������
�������������������������������
�������������������������������
�������������������������������
����������������������������
����������������������������
����������������������������
����������������������������
����������������������������
����������������������������
�����������������������������������������
�����������������������������������������
�����������������������������������������
������������������������������
������������������������������
������������������������������
������������������������������
������������������������������
������������������������������
������������������������������
������������������������������
������������������������������
������������������������������
������������������������������
������������������������������
�������������������������������
�������������������������������
�������������������������������
�������������������������������
����������������������������
����������������������������
����������������������������
����������������������������
����������������������������
����������������������������
����������������������������
����������������������������
�����������������������������������������
�����������������������������������������
�����������������������������������������
�����������������������������������������
������������������������������
������������������������������
������������������������������
������������������������������
������������������������������
������������������������������
������������������������������
������������������������������
������������������������������
�������������������������������
�������������������������������
�������������������������������
����������������������������
����������������������������
����������������������������
����������������������������
����������������������������
����������������������������
�����������������������������������������
�����������������������������������������
�����������������������������������������
������������������������������
������������������������������
������������������������������
������������������������������
������������������������������
������������������������������
������������������������������
������������������������������
������������������������������
�������������������������������
�������������������������������
�������������������������������
����������������������������
����������������������������
����������������������������
����������������������������
����������������������������
����������������������������
�����������������������������������������
�����������������������������������������
�����������������������������������������
������������������������������
������������������������������
������������������������������
������������������������������
������������������������������
������������������������������
������������������������������
������������������������������
������������������������������
������������������������������
������������������������������
������������������������������
�������������������������������
�������������������������������
�������������������������������
�������������������������������
����������������������������
����������������������������
����������������������������
����������������������������
����������������������������
����������������������������
����������������������������
����������������������������
�����������������������������������������
�����������������������������������������
�����������������������������������������
�����������������������������������������
������������������������������
������������������������������
������������������������������
������������������������������
������������������������������
������������������������������
������������������������������
������������������������������
������������������������������
�������������������������������
�������������������������������
�������������������������������
����������������������������
����������������������������
����������������������������
����������������������������
����������������������������
����������������������������
�����������������������������������������
�����������������������������������������
�����������������������������������������
������������������������������
�� ����������������������������
������������������������������
������������������������������
��� ���������������������������
������������������������������
������������������������������
������������������������������
������������������������������
�������������������������������
���� ���������������������������
�������������������������������
����������������������������
� ���������������������������
����������������������������
����������������������������
� ���������������������������
����������������������������
�����������������������������������������
��� ��������������������������������������
�����������������������������������������
������������������������������
������������������������������
������������������������������
������������������������������
������������������������������
������������������������������
������������������������������
������������������������������
������������������������������
������������������������������
������������������������������
������������������������������
�������������������������������
�������������������������������
�������������������������������
�������������������������������
����������������������������
����������������������������
����������������������������
����������������������������
����������������������������
����������������������������
����������������������������
����������������������������
�����������������������������������������
�����������������������������������������
�����������������������������������������
�����������������������������������������
������������������������������
������������������������������
������������������������������
������������������������������
������������������������������
������������������������������
������������������������������
������������������������������
������������������������������
�������������������������������
�������������������������������
�������������������������������
����������������������������
����������������������������
����������������������������
����������������������������
����������������������������
����������������������������
�����������������������������������������
�����������������������������������������
�����������������������������������������
������������������������������
������������������������������
������������������������������
������������������������������
������������������������������
������������������������������
������������������������������
������������������������������
������������������������������
�������������������������������
�������������������������������
�������������������������������
����������������������������
����������������������������
����������������������������
����������������������������
����������������������������
����������������������������
�����������������������������������������
�����������������������������������������
�����������������������������������������
������������������������������
������������������������������
������������������������������
������������������������������
������������������������������
������������������������������
������������������������������
������������������������������
������������������������������
������������������������������
������������������������������
������������������������������
�������������������������������
�������������������������������
�������������������������������
�������������������������������
����������������������������
����������������������������
����������������������������
����������������������������
����������������������������
����������������������������
����������������������������
����������������������������
�����������������������������������������
�����������������������������������������
�����������������������������������������
�����������������������������������������
������������������������������
������������������������������
������������������������������
������������������������������
������������������������������
������������������������������
������������������������������
������������������������������
������������������������������
�������������������������������
�������������������������������
�������������������������������
����������������������������
����������������������������
����������������������������
����������������������������
����������������������������
����������������������������
�����������������������������������������
�����������������������������������������
�����������������������������������������
������������������������������
�� ����������������������������
������������������������������
������������������������������
��� ���������������������������
������������������������������
������������������������������
������������������������������
������������������������������
�������������������������������
���� ���������������������������
�������������������������������
����������������������������
� ���������������������������
����������������������������
����������������������������
� ���������������������������
����������������������������
�����������������������������������������
��� ��������������������������������������
�����������������������������������������
De
ten
t 3
0
������������������������������
De
ten
t 2
5
��������������������������������� �� ��
De
ten
t 1
5
���������������������������������� ��� ���
De
ten
t 5
�����������������������������������
�����
����
De
ten
t 1
�����������������������������
����
����
����
De
ten
t 0
�����������������������������
�����
�����
�����
B-7
67
-20
0E
R1
28
5 F
ligh
ts
�������������������������������������������� �� ��
0.0
53
75
������������������������������
0.0
05
00
��������������������������������� �� �� ��
0.0
15
56
���������������������������������� ��� ��� ���
0.0
10
56
�����������������������������������
�����
����
����
0.0
41
11
�����������������������������
����
����
����
����
6.8
34
36
�����������������������������
�����
�����
�����
�����
0.0
�������������������������������������������� �� �� ��
0.0
00
00
������������������������������
0.0
00
00
��������������������������������� �� ��
0.0
00
00
���������������������������������� ��� ���
0.0
00
00
�����������������������������������
�����
����
0.2
35
36
�����������������������������
����
����
����
52
.72
78
6
�����������������������������
�����
�����
�����
1.0
�������������������������������������������� �� ��
0.3
83
14
������������������������������
0.4
81
08
��������������������������������� �� ��
2.0
57
58
���������������������������������� ��� ���
1.6
79
61
�����������������������������������
�����
����
39
.35
47
2
�����������������������������
����
����
����
65
00
.56
34
8
�����������������������������
�����
�����
�����
2.5
�������������������������������������������� �� ��
1.5
93
06
������������������������������
0.9
31
89
��������������������������������� �� �� ��
3.8
62
28
���������������������������������� ��� ��� ���
3.9
19
67
�����������������������������������
�����
����
����
37
.67
44
7
�����������������������������
����
����
����
����
23
78
.42
79
8
�����������������������������
�����
�����
�����
�����
5.0
�������������������������������������������� �� �� ��
0.7
78
86
������������������������������
0.1
43
33
��������������������������������� �� ��
0.3
62
03
���������������������������������� ��� ���
0.2
88
14
�����������������������������������
�����
����
0.7
75
19
�����������������������������
����
����
����
8.5
71
42
�����������������������������
�����
�����
�����
7.5
�������������������������������������������� �� ��
8.9
57
19
������������������������������
1.5
77
33
��������������������������������� �� ��
2.7
36
94
���������������������������������� ��� ���
0.7
21
42
�����������������������������������
�����
����
3.6
55
81
�����������������������������
����
����
����
2.4
29
03
�����������������������������
�����
�����
�����
10
.0
�������������������������������������������� �� ��
28
.68
47
5
������������������������������
4.3
58
44
��������������������������������� �� �� ��
9.3
77
31
���������������������������������� ��� ��� ���
2.1
60
28
�����������������������������������
�����
����
����
7.9
44
89
�����������������������������
����
����
����
����
7.4
63
25
�����������������������������
�����
�����
�����
�����
15
.0
�������������������������������������������� �� �� ��
0.1
56
19
������������������������������
0.0
46
03
��������������������������������� �� ��
0.0
77
03
���������������������������������� ��� ���
0.0
48
97
�����������������������������������
�����
����
0.4
31
03
�����������������������������
����
����
����
0.9
60
47
�����������������������������
�����
�����
�����
20
.0
�������������������������������������������� �� ��
0.0
03
06
������������������������������
0.0
00
92
��������������������������������� �� ��
0.0
17
58
���������������������������������� ��� ���
0.0
08
97
�����������������������������������
�����
����
0.2
16
86
�����������������������������
����
����
����
1.2
60
39
�����������������������������
�����
�����
�����
25
.0
�������������������������������������������� �� ��
0.0
02
61
������������������������������
0.0
01
39
��������������������������������� �� �� ��
0.0
15
28
���������������������������������� ��� ��� ���
0.0
17
69
�����������������������������������
�����
����
����
0.1
12
58
�����������������������������
����
����
����
����
0.8
21
39
�����������������������������
�����
�����
�����
�����
30
.0
�������������������������������������������� �� �� ��
0.0
00
92
������������������������������
0.0
00
92
��������������������������������� �� ��
0.0
20
00
���������������������������������� ��� ���
0.0
03
89
�����������������������������������
�����
����
0.0
88
89
�����������������������������
����
����
����
1.0
60
39
�����������������������������
�����
�����
�����
35
.0
�������������������������������������������� �� ��
0.0
09
64
0.0
52
58
�� �� ��
0.2
47
28
��� ��� ���
0.3
63
58
����
����
����
5.0
97
33
����
����
����
31
.16
98
6�����
�����
�����
40
.0
�� �� ��
���������������������������������������������������������������������������������������������������������������������������������������������������������������������������������������������������������������
���� ���� ���� ���� ���� ���� ���� ���� ���� ���� ���� ���� ���� ���� ���� ���� ���� ���� ���� ���� ���� ���� ���� ���� ���� ���� ���� ���� ���� ���� ���� ������������������������������������������������������������������������������������������������������������������������������������������������������������������������������������������������������������������ ��� ��� ��� ��� ��� ��� ��� ��� ��� ��� ��� ��� ��� ��� ��� ��� ��� ��� ��� ��� ��� ��� ��� ��� ��� ��� ��� ��� ��� ���
Fla
p D
eten
t Set
ting
Speed Brake Deflection (degrees)
A-43
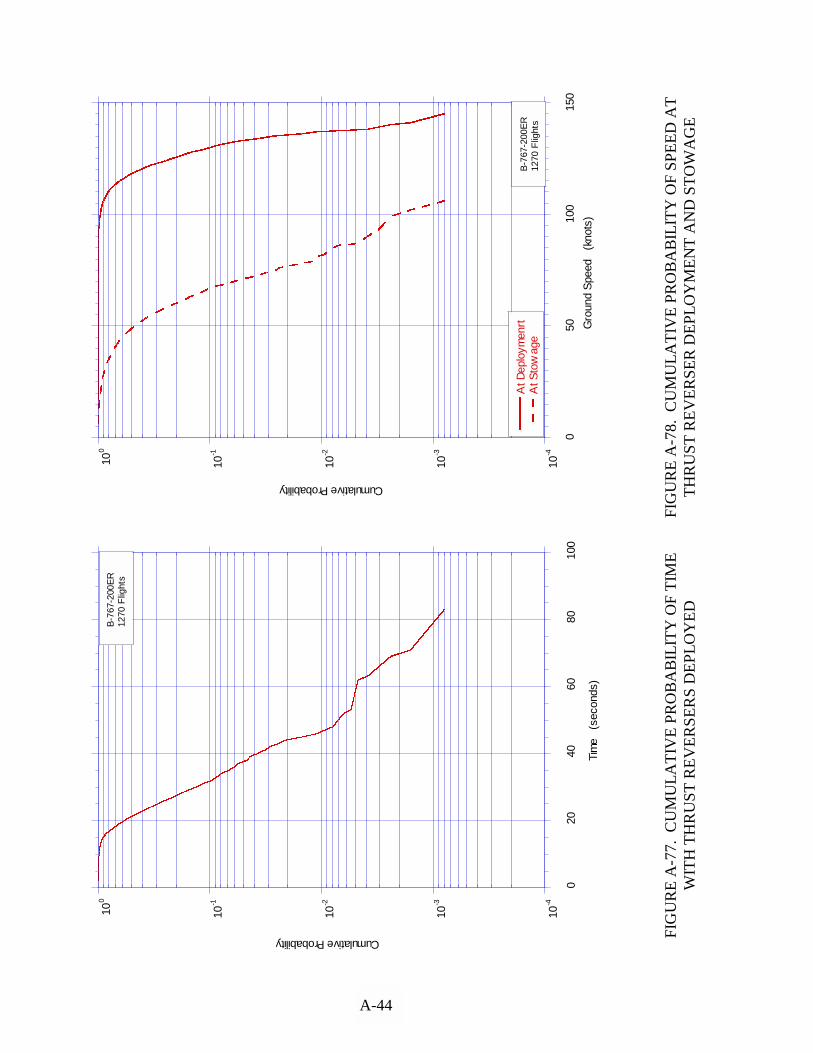
FIG
UR
E A
-77.
CU
MU
LA
TIV
E P
RO
BA
BIL
ITY
OF
TIM
EW
ITH
TH
RU
ST
RE
VE
RS
ER
S D
EP
LO
YE
DF
IGU
RE
A-7
8. C
UM
UL
AT
IVE
PR
OB
AB
ILIT
Y O
F S
PE
ED
AT
TH
RU
ST
RE
VE
RS
ER
DE
PL
OY
ME
NT
AN
D S
TO
WA
GE
A-44
����������������������������������������������������������� ��������
������� ��������������� ��������
��� �����������
����������� ��������
�������
��������������
�������������������
�������������� �������
���������� �������
�������
������������� ��������
����������� �������
��������
�������������������������������
�������������������
����
������������
������������
������������ �������
�������������������������
������������������
������������������
������������������
10-4
10-3
10-2
10-1
100
020
4060
8010
0
Cumulative Probability
Tim
e (
seco
nds)
�����������������������������������������
�����������������������������������������
�����������������������������������������
B-7
67-2
00E
R12
70 F
light
s
�����������������������������������������������������������������������������������������������������������������������������������������������������������������������
������� ������������������������ �����������
���������� �����������
������
���������� �����������
��������������� ���������� ��������
�������� ����� ��� ������� ��������
������
�����������
�������� �� �� �� ������ ���� ���� ����
����������� ����
������
�����
�������������������������������������������������������� ������� ��������
������������������
����������������� ��������
������ ��������
����� ���������� ���������� ����
��� �����������
������� ������� �����������
��� ����� ���������
������������� ����
�������� ������
������
�����
����� ������ ����
�������� ����
�������� ��� �����
������� ��
10-4
10-3
10-2
10-1
100
050
100
150
���������������������������������������������������
���������������������������������������������������
���������������������������������������������������
�����������������
At D
eplo
ymen
rt
������������
At S
tow
age
Cumulative Probability
Gro
und
Spe
ed
(kno
ts)
�������������������������������������
�������������������������������������
�������������������������������������
B-7
67-2
00E
R12
70 F
light
s

FIG
UR
E A
-79.
CU
MU
LA
TIV
E P
RO
BA
BIL
ITY
OF
PE
RC
EN
TO
F N
1 A
T T
AK
EO
FF
FIG
UR
E A
-80.
CU
MU
LA
TIV
E P
RO
BA
BIL
ITY
OF
PE
RC
EN
TO
F N
1 D
UR
ING
LA
ND
ING
RO
LL
, AT
TH
RU
ST
RE
VE
RS
ER
DE
PL
OY
ME
NT
, AN
D D
UR
ING
TH
RU
ST
RE
VE
RS
ER
DE
PL
OY
ME
NT
A-45/A-46
��������������������������������������������������
�������������������� ������������
�����������
������� ����� ��� ������ ������� ���� ���� ��������
������
�����
����������
�����
������� �� �� �� ��
���� �������� �������
��������
�����
����� ������ �������� ������
�����
����
�������� ����� ���������� ����
������ ���� ������ ����
�����������
�������� ������� ��� ���� ��������
�������� ���� ����
�
��������� ����� �������
�������� ������������������������������������������������������������������ ����
������������� ����
�������� ����
���� �������� ��������� �������� �������� ���������������
������� ���� ���� ������ ������ ������ ����� ������ ��������� ��������� ��������� ������ ���
10-4
10-3
10-2
10-1
100
20
40
60
80
10
01
20
���������������������������������������������������������������������������������������
���� �����������������������������������������������������������������������������������
���������������������������������������������������������������������������������������
���������������������������������������������������������������������������������������
�������������� D
uri
ng
La
nd
ing
Ro
ll
�������������
At
Th
rust
Re
vers
er
De
plo
yme
nt
����������������� D
uri
ng
Th
rust
Re
vers
er
De
plo
yme
nt
Cumulative Probability
Pe
rce
nt
N1
�����������������������������
�����������������������������
�����������������������������
�����������������������������
B-7
67
-20
0E
R1
27
0 F
ligh
ts
������������������������������������������������������������������������������������������������������������� ��������
�������������������������������������
����
�����
�������������������
���������
������������� ������
�����
������
����������
���������
�������������
�����������
����������
���������
�����
�������� ������
�����
����������
���������������
�����
����� ��� ��� ��� ��� ���
10-4
10-3
10-2
10-1
100
85
90
95
10
01
05
Cumulative Probability
Pe
rce
nt
N1
���������������������������
���������������������������
���������������������������
���������������������������
B-7
67
-20
0E
R1
28
5 F
ligh
ts

B-1
APPENDIX B GREAT CIRCLE DISTANCE CALCULATION
Given:
Latitude and Longitude ρ = distance from centerof Departure and ϕ = angle from North PoleDestination Airports θ = angle E/W of prime meridian
Procedure: (see sketch)
The standard mathematical system for spherical coordinates is shown, where three variablesspecify location: ρ, ϕ, and θ.
Let a = Great Circle Distance in angular measure.
Latitude is measured away from the Equator (0°) to the North Pole (+90°) and the South Pole(-90°); whereas in the standard spherical coordinate system, the North Pole, Equator, and SouthPole lie at 0°, 90°, and 180°, respectively. Therefore,
ϕ = 90° - latitude
transforms latitude readings into equivalent angles (ϕ) in the standard spherical coordinatesystem.
Then
b = 90° - LatitudeDep
c = 90° - LatitudeDes
where b and c are values of ϕ for the departure and destination locations, respectively.

B-2
Longitude is measured away from the prime meridian (0°). Longitudes to the east are positiveand to the west negative. However, the standard spherical coordinate system measures its anglesin the opposite direction. Therefore,
θ = - longitude
transforms longitude readings into equivalent angles (θ) in the standard spherical coordinatesystem.
Then
A = (- LongitudeDes) - (- LongitudeDep)= LongitudeDep - LongitudeDes
where A is the value of θ between the departure and destination locations.
The following equation, based on the spherical coordinate system, allows the computation of theGreat Circle Distance, a. (Law of cosines for oblique spherical triangles)
cos a = cos b cos c + sin b sin c cos A
Substituting for b, c, and A from the above equalities,
cos a = cos (90° - LatDep) cos (90° - LatDes)+ sin (90° - LatDep) sin (90° - LatDes) cos (LonDep - LonDes)
Since
cos (90° - LatDep) = sin LatDep
cos (90° - LatDes) = sin LatDes
sin (90° - LatDep) = cos LatDep
sin (90° - LatDes) = cos LatDes
by replacement one obtains
cos a = sin (LatDep) sin (LatDes) + cos (LatDep) cos (LatDes) cos (LonDes - LonDep)
Thus a, the angular measure of the great circle arc connecting the departure and destinationlocations, is obtained as
a = cos-1 [sin (LatDep) sin (LatDes) + cos (LatDep) cos (LatDes) cos (LonDes - LonDep)]
So, for a expressed in radians
GCD aa=
=
radians
radians nm
180 60
1
1
1
10800deg. min.
deg. min.π πnm
and for a expressed in degrees,
GCD a a=
=degrees
nmnm
60
1
1
160
min.
deg. min.