Size-Specific Dose Estimates (SSDE) in Pediatric and Adult Body ...

Dose Optimization in
Pediatric Nuclear Medicine
Frederic H. Fahey DSc
Boston Children’s Hospital
Harvard Medical School
Thanks to S. James Adelstein, S. Ted Treves,
Keith Strauss, Matthew Palmer,
Marilyn Goske, James Brink

Outline
• Pediatric Imaging
• Radiation Risk
• Dosimetry and Dose Optimization
– Radiopharmaceuticals
– Hybrid Imaging
• Communication of Risk
• Image Gently
• Image Wisely (Works In Progress)

Pediatric Lesson 1 Children are not just small adults!

1980-1982 2006
Natural Background
CT
Radiol & Fluoro
Interventional
NM
Other NonMedical
Medical 0.5 mSv
Total 3.1 mSv Medical 3.0 mSv
Total 5.5 mSv
Estimated Annual Per Capita Adult Effective Dose in US
CT CT
NM NM
from NCRP 160

Nuclear Medicine Procedures in the US
0
4
8
12
16
20
1980 1985 1990 1995 2000 2005 2010
Nu
mb
er
of
Nu
cle
ar
Me
dic
ine
Pro
ce
du
res
in
US
(m
illi
on
s)
NCRP 160

R. Fazel et al., Exposure to Low-Dose
Ionizing Radiation from Medical Imaging
Procedures. NEJM 2009; 361:841-843
• Studied insurance records of over 900,000 patients (18-
65 YO) over 3 years
• 69% had at least 1 radiologic exam
• Annual effective dose
– Mean 2.4 6.0 mSv
– Median 0.1 mSv (inter-quartile range 0.1-1.7 mSv)
– 78.6% < 3 mSv; 19.4% 3-20 mSv
– 1.9% 30-50 mSv; 0.2% >50 mSv

R. Fazel et al., NEJM 2009; 361:841-843
Procedure Ave ED (mSv) Ann’l ED per cap % Total ED
1. Myo Perf Img 15.6 0.540 22.1
2. CT Abdomin 8 0.446 18.3
3. CT Pelvis 6 0.297 12.2
4. CT Chest 7 0.184 7.5
5. Dx Card Cath 7 0.113 4.6
6. Rad Lumbar 1.5 0.080 3.3
7. Mammo 0.4 0.076 3.1
8. CT Ang Chest 15 0.075 3.1
12. Bone Scan 6.3 0.035 1.4
17. Thyroid Uptk 1.9 0.016 0.7
PET or PET/CT not in Top 20

A. Dorfman et al., Use of Medical Imaging
Procedures with Ionizing Radiaion in Children. Arch
Pediatr Adolesc Med. Published online.
• Insurance records of 355,000 children (under 18 YO) over
3 years
• Number and type of exams, not dose
• 42.5% of children had a radiologic procedure
• Ave of 7 radiologic exams by 18 YO
• 84.7% radiography, 11.9% CT, 2.5% fluoro, 0.9% NM
• 4 NM studies per yr per 1000 children (bone, thyroid)

From the Life Span Study (LSS) of the Radiation Effects
Research Foundation atom bomb survivors we have
learned about the time course of cancer appearance after
a single acute dose of radiation – in the next decade we
will learn more from those exposed in early childhood.

Cancer Mortality (Solid Tumors)
from Lifespan Study (1950-2003)
Ozasa et al., Rad Research 2012;177:229-243.

Most national and international bodies (ICRP,NCRP)
have based their low dose (<100 mSv) risk estimates
on linear extrapolation of the higher dose data. This
report states that there is a significant trend in this range,
consistent with that observed for the full dose range.
Ozasa et al., Rad Research 2012;177:229-243.

Radiation exposure from CT scans in childhood
and subsequent risk of leukemia and brain
tumours: a retrospective cohort study. Lancet
2012;380:499-505.
• Over 170,000 children (< 22 YO) studied from 1985 to
2002 within the UK National Health Service
• CT doses estimated for standard children (0, 5, 10, 15, 20
YO) using typical exposure parameters and Monte Carlo
simulations
• 74 and 135 cases of leukemia and brain tumors in 177,000
patients, respectively with a dose response relationship.
• Relative risks of 3.2 and 2.8 for leukemia and brain tumor,
respectively.

Neoplastic transformation of human
fibroblasts dips below background
frequency at low doses
Ko et al 2006

Induction of mutations in bystander cells
by an alpha-particle microbeam
(Bystander Effect)
Hall 2004

This, in turn, has led to the battle of the national academies:
From BEIR VII – National Academies of the USA
…current scientific evidence is consistent with the
hypothesis that there is a linear, no-threshold dose-
response relationship between exposure to ionizing
radiation and the development of cancer in humans
From Académie des Science – Institut de France
While LNT may be useful for the administrative
organization of radioprotection, its use for assessing
carcinogenic risks, induced by low doses, such as those
delivered by diagnostic radiology or the nuclear industry,
is not based on valid scientific data.

Lifetime Attributable Risk
10 mGy in 100,000 exposed persons (BEIR VII Phase 2, 2006)
All Solid Tumors Leukemia
Male Female Male Female
Excess Cases 80 130 10 7
Excess Deaths 41 61 7 5
Note: About 45% will contract cancer and 22% will die.

0 10 20 30 40 50 60 70 80
Age at Exposure
0
1000
2000
3000
4000
5000 L
ifeti
me a
ttri
bu
tab
le c
an
cer
risk p
er
10
6 in
div
idu
als
exp
osed
to
10 m
Gy
Female
Male
Lifetime Attributable Risk
10 mGy in 1,000,000 exposed persons (Based on BEIR VII Phase 2, 2006)

• Injected activity
– Total counts and imaging time
• Choice of camera
– Detector thickness and material
– Number of detectors
• Choice of collimator
– Hi Sens, Gen Purpose, Hi Res, Pinhole
• Image processing and reconstruction
Factors Affecting Dose in
NM and SPECT

Patient Effective Dose (mSv)
Summary 1 Year 5 Year 10 Year 15 Year Adult
Mass (kg) 9.7 19.8 33.2 56.8 70
Tc-MDP (20 mCi*) 2.8 2.9 3.9 4.2 4.2
Tc-ECD (20 mCi*) 4.1 4.6 5.3 5.9 5.7
Tc-MAG3 (10 mCi*) 1.2 1.3 2.2 2.8 2.7
*max admin activ ICRP 80 and 106

Planar Image Processing
99mTc DMSA Pinhole Images in 3 month old
Original Processed with
Adaptive Filtering

Original Study (100 % image counts)
50% Subsampled Study 50% Subsampled Study + NR
30% Subsampled Study 30% Subsampled Study + NR
10% Subsampled Study 10% Subsampled Study + NR
20% Subsampled Study 20% Subsampled Study + NR
Hsiao E et al. Radiology
2011; 261:907-915
99mTc MAG3 Study

NR: noise reduction Hsiao E et al. Radiology 2011; 261:907-915

99mTc Disofenin Hepatobiliary Studies
for Biliary Atresia
29 day old, 3.9 kg baby girl
Original Full Dose
18.5 MBq (0.5 mCi)
Simulat Dose Reduction
3.0 MBq (0.08 mCi)
16% of full
Simulat Dose Reduction
Adaptive Filtering

99mTc Disofenin Hepatobiliary Studies
for Biliary Atresia
30
40
50
60
70
80
90
100
Full Dose Reduced Dose Reduced with
Adaptive Filtering

Iterative Reconstruction
• Longer
• Can be more accurate
• Incorporate noise properties
• Incorporate physics (like collimator spatial
resolution recovery)

Use of OSEM-3D Reconstruction
In SPECT
FBP Full Cts OSEM Half Cts
FBP Full Cts OSEM Full Cts OSEM Half Cts Sheehy et al. Radiol 2009;
251:511-516 Stansfield et al. Radiol 2010;
257:793-801

• Injected activity
– Total counts and imaging time
• Choice of scanner
– Crystal material and thickness
– 2D vs 3D
– Axial field of view
• Image processing
Factors Affecting Dose in PET
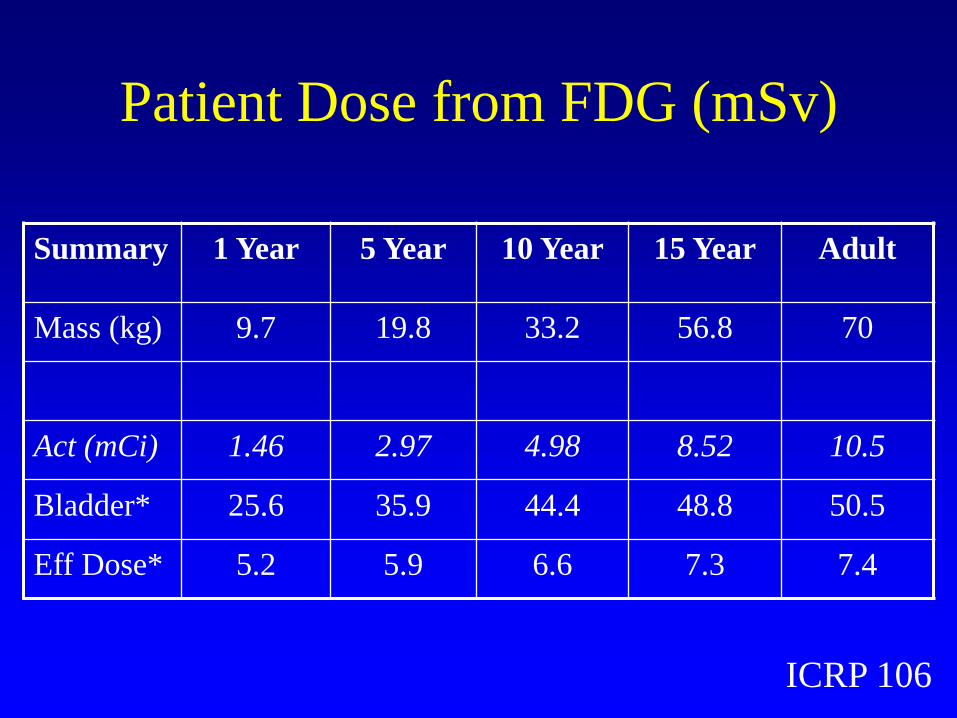
Patient Dose from FDG (mSv)
Summary 1 Year 5 Year 10 Year 15 Year Adult
Mass (kg) 9.7 19.8 33.2 56.8 70
Act (mCi) 1.46 2.97 4.98 8.52 10.5
Bladder* 25.6 35.9 44.4 48.8 50.5
Eff Dose* 5.2 5.9 6.6 7.3 7.4
ICRP 106

Factors Affecting Radiation Dose in
Multi-Detector CT
• Tube current or time (α mAs)
• Reduce tube voltage (α kVp2)
• Beam collimation
• Pitch (table speed) (α 1/pitch)
• Patient size
• Region of patient imaged

CIRS Tissue Equivalent Phantoms
Phantom AP x Lat
(cm)
Circum
(cm)
Newborn 9 x 10.5 32
1 Year Old 11.5 x 14 42
5 Year Old 14 x 18 53
10 Year
Old
16 x 20.5 61
Med Adult 25 x 32.5 96
•Dosimetric CT phantoms
•Simulated spine
•Five 1.3 cm holes
•Five different sizes Fahey et al. Radiology 2007;243:96-104

Dosimetry of PET-CT
and SPECT-CT
• PET/CT
–GE Discovery LS
• SPECT/CT
–Philips Precedent

CTDIvol (160 mA, 0.8 s, 1.5:1 pitch)
0.00
5.00
10.00
15.00
20.00
25.00
30.00
70 90 110 130 150
Tube Voltage (kVp)
CT
AD
Ivo
l (m
Gy) New Born
1 Year Old
5 Year Old
10 Year Old
Med Adult
Dose from CT of PET-CT
GE Discovery LS (4-slice)
ED from
10 mCi of FDG
5-7 mSv

Median Effective Dose Values Review of Published Results
Head CT 1.9 mSv (0.3-8.2)
Chest CT 7.5 mSv (0.3-26.0)
Abdomen CT 7.9 mSv (1.4-31.2)
Pelvis CT 7.6 mSv (2.5-36.5)
Abd & pelvis CT 9.3 mSv (3.7-31.5)
Pantos et al., Brit J Radiol 2011;84:293-303
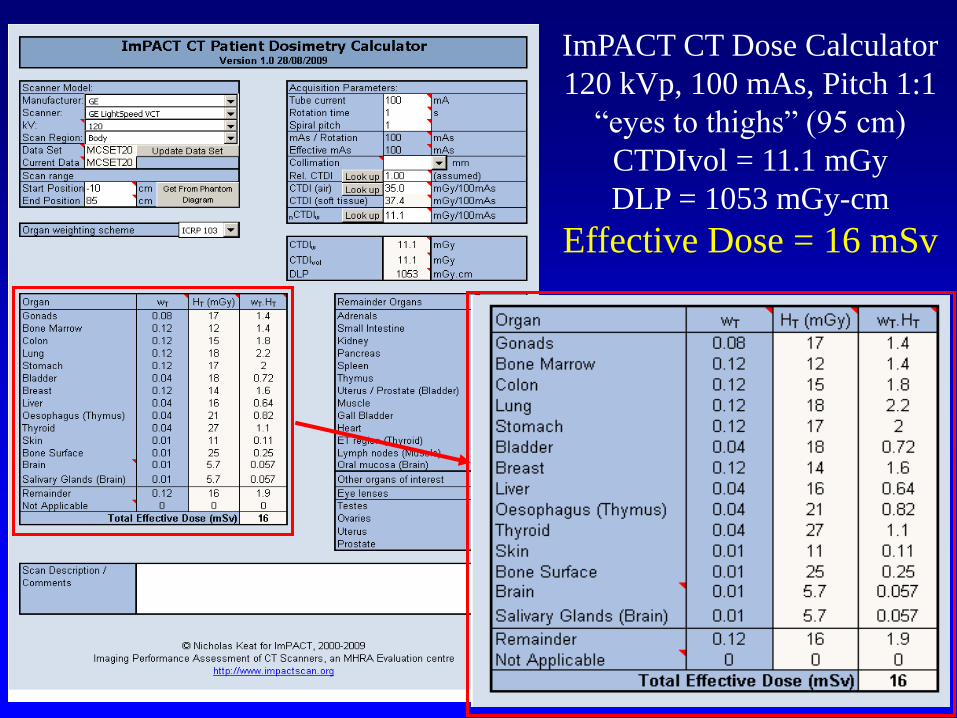
ImPACT CT Dose Calculator
120 kVp, 100 mAs, Pitch 1:1
―eyes to thighs‖ (95 cm)
CTDIvol = 11.1 mGy
DLP = 1053 mGy-cm
Effective Dose = 16 mSv

Organ and effective doses in pediatric
patients undergoing helical multislice
computed tomography examination
Lee et al. Med Phys 2007;34:1858-1873
Estimated organ and
effective doses from
helical CT for 5
phantoms and the
MCNPX Monte Carlo
photon transport code

Lee et al. Med Phys 2007;34:1858-1873
Organ 9 MO (M) 4 YO (F) 11 YO (M) 14 YO (M)
Bone marrow 6.02 6.64 7.33 7.62
Lungs 15.95 14.75 12.74 13.04
Stomach 15.62 14.13 12.71 10.73
Muscle 8.20 7.68 5.93 5.40
Breast 10.67
Gonads 12.66 14.39 8.15 7.83
CAP CT exam, 120 kVp, 100 mAs
12 mm beam thickness, 1:1 Pitch
(Dose in mGy)

CT-Based Attenuation Correction
• Acquire CT Scan and reconstruct
• Apply energy transformation
• Reproject to generate correction matrix
• Smooth to resolution of PET/SPECT
• Apply during reconstruction

Quality of CTAC
80 kVp
10 mA
0.5 s/rot
1.5:1
140 kVp
160 mA
0.8 s/rot
1.5:1

Initial Experience with weight-based,
low-dose pediatric PET/CT protocols
Alessio et al. J Nucl Med 2009;50:1570-1578
• 0.144 mCi/kg FDG (1 & 10 mCi min & max)
• 120 kVp
• Weight-based (Broselow-Luten color scale) 10-40 mAs
• 45 patients (9.2-109 kg, 1.4-23 YO)
• Dosimetry extrapolated from standard phantoms
• WB PET/CT effective dose from 5.4 to 10.0 mSv for 9 and 70 kg patient, respectively

Axial Extent of CT
• ―Whole Body‖ PET typically acquired ―Eyes to Thighs‖
• Potential for SPECT acquisitions to all be extended, particularly with more efficient reconstruction
• Thus CT component can be combination of head & neck, thoracic, abdominal and pelvic CT
• Is ―One size fits all‖ appropriate?
• Alternative paradigm suggested by George Segall of Stanford and Palo Alto VA Medical Center
• Standardization of technique

Dose/Risk Statements
AAPM (Dec 2011)
http://www.aapm.org/org/policies/details.asp?id=318&type=PP
―Risks of medical imaging at effective doses below 50 mSv for single
procedures or 100 mSv for multiple procedures over short time periods
are too low to be detectable and may be nonexistent. Predictions of
hypothetical cancer incidence and deaths in patient populations
exposed to such low doses are highly speculative and should be
discouraged. These predictions are harmful because they lead to
sensationalistic articles in the public media that cause some patients
and parents to refuse medical imaging procedures, placing them at
substantial risk by not receiving the clinical benefits of the prescribed
procedures.‖

Dose/Risk Statements
SNMMI (June 2012) http://interactive.snm.org/docs/SNM_Position_Statement_on_Dose_Optimization_FI
NAL_June_2012.pdf
Radiation dose for all nuclear medicine and molecular imaging
procedures should be optimized so that the patient receives the smallest
possible amount of radiopharmaceutical that will provide the
appropriate diagnostic information. SNM and SNMTS also recognize
that if an appropriate procedure—one that can provide the physician
with clinical information essential to the patient’s treatment—is not
performed when necessary due to fear of radiation, it can be
detrimental to the patient.
The SNM and SNMTS believe that the right test with the right dose
should be given to the right patient at the right time.

Communication of Risk
• Need to be prepared to speak to referring physicians, patients, and parents
• In general, referring physicians have very little understanding of radiation risk and may perceive NM as a ―high dose‖ procedure.
• Teenage patients and parents may have seen discussions of medical radiation in the news.
• Reports have shown that informing patients regarding radiation risk does not adversely affect their willingness to have an appropriately ordered study.
Fahey, Treves, Adelstein. Minimizing and Communicating Radiation
Risk in Pediatric Nuclear Medicine. J Nucl Med. 2011;52:1240-1251.

Regarding radiologic procedures,
when patients and families ask
―What is my dose?‖
they are really asking…

Regarding radiologic procedures,
when patients and families ask
―What is my dose?‖
they are really asking…
―What is my risk?‖

A reasonable approach is to discuss with patients
and their families:
•We will be administering a small amount radioactivity in
order to perform a study which emits radiation similar to
that emitted by x-ray machines.
•This exposure may lead to a slight increase in the risk of
contracting cancer sometime in their lifetime.
•The radiation dose from this procedure is in the range of
many other radiological tests and is on the same order as
that individuals get from natural background in one year.
•The dose to the parent of the patient is on the order of the
radiation one would receive during a transcontinental
flight.

Risk of dying of cancer as a result from a
FDG PET scan (~1 in 2500)
PET scan
(1 in 2500)
Natural Risk
(550 in 2500)

Lifetime fatal risk from
everyday activities Activity Lifetime Risk Accident while riding in a car 304
Accident as a pedestrian 652
Choking 894
Accidental poisoning 1,030
Drowning 1,127
Exposure to fire or smoke 1,181
Falling down stairs 2,024
Cancer from 18F PET scan 2,700
Accident while riding a bike 4,734
Cancer from 99mTc MDP bone scan 4,760
Accidental firearms discharge 6,333
Accident while riding in a plane 7,058
Hit by lightning 84,388

Activity or risk LLE (days)
Living in poverty 3,500
Being male (vs. female) 2,800
Cigarettes (male) 2,300
Working as a coal miner 1,100
30-lb overweight 900
Grade school dropout 800
15-lb overweight 450
Alcohol 230
Motor vehicle accidents 180
Speed limit: 65 vs. 55 miles per hour 40
Coffee: 2 cups/day 26
Radiation worker, age 18-65 (~200 mSv lifetime) 25
Birth control pills 5
Decrease in Life Expectancy

Pediatric Administered Dose Survey
• Surveyed 15 dedicated pediatric hospitals in
North America (13 responded)
• Requested information on 16 studies
commonly performed in pediatric NM
– Administered dose per kg
– Maximum administered dose
– Minimum administered dose
Treves ST, Davis RT, Fahey FH. J Nucl Med, 2008;49:1024-1027.

Review of 99mTc DMSA Data
N Min Max Median Mean
Tc-99m
DMSA
MBq/kg
(mCi/kg) 8 1.11 3.70 2.22 2.35
Minimum
Activity 11 5.55 74.00 18.50 26.40
Maximum
Activity 11 74.00 222.00 185.00 151.36

Variability in Administered Doses
in Pediatrics
• Consider the maximum/minimum for a parameter as the range factor
• For Admin dose/kg and Maximum dose the range factor varied, on average, by a factor of 3, and by as much as a factor of 10
• Minimum dose range factor varied, on average, by a factor of 10 and as much as a factor of 20

Alliance for Radiation
Safety in Pediatric
Imaging launched in
2007. Now includes
over 60 international
organizations
including partners in
industry,
imagegently.org
Pediatric Radiopharmaceutical
Administered Doses
• Consensus workshops among pediatric nuclear medicine leaders took place at the 2009 and 2010 Society of Nuclear Medicine Annual Meetings and at the 2009 and 2010 Annual Meetings of the Society for Pediatric Radiology
• Members represented the SNM, SPR, ACR and Image Gently Campaign

Gelfand MJ, Parisi MT, Treves ST
Pediatric radiopharmaceutical
administered doses: 2010 North
American consensus guidelines.
J Nucl Med. 2011;52:318-22.


Nuclear Medicine Parent Information Brochure

Image Wisely
Nuclear Medicine Project
• Initially concentrated on CT
• Now expanding to nuclear medicine
• Kick-off Meeting October 27, 2011
• SNM and ASNC asked to participate in
addition to ACR, RSNA, ASRT and AAPM

Image Wisely
Nuclear Medicine Project
• IW Leadership
– Jim Brink (RSNA)
– William Hendee (AAPM)
– Greg Morrison (ASRT)
– Rick Morin (ACR: Not
present on 10/27/11)
• SNM/SNMTS
– Fred Fahey
– Chris Palestro
– Brenda King
• ACR
– Murray Becker
– Beth Harkness
• AAPM
– Larry Williams
• ASNC
– Gordon DePuey
• RSNA
– Hossein Jadvar (not present
on 10/27/11)

Image Wisely
Nuclear Medicine Project
• Develop material for imaging professionals first followed
by that for referring physicians and patients
– General Nuclear Medicine
– Cardiac Nuclear Medicine
– PET and PET/CT
• Materials being finalized this month
• Target Launch Date – November 2012 (RSNA)

Thanks!
Questions?