Dorothy Scott TOC - wsdot.wa.gov · INVENTORY Dorothy Scott Airport The initial step in the...
52
i Dorothy Scott Airport Oroville, Washington AIRPORT LAYOUT PLAN REPORT “The preparation of this document may have been supported, in part, through the Airport Improvement Program financial assistance from the Federal Aviation Administration (Project Number 3-53-5300-03) as provided under Title 49, United States Code, section 47104. The contents do not necessarily reflect the official views of policy of the FAA. Acceptance of this report by the FAA does not in any way constitute a commitment on the part of the United States to participate in any development depicted therein nor does it indicate that the proposed development is environmentally acceptable in accordance with appropriate public laws.” Chapter One - INVENTORY AIRPORT LOCATION AND ACCESS .........................................................................1-1 AREA TOPOGRAPHY ...................................................................................................1-2 CLIMATE ........................................................................................................................1-2 COMMUNITY AND AIRPORT HISTORY ..................................................................1-2 AIRCRAFT ACTIVITY DATA ......................................................................................1-2 CRITICAL AIRCRAFT ..................................................................................................1-3 EXISTING FACILITIES .................................................................................................1-3 Airfield Facilities................................................................................................1-4 Runway ...................................................................................................1-4 Taxiways and Taxilanes ..........................................................................1-5 Aprons and Aircraft Parking ...................................................................1-5 Landside Facilities ...............................................................................................1-5 Hangars and Airport Buildings ...............................................................1-5 Fixed Based Operators (FBOs) ...............................................................1-6 Internal Circulation, Access and Vehicle Parking ..................................1-6 Airfield Support Facilities ...................................................................................1-6 Aircraft Rescue and Firefighting .............................................................1-6 Fueling Facilities......................................................................................1-6 Airport Maintenance ................................................................................1-6 Utilities ....................................................................................................1-6 Common Traffic Advisory Frequency (CTAF)........................................1-6 Airport Navigational Aids ..................................................................................1-7
-
Upload
nguyencong -
Category
Documents
-
view
221 -
download
0
Transcript of Dorothy Scott TOC - wsdot.wa.gov · INVENTORY Dorothy Scott Airport The initial step in the...
i
Dorothy Scott Airport Oroville, Washington AIRPORT LAYOUT PLAN REPORT “The preparation of this document may have been supported, in part, through the Airport Improvement Program financial assistance from the Federal Aviation Administration (Project Number 3-53-5300-03) as provided under Title 49, United States Code, section 47104. The contents do not necessarily reflect the official views of policy of the FAA. Acceptance of this report by the FAA does not in any way constitute a commitment on the part of the United States to participate in any development depicted therein nor does it indicate that the proposed development is environmentally acceptable in accordance with appropriate public laws.” Chapter One - INVENTORY AIRPORT LOCATION AND ACCESS .........................................................................1-1 AREA TOPOGRAPHY ...................................................................................................1-2 CLIMATE ........................................................................................................................1-2 COMMUNITY AND AIRPORT HISTORY ..................................................................1-2 AIRCRAFT ACTIVITY DATA ......................................................................................1-2 CRITICAL AIRCRAFT ..................................................................................................1-3 EXISTING FACILITIES .................................................................................................1-3
Airfield Facilities ................................................................................................1-4 Runway ...................................................................................................1-4 Taxiways and Taxilanes ..........................................................................1-5 Aprons and Aircraft Parking ...................................................................1-5
Landside Facilities ...............................................................................................1-5 Hangars and Airport Buildings ...............................................................1-5 Fixed Based Operators (FBOs) ...............................................................1-6 Internal Circulation, Access and Vehicle Parking ..................................1-6
Airfield Support Facilities ...................................................................................1-6 Aircraft Rescue and Firefighting .............................................................1-6 Fueling Facilities ......................................................................................1-6 Airport Maintenance ................................................................................1-6 Utilities ....................................................................................................1-6 Common Traffic Advisory Frequency (CTAF)........................................1-6
Airport Navigational Aids ..................................................................................1-7

ii
Instrument Approach Aids .......................................................................1-7 Visual Approach Aids ..............................................................................1-7
Airport Lighting and Signing ..................................................................1-7 Other NAVAIDS .....................................................................................1-7
LAND USE PLANNING AND ZONING ......................................................................1-7 Existing Land Use ..............................................................................................1-8
Existing Zoning .................................................................................................1-8 Okanogan County Zoning ........................................................................1-8 City of Oroville Zoning ...........................................................................1-9
Comprehensive Plan Goals & Policies ...............................................................1-10 Okanogan County Comprehensive Plan ..................................................1-10 City of Oroville Comprehensive Plan ......................................................1-10
Chapter One - EXHIBITS 1A Airport Aircraft Reference Codes ..................................................... after page 1-3 1B Existing Facilities…………………………………………………..after page1-3 1C Airport Layout, Dimensions and Pavement Cross Sections .............. after page 1-4 1D Pavement Conditions ......................................................................... after page 1-4 1E Zoning Map ...................................................................................... after page 1-9 Chapter One - TABLES 1A Airfield Design Standards ...................................................................................1-4 Chapter Two - FORECASTS INTRODUCTION ...........................................................................................................2-1 AVIATION ACTIVITY PARAMETERS AND MEASURES TO FORECAST ………2-1 PREVIOUS AIRPORT FORECASTS ............................................................................2-2 NATIONAL TRENDS FORECAST BY FAA ..............................................................2-3 POPULATION FORECASTS ........................................................................................2-5 DOROTHY SCOTT AIRPORT FORECASTS ..............................................................2-7
Based Aircraft Forecasts .....................................................................................2-7 Aircraft Operations Forecasts .............................................................................2-8 Selected Forecasts ...............................................................................................2-9 Airport Reference Code and Critical Aircraft .....................................................2-11
AIRPORT PLANNING FORECAST RESULTS COMPARED WITH TAF ...............2-11 Chapter Two - TABLES 2A FAA TAF Annual Aircraft Operations, Historical and Forecast ........................2-2 2B FAA TAF Based Aircraft, Historical and Forecast .............................................2-2 2C Washington Aviation System Plan Forecasts .....................................................2-3 2D FAA Long-Range GA Forecasts .........................................................................2-4

iii
2E FAA Forecasts for FA and Air Taxi Active Fleet ...............................................2-4 2F Okanogan County Population ..............................................................................2-5 2G Thompson-Okanogan Development Region Population .....................................2-6 2H Comparison of Based Aircraft Forecast Models ..................................................2-7 2I Comparison of Aircraft Operations Forecast Models .........................................2-9 2J Dorothy Scott Airport Aviation Demand Forecasts ............................................2-9 2K Based Aircraft Fleet Mix ....................................................................................2-10 2L Dorothy Scott Airport GA Operations Mix .........................................................2-11 2M Comparison of Selected Forecasts with Terminal Area Forecasts ......................2-12 Template for Comparing Airport Planning and TAF Forecasts ………after page 2-12 Template for Summarizing and Documenting Airport Planning Forecasts…………………………………………………………. after page 2-12 Chapter Three – AIRPORT FACILITY REQUIREMENTS/ ALTERNATIVES PLANNING HORIZONS ...............................................................................................3-2 AIRFIELD REQUIREMENTS ......................................................................................3-3
Airfield Design Standards ...................................................................................3-3 Runways ...............................................................................................................3-4
Airfield Capacity .....................................................................................3-5 Runway Orientation ................................................................................3-5 Runway Length .......................................................................................3-5
Runway Width .....................................................................................................3-7 Runway Pavement Strength ................................................................................3-7 Taxiways .............................................................................................................3-7 Navigational and Approach Aids ........................................................................3-7 Airfield Lighting, Signage, and Marking ............................................................3-8
Identification Lighting ............................................................................3-8 Runway and Taxiway Lighting ...............................................................3-9 Visual Approach Lighting ......................................................................3-9 Pilot-Controlled Lighting ........................................................................3-9 Airfield Signage ......................................................................................3-9 Pavement Markings ................................................................................3-10
Weather Reporting ..............................................................................................3-10 LANDSIDE REQUIREMENTS .....................................................................................3-10
Hangars ................................................................................................................3-10 Aircraft Parking Apron .......................................................................................3-11
Based Aircraft Tie-Downs ......................................................................3-11 Transient Aircraft Tie-Downs ..................................................................3-11
Vehicle Parking ...................................................................................................3-11 Helicopter Facilities .............................................................................................3-12
SUPPORT FACILITIES .................................................................................................3-12 Pilots’ Lounge ......................................................................................................3-12 Aircraft Rescue and Firefighting ........................................................................3-12 Airport Maintenance/Storage Facilities ...............................................................3-12

iv
Aviation Fuel Storage .........................................................................................3-12 Security/Fencing ..................................................................................................3-13 Utilities .................................................................................................................3-13
LAND USE PLANNING AND ZONING ......................................................................3-13 City of Oroville Zoning Code Recommendations ...............................................3-13 City of Oroville & Okanogan County Comprehensive Plan Recommendations ................................................................................................3-13 Other Recommendations .....................................................................................3-14
SUMMARY ....................................................................................................................3-14 Chapter Three – SUBPART 1 – Development Alternatives ...................... 3-15
Airside Development……………………………………………………………3-16 Landside Development ........................................................................................3-17
Chapter Three – SUBPART 2 – Preferred Alternative ................................ 3-19 Chapter Three - EXHIBITS 3A Runway and Building Alternative 1 .................................................. after page 3-18 3B Runway and Building Alternative 2 .................................................. after page 3-18 3C Runway and Building Alternative 3 .................................................. after page 3-18 3D Preferred Alternative ......................................................................... after page 3-19 Chapter Three - TABLES 3A Aviation Demand Planning Horizons .................................................................3-2 3B Airport Design Standards ....................................................................................3-4 3C Wind Coverage Percentages................................................................................3-5 3D Runway Length Requirements ............................................................................3-6 Chapter Four – AIRPORT PLANS AIRPORT LAYOUT PLAN DRAWING SET ..............................................................4-1
Cover Sheet .........................................................................................................4-1 Airport Layout Plan Drawing .............................................................................4-1 Terminal Area Plan Drawing ...............................................................................4-2 Airport Airspace Plan Drawing ..........................................................................4-2
Primary Surface .......................................................................................4-2 Approach Surface ....................................................................................4-2 Transitional Surface ................................................................................4-2 Horizontal Surface ..................................................................................4-2 Conical Surface ........................................................................................4-2
Runway Approach Plan & Profile Drawing .......................................................4-3

v
Land Use Plan Drawing ......................................................................................4-3
Chapter Four - PLAN SHEETS 1 Cover Sheet ....................................................................................... after page 4-3 2 Airport Layout Plan .......................................................................... after page 4-3 3 Terminal Area Plan……………………………………………..….after page 4-3 4 Airspace Plan .................................................................................... after page 4-3 5 Runway 15/33 Runway Protection Zone Plan and Profile ............... after page 4-3 6 Airport Land Use Plan ...................................................................... after page 4-3 Chapter Five – CAPITAL IMPROVEMENT PROJECTS CAPITAL IMPROVEMENT PROJECTS .....................................................................5-1
Phase I .................................................................................................................5-1 Phase II ...............................................................................................................5-2 Phase III ..............................................................................................................5-2 Project Costs ........................................................................................................5-2 Funding Sources .................................................................................................5-3
FAA .........................................................................................................5-3 State ........................................................................................................5-3
Chapter Five - Tables 5A Proposed Capital Improvement Projects ……………………….after page 5-3 5B FAA Capital Improvement Project Spreadsheet……………….after page 5-3 APPENDICES Appendix A – Glossary of Terms Appendix B – Zoning Ordinances Appendix C – FAA Computer Design Printouts

Dorothy Scott Airport Airport Layout Plan Report-Inventory 1-1
Chapter One Airport Layout Plan Report
INVENTORY Dorothy Scott Airport The initial step in the preparation of the Airport Layout Plan Report for Dorothy Scott Airport is the collection of information pertaining to the airport and the area it serves. The information collected in this chapter will be used in subsequent analyses in this study. The inventory portion of this chapter will summarize the airport location, history and existing facilities. By establishing a thorough and accurate inventory, an appropriate forecast and recommendations for airfield and landside development can be developed. The information was obtained from several sources, including on-site inspections, airport records, reviews of other planning studies, the Federal Aviation Administration (FAA), various government agencies, a number of on-line (Internet sites), which presently summarize most statistical information and facts about the airport, and interviews with airport staff, planning associations, and airport tenants. As with any airport planning study, an attempt has been made to utilize existing data, or information provided in existing planning documents, to the maximum extent possible. AIRPORT LOCATION AND ACCESS Dorothy Scott Airport is located in the City of Oroville, Washington in Okanogan County. Located in north central Washington, the county is bordered by British Columbia, Canada on the north, the Cascade Mountain Range on the west and the Columbia River Basin and Lake Roosevelt on the south and east. Okanogan County is home to a wide variety of wildlife and spectacular scenery. The City of Oroville is situated in a high desert, four miles south of the

Dorothy Scott Airport Airport Layout Plan Report-Inventory 1-2
British Columbia border. The city is served by U.S. Highway 97. Public transportation to and from the City is provided by Oroville Taxi Service. The Airport is located two miles northeast of downtown Oroville. AREA TOPOGRAPHY The Dorothy Scott Airport has an elevation of 1,067 feet (NAVD 88) (surveyed by W&H Pacific, June 2002). The surrounding terrain is very mountainous. To the east of the Airport is the Okanogan Highlands. The west side of the Airport has a view of Lake Osoyoos and the Cascade Mountains. Both the Simiklameen and Okanogan Rivers also run through the City. CLIMATE Oroville has a four season climate. Winter temperatures in Oroville generally range from 28 to 50 degrees Fahrenheit with the coolest temperatures typically occurring in January. Summer temperatures generally range from 70 to 85 degrees Fahrenheit with the warmest days occurring in the month of July. Annual precipitation averages about 12.4 inches. June is typically the wettest month of the year. COMMUNITY AND AIRPORT HISTORY As with many cities in Washington State, the City of Oroville was originally used by the Native Americans. Lake Osoyoos and the nearby rivers were used as fur trading posts. In 1857 the first white man came to the area (Hiram (Okanogan) Smith) from New York. Three years later he discovered gold on the Similkameen River. Smith also planted the first apple tree in what is now known as Oroville. In 1892 the town’s name became Oro (Spanish for gold) and the area received a post office. By 1909 the town’s name was Oroville, Spanish for City of Gold. During this same time period the railroad was constructed and the town was booming. Mining is still a large part of Oroville’s history, but today the main industry is agriculture with many fruit producing orchards located in the area. A large portion of the land that the airport is currently on was purchased by the City of Oroville in 1934 from the Scott family. Additional portions of land were purchased in 1940. It is assumed that the Airport operated as a turf airstrip until 1985 when it was paved. The Airport is named after Dorothy Scott, a woman who was killed in a tragic accident while ferrying fighter planes to England during World War II. Today, the Airport is owned and operated by the City of Oroville. AIRCRAFT ACTIVITY DATA There are two types of aircraft activity data: based aircraft and annual operations. Based aircraft are the number of aircraft that are stored at an airport (either in hangars or in tiedowns). Annual
Dorothy Scott Airport Airport Layout Plan Report-Inventory 1-3
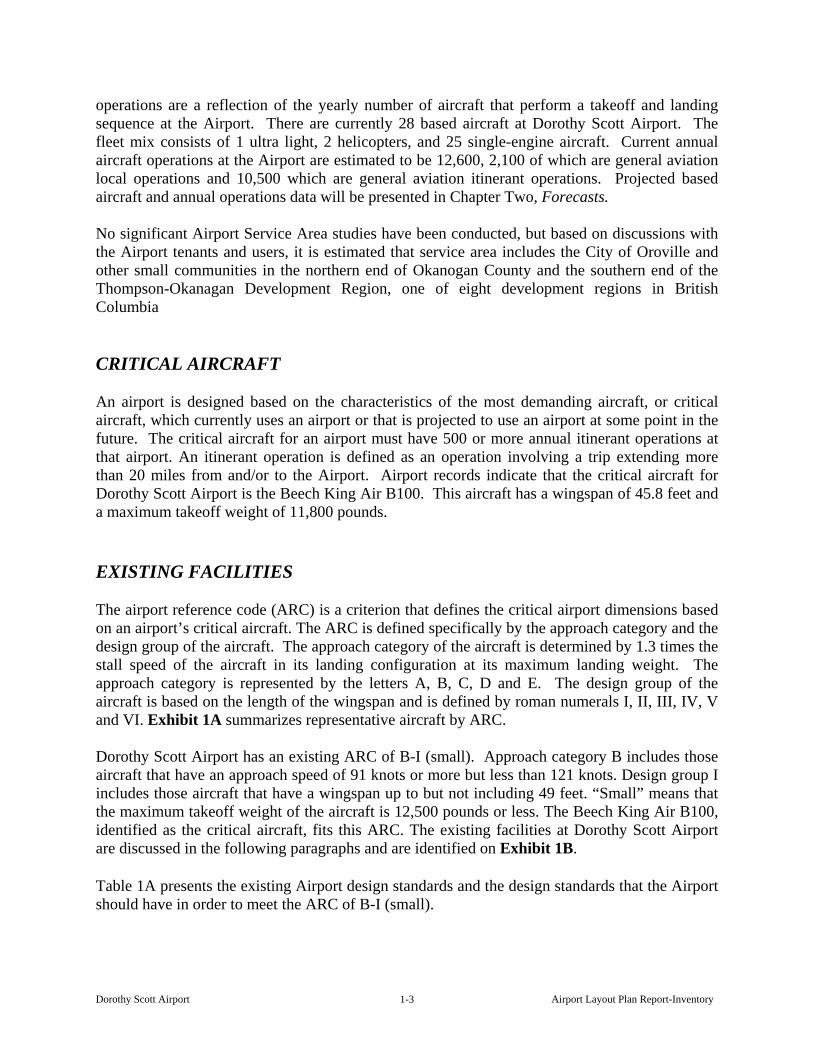
operations are a reflection of the yearly number of aircraft that perform a takeoff and landing sequence at the Airport. There are currently 28 based aircraft at Dorothy Scott Airport. The fleet mix consists of 1 ultra light, 2 helicopters, and 25 single-engine aircraft. Current annual aircraft operations at the Airport are estimated to be 12,600, 2,100 of which are general aviation local operations and 10,500 which are general aviation itinerant operations. Projected based aircraft and annual operations data will be presented in Chapter Two, Forecasts. No significant Airport Service Area studies have been conducted, but based on discussions with the Airport tenants and users, it is estimated that service area includes the City of Oroville and other small communities in the northern end of Okanogan County and the southern end of the Thompson-Okanagan Development Region, one of eight development regions in British Columbia CRITICAL AIRCRAFT An airport is designed based on the characteristics of the most demanding aircraft, or critical aircraft, which currently uses an airport or that is projected to use an airport at some point in the future. The critical aircraft for an airport must have 500 or more annual itinerant operations at that airport. An itinerant operation is defined as an operation involving a trip extending more than 20 miles from and/or to the Airport. Airport records indicate that the critical aircraft for Dorothy Scott Airport is the Beech King Air B100. This aircraft has a wingspan of 45.8 feet and a maximum takeoff weight of 11,800 pounds. EXISTING FACILITIES The airport reference code (ARC) is a criterion that defines the critical airport dimensions based on an airport’s critical aircraft. The ARC is defined specifically by the approach category and the design group of the aircraft. The approach category of the aircraft is determined by 1.3 times the stall speed of the aircraft in its landing configuration at its maximum landing weight. The approach category is represented by the letters A, B, C, D and E. The design group of the aircraft is based on the length of the wingspan and is defined by roman numerals I, II, III, IV, V and VI. Exhibit 1A summarizes representative aircraft by ARC. Dorothy Scott Airport has an existing ARC of B-I (small). Approach category B includes those aircraft that have an approach speed of 91 knots or more but less than 121 knots. Design group I includes those aircraft that have a wingspan up to but not including 49 feet. “Small” means that the maximum takeoff weight of the aircraft is 12,500 pounds or less. The Beech King Air B100, identified as the critical aircraft, fits this ARC. The existing facilities at Dorothy Scott Airport are discussed in the following paragraphs and are identified on Exhibit 1B. Table 1A presents the existing Airport design standards and the design standards that the Airport should have in order to meet the ARC of B-I (small).

Dorothy Scott Airport Airport Layout Plan Report-Inventory 1-4
Table 1A - Airport Design Standards Design Feature Existing
(feet) Standard B-I (small)
(feet) Runway Safety Area (RSA) -Width 120 120 -Runway 15 Length beyond runway end 110 240 -Runway 33 Length beyond runway end 180 240 Runway Object Free Area (OFA) -Width 400 250 -Runway 15 Length beyond runway end 80 240 -Runway 33 Length beyond runway end 150 240 Runway Obstacle Free Zone (OFZ) -Width 250 250 -Runway 15 Length beyond runway end 80 200 -Runway 33 Length beyond runway end 150 200 Runway Protection Zones 500 x 1,000 x 700 250 x 1,000 x 450
Sources: Existing – W& H Pacific, Inc. Standard – FAA AC 150/5300-13, Change 8 As can be noted in Table 1A, several of the existing critical area dimensions do not meet B-I (small) ARC standards. AIRFIELD FACILITIES All existing pavement sections and pavement conditions were obtained from Pavement Consultants Inc.’s 1999 pavement survey (see Exhibits 1C and 1D). The pavement condition index (PCI) survey is an inventory of the existing pavement sections and pavement conditions at all state-funded airports. The survey is compiled by a consultant hired by the State of Washington. The consultant uses a form of pavement testing to get a rating for each pavement surface. The rating, based on a numbered scale of 0-100, with 0 being the lowest and 100 being the highest, corresponds to a pavement condition ranging from poor to excellent. The State has hired another consultant to update this data in 2004/2005. Current pavement conditions discussed below are reported based on visual observations by W&H Pacific through a recent (September, 2004) airport field visit. Runway Dorothy Scott Airport has one paved, asphalt runway, Runway 15-33, at a length of 4,020 feet and a width of 50 feet. The pavement section for Runway 15-33 is six inches of gravel base course, bituminous surface treatment (BST) and one and one-half inches of asphalt concrete pavement with fabric. The runway was last paved in 1998. The runway pavement is in good condition. The existing pavement strength for Runway 15-33 at Dorothy Scott Airport is rated at 5,000 pounds single wheel gear (SWG). The existing critical aircraft, the King Air B-100, weight is listed as 11,800

Dorothy Scott Airport Airport Layout Plan Report-Inventory 1-5
pounds SWG. An analysis of the pavement strength requirements is contained in the facility requirements section of this study. Runway orientation is determined by the direction of the prevailing winds. The FAA recommends that a runway have 95% wind coverage based on specified crosswind components. Dorothy Scott does not currently have a wind rose; therefore, current wind coverages can not be identified. Taxiways and Taxilanes Runway 15-33 has a partial parallel taxiway (Taxiway A) with a length of 3,070 feet and a width of 24 feet. Taxiway A has pavement sections consisting of 10 inches of crushed aggregate base course, an additional three inches of crushed aggregate, topped with bituminous surface treatment. There are also four connector taxiways: Taxiway B at midfield with dimensions of 78 feet long and 20 feet wide; an unnamed taxiway called out as the south midfield connector taxiway with dimensions of 88 feet long and 14 feet wide; Taxiway C, the connector on the north end of with dimensions of 110 feet long and 25 feet wide; and Taxiway D the south end connector with dimensions of 110 feet long and 25 feet wide. Taxiway B and the south midfield taxiway have the same pavement sections as Taxiway A. Taxiways C and D both have pavement sections consisting of six inches of gravel and bituminous surface treatment. Slurry seals were completed on both of these taxiways in 1992. All taxiways at the Airport were slurry sealed in 1992. They are currently all in poor condition and have weeds growing up through the cracks. Aprons and Aircraft Parking There is one aircraft apron area on the airport, connected to the runway by the midfield taxiway and Taxiway A. The apron has dimensions of 95 feet by 640 feet and contains ten aircraft tiedown positions. There is $3 per day (night) charge for using the tiedowns. The pavement on this apron is in poor condition and has weeds growing in the cracks. LANDSIDE FACILITIES Hangars and Airport Buildings There are a total of 10 hangar buildings at the Airport. Two are privately owned buildings operated under a ground lease through the City of Oroville (a 70’x70’ FBO building and a 40’x 77’ executive hangar). The remaining buildings are all City-owned and include an open T-hangar that has bays for eight aircraft, and several other hangars varying in size. The City charges hangar lessees $35 per month for aircraft storage in the T-hangar and $0.05 per square foot per month for closed hangar space. In addition to hangar buildings at the Airport, there is a pilots’ lounge equipped with restrooms and a telephone. This lounge area is also used as a U.S. customs agent’s checkpoint for air traffic arriving from Canada. U.S. Customs is located off-site but will come to the airport upon request. The City of Oroville also has a pump station located on the field.

Dorothy Scott Airport Airport Layout Plan Report-Inventory 1-6
Fixed Based Operators (FBOs) A fixed based operator (FBO) is an individual or a business that offers aviation-related services to Airport users, such as flight instruction, aircraft rental, aircraft maintenance, full-service aircraft fueling, etc. There is one fixed based operator at Dorothy Scott Airport. The FBO provides major airframe and power plant services. Internal Circulation, Access and Vehicle Parking A four-foot perimeter fence surrounds the airport; however, the fencing is in poor shape and there are no gates. The public can access the airfield by walking through un-gated openings. Vehicular traffic uses Airport Road to access the airport’s facilities. There is no designated automobile parking at the Airport. AIRFIELD SUPPORT FACILITIES Aircraft Rescue and Firefighting There are no Aircraft Rescue and Firefighting (ARFF) facilities available at the Airport, however, in the event of an emergency, these services are provided by City of Oroville Fire and Police Departments. Fueling Facilities The City of Oroville operates the self-service fueling facilities at the Airport and provides 100LL aircraft fuel and 80 octane gasoline. Airport Maintenance Airport maintenance is provided by the City of Oroville. Utilities Water is available from the pump station near the access road. Sewer services are provided by the City of Oroville. Telephone service consists of a pay phone in the pilots’ lounge area. Common Traffic Advisory Frequency (CTAF) The Federal Communications Commission (FCC) issued Dorothy Scott Airport a Common Traffic Advisory Frequency (CTAF) of 122.9 MHz. This frequency is used by pilots to communicate their intentions to other pilots who may be in the vicinity of the Airport.

Dorothy Scott Airport Airport Layout Plan Report-Inventory 1-7
AIRPORT NAVIGATIONAL AIDS Airport Navigational Aids, or NAVAIDS, provide electronic navigational assistance to aircraft for approaches to an airport. NAVAIDS are either visual approach aids or instrument approach aids; the former providing a visual navigational tool, and the latter being an instrument-based navigational tool. The types of approaches available at an airport are based on the NAVAIDS which are provided. Instrument Approach Aids There are no instrument approach aids at Dorothy Scott Airport. Visual Approach Aids Dorothy Scott Airport is equipped with a rotating beacon to assist pilots in locating the Airport. The beacon is located east of the runway, off of airport property, and on top of a hill. All approaches to the Airport are made on a visual basis. The Airport also has a 2-box Precision Approach Path Indicator (PAPI) on the left side of Runway 15. PAPIs contain multiple light units that are angled to provide the pilot with information as to whether he is approaching too low or too high. Airport Lighting and Signing Runway 15-33 is equipped with low intensity runway lights (LIRL). The LIRL are pilot activated by using the CTAF frequency of 122.9 MHz. There is no lighting on the airport taxiways, however Taxiway A has reflectors. Other NAVAIDS Dorothy Scott Airport also has a segmented circle and a lighted wind sock. LAND USE PLANNING AND ZONING There are several land use requirements, on the Federal, State, County and City levels, that need to be considered when reviewing existing land uses and planning for future development at and around an airport. Federal regulations are generally concerned with airspace protection (14 CFR Part 77) and noise levels, particularly for areas that fall within the 65 decibel (dBA) noise contour line. 14 CFR Part 77, Objects Affecting Navigable Airspace, establishes obstruction standards used for identifying potential adverse effects to air navigation and establishes notice standards for proposed construction. There are five imaginary surfaces, each with specific controlling measures: a primary surface, an approach surface, a transitional surface, a horizontal surface and a conical surface. It is ideal to keep these surfaces clear of any and all obstructions.
Dorothy Scott Airport Airport Layout Plan Report-Inventory 1-8
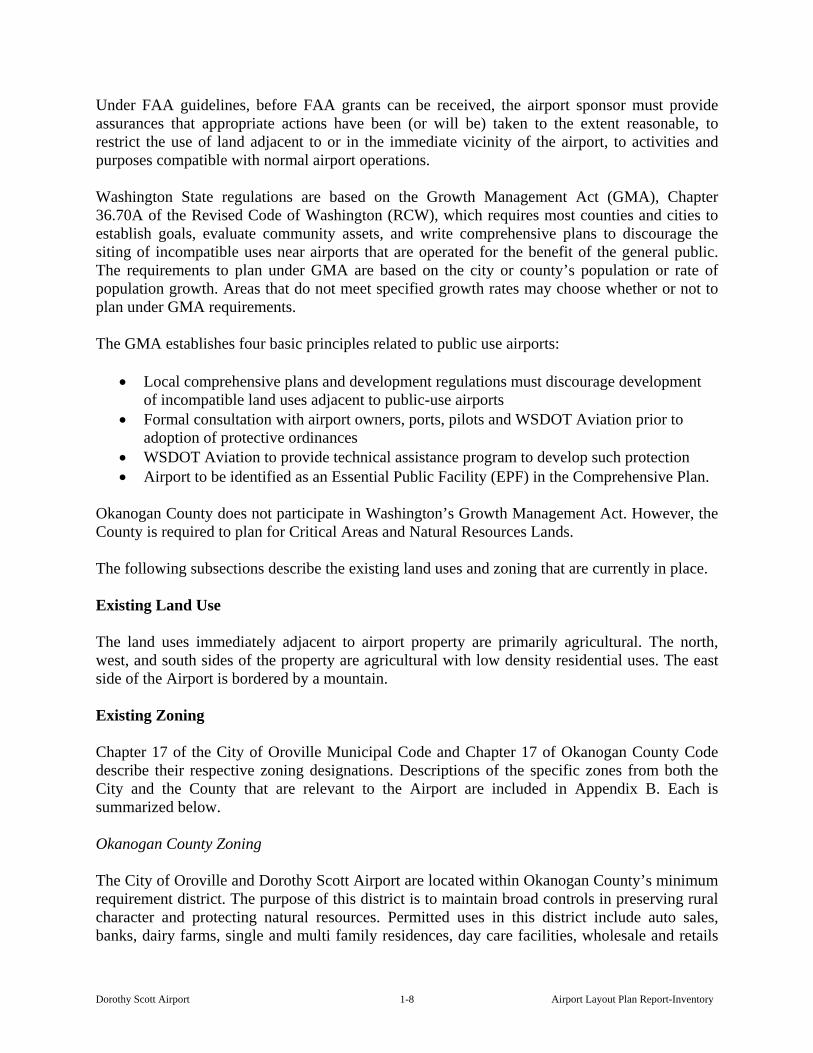
Under FAA guidelines, before FAA grants can be received, the airport sponsor must provide assurances that appropriate actions have been (or will be) taken to the extent reasonable, to restrict the use of land adjacent to or in the immediate vicinity of the airport, to activities and purposes compatible with normal airport operations. Washington State regulations are based on the Growth Management Act (GMA), Chapter 36.70A of the Revised Code of Washington (RCW), which requires most counties and cities to establish goals, evaluate community assets, and write comprehensive plans to discourage the siting of incompatible uses near airports that are operated for the benefit of the general public. The requirements to plan under GMA are based on the city or county’s population or rate of population growth. Areas that do not meet specified growth rates may choose whether or not to plan under GMA requirements. The GMA establishes four basic principles related to public use airports:
• Local comprehensive plans and development regulations must discourage development of incompatible land uses adjacent to public-use airports
• Formal consultation with airport owners, ports, pilots and WSDOT Aviation prior to adoption of protective ordinances
• WSDOT Aviation to provide technical assistance program to develop such protection • Airport to be identified as an Essential Public Facility (EPF) in the Comprehensive Plan.
Okanogan County does not participate in Washington’s Growth Management Act. However, the County is required to plan for Critical Areas and Natural Resources Lands. The following subsections describe the existing land uses and zoning that are currently in place. Existing Land Use The land uses immediately adjacent to airport property are primarily agricultural. The north, west, and south sides of the property are agricultural with low density residential uses. The east side of the Airport is bordered by a mountain. Existing Zoning Chapter 17 of the City of Oroville Municipal Code and Chapter 17 of Okanogan County Code describe their respective zoning designations. Descriptions of the specific zones from both the City and the County that are relevant to the Airport are included in Appendix B. Each is summarized below. Okanogan County Zoning The City of Oroville and Dorothy Scott Airport are located within Okanogan County’s minimum requirement district. The purpose of this district is to maintain broad controls in preserving rural character and protecting natural resources. Permitted uses in this district include auto sales, banks, dairy farms, single and multi family residences, day care facilities, wholesale and retails

Dorothy Scott Airport Airport Layout Plan Report-Inventory 1-9
stores, maintenance shops, restaurants, gravel pits less than three acres in size, hospitals, light manufacturing, parks and golf courses, hotels/motels, and others. This district allows a minimum density of one acre per single family unit and a minimum of 9,600 square feet per multi-family unit or mobile home park unit. The maximum height of buildings and structures within this zone ranges from 35 feet to 200 feet, depending on its use. For example grain elevators and water tanks can be no higher than 100 feet, while the maximum height for most agricultural uses is limited to 65 feet. Okanogan County also has an Airport Safety Overlay District which applies to lands classified by the FAA as visual, utility, non-precision, and precision runways. The purpose of this overlay district is to protect lives and property on lands which lie within the transition and approach zone surrounding an airport or landing field. Also, the district is intended to prevent the establishment of airspace obstructions through height restrictions. The district prohibits uses such as schools, churches, and auditoriums (i.e., assemblies of people), uses which create electrical interference with navigational signals or radio communications, and uses which foster an increased bird population. There is also language in the ordinance prohibiting emission of smoke, ash, dust, vapor and other forms of air pollution, and materials that may produce glare. The heights of building or structures within this overlay zone are limited by Part 77 Regulations. Exhibit 1E shows the County’s zoning map and the Airport Overlay District for the Oroville area. City of Oroville Zoning While the Airport is outside of the official City limits of Oroville, it is City property and is zoned as such. The City of Oroville’s zoning map defines the Airport area as “Airport” District. The intent of this zone is to provide an area for airport, industrial and commercial uses that do not produce unreasonable dissemination of dust, smoke, visible gas, excess noise and vibration or odor. The permitted uses within this district include aircraft repair, maintenance, and manufacturing, fuel sales and storage, eating and drinking establishments, freights depots, lumber yards, motels, parks, office buildings, transportation terminals, vocational schools, warehouse and wholesaling establishments, and others. The Airport District permits a maximum planned development residential density of 23.4 units per acre. A maximum building height is not specified. Some of the permitted uses in the Airport District may be incompatible with airport operations. Large concentrations of people such as those that occur in schools, can compromise safety (of both people and aircraft) when they are located anywhere within the Airport property boundary or if they fall under the runway’s approach surface. Due to the Airport’s location outside of the City limits of Oroville, the zoning designations within a two mile radius of the Airport fall under the County’s Minimum Requirement District. The uses within this area are described above under the Okanogan County Zoning subsection.

Dorothy Scott Airport Airport Layout Plan Report-Inventory 1-10
Comprehensive Plan Goals and Policies Okanogan County Comprehensive Plan Since Okanogan County is not required to plan under GMA, a comprehensive plan is not required. The County is required, however, to plan for Critical Areas and Natural Resources Lands. The County will have its first update of the Critical Areas and Natural Resources Lands completed by December 1, 2007. Okanogan County does have a comprehensive plan, however it is in the process of being revised; a draft document is in place, dated June, 2005. The Transportation Element of the plan is not addressed in this draft document. City of Oroville Comprehensive Plan The City of Oroville adopted a comprehensive plan on October 17, 1995. The Airport is addressed under the Public Facilities Element. The goal of this element is to “coordinate location, expansion, and timing of public facilities and utilities to meet present demand and allow for future growth in a cost effective manner.” A description of the Airport in regard to location, elevation, runway length and existing facilities is included in the comprehensive plan text. There is also discussion included on future plans for an airport industrial/business park. The Airport is not specifically addressed as an Essential Public Facility and there are no specific policies discouraging the development of incompatible land uses adjacent to the Airport.

Dorothy Scott Airport Airport Layout Plan Report-Forecast
2-1
Chapter Two Airport Layout Plan Report FORECAST Dorothy Scott Airport INTRODUCTION Aviation demand forecasts help to determine the size and timing of needed airport improvements. This chapter indicates the types and levels of aviation activity expected at Dorothy Scott Airport during the forecast period of 2005 through 2025. The methodology followed is from “Forecasting Aviation Activity by Airport,” GRA, Incorporated, July 2001. AVIATION ACTIVITY PARAMETERS AND MEASURES TO FORECASTS For Dorothy Scott Airport, the following activity categories are projected: • Based Aircraft, including fleet mix. • Aircraft Operations, including air taxi, general aviation (GA), and local vs. Itinerant. • Airport Reference Code, which defines the appropriate FAA criteria for airport design and is
determined by the most demanding aircraft that regularly uses the airport.
Dorothy Scott Airport Airport Layout Plan Report-Forecast
2-2
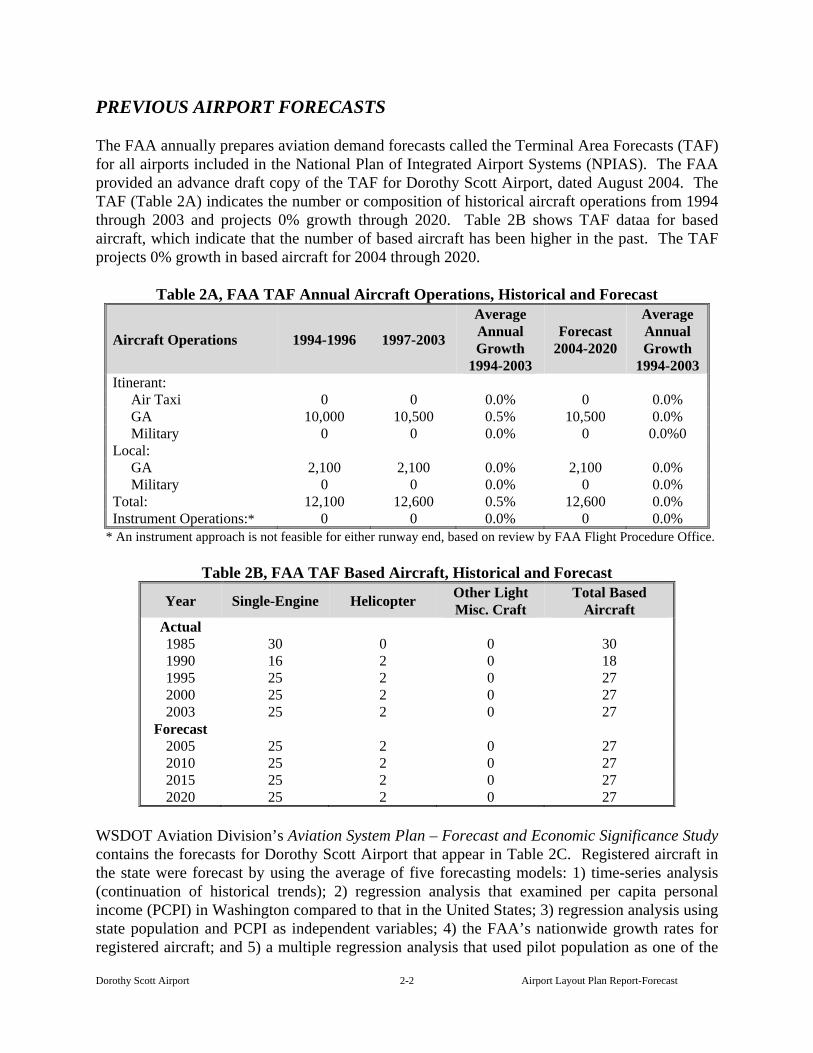
PREVIOUS AIRPORT FORECASTS The FAA annually prepares aviation demand forecasts called the Terminal Area Forecasts (TAF) for all airports included in the National Plan of Integrated Airport Systems (NPIAS). The FAA provided an advance draft copy of the TAF for Dorothy Scott Airport, dated August 2004. The TAF (Table 2A) indicates the number or composition of historical aircraft operations from 1994 through 2003 and projects 0% growth through 2020. Table 2B shows TAF dataa for based aircraft, which indicate that the number of based aircraft has been higher in the past. The TAF projects 0% growth in based aircraft for 2004 through 2020.
Table 2A, FAA TAF Annual Aircraft Operations, Historical and Forecast
Aircraft Operations 1994-1996 1997-2003
Average Annual Growth
1994-2003
Forecast 2004-2020
Average Annual Growth
1994-2003 Itinerant: Air Taxi 0 0 0.0% 0 0.0% GA 10,000 10,500 0.5% 10,500 0.0% Military 0 0 0.0% 0 0.0%0 Local: GA 2,100 2,100 0.0% 2,100 0.0% Military 0 0 0.0% 0 0.0% Total: 12,100 12,600 0.5% 12,600 0.0% Instrument Operations:* 0 0 0.0% 0 0.0%
* An instrument approach is not feasible for either runway end, based on review by FAA Flight Procedure Office.
Table 2B, FAA TAF Based Aircraft, Historical and Forecast
Year Single-Engine Helicopter Other Light Misc. Craft
Total Based Aircraft
Actual 1985 30 0 0 30 1990 16 2 0 18 1995 25 2 0 27 2000 25 2 0 27 2003 25 2 0 27
Forecast 2005 25 2 0 27 2010 25 2 0 27 2015 25 2 0 27 2020 25 2 0 27
WSDOT Aviation Division’s Aviation System Plan – Forecast and Economic Significance Study contains the forecasts for Dorothy Scott Airport that appear in Table 2C. Registered aircraft in the state were forecast by using the average of five forecasting models: 1) time-series analysis (continuation of historical trends); 2) regression analysis that examined per capita personal income (PCPI) in Washington compared to that in the United States; 3) regression analysis using state population and PCPI as independent variables; 4) the FAA’s nationwide growth rates for registered aircraft; and 5) a multiple regression analysis that used pilot population as one of the

Dorothy Scott Airport Airport Layout Plan Report-Forecast
2-3
variables. The registered aircraft forecasts were distributed among the counties according to the actual distribution in 1998, with adjustments in the future to consider different population and PCPI growth forecast by the State. Based aircraft for individual airports were forecast by holding constant the market share of the aircraft based in the county to the number of aircraft registered in that county. To forecast aircraft operations, a utilization rate (operations per based aircraft) was calculated. Except where specific conditions were noted, the utilization rate at each airport was increased uniformly by 0.3% for 2005, 0.33% for 2010, .36% for 2015, and 0.39% for 2020.
Table 2C, Washington Aviation System Plan Forecasts 2000 2005 2010 2015 2020 Annual Growth
2000-2020 Aircraft Operations Itinerant: GA 10,500 10,500 10,600 10,600 10,700 0.1% Local: GA 2,100 2,100 2,100 2,100 2,100 0.0% Total Operations 12,600 12,600 12,700 12,700 12,800 0.1% Instrument Approaches 0 218 220 220 222 0.1%* Total Based Aircraft 19 19 19 19 19 0.0% Single Engine Piston 18 18 18 18 18 0.0% Rotor 1 1 1 1 1 0.0%
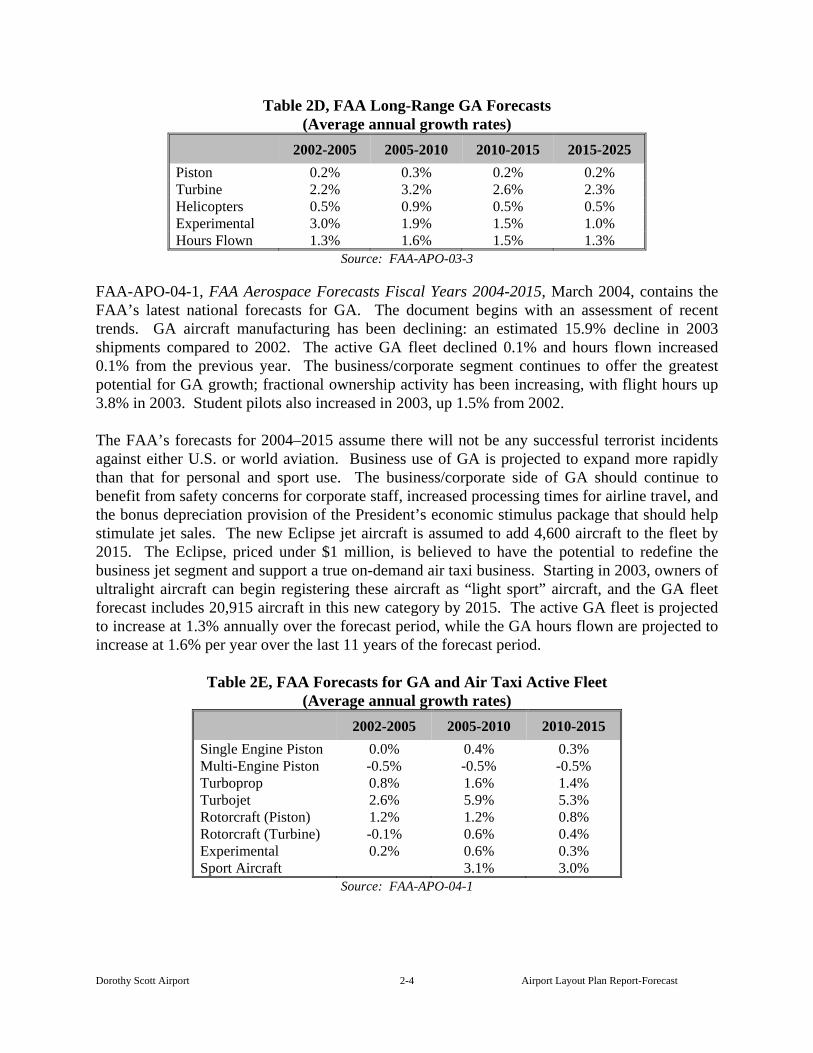
*Annual growth rate is for 2005-2020, since there were no instrument approaches in 2000. NATIONAL TRENDS FORECAST BY FAA FAA-APO-03-3, FAA Long-Range Forecasts, Fiscal Years 2015, 2020, 2025, and 2030, June 2003, contains forecasts of long-term growth in GA aircraft, GA hours flown, and pilots. GA activity is very sensitive to changes in fuel price and economic growth. Forecast assumptions include sustained economic growth, relative stability in fuel prices, and continued growth in fractional ownership programs and corporate flying. Also important to GA growth is continued investment in production by GA aircraft manufacturers. Pilot growth is aided by recent industry program initiatives designed to promote GA. According to FAA-APO-03-3, the number of active GA aircraft is expected to increase at an average annual growth rate of 0.5%, with slower growth for the piston engine portion of the fleet than the turbine portion, reflecting more business and corporate use of GA aircraft in an expanding U.S. economy. Flight hours are projected to increase at a faster rate than the fleet, 1.5% annually through 2014, and 1.2% annually from 2015 through 2030. The number of pilots is forecast to grow at an average annual rate of 1.2% over the 28-year period.
Dorothy Scott Airport Airport Layout Plan Report-Forecast
2-4
Table 2D, FAA Long-Range GA Forecasts (Average annual growth rates)
2002-2005 2005-2010 2010-2015 2015-2025 Piston 0.2% 0.3% 0.2% 0.2% Turbine 2.2% 3.2% 2.6% 2.3% Helicopters 0.5% 0.9% 0.5% 0.5% Experimental 3.0% 1.9% 1.5% 1.0% Hours Flown 1.3% 1.6% 1.5% 1.3%
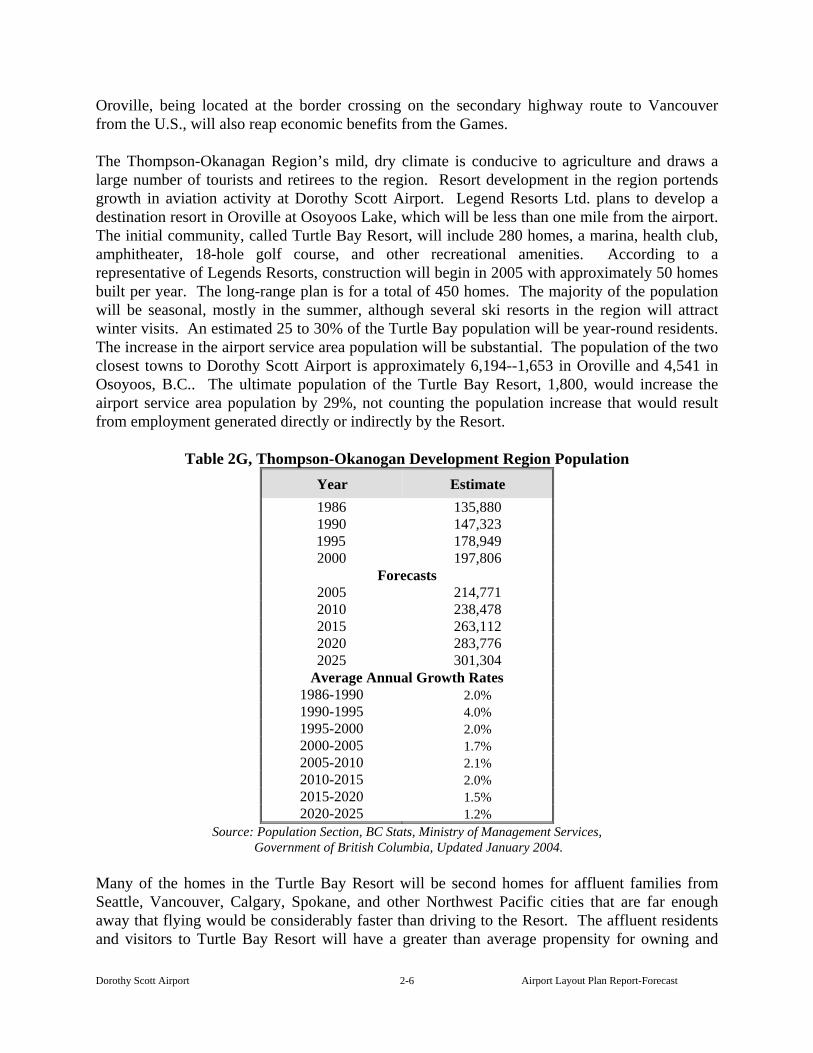
Source: FAA-APO-03-3 FAA-APO-04-1, FAA Aerospace Forecasts Fiscal Years 2004-2015, March 2004, contains the FAA’s latest national forecasts for GA. The document begins with an assessment of recent trends. GA aircraft manufacturing has been declining: an estimated 15.9% decline in 2003 shipments compared to 2002. The active GA fleet declined 0.1% and hours flown increased 0.1% from the previous year. The business/corporate segment continues to offer the greatest potential for GA growth; fractional ownership activity has been increasing, with flight hours up 3.8% in 2003. Student pilots also increased in 2003, up 1.5% from 2002. The FAA’s forecasts for 2004–2015 assume there will not be any successful terrorist incidents against either U.S. or world aviation. Business use of GA is projected to expand more rapidly than that for personal and sport use. The business/corporate side of GA should continue to benefit from safety concerns for corporate staff, increased processing times for airline travel, and the bonus depreciation provision of the President’s economic stimulus package that should help stimulate jet sales. The new Eclipse jet aircraft is assumed to add 4,600 aircraft to the fleet by 2015. The Eclipse, priced under $1 million, is believed to have the potential to redefine the business jet segment and support a true on-demand air taxi business. Starting in 2003, owners of ultralight aircraft can begin registering these aircraft as “light sport” aircraft, and the GA fleet forecast includes 20,915 aircraft in this new category by 2015. The active GA fleet is projected to increase at 1.3% annually over the forecast period, while the GA hours flown are projected to increase at 1.6% per year over the last 11 years of the forecast period.
Table 2E, FAA Forecasts for GA and Air Taxi Active Fleet (Average annual growth rates)
2002-2005 2005-2010 2010-2015 Single Engine Piston 0.0% 0.4% 0.3% Multi-Engine Piston -0.5% -0.5% -0.5% Turboprop 0.8% 1.6% 1.4% Turbojet 2.6% 5.9% 5.3% Rotorcraft (Piston) 1.2% 1.2% 0.8% Rotorcraft (Turbine) -0.1% 0.6% 0.4% Experimental 0.2% 0.6% 0.3% Sport Aircraft 3.1% 3.0%
Source: FAA-APO-04-1

Dorothy Scott Airport Airport Layout Plan Report-Forecast
2-5
POPULATION FORECASTS Community population and income within an airport’s service area usually correlate with activity levels at the airport. Dorothy Scott Airport’s service area is the northern end of Okanogan County and the southern end of the Thompson-Okanagan Development Region, one of eight development regions in British Columbia. The closest public airports to Dorothy Scott are approximately 30 nautical miles away, Omak to the south and Penticton (British Columbia) to the north. Consequently, the service area for Dorothy Scott is a radius of approximately 15 nautical miles, extending halfway to the next closest public airports. Table 2F indicates historical population and three forecasts for future populations in Okanogan County.
Table 2F, Okanogan County Population Year Population 1980 30,663 1985 32,687 1990 33,350 1995 38,943 2000 39,564
Forecasts Low Medium High
2005 39,219 41,458 43,904 2010 40,712 44,061 47,850 2015 41,776 46,315 51,549 2020 42,170 47,920 54,629 2025 42,394 49,410 57,661
Average Annual Growth Rates 1980-1985 1.3% 1985-1990 0.4% 1990-1995 3.1% 1995-2000 0.3% 2000-2005 -0.2% 0.9% 2.1% 2005-2010 0.8% 1.2% 1.7% 2010-2015 0.5% 1.0% 1.5% 2015-2020 0.2% 0.7% 1.2% 2020-2025 0.1% 0.6% 1.1% Source: State of Washington Office of Financial Management,
Projections released January 2002 Table 2G indicates historical and projected future population in the Thompson-Okanagan Development Region. The growth rates projected by the British Columbia government are similar to the high population growth rates the State of Washington Office of Financial Management has projected for Okanogan County, between 1% and 2% per year. British Columbia is projecting economic and population growth in the future. The Vancouver 2010 Olympic and Paralympic Games in British Columbia are expected to generate up to $10 billion in direct economic activity and 228,000 direct and indirect job years across the province.
Dorothy Scott Airport Airport Layout Plan Report-Forecast
2-6
Oroville, being located at the border crossing on the secondary highway route to Vancouver from the U.S., will also reap economic benefits from the Games. The Thompson-Okanagan Region’s mild, dry climate is conducive to agriculture and draws a large number of tourists and retirees to the region. Resort development in the region portends growth in aviation activity at Dorothy Scott Airport. Legend Resorts Ltd. plans to develop a destination resort in Oroville at Osoyoos Lake, which will be less than one mile from the airport. The initial community, called Turtle Bay Resort, will include 280 homes, a marina, health club, amphitheater, 18-hole golf course, and other recreational amenities. According to a representative of Legends Resorts, construction will begin in 2005 with approximately 50 homes built per year. The long-range plan is for a total of 450 homes. The majority of the population will be seasonal, mostly in the summer, although several ski resorts in the region will attract winter visits. An estimated 25 to 30% of the Turtle Bay population will be year-round residents. The increase in the airport service area population will be substantial. The population of the two closest towns to Dorothy Scott Airport is approximately 6,194--1,653 in Oroville and 4,541 in Osoyoos, B.C.. The ultimate population of the Turtle Bay Resort, 1,800, would increase the airport service area population by 29%, not counting the population increase that would result from employment generated directly or indirectly by the Resort.
Table 2G, Thompson-Okanogan Development Region Population Year Estimate 1986 135,880 1990 147,323 1995 178,949 2000 197,806
Forecasts 2005 214,771 2010 238,478 2015 263,112 2020 283,776 2025 301,304
Average Annual Growth Rates1986-1990 2.0% 1990-1995 4.0% 1995-2000 2.0% 2000-2005 1.7% 2005-2010 2.1% 2010-2015 2.0% 2015-2020 1.5% 2020-2025 1.2%
Source: Population Section, BC Stats, Ministry of Management Services, Government of British Columbia, Updated January 2004.
Many of the homes in the Turtle Bay Resort will be second homes for affluent families from Seattle, Vancouver, Calgary, Spokane, and other Northwest Pacific cities that are far enough away that flying would be considerably faster than driving to the Resort. The affluent residents and visitors to Turtle Bay Resort will have a greater than average propensity for owning and

Dorothy Scott Airport Airport Layout Plan Report-Forecast
2-7
chartering aircraft. Legends Resorts has written the City of Oroville, “The proximity of the Airport (five minutes) is very positive; a major factor in the marketing and sales program of this upscale Development in that it is such a significant factor for a destination Resort….We respectfully submit that improvements to available services at the Oroville Airport particularly in the areas of Terminal facilities and fuel sales are needed and would certainly enhance the sales absorptions of the Turtle Bay Resort and in the longer term increase visitors to the Resort with considerable economic spin off to the City.” DOROTHY SCOTT AIRPORT FORECASTS For the Dorothy Scott Airport forecasts, growth rates and methodologies from four different sources were examined—the FAA’s Terminal Area Forecasts, the Washington Aviation System Plan, the State of Washington Office of Financial Management Population Forecasts, and the British Columbia Thompson-Okanagan Population Forecasts. BASED AIRCRAFT FORECASTS The inventory effort for this report found that the actual number of based aircraft in 2004, 28, differs from the TAF, which reported 27 for 2003, and from the Washington Aviation System Plan, which reported 19 for 2000. The differences in these numbers imply that the fleet based at Dorothy Scott Airport has been growing in recent years. From 19 aircraft in 2000 (Washington Aviation System Plan) to 27 aircraft in 2003 (TAF) represents 9.2% average annual growth. The growth from 2003 to 2004, from 27 to 28 aircraft, is a 3.7% annual increase. Table 2H presents the based aircraft forecasts that resulted from four different models, using the actual number of based aircraft, 28, instead of the base year numbers in the TAF and Washington Aviation System Plan. Table 2H does not contain the actual forecast numbers that are in the TAF.
Table 2H, Comparison of Based Aircraft Forecast Models
Year FAA
Growth Rate
State Growth
Rate
Selected High County Population
Growth Rate
Thompson-Okanagan
Region Growth Rate
2004 28 28 28 28 Forecasts
2005 28 28 29 28 2010 28 28 31 32 2015 28 28 34 35 2020 28 28 36 38 2025 28 28 38 40
Average Annual Growth Rate2004-2025 0.0% 0.0% 1.4% 1.7%
Notes: FAA and State growth rates = 0.0% annual growth from draft Terminal Area Forecasts, August 2004, and from Washington Aviation System Plan – Forecast and Economic Significance Study

Dorothy Scott Airport Airport Layout Plan Report-Forecast
2-8
High County population growth rates from Table 2F Thompson-Okanagan Development Region population growth rates from Table 2G
The FAA and State model projections for no growth seem unreasonable low, considering recent growth and the Turtle Bay Resort development, which will substantially increase air service area population, raise the per capita income in the service area, and create a new destination attractive for GA. The model that uses the Thompson-Okanagan Development Region population growth rate provides a 1.7% annual growth in based aircraft, higher than the 1.3% annual growth in the active GA fleet from the most recent national FAA forecasts for GA. The High County Population model, with 1.4% annual growth, is close to the FAA’s nationwide forecast rate of 1.3% and is the selected forecast model for based aircraft. AIRCRAFT OPERATIONS FORECASTS Different sources indicate annual aircraft operations at Dorothy Scott Airport have totaled 12,600 for several years. However, it is likely the operations number has not been changed due to the lack of records, observations, or other information that would justify a different number. Airport management reports traffic at the airport seems to be increasing, evidenced by growing aviation gasoline sales. Transient aircraft activity is thought to be increasing. The airport receives a relatively high percentage of transient traffic, since it is a port of entry into the U.S., is a convenient place for clearing Customs quickly, and is located on a major route for air traffic traveling between Alaska, Canada, and the Lower 48. If jet fuel sales were available at the airport, even more transient traffic would use the airport. The Airport Manager estimated a turbojet aircraft lands at the airport about four times a year now. Table 2I shows the operations forecasts for Dorothy Scott Airport, using three different forecasting models. The FAA Growth Rate Model uses the TAF projection of no future growth, which seems unreasonable, considering the Turtle Bay Resort development, the growth of tourism in the region, the expected increase in cross-border traffic for the 2010 Games, and the likelihood that jet fuel sales will be available at the airport in the future. The County Population model provides the same growth rate for operations as the selected growth rate for based aircraft, 1.4% per year. This is not consistent the FAA’s national forecasts that project the hours flown in GA aircraft will grow more rapidly than the GA fleet. It is also not consistent with anecdotal information from airport management that the amount of transient traffic is increasing, which would tend to increase the ratio of operations per based aircraft. The selected forecast uses the State Aviation System Plan’s aircraft utilization method. Annual operations per based aircraft are projected to grow from 450 now to 458 in 2025. A slight increase in utilization is consistent with recent FAA forecasts for hours flown in GA and air taxi aircraft. The selected growth rate, 1.5% per year, is slightly higher than the based aircraft growth rate, reflecting the increase in utilization. This forecast was selected because it provides a more reasonable annual growth rate than the other forecast models and is nearly the same as the most recent national projection for GA hours flown (1.6% per year).
Table 2I, Comparison of Aircraft Operations Forecast Models

Dorothy Scott Airport Airport Layout Plan Report-Forecast
2-9
Year FAA
Growth Rate
Selected State
Growth Rate
High Population
Growth Rate
2004 12,600 12,600 12,600
2005 12,600 12,903 12,865 2010 12,600 14,084 13,996 2015 12,600 15,227 15,078 2020 12,600 16,226 16,004 2025 12,600 17,210 16,904
2004-2025 0.0% 1.5% 1.4%
Notes: FAA growth rate = 0.0% annual growth from draft Terminal Area Forecasts, August 2004 State growth = growing aircraft utilization method from Washington Aviation System Plan – Forecast and Economic Significance Study High County population growth rates from Table 2F
SELECTED FORECASTS Table 2J presents the selected forecasts for based aircraft and aircraft operations. Based aircraft are projected to grow 1.4% annually and aircraft operations are projected to grow 1.5% annually. Table 2J’s mix of based aircraft and aircraft operations and its forecast of instrument approaches are explained in the following section.
Table 2J, Dorothy Scott Airport Aviation Demand Forecasts Based Aircraft Aircraft Operations
Year Single Engine
Turbo-prop
Heli-copte
r
Light Spor
t
Total Based
Aircraft
Air Taxi
Itinerant GA
Local GA
Total Operation
s
Inst. Approache
s Current 25 0 2 1 28 0 10,500 2,100 12,600 0
2005 26 0 2 1 29 50 10,668 2,185 12,903 0 2010 27 1 2 1 31 58 11,642 2,384 14,084 353 2015 29 1 2 2 34 66 12,584 2,577 15,227 381 2020 30 1 3 2 36 76 13,405 2,745 16,226 407 2025 32 1 3 2 38 87 14,212 2,911 17,210 432
Throughout the 20-year planning period, the fleet mix of based aircraft is expected to change slightly. Table 2K shows the fleet mix projected through 2025. Consistent with the national FAA forecasts described earlier, single engine piston aircraft are expected to grow at a slower rate than other GA aircraft, resulting in a declining share of the Dorothy Scott based aircraft fleet. A turboprop aircraft, such as the King Air B100 that is now used regularly at the airport, is assumed to be based at Dorothy Scott in the future. The turboprop aircraft might belong to one

Dorothy Scott Airport Airport Layout Plan Report-Forecast
2-10
of the government agencies active in the region or to a local business or resident. Helicopters’ share of the fleet is projected to be constant through the forecast period. Light sport aviation is projected to have a growing presence at Dorothy Scott Airport because it is recreational and suited to people who come to the region to enjoy outdoor recreation. In addition, light sport aviation is expected to boom nationwide following the aviation regulation issued in mid-2004 that created Light Sport Pilot certification.
Table 2K, Based Aircraft Fleet Mix
Year Single Engine Turboprop Helicopter Light Sport
2004 25 (89%) 0 (0%) 2 (7%) 1 (4%) 2005 26 (89%) 0 (0%) 2 (7%) 1 (4%) 2010 27 (86%) 1 (3%) 2 (7%) 1 (4%) 2015 29 (85%) 1 (3%) 2 (7%) 2 (5%) 2020 30 (85%) 1 (3%) 3 (7%) 2 (5%) 2025 32 (85%) 1 (3%) 3 (7%) 2 (5%)
The aircraft operations forecast in Table 2J is divided among air taxi, GA local, and GA itinerant categories. When Turtle Bay Resort is built, it is likely the airport will see more air taxi aircraft than it does now. In 2005, as resort construction begins, it is estimated that 50 air taxi aircraft operations (on average, about two aircraft landings per month) will occur at the airport. Air taxi operations are projected to nearly double over the forecast period. Military aircraft do not use the airport now, and there is no indication they will in the future. GA aircraft operations are classified as itinerant or local (touch-and-go and other operations that remain within 20 miles of the airport). While the Airport Manager has noticed strong growth in flight training activity (local operations) recently, he also noted that agricultural spraying, which also contributes to the number of local operations, has declined. Local operations by Border Patrol aircraft are expected to remain at relatively constant levels in the future. Consequently, there is no indication that the portion of operations that are local will change appreciably. For the forecast years, it is assumed that the proportions of local and itinerant operations will remain constant, 17% local and 83% itinerant. Table 2J shows a forecast of instrument approaches, although the airport does not have an instrument approach now. The Washington Aviation System Plan forecasts assumed that all public-use airports in the state would have a minimum of one GPS approach. For this Airport Layout Plan Report, it is assumed that Dorothy Scott Airport will have an instrument approach in place by 2010. The forecast of instrument approaches follows the methodology in the Washington Aviation System Plan. Instrument weather is estimated to occur 9% of the time east of the Cascade Mountains. All air taxi approaches and 46.1% of GA aircraft approaches are assumed instrument approaches, consistent with assumptions in the Washington Aviation System Plan. AIRPORT REFERENCE CODE AND CRITICAL AIRCRAFT

Dorothy Scott Airport Airport Layout Plan Report-Forecast
2-11
The current critical aircraft is the turboprop Beech King Air B100 (11,800 pounds maximum takeoff weight), which is now used for medical evacuation and by approximately three other operators in the area. The current and forecast ARC for Dorothy Scott Airport is B-I (small). The future ARC is based on a family of critical aircraft projected to use the airport. These aircraft include the King Air, and other small business jets, such as some models of the Learjet, the Dassault Falcon 10, and the Rockwell Sabre 40/60, which all have Maximum Takeoff Weights of less than 12,500 pounds. Table 2L presents the estimated breakdown of the forecast GA aircraft operations by ARC and weight. Transient aircraft are reported to be somewhat larger and faster than the aircraft based at the airport. Statistics on the international aircraft that use the airport support this. Based on statistics for October 2003 through October 2004 tabulated by a US Customs representative, approximately 1,000 annual aircraft operations at the airport are by international aircraft. These 1,000 operations are divided among single engine aircraft (76%), twin engine aircraft (17%), and helicopters (7%).
Table 2L, Dorothy Scott Airport GA Operations Mix Airport Reference Code NA A-I B-I B-I
Takeoff Weight (pounds) Helicopters
Small (max. 12,500)
Small (max.
12,500)
13,000-19,000
2005 Local 153 (7%) 2,032 (93%) 0 (0%) 0 (0%) Itinerant 748 (7%) 9,067 (85%) 853 (8%) 0 (0%) 2010 Local 167 (7%) 2,217 (93%) 0 (0%) 0 (0%) Itinerant 815 (7%) 9,663 (83%) 1,048 (9%) 116 (1%) 2015 Local 180 (7%) 2,397 (93%) 0 (0%) 0 (0%) Itinerant 881 (7%) 10,444 (83%) 1,133 (9%) 126 (1%) 2020 Local 192 (7%) 2,553 (93%) 0 (0%) 0 (0%) Itinerant 938 (7%) 10,992 (82%) 1,341 (10%) 134 (1%) 2025 Local 204 (7%) 2,707 (93%) 0 (0%) 0 (0%) Itinerant 995 (7%) 11,654 (82%) 1,421 (10%) 142 (1%)
AIRPORT PLANNING FORECAST RESULTS COMPARED WITH TAF Table 2M compares the selected forecasts for Dorothy Scott Airport with the draft TAF numbers. The selected forecasts are higher than the TAF numbers. One reason is that the TAF’s number of based aircraft in 2003 is less than the actual number of based aircraft in 2004. The TAF projects no future growth from the 2003 numbers of based aircraft and operations, while the selected forecasts project moderate growth, spurred by local population growth and economic development.

Dorothy Scott Airport Airport Layout Plan Report-Forecast
2-12
Table 2M, Comparison of Selected Forecasts with Terminal Area Forecasts Based Aircraft Forecast Operations Forecast
Year TAF Selected Difference TAF Selected Difference 2005 27 29 6% 12,600 12,903 2% 2010 27 31 15% 12,600 14,084 12% 2015 27 34 24% 12,600 15,227 21% 2020 27 36 32% 12,600 16,226 29%

Dorothy Scott Airport Airport Layout Plan Report- Facilities Requirements/Alternatives
3-1
Chapter Three AIRPORT FACILITY Airport Layout Plan Report
REQUIREMENTS/ALTERNATIVES Dorothy Scott Airport In this chapter, existing components of the airport are evaluated so that the capacities of the overall system are identified. Once identified, the existing capacity is compared to the forecast activity levels prepared in Chapter Two to determine where deficiencies currently exist or may be expected to materialize in the future. Once deficiencies in a component are identified, a more specific determination of the approximate sizing and timing of the new facilities can be made. The objective of this effort is to identify, in general terms, the adequacy of the existing airport facilities and outline what new facilities may be needed and when they may be needed to accommodate forecast demands. Having established these facility requirements, alternatives for providing these facilities will be evaluated to determine the most cost-effective and efficient means for implementation. Airport facilities include both airfield and landside components. Airfield facilities include those facilities that are related to the arrival, departure, and ground movement of aircraft. These components include: Runways Taxiways Navigational Approach Aids Lighting, Markings, and Signage

Dorothy Scott Airport Airport Layout Plan Report- Facilities Requirements/Alternatives
3-2
Landside facilities are needed for the interface between air and ground transportation modes. This includes components for general aviation needs such as: Aircraft Hangars Aircraft Parking Aprons Auto Parking and Access Airport Support Facilities PLANNING HORIZONS The cost-effective, efficient, and orderly development of an airport should rely more upon actual demand at an airport than a time-based forecast figure. In order to develop an airport layout plan that is demand-based rather than time-based, a series of planning horizon milestones have been established for Dorothy Scott Airport that take into consideration the reasonable range of aviation demand projections. It is important to consider that the actual activity at the airport may be higher or lower than projected activity levels. By planning according to activity milestones, the resultant plan can accommodate unexpected shifts, or changes in the area’s aviation demand. It is important that the plan accommodate these changes so that the Airport can respond to unexpected changes in a timely fashion. These milestones provide flexibility, while potentially extending this plan’s useful life if aviation trends slow over the period. The most important reason for utilizing milestones is that they allow the airport to develop facilities according to need generated by actual demand levels. The demand-based schedule provides flexibility in development, as development schedules can be slowed or expedited according to actual demand at any given time over the planning period. Improvements to the airport presented in the report should be correlated to the volume of activity of a change in service at the airport. The resultant plan provides airport officials with a financially responsible and need-based program. Table 3A presents the planning horizon milestones for each activity demand category. TABLE 3A: Aviation Demand Planning Horizons
Demand Category Current Short Term
(2010)
Intermediate Term (2015)
Long Term (2025)
Operations Local Itinerant Total
2,100 10,500 12,600
2,384 11,700 14,084
2,577 12,650 15,227
2,911 14,299 17,210
Based Aircraft 28 31 34 38 Note: Itinerant forecast includes air taxi operations
Dorothy Scott Airport Airport Layout Plan Report- Facilities Requirements/Alternatives
3-3
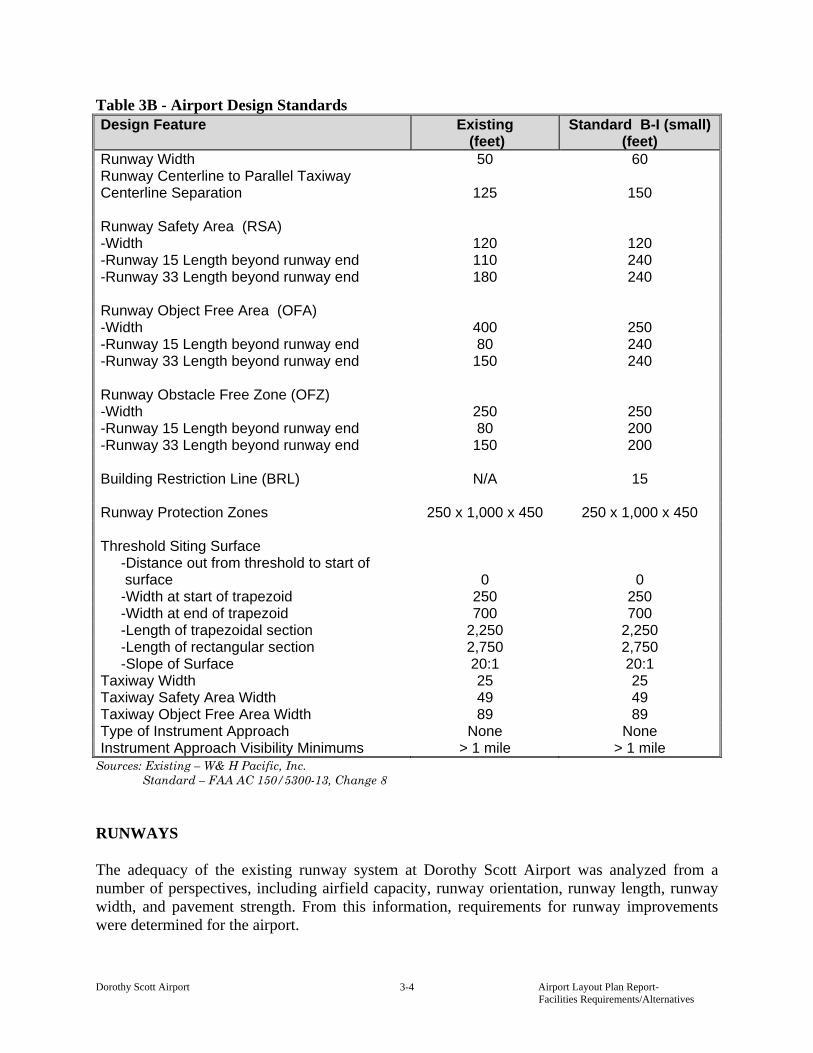
AIRFIELD REQUIREMENTS Airfield requirements include the need for those facilities related to the arrival and departure of aircraft. The adequacy of existing airfield facilities at Dorothy Scott Airport have been analyzed from a number of perspectives, including airfield capacity, runway length, runway pavement strength, airfield lighting, navigational aids, and pavement markings. AIRFIELD DESIGN STANDARDS In order to determine facility requirements, the Airport Reference Code (ARC) must be referred to in order for the appropriate airport design criteria to be applied. As discussed in Chapter Two, the existing ARC for Dorothy Scott Airport is B-I (small) and the critical aircraft is a Beech King Air B100. The forecasts anticipate the Airport maintaining the current operational fleet mix, which will continue to place the Airport in the B-I (small) category. Facility requirements will be developed based on these assumptions. The FAA has established several airport design standards to protect aircraft operational areas and keep them free from obstructions that could affect the safe operation of aircraft. These include the runway safety area (RSA), object free area (OFA), obstacle free zone (OFZ), and runway protection zone (RPZ). The RSA is “a defined surface surrounding the runway prepared or suitable for reducing the risk of damage to airplanes in the event of an undershoot, overshoot, or an excursion from the runway.” An OFA is an area on the ground centered on the runway or taxiway centerline provided to enhance the safety of aircraft operations. No above ground objects are allowed except for objects that need to be located in the OFA for air navigation or aircraft ground maneuvering purposes. An OFZ is a volume of airspace that is required to be clear of objects, except for frangible items required for navigation of aircraft. It is centered along the runway and extended runway centerline. The RPZ is defined as an area off the runway end to enhance the protection of people and property on the ground. The RPZ is trapezoidal in shape and centered about the extended runway centerline. The dimensions of an RPZ are a function of the runway ARC and approach visibility minimums. As shown in Table 3B, the RSA length beyond Runway 15 end which is 130 feet short of the 240-foot standard, OFA length beyond Runway 15 end which is 90 feet short of the 240-foot standard and RSA and OFA length beyond Runway 33 end which are 60 feet short of the 240-foot standard. The existing 15 foot Building Restriction Line (BRL) is not currently being met. There are several buildings too close to the runway that are penetrating the 14 CFR Part 77 Surface. Options for addressing how to meet the FAA’s standards for the airfield are discussed in the Development Alternatives section of this report.
Dorothy Scott Airport Airport Layout Plan Report- Facilities Requirements/Alternatives
3-4
Table 3B - Airport Design Standards Design Feature Existing
(feet) Standard B-I (small)
(feet) Runway Width 50 60 Runway Centerline to Parallel Taxiway Centerline Separation
125
150
Runway Safety Area (RSA) -Width 120 120 -Runway 15 Length beyond runway end 110 240 -Runway 33 Length beyond runway end 180 240 Runway Object Free Area (OFA) -Width 400 250 -Runway 15 Length beyond runway end 80 240 -Runway 33 Length beyond runway end 150 240 Runway Obstacle Free Zone (OFZ) -Width 250 250 -Runway 15 Length beyond runway end 80 200 -Runway 33 Length beyond runway end 150 200 Building Restriction Line (BRL) N/A 15 Runway Protection Zones 250 x 1,000 x 450 250 x 1,000 x 450 Threshold Siting Surface -Distance out from threshold to start of surface
0
0
-Width at start of trapezoid 250 250 -Width at end of trapezoid 700 700 -Length of trapezoidal section 2,250 2,250 -Length of rectangular section 2,750 2,750 -Slope of Surface 20:1 20:1 Taxiway Width 25 25 Taxiway Safety Area Width 49 49 Taxiway Object Free Area Width 89 89 Type of Instrument Approach None None Instrument Approach Visibility Minimums > 1 mile > 1 mile
Sources: Existing – W& H Pacific, Inc. Standard – FAA AC 150/5300-13, Change 8 RUNWAYS The adequacy of the existing runway system at Dorothy Scott Airport was analyzed from a number of perspectives, including airfield capacity, runway orientation, runway length, runway width, and pavement strength. From this information, requirements for runway improvements were determined for the airport.

Dorothy Scott Airport Airport Layout Plan Report- Facilities Requirements/Alternatives
3-5
Airfield Capacity A demand/capacity analysis measures the capacity of the airfield configuration. Planning standards indicate that when demand reaches 60% of capacity, new facilities should be planned. When demand reaches 80% of capacity, new facilities should be in place. To determine the airfield capacity at Dorothy Scott Airport, the Advisory Circular 150/5060-5, Airport Capacity and Delay was referenced. A typical airport with a single runway and parallel taxiway configuration similar to Dorothy Scott Airport has an annual capacity of 230,000 operations. Since the forecasts for Dorothy Scott Airport remain well below this threshold, the capacity of the existing runway will not be reached; therefore the airfield will be able to meet operational demands. Runway Orientation For the operational safety and efficiency of an airport, it is desirable for the primary runway of an airport's runway system to be oriented as close as possible to the direction of the prevailing wind. This reduces the impact of wind components perpendicular to the direction of travel of an aircraft that is landing or taking off (defined as a crosswind). FAA design standards specify that additional runway configurations are needed when the primary runway configuration provides less than 95 percent wind coverage at specific crosswind components. The 95 percent wind coverage is computed on the basis of crosswinds not exceeding 10.5 knots for small aircraft weighing less than 12,500 pounds and from 13 to 16 knots for aircraft weighing over 12,500 pounds. Current wind data from the National Climatic Data Center (NCDC) is unavailable for Dorothy Scott Airport. A review of nearby airports indicates that Osoyoos is the airport nearest to Dorothy Scott with historical wind data. The Table 3B shows the current wind data for Osoyoos Airport. A review of the wind data indicates that the FAA recommended wind coverage of 95% is exceeded. TABLE 3C, Wind Coverage Percentages
WIND COVERAGE MAXIMUM
CROSSWIND COMPONENT
10.5 KNOTS 13 KNOTS 16 KNOTS 20 KNOTS
ALL WEATHER ALL WEATHER ALL WEATHER ALL WEATHERRUNWAY 15-33 99.93% 99.27% 99.99% 100% Runway Length The determination of runway length requirements should consider both takeoff and landing requirements. Takeoff requirements are a factor of airport elevation, mean maximum temperature of the hottest month, critical aircraft type (or family of aircraft types) expected to use the airport, and stage length of the longest nonstop trip destinations. Aircraft performance declines as each of these factors increase. Landing requirements are a factor of airport elevation,

Dorothy Scott Airport Airport Layout Plan Report- Facilities Requirements/Alternatives
3-6
aircraft landing weight and the runway condition (i.e. dry conditions or wet conditions). The local airport elevation is 1067 feet above mean sea level (MSL) and the mean maximum temperature of the hottest month, July, is 86 degrees Fahrenheit (F). Runway elevation varies by approximately five feet along Runway 15-33. Using the site-specific data described above, runway length requirements for the various classifications of aircraft that may operate at the airport were examined using the FAA Airport Design computer program, Version 4.2D. The program groups general aviation aircraft into several categories, reflecting the percentage of the fleet within each category and useful load (passengers and fuel) of the aircraft. Table 3D summarizes FAA’s generalized recommended runway lengths for Dorothy Scott Airport. (See Appendix for print out of recommended runway lengths). The FAA recommended runway length for the critical aircraft, Beech King Air B100, at Dorothy Scott Airport is 2,579 feet. The existing runway is 4,020 feet long. The FAA computer design program recommends a runway length of 3,980 feet, to accommodate 100% of small airplanes with less than 10 passenger seats. This has been listed in Table 3D below. It is important to note that small aircraft with more than 10 passenger seats may also use the Airport, however, the aircraft’s fuel or passenger load may need to be reduced. Based on the forecasts presented in the previous chapter, the recommendations based on critical aircraft, and the recommendations from the FAA design program, the current runway length of 4,020 feet will be adequate for Dorothy Scott Airport throughout the planning period. Runway length in relationship to airfield design standards is discussed in more detail in the Development Alternatives section of this report. Printouts from the Airport Design program our located in the appendix. TABLE 3D, Runway Length Requirements
AIRPORT AND RUNWAY DATA Airport elevation 1067 feet Mean daily maximum temperature of the hottest month 86 F Maximum difference in runway centerline elevation 5 feet Wet and slippery runways RUNWAY LENGTHS RECOMMENDED FOR AIRPORT DESIGN Small airplanes with less than 10 passenger seats 75 percent of these small airplanes 2,830 feet 95 percent of these small airplanes 3,360 feet 100 percent of these small airplanes 3,980 feet Small airplanes with 10 or more passenger seats 4,400 feet Source: FAA’s Airport Design Computer Program, Version 4.2D utilizing Chapter Two of AC 150/5325-4A, Runway Length Requirements for Airport Design, no changes included.
Dorothy Scott Airport Airport Layout Plan Report- Facilities Requirements/Alternatives
3-7
RUNWAY WIDTH The width of the existing runway was also examined to determine the need for facility improvements. Runway 15-33 currently has a width of 50 feet According to FAA Standards, the minimum runway width ADG I category A and B visual runways, with not lower than three-fourths mile approach visibility minimums is 60-feet. It is recommended that Runway 15-33 be widened to 60 feet to meet ADG I standards. RUNWAY PAVEMENT STRENGTH The most important feature of airfield pavement is its ability to withstand repeated use by aircraft of significant weight. At Dorothy Scott Airport, this includes a wide range of general aviation aircraft including small single and multi-engine aircraft. Runway 15-33 has an existing strength-rating of 5,000 pounds single wheel gear loading (SWG). The critical aircraft for the Dorothy Scott Airport is the Beech King Air B100 with a takeoff weight of 11,800 pounds. It is recommended that Runway 15-33 be strengthened to provide a strength-rating of 12,500 pounds. TAXIWAYS Taxiways are constructed primarily to facilitate aircraft movements to and from the runway system. Some taxiways are necessary simply to provide access between the aprons and the runways, whereas other taxiways become necessary as activity increases at an airport to provide safe and efficient use of the airfield. Taxiway width is determined by the ADG of the critical aircraft to use the taxiway. As previously mentioned, the most demanding aircraft to use the airfield fall within ADG I. According to FAA design standards, the minimum taxiway width for ADG I is 25 feet. Dorothy Scott Airport has a parallel taxiway (Taxiway A) at a width of 24 feet, a midfield connector taxiway (Taxiway B) at a width of 20 feet, an unnamed taxiway south midfield connector at a width of 14 feet, a north connector taxiway (Taxiway C) at 25 feet and a south connector taxiway (Taxiway D) which is 25 feet wide. It is recommended that Taxiways A and B, as well as the unnamed taxiway, be widened to 25 feet to meet ADG I standards. Because Taxiway A is not as long as the runway, aircraft are sometimes required to back taxi on the runway in order to take-off. This could present safety concerns and could affect operational effectiveness at the Airport; therefore it is recommended that the parallel taxiway be extended on both ends. It is important to note that the FAA does not require construction of a parallel taxiway until the Airport has 20,000 annual operations. The FAA recommends a runway centerline to taxiway centerline separation distance of 150 feet for ADG I. The existing runway centerline to taxiway centerline separation distance 129 feet. It is recommended that 150 feet of separation be achieved. How to get this separation is addressed in the alternatives analysis. NAVIGATIONAL AND APPROACH AIDS As discussed in Chapter One, Dorothy Scott Airport does not currently have any navigational or approach aids. However, pilots flying into or out of Dorothy Scott Airport can utilize

Dorothy Scott Airport Airport Layout Plan Report- Facilities Requirements/Alternatives
3-8
NAVAIDS at nearby airports. A Non-Directional Beacon (NDB) is available at Omak Municipal Airport, which is located approximately 31 miles south of Dorothy Scott Airport. The advent of GPS technology can ultimately provide the airport with the capability of establishing new instrument approaches at minimal cost since there is not a requirement for the installation and maintenance of costly ground-based transmission equipment at the airport. The FAA is proceeding with a program to transition from existing ground-based navigational aids to a satellite-based navigation system utilizing GPS technology. The FAA commissioned the Wide Area Augmentation System (WAAS) in July 2003. The WAAS refines the GPS guidance for enroute navigation and approaches. General aviation, corporate, air taxi, and regional airline operators are expected to benefit from this augmentation to GPS signals. The FAA is certifying new approaches at the current rate of about 300 per year, nationally. GPS approaches fit into three categories, each based upon the desired visibility minimum of the approach. The three categories of GPS approaches are: precision, non-precision with vertical guidance, and non-precision. To be eligible for a GPS approach, the airport landing surface must meet specific standards as outlined in FAA AC 150/5300-13, Airport Design, Change 10. Chapter Two: Forecasts, notes that the Washington Aviation System Plan forecasts assumed that all public-use airports in the State would have a minimum of one non-precision GPS approach and that Dorothy Scott Airport will have a GPS approach procedure in place by 2010. The FAA requires that airports having a non-precision GPS approach must have a minimum runway length of 3,200 feet and depending on the visibility minimums, may be required to have an approach lighting system. However the Design AC does state that airports having runways as short as 2,400 feet could support an instrument approach if the lowest Height Above Touchdown (HAT) is based on clearing a 200-foot obstacle within the final approach segment. The FAA Flight Procedures office (FPO) evaluated the areas surrounding the Airport and determined that an instrument approach procedure is not feasible at Dorothy Scott Airport for either runway end. AIRFIELD LIGHTING, SIGNAGE AND MARKING Airports commonly include a variety of lighting and pavement markings to assist pilots utilizing the airport. These lighting systems and marking aids are used to assist pilots in locating the airport during the day, at night, during poor weather conditions, and assisting in the ground movement of aircraft. Identification Lighting Dorothy Scott Airport is equipped with a rotating beacon to assist pilots in locating the airport at night or in low visibility conditions. The existing rotating beacon is old and should be replaced. The beacon location, east of the airfield on top of a mountain, is a good location.

Dorothy Scott Airport Airport Layout Plan Report- Facilities Requirements/Alternatives
3-9
Runway and Taxiway Lighting Airport lighting systems provide critical guidance to pilots during nighttime and low visibility operations. Runway 15-33 is currently equipped with a low intensity runway lighting (LIRL). This system is outdated. It is recommended that the Airport upgrade their runway lighting system to medium intensity runway lighting (MIRL). Effective ground movement of aircraft at night is enhanced by the availability of taxiway lighting. Currently, there are reflectors on the parallel taxiway (Taxiway A). The other taxiways do not have a lighting system or reflectors. Future improvements to taxiways at the Airport should consider installation of reflectors on the connecting taxiways. Taxiway lighting is not required, and a system of edge reflectors may be adequate to serve the needs of the Airport. Visual Approach Lighting In most instances, the landing phase of any flight must be conducted in visual conditions. To provide pilots with visual guidance information during landings to the runway, visual glideslope indicators are commonly provided at airports. Presently, the Airport has a 2 box Precision Approach Path Indicator (PAPI) on the left side of Runway 15. It is recommended that a PAPI be installed on Runway 33. PAPIs contain multiple light units that are angled to provide the pilot with information as to whether he/she is approaching too high or too low. Runway identification lighting provides the pilot with a rapid and positive identification of the runway end. The most basic system involves runway end identifier lights (REILs). There are no REILs available at the Airport at this time. It is recommended that REILs be installed on both runway ends. Pilot-Controlled Lighting Dorothy Scott Airport is equipped with pilot-controlled lighting (PCL). PCL allows pilots to activate the lighting systems at the Airport using the radio transmitter in the aircraft. This system should be maintained through the planning period. Airfield Signage Airfield signage is used to identify runways, taxiways, and apron areas. These aid pilots in determining their position on the airport and provide directions to their desired location on the airport. Dorothy Scott Airport has some signage including runway identification signs located on Taxiways B, C and D. It is recommended that the existing hold signs be removed and lighted hold signs be installed when upgrading the runway lighting system. It is also recommended that designation signs such as a transient apron sign be installed. Lighted distance to go signs may be helpful although they are not required for Dorothy Scott Airport.

Dorothy Scott Airport Airport Layout Plan Report- Facilities Requirements/Alternatives
3-10
Pavement Markings Runway markings are designed according to the type of approach available on the runway. FAA Advisory Circular 150/5340-1J, Marking of Paved Areas on Airports, provides the guidance necessary to design airport markings. Runway 15-33 is currently marked for visual approaches to the Airport. Since an instrument approach was deemed infeasible by the FPO, the existing visual markings will be adequate. Taxiway and apron areas also require marking. Yellow centerline stripes are currently painted on Taxiway B, Taxiways A, C and D have hold lines, although due to separation limitations between Taxiway A and Runway 15-33, the hold lines are not in the correct location. WEATHER REPORTING Dorothy Scott Airport is equipped with a lighted wind cone and a segmented circle, which provides pilots with information about wind conditions and local traffic patterns. These facilities are required when an airport is not served by a 24-hour ATCT. LANDSIDE REQUIREMENTS Landside facilities include hangars, aircraft apron, aircraft tie-downs, and automobile parking. These facilities provide the essential interface between the air and ground transportation modes. The capacities of the various components of each area were examined in relation to projected demand to identify future landside facility needs. HANGARS Utilization of hangar space varies as a function of local climate, security, and owner preferences. The trend in general aviation aircraft, whether single or multi-engine, is toward higher performance aircraft. Therefore, many aircraft owners prefer enclosed hangar space to outside tie-downs. The demand for aircraft storage hangars is dependent upon the number and type of aircraft expected to be based at the airport in the future. For planning purposes, it is necessary to estimate hangar requirements based upon forecast operational activity. It is worth noting that hangar development should be based on actual demand trends and financial investment conditions, not solely on forecasts. All eight of the existing hangars at Dorothy Scott Airport are currently occupied. The City owns an open hangar that contains eight aircraft. In the case of Dorothy Scott Airport, the forecasts are indicating an increase of seven based aircraft throughout the planning period. It is recommended that this City owned hangar be replaced with a T-hangar that will hold 10 aircraft. It is also recommended that a second 10 unit T-hangar be added to accommodate a portion of the based aircraft that are currently tied down, as well as the additional based aircraft anticipated in the forecasts.
Dorothy Scott Airport Airport Layout Plan Report- Facilities Requirements/Alternatives
3-11
Potential hangar layouts are shown in the “Development Alternatives” section of this chapter. AIRCRAFT PARKING APRON The FAA recommends that tie-down space be provided for all based aircraft not stored in hangars. There are a total of 10 tie-down positions at the Airport. At this time there are not designated areas for based and transient aircraft. The following subsections will discuss the requirements for both types of tie-downs. Based Aircraft Tie-Downs Six of the twenty-five based aircraft at the Airport are currently using tie-downs. There is no hangar space available for these aircraft at this time. Although the City has not maintained a waiting list for hangars, it is understood that the owners of these aircraft would like to have hangar space if it were available. Based on this, the ratio of tied down aircraft to aircraft stored in hangars is expected to change during the planning period. It is recommended that the airport maintain six tie downs for based aircraft. The FAA allocates 300 square yards of space per based aircraft tie-down. Based on this allocation, 1,800 square yards is needed by 2025 to accommodate based aircraft tie-down spaces. Transient Aircraft Tie-Downs In regard to transient aircraft tie-downs, the FAA has developed an approach for determining the number of tie-downs needed for itinerant aircraft operating at an airport. The following steps were taken from FAA Advisory Circular (AC 150/5300-13, Appendix 5, Change 8): Number of annual itinerant operations (from Chapter Two), multiplied by 50 percent (50 percent of annual itinerant operations are departures, divided by 12 (12 months per year), divided by 30 (30 days per month), and then reduced by 50 percent to account for aircraft that do not remain at the Airport. Written as: {[(14,212 x 0.5) ÷ 12] ÷ 30} x 0.5 = 10 Using this methodology, the Airport will need to have transient tie-down space for ten aircraft by 2025. The FAA allocates 360 square yards of space per transient aircraft tie-down. Based on this allocation, 3,600 square yards is needed by 2025 to accommodate transient aircraft tie-down spaces. The airport has an existing tie down apron that can not planned for future use, as it is designed to be demolished in order to construct the parallel taxiway. VEHICLE PARKING The airport does not currently have a designated area for automobile parking. It is typical at general aviation airports, such as Dorothy Scott Airport, for pilots to park their vehicles in their hangars while utilizing their aircraft. For this reason, it is not necessary to provide parking for the same number of vehicles as the number of based aircraft. However, Dorothy Scott Airport currently has a need for designated vehicle parking, and particularly for long term automobile parking, because some tenants leave vehicles there for extended lengths of time. This sometimes

Dorothy Scott Airport Airport Layout Plan Report- Facilities Requirements/Alternatives
3-12
creates a conflict for fuel delivery and airport maintenance. A designated automobile parking lot will reduce the need for vehicles to drive on aircraft movement areas; it will also provide a location for airport patrons and transient traffic to park their vehicles. It is recommended that a parking lot be constructed to accommodate approximately twenty vehicles. Sixteen tie-down spaces are proposed, so these pilots will need space for parking, both aircraft using hangars and tie-down spaces may have passengers who will need parking space, maintenance personnel need parking space and some parking space should be provided for the US Customs Agents. Planning standards use a ratio of about 44 square yards per vehicle. Using this ratio, an area of approximately 880 square yards is needed to accommodate twenty vehicles. HELICOPTER FACILITIES There an existing helicopter pad just south of the City owned Hangar. However, this is not a suitable location for a helicopter pad because of the disturbance caused by the helicopter during take off and landing. It is recommended that a paved helicopter parking facility be constructed to accommodate two helicopters at a greater distance from the other airport facilities. FAA Advisory Circular 150/5390-2B, Heliport Design, provides the guidance necessary to design a helicopter parking facility. SUPPORT FACILITIES Various facilities that do not logically fall within classifications of airfield, terminal area, or general aviation areas have also been identified. These other areas provide certain functions related to the overall operation of the airport, and include: a pilots’ lounge area, aircraft rescue and fire fighting, fuel storage, and airport maintenance facilities. PILOTS’ LOUNGE There is currently a pilots’ lounge at the airport, equipped with a restroom and a telephone. This lounge is also used as a U.S. customs agent’s checkpoint for air traffic arriving from Canada. The current facilities are undersized and inadequate for the needs of the airport. It is recommended that a new pilots’ lounge be constructed as funds become available. AIRCRAFT RESCUE AND FIREFIGHTING Aircraft rescue and firefighting (ARFF) is not a required service at Dorothy Scott Airport. Emergency response services are available through the City of Oroville fire and police department. This will be adequate through the planning period. AIRPORT MAINTENANCE/STORAGE FACILITIES The City maintains the Airport. This situation will be adequate through the planning period.

Dorothy Scott Airport Airport Layout Plan Report- Facilities Requirements/Alternatives
3-13
AVIATION FUEL STORAGE The City of Oroville operates the self-service fueling facilities at the Airport and provides 100LL aircraft fuel and 80 octane gasoline. The existing fuel tanks are under-sized; fuel suppliers will not supply fuel unless other airports order fuel at the same time. It is recommended that larger fuel tanks be installed. Jet A fuel should be made available at the airport as well. SECURITY/FENCING There is currently a four-foot perimeter fence that surrounds the Airport; however, the fencing is in poor condition and there are no gates. Although neither the FAA nor the TSA requires fencing of the airport, it is recommended to enhance safety and security. The installation of a new perimeter fence would aide in keeping wildlife off airport property, limit pedestrian access and create a visual property line for the airport. UTILITIES The existing utilities at the Airport include, water, sewer, power and phone services. These utilities are adequate for the planning period. LAND USE PLANNING AND ZONING There are several items that should be completed with regard to the land use and zoning around the Airport. These recommendations are provided below. The Capital Improvement Plan (CIP) will provide a cost estimate to implement these recommendations. City of Oroville Zoning Code Recommendations:
• Rezone the Airport property as “Airport” to ensure that only compatible uses are occurring within the Airport property boundary. Alternatively, the property could be zoned as “Industrial”, which would help limit incompatible uses.
City of Oroville & Okanogan County Comprehensive Plan Recommendations:
• The final Airport Layout Plan should be adopted by reference into the Comprehensive Plan for Okanagan County and the City of Oroville.
• Identify Dorothy Scott Airport as an Essential Public Facility • Add a summary of planned improvements identified in the Airport Layout Plan to the
transportation inventory. • Insert a description of Dorothy Scott Airport and its facilities (i.e., runway dimensions,
runway orientation, number of hangars, aviation activity levels) into the Okanogan County Comprehensive Plan.

Dorothy Scott Airport Airport Layout Plan Report- Facilities Requirements/Alternatives
3-14
Other Recommendations:
• Discourage incompatible land use adjacent to Dorothy Scott Airport • Adopt a title notice or similar requirement to inform purchasers of property within one
mile of the Airport that their property is located adjacent to or in close proximity to Dorothy Scott Airport and that their property may be impacted by a variety of aviation activities. Note that such activities may include but are not limited to noise, vibration, chemical odors, hours of operations, low overhead flights, and other associated activities.
SUMMARY The intent of this chapter has been to outline the facilities required to meet potential aviation demands projected for Dorothy Scott Airport through the long term planning horizon. The next step is to develop alternatives that best meet these projected needs.

Dorothy Scott Airport Airport Layout Plan Report- Facilities Requirements/Alternatives
3-15
Chapter Three-Subpart One Airport Layout Plan Report
DEVELOPMENT ALTERNATIVES Dorothy Scott Airport Based on the facility requirements, three development alternatives were created. The alternatives are shown in Exhibit 3A (Alternative 1), Exhibit 3B (Alternative 2) and Exhibit 3C (Alternative 3) and are described below. Each of the alternatives presented in the following section have been developed to allow the airport to meet many or all the FAA design standards. A fourth option, a no-action alternative, is available to the City. A no-action alternative is one where the City does not select to complete improvements to the airport to allow the facility to meet the FAA design requirements. These include not meeting the Runway width requirements, runway centerline to taxiway centerline separation requirements, and other describing in the preceding chapter. As the Dorothy Scott Airport is part of the NPIAS, the City is entitled to Non-Primary Entitlement funds under the Airport Improvement Program. The FAA’s policy for airport’s not meeting design requirements is to place the facility in a “maintenance mode”, which essentially allows minor maintenance activities to be funded by the FAA, but no major projects will be funded. This would entail the facility remaining in its current configuration and the supply of some funding to allow for crack sealing and fog sealing activities for pavements. The FAA Flight Procedures Office has determined that an instrument approach procedure is not feasible at either runway end of Dorothy Scott Airport.
Dorothy Scott Airport Airport Layout Plan Report- Facilities Requirements/Alternatives
3-16
AIRSIDE DEVELOPMENT Alternative 1 proposes the following airside development:
• Acquire approximately 7.5 acres on the south end of the airport and 2 acres on the north end of the airport for the runway protection zones and to accommodate taxiway extension (part of this acquisition may be an avigation easement rather than acquisitions of actual property).
• Shift the Runway 15 one hundred eighty feet to the south. Shifting the runway will allow standard RSA & OFA dimensions on the north end of the runway. This option allows the runway length to remain at 4,020 feet. This length will still accommodate 100% of the small airplanes with less than 10 passengers.
• Reconstruct the runway, and widen to 60 feet, and reconstruct other existing aircraft movement area pavement surfaces that are to be left in place to increase the strength rating to 12,500 pounds.
• Remove approximately 3.25 acres of orchard trees to clear the approach at the south end of the airport.
• Reroute the gravel road at the south end of the runway. This will allow standard RSA & OFA dimension on the south end of the runway.
• Relocate the water tank in the orchard at the south end of the runway. • Acquire approximately two acres on the southwest side of the runway to allow taxiway
extension. • Relocate the parallel taxiway 21 feet to the west to provide the standard 150 foot
separation between the runway and the taxiway. Construct the new taxiway the full 25-foot width and the full length of the runway.
• Widen connecting taxiways to 25 feet. • Install REILs on both runway ends. • Install 2-box PAPIs on Runway 33 end.
Alternative 2 proposes the following airside development:
• Acquire approximately 7 acres on the south end of the airport and 2 acres on the north end of the airport for the runway protection zone and to accommodate taxiway extension (part of this acquisition may be an avigation easement rather than acquisitions of actual property).
• Shift the runway 75 feet to the east and 110 feet to the south. This shift allows the existing runway length of 4,020 feet to be maintained and allows standard RSA & OFA dimensions on the north end of the runway. This relocation also allows room for nested T-hangars with a taxi lane to access the back side of the hangars. Due to the low strength rating of the runway, reconstruction of the pavement is recommended in all options.
• Reconstruct the parallel and connecting taxiways and other existing aircraft movement area pavement surfaces that are to be left in place to increase the strength rating to 12,500 pounds.
• Remove approximately 4 acres of orchard trees to clear the approach at the south end of the airport.

Dorothy Scott Airport Airport Layout Plan Report- Facilities Requirements/Alternatives
3-17
• Reroute the gravel road at the south end of the runway. This will allow standard RSA & OFA dimension on the south end of the runway.
• Relocate the water tank in the orchard at the south end of the runway. • Relocate Taxiway A 54 feet to the east. This will allow standard 150 foot separation
between the runway and the taxiway. • Extend parallel taxiway to the full length of the runway. • Widen connecting taxiways to 25 feet. • Install REILs on both runway ends. • Install PAPI on Runway 33.
Alternative 3 proposes the following airside development:
• Acquire approximately 5 acres on the south end of the airport and 2 acres on the north end of the airport for the runway protection zone (part of this acquisition may be an avigation easement rather than acquisitions of actual property).
• Relocate the Runway 15 Threshold 180 feet to the south and the Runway 33 Threshold 200 feet to the north. Relocating the runway thresholds will allow standard RSA & OFA dimensions on the runway ends. With this option, the runway length will change from 4,020 feet to 3,640 feet. This length will still accommodate 95% of the small airplanes with less than 10 passengers.
• Reconstruct runway and other existing aircraft movement area pavement surfaces that are to be left in place to increase the strength rating to 12,500 pounds.
• Reconstruct Runway and other existing pavement surfaces that are to be left in place to increase the strength rating to 12,500 pounds.
• Extend and widen parallel taxiway to the full length of the runway. • Widen connecting taxiways to 25 feet. • Install REILs on both runway ends. • Install PAPI on Runway 33. NOTE: This alternative meets RSA and OFA standard dimensions, however, it does not provide standard runway taxiway separation and therefore if this option is selected, it would affect the Airport’s ability to obtain funding from the FAA to maintain the viability of the facility.
LANDSIDE DEVELOPMENT Landside alternatives contain the same options. Land side development includes:
• Construct a new tie down apron with space for 16 tie downs. • Construct 2 new helicopter pads, 12’ x 20’ near the north end of Taxiway A. • Construct an automobile parking lot for twenty vehicles. This will modify the access to
the ramp area. The parking area would have a drive through lane to access parking and the ramp area, with parking spaces on each side of the drive through lane.
• Construct new hangars. • Construct new pilots’ lounge.

Dorothy Scott Airport Airport Layout Plan Report- Facilities Requirements/Alternatives
3-18
• Install perimeter fence. The fencing in the area of the terminal will need to be designed to accommodate the general public.

Dorothy Scott Airport Airport Layout Plan Report- Facilities Requirements/Alternatives
3-19
Chapter Three-Subpart Two Airport Layout Plan Report
PREFERRED ALTERNATIVE Dorothy Scott Airport During the second airport advisory committee meeting held on May 5, 2005, the committee selected Alternative Number 2 as the preferred alternative. This option provides the greatest long term flexibility to the airport, maintains the current runway length, provides for future aircraft tiedown locations, provides for future helicopter parking locations, and allows the airport the greatest amount of landside expansion of the three alternatives presented. The preferred alternative also meets the FAA design standards for runway/parallel taxiway separation, runway safety area and object free area standards, and maintains a clear approach to both runway ends. The preferred alternative will differ slightly from alternative two presented to the advisory committee based on comments received during the meeting. The runway will be reconstructed with a width of 60 feet instead of 50 feet, and the gravel road at the south end of the runway will be closed instead of being rerouted. This preferred alternative is depicted in Exhibit 3D and will be used as the basis for completing the ALP set. The improvements proposed in the preferred alternative include safety enhancements, storage enhancements, and user amenities for the public. The estimated construction costs and timeline for improvements to be constructed is included in Chapter 5. This is provided as a guide to the City, and if the level of service or activity changes significantly, the order and timing of improvements should be revised. The safety enhancements to the runway should be undertaken as soon as funding allows. The FAA generally recommends a parallel taxiway be constructed when operations at an airport reach 20,000 annual operations. The hangar buildings and associated taxilanes should be constructed as demand dictates.

Dorothy Scott Airport Airport Layout Plan Report-Airport Plans 4-1
Chapter Four Airport Layout Plan Report
AIRPORT PLANS Dorothy Scott The airport plans are one of the last steps in the development of an airport layout plan report. They are a pictorial representation and summarization of the efforts made in the airport layout planning process. The previous chapters on Inventory, Forecasting, and Facility Requirements/Alternatives and the reviews provided by the Airport Advisory Committee supply the basis for the existing and future airport layouts that are shown in the airport layout drawings. As was previously discussed, the development at an airport should rely more on actual demand rather than a time-based forecast. The development shown in the airport plans reflects planned development, but the course and timing of this development must be carried forward as airport activity demands rather than in the exact form it has been presented. AIRPORT LAYOUT PLAN DRAWING SET COVER SHEET The cover sheet shows both the location and the vicinity map for Dorothy Scott. A sheet index to the airport layout plan drawing set is also provided on this sheet. AIRPORT LAYOUT PLAN DRAWING The airport layout plan depicts the current airport layout and the proposed improvements to the airport for the 20-year planning period. Descriptions of the improvements and costs over the next 20-years are included in Chapter 5, Capital Improvements Projects (CIP). As previously
Dorothy Scott Airport Airport Layout Plan Report-Airport Plans 4-2
mentioned, the needs defined in the Facility Requirements/Alternatives (Chapter 3) and the reviews provided by the Advisory Committee were the basis for determining the proposed improvements at Dorothy Scott. The future airport development is shown on the airport layout plan as required by the FAA. The plan can be modified to accommodate development as dictated by demand. Runway visibility minimums, runway protection zones, object free areas, safety areas and other standard airport dimensions are shown in the plan and in the runway data tables. Other tables include an airport data table, buildings/facilities table, and a non-standard conditions and disposition table. TERMINAL AREA PLAN DRAWING The terminal area plan shows a larger view of the runway and hangars from the airport layout plan. AIRPORT AIRSPACE PLAN DRAWING This drawing shows the Part 77 Imaginary Surfaces for the future layout of Dorothy Scott with a USGS map as the background. Airport imaginary surfaces consist of five different types of surfaces. The surface shapes and dimensions as they apply to Dorothy Scott are as follows: Primary Surface: A rectangular surface with a width (centered on the runway centerline) that varies for each runway and a length that extends 200 feet beyond each end of the runway. The elevation of the primary surface corresponds to the elevation of the nearest point of the runway centerline. The width of the primary surface of Runway 15-33 is 250 feet. Approach Surface: A surface centered on the extended runway centerline, starting at each end of the primary surface (200 feet beyond each end of the runway), at a width equal to that of the primary surface and an elevation equal to that of the end of the runway. The approach surfaces at Dorothy Scott reflect visual approaches to both runway ends. The surface extends at a horizontal distance of 5,000 feet at a slope of 20:1 to a width of 1,250 feet. Transitional Surface: A sloping 7:1 surface that extends outward and upward at right angles to the runway centerline from the sides of the primary surface and the approach surfaces. Horizontal Surface: An elliptical surface at an elevation 150 feet above the established airport elevation created by swinging arcs of a 5,000-foot radius from the center of each end of the primary surface. Conical Surface: A surface extending outward and upward from the horizontal surface at a slope of 20:1 for a horizontal distance of 4,000 feet. It is ideal to keep these surfaces clear of obstructions whenever possible. The Part 77 surfaces are the basis for protection of the airspace around the airport. Obstructions to these surfaces are identified in the Obstruction Data Tables (on sheets 3 and 4), along with the plan to address the

Dorothy Scott Airport Airport Layout Plan Report-Airport Plans 4-3
described obstructions. Obstructions to the Part 77 surfaces were determined based on a review of the USGS map and a preliminary survey of obstructions performed by W&H Pacific and RLW Consulting in 2004. Past obstruction removal and the FAA 5010 form were also used to identify the existing obstructions. Obstruction removal has been incorporated into the capital improvement program. RUNWAY APPROACH PLAN & PROFILE DRAWING This drawing provides a plan and profile view of any obstructions within the primary and approach surfaces of the runway. Obstruction Data Tables with proposed dispositions are included for both existing and future scenarios. LAND USE PLAN DRAWING A land use plan has been developed for the airport and the surrounding area. This plan includes the zoning on and around the airport per Chapter 17 (zoning) of the Okanogan County Code. In general, land use concerns associated with the areas around airports fall into one of the following categories:
Lighting Glare, Smoke and Dust Bird Attractions/Landfills Airspace Obstructions and Height Restrictions Electrical Interference Concentrations of People Noise Impacts
Any of these activities can create safety concerns for airport users and people on the ground or can be impacted adversely by airport operations. It is important that these issues be addressed in the land use zoning and development around an airport.

Dorothy Scott Airport Airport Layout Plan Report- Capital Improvement Plan
5-1
Chapter Five CAPITAL IMPROVEMENT Airport Layout Plan Report PROJECTS Dorothy Scott Through the evaluation of the facility requirements and the development of the airport layout plan, the improvements needed at Dorothy Scott over the next 20-year period have been determined. The capital improvement plan provides the basis for planning the funding of these improvements. The planned phases of development are in the 5-, 10- and 20-year time frames. CAPITAL IMPROVEMENT PROJECTS The Capital Improvement Plan (CIP) develops both the timeline for the airport improvements and estimated costs for those improvements. The plan is divided into three phases: Phase I, 2006-2010, Phase II, 2011-2015, and Phase III, 2016-2025. Phase I Phase I is the first five years of the planning period, 2006 to 2010. The projects included in this stage are focused on improving existing facilities and removing obstructions:
1. Fuel Storage 2. Install Perimeter Fence (West Side) 3. Construct New Rectangle Hangar Building 4. New Runway Construction/Relocation (Environmental/Preliminary Engineering)
Dorothy Scott Airport Airport Layout Plan Report- Capital Improvement Plan
5-2
5. New Runway Construction/Relocation (Final Design) 6. Land Acquisition (Runway 15 and 33 RPZ) 7. New Runway Construction/Relocation 8. Relocate Airport Beacon 9. Construct Helicopter Pads
Phase II Phase II is the second five years of the planning period, 2011- 2015. The projects planned during this stage focus on maintaining existing facilities and increasing the amount of hangars and storage area on the airport.
10. Tree Removal at south end of airport (Runway 33 Approach) 11. Install Perimeter Fence (East Side) 12. New Taxiway Construction (Connecting and Taxiway A) 13. Construct New Pilots Lounge 14. Construct New Tie Down Apron 15. New T-Hangar Taxilane Construction 16. Construct New T-Hangar Building 17. Construct New Rectangle Hangar Buildings
Phase III Phase III is the last ten years of the planning period, 2016 – 2025. These projects include:
18. Installation of REIL’s on both runway ends and DTG signs 19. Install PAPI 20. Install Access Control System 21. Pavement Maintenance 22. New T-Hangar Taxilane Construction 23. Construct Parking Lot 24. Construct New T-Hangar Buildings 25. Construct New Rectangle Hangar Buildings 26. Update ALP 27. Construct Airport Access Road 28. Construct Service Road to East Side of Airport
Project Costs A list of improvements and costs over the next 20-years are included in Table 5A at the end of this chapter. All costs are estimated in 2005 dollars. Total project costs include construction, temporary flagging and signing, construction staking, testing, engineering, administration, and contingency, as applicable. Utilities including phone and power are included in all new hangar projects. No water or septic service costs were added for the hangar developments. Table 5B presents the CIP in the FAA’s formatted spreadsheet.

Dorothy Scott Airport Airport Layout Plan Report- Capital Improvement Plan
5-3
Funding Sources Funding for a CIP can come from several different sources, including the FAA, the State of Washington, the City of Oroville, and private sources. Each project listed in the CIP has been assigned a total cost, which is then assigned a percentage based on its funding source(s) eligibility. FAA Federal grants are available through the current Airport Improvement Program (AIP) legislation called Vision 100 – Century of Aviation Reauthorization Act. This program was funded at $3.4 billion in fiscal year 2004 and is allowed to increase $100 million each year through 2007. Under most circumstances, projects that qualify for AIP funding are eligible for up to 95 percent of total project costs through 2007. It is anticipated that a similar reauthorization will continue in fiscal year 2008 and beyond. Typically, the remaining 5 percent of the project cost is funded by the airport sponsor. It is important to note that even though a project may be eligible for federal funding, this does not ensure that funds will be available or granted to the project by the FAA. State The Washington State Department of Transportation also provides grants. For projects eligible for AIP funding, the State typically matches the local share on a 50/50 basis, therefore, the funding percentages could be FAA -95%, State – 2.5%, Local – 2.5%. For projects funded by the State only, the minimum sponsor share is 5%.