DonnishJournals - Kibabii University
14
DonnishJournals 2041-3164 Corresponding Author: [email protected] Donnish Journal of Nursing and Midwifery Vol 1(2) pp. 005-018 May, 2015 http://www.donnishjournals.org/djnm Copyright © 2015 Donnish Journals Original Research Article Characteristics of Injuries among Children Attending Public Primary Schools in Kisumu Municipality, Kenya. 1 Drusilla N. Nyangahu, 1 Wilson Odero, 1 Lilian Ogonda, 2 Morris S. Shisanya, 3 Everlyne N. Morema* 1 Department of Public Health, Maseno University, Private Bag, Maseno, Kenya. 2 Department of Nursing, Great Lakes University, Kisumu, Kenya. 3 Department of Community Health and Management, Masinde Muliro University, Kakamega, Kenya. Accepted 25th March, 2015. Background: Injuries remain a major killer of children throughout the world. On average, for children in the age group 5-14 years, injury accounts for more than a quarter (27 %) of all deaths worldwide. In addition to these deaths, many other children sustain injuries that require hospitalization, outpatient treatment and sometimes result in disability. In Kenya, injuries are the third leading cause of mortality after malaria and HIV/AIDS and are the fifth leading cause of morbidity among patients attending health care facilities. Approximately 16.8 % of reported injury cases in Kisumu occur among children less than 15 years of age and accounting for 28.7 % of the total injury admissions. Although children less than 15 years of age fall within the primary school age, not much is known about the nature and factors that contribute to the occurrence of injuries among primary school children in Kisumu and programs focusing on their prevention are lacking. Methods: This was a cross-sectional study that aimed to describe the characteristics of injuries among primary school children in Kisumu Municipality. A random sample of 492 pupils aged 11 to 18 years; from 18 schools was interviewed using a structured questionnaire to collect information on the incidence of injuries during the three month period prior to the interview. Results: The most common cause of these injuries was due to falls on the same level (33.9 %). Majority of these pupils were injured while playing (48.8 %), at home (40.9 %) with cuts or open wounds being the most common injury that was sustained (42.1 %). However, injuries caused by fire / hot fluids were associated with gender (P < 0.002) with 76% of the pupils who reported having sustained these injuries being girls. Furthermore, gender was associated with occurrences of injuries at home (P < 0.001) with 115 out of the 201 (57.2%) children who reported having been injured while at home being girls. Almost half of the pupils sought medical care and a quarter of the pupils were hospitalized. Two-thirds of the pupils (66.5 %) received first aid which was mostly administered by a friend or family. More than half (56.7 %) of the pupils were absent from school due to the injury. Although 95.7 % of the pupils reported being taught about road safety in school, only 24 % of the pupils demonstrated a high level of awareness regarding road safety by being able to give a correct response regarding traffic lights and zebra crossing. The information obtained from this study will shed more light on the extent and characteristics of injuries occurring among primary school children and can be used to develop and implement injury prevention and safety promotion policies in primary schools. Conclusion: These findings suggest that most children in primary schools are affected by injuries sustained while playing at home; and girls are at a higher risk of burn injuries than boys. Moreover, there is a low level of awareness of road safety rules and regulations among the primary school pupils. Interventions such as adequate supervision by caregivers while children are playing and review of teaching strategies for road safety education for schools could aid in the reduction of injuries among the pupils. Keywords: Injuries, Children, Characteristics, Kenya INTRODUCTION Almost 16 000 people die from injuries every day, resulting in a total of approximately 5.8 million deaths annually worldwide (Krug et al., 2000). This accounts for 10% of the world’s deaths, 32% more than the number of fatalities that result from malaria, tuberculosis, and HIV and AIDS combined (WHO, 2010). Injuries account for 12 % of the total burden of disease worldwide (Peden and Sharma, 2002). Murray and Lopez (1996) reported that deaths from injuries are projected to rise from 5.1 million in 1990 to 8.4 million (9.2 % of all global deaths) in 2020. It is estimated that 16 % of all disabilities globally are caused by injury (WHO, 2010). On average, for children in the age group 5-14 years, injury accounts for more than a quarter (27 %) of all deaths worldwide (WHO, 2006). However, little is known regarding
Transcript of DonnishJournals - Kibabii University

DonnishJournals 2041-3164
Corresponding Author: [email protected]
Donnish Journal of Nursing and Midwifery Vol 1(2) pp. 005-018 May, 2015 http://www.donnishjournals.org/djnm Copyright © 2015 Donnish Journals
Original Research Article
Characteristics of Injuries among Children Attending Public Primary Schools in Kisumu Municipality, Kenya.
1Drusilla N. Nyangahu, 1Wilson Odero, 1Lilian Ogonda, 2Morris S. Shisanya, 3Everlyne N. Morema*
1Department of Public Health, Maseno University, Private Bag, Maseno, Kenya.
2Department of Nursing, Great Lakes University, Kisumu, Kenya.
3Department of Community Health and Management, Masinde Muliro University, Kakamega, Kenya.
Accepted 25th March, 2015.
Background: Injuries remain a major killer of children throughout the world. On average, for children in the age group 5-14 years, injury accounts for more than a quarter (27 %) of all deaths worldwide. In addition to these deaths, many other children sustain injuries that require hospitalization, outpatient treatment and sometimes result in disability. In Kenya, injuries are the third leading cause of mortality after malaria and HIV/AIDS and are the fifth leading cause of morbidity among patients attending health care facilities. Approximately 16.8 % of reported injury cases in Kisumu occur among children less than 15 years of age and accounting for 28.7 % of the total injury admissions. Although children less than 15 years of age fall within the primary school age, not much is known about the nature and factors that contribute to the occurrence of injuries among primary school children in Kisumu and programs focusing on their prevention are lacking. Methods: This was a cross-sectional study that aimed to describe the characteristics of injuries among primary school children in Kisumu Municipality. A random sample of 492 pupils aged 11 to 18 years; from 18 schools was interviewed using a structured questionnaire to collect information on the incidence of injuries during the three month period prior to the interview. Results: The most common cause of these injuries was due to falls on the same level (33.9 %). Majority of these pupils were injured while playing (48.8 %), at home (40.9 %) with cuts or open wounds being the most common injury that was sustained (42.1 %). However, injuries caused by fire / hot fluids were associated with gender (P < 0.002) with 76% of the pupils who reported having sustained these injuries being girls. Furthermore, gender was associated with occurrences of injuries at home (P < 0.001) with 115 out of the 201 (57.2%) children who reported having been injured while at home being girls. Almost half of the pupils sought medical care and a quarter of the pupils were hospitalized. Two-thirds of the pupils (66.5 %) received first aid which was mostly administered by a friend or family. More than half (56.7 %) of the pupils were absent from school due to the injury. Although 95.7 % of the pupils reported being taught about road safety in school, only 24 % of the pupils demonstrated a high level of awareness regarding road safety by being able to give a correct response regarding traffic lights and zebra crossing. The information obtained from this study will shed more light on the extent and characteristics of injuries occurring among primary school children and can be used to develop and implement injury prevention and safety promotion policies in primary schools. Conclusion: These findings suggest that most children in primary schools are affected by injuries sustained while playing at home; and girls are at a higher risk of burn injuries than boys. Moreover, there is a low level of awareness of road safety rules and regulations among the primary school pupils. Interventions such as adequate supervision by caregivers while children are playing and review of teaching strategies for road safety education for schools could aid in the reduction of injuries among the pupils.
Keywords: Injuries, Children, Characteristics, Kenya
INTRODUCTION
Almost 16 000 people die from injuries every day, resulting in a total of approximately 5.8 million deaths annually worldwide (Krug et al., 2000). This accounts for 10% of the world’s
deaths, 32% more than the number of fatalities that result from malaria, tuberculosis, and HIV and AIDS combined (WHO, 2010). Injuries account for 12 % of the total burden of disease worldwide (Peden and Sharma, 2002). Murray and Lopez
(1996) reported that deaths from injuries are projected to rise from 5.1 million in 1990 to 8.4 million (9.2 % of all global deaths) in 2020. It is estimated that 16 % of all disabilities globally are caused by injury (WHO, 2010).
On average, for children in the age group 5-14 years, injury accounts for more than a quarter (27 %) of all deaths worldwide (WHO, 2006). However, little is known regarding

N y a n g a h u e t a l D o n n . J . N u r s . M i d w i f . | 006
www.donnishjournals.org
differences in injury occurrences among boys and girls in Kenya. Absolute numbers and rates of child injury and death are rising in the low and middle –income countries in tandem with growing levels of urbanization and motorization (WHO, 2010). Other reasons that have been proposed to add to the number of resulting deaths and impairments include; challenging living conditions, heavy traffic, lack of safe play space, inaccessible and unaffordable emergency services (Bartlett, 2002). A large proportion of these injuries are concentrated in Sub- Saharan Africa, as a consequence of socio-political and economical instability, wars, interpersonal violence and motor vehicle crashes (Harvey et al., 2009). In addition to these deaths, tens of millions more children sustain injuries that do not kill them, but are serious enough to require hospital treatment and sometimes result in disability (Sethi et al., 2004). There is need to better understand the proportion of these consequences in our setting.
The burden of injury on children falls unequally. It is heaviest among the poor with the burden greatest on children in the poorer countries with lower incomes (WHO, 2008). Approximately 95 % of child injuries occur in low and middle income countries (Harvey et al., 2009). The rate of child injury
death is 3.4 times higher in low income and middle-income countries than in high-income countries (WHO, 2008). In Egypt, for example, injury is the fifth leading cause of child deaths (>4% of deaths), and accounts for 10-20% of all hospital admissions (El-Sayed et al., 2003). In Tanzania, on average 20-25% of road accidents deaths usually involve pedestrians under the age of 15 years who include primary school children (Museru et al.,1999).
In Kenya, injuries are the third leading cause of mortality after malaria and HIV and AIDS and are the fifth leading cause of morbidity among patients attending health care facilities (Odero et al., 2003). A community-based study carried out in
Kiambu district, Kenya showed that children aged 5-14 years are the most common victims of injury and account for 36 % of all injuries (Nordberg et al., 2000). Odero et al., (2007) found that 17 % of the injuries in a rural health centre in Western Kenya, occurred among children aged 5 – 14 years. A study conducted in New Nyanza Provincial General Hospital indicates that injuries contribute 40 % of all emergency department visits and 17 % of reported injury cases occurred among children less than 15 years of age (Ogendi 2005, unpublished MPH thesis). However, the specific types of injuries affecting these children were not determined and the resulting consequences not known.
Injuries occurring among children can be classified either according to intent and/or mechanism of the injury. With regard to intent they can be intentional or unintentional. Unintentional injuries constitute road traffic crashes, falls, burns, drowning, poisoning and animal bites. Intentional injuries include interpersonal violence, self harm, legal interventions and wars (WHO, 2006).
The five leading causes of injuries in children are road traffic crashes, drowning, burns, falls and poisoning (WHO, 2008). Nevertheless, little is known regarding the major causes of injuries among school children in Kisumu. Road traffic crashes are the second leading cause of death among children aged 10 – 14 years (Harvey et al., 2009). Of the 1.3 million
people killed by road crashes every year, 260 000 (20%) are children. Drowning kills more than 175 000 children a year and up to 3 million children survive a drowning incident. Fire-related burns kill nearly 96 000 children a year and the death rate is 11 times higher in low-and middle-income countries than in high income countries (WHO, 2008). Nearly 47,000 children fall to
their deaths every year, but hundreds of thousands more sustain less serious injuries from a fall. More than 45 000 children die each year from unintended poisoning (WHO, 2008). In addition to mortality, hospital admissions, emergency department attendances and days lost from school can all be used as markers of injury severity (WHO, 2006). There is need to document the burden of injuries among children in schools in the region.
The Convention on the Rights of a child affirms that each child has the right to the highest attainable level of health and the right to a safe environment (WHO, 2006). However, programs focusing on injuries among primary school children are lacking. A great part of children’s life is spent in schools and yet the issue of school as a workplace remains unexplored. School health programs in Kisumu Municipality focus mainly on hygiene and deworming (Ministry of Public Health and Sanitation, 2009).
A survey focusing on road safety education practices, problems and perceived needs for the future in 1200 schools in Africa and Asia showed that little road safety education was being carried out and that children’s road safety knowledge was often inadequate (Sayer et al., 1997). Results from a
controlled study showed that children exposed to the 'Safe Ways' material had, statistically significantly at the 5 per cent level, improved their road safety knowledge and attitudes over children who had not been exposed to the resource (Sayer et al., 1997). Another study showed that pedestrian safety education can result in improvement in children’s knowledge and can change observed road crossing behaviour, but whether this reduces the risk of pedestrian motor vehicle collision and injury occurrence is unknown (Duperrex et al., 2002). A study carried out in Tanzania showed that over 31% of the school-going children did not know the safer way of walking along the streets relative to oncoming vehicles (Museru et al.,1999).
The Kenyan Government is concerned with efforts to curb the rising burden of death and disability due to injuries. Kenyan National Road Safety Action Plan 2005-2010 was laid out in order to try and reduce this menace. It formulated a number of strategies towards this effect. One of the strategies is road safety education among school children. Road safety education is very important as it inculcates safe road practices among children right from a very tender age. If properly done, this could go a long way in reducing the road carnage among children as they constitute the next generation. The extent of knowledge, attitude and practice regarding road safety measures among primary school children in Kisumu is not known. METHODS Study design and study area The study was conducted in Kisumu Municipality, which is the headquarters of Nyanza province in Western Kenya. Kisumu
Municipality lies within longitudes 33 20’E and latitudes 0 50’S (KMC, 2004) and has a population of 652,735 (Kenya National Bureau of Statistics, 2009). It covers an area of approximately 417 Km
2, of which 297 Km
2 is dry land and
approximately 120 Km2 under water (KMC, 2004). It has
developed progressively from a railway terminus and internal port in 1901, to become a leading commercial / trading, industrial communication and administrative centre in the Lake Victoria basin (KMC, 2004). It's geographic position and its

N y a n g a h u e t a l D o n n . J . N u r s . M i d w i f . | 007
www.donnishjournals.org
cosmopolitan profile, places the city strategically as a competitive growth centre in the emergent age of technological and economic development (KMC, 2004).
Rapid urbanization trends in Kisumu, particularly in the last decade coupled with low investment in infrastructure and basic service expansion has resulted into enormous pressure on the urban environment (KMC, 2004). With an annual growth rate estimated at 2.8% and population density of 828 persons per square Km, Kisumu records one of the highest urban population densities in the country, bringing with it the associated complexities in urban planning (KMC, 2004). A major challenge to the city within the national context is that of reducing the currently high poverty levels (48%) to compare favourably with the national average (29%) (KMC, 2004).
Key health challenges facing Kisumu include high HIV and AIDS infection, malaria and water borne diseases contributing to high mortality rate (KMC, 2004). The Municipality’s health system consists of five levels, with the provincial hospital at the apex, then district hospitals and community at the lowest level. It has no national referral hospitals.
Kisumu Municipality has a total of 162 primary schools, of which 117 are public and 45 private primary schools (MCK, 2010). Amongst the schools, 3 are mixed day and boarding, 2 mixed boarding, 1 girls’ day and the remainder mixed day schools. The total student population is 82,178, with almost equal numbers for both girls and boys (41,480 vs. 40,698) (MCK, 2010). Study Design
This was a cross-sectional study. Information regarding injury history, demographics and road safety education were obtained at one point in time from primary school children in standards six to eight who were in public primary schools within Kisumu Municipality. Study Population The study targeted both boys and girls in standards six to eight from randomly selected public primary schools in Kisumu Municipality. Inclusion and exclusion criteria Public primary school children in standards six to eight in the sampled schools whose head teacher and class teacher provided consent were included. Public primary school children in the sampled schools that were not in standards six to eight and whose head teachers and class teachers did not provide consent were not included. Sample Size Determination The sample size was calculated according to (Sethi et al.,
2004). n = [4 (r) (1-r) (f) (1.1)] / [(e2) (p) (nh)] This formula was chosen since a community survey is a study which attempts to ascertain the frequency of a disease in a fixed geographic region or in a group defined by a common membership, e.g. school-children.
Where n = the required sample size, 4 = a factor to achieve 95% level of confidence (i.e. a reflection of the degree of certainty of obtaining the same results if the survey were to be repeated r = the anticipated prevalence of childhood injuries, 1.1 = a factor necessary to raise the sample size by 10% to allow for non responses, f = the design effect, a factor included in the calculation of the required sample size that increases the sample size in proportion to the degree of bias that can be introduced by clustering. e = the margin of error to be tolerated, p = the proportion of the total population that primary school children comprises, nh = the average number of schools per zone In the study:
4 = the factor to achieve 95 % level of confidence r = 30 % (Bartlett, 2002). 1.1 = factor necessary to raise the sample size by 10 % to allow for non responses f = 2 e = 5% p = 75,137 / 652,735 nh = 13 N = (4x0.3x0.7x2x1.1) 0.05
2 x (75137/652735) x 13
= 1.848 0.0025x0.11511x13 = 1.848 0.003741 = 494 primary school children.
where 75137 is the total public primary school population (MCK, 2010) and 652 735 is the total population of Kisumu (Kenya Census, 2009). Sampling Design Multi-stage cluster sampling and simple random sampling methods were used. Public primary schools in Kisumu Municipality were clustered according to zones. The Municipality is divided into nine zones namely Central, Kajulu, Manyatta, Nyahera, Ojolla, Otonglo, Ragumo, Rweya and Southern (Table 3.1). The sampling was done in stages. Two schools were chosen from each zone using simple random sampling with the lottery method. Simple random sampling ensured that all schools had an equal and independent chance of being selected. Lottery method is whereby all the schools in a specific zone were allocated a number and then two numbers were randomly picked.
Probability proportional to size method was used to determine the number of children from each school that were recruited. This method was chosen to ensure equitable distribution of the sample among schools such that schools with many pupils contributed the most to the sample. This means that the zone with the highest population contributed most to the sample size as shown in Table 3.1. The second stage of sampling involved the selection of classes.

N y a n g a h u e t a l D o n n . J . N u r s . M i d w i f . | 008
www.donnishjournals.org
Table 3.1: Zones, number of schools and total student population in Kisumu municipality
Zone Number of schools
Number of boys
Number of girls
Total student population
CENTRAL 12 5492 6074 11566
KAJULU 10 3301 3508 6809
MANYATTA 7 5120 5509 10629
NYAHERA 17 3753 3632 7385
OJOLLA 16 3140 2827 5967
OTONGLO 16 4384 4345 8729
RAGUMO 14 3750 3652 7402
RWEYA 15 3091 3209 6300
SOUTHERN 10 5021 5329 10350
TOTALS 117 37052 38085 75137
Table 3.2: Schools chosen and number of pupils in standards six to eight interviewed per zone by gender.
SCHOOL ZONE BOYS GIRLS TOTAL
No (%)
Arina Central 30 36 66 13.4
Kaloleni Central 6 4 10 2.0
Mayenya Rweya 12 14 26 5.3
Obwolo Kajulu 11 20 31 6.3
Ogada Nyahera 13 11 24 4.9
Bar-Union Nyahera 13 12 25 5.1
Angira Kajulu 5 9 14 2.8
Victoria Southern 16 16 32 6.5
Central Southern 16 19 35 7.1
Manyatta Manyatta 14 20 34 6.9
Migosi Manyatta 28 8 36 7.3
Dr Robert Ouko Otonglo 24 18 42 8.5
Ngege Otonglo 6 7 13 2.6
Bwanda Ragumo 3 2 5 1.0
Nyalunya Ragumo 28 17 45 9.1
Bungu Rweya 6 9 15 3.0
Usari Ojolla 15 0 15 3.0
Kibwayi Ojolla 10 14 24 4.9
Total 256 236 492
The time of data collection coincided with the KCPE trial exam and so in some schools (Arina, Mayenya, Ogada, Victoria, Kaloleni, Usari, Angira, Bwanda, Bar-Union, Migosi and Manyatta), the standard eights were engaged in the exams. In those schools, standards six and seven were each allocated a fifty percent share.
However in schools where standard eights were available (Central, Obwolo, Dr Robert Ouko, Ngege, Nyalunya, Bungu and Kibwayi), each class was allocated thirty three percent. For those schools that had more than one stream per class, the ratio allocated to that class was further divided according to the number of streams. The last stage of sampling was during questionnaire administration, whereby only those pupils who had sustained an injury were eligible. The schools that were randomly chosen and the number of pupils who were interviewed per zone in terms of gender are shown in Table 3.2. Methods of Data Collection
During data collection, the researcher introduced herself and briefly explained what the study involved to the head teacher and class teacher who subsequently facilitated entry into the school and classrooms respectively. This included the reason for the specific interest on those who had sustained any type of
injury during the last three months. In most schools, entry into the classrooms was allowed only during break time so as not to disrupt normal class hours. When in class, the researcher introduced herself and briefly explained the purpose of the research and why they have been chosen.
Thereafter, those who had sustained any form of injury within the last three months were asked to stand up; questionnaires were then randomly administered among those pupils who were standing up. If in a class, the children who had sustained injuries were less than the calculated sample size, the deficit was added to the calculated sample for the next class. Amongst those who were administered questionnaires, those who had any queries or did not understand the questions, were asked to raise up their hands so that their concerns could be clarified. Research Instruments A structured questionnaire (Sethi et al., 2004) (Appendix II) was used to seek information on injury occurrence during the last three months from selected public primary school children of Kisumu Municipality. Key variables were demographics, injury characteristics, traffic injuries, medical care and treatment of injury, post injury impact and road safety education. The data generated quantitative information that

N y a n g a h u e t a l D o n n . J . N u r s . M i d w i f . | 009
www.donnishjournals.org
was representative of the whole primary school population and results were generalized to all public primary school children of Kisumu Municipality. Data collection procedure
An introductory letter from Maseno University to the Municipal Education Officer in Kisumu Municipality was obtained (Appendix IV). The Municipal Education Officer was introduced into the study and requested to grant permission for the study to be undertaken in public primary schools. The Municipal Education Office then wrote an introductory letter to facilitate entry into public primary schools (Appendix III). Permission was further sought from respective head teachers and class teachers. Data collection was done during break time in order to avoid disrupting normal lessons.
Data analysis and presentation The data was checked for completeness, consistency and accuracy before leaving the school compound. The data was coded, entered and cleaned in the computer. Descriptive statistics was used to determine gender and age distribution across the categories of injuries. Chi-square test for independence was used to test the association between selected variables. Statistical significance was assessed at a P-value ≤ 0.05. Statistical Package for Social Sciences version 16.0 and Microsoft excel was used. For objective four, a correct response in section six, questions 6.4 and 6.5 was awarded one mark and the totals were summed up.
A pupil who answered correctly what all the traffic lights symbolized was awarded a three, and his counterpart who was not able to answer what any of the traffic lights symbolized got a zero. Further still, a pupil who was able to correctly describe what a zebra crossing is was awarded one mark, which was summed up with the initial score to get a final mark. The final mark ranged from zero to four; those who had scored four were regarded as having a high level of awareness while their counterparts with zero were regarded as having a low level of awareness. Pupils who scored two or three were regarded as having a moderate level of awareness. Ethical considerations Permission was granted by Maseno University, Municipal Education Officer and various head teachers (Appendix III and Appendix IV). Informed consent (Appendix I) was obtained from the respective class teachers. This enabled them to know the purpose of the study and to decide whether or not their pupils should participate by appending their signatures. The ethical issues upheld were confidentiality (the school children did not write their names on the questionnaires such that any information given could not be traced back to them); beneficence (the information given was intended solely for research without any consequences on the school children) and autonomy (study participation was entirely voluntary). Limitations As this study included reported occurrences of accidents and involved only in-school children, the findings should be interpreted cautiously. Children may have misreported, just as is the case with any self-reported data. In addition, as this was a cross sectional study, a cause-effect relationship could not be assigned between any of the variables. However, with the
recent introduction of free primary education, school enrollment rate is high and therefore, the majority of children attend school. The findings can serve to represent the entire primary school community in Kisumu Municipality. RESULTS Introduction This chapter presents the results, organized by study objectives and is divided into four sections. Section one focuses on demographic characteristics; section two explores the causes, circumstances, types and magnitude of the injuries; section three presents the burden of childhood injuries and finally section four outlines the level of awareness of road safety rules and regulations. Each section covers an objective and has tabular and graphical presentations of the variables. The data are displayed according to gender and age groups in order to facilitate comparison between the groups. The outcomes of statistical tests performed are also indicated in the respective sections. Demographic characteristics of the children Of the 492 pupils that were interviewed 256 (52 %) were boys and 236 (48 %) were girls (Table 4.1). The mean age for the pupils interviewed was 13.05 (95% CI 12.95-13.15) years. The age range was 11 – 18 years with 469 (95.3 %) being aged 14 and below. Class six pupils contributed 167 (33.9 %) of the sample size, class seven 263 (53.5 %) and class eight 62 (12.6 %) - Table 4.2.
Majority of the pupils interviewed were 11 – 14 years of age. Among the 15 – 18 year olds, boys were twice more than the girls interviewed (Table 4.1).
Most pupils (63.7 %) reported sustaining a superficial injury, 18.7 % had moderate injuries and only 1.6 % sustained severe injuries requiring surgery (Table 4.3).
Of all the injuries reported, 307 (62.4 %) were unintentional and 163 (33.1 %) were intentional (Table 4.4).
As summarized in Table 4.5, most intentional injuries occurred among boys 88 (54 %) in comparison to girls 75 (46 %). The disparity among gender on the intent of injuries was not significant, [P = 0.309 (0.303≤ P ≤ 0.321)]. Causes, circumstances, types and magnitude of the injuries
Pupils who sustained injuries caused by falls on the same level were 167 (33.9 %) followed by those who were struck by or against an object 100 (20.3 %) and knife / sharp / penetrating object 68 (13.8 %). Injuries that were rarely sustained were strangulation, drowning and machinery, each 0.4 %. Girls sustained most injuries due to fire or hot fluids in comparison to boys 19 (76 %) versus 6 (24 %) – Table 4.6.
However, injuries caused by fires / hot fluids were associated with gender (P < 002) with nineteen out of the twenty five (76%) pupils who reported having sustained injuries caused by fire / hot fluids being girls (Table 4.6).
Many of the pupils were injured while at home 201 (40.9 %), followed by school/educational area 134 (27.2 %) and along the street/road 94 (19.1 %). Furthermore, gender was associated with occurrences of injuries at home (P < 0.001) with 115 (57.2 %) out of the 201 children who reported having been injured while at home being girls (Table 4.7).

N y a n g a h u e t a l D o n n . J . N u r s . M i d w i f . | 010
www.donnishjournals.org
Table 4.1: Distribution of pupils by age and gender
Age groups Boys Percent Girls Percent Total Percent
11 – 14 240 93.75 229 97.03 469 95.3
15 – 18 16 6.25 7 2.97 23 4.7
Total 256 100 236 100 492 100
Table 4.2: Distribution of pupils by class and gender
Gender Standard six Standard seven Standard eight Total
N % N % N %
Boys 87 52.1 136 51.7 33 53.2 256
Girls 80 47.9 127 48.3 29 46.8 236
Total 167 (33.9%) 100 263 (53.5%) 100 62 (12.6%) 100 492
Table 4.3: Injury severity by age
Age groups No apparent injury
Superficial injury
Moderate (requires sutures)
Severe (requires surgery)
Refused to answer
Total
11 – 14 75 296 88 8 1 468
15 – 18 2 17 4 0 0 23
Total 77 313 92 8 1 491
Table 4.4: Distribution of pupils by intent and age
Age groups Intentional % Unintentional % Don’t know % Total %
11 – 14 154 94.5 295 96.1 20 90.9 469 95.3
15 – 18 9 5.5 12 3.9 2 9.1 23 4.7
Total 163 100 307 100 22 100 492 100
Table 4.5: Distribution of pupils by intent and gender
Gender Intentional % Unintentional % Don’t know % Total %
Boys 88 54 155 50.5 13 59.1 256 52
Girls 75 46 152 49.5 9 40.9 236 48
Total 163 100 307 100 22 100 492 100
Table 4.6: Distribution of pupils by mechanism of injury and gender
MECHANISM (How the injury was caused)
Boys Girls Total
No (%) No (%) No (%)
Traffic accident 21 (55.3%) 17 (44.7%) 38 (7.7%)
Assault 19 (54.3%) 16 (45.7%) 35 (7.1%)
Fall on same level 92 (55.1%) 75 (44.9%) 167 (33.9%)
Fall from a height 22 (52.4%) 20 (47.6%) 42 (8.5%)
Fire / Hot fluid 6 (24%) 19 (76%) 25 (5.1%)
Knife / Sharp / Penetrating object 33 (48.5%) 35 (51.5%) 68 (13.8%)
Strangulation 1 (50%) 1 (50%) 2 (0.4%)
Drowning 0 (0%) 2 (100%) 2 (0.4%)
Poisoning 1 (33.3%) 2 (66.7%) 3 (0.6%)
Machinery 2 (100) 0 (0%) 2 (0.4%)
Struck by or against an object 55 (55%) 45 (45%) 100 (20.3%)
Other 2 (40%) 3 (60%) 5 (1.0%)
Don’t know 2 (66.7%) 1 (33.3%) 3 (0.6%)
Total 256 236 492

N y a n g a h u e t a l D o n n . J . N u r s . M i d w i f . | 011
www.donnishjournals.org
Table 4.7: Distribution of pupils by place of injury occurrence and gender
PLACE BOYS GIRLS TOTAL
No % No % No %
Home 86 42.8 115 57.2 201 40.9
Street / Road 51 54.3 43 45.7 94 19.1
School / Educational area 80 59.7 54 40.3 134 27.2
Farm 14 53.8 12 46.2 26 5.3
Sports / athletics area 22 64.7 12 35.3 34 6.9
Other 3 100 0 0 3 0.6
Total 256 236 492 100
Table 4.8: Distribution of pupils injured on the road by gender
Gender If on Road
On the way to school
On the way from school
On the way to the shop
Other (specify) Total
Boys 12 (46.2 %) 18 (48.6 %) 20 (66.7 %) 1 51 (54.3 %)
Girls 14 (53.8 %) 19 (51.4 %) 10 (33.3 %) 0 43 (45.7 %)
Total 26 (27.7 %) 37 (39.4 %) 30 (31.9 %) 1 (1 %) 94 (100 %)
Table 4.9: Distribution of pupils by type of activity at the time of injury and gender
Activity Boys Girls Total
No % No % No %
Working-paid work 7 70 3 30 10 2.0
Working-unpaid work 31 41.3 44 58.7 75 15.2
Travelling 27 56.25 21 43.75 48 9.8
Studying 12 44.4 15 55.6 27 5.5
Sports / athletics 35 63.6 20 36.4 55 11.2
Leisure / playing 123 51.25 117 48.75 240 48.8
Vital activity e.g. resting, sleeping 7 53.8 6 46.2 13 2.6
Other 11 61.1 7 38.9 18 3.7
Don’t know 3 50 3 50 6 1.2
Total 256 236 492 100
The gender disparity was also evident in injuries occurring in the school / educational area where boys constituted 80 (59.7 %) and sports / athletics area where girls injured were only 12 (35.3 %). Injuries occurring in the farm were almost similar between both boys 14 (53.8 %) and girls 12 (46.2 %).
Results on Table 4.8 show that pupils injured while on the way from school were 37 (39.4 %) and 30 (31.9 %) were injured while on the way to the shop. More than half (61.7 %) of the pupils who were injured on the road were 13 years and below. More boys 51 (54.3 %) than girls 43 (45.7 %) were injured while on the road.
Many of the pupils were injured while playing 240 (48.8 %), with no difference between boys 123 (51.25 %) and girls 117 (48.75 %). Others were injured while doing unpaid work 75 (15.2 %) and during sports / athletics 55 (11.2 %). Injuries sustained by boys during sports / athletics were almost double those of girls 35 (63.6 %) versus 20 (36.4 %). More boys 7 (70 %) than girls 3 (30 %) were injured while doing paid work (Table 4.9).
Cuts or open wounds 207 (42.1 %) were the common type of injury that was sustained with no major difference between boys 110 (53.1 %) and girls 97 (46.9 %). The gender disparity in burn injuries is evident with girls sustaining 20 (74.1 %) of these injuries (Figure 4.1). A chi-square for independence
between gender and burn injuries revealed a significant association, (P < 0.005). Fractures were almost twice as common among boys 30 (65.2 %) than girls 16 (34.8 %), (0.05 < P < 0.1). Burden of childhood injuries
School absenteeism Of the 492 pupils interviewed, those who missed school due to the injury comprised 56.7 %. Boys who were absent made up 130 (46.6 %). In each school there were a percentage of pupils who missed school because of the injury. In Bungu, all the pupils who were interviewed reported being absent from school due to the injury and in Kibwayi, 22 (91.7 %) of the pupils reported missing school. Only in Arina, Bar-Union, Victoria, Central, Migosi and Bwanda primary schools did less than 50 % of the pupils miss school due to injury, however, in the rest of the schools (Kaloleni, Mayenya, Obwolo, Ogada, Angira, Manyatta, Dr Robert Ouko, Ngege, Nyalunya, Bungu, Usari and Kibwayi) more than 50 % of the pupils missed school due to injury (Table 4.10).

N y a n g a h u e t a l D o n n . J . N u r s . M i d w i f . | 012
www.donnishjournals.org
Figure 4.1: Comparison of nature of injuries among boys and girls
Table 4.10: Distribution of pupils showing days absent by school
School Days absent from school Total Total days absent as a % of N
1 2 – 3 4 – 5 5
Arina 2 15 7 2 26 39.4
Kaloleni 0 1 4 0 5 50
Mayenya 1 10 4 4 19 73.1
Obwolo 2 12 7 0 21 67.7
Ogada 5 7 4 0 16 66.7
Bar – Union 3 4 3 1 11 44
Angira 0 0 10 0 10 71.4
Victoria 1 3 3 1 8 25
Central 0 7 5 0 12 34.3
Manyatta 5 11 3 6 25 73.5
Migosi 5 3 2 1 11 30.6
Robert Ouk 4 7 7 12 30 71.4
Ngege 1 5 0 2 8 57.1
Bwanda 0 0 0 1 1 20
Nyalunya 5 13 9 1 28 62.2
Bungu 4 7 4 0 15 100
Usari 2 5 1 0 8 53.3
Kibwayi 3 11 7 1 22 91.7
Total 43 121 80 32 276

N y a n g a h u e t a l D o n n . J . N u r s . M i d w i f . | 013
www.donnishjournals.org
Table 4.11: Distribution of pupils showing number of days absent from school due to injury
Days absent Boys Girls Total %
One 21 22 43 15.4
Two 18 37 55 19.7
Three 39 28 67 24.0
Four 16 15 31 11.1
Five 19 31 50 17.9
5 16 16 32 11.5
Don’t know 1 0 1 0.4
Total 130 149 279 100
Table 4.12: Distribution of pupils who sought medical care by gender
Gender Did you seek medical care Total %
Yes % No %
Boys 122 51.3 134 52.8 256 52
Girls 116 48.7 120 47.2 236 48
Total 238 100 254 100 492 100
Table 4.13: Distribution of pupils who sought medical care by school
School Yes (%) No (%) Total (N)
Arina 45.5 54.5 66
Kaloleni 60.0 40.0 10
Mayenya 84.6 15.4 26
Obwolo 58.1 41.9 31
Ogada 25.0 75.0 24
Bar-Union 32.0 68.0 25
Angira 85.7 14.3 14
Victoria 31.2 68.8 32
Central 48.6 51.4 35
Manyatta 79.4 20.6 34
Migosi 30.6 69.4 36
Dr Robert Ouko 54.8 45.2 42
Ngege 35.7 64.3 14
Bwanda 20.0 80.0 5
Nyalunya 33.3 66.7 45
Bungu 40.0 60.0 15
Usari 46.7 53.3 15
Kibwayi 58.3 41.7 24
There was a significant association between gender and school absenteeism, girls were significantly more likely to be absent than boys (P < 0.031). One quarter (24.0 %) of the pupils missed school for three days while 11.5 % missed more than five days of school (Table 4.11). A chi-square test for independence between gender and days absent from school revealed a significant association, [P < 0.024, (0.018 ≤ P ≤ 0.023)]. The average number of days school children were absent was 3.96 days, with a median of 3 days and a range of 1 - 60 days.
A visit to the emergency department The pupils who sought medical care comprised 238 (48.4 %) - Table 4.12. The disparity in gender among pupils who sought medical care was not large 122 (51.3 %) among boys versus 116 (48.7 %) among girls. Pupils who visited the provincial hospital comprised 44 (18.5 %), district hospital 50 (21 %),
health centres 49 (20.6 %) and dispensaries 46 (19.3 %). A greater percentage 186 (78.2 %) of the pupils who sought medical care took less than two hours to get to the hospital. Most students in Mayenya 22 (84.6 %), Angira 12 (85.7 %) and Manyatta 27 (79.4 %) sought medical care.
Two thirds 327 (66.5 %) of the pupils received first aid after sustaining an injury. Most of the pupils were given first aid by a friend / family 218 (66.7 %). Others were administered first aid by a bystander 38 (11.6 %) and 27 (8.3 %) by a teacher.
With regards to the distribution of pupils who sought medical care, the chi-square test for independence was not significant, (P > 0.1).
Each school had a number of pupils who sought medical care though the ratio varied. Schools such as Mayenya, Angira and Manyatta had almost four-fifths of their pupils seeking medical care while in Ogada and Bwanda only a quarter or less of their pupils sought medical care.

N y a n g a h u e t a l D o n n . J . N u r s . M i d w i f . | 014
www.donnishjournals.org
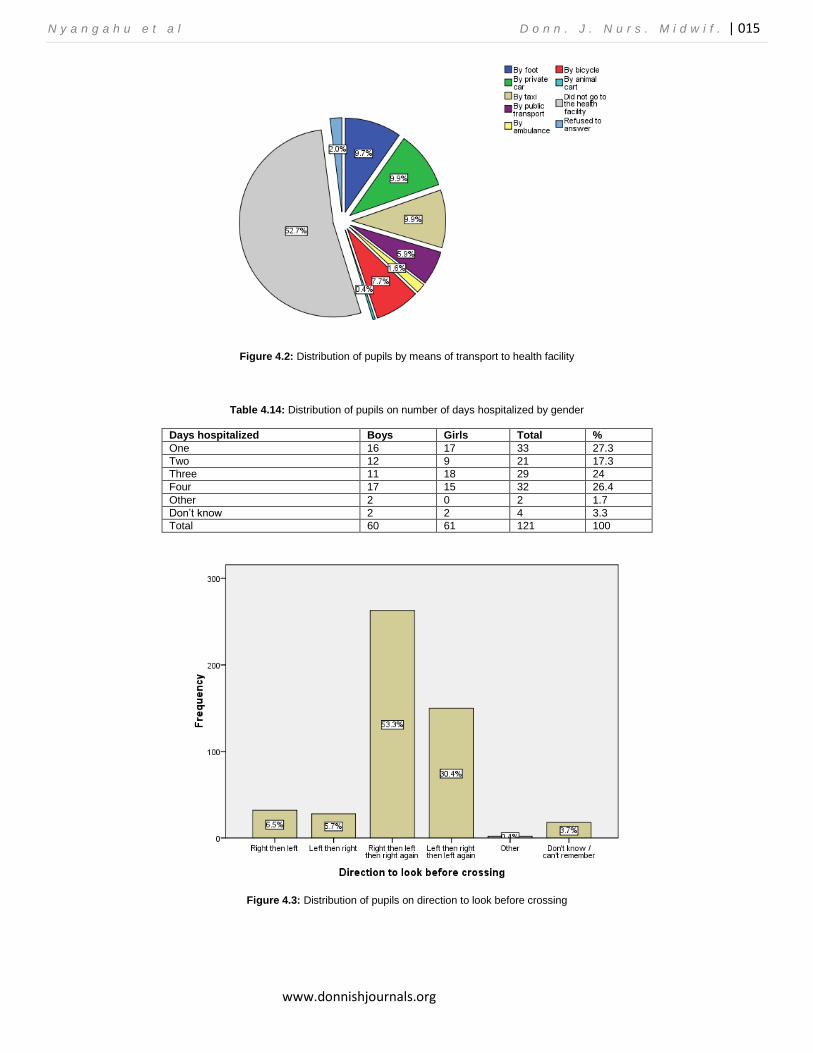
Of the 238 pupils who sought treatment at a hospital, 49 (9.9 %) went by private car, 49 (9.9 %) took a taxi, 48 (9.3 %) walked, 38 (7.7 %) went by bicycle, 29 (5.9 %) used public transport, 8 (1.6 %) by ambulance and 2 (0.4 %) by animal cart. Hospitalization One quarter (121 / 492) of the pupils were hospitalized with girls comprising 61 (51.2 %). Table 4.14 shows the distribution of the number of days pupils were hospitalized. More than a quarter (27.3 %) of the pupils were hospitalized for one day and 32 (26.4 %) for four days. The average number of days school children were hospitalized was 2.54 days, with a median of 3 days and a range of 1 – 5 days.
Injury consequences on activity Of the 492 pupils interviewed 71.1 % (350 / 492), reported that injuries affected their usual activities. Amongst the 350 pupils affected by injuries, 216 (61.7 %) had returned to the same level of usual activity, 114 (32.6 %) had returned partially and 20 (5.7 %) had not been able to return to the same level of usual activity.
Traffic injuries Of the 38 pupils who had sustained road traffic injuries, 22 (58 %) were bicyclists; of whom 18 (81.8 %) were boys and 4 (18.2 %) were girls. Pedestrians accounted for 9 (23.7 %) and passengers for 6 (15.8%). The most common means of transport being used was bicycles 26 (68.4 %); motorcycles comprised 2 (5.3 %). Use of safety measures Of the 38 pupils who had sustained road traffic injuries, 13 (34.2 %) used seat - belts all the time, 12 (31.6 %) used sometimes, 5 (13.2 %) have never used a seat belt and 7 (18.4 %) reported that there were no seat – belts in the cars they usually rode in. Regarding helmet use; 9 (23.7 %) of the pupils who sustained road traffic injuries used it all the time, 6 (15.8 %) used it sometimes, 9 (23.7 %) do not own a helmet and another 6 (15.8 %) have never used a helmet.
Road Safety Rules and Regulations The majority of the pupils 471 (95.7 %) reported being taught about road safety rules and regulations in school. Boys comprised 242 (51.3 %). All the pupils in Manyatta and Ojolla zones reported being taught about road safety rules and regulations in school. Most of them 432 (91.7 %) remembered having been asked a question on road safety during examinations.
Slightly more than half 262 (53.3 %) of the pupils gave a correct response on the direction to look before crossing the road (Figure 4.3).
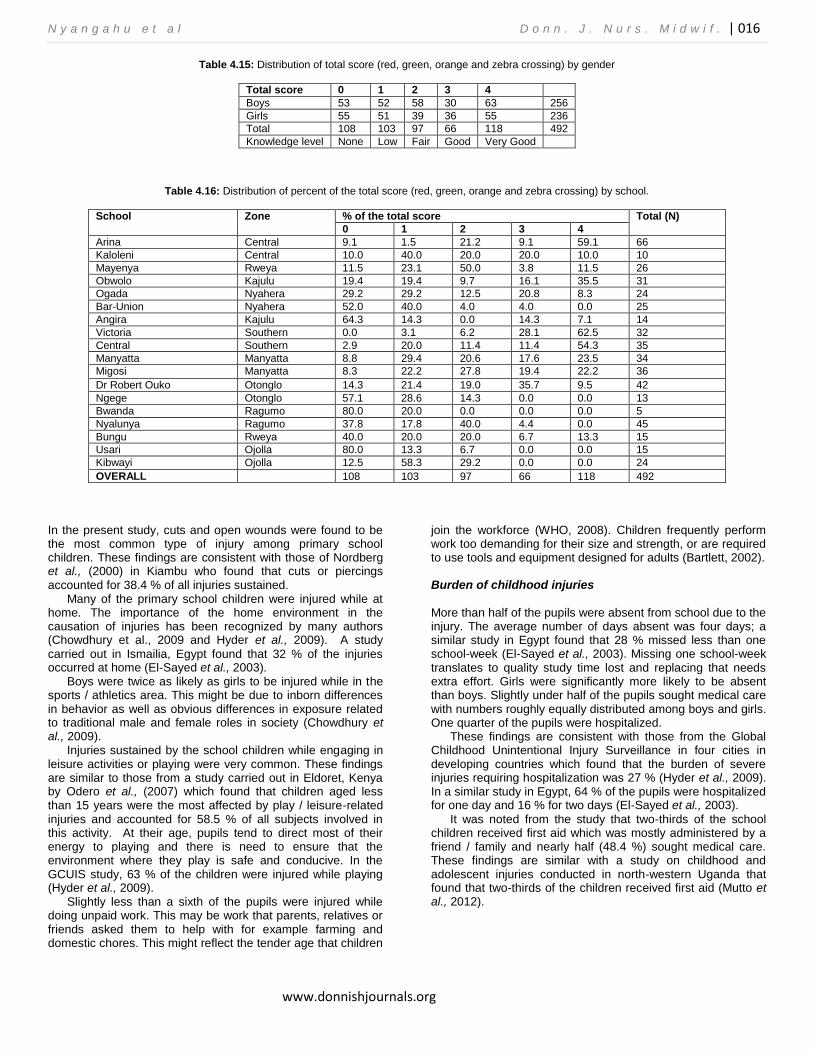
Almost a quarter 118 (24 %) of the pupils had a high awareness level (total score of 4) on road safety rules and regulations compared to 266 (54.1 %) of the pupils whose level of awareness was moderate (total score 1 - 3). A further 108 (22 %) of the pupils (total score of 0) demonstrated no awareness.
School children in the Southern zone demonstrated the highest level of awareness. None of the school children in Ragumo and Ojolla zones answered all the four questions correctly. Despite the fact that all the school children in Manyatta and Ojolla zones had reported being taught about road safety rules and regulations, none of them demonstrated a high level of awareness. DISCUSSION Introduction
This chapter discusses the findings of the study, starting with demographic characteristics, characteristics of injuries; burden of childhood injuries and level of awareness of road safety rules and regulations. Demographic characteristics of the children
Recruited school children were nearly equally distributed between the two genders. Class six pupils contributed to a third of the sample size, class seven almost half of the sample size and class eight the remainder. This occurred because in some of the schools (Arina, Mayenya, Ogada, Victoria, Kaloleni, Usari, Angira, Bwanda, Bar-Union, Migosi and Manyatta), class eights were deeply engrossed in the KCPE trial exam at the time of data collection. Causes, circumstances, types and magnitude of the injuries
Intentional injuries were more common among boys in comparison to girls. Most of the injuries sustained were unintentional. Although young adults experience far higher rates of intentional injuries, children are disproportionately burdened by unintentional injuries (Bartlett, 2002; WHO, 2008). However, injuries caused by fires and hot fluids were the only type of injury associated with gender, with nineteen out of the twenty five pupils who reported having sustained injuries caused by fire and hot fluids being girls. Global figures indicate that girls have a far greater likelihood of being killed or injured as a result of burns (Bartlett, 2002), this is most likely a
reflection of the extra time that girls are expected to spend indoors often with responsibility for cooking.
Injuries sustained by boys during sports and athletics were almost double those of girls and fractures were almost twice more common among boys than girls. This might be attributed to behavioural differences, but it is likely that it is as much a function of the greater freedom afforded to boys with the greater exposure to risk that this implies (Bartlett, 2002).
Injuries caused by falls on level ground were common with boys being more affected than girls. These findings are similar with those from other studies which found that falls were the most common cause of injury in children (El-Sayed et al., 2003; Chowdhury et al., 2009; Hyder et al., 2009 and Peden et al., 2002). Falls have been reported to be the cause of most non-fatal injuries (WHO, 2008). Falls are usually reported to be the most common cause of injury seen in hospitals, accounting for between 25 and 52 % of all treated child injuries (Bartlett, 2002). Furthermore, falls are the leading cause of DALYs for children aged 5 – 14 years (Krug et al., 2000).
N y a n g a h u e t a l D o n n . J . N u r s . M i d w i f . | 015
www.donnishjournals.org
Figure 4.2: Distribution of pupils by means of transport to health facility
Table 4.14: Distribution of pupils on number of days hospitalized by gender
Days hospitalized Boys Girls Total %
One 16 17 33 27.3
Two 12 9 21 17.3
Three 11 18 29 24
Four 17 15 32 26.4
Other 2 0 2 1.7
Don’t know 2 2 4 3.3
Total 60 61 121 100
Figure 4.3: Distribution of pupils on direction to look before crossing
N y a n g a h u e t a l D o n n . J . N u r s . M i d w i f . | 016
www.donnishjournals.org
Table 4.15: Distribution of total score (red, green, orange and zebra crossing) by gender
Total score 0 1 2 3 4
Boys 53 52 58 30 63 256
Girls 55 51 39 36 55 236
Total 108 103 97 66 118 492
Knowledge level None Low Fair Good Very Good
Table 4.16: Distribution of percent of the total score (red, green, orange and zebra crossing) by school.
School Zone % of the total score Total (N)
0 1 2 3 4
Arina Central 9.1 1.5 21.2 9.1 59.1 66
Kaloleni Central 10.0 40.0 20.0 20.0 10.0 10
Mayenya Rweya 11.5 23.1 50.0 3.8 11.5 26
Obwolo Kajulu 19.4 19.4 9.7 16.1 35.5 31
Ogada Nyahera 29.2 29.2 12.5 20.8 8.3 24
Bar-Union Nyahera 52.0 40.0 4.0 4.0 0.0 25
Angira Kajulu 64.3 14.3 0.0 14.3 7.1 14
Victoria Southern 0.0 3.1 6.2 28.1 62.5 32
Central Southern 2.9 20.0 11.4 11.4 54.3 35
Manyatta Manyatta 8.8 29.4 20.6 17.6 23.5 34
Migosi Manyatta 8.3 22.2 27.8 19.4 22.2 36
Dr Robert Ouko Otonglo 14.3 21.4 19.0 35.7 9.5 42
Ngege Otonglo 57.1 28.6 14.3 0.0 0.0 13
Bwanda Ragumo 80.0 20.0 0.0 0.0 0.0 5
Nyalunya Ragumo 37.8 17.8 40.0 4.4 0.0 45
Bungu Rweya 40.0 20.0 20.0 6.7 13.3 15
Usari Ojolla 80.0 13.3 6.7 0.0 0.0 15
Kibwayi Ojolla 12.5 58.3 29.2 0.0 0.0 24
OVERALL 108 103 97 66 118 492
In the present study, cuts and open wounds were found to be the most common type of injury among primary school children. These findings are consistent with those of Nordberg et al., (2000) in Kiambu who found that cuts or piercings accounted for 38.4 % of all injuries sustained.
Many of the primary school children were injured while at home. The importance of the home environment in the causation of injuries has been recognized by many authors (Chowdhury et al., 2009 and Hyder et al., 2009). A study
carried out in Ismailia, Egypt found that 32 % of the injuries occurred at home (El-Sayed et al., 2003).
Boys were twice as likely as girls to be injured while in the sports / athletics area. This might be due to inborn differences in behavior as well as obvious differences in exposure related to traditional male and female roles in society (Chowdhury et al., 2009).
Injuries sustained by the school children while engaging in leisure activities or playing were very common. These findings are similar to those from a study carried out in Eldoret, Kenya by Odero et al., (2007) which found that children aged less than 15 years were the most affected by play / leisure-related injuries and accounted for 58.5 % of all subjects involved in this activity. At their age, pupils tend to direct most of their energy to playing and there is need to ensure that the environment where they play is safe and conducive. In the GCUIS study, 63 % of the children were injured while playing (Hyder et al., 2009).
Slightly less than a sixth of the pupils were injured while doing unpaid work. This may be work that parents, relatives or friends asked them to help with for example farming and domestic chores. This might reflect the tender age that children
join the workforce (WHO, 2008). Children frequently perform work too demanding for their size and strength, or are required to use tools and equipment designed for adults (Bartlett, 2002). Burden of childhood injuries
More than half of the pupils were absent from school due to the injury. The average number of days absent was four days; a similar study in Egypt found that 28 % missed less than one school-week (El-Sayed et al., 2003). Missing one school-week translates to quality study time lost and replacing that needs extra effort. Girls were significantly more likely to be absent than boys. Slightly under half of the pupils sought medical care with numbers roughly equally distributed among boys and girls. One quarter of the pupils were hospitalized.
These findings are consistent with those from the Global Childhood Unintentional Injury Surveillance in four cities in developing countries which found that the burden of severe injuries requiring hospitalization was 27 % (Hyder et al., 2009). In a similar study in Egypt, 64 % of the pupils were hospitalized for one day and 16 % for two days (El-Sayed et al., 2003).
It was noted from the study that two-thirds of the school children received first aid which was mostly administered by a friend / family and nearly half (48.4 %) sought medical care. These findings are similar with a study on childhood and adolescent injuries conducted in north-western Uganda that found that two-thirds of the children received first aid (Mutto et al., 2012).
N y a n g a h u e t a l D o n n . J . N u r s . M i d w i f . | 017
www.donnishjournals.org
Traffic injuries
Many of the traffic injuries were sustained by pupils who were bicyclists. A study carried out in Kawempe, Uganda, among primary school children found that motorcycles and bicycles are the leading cause of their injuries (Nakitto et al., 2006). The findings by the study that more than 80 % of the pupils who sustained traffic injuries were boys are similar to those reported elsewhere (Bartlett, 2002).
Road Safety Rules and Regulations All the schools had incorporated road safety rules and regulations in their curriculum; this was ascertained from the responses obtained when pupils were asked if they had ever been taught road safety education. Elsewhere in Malawi, in a similar study, 80 % of the pupils reported being taught road safety at home or school (Muula et al., 2009).
More than half of the pupils demonstrated correct comprehension on the direction to look before crossing the road. Of all the school children interviewed, only a quarter demonstrated a high level of awareness and an almost equal number had no awareness. A similar study on Road Safety Awareness and Practices Among School Children of Chandigarh, India showed that forty percent of the pupils lacked correct knowledge of traffic safety rules (Swami et al.,
2006). There is need to develop effective learning strategies where pupils are sensitized from a tender age that road safety education is a life skill, the present statistics on road carnage can be used to provide practical examples. CONCLUSIONS
We have demonstrated that most children in primary schools are affected mainly by injuries sustained while playing at home
with cuts or open wounds being the most common injury that was sustained and exposure to injury risk, particularly burn injuries depends on their gender. The burden of injuries was evidenced by more than half of the pupils missing school and almost half seeking medical care. Two thirds of the pupils received first aid after sustaining an injury. Moreover, there is a low level of awareness of road safety rules and regulations among the primary school pupils. COMPETING INTERESTS
The authors declare that they have no competing interests. AUTHORS' CONTRIBUTIONS
DNN designed, carried out the survey study and participated in the drafting of the manuscript. LO and WO participated in designing the study. ENM and MSS performed the statistical analysis and participated in drafting the manuscript. All authors read and approved the final manuscript. ACKNOWLEDGEMENTS
We are indebted to the Kisumu Municipal Education officials, various head teachers and class teachers, who allowed access to their schools, and pupils who provided information regarding their injury history, the research assistants Euphie and Nancy who helped with data collection and data entry. These data are published with the approval of the Maseno University Ethical Review Committee. This work was part of DNN’s Master’s in Public Health (MPH) studies at Maseno University, Maseno, Kenya.
REFERENCES Agran, P. F. Winn, G.D. Anderson, L . G. & Valle, C. D. (1998). Family,
social and cultural factors in pedestrian injuries among Hispanic children. Journal of Injury Prevention. 4: 188-193.
Bartlett, S. (2002). The problem of children’s injuries in low income countries: a review. Health Policy and Planning. 1(17), 1–13.
Chowdhury, S. M. Rahman, A. Mashreky, S. R. Giashuddin, S. M. Svanstrom, L. Horte, L. G. & Rahman, F. (2009). The Horizon of Unintentional Injuries Among Children in Low-Income Setting: An Overview from Bangladesh Health and Injury Survey. Journal of Environmental and Public Health. 10, 1155-1160.
Duperrex, O. Roberts, I. & Bunn, F. (2002). Safety education of pedestrians for injury prevention. Cochrane Database of Systematic Reviews. Issue 2, Art No: CD001531 DOI: 10.1002/14651858
El-Sayed, H. Hassan, F. & Gad, S. (2003). Cross-sectional study of injuries among school children in Ismailia city, Egypt. Home and Industrial Safety. Chapter 4. Pages 521 – 522.
Fèvre, E. M. Kaboyo, R. W. Persson, V. Edelsten, M. Coleman, P. G. & Cleaveland, S. (2005). The epidemiology of animal bite injuries in Uganda and projections of the burden of rabies. Tropical Medicine and International Health. 1(10), 790–798.
Gome, D. L. Mutiso, V. M. & Kimende, K. (2005). Paediatric Trauma at Kenyatta National Hospital, Nairobi Kenya. East and Central African Journal of Surgery. 2(10), 33-36.
Harvey, A. Towner, E. Peden, M. Soori, H. & Bartolomeos, K. (2009). Injury prevention and the attainment of child and adolescent health. Bull World Health Organ. 5(87), 390 – 394.
Hee-Kim, M. Subramanian, S. V. Kawachi, I. & Yup-Kim, C. (2007). Association between childhood fatal injuries and socioeconomic
position at individuals and area levels: a multilevel study. Journal of Epidemiology and Community Health. 61(2), 135-140
Hyder, A. A. Sugerman, D. E. Puvanachandra, P. Razzak, J. El-Sayed,
H. Isaza, A. Rahman, F. & Peden, M. (2009). Global childhood
unintentional injury surveillance in four cities in developing countries: a pilot study. Bull World Health Organ. 1(87), 345-352.
Kenya National Bureau of Statistics. 2010. Kenya Census 2009. KMC. (2004). United Nations Human Settlement Programme, Kisumu
City Development Strategies (2004 – 2009). Kisumu City Council and Centre for Development and Planning Management, Kisumu.
Krug, E. G. Sharma, G. K. & Lozano, R. (2000). The global burden of injuries. American Journal of Public Health. 90, 523-526.
Matzopoulos, R. Niekerk, A. Marais, S. & Donson, H. (2002). A Profile of Fatal Injuries in South Africa. Africa Safety Promotion; A Journal of Injury and Violence Prevention. 1(1), 16-23. Medical Research Council.
Ministry of Public Health and Sanitation. (2009). Child and Adolescent Health. GIZ Health Sector Programme in Kenya.
Ministry of Transport and GoK / Sida Roads 2000 Project. (2005). Kenyan National RoadSafety Action Plan. 2005-2010.
Mock, C. N. Gloyd, S. Adjei, S. Acheampong, F & Gish, O. (2003). Economic consequences of injuries and resulting family coping strategies in Ghana. Accident Analysis and Prevention. 1(35), 81–90.
Municipal Council of Kisumu (MCK). 2010. Municipal Education Offices.
Murray, C. J. & Lopez, A. D. (1996). Alternative projections of mortality and disability by cause 1990–2020: Global Burden of Disease Study. Lancet, 349:1498–1504.
N y a n g a h u e t a l D o n n . J . N u r s . M i d w i f . | 018
www.donnishjournals.org
Museru, L. M. Leshabari, M. T. & Mbembati N. A A. (1999). Patterns of Road Traffic Injuries and Associated Factors among school-aged children in Dar es Salaam, Tanzania. Africa Safety Promotion; A Journal of Injury and Violence Prevention. 1: 42-50.
Mutto, M. Lawoko, S. Ovuga, E. & Svanstrom, L. (2012). Childhood and adolescent injuries in elementary schools in north-western Uganda: extent, risk and associated factors. International Journal of Injury Control and Safety Promotion. D01:10.1080/17457300.2011.648675.
Muula, S. A. & Misiri, H. E. (2009). Physical trauma experience among school children in periurban Blantyre, Malawi. International Archives of Medicine. 2, 20-33.
Nakitto, M. Mutto, M. Howard, A. & Lett, R. (2008). Pedestrian traffic injuries among school children in Kawempe, Uganda. African Health Sciences; 8(3), 156-159.
Nakitto, M. Mutto, M. & Lett, R. (2006). Environmental hazards and access to injury care at 2 primary schools in Kampala, Uganda. African Safety Promotion: A Journal of Violence and Injury Prevention. 4(3, 59–68.
Njonjo, S. K. (2010). Youth Fact Book. Infinite Possibility of Definite Disaster. Institute of Economic Affairs and Friedrich-Ebert-Stiftung.
Nordberg, E. Kimani, V. & Diwan, V. (2000). Household survey of injuries in a Kenya district. East African Medical Journal. 5(77), 240-244.
Odero, W. Khayesi, M. & Heda, P. M. (2003). Road traffic injuries in Kenya: Magnitude, causes and status of intervention. Injury Control Safety Promotion. 10: 53-61.
Odero, W. Polsky, S. Urbane, D. Carel, R. & Tierney W. M. (2007). Characteristics of injuries presenting to a rural health centre in Western Kenya. East Africa Medical Journal. 8(84), 367-373.
Ogendi, Japheths. “Injuries Reported at Nyanza Provincial General Hospital in Kisumu City, western Kenya.”MPH Thesis. Maseno University, 2005.
Peden, M. M. K. and Sharma, G. (2002). The injury chart book: A geographical overview the global burden of injuries. Geneva: World Health Organization.
Peltzer, K. (2008). Injury and social determinants among in-school adolescents in six African countries. Injury Prevention, 14(6), 381–388.
Primary School Deworming in Kenya. http://povertyaction.org/node/2302 accessed on 20th September 2010.
Sayer, I. A. & Palmer, C. J. (1997). Pedestrian accidents and road safety education in selected developing countries. 3
rd African Road
Safety Congress, Pretoria, 14-17 April 1997. Sethi, D. Habibula, S. McGee, K. Peden, M. Bennett, S. Hyder, A. A.
Klevens, J. Odero, W. & Suriyawongpaisal, P. (Eds). (2004). Guidelines for Conducting Community Surveys on Injury and Violence. World Health Organization. Geneva.
Sminkey, L. & Mekki, N. (2008). News Release 2008. WHO media centre. WHO, Geneva.
Swami, S. M. Puri, S. & Bhatia, V. (2006). Road Safety Awareness and Practices Among School Children of Chandigarh. Indian Journal of Community Medicine. 3(31), 199-204.
World Health Organization (WHO). (2010). Injuries and Violence, The Facts. Geneva: World Health Organization. www.who.int/violence_injury_prevention/en, accessed on 15
th
September 2010. World Health Organization (WHO). (2008). World report on child injury
prevention. Geneva: World Health Organization. http://whqlibdoc.who.int/publications/2008/9789241563574_eng.pdf
accessed on 15th September 2010. World Health Organization (WHO). (2006). Child and adolescent injury
prevention: A WHO plan of action 2006-2015. Geneva: http://www.who.int/violence injury prevention/publications/other injury/en/index.html, accessed on 15th September 2010.
World Health Organization (WHO). (2005). Child and adolescent injury prevention: A global call to action. Geneva: http://whq.libdoc.who.int/publications/2005/9241593415eng. pdf, accessed 15th September 2010).
World Health Organization (WHO). (2004). Global burden of Disease Project. WHO, Geneva