![[Supplementary material] The Maya wall paintings from ...cambridge...The Maya blue pigment was identified directly on the layer covering the adobe bricks of the wall (Figures S1 and](https://static.fdocuments.in/doc/165x107/61336258dfd10f4dd73b0d89/supplementary-material-the-maya-wall-paintings-from-cambridge-the-maya.jpg)
Doménech, A. et al. Study blue maya. 2006
10
Chemometric Study of Maya Blue from the Voltammetry of Microparticles Approach Antonio Dome ´ nech,* ,† Marı ´a Teresa Dome ´ nech-Carbo ´ , ‡ and Marı ´a Luisa Va ´ zquez de Agredos Pascual ‡,§ Departament de Quı mica Analı tica, Universitat de Vale ncia, Dr. Moliner, 50, 46100 Burjassot, Vale ncia, Spain, Institut de Restauracio del Patrimoni/Departament de Conservacio i Restauracio de Bens Culturals, Universitat Polite cnica de Vale ncia, Camı de Vera 14, 46022, Vale ncia, Spain, and Departament de Histo ria de l’Art, Universitat de Vale ncia, Passeig al Mar, Vale ncia, Spain The use of the voltammetry of microparticles at paraffin- impregnate d graphite electrode s allows for the character- ization of different types of Maya Blue (MB) used in wall paintings from different archaeological sites of Campeche and Yucata ´ n (Mex ico). Using volta mmetri c signals for electron-tr ansfer processes involving palygorsk ite-associ- ate d indigo and qui none functio nal ities genera ted by scratching the graphite surface, voltammograms provide informa tion on the composition and texture of MB sample s. App licati on of hiera rchical cluste r anal ysis and other chemometric methods allows us to characterize samples from differen t archaeolog ical sites and to distin guish between samples proceeding from different chronological per iods . Comp ariso n between micro scopic, spec tro- scopic, and electrochemical examination of genuine MB sample s and syn the tic spe cime ns indica ted tha t the preparation procedure of the pigment evolved in time via succe ssive steps anticipatin g mode rn synthe tic proce- dures, namely, hybrid organic-inorganic synthesis, tem- perature control of chemical reactivity, and template-like synthesis. Maya Blue (MB), a pigmen t produced by the ancien t Mayas, has cla ime d considera ble att ent ion bec aus e of its enormous stability and peculiar hue, ranging from a bright turquoise to a dark greenish blue. The use of MB in Central America, mostly in Mexico, is well documented in archaeological sites between the 8th and the 16th centuries, 1 but its use is prolonged even to recent times. 2 MB can be considered as a hybrid organi c-inorganic material 3 resulting from the attachment of indigo, a blue dye extracted from Indigofera suffruticosa and other species, and a local clay, palygor- skite. 4,5 A Yucata ´ n site, Sak lu’um, served as the main and almost unique source of palygorskite in Mesoamerica. Natural indigo is formed by indigotin (3 H -indol-3-one, 2-(1,3-dihydro-3-oxo-2 H -indol- 2-yli dene)- 1,2-d ihydr o), a quasi-p lanar molecu le of approximate dimen sions 4.8 × 12 Å. 6 Th e ino rga nic compone nt of MB, palygorskite, is a fibrous phyllosilicate of ideal composition (Mg,- Al) 4 Si 8 (O,OH,H 2 O) 24 ‚nH 2 O. Pal ygo rskite appear s usua lly as a mix tur e of two dif fer ent poly typ es, one mono cli nic and one ort hor hombic , who se str uct ure can be des cri bed in terms of continuous, two-dimensional tetrahedral and octahedral sheets. 7,8 Both polytytpes show discontinuous 2:1 tetrahedral/octahedral layers with one 2:1 unit joined to the next by inversion of the SiO 4 tetr ahedr a along Si -O-Si bonds. The tet rah edr al and octahedral mesh gives rise to a series of rectangular tunnels of dimensions 6.4 × 3.7 Å. Such clays are, therefore, crossed by zeolite-like channels and permeated by weakly bound, nonstruc- tural (zeolitic) water. Magnesium and aluminum cations complete their coordination with tightly bound water molecules (structural water). Although the procedure of extraction of indigo from plants has remained in use until current times, the procedure for preparing MB is unknown. 1,4,5 It is believed that the Mayas prepared the pigment by crushing indigo and palygorskite with a moderate thermal treatment, but the details of the process and the way in which the ancient Mayas modulated the hue of the pigment have not been elucidated. The nature of the indigo-palygorskite association has claimed considerable attention in the last years. 9-22 Thus, J ose ´ -Ya cama ´ n et al. 9,10 discov ered that most palyg orskit e parti cles exhibit a supers truct ure along the a-axis about 14 Å, whi ch roughl y * Corresponding au thor. E-mail: antonio.domenech@uv .es. † Departament de Quı ´mica Analı ´tica, Universitat de Vale `ncia. ‡ Universit at Po lite ` cnica d e Vale ` ncia. § Departament de Histo ` ria de l’Art, Universitat de Vale `ncia. (1) Magaloni Kerpel, D. Materiales y Te ´cnicas de la Pintura Maya. Facultad de Filosofı ´a y Letras, Universidad Nacional Auto ´ noma de Me ´xico, 1996. (2) Tagle, A.; Paschinger, H.; Richard, H.; Infante, G. Stud. Conserv. 1990, 35 , 156-159. (3) Romero, P.; Sa ´nchez, C. New J. Chem. 2005, 29 , 57-58. (4) Torres, L. M. Mater. Res. Soc. Symp. Proc. 1988, 123. (5) Reyes- Val erio, C. De Bon ampak al Templo Mayor: el azul May a en Mesoame ´ rica; Siglo XXI, Madrid, 1993. (6) Gordon, P. F.; Gregory, P. Indigoid Dyes in Organic Chemistry in Colour ; Springer-Verlag : Berlin 1983; pp. 208-211. (7) Chisholm, J. E. Can. Miner. 1990, 28, 329-339. (8) Chisholm, J. E. Can. Miner. 1992, 30 , 61-73. (9) Jos e ´ -Yacama ´ n, M.; Rendo ´ n, L.; Arenas, J. ; Serra Puche, M. C. Science 1996, 273, 223-225. (10) Polette, L. A.; Meitzner, G.; Jose ´-Yacama ´n, M.; Chianelli, R. R. Microchem. J. 2002, 71, 167-174. (11) Hubbard, B.; Kuang, W.; Moser, A.; Facey, G. A.; Detellier, C. Clays Miner. 2003, 51, 318-326. (12) Chiari, G.; Giustetto, R.; Riccihiardi, G. Eur. J. Mineral. 2003, 15 , 21-33. (13) Fois, E.; Gamba, A.; Tilocca, A. Microporous Mesoporous Mater. 2003, 57 , 263-272. (14) Witke, K.; Brzezinka, K.-W.; Lamprecht, I. J. Mol. Struct. 2003, 661-662 , 235-238. (15) Reinen, D.; Ko ¨hl, P.; Mu ¨ller, C. Z. Anorg. Allg. Chem. 2004, 630 , 97-103. Anal. Chem. 2007, 79, 2812-2821 2812 Analytical Chemistry, Vol. 79, No. 7, April 1, 2007 10.10 21/ac 0623 686 CCC: $37.00 © 2007 American Chemical Society Published on Web 03/08/2007
-
Upload
trinidad-pasies-arqueologia-conservacion -
Category
Documents
-
view
224 -
download
0
Transcript of Doménech, A. et al. Study blue maya. 2006
8/3/2019 Doménech, A. et al. Study blue maya. 2006
http://slidepdf.com/reader/full/domenech-a-et-al-study-blue-maya-2006 1/10
Chemometric Study of Maya Blue from theVoltammetry of Microparticles Approach
Antonio Domenech,*,† Marıa Teresa Domenech-Carbo,‡ andMarıa Luisa Vazquez de Agredos Pascual‡,§
Departament de Quı mica Analı tica, Universitat de Vale `ncia, Dr. Moliner, 50, 46100 Burjassot, Vale `ncia, Spain, Institut de Restauracio ´ del Patrimoni/Departament de Conservacio ´ i Restauracio ´ de Bens Culturals, Universitat Polite `cnica de Vale `ncia,Camı de Vera 14, 46022, Vale `ncia, Spain, and Departament de Histo `ria de l’Art, Universitat de Vale `ncia, Passeig al Mar,Vale `ncia, Spain
The use of the voltammetry of microparticles at paraffin-
impregnated graphite electrodes allows for the character-
ization of different types of Maya Blue (MB) used in wall
paintings from different archaeological sites of Campeche
and Yucata ´ n (Mexico). Using voltammetric signals for
electron-transfer processes involving palygorskite-associ-
ated indigo and quinone functionalities generated by scratching the graphite surface, voltammograms provide
information on the composition and texture of MB samples.
Application of hierarchical cluster analysis and other
chemometric methods allows us to characterize samples
from different archaeological sites and to distinguish
between samples proceeding from different chronological
periods. Comparison between microscopic, spectro-
scopic, and electrochemical examination of genuine MB
samples and synthetic specimens indicated that the
preparation procedure of the pigment evolved in time via
successive steps anticipating modern synthetic proce-
dures, namely, hybrid organic-inorganic synthesis, tem-
perature control of chemical reactivity, and template-like
synthesis.
Maya Blue (MB), a pigment produced by the ancient Mayas,
has claimed considerable attention because of its enormous
stability and peculiar hue, ranging from a bright turquoise to a
dark greenish blue. The use of MB in Central America, mostly in
Mexico, is well documented in archaeological sites between the
8th and the 16th centuries,1 but its use is prolonged even to recent
times.2
MB can be considered as a hybrid organic-inorganic material3
resulting from the attachment of indigo, a blue dye extracted from
Indigofera suffruticosaand other species, and a local clay, palygor-
skite.4,5 A Yucatan site, Sak lu’um, served as the main and almost
unique source of palygorskite in Mesoamerica. Natural indigo is
formed by indigotin (3 H -indol-3-one, 2-(1,3-dihydro-3-oxo-2 H -indol-
2-ylidene)-1,2-dihydro), a quasi-planar molecule of approximate
dimensions 4.8 × 12 Å.6 The inorganic component of MB,
palygorskite, is a fibrous phyllosilicate of ideal composition (Mg,-
Al)4Si8(O,OH,H2O)24‚nH2O. Palygorskite appears usually as a
mixture of two different polytypes, one monoclinic and one
orthorhombic, whose structure can be described in terms of continuous, two-dimensional tetrahedral and octahedral sheets.7,8
Both polytytpes show discontinuous 2:1 tetrahedral/octahedral
layers with one 2:1 unit joined to the next by inversion of the
SiO4 tetrahedra along Si-O-Si bonds. The tetrahedral and
octahedral mesh gives rise to a series of rectangular tunnels of
dimensions 6.4 × 3.7 Å. Such clays are, therefore, crossed by
zeolite-like channels and permeated by weakly bound, nonstruc-
tural (zeolitic) water. Magnesium and aluminum cations complete
their coordination with tightly bound water molecules (structural
water).
Although the procedure of extraction of indigo from plants has
remained in use until current times, the procedure for preparing
MB is unknown.1,4,5 It is believed that the Mayas prepared the
pigment by crushing indigo and palygorskite with a moderate
thermal treatment, but the details of the process and the way in
which the ancient Mayas modulated the hue of the pigment have
not been elucidated.
The nature of the indigo-palygorskite association has claimed
considerable attention in the last years.9-22 Thus, Jose-Yacaman
et al.9,10 discovered that most palygorskite particles exhibit a
superstructure along the a-axis about 14 Å, which roughly
* Corresponding author. E-mail: [email protected].† Departament de Quımica Analıtica, Universitat de Valencia.‡ Universit at Politecnica d e Valencia.§ Departament de Historia de l’Art, Universitat de Valencia.
(1) Magaloni Kerpel, D. Materiales y Tecnicas de la Pintura Maya. Facultad de
Filosofıa y Letras, Universidad Nacional Autonoma de Mexico, 1996.
(2) Tagle, A.; Paschinger, H.; Richard, H.; Infante, G. Stud. Conserv. 1990, 35 ,
156-159.
(3) Romero, P.; Sanchez, C. New J. Chem. 2005, 29 , 57-58.
(4) Torres, L. M. Mater. Res. Soc. Symp. Proc. 1988, 123.
(5) Reyes-Valerio, C. De Bonampak al Templo Mayor: el azul Maya en
Mesoamerica; Siglo XXI, Madrid, 1993.
(6) Gordon, P. F.; Gregory, P. Indigoid Dyes in Organic Chemistry in Colour ;
Springer-Verlag: Berlin 1983; pp. 208-211.
(7) Chisholm, J. E. Can. Miner. 1990, 28, 329-339.(8) Chisholm, J. E. Can. Miner. 1992, 30 , 61-73.
(9) Jose-Yacaman, M.; Rendon, L.; Arenas, J. ; Serra Puche, M. C. Science1996,
273, 223-225.
(10) Polette, L. A.; Meitzner, G.; Jose-Yacaman, M.; Chianelli, R. R. Microchem.
J. 2002, 71, 167-174.
(11) Hubbard, B.; Kuang, W.; Moser, A.; Facey, G. A.; Detellier, C. Clays Miner.
2003, 51, 318-326.
(12) Chiari, G.; Giustetto, R.; Riccihiardi, G. Eur. J. Mineral. 2003, 15 , 21-33.
(13) Fois, E.; Gamba, A.; Tilocca, A. Microporous Mesoporous Mater. 2003, 57 ,
263-272.
(14) Witke, K.; Brzezinka, K.-W.; Lamprecht, I. J. Mol. Struct. 2003, 661-662 ,
235-238.
(15) Reinen, D.; Kohl, P.; Muller, C. Z. Anorg. Allg. Chem. 2004, 630 , 97-103.
Anal. Chem. 2007, 79, 2812-2821
2812 Analytical Chemistry, Vol. 79, No. 7, April 1, 2007 10.1021/ac0623686 CCC: $37.00 © 2007 American Chemical SocietyPublished on Web 03/08/2007

8/3/2019 Doménech, A. et al. Study blue maya. 2006
http://slidepdf.com/reader/full/domenech-a-et-al-study-blue-maya-2006 2/10
corresponds to three times the original lattice constant and might
well be explained by the presence of indigo in the channels. Such
authors reported the presence of iron nanoparticles outside the
lattice of the crystallites of palygorskite as well as inside the
channels accompanying iron oxide and an amorphous phase of
FeO(OH) in MB samples10 and suggested that light dispersion
on metal nanoparticles contributes significantly to the optical
properties of the pigment. Sanchez del Rıo et al.,14,16,19 however,
did not find neither iron in metallic form nor goethite in
archaeological MB while Chiari et al.,12
Reinen et al.,15
andGiustetto et al.,17,18 suggested that the MB hue is mainly attribut-
able to bathochromic shift of the indigo spectrum originated when
single indigo molecules become attached to the palygorskite
matrix. Molecular modeling and spectral data indicate that
hydrogen bonding between indigo and the hydroxy groups in the
palygorskite channels12,13,22 or edge silanol groups11 occurs.
In previous reports, we have studied the solid-state electro-
chemistry of genuine MB samples in contact with aqueous23 and
nonaqueous24 electrolytes using the voltammetry of microparticles
approach. This methodology, developed by Scholz et al.,25,26
provides information on the composition of solid micro- and
nanosamples of solid materials. Application of solid-state electro-
chemistry combined with electron microscopy, atomic forcemicroscopy, FT-IR, and visible spectroscopies and nuclear mag-
netic resonance data allowed us to conclude that not only indigo
but also its oxidized form, dehydroindigo, is attached to palygor-
skite in MB, contributing significantly to modulate the hue of the
pigment.23 The voltammetry of microparticles allowed detection
of the presence of MB in wall paintings of the substructure IIC in
the archaeological site of Calakmul, dated in the Early Classical
period (440-450 B.C.), thus providing evidence on the use of this
pigment 700-750 years prior to the date currently accepted.23
In order to explore the capabilities of the voltammetry of
microparticles for acquiring analytical information, a chemometric
study was performed on a series of 32 MB samples from 12
archaeological sites in Yucatan (Chacmultun, D’zula, Ek Balam,
Acanceh, Kuluba, and Mulchic, all of the Late Classical period,
Chichen Itza, corresponding to the Terminal Classical period, and
Mayapan, dated at the Postclassical period) and 3 sites in
Campeche (Dzibilnocac and El Tabasqueno, Late Classical period,
and the substructure A-6 of the site of Calakmul, corresponding
to the Early Classical period, and the substructure II-C of the same
archaeological site, dated in the Late Preclassical period). The
response in contact with aqueous acetate buffer of genuine MB
samples was compared with that of synthetic specimens prepared
by crushing palygorskite and indigo under different thermal
treatments.
Multivariate chemometric methods have been applied to
voltammetric data for MB samples and synthetic specimens in
order to identify possible regularities in the electrochemicalresponse of such material and obtain analytical information
concerning two unsolved questions: (i) the method of preparation
of the pigment by the ancient Mayas and (ii) the existence of a
possible geographical or chronological variation in the Maya Blue
technology. Multivariate statistical techniques, including pattern
recognition and hierarchical cluster analysis have claimed con-
siderable attention for analytical purposes. Such methods have
been recently applied to different electroanalytical problems.27-29
EXPERIMENTAL SECTION
Microsamples ( ∼1 µg) and eventually nanosamples ( ∼20-50
ng) of MB were taken from blue or greenish-blue regions of wall
paintings in the listed archaeological sites, with the help of a microscalpel, during their routine examination and restoration.
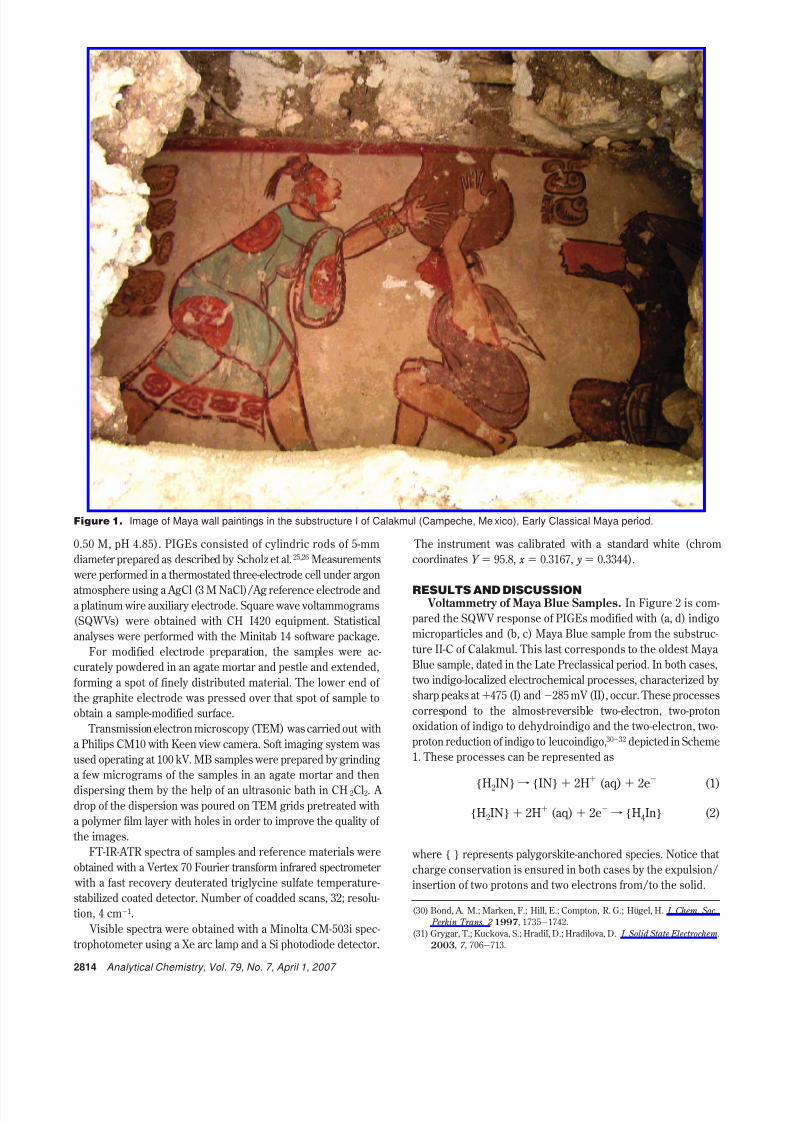
Figure 1 shows a typical Maya wall painting. A light microscope
Leica DMR ( ×25-×400) was used for selecting the samples to
be analyzed and for morphological examination of them.
Palygorskite was collected from the Sak lu’um classical
deposits in Yucatan. Synthetic indigo (Fluka) was used as a
reference material. To mimic possible preparation procedures of
MB employed by the ancient Mayas, a series of synthetic
specimens (S-1 to S-6) were prepared by crushing palygorskite
with synthetic indigo (3% w/w) plus calcite (10% w/w) and heating
at temperatures of 25, 70, 160, 260, 320. and 400 °C for periods of
12 h. With except sample S-6, which acquired a brown hue, all
Maya Blue synthetic specimens became greenish-blue, the green-
ish hue increasing on increasing temperature along the S-1 to S-5
series. After thermal treatment, a portion of the specimens was
modified by adding ochre from Sak lu’um (10% w/w), (series SC-1
to SC-6). A third series of synthetic specimens (ST-1 to ST-6) were
heated at 200 °C during 1, 2, 4, 6, 12, and 24 h. A fourth series
(SO-1 to SO-6) was prepared by adding ochre and then heating
at the above listed temperatures.
Pictorial samples were examined with a Jeol JSM 6300
scanning electron microscope operating with a Link-Oxford-Isis
X-ray microanalysis system. The analytical conditions were as
follows: accelerating voltage 20 kV, beam current 2 × 10⁻⁹ A,
and working distance 15 mm. Samples were carbon coated to
eliminate charging effects. Quantitative microanalysis was carried
out using the ZAF method for correcting interelemental effects.
The counting time was 100 s for major and minor elements.
Voltammetry of microparticles experiments were performed
using paraffin-impregnated graphite electrodes (PIGEs) immersed
into acetic acid/sodium acetate buffer (total acetate concentration
(16) Sanchez del Rıo, M. S.; Martinetto, P.; Somogyi, A.; Reyes-Valerio, C.;
Dooryhee, E.; Peltier, N.; Alianelli, L.; Moignard, B.; Pichon, L.; Calligaro,
T.; Dran, J.-C. Spectrochim. Acta, B 2004, 59 , 1619-1625.
(17) Vandenabeele, P.; Bode, S.; Alonso, A.; Moens, L. Spectrochim. Acta, A 2005,
61, 2349-2356.
(18) Chianelli, R. R.; Perez de la Rosa, M.; Meitzner, G.; Siadati, M.; Berhault,
G.; Mehta, A.; Pople, J.; Fuentes, S.; Alonzo-Nunez, G.; Polette, L. A. J.
Synchrotron Radiat. 2005, 12 , 129-134.
(19) Sanchez del Rio, M. S.; Sodo, A.; Eeckhout, S. G.; Neisius, T.; Martinetto,
P.; Dooryhee, E.; Reyes-Valerio, C. Nucl. Instrum., Methods Phys. Res., Sect. B 2005, 238, 50-54.
(20) Giustetto, R.; Llabres i Xamena, F. X.; Ricchiardi, G.; Bordiga, S.; Damin,
A.; Gobetto, R.; Chierotti, M. R. J. Phys. Chem. B 2005, 109 , 19360-19368.
(21) Sanchez del Rıo, M.; Martinett o, P.; Reyes-Valerio, C.; Dooryhee, E.; Suarez,
M. Archaeometry 2006, 48, 115-130.
(22) Giustetto, R.; Levy, D.; Chiari, G. Eur. J. Mineral. 2006, 18, 629-640.
(23) Domenech, A.; Domenech, M. T. ; Vazquez, M. L. J. Phys. Chem. B 2006,
110 , 6027-6039.
(24) Domenech, A.; Domenech, M. T.; Vazquez, M. L. J. Phys. Chem. C , submitted.
(25) Scholz, F.; Meyer, B. In Electroanalytical Chemistry , A Series of Advances;
Bard, A. J., Rubinstein, I., Eds.; Marcel Dekker: New York, 1998; Vol. 20,
pp 1-87.
(26) Grygar, T.; Marken, F.; Schroder, U.; Scholz, F. Collect. Czech. Chem.
Commun. 2002, 67 , 163-208.
(27) Scampicchio, M.; Mannino, S.; Zima, J.; Wang, J. Electroanalysis 2005, 17 ,
1215-1221.
(28) Gutes, A.; Ibanez, A. B.; Cespedes, F.; Alegret, S.; del Valle, M. Anal. Bioanal.
Chem. 2005, 382 , 471-476.
(29) Richards, E.; Bessant, C.; Saini, S. Electroanalysis 2002, 14, 1533-1542.
Analytical Chemistry, Vol. 79, No. 7, April 1, 2007 2813
8/3/2019 Doménech, A. et al. Study blue maya. 2006
http://slidepdf.com/reader/full/domenech-a-et-al-study-blue-maya-2006 3/10
0.50 M, pH 4.85). PIGEs consisted of cylindric rods of 5-mm
diameter prepared as described by Scholz et al.25,26 Measurements
were performed in a thermostated three-electrode cell under argon
atmosphere using a AgCl (3 M NaCl)/Ag reference electrode anda platinum wire auxiliary electrode. Square wave voltammograms
(SQWVs) were obtained with CH I420 equipment. Statistical
analyses were performed with the Minitab 14 software package.
For modified electrode preparation, the samples were ac-
curately powdered in an agate mortar and pestle and extended,
forming a spot of finely distributed material. The lower end of
the graphite electrode was pressed over that spot of sample to
obtain a sample-modified surface.
Transmission electron microscopy (TEM) was carried out with
a Philips CM10 with Keen view camera. Soft imaging system was
used operating at 100 kV. MB samples were prepared by grinding
a few micrograms of the samples in an agate mortar and then
dispersing them by the help of an ultrasonic bath in CH 2Cl2. A
drop of the dispersion was poured on TEM grids pretreated with
a polymer film layer with holes in order to improve the quality of
the images.
FT-IR-ATR spectra of samples and reference materials were
obtained with a Vertex 70 Fourier transform infrared spectrometer
with a fast recovery deuterated triglycine sulfate temperature-
stabilized coated detector. Number of coadded scans, 32; resolu-
tion, 4 cm-1.
Visible spectra were obtained with a Minolta CM-503i spec-
trophotometer using a Xe arc lamp and a Si photodiode detector.
The instrument was calibrated with a standard white (chrom
coordinates Y ) 95.8, x ) 0.3167, y ) 0.3344).
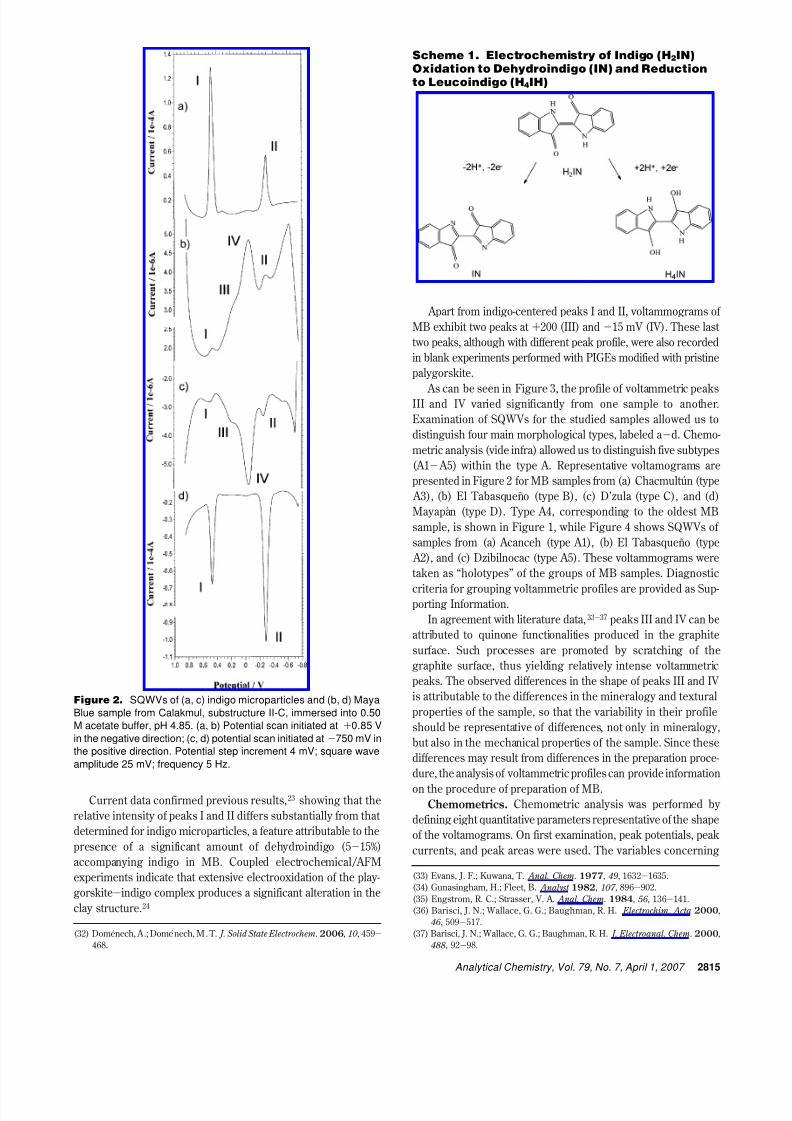
RESULTS AND DISCUSSION Voltammetry of Maya Blue Samples. In Figure 2 is com-
pared the SQWV response of PIGEs modified with (a, d) indigo
microparticles and (b, c) Maya Blue sample from the substruc-
ture II-C of Calakmul. This last corresponds to the oldest Maya
Blue sample, dated in the Late Preclassical period. In both cases,
two indigo-localized electrochemical processes, characterized by
sharp peaks at +475 (I) and -285 mV (II), occur. These processes
correspond to the almost-reversible two-electron, two-proton
oxidation of indigo to dehydroindigo and the two-electron, two-
proton reduction of indigo to leucoindigo,30-32 depicted in Scheme
1. These processes can be represented as
where { } represents palygorskite-anchored species. Notice that
charge conservation is ensured in both cases by the expulsion/
insertion of two protons and two electrons from/to the solid.
(30) Bond, A. M.; Marken, F.; Hill, E.; Compton, R. G.; Hugel, H. J. Chem. Soc.,
Perkin Trans. 2 1997, 1735-1742.
(31) Grygar, T.; Kuckova, S.; Hradil, D.; Hradilova, D. J. Solid State Electrochem.
2003, 7 , 706-713.
Figure 1. Image of Maya wall paintings in the substructure I of Calakmul (Campeche, Mexico), Early Classical Maya period.
{H2IN}f
{IN} + 2H+
(aq) + 2e-
(1)
{H2IN} + 2H+ (aq) + 2e-f {H4In} (2)
2814 Analytical Chemistry, Vol. 79, No. 7, April 1, 2007
8/3/2019 Doménech, A. et al. Study blue maya. 2006
http://slidepdf.com/reader/full/domenech-a-et-al-study-blue-maya-2006 4/10
Current data confirmed previous results,23 showing that the
relative intensity of peaks I and II differs substantially from that
determined for indigo microparticles, a feature attributable to the
presence of a significant amount of dehydroindigo (5-15%)
accompanying indigo in MB. Coupled electrochemical/AFM
experiments indicate that extensive electrooxidation of the play-
gorskite-indigo complex produces a significant alteration in the
clay structure.24
Apart from indigo-centered peaks I and II, voltammograms of
MB exhibit two peaks at +200 (III) and -15 mV (IV). These last
two peaks, although with different peak profile, were also recorded
in blank experiments performed with PIGEs modified with pristine
palygorskite.
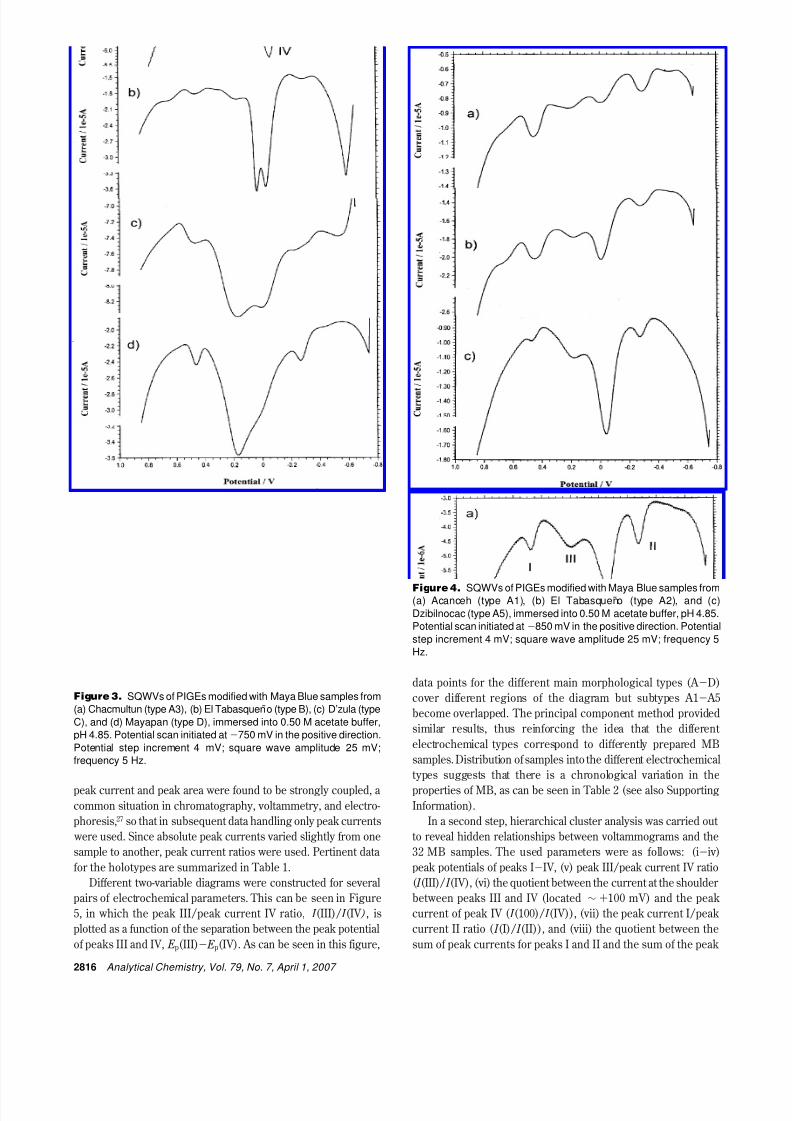
As can be seen in Figure 3, the profile of voltammetric peaksIII and IV varied significantly from one sample to another.
Examination of SQWVs for the studied samples allowed us to
distinguish four main morphological types, labeled a -d. Chemo-
metric analysis (vide infra) allowed us to distinguish five subtypes
(A1- A5) within the type A. Representative voltamograms are
presented in Figure 2 for MB samples from (a) Chacmultun (type
A3), (b) El Tabasqueno (type B), (c) D’zula (type C), and (d)
Mayapan (type D). Type A4, corresponding to the oldest MB
sample, is shown in Figure 1, while Figure 4 shows SQWVs of
samples from (a) Acanceh (type A1), (b) El Tabasqueno (type
A2), and (c) Dzibilnocac (type A5). These voltammograms were
taken as “holotypes” of the groups of MB samples. Diagnostic
criteria for grouping voltammetric profiles are provided as Sup-porting Information.
In agreement with literature data,33-37 peaks III and IV can be
attributed to quinone functionalities produced in the graphite
surface. Such processes are promoted by scratching of the
graphite surface, thus yielding relatively intense voltammetric
peaks. The observed differences in the shape of peaks III and IV
is attributable to the differences in the mineralogy and textural
properties of the sample, so that the variability in their profile
should be representative of differences, not only in mineralogy,
but also in the mechanical properties of the sample. Since these
differences may result from differences in the preparation proce-
dure, the analysis of voltammetric profiles can provide information
on the procedure of preparation of MB.Chemometrics. Chemometric analysis was performed by
defining eight quantitative parameters representative of the shape
of the voltamograms. On first examination, peak potentials, peak
currents, and peak areas were used. The variables concerning
(32) Domenech, A.; Domenech, M. T. J. Solid State Electrochem. 2006, 10 , 459-
468.
(33) Evans, J. F.; Kuwana, T. Anal. Chem. 1977, 49 , 1632-1635.
(34) Gunasingham, H.; Fleet, B. Analyst 1982, 107 , 896-902.
(35) Engstrom, R. C.; Strasser, V. A. Anal. Chem. 1984, 56 , 136-141.
(36) Barisci, J. N.; Wallace, G. G.; Baughman, R. H. Electrochim. Acta 2000,
46 , 509-517.
(37) Barisci, J. N.; Wallace, G. G.; Baughman, R. H. J. Electroanal. Chem. 2000,
488, 92-98.
Figure 2. SQWVs of (a, c) indigo microparticles and (b, d) Maya
Blue sample from Calakmul, substructure II-C, immersed into 0.50M acetate buffer, pH 4.85. (a, b) Potential scan initiated at +0.85 V
in the negative direction; (c, d) potential scan initiated at -750 mV inthe positive direction. Potential step increment 4 mV; square wave
amplitude 25 mV; frequency 5 Hz.
Scheme 1. Electrochemistry of Indigo (H2IN)
Oxidation to Dehydroindigo (IN) and Reduction
to Leucoindigo (H4IH)
Analytical Chemistry, Vol. 79, No. 7, April 1, 2007 2815
8/3/2019 Doménech, A. et al. Study blue maya. 2006
http://slidepdf.com/reader/full/domenech-a-et-al-study-blue-maya-2006 5/10
peak current and peak area were found to be strongly coupled, a
common situation in chromatography, voltammetry, and electro-
phoresis,27 so that in subsequent data handling only peak currents
were used. Since absolute peak currents varied slightly from one
sample to another, peak current ratios were used. Pertinent data
for the holotypes are summarized in Table 1.
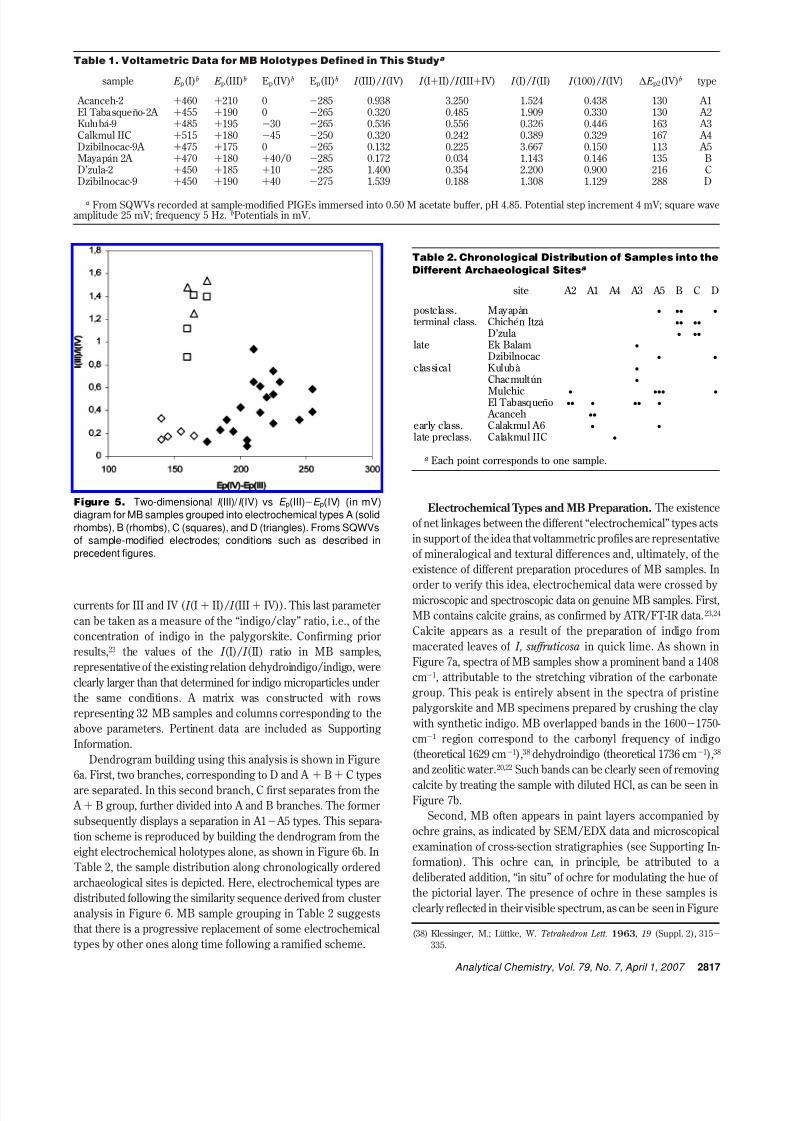
Different two-variable diagrams were constructed for several
pairs of electrochemical parameters. This can be seen in Figure
5, in which the peak III/peak current IV ratio, I (III)/ I (IV ), is
plotted as a function of the separation between the peak potential
of peaks III and IV, E p(III)- E p(IV). As can be seen in this figure,
data points for the different main morphological types (A -D)
cover different regions of the diagram but subtypes A1- A5
become overlapped. The principal component method provided
similar results, thus reinforcing the idea that the different
electrochemical types correspond to differently prepared MB
samples. Distribution of samples into the different electrochemical
types suggests that there is a chronological variation in the
properties of MB, as can be seen in Table 2 (see also Supporting
Information).
In a second step, hierarchical cluster analysis was carried out
to reveal hidden relationships between voltammograms and the
32 MB samples. The used parameters were as follows: (i-iv)
peak potentials of peaks I-IV, (v) peak III/peak current IV ratio
( I (III)/ I (IV), (vi) the quotient between the current at the shoulder
between peaks III and IV (located ∼ +100 mV) and the peak
current of peak IV ( I (100)/ I (IV)), (vii) the peak current I/peak
current II ratio ( I (I)/ I (II)), and (viii) the quotient between the
sum of peak currents for peaks I and II and the sum of the peak
Figure 3. SQWVs of PIGEs modified with Maya Blue samples from(a) Chacmultun (type A3), (b) El Tabasqueno (type B), (c) D’zula (type
C), and (d) Mayapan (type D), immersed into 0.50 M acetate buffer,pH 4.85. Potential scan initiated at -750 mV in the positive direction.
Potential step increment 4 mV; square wave amplitude 25 mV;frequency 5 Hz.
Figure 4. SQWVs of PIGEs modified with Maya Blue samples from(a) Acanceh (type A1), (b) El Tabasqueno (type A2), and (c)
Dzibilnocac (type A5), immersed into 0.50 M acetate buffer, pH 4.85.Potential scan initiated at -850 mV in the positive direction. Potential
step increment 4 mV; square wave amplitude 25 mV; frequency 5Hz.
2816 Analytical Chemistry, Vol. 79, No. 7, April 1, 2007
8/3/2019 Doménech, A. et al. Study blue maya. 2006
http://slidepdf.com/reader/full/domenech-a-et-al-study-blue-maya-2006 6/10
currents for III and IV ( I (I + II)/ I (III + IV)). This last parameter
can be taken as a measure of the “indigo/clay” ratio, i.e., of the
concentration of indigo in the palygorskite. Confirming prior
results,23 the values of the I (I)/ I (II) ratio in MB samples,
representative of the existing relation dehydroindigo/indigo, were
clearly larger than that determined for indigo microparticles under
the same conditions. A matrix was constructed with rows
representing 32 MB samples and columns corresponding to the
above parameters. Pertinent data are included as Supporting
Information.
Dendrogram building using this analysis is shown in Figure
6a. First, two branches, corresponding to D and A + B + C types
are separated. In this second branch, C first separates from the
A + B group, further divided into A and B branches. The former
subsequently displays a separation in A1- A5 types. This separa-
tion scheme is reproduced by building the dendrogram from the
eight electrochemical holotypes alone, as shown in Figure 6b. In
Table 2, the sample distribution along chronologically ordered
archaeological sites is depicted. Here, electrochemical types are
distributed following the similarity sequence derived from cluster
analysis in Figure 6. MB sample grouping in Table 2 suggests
that there is a progressive replacement of some electrochemical
types by other ones along time following a ramified scheme.
Electrochemical Types and MB Preparation. The existence
of net linkages between the different “electrochemical” types acts
in support of the idea that voltammetric profiles are representative
of mineralogical and textural differences and, ultimately, of the
existence of different preparation procedures of MB samples. In
order to verify this idea, electrochemical data were crossed by microscopic and spectroscopic data on genuine MB samples. First,
MB contains calcite grains, as confirmed by ATR/FT-IR data.23,24
Calcite appears as a result of the preparation of indigo from
macerated leaves of I, suffruticosa in quick lime. As shown in
Figure 7a, spectra of MB samples show a prominent band a 1408
cm-1, attributable to the stretching vibration of the carbonate
group. This peak is entirely absent in the spectra of pristine
palygorskite and MB specimens prepared by crushing the clay
with synthetic indigo. MB overlapped bands in the 1600-1750-
cm-1 region correspond to the carbonyl frequency of indigo
(theoretical 1629 cm-1 ),38 dehydroindigo (theoretical 1736 cm-1 ),38
and zeolitic water.20,22 Such bands can be clearly seen of removing
calcite by treating the sample with diluted HCl, as can be seen inFigure 7b.
Second, MB often appears in paint layers accompanied by
ochre grains, as indicated by SEM/EDX data and microscopical
examination of cross-section stratigraphies (see Supporting In-
formation). This ochre can, in principle, be attributed to a
deliberated addition, “in situ” of ochre for modulating the hue of
the pictorial layer. The presence of ochre in these samples is
clearly reflected in their visible spectrum, as can be seen in Figure
(38) Klessinger, M.; Luttke, W. Tetrahedron Lett. 1963, 19 (Suppl. 2), 315-
335.
Table 1. Voltametric Data for MB Holotypes Defined in This Studya
sample E p(I)b E p(III)b Ep(IV)b Ep(II)b I (III)/ I (IV) I (I+II)/ I (III+IV) I (I)/ I (II) I (100)/ I (IV) ∆ E p2(IV)b type
Acanceh-2 +460 +210 0 -285 0.938 3.250 1.524 0.438 130 A1El Tabasqueno-2A +455 +190 0 -265 0.320 0.485 1.909 0.330 130 A2Kuluba-9 +485 +195 -30 -265 0.536 0.556 0.326 0.446 163 A3Calkmul IIC +515 +180 -45 -250 0.320 0.242 0.389 0.329 167 A4Dzibilnocac-9A +475 +175 0 -265 0.132 0.225 3.667 0.150 113 A5Mayapan 2A +470 +180 +40/0 -285 0.172 0.034 1.143 0.146 135 BD’zula-2 +450 +185 +10 -285 1.400 0.354 2.200 0.900 216 CDzibilnocac-9 +450 +190 +40 -275 1.539 0.188 1.308 1.129 288 D
a From SQWVs recorded at sample-modified PIGEs immersed into 0.50 M acetate buffer, pH 4.85. Potential step increment 4 mV; square waveamplitude 25 mV; frequency 5 Hz. bPotentials in mV.
Figure 5. Two-dimensional I (III)/ I (IV) vs E p(III)-E p(IV) (in mV)diagram for MB samples grouped into electrochemical types A (solid
rhombs), B (rhombs), C (squares), and D (triangles). Froms SQWVsof sample-modified electrodes; conditions such as described in
precedent figures.
Table 2. Chronological Distribution of Samples into the
Different Archaeological Sitesa
site A2 A1 A4 A3 A5 B C D
postclass. Mayapan • •• •
terminal class. Chichen Itza •• ••
D’zula • ••
late Ek Balam •
Dzibilnocac • •
classical Kuluba •
Chacmultun •
Mulchic • ••• •El Tabasqueno •• • •• •
Acanceh ••
early class. Calakmul A6 • •
late preclass. Calakmul IIC •
a Each point corresponds to one sample.
Analytical Chemistry, Vol. 79, No. 7, April 1, 2007 2817

8/3/2019 Doménech, A. et al. Study blue maya. 2006
http://slidepdf.com/reader/full/domenech-a-et-al-study-blue-maya-2006 7/10
8. Diffuse reflectance spectra of many MB samples (curve A in
Figure 8) exhibit typically two bands at ∼420 and ∼540 nm, close
to those described for indigo and dehydroindigo in solution
phase.38 In contrast, samples of paint layers containing addi-
tions of ochre (curve B in Figure 8) exhibit a diffuse reflec-tance spectrum close to that of goethite,39 shown in curve C of
Figure 8.
It should be noted that palygorskite contains iron ions.
Although such ions do not influence the hue of the pristine clay
(white in all samples from Sak lu’um), their participation in
chemical processes (acting, for instance, as catalytic redox sites
or modulating water/indigo coordination) involved in the prepara-
tion of MB cannot be entirely discarded.
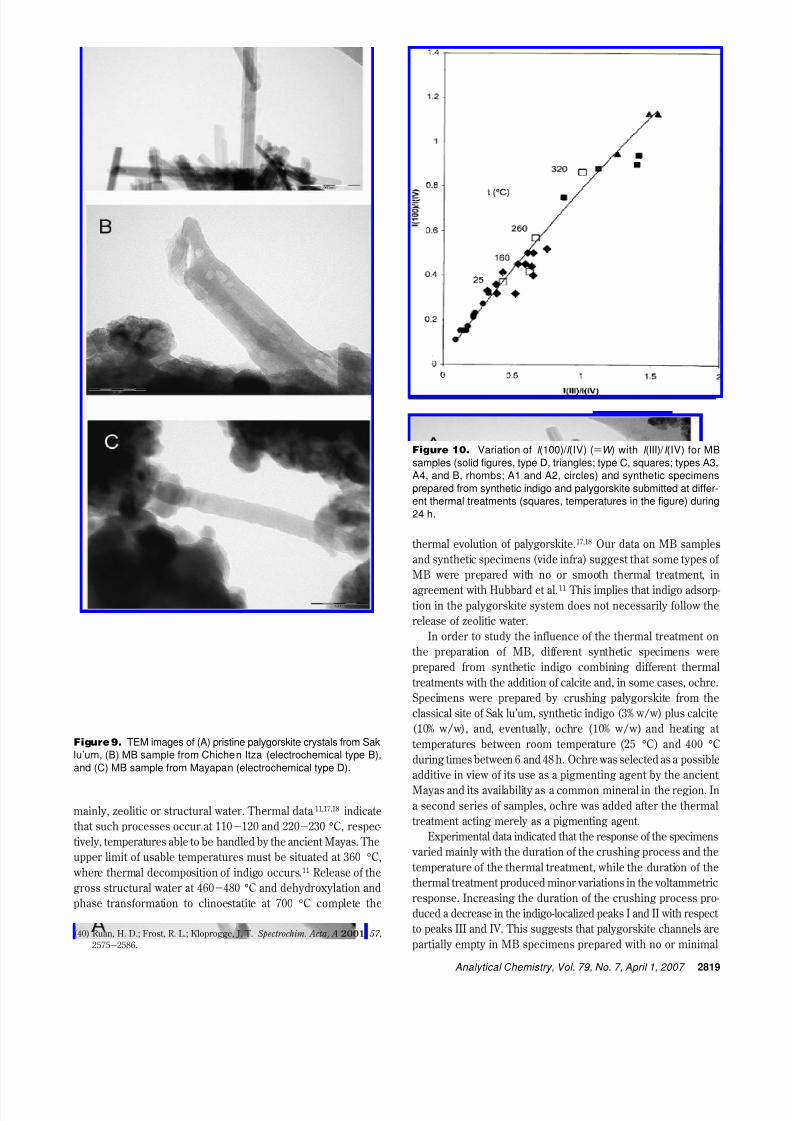
Remarkably, TEM examination of MB samples revealed
significant differences between pristine palygorskite crystals from
the classical site of Sak lu’um and palygorskite in MB samples,
as well as between the different types of MB. As can be seen in
Figure 9A, pristine palygorskite consists of aggregates of elon-gated crystals 0.5-1- µm sized having fine fiber structures with
thicknesses from 300 to 600 Å, as shown in Figure 9A. In contrast,
palygorskite from MB samples showed narrow fibbers with a
corrugated structure. Remarkably, a clear correlation between
“electrochemical” types and TEM images was obtained. Thus,
A-type MB samples presented irregular-shaped palygorskite
crystals, whereas B-type samples exhibited numerous 10-20-nm-
sized pores irregularly distributed on the surface of the crystals
(see Figure 9B). In contrast, MB samples of the C and D types
showed a dense array of fine (2-5-nm-sized) pores covering the
entire surface of palygorskite crystals (see Figure 9C). See details
in Supporting Information.
Such textural differences can be attributed to differences in
the preparation of MB via crushing indigo and palygorskite with
application of a given thermal treatment and, eventually, with
addition of other components. Similarly to other minerals,40 pores
observed in palygorskite crystals can be attributed to segregation
and evacuation of loosely bound (physisorbed) water at and,(39) Elias, M.; Chartier, C.; Prevot, G.; Garay, H.; Vignaud, C. Mater. Sci. Eng.
B 2006, 127 , 70-80.
Figure 6. Hierarchical cluster analysis with euclidean distance ofthe autoscaled variables applied to voltammetric parameters recorded
for MB samples. Data matrix using the electrochemical parametersdescribed in the text for (a) 32 MB samples and (b) the holotypes
listed in Table 1.
Figure 7. ATR/FT-IR spectra of MB sample from Mulchic (a) before
and (b) after treatment with diluted HCl for removing calciumcarbonate.
Figure 8. Diffuse reflectance spectra of (A) MB sample from El
Tabasqueno, (B) MB sample from Kuluba, and (C) goethite (fromref 40).
2818 Analytical Chemistry, Vol. 79, No. 7, April 1, 2007
8/3/2019 Doménech, A. et al. Study blue maya. 2006
http://slidepdf.com/reader/full/domenech-a-et-al-study-blue-maya-2006 8/10
mainly, zeolitic or structural water. Thermal data 11,17,18 indicate
that such processes occur at 110-120 and 220-230 °C, respec-
tively, temperatures able to be handled by the ancient Mayas. The
upper limit of usable temperatures must be situated at 360 °C,
where thermal decomposition of indigo occurs.11 Release of the
gross structural water at 460-480 °C and dehydroxylation and
phase transformation to clinoestatite at 700 °C complete the
thermal evolution of palygorskite.17,18 Our data on MB samples
and synthetic specimens (vide infra) suggest that some types of
MB were prepared with no or smooth thermal treatment, in
agreement with Hubbard et al.11 This implies that indigo adsorp-tion in the palygorskite system does not necessarily follow the
release of zeolitic water.
In order to study the influence of the thermal treatment on
the preparation of MB, different synthetic specimens were
prepared from synthetic indigo combining different thermal
treatments with the addition of calcite and, in some cases, ochre.
Specimens were prepared by crushing palygorskite from the
classical site of Sak lu’um, synthetic indigo (3% w/w) plus calcite
(10% w/w), and, eventually, ochre (10% w/w) and heating at
temperatures between room temperature (25 °C) and 400 °C
during times between 6 and 48 h. Ochre was selected as a possible
additive in view of its use as a pigmenting agent by the ancient
Mayas and its availability as a common mineral in the region. In
a second series of samples, ochre was added after the thermal
treatment acting merely as a pigmenting agent.
Experimental data indicated that the response of the specimens
varied mainly with the duration of the crushing process and the
temperature of the thermal treatment, while the duration of the
thermal treatment produced minor variations in the voltammetric
response. Increasing the duration of the crushing process pro-
duced a decrease in the indigo-localized peaks I and II with respect
to peaks III and IV. This suggests that palygorskite channels are
partially empty in MB specimens prepared with no or minimal(40) Ruan, H. D.; Frost, R. L.; Kloprogge, J. T. Spectrochim. Acta, A 2001, 57 ,
2575-2586.
Figure 9. TEM images of (A) pristine palygorskite crystals from Saklu’um, (B) MB sample from Chichen Itza (electrochemical type B),
and (C) MB sample from Mayapan (electrochemical type D).
Figure 10. Variation of I (100)/ I (IV) ()W ) with I (III)/ I (IV) for MB
samples (solid figures, type D, triangles; type C, squares; types A3,A4, and B, rhombs; A1 and A2, circles) and synthetic specimens
prepared from synthetic indigo and palygorskite submitted at differ-ent thermal treatments (squares, temperatures in the figure) during
24 h.
Analytical Chemistry, Vol. 79, No. 7, April 1, 2007 2819
8/3/2019 Doménech, A. et al. Study blue maya. 2006
http://slidepdf.com/reader/full/domenech-a-et-al-study-blue-maya-2006 9/10
thermal treatment and are progressively filled on increasing
temperature, so that indigo molecules become increasingly at-
tached to the inorganic host. Additionally, the I (I)/ I (II) ratio
increases on increasing temperature, denoting the concomitant
increase in the relative amount of dehydroindigo, a feature
consistent with prior thermochemical data.23,24
Using the above preparation procedures, voltammetric profiles
of types A3 and A4 were reproduced satisfactorily by specimens
S1-S3, prepared by crushing indigo and palygorskite with no or
smooth thermal treatment. A5-type voltammograms were obtained
for heated synthetic specimens S4 and S5. Types A1 and A2,however, were approached by nonheated or moderately heated
synthetic specimens after adding ochre (SO1-SO3). The elec-
trochemical type C was approached by specimens SC3-SC5,
which were heated after adding ochre. However, the electro-
chemical types B and D were not completely attained. Comparing
data for selected pairs of electrochemical parameters for genuine
MB samples and synthetic specimens indicated that the temper-
ature of the thermal treatment probably increased along the
sequence A -B-C-D. This can be seen in Figure 10, where the
variation of I (100)/ I (IV) with I (III)/ I (IV) is given for genuine MB
samples (solid figures) and a series of synthetic specimens
prepared without addition of ochre at different temperatures. In
this figure, the different electrochemical types are sequentially
grouped along an almost linear representation. Data points for
nonheated synthetic specimens fall within the region of A3- A4
types and, remarkably, on increasing the temperature of the
thermal treatment, synthetic specimens approach, successively,
the regions of A5, B and C-D genuine MB samples. Interestingly,
synthetic specimens prepared with ochre without thermal treat-
ment approached the region of A1- A2 types.
Implications. Crossing microscopical, spectral, and voltam-
metric data for MB samples and synthetic specimens suggested
the following: (i) electrochemical types A3 and A4 correspond
to MB prepared by crushing indigo and palygorskite with no (or
smooth) thermal treatment and no significant addition of ochre;
(ii) types A1 and A2 were prepared similarly but incorporating a
smooth thermal treatment and, frequently, a postheating addition
of ochre-type minerals; (iii) preparation of type A5 MB required
the use of a thermal treatment between 160 and 200 °C; (iv)
preparation of types B-D required the use of more strong thermal
treatments, probably with temperatures above 200 °C and addi-
tives, ochre being one of the possibly used materials.
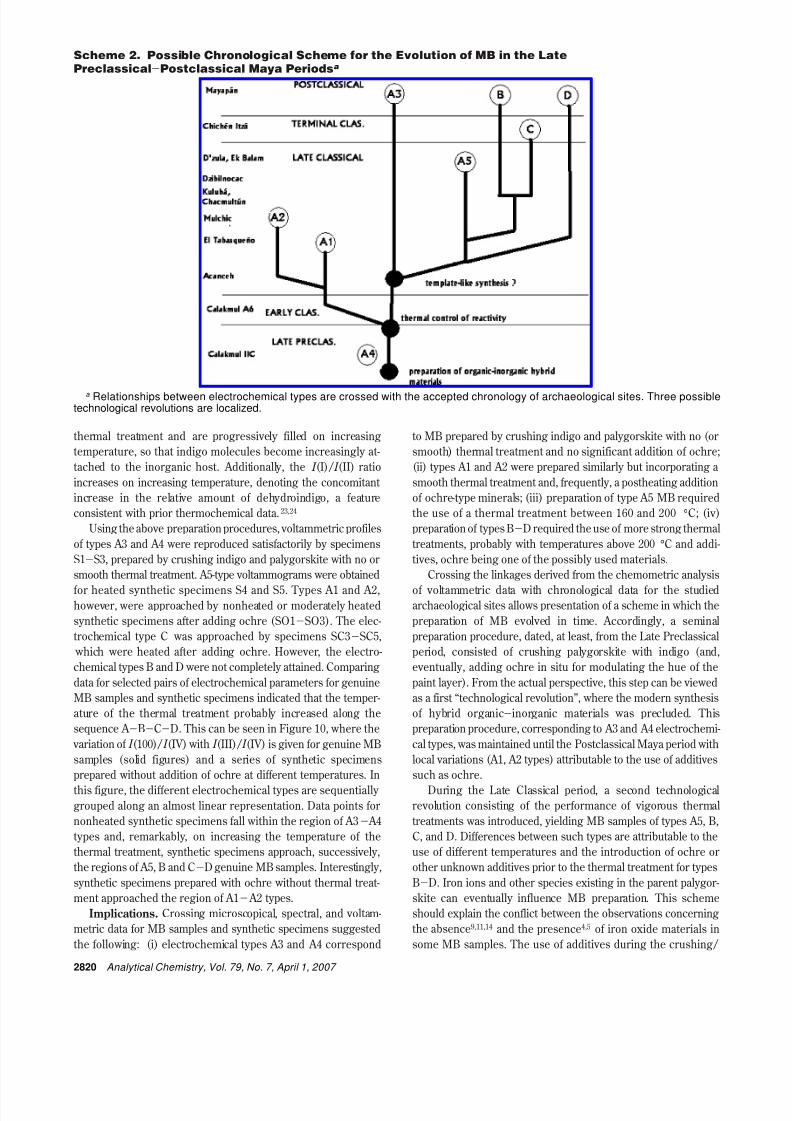
Crossing the linkages derived from the chemometric analysis
of voltammetric data with chronological data for the studiedarchaeological sites allows presentation of a scheme in which the
preparation of MB evolved in time. Accordingly, a seminal
preparation procedure, dated, at least, from the Late Preclassical
period, consisted of crushing palygorskite with indigo (and,
eventually, adding ochre in situ for modulating the hue of the
paint layer). From the actual perspective, this step can be viewed
as a first “technological revolution”, where the modern synthesis
of hybrid organic-inorganic materials was precluded. This
preparation procedure, corresponding to A3 and A4 electrochemi-
cal types, was maintained until the Postclassical Maya period with
local variations (A1, A2 types) attributable to the use of additives
such as ochre.
During the Late Classical period, a second technological
revolution consisting of the performance of vigorous thermal
treatments was introduced, yielding MB samples of types A5, B,
C, and D. Differences between such types are attributable to the
use of different temperatures and the introduction of ochre or
other unknown additives prior to the thermal treatment for types
B-D. Iron ions and other species existing in the parent palygor-
skite can eventually influence MB preparation. This scheme
should explain the conflict between the observations concerning
the absence9,11,14 and the presence4,5 of iron oxide materials in
some MB samples. The use of additives during the crushing/
Scheme 2. Possible Chronological Scheme for the Evolution of MB in the Late
Preclassical-Postclassical Maya Periodsa
a Relationships between electrochemical types are crossed with the accepted chronology of archaeological sites. Three possibletechnological revolutions are localized.
2820 Analytical Chemistry, Vol. 79, No. 7, April 1, 2007

8/3/2019 Doménech, A. et al. Study blue maya. 2006
http://slidepdf.com/reader/full/domenech-a-et-al-study-blue-maya-2006 10/10