DOI: 10jal.xjegi.com/attached/file/20180112/20180112205614_41.doc · Web view(Please write your...
9
J Arid Land doi: ***** Science Press Springer-Verlag Accumulation of soil organic carbon during natural restoration of desertified grassland in China’s Horqin Sandy Land (Times New Roman ,18 pt,Bold, flush left) LI Yuqiang 1* , ZHAO XueYong 1 , ZHANG Fengxia 2 , Tala AWADA 3 , WANG Shaokun 1 , ZHAO Halin 1 , ZHANG Tonghui 1 , LI Yulin 1 (Times New Roman, 11 pt) (Please give the author(s)’ name with the ordering of the family (last) name and first name for the Chinese while with the ordering of the first name and family (last) name for the foreigners. The first letter of the first name should be capital, and all the letters of the family (last) should be capital (e.g., HE Qing, YANG Xinghua). Where the family name may be ambiguous (e.g., a double name), please connect them with a hyphen. A comma should be used between two authors’ name. Indicate all affiliations with a superscript immediately after the author’s name(s), below the name(s) of the author(s), list the address(es) of each author’s affiliation (where the actual work was done). Provide the full postal address of each affiliation, including the city, postcode and country name. Using an asterisk indicates and provides an email address for the corresponding author who is willing to handle correspondence at all stages of publication and post-publication.) 1 Cold and Arid Regions Environmental and Engineering Research Institute, Chinese Academy of Sciences, Lanzhou 730000, China; 2 School of Environmental and Municipal Engineering, Lanzhou Jiaotong University, Lanzhou 730070, China; 3 School of Natural Resources, University of Nebraska, Lincoln NE 68583, USA (Times New Roman, 8 pt) Abstract: China’s Horqin Sandy Land, a formerly lush grassland, has experienced extensive desertification that caused considerable carbon (C) losses from the plant-soil system. Natural restoration through grazing exclusion is a widely suggested option to sequester C and to restore degraded land. In a desertified grassland, we investigated the C http://jal.xjegi.com/; www.springer.com/40333
Transcript of DOI: 10jal.xjegi.com/attached/file/20180112/20180112205614_41.doc · Web view(Please write your...

J Arid Landdoi: *****
Science Press Springer-Verlag
Accumulation of soil organic carbon during natural restoration of desertified grassland in China’s Horqin Sandy Land (Times New Roman,18 pt,Bold, flush left)
LI Yuqiang1*, ZHAO XueYong1, ZHANG Fengxia2, Tala AWADA3, WANG Shaokun1, ZHAO Halin1, ZHANG Tonghui1, LI Yulin1 (Times New Roman, 11 pt)(Please give the author(s)’ name with the ordering of the family (last) name and first name for the Chi-nese while with the ordering of the first name and family (last) name for the foreigners. The first letter of the first name should be capital, and all the letters of the family (last) should be capital (e.g., HE Qing, YANG Xinghua). Where the family name may be ambiguous (e.g., a double name), please connect them with a hyphen. A comma should be used between two authors’ name. Indicate all affiliations with a superscript immediately after the author’s name(s), below the name(s) of the author(s), list the address(es) of each author’s affiliation (where the actual work was done). Provide the full postal ad-dress of each affiliation, including the city, postcode and country name. Using an asterisk indicates and provides an email address for the corresponding author who is willing to handle correspondence at all stages of publication and post-publication.)
1 Cold and Arid Regions Environmental and Engineering Research Institute, Chinese Academy of Sciences, Lanzhou 730000, China;
2 School of Environmental and Municipal Engineering, Lanzhou Jiaotong University, Lanzhou 730070, China;3 School of Natural Resources, University of Nebraska, Lincoln NE 68583, USA (Times New Roman, 8 pt)
Abstract: China’s Horqin Sandy Land, a formerly lush grassland, has experienced extensive desertification that caused considerable carbon (C) losses from the plant-soil system. Natural restoration through grazing exclusion is a widely suggested op-tion to sequester C and to restore degraded land. In a desertified grassland, we in-vestigated the C accumulation in the total and light fractions of the soil organic mat-ter from 2005 to 2013 during natural restoration. To a depth of 20 cm, the light frac-tion organic carbon (LFOC) storage increased by 221 g C/m2 (84%) and the total soil organic carbon (SOC) storage increased by 435 g C/m2 (55%). The light fraction dry matter content represented a small proportion of the total soil mass (ranging from 0.74% in 2005 to 1.39% in 2013), but the proportion of total SOC storage accounted for by LFOC was remarkable (ranging from 33% to 40%). The C sequestration aver-aged 28 g C/(m2•a) for LFOC and 54 g C/(m2•a) for total SOC. The total SOC was strongly and significantly positively linearly related to the light fraction dry matter content and the proportions of fine sand and silt+clay. The light fraction organic mat-ter played a major role in total SOC sequestration. Our results suggest that grazing exclusion can restore decertified grassland and has a high potential for sequestering SOC in the semiarid Horqin Sandy Land. (Garamond, 10 pt)
Keywords: carbon storage; carbon sequestration; soil light fraction; restoration; grazing exclusion (Garamond, 9 pt)
http://jal.xjegi.com/; www.springer.com/40333

286 JOURNAL OF ARID LAND 2015 Vol. 7 No. 3
(Please write your text in proper English and save in Word (.doc) format. Use 10.5 pt Times New Roman font, sin-gle spaced. The text, tables and figures must be in one document. Subsections should be numbered 1.1 (then 1.1.1, 1.1.2,), 1.2, etc. Please cite a reference to acknowledge sources of information from others’ research and results. Ensure that every reference cited in the text is also present in the reference list. Citations guidelines are as follows: as (Smith, 1998) for single author, as (Smith and Miller, 1999) for two authors, and as (Smith et al., 2006) for three or more authors. In the reference list, references should be arranged first alphabetically, then chronologically, if necessary. More than one reference from the same author(s) in the same year must be identified by the letters "a", "b", "c", etc., placed after the year of publication. Journal names should not be abbreviated.)
1 IntroductionMeasurable global warming is being caused by increased emissions of four types of anthro-pogenic greenhouse gases (GHGs): carbon dioxide (CO2), methane (CH4), nitrous oxide (N2O) and halocarbons. CO2 is the most important GHG and its annual emissions increased from 21 Gt in 1970 to 38 Gt in 2004, an increase of 81% in less than 35 years (IPCC, 2007). Soils play a par -ticularly important role in the atmospheric CO2 budget (Raich and Potter, 1995). Soil contains ap-proximately 2,344 Gt of organic C globally to a depth of 3 m and is the largest pool of terrestrial or-ganic C in the biosphere (Jobbágy and Jackson, 2000). Thus, proportionally small changes in the soil organic carbon (SOC) storage could significantly affect the atmospheric CO2 concentration (Raich and Potter, 1995; Stockmann et al., 2013). For example, a decrease of just 10% in total SOC would be equivalent to 30 years of anthropogenic emissions (Kirschbaum, 2000). The pat-terns and controls of SOC storage are therefore critical for our understanding of the biosphere, given the importance of SOC for ecosystem processes and the feedbacks between this pool and the atmospheric composition and the rate of climate change (Jobbágy and Jackson, 2000). (Times New Roman, 10.5 pt)(This paragraph is the introduction of the article. In this part, author(s) should provide an adequate background, and state the significance, objective(s) and method(s) of the research work. Author(s) should also cite relative references, especially references of work published in the last two to three years. The introduction should use 10.5 pt Times New Roman font.)
2 Materials and methods (Times New Roman, 12 pt)
2.1 Study area (Times New Roman, 10.5 pt)The study was conducted in the southern part of the Horqin Sandy Land, Inner Mongolia, China, near the Naiman Desertification Research Station of the Chinese Academy of Sciences (42°55N, 120°42E; 377 m asl; Fig. 1). The region has a continental semiarid monsoon temperate climate regime with a mean annual precipitation of 366 mm, of which 70% falls from June to August, a mean annual potential evaporation of 1,935 mm, and an annual mean temperature of 6.8°C.2.2 Experimental design and soil samplingRestoration of the site was initiated in the autumn of 1996 by establishing a fenced with an area of 4.5 hm2 (300 m×150 m) that excluded grazing and allowed the vegetation to recover naturally. Nine years later (2005), the Naiman Desertification Research Station implemented a project for long-term monitoring of the dynamic evolution of the vegetation and soil. To do so, we estab-lished four 50 m×50 m plots within this enclosure, and separated these plots by 10-m-wide buffer strips (Fig. 1). Each plot was divided into twenty-five 10 m×10 m cells for sampling and investi-gation, with a total of 100 cells across all four plots. Each cell was identified using a concrete pil -ing at each of its four corners.

YuQiang LI et al.: Accumulation of soil organic carbon during natural restoration of desertified grassland in… 287
Fig. 1 Location of the study area in the Horqin Sandy Land of Inner Mongolia, northern China, illustration of the sampling design and photographs of the study site at different times (The 1996 photograph was provided by Dr. XueYong ZHAO) (Times New Roman, 9 pt)(Figures and photographs must be numbered consecutively, using Arabic numerals. Their position in the paper should match the indication in the text. A figure showing national boundaries should be drawn based on the latest standard base-map of Map Press. An entire map of China should include Taiwan Island, South China Sea Islands and Diaoyudao Island. The original maps/figures shall be in formats of .XLS for EXCEL, .OPJ for Origin, .PSD for Photoshop, .JNB for Sigmaplot, .AI/.EPS for ArcGis, etc. [Note: Please provide the origi-nal graphs of all your figures so that they can be edited in word size, font, curve shape, legend, etc]. The figures and photographs should be provided in high-resolution files with 600-900 dpi with clear titles using 7 or 8 pt Times New Roman font, and given the titles below them. In the figures, the river, the lake, the sea , the desert and the mountains should be expressed in italics.)
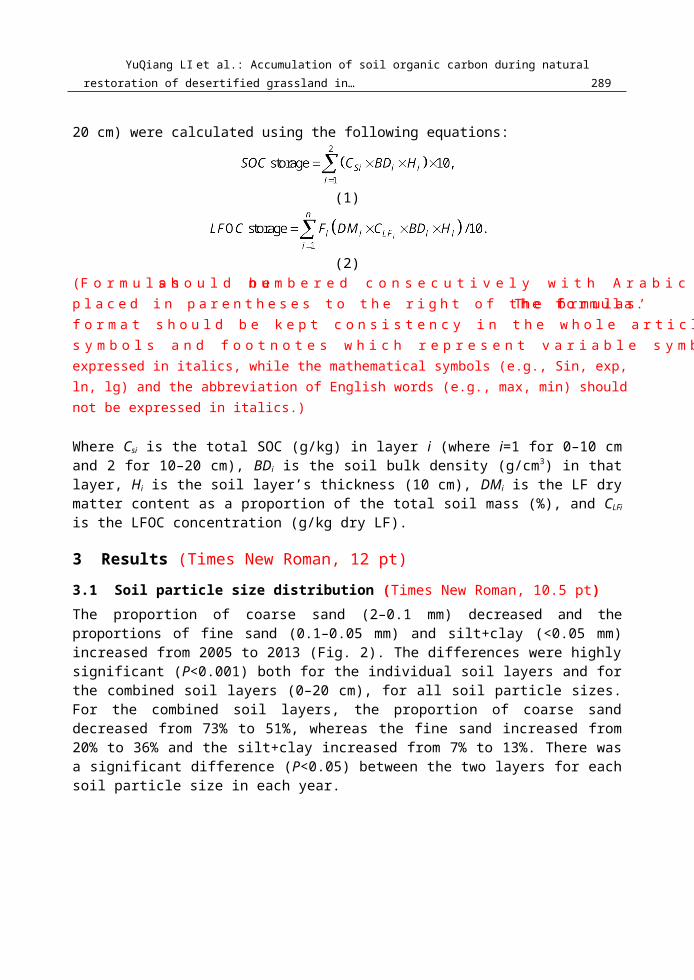
2.3 Data analysisThe total SOC storage in the soil (SOC storage, g/m2 to a depth of 20 cm) and in the light fraction (LFOC storage, g/m2 to a depth of 20 cm) were calculated using the following equations:
(1)
(2)
(Formulas should be numbered consecutively with Arabic numerals, placed in parentheses to the right of the formula. The formulas’ format should be kept consistency in the whole article. Variable symbols and footnotes which represent variable symbols should be expressed in italics, while the mathematical

288 JOURNAL OF ARID LAND 2015 Vol. 7 No. 3
symbols (e.g., Sin, exp, ln, lg) and the abbreviation of English words (e.g., max, min) should not be ex-pressed in italics.)
Where Csi is the total SOC (g/kg) in layer i (where i=1 for 0–10 cm and 2 for 10–20 cm), BDi is the soil bulk density (g/cm3) in that layer, Hi is the soil layer’s thickness (10 cm), DMi is the LF dry matter content as a proportion of the total soil mass (%), and CLFi is the LFOC concentration (g/kg dry LF).
3 Results (Times New Roman, 12 pt)
3.1 Soil particle size distribution (Times New Roman, 10.5 pt)The proportion of coarse sand (2–0.1 mm) decreased and the proportions of fine sand (0.1–0.05 mm) and silt+clay (<0.05 mm) increased from 2005 to 2013 (Fig. 2). The differences were highly significant (P<0.001) both for the individual soil layers and for the combined soil layers (0–20 cm), for all soil particle sizes. For the combined soil layers, the proportion of coarse sand de -creased from 73% to 51%, whereas the fine sand increased from 20% to 36% and the silt+clay in-creased from 7% to 13%. There was a significant difference (P<0.05) between the two layers for each soil particle size in each year.
Fig. 2 Changes in the soil particle size distribution from 2005 to 2013 (n=100). All differences between years were significant at P<0.001 level, paired-sample t-test.
(Figures with coordinate axis: The name, units and scales of coordinate axis should be placed in the figures, with clear lettering of 7 or 8 pt Times New Roman font. The units should be listed af-ter the coordinate axis’s name with parentheses outside (e. g. (m/s), (mm).)
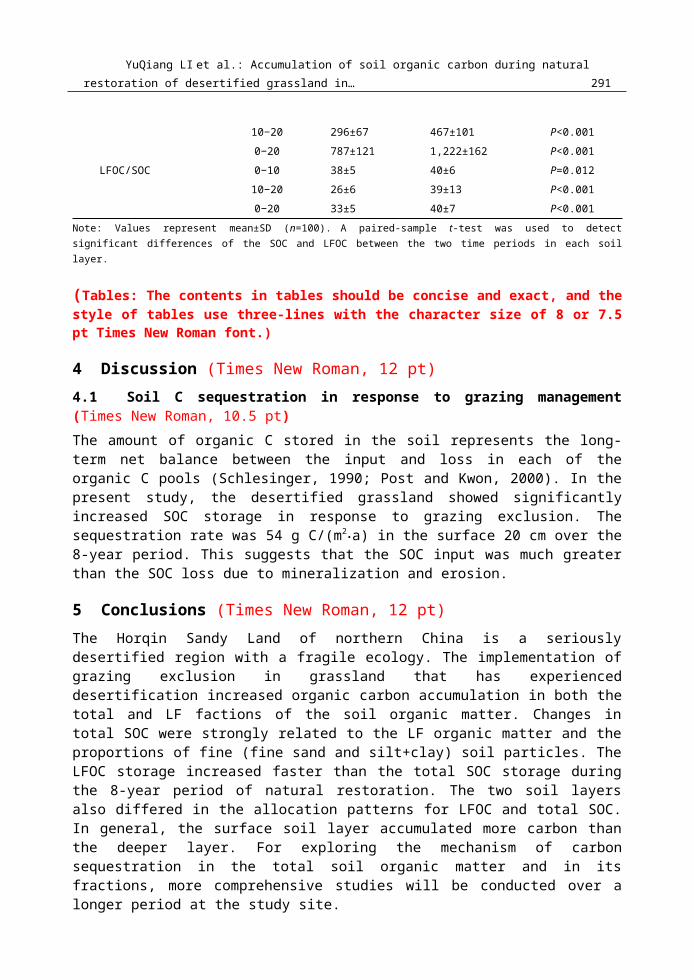
3.2 Carbon storage and accumulation ratesThe LFOC and SOC storage to a depth of 20 cm in 2013 were 221 and 435 g/m 2 greater than those in 2005 (i.e. they increased by 84% and 55%, respectively; Table 1). The increase was faster for LFOC storage than for total SOC storage in each soil layer. The LFOC storage increased by 63% and 134% in the 0–10 and 10–20 cm layers, respectively, whereas the corresponding total SOC storage increased by 54% and 58%. Thus, these storage values increased faster in the 10–20 cm layer. The LFOC and SOC storage differed significantly not only (P<0.001) between the two years for individual soil layers and the combined layers, but also between the two layers in each year (Table 1).
Table 1 Changes in the storage of soil organic carbon (SOC) and light fraction organic carbon (LFOC) to a depth of 20 cm from 2005 to 2013 (Times New Roman, 9 pt)
Soil layer (cm) 2005 2013 t-test
LFOC storage (g C/m2) 0−10 186±34 304±54 P<0.001
YuQiang LI et al.: Accumulation of soil organic carbon during natural restoration of desertified grassland in… 289
10−20 77±19 180±35 P<0.001
0−20 263±45 484±77 P<0.001
SOC storage (g C/m2) 0−10 491±72 755±85 P<0.001
10−20 296±67 467±101 P<0.001
0−20 787±121 1,222±162 P<0.001
LFOC/SOC 0−10 38±5 40±6 P=0.012
10−20 26±6 39±13 P<0.001
0−20 33±5 40±7 P<0.001
Note: Values represent mean±SD (n=100). A paired-sample t-test was used to detect significant differences of the SOC and LFOC be-tween the two time periods in each soil layer.
(Tables: The contents in tables should be concise and exact, and the style of tables use three-lines with the character size of 8 or 7.5 pt Times New Roman font.)
4 Discussion (Times New Roman, 12 pt)4.1 Soil C sequestration in response to grazing management (Times New Roman, 10.5 pt)The amount of organic C stored in the soil represents the long-term net balance between the input and loss in each of the organic C pools (Schlesinger, 1990; Post and Kwon, 2000). In the present study, the desertified grassland showed significantly increased SOC storage in response to grazing exclusion. The sequestration rate was 54 g C/(m2•a) in the surface 20 cm over the 8-year period. This suggests that the SOC input was much greater than the SOC loss due to mineralization and erosion.
5 Conclusions (Times New Roman, 12 pt)The Horqin Sandy Land of northern China is a seriously desertified region with a fragile ecology. The implementation of grazing exclusion in grassland that has experienced desertification in-creased organic carbon accumulation in both the total and LF factions of the soil organic matter. Changes in total SOC were strongly related to the LF organic matter and the proportions of fine (fine sand and silt+clay) soil particles. The LFOC storage increased faster than the total SOC stor-age during the 8-year period of natural restoration. The two soil layers also differed in the alloca-tion patterns for LFOC and total SOC. In general, the surface soil layer accumulated more carbon than the deeper layer. For exploring the mechanism of carbon sequestration in the total soil or-ganic matter and in its fractions, more comprehensive studies will be conducted over a longer pe-riod at the study site.
Acknowledgements (Times New Roman, 12 pt)This research was supported by the National Natural Science Foundation of China (41271007, 31170413) and the National Science and Technology Support Program of China (2011BAC07B02).
References (Times New Roman, 10 pt)
References introduction:In the reference list, references should be arranged first alphabetically, then chronologically, if necessary. More
than one reference from the same author(s) in the same year must be identified by the letters "a", "b", "c", etc.,
placed after the year of publication. Journal names should not be abbreviated. The references should be expressed
in 8 pt Times New Roman font.
Examples:
Articles: Day R, Fuller M, Schmidt V A. 1997. Hysteresis properties of titanomagnetites: grain-size and

290 JOURNAL OF ARID LAND 2015 Vol. 7 No. 3
compositional dependence. Physics of the Earth and Planetary Interiors, 13(4): 260267.
Ames R N, Reid C P P, Porter L K, et al. 1983. Hyphal uptake and transport of nitrogen from two 15N-la-
belled sources by Glomus misseae, a vesicular-arbuscular mycorrhizal fungus. New Phytologist , 95(3):
381396.
Monograph: Lambers H, Stuart Chapin ΙΙΙ F, Pons T L. 2008. Plant Physiological Ecology. 2 nd ed. New
York: Springer Science+Business Media, 56−64.
Proceedings: Bernstein N, Kafkafi U. 2002. Root growth under salinity stress. In: Waisel Y, Eshel A,
Kafkafi U. Plant Roots, the Hidden Half. New York: Marcel Dekker Press, 787−805.
Electronic reference: UNESCO World Heritage Centre. 2008. Operational Guidelines for the Implemen-
tation of the World Heritage Convention. Paris: UNESCO World Heritage Centre. [2009-11-17]. http://whc.un-
esco.org.
Boone R D. 1994. Light fraction soil organic matter: origin and contribution to net nitrogen mineralization. Soil Biology & Bio-chemistry, 26: 1459–1468.
Brar B S, Singh K, Dheri G S, et al. 2013. Carbon sequestration and soil carbon pools in a rice–wheat cropping system: effect of long-term use of inorganic fertilizers and organic manure. Soil & Tillage Research, 128: 30–36.
Brejda J J. 1997. Soil changes following 18 years of protection from grazing in Arizona chaparral. The Southwestern Naturalist, 42: 478–487.
Chen Y P, Li Y Q, Zhao X Y, et al. 2012. Effects of grazing exclusion on soil properties and on ecosystem carbon and nitrogen storage in a sandy rangeland of Inner Mongolia, Northern China. Environmental Management, 50: 622–632.
Christensen B T. 1992. Physical fractionation of soil and organic matter in primary particle size and density separates. Advances in Soil Science, 20: 1–90.
Crow S E, Swanston C W, Lajtha K, et al. 2007. Density fractionation of forest soils: methodological questions and interpreta-tion of incubation results and turnover time in an ecosystem context. Biogeochemistry, 85: 69–90.
FAO (Food and Agriculture Organization of the United Nations). 2004. Carbon Sequestration in Dryland soils. World Soil Re -sources Report 102. FAO, Rome, Italy.
FAO (Food and Agriculture Organization of the United Nations). 2006. FAO/IUSS Working Group WRB, World reference base for soil resources 2006. World Soil Resources Reports 103. FAO, Rome, Italy.
Grandy A S, Strickland M S, Lauber C L, et al. 2009. The influence of microbial communities, management, and soil texture on soil organic matter chemistry. Geoderma, 150: 278–286.
Gregorich E G, Liang B C, Ellert B H, et al. 1996. Fertilization effects on soil organic matter turnover and corn residue C stor-age. Soil Science Society of America Journal, 60: 472–476.
Haynes R J. 2000. Labile organic matter as an indicator of organic matter quality in arable and pastoral soils in New Zealand. Soil Biology & Biochemistry, 32: 211–219.
Helldén U, Tottrup C. 2008. Regional desertification: a global synthesis. Global and Planetary Change, 64: 169–176.Huang G, Zhao X Y, Li Y Q, et al. 2012. Restoration of shrub communities elevates organic carbon in arid soils of northwestern
China. Soil Biology & Biochemistry, 47: 123–132.IPCC (Intergovernmental Panel on Climate Change). 2007. Climate Change 2007: Synthesis Report. Contribution of Working
Groups I, II and III to the Fourth Assessment Report of the Intergovernmental Panel on Climate Change. Geneva: IPCC.ISO (International Organization for Standardization). 1994. Soil Quality—Pretreatment of Samples for Physico-chemical Analy-
sis. Geneva: ISO.ISO (International Organization for Standardization). 1998. Soil Quality—Determination of Particle Size Distribution in Mineral
Soil Material—Method by Sieving and Sedimentation. Geneva: ISO.Jobbágy E G, Jackson R B. 2000. The vertical distribution of soil organic carbon and its relation to climate and vegetation. Eco -
logical Applications, 10: 423–436.Kirschbaum M U F. 2000. Will changes in soil organic carbon act as a positive or negative feedback on global warming? Bio -
geochemistry, 48: 21–51.Laik R, Kumar K, Das D K, et al. 2009. Labile soil organic matter pools in a calciorthent after 18 years of afforestation.
YuQiang LI et al.: Accumulation of soil organic carbon during natural restoration of desertified grassland in… 291