
DOI: 10.7897/2230-8407.089164 - irjponline.com DEVELOPMENT AND EVALUATION OF TOPICAL MICROEMULSION...
17
Faizi Muzaffar & U. K. Singh . Int. Res. J. Pharm. 2017, 8 (9) 95 INTERNATIONAL RESEARCH JOURNAL OF PHARMACY www.irjponline.com ISSN 2230 – 8407 Research Article DESIGN DEVELOPMENT AND EVALUATION OF TOPICAL MICROEMULSION Faizi Muzaffar *, U. K. Singh Kharvel Subharti college of Pharmacy, Swami Vivekanand Subharti Univrsity, India *Corresponding Author Email: [email protected] Article Received on: 12/08/17 Approved for publication: 18/09/17 DOI: 10.7897/2230-8407.089164 ABSTRACT A microemulsion based gel was designed for the topical and targeted delivery of sertaconazole nitrate for the treatment of superficial fungal infection. The microemulsion region was obtained using a ternary diagram, different ratio of oil and Smix were used. The microemulsion of sertaconazole containing 2% (w/w) of sertaconazole, 6.67% (w/w) of oil phase (Eugenol+Oleic acid 1:1), 60.18% (w/ w) of surfactant mixture 2:1 ratio (Tween-80 and Transcutol-P) and 33.15% (w/w) with distilled water. The prepared microemulsion gel and commercial cream of sertaconazole were evaluated for in-vitro and ex-vivo studies. The highest drug retention was achieved with Tween 80 and Transcutol P (T80TC45) when the optimized formulation was converted to a gel. The designed formulation MG2 was safe to be used over the skin as the PDI=0 when compared with commercial cream and MG1. The optimized formulation also posse’s anti -inflammatory activity. The average zone of inhibition of MG2 was (23.19 ± 0.478) which was more than the commercial cream (15.34 ± 0.382) or MG1 (17.78 ± 0.715). Candida albicans which may be due to better permeation and retention effect of microemulsion gel 2. The MG2 was found to be stable after six month. The results obtained in this research from in vitro and in vivo data it can be concluded that the developed microemulsions have great potential for topical drug delivery in the treatment of inflammation and fungal infection. Key words: Sertaconazole nitrate, microemulsion gels, skin retention, antifungal, anti-inflammatory effect INTRODUCTION Delivery of a drug via skin 1-2 found to be attractive and proven to be very beneficial, as the systemic load of API is avoided and thus side effect are reduced as compared to others routes, drug applied topically avoids a number of parameters. Plasma levels typical for repeated administration of rapidly eliminated drug circumvent the first pass effect and decrease gastrointestinal side effects of a drug administrated by the oral route. Local actions include actions on the stratum corneum, or within the dermis. Topical delivery 3-4 has become an important means of drug delivery. Delivery of drugs to skin for systemic and local effect is called topical delivery. Topical delivery involves in the availability of drug molecules continuously from the surface, through its layers, and maintain a constant concentration within. Thus it’s a valuable alternative to the conventional topical, oral and parenteral route of drug administration. Several topical therapeutic systems are being developed successfully and recently commercialized. The reason for selecting a skin, as the route of delivery of API, is mainly because of the fact that this method avoids the irritation to the GIT that can often occur, causing bleeding, etc. Additionally, in some instances administration through this route allows the drug to bypass the metabolism, allowing more of the drug's active ingredient to be utilized. Furthermore, a high drug concentration can be delivered to a particular diseased or affected area (e.g. bacterial or fungal infection). Ingredients selected must be tolerable to the patient and non-corrosive to the applied area. Absorption rate must be considered along with the total amount of drug delivered and the rate of elimination of active ingredient if found in the bloodstream. Microemulsion could be an alternative carrier in topical drug delivery and as it has high Solubilization capability and nanometer size, it is believed that microemulsion will be a better candidate in delivering drug topically. Microemulsions composed of surfactant, water, and oil having co-surfactants provide better therapeutic action when compared to the traditional cream and lotions. Chemically, Sertaconazole contains a benzothiophene ring which makes it unique from other imidazole antifungal. A benzothiophene ring is a sulfur analog of the indole ring found in the amino acid tryptophan. Tryptophan is found in the fungal membrane in addition to lipids such as ergosterol. The benzothiophene ring in Sertaconazole mimics tryptophan and increases the drugs ability to form pores in the fungal cell membrane. If the cell membrane is made sufficiently leaky by these pores the fungal cell will die. MATERIALS AND METHODS Sertaconazole nitrate was purchased from Hangzhou Holypharm Biotech Co. Ltd. (Zhejiang, China, Eugenol, Tween-80, propylene glycol was purchased from Sigma Aldrich Mumbai Transcutol P was gifted from gattefosse, India. All other chemicals used in the study were of analytical reagent grade. Screening of excipients Screening of excipients is most important criteria to find Sertaconazole solubility 5-6 in different excipients such as oil, surfactants, and cosurfactants. Maximum solubility is to be fined in each component and with the help of ternary diagram microemulsion region is obtained. Smix has a vital in the
Transcript of DOI: 10.7897/2230-8407.089164 - irjponline.com DEVELOPMENT AND EVALUATION OF TOPICAL MICROEMULSION...
Faizi Muzaffar & U. K. Singh . Int. Res. J. Pharm. 2017, 8 (9)
95
INTERNATIONAL RESEARCH JOURNAL OF PHARMACY
www.irjponline.com
ISSN 2230 – 8407
Research Article
DESIGN DEVELOPMENT AND EVALUATION OF TOPICAL MICROEMULSION
Faizi Muzaffar *, U. K. Singh
Kharvel Subharti college of Pharmacy, Swami Vivekanand Subharti Univrsity, India *Corresponding Author Email: [email protected]
Article Received on: 12/08/17 Approved for publication: 18/09/17
DOI: 10.7897/2230-8407.089164 ABSTRACT
A microemulsion based gel was designed for the topical and targeted delivery of sertaconazole nitrate for the treatment of su perficial fungal infection.
The microemulsion region was obtained using a ternary diagram, different ratio of oil and Smix were used. The microemulsion of sertaconazole
containing 2% (w/w) of sertaconazole, 6.67% (w/w) of oil phase (Eugenol+Oleic acid 1:1), 60.18% (w/w) of surfactant mixture 2:1 ratio (Tween-80
and Transcutol-P) and 33.15% (w/w) with distilled water. The prepared microemulsion gel and commercial cream of sertaconazole were evaluated for
in-vitro and ex-vivo studies. The highest drug retention was achieved with Tween 80 and Transcutol P (T80TC45) when the optimized formulation
was converted to a gel. The designed formulation MG2 was safe to be used over the skin as the PDI=0 when compared with commercial cream and
MG1. The optimized formulation also posse’s anti-inflammatory activity. The average zone of inhibition of MG2 was (23.19 ± 0.478) which was
more than the commercial cream (15.34 ± 0.382) or MG1 (17.78 ± 0.715). Candida albicans which may be due to better permeation and retention
effect of microemulsion gel 2. The MG2 was found to be stable after six month. The results obtained in this research from in vitro and in vivo data it
can be concluded that the developed microemulsions have great potential for topical drug delivery in the treatment of inflammation and fungal
infection.
Key words: Sertaconazole nitrate, microemulsion gels, skin retention, antifungal, anti-inflammatory effect
INTRODUCTION
Delivery of a drug via skin1-2 found to be attractive and proven to be very beneficial, as the systemic load of API is avoided and thus side effect are reduced as compared to others routes, drug applied topically avoids a number of parameters. Plasma levels typical for repeated administration of rapidly eliminated drug circumvent the first pass effect and decrease gastrointestinal side effects of a drug administrated by the oral route. Local actions include actions on the stratum corneum, or within the dermis.
Topical delivery3-4 has become an important means of drug delivery. Delivery of drugs to skin for systemic and local effect is called topical delivery. Topical delivery involves in the availability of drug molecules continuously from the surface, through its layers, and maintain a constant concentration within. Thus it’s a valuable alternative to the conventional topical, oral and parenteral route of drug administration. Several topical therapeutic systems are being developed successfully and
recently commercialized. The reason for selecting a skin, as the route of delivery of API, is mainly because of the fact that this method avoids the irritation to the GIT that can often occur, causing bleeding, etc. Additionally, in some instances administration through this route allows the drug to bypass the metabolism, allowing more of the drug's active ingredient to be utilized. Furthermore, a high drug concentration can be delivered to a particular diseased or affected area (e.g. bacterial or fungal infection). Ingredients selected must be tolerable to the
patient and non-corrosive to the applied area. Absorption rate must be considered along with the total amount of drug delivered and the rate of elimination of active ingredient if found in the bloodstream.
Microemulsion could be an alternative carrier in topical drug delivery and as it has high Solubilization capability and
nanometer size, it is believed that microemulsion will be a better candidate in delivering drug topically. Microemulsions composed of surfactant, water, and oil having co-surfactants provide better therapeutic action when compared to the traditional cream and lotions. Chemically, Sertaconazole contains a benzothiophene ring which makes it unique from other imidazole antifungal. A
benzothiophene ring is a sulfur analog of the indole ring found in the amino acid tryptophan. Tryptophan is found in the fungal membrane in addition to lipids such as ergosterol. The benzothiophene ring in Sertaconazole mimics tryptophan and increases the drugs ability to form pores in the fungal cell membrane. If the cell membrane is made sufficiently leaky by these pores the fungal cell will die.
MATERIALS AND METHODS
Sertaconazole nitrate was purchased from Hangzhou Holypharm Biotech Co. Ltd. (Zhejiang, China, Eugenol, Tween-80, propylene glycol was purchased from Sigma Aldrich Mumbai Transcutol P was gifted from gattefosse, India. All other chemicals used in the study were of analytical reagent grade.
Screening of excipients
Screening of excipients is most important criteria to find Sertaconazole solubility5-6 in different excipients such as oil, surfactants, and cosurfactants. Maximum solubility is to be fined in each component and with the help of ternary diagram microemulsion region is obtained. Smix has a vital in the

Faizi Muzaffar & U. K. Singh . Int. Res. J. Pharm. 2017, 8 (9)
96
formulation as its presence makes the interfacial tension very low, and hence microemulsions formed spontaneously, with an average droplet diameter of 10-200 nm or smaller. The spectrophotometer was used at 260 nm for analysis of drug.
Drug Solubility
Drug solubility7 in number of oil, surfactants and co-surfactant (Oleic Acid, Eugenol, Olive oil, Captex 300, Captex 355, Ethyl oleate and IPM ) surfactants (Labrasol, Tween 20, Tween 80 and Cremophor RH-40) and co-surfactants (Transcutol P, Capryol, PEG 400, Ethanol and Propylene glycol) were detected
by adding an excess amount of active pharmaceutical ingredients (API) in 2ml of the selected components in 5 ml capped vials with cap or aluminum foil cap separately, mixture were vortexed and the mixture vials were kept at 37ºC ± 5ºC in incubator shaker for 72 hours, later microemulsions were centrifuged at five thousand RPM for fifteen minutes. The supernatant was separated and filtered using 0.45µm membrane filter, different Excipients solubility is illustrated in the table 1
and figure 1 to 3. The API was detected in each component using spectrophotometer at (260nm).
Analytical Method
High-performance liquid chromatography and UV spectrophotometric method were developed and validated for the quantitative determination of the bulk sertaconazole nitrate8 and its micro emulsion formulation. For HPLC, LC GC Qualisil
BDS C18 column (4.6×250 mm, 5µm particle size) with the mobile phase consisted of acetonitrile-water (65:35%v/v) and flow rate of 1.8 ml/min were used for the analysis. The sertaconazole nitrate peak is monitored at a wavelength of 260 nm; the retention time was 20.16 min. The method is considered reliable for the determination of sertaconazole nitrate. Nearly 99.6% of sertaconazole nitrate from microemulsion formulation were recovered by applying this method with RSD 0.18% (n=9).
Construction of pseudo -ternary phase diagram
According to solubility studies Oleic acid + Eugenol 1:1 ratio was chosen as the oil, Tween-80 (HLB value 15) selected as a surfactant and Transcutol P, Polyethylene glycol was selected as Cosurfactant, for aqueous phase water was used. Different Smix ratios 1:1, 1:2, 1:3, 2:1, 3:1, and 4:1. The ratio9-11 was
selected in different concentration. Firstly concentration of surfactant was increased as compared to Co-surfactant and in second condition concentration of Co-surfactant was increased as compared to surfactant, different ratio of oil and Smix were varied as 9.5:0.5, 9:1, 8.5:1.5, 8:2, 7.5:2.5, 7:3, 6.5:3.5, 6:4, 5.5:4.5, 5:5, 4.5:5.5, 4:6, 3.5:6.5, 3:7, 2.5:7.5, 2:8, 1.5:8.5, 1:9, 0.5:9.5 Were chosen so as to cover maximum ratio which will be important to define the ternary diagram. Aqueous titration
method was deployed to develop phase diagram. Slow titration with water and constant stirring after each water addition, the tube was observed for clarity and stability. Point where solution became turbid marked as the end point. The quantity of the distilled water added was noted, the same process was repeated for all other surfactant/co-surfactant ratios. Those formulations12 which remain stable after water titration and further addition of aqueous do not destabilize microemulsion. The result of preliminary trial batches of microemulsion presented in Table
5.6. (Oil phase 5-95% in each batch) A three component ternary diagram with each axis representing an oil phase, Smix, and water with fix mass ratio. The microemulsion area was drawn using Smix software.
Selection of microemulsion on the basis of stability studies
The optimized formulation was evaluated for following stability testing methods
Centrifugation Remi Model R-8C Centrifuge instrument at 5000 rpm for 15 min to find the stability of formulation by analyzing13 separation of phase occurs or not. Formulations do not undergo phase separation were taken to next stability testing methods.
Thermal stability of microemulsion
Stability of optimized Formulations was detected by placing in 10 ml transparent borosil volumetric flask at three different temperatures i.e. 4, 25 and 45o C ± 1 o C in a temperature controlled oven or in an incubator for the duration of 48-72 hours. Samples were removed periodically for assessment to detect any physical changes like loss of coalescence, clarity, and
turbidity etc.
Freeze-Thaw Method
The freeze-thaw methods14 were employed where temperature ranging from -4 to 40ºC for the duration of twenty-four hours. Samples were periodically checked visually to find any physical changes like clarity loss, the presence of coalescence and turbidity etc.
Stability Study Microemulsions
Here, we use
• ‘×’ for unstable and ‘√’ for stable after 24 hrs.
• ‘×’ separation of phase and ‘√’ non-separation of phase after centrifugation.
• Freeze Thaw method √ – Pass, × - Fail
Clarity/Dispersibility test
The stability of microemulsion15-17 was assessed for clarity for infinite dilution. Dilutions were checked using XXII USP dissolution apparatus. Test formulations were transferred in 900 ml 0.1 HCl and distilled water respectively at 37± 0.5 o C. The
aim of this research was to detect the best grade of formulation in reference to given table 4 % Transmittance18-19 was checked with respect to distilled water using spectrophotometer at 650 nm by dilution of 1.0 ml of the formulation with distilled water up to 100 ml. The microemulsion was examined for clarity by finding the transparency in term of Transmittance. Having water in as an external phase, %T value less than 98% suggest less clarity of microemulsion. Table 3
Preparation of microemulsions The microemulsion which passed the test as described in Table 5 was used for further investigation. According to ternary diagram sertaconazole, loaded microemulsion20-22 was selected comprising of different component ratio. The microemulsion was prepared with
reference to the area in the ternary diagrams, the Sertaconazole nitrate-loaded microemulsion was selected having different oil and Smix ratio. Sertaconazole nitrate (2% w/w) were dissolved in oil (oil phase was varied from 5% to 95%, and the drug was dissolved with the help of ultrasonication. (Oleic acid + Eugenol 1:1). The optimized quantity of surfactant (Tween 80)
Faizi Muzaffar & U. K. Singh . Int. Res. J. Pharm. 2017, 8 (9)
97
and co-surfactant (Propylene glycol or Transcutol P) were added and vortexed for five minutes, the aqueous phase was added slowly with continued stirring, turbidity appearance is considered end point. Selected microemulsion formulation is
given in table 6
Following parameters were employed for evaluation of Microemulsion.
Microscopic Evaluation
OLYMPUS microscope and optical microscope were employed
to detect the homogeneity of on formulation.
Microemulsion droplet size analysis
The size and distribution of formulation were obtained by Malvern Zetasizer23-24 version 6.20 laser scattering principle is employed. Malvern instrument having laser light scattering zeta sizer with argon laser was employed for evaluating the size of
globule in microemulsion and size distribution, at 90° angles and 25 °C scattering of light was monitored. The microemulsion size was obtained from the intensity, volume and bimodal distribution assuming particles to be spherical
Zeta Potential
It's an important parameter that provides an indication of the stability in colloidal systems and indicates charge present on the
colloidal systems. Highly positive or highly negative25-26 charge on oil globules indicate higher stability because of the anticipated surface repulsion between similarly charged globules hence inhibiting aggregation of the colloidal oil globules
Refractive index & pH
Refractive index of optimized formulations was detected using
an Abbe-type refractometer27. To standardized, the instrument castor oil was used. It’s a parameter in finding droplet size distribution of microemulsion as the droplet size measurement is done by light scattering observed at 90° angles. Benchtop pH Meter was employed to find the pH of the optimized formulation. pH meter was standardized with pH 4 and pH 7 buffers before use.
Conductivity Measurement
SIMTRONICS conductivity28 meter having magnetic stirrer was used to find the conductivity28 of formulation, having two platinum plates which are separated by a defined distance and having liquid between the platinum plates act as a conductor. It helps to determine the type of microemulsion and detect phase inversion phenomenon.
Viscosity
In the present study, the viscosity29 of microemulsion and its gel formulation were detected using Brookfield Viscometer (LV DV-III+ Pro EXTRA) rheometer used to measure viscosity and shear stress at given shear rates. It consists of the sample holder, and water jacket, and spindle. The rheometer uses a calibrated spring to drive a spindle that is immersed in the test fluid. DV-
III Ultra programmable rheometer is able to measure viscosity over an extremely large range of 0.1 to > 800 million cP.
TEM Analysis
Morphology of microemulsion was studied using TEM, TOPCON 002B used at 200 KV and of a 0.18 nm providing
point to point resolution. Increasing magnification, Bright field imaging modes were used find the type and size30-31 of the microemulsion. In order to perform the TEM an observation, the microemulsion was diluted with distilled water (1/100). A small drop of diluted microemulsion was deposited on the Copper holey film grid and observed by having a fixing agent and drying it in the filtered air.
Permeation, retention studies
Rat skin was obtained from already approved experiment (Reference No Med/IAEC/2012/136) Subharti University, Meerut to carry the permeation studies using the skin. Franz diffusion apparatus having an effective diffusion16-32 area of 3.14 cm2 receptor volume was 20 ml were employed for the permeation study. The optimized skin was placed at 25o C for 30
minutes before conducting the experiment. The skin was washed with distilled water and skin was clamped on the Franz diffusion apparatus. The subcutaneous side should face up into the donor compartment and the dermal side should face the receptor compartment. 2% optimized formulations (ME1- ME8) was administrated on the subcutaneous side of individual skin samples. The upper part of the cell was covered with aluminum foil. The receptor chambers were filled with methanolic phosphate buffer 7.4 (30:70%, V/V). The receiver compartment
was stirred at 100 rpm and 37±1 °C was maintained. The whole methanolic PB was replaced with new at an interval of thirty minutes until the skin was stabilized. Practically it was found that after 2.5 hours skin stabilization was achieved. When complete stabilization was achieved, Specified amount of formulation was placed into the donor compartment and sealed as to maintained occlusive conditions. Samples were withdrawn at regular intervals 0.5, 1, 2, 3, 4, 5, 6, 8, 10, 12, 20 and 24 hrs
and filtered through membrane filter size 0.45µ and analyzed for drug content by HPLC. Ex-vivo Skin permeation profile of Microemulsions is given in Figure 5. Optimized formulation selection
Formulation ME 2 and ME 6 have lowest release profile hence
both the formulation ME 2 and ME 6 was converted to gel formulation (MG1and MG2).
Preparation of gel of microemulsion
Carbomer 934 was used to make gel matrix33. The polymer was swelled with a small amount of water for 24 h resulting in a solution of high viscosity. Sertaconazole microemulsion was
added little by little to the viscous solution under constant stirring. The concentration of Carbomer 934 in MB gel was 1% (w/w). Cumulative drug release from Microemulsion MG1 and MG2 is described in Figure 6
Permeation data analysis
The drug permeated or retainerd34-37 through the skin (mg cm–2) using franz diffusion was calculated. Drug flux (permeation
rate) at steady state (Jss) was calculated by dividing the slope of the graph linear portion with the diffusion cell area (mg cm–2 h–1). Kp, Permeability coefficient was calculated by dividing Jss by the initial concentration of the drug in the donor cell (cm h–1). Er Enhancement ratio was calculated by dividing Jss of the
Faizi Muzaffar & U. K. Singh . Int. Res. J. Pharm. 2017, 8 (9)
98
respective formulation by Jss of the control formulationThe permeation profile is given in table 8.
Characterization Of Microemulsion Gel
Clarity Test The clarity test employed to detect the stability of gel; it was detected by visual inspection under background which is black and white. Satisfactory + Good ++ Excellent (glassy) +++
Spreadability
Spreadability was determined using wooden block apparatus, which was provided by a pulley at one end. By this method, Spreadability38-39 was measured on the basis of “slip” and “drag”. A ground glass slide was fixed on this block. An excess of gel (about 2 g) under study was placed on this ground slide.
The gel was then sandwiched between the slides. A weight of 100 g was placed on the top of the two slides for 5 min to expel air and to provide a uniform film of the gel between the slides. Excess of the gel was scrapped off from the edges. The top plate was then subjected to a pull of 20 g weight with the help of a string attached to the hook and the time (in seconds) required by the top slide to cover a distance of 7.5 cm was noted. S = M.L / T
Homogeneity
A little portion of the gel is checked by pressing in between the thumb and the index finger and the consistency of the gel is noticed (whether homogeneous or not, if their coarse particle appeared or detached on fingers).
Skin irritancy test
For this investigation, Wistar rat of any sex was used. The rats were obtained from the animal house of SV Subharti University, Meerut, U.P, India, Ref. No Med/IAEC/2014/378. Rats in the range of weighing 180-200 g were chosen for the study40-41.
The day before study hairs from the site of the study of the animal was removed with the help of hair clippers and scissors, complete hair removal should be done from 2 cm2 area the
portion was cleaned with surgical spirit. A 10µl of sample formulation gel was then applied the following day to the site if investigation.
Test Materials
Microemulsion formulation (MG1 & MG2) were selected to be tested against the control 2% Sertaconazole cream (SERACON,
AS Life Science) The dose of each test material was taken 10µl.
Clinical Observations
Assessing the site where the formulation was applied was scored once daily at 1, 2, 3 and 4 days after microemulsion application in the form of MG1 & MG2. Reaction on skin at the application site scored as follows grading of skin reaction (Table 9,10)
Primary Dermal Irritation Index CALCULATION (PDI)
The PDI was calculated with the help of fallowing formula and the result was predicted according to Figure 8-11
PDI = Combined index for 1, 2, 3 and 4 days / 4
Anti-inflammatory activity
Anti-inflammatory activity of MG1 and MG2 were compared with the marketed formulation. The study was carried out with the help of carrageenan42 that was used to induce paw edema as developed by (Winter et al., 1962). in albino rats. Rat weighing
180-210 g overnight fasted with free water. Groups were divided into 2 groups of 2 animals each. Dorsal part of hair of animal was first trimmed and shaved 12 h before starting the experiments. The control animals were kept intact without any disturbance. The first batch (control) received carrageenan only without the drug. The second batch received an application of optimized formulation in a dose of 5 mg/kg on the shaved region of all animals (except control group) half an hour before
subplantar mode of carrageenan. The animals were injected with 0.1 ml of carrageenan suspension (1%, w/v, in distilled water) in the right paw. Paw edema was obtained before carrageenan injection as well as after 1 to 6 h following the carrageenan injection using mercury displacement method. The % inhibition of edema volume was calculated as follows: % Inhibition = 100 × [1 – (A – x / B – y)] Where A is paw volume after administration of carrageenan at time t,
X is paw volume before administration of carrageenan. B is the mean paw volume of control rats after administration of carrageenan at time t y is mean paw volume of control rats before administration of carrageenan.
Ntifungal activity In vitro
Cup plate methods
The sterilized media was poured into Petri-plates43,44 of 100 mm size. For each formulation, three plates were prepared and kept for solidifying. One hole was bored in each plate with a stainless steel borer of 9mm diameter. The test solution was delivered with a micropipette into the holes. The volume of all the formulation to be tested was kept uniform (0.5 ml in each hole). The Petri dishes were left aseptically for an hour for
diffusion45,46 of the drug solutions. The antifungal property of optimized formulation from (MG 1 and MG2) and the control 2% Sertaconazole marketed formulation was determined using Candida albicans. (ATCC 10231) as representative fungi, adopting the Petri plate method.
Stability Studies
Optimized formulations (ME 2 and ME 6) and (MG1 and MG2) were subjected to stability studies. Formulations were transferred in ampoules and placed in Stability chambers as described in Table 16. Samples were withdrawn at 0, 1, 3 and 6 months47-49 to evaluate their physical stabilities. The stability of optimized formulations was investigated for different parameters. The stability study was performed as per ICH guideline
conditions can be decided based on climatic condition of that particular zone. As per guideline, stability is carried out as per given parameters.
Faizi Muzaffar & U. K. Singh . Int. Res. J. Pharm. 2017, 8 (9)
99
Table 1 solubility drug in different component
Component Solubility (mg/ml) Component Solubility (mg/ml)
Eugenol 39.23 ±0.22 Span 80 21.66 ± 0.57
Oleic acid 31.03 ± 1.527 Tween 80 37.33 ± 0.012
Oleic acid + Eugenol (1:1) 41.13 ± 0.44 Span 20 3.02 ± 1.645
Light Liquid Paraffin 9.33 ± 0.577 Tween 20 28.03 ± 0.605
Cardamom oil 17.13 ± 1.527 Propanol 23.7 ± 2.645
Peppermint oil 24.33 ± 2.516 Acconon CC-6 33.03 ± 0.79
Castor oil 10.33 ± 1.527 Isopropyl alcohol 17.33 ± 0.201
Cinnamon oil 28.66 ± 1.527 Cremophor RH-40 25.66 ± 1.081
Labrafac 28.33 ± 1.154 Transcutol P 37.02 ± 1.358
Capryol 90 21.66 ± 2.081 Propylene glycol 35.66 ± 1.969
Captex 355 23.33 ± 2.309 Polyethylene glycol 26.17 ± 1.732
Isopropyl myristate 20.66 ± 2.081
Table 2 Smix ratio used for Microemulsion formulation
S.No Surfactant volume Co surfactant volume Smix ratio
1 50 50 1:1
2 33.3 66.7 0.5:1 or 1:2
3 25 75 1:3
4 66.7 33.3 2:1 or 1:0.5
5 75 25 3:1
6 80 20 4:1
Table 3 Microemulsion stability result
Smix Ratio
(S: Cs)
Code
% V/V Observation according to
Thermodynamic Stability
Inference
oil Smix Aqueous Stable at
room Temp.
Centrifuge Freeze
Thaw
1:1 Oil: Tween 80: propylene glycol
T80PG 2 9.12 53.65 37.23 √ √ √ Passed
T80PG 3 11.97 46.19 41.84 √ √ √ Passed
T80PG 4 13.03 43.81 43.16 √ √ √ Passed
T80PG 5 15.27 38.5 46.23 √ √ √ Passed
1:2 T80PG 17 9.95 64.93 25.12 √ √ √ Passed
T80PG 19 12.43 53.97 33.6 √ √ √ Passed
T80PG 20 12.89 50.84 36.27 √ √ √ Passed
T80PG 23 18.23 30.66 51.11 √ √ √ Passed
1:3 T80PG 34 10.43 16.23 73.34 √ √ √ Passed
2:1 T80PG 43 11.26 67.38 21.36 √ √ √ Passed
T80PG 44 14.32 63.79 21.89 √ √ √ Passed
T80PG 45 16.12 61.15 22.73 √ √ √ Passed
T80PG 46 17.33 55.48 27.19 √ √ √ Passed
3:1 T80PG 58 11.11 55.55 33.34 √ √ √ Passed
T80PG 59 10.25 51.28 38.47 √ √ √ Passed
T80PG 61 13.33 53.33 33.33 √ √ √ Passed
4:1 T80PG 72 7.28 38.14 54.58 √ √ √ Passed
T80PG 73 7.87 36.5 56.23 √ √ √ Passed
T80PG 74 8.43 32.89 58.68 √ √ √ Passed
T80PG 75 11.2 31.02 57.01 √ √ √ Passed
1:1 Oil: Tween 80: Transcutol P
T80TC 1 10.76 48.06 41.18 √ √ √ Passed
T80TC2 10.93 39.87 49.2 √ √ √ Passed
T80TC3 9.09 21.21 69.70 √ √ √ Passed
1:2 T80TC18 5.88 52.94 41.18 √ √ √ Passed
T80TC19 7.22 46.4 46.38 √ √ √ Passed
T80TC20 9.52 38.10 52.38 √ √ √ Passed
1:3 T80TC31 6.25 56.25 37.50 √ √ √ Passed
T80TC32 7.22 51.7 41.08 √ √ √ Passed
T80TC33 10.53 42.11 47.37 √ √ √ Passed
2:1 T80TC45 6.67 60.18 33.15 √ √ √ Passed
T80TC46 7.91 55.07 37.02 √ √ √ Passed
T80TC47 11.76 47.06 41.18 √ √ √ Passed
T80TC48 13.64 31.82 54.55 √ √ √ Passed
T80TC49 14.72 28.25 57.03 √ √ √ Passed
T80TC50 16.00 24.00 60.00 √ √ √ Passed
3:1 T80TC58 7.94 71.43 20.63 √ √ √ Passed
T80TC59 9.09 36.36 36.39 √ √ √ Passed
4:1 T80TC71 7.03 66.4 26.57 √ √ √ Passed
T80TC72 10.4 53.21 36.39 √ √ √ Passed
T80TC73 11.27 47.06 41.67 √ √ √ Passed
Faizi Muzaffar & U. K. Singh . Int. Res. J. Pharm. 2017, 8 (9)
100
Table 4 different grade of the microemulsion
S.No Observation Grade
1 Forming rapidly within one minute. Microemulsion is clear to slightly bluish A
2 Forming rapidly little bit less clear and bluish color B
3 Fine milky type emulsion C
4 Emulsion grayish with slightly oily in appearance D
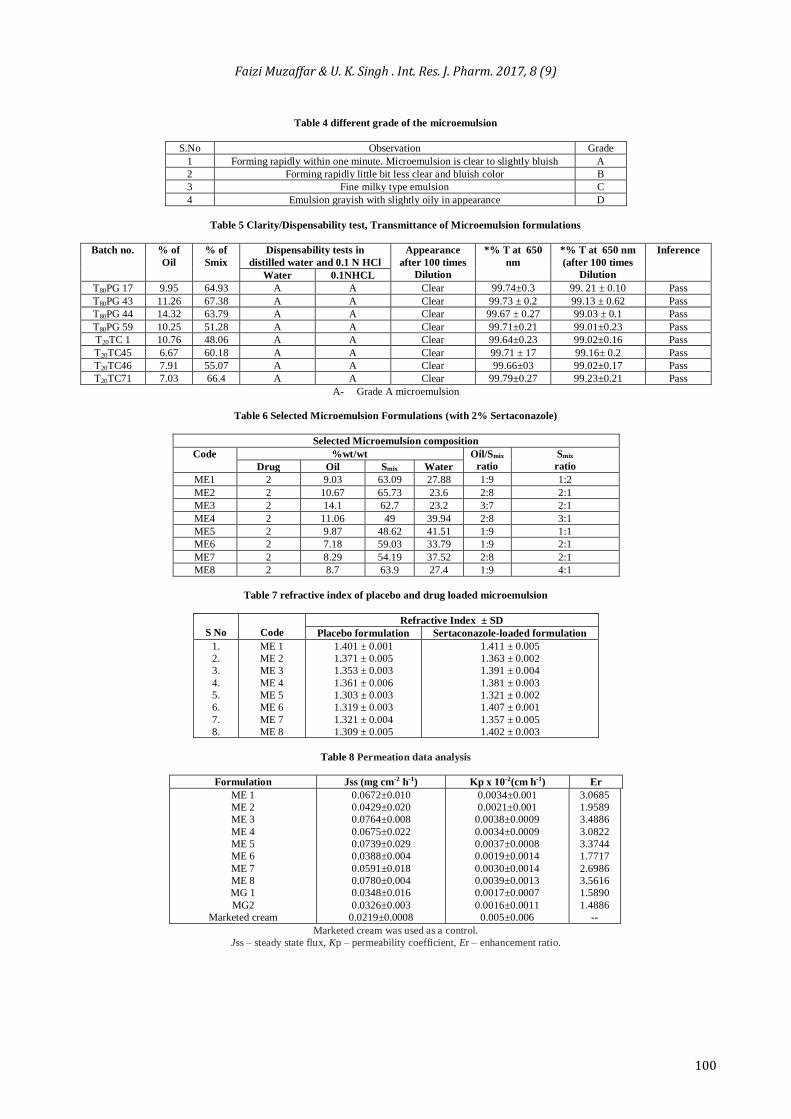
Table 5 Clarity/Dispensability test, Transmittance of Microemulsion formulations
Batch no. % of
Oil
% of
Smix
Dispensability tests in
distilled water and 0.1 N HCl
Appearance
after 100 times
Dilution
*% T at 650
nm
*% T at 650 nm
(after 100 times
Dilution
Inference
Water 0.1NHCL
T80PG 17 9.95 64.93 A A Clear 99.74±0.3 99. 21 ± 0.10 Pass
T80PG 43 11.26 67.38 A A Clear 99.73 ± 0.2 99.13 ± 0.62 Pass
T80PG 44 14.32 63.79 A A Clear 99.67 ± 0.27 99.03 ± 0.1 Pass
T80PG 59 10.25 51.28 A A Clear 99.71±0.21 99.01±0.23 Pass
T20TC 1 10.76 48.06 A A Clear 99.64±0.23 99.02±0.16 Pass
T20TC45 6.67 60.18 A A Clear 99.71 ± 17 99.16± 0.2 Pass
T20TC46 7.91 55.07 A A Clear 99.66±03 99.02±0.17 Pass
T20TC71 7.03 66.4 A A Clear 99.79±0.27 99.23±0.21 Pass
A- Grade A microemulsion
Table 6 Selected Microemulsion Formulations (with 2% Sertaconazole)
Selected Microemulsion composition
Code %wt/wt Oil/Smix
ratio
Smix
ratio Drug Oil Smix Water
ME1 2 9.03 63.09 27.88 1:9 1:2
ME2 2 10.67 65.73 23.6 2:8 2:1
ME3 2 14.1 62.7 23.2 3:7 2:1
ME4 2 11.06 49 39.94 2:8 3:1
ME5 2 9.87 48.62 41.51 1:9 1:1
ME6 2 7.18 59.03 33.79 1:9 2:1
ME7 2 8.29 54.19 37.52 2:8 2:1
ME8 2 8.7 63.9 27.4 1:9 4:1
Table 7 refractive index of placebo and drug loaded microemulsion
S No
Code
Refractive Index ± SD
Placebo formulation Sertaconazole-loaded formulation
1.
2.
3.
4.
5.
6.
7.
8.
ME 1
ME 2
ME 3
ME 4
ME 5
ME 6
ME 7
ME 8
1.401 ± 0.001
1.371 ± 0.005
1.353 ± 0.003
1.361 ± 0.006
1.303 ± 0.003
1.319 ± 0.003
1.321 ± 0.004
1.309 ± 0.005
1.411 ± 0.005
1.363 ± 0.002
1.391 ± 0.004
1.381 ± 0.003
1.321 ± 0.002
1.407 ± 0.001
1.357 ± 0.005
1.402 ± 0.003
Table 8 Permeation data analysis
Formulation Jss (mg cm-2 h-1) Kp x 10-2(cm h-1) Er
ME 1
ME 2
ME 3
ME 4
ME 5
ME 6
ME 7
ME 8
MG 1
MG2
Marketed cream
0.0672±0.010
0.0429±0.020
0.0764±0.008
0.0675±0.022
0.0739±0.029
0.0388±0.004
0.0591±0.018
0.0780±0.004
0.0348±0.016
0.0326±0.003
0.0219±0.0008
0.0034±0.001
0.0021±0.001
0.0038±0.0009
0.0034±0.0009
0.0037±0.0008
0.0019±0.0014
0.0030±0.0014
0.0039±0.0013
0.0017±0.0007
0.0016±0.0011
0.005±0.006
3.0685
1.9589
3.4886
3.0822
3.3744
1.7717
2.6986
3.5616
1.5890
1.4886
--
Marketed cream was used as a control.
Jss – steady state flux, Kp – permeability coefficient, Er – enhancement ratio.

Faizi Muzaffar & U. K. Singh . Int. Res. J. Pharm. 2017, 8 (9)
101
Table 9 Grading reaction of skin (Erythema and Eschar Formation)
No erythema 0
Very slight erythema (barely perceptible) 1
Well defined erythema 2
Moderate to severe erythema 3
Severe erythema (beef redness) to eschar formation preventing grading of
erythema
4
Table 10 Skin reactions grading (Oedema Formation)
No oedema 0
Very slight oedema (barely perceptible) 1
Slight oedema (edges of area well defined by definite raising) 2
Moderate oedema (raised approximately 1 mm) 3
Severe oedema (raised more than 1 mm and extending beyond area of exposure) 4
Table 11 Evaluation PDI (primary dermal index)
Evaluations Score
Non Irritant 0.0
Negligible Irritant 0.1- 0.4
Slight Irritant 0.41-1.9
Moderate Irritant 2.0 - 4.9
Severe Irritant 5.0 - 8.0
Table 12 Summary of observed irritation of skin scores of 2 % Sertaconazole (SERACON) Control
Time Period after 2 % Sertaconazole (SERACON) marketed
preparation (Control) in days
Animal
no.
Sex 1 2 3 4
Ery. Oed. Ery. Oed. Ery. Oed. Ery. Oed.
1. M 1 0.0 0.0 0.0 0.0 0.0 0.0 0.0
2. M 1 0.0 0.0 0.0 0.0 0.0 0.0 0.0
3. M 1 0.0 0.0 0.0 0.0 0.0 0.0 0.0
Total 3 0 0.0 0.0 0.0 0.0 0.0 0.0
Mean 1 0.00 0 0.00 0.0 0.00 0.0 0.00
Combined index 0.5 0.0 0.0 0.0
PDI 0.12
* (Ery. = Erythema; Oed. = Oedema)
Table 13 Summary of observed primary skin irritation scores of MG1
Time Period after MG 1 (in days)
Animal
no.
Sex 1 2 3 4
Ery. Oed. Ery. Oed. Ery. Oed. Ery. Oed.
1 M 1 0.0 1 0.0 0 0.0 0 0.0
2 M 1 0.0 0 0.0 0 0.0 0 0.0
3 M 1 0.0 1 0.0 1 0.0 0 0.0
Total 3 0.0 0.66 0.0 0.33 0.0 0 0.0
Mean 1 0.00 0.33 0.00 0.16 0.00 0 0.00
Combined index 0.5 0.16 0.08 0
PDI 0.185
* (Ery. = Erythema; Oed. = Oedema)
Table 14 Summary of observed primary skin irritation scores of MG2
Time Period after MG 2 (in days)
Animal
no.
Sex 1 2 3 4
Ery. Oed. Ery. Oed. Ery. Oed. Ery. Oed.
1. M 0.0 0.0 0.0 0.0 0.0 0.0 0.0 0.0
2. M 0.0 0.0 0.0 0.0 0.0 0.0 0.0 0.0
3. M 0.0 0.0 0.0 0.0 0.0 0.0 0.0 0.0
Total 0.0 0.0 0.0 0.0 0.0 0.0 0.0 0.0
Mean 0.0 0.00 0.00 0.0 0.0 0.0 0.0 0.0
Combined index 0.0 0.0 0.0 0.00
PDI 0.00 (Zero)
* (Ery. = Erythema; Oed. = Oedema)
Faizi Muzaffar & U. K. Singh . Int. Res. J. Pharm. 2017, 8 (9)
102
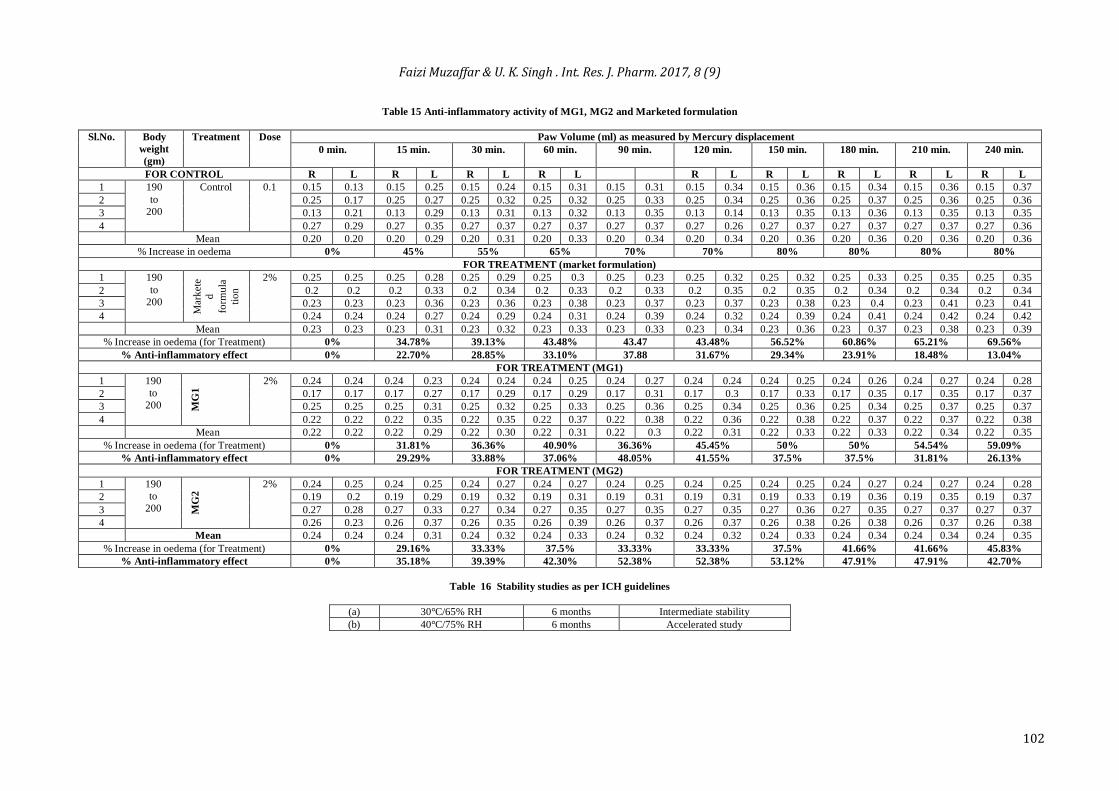
Table 15 Anti-inflammatory activity of MG1, MG2 and Marketed formulation
Sl.No. Body
weight
(gm)
Treatment Dose Paw Volume (ml) as measured by Mercury displacement
0 min. 15 min. 30 min. 60 min. 90 min. 120 min. 150 min. 180 min. 210 min. 240 min.
FOR CONTROL R L R L R L R L R L R L R L R L R L
1 190
to
200
Control 0.1 0.15 0.13 0.15 0.25 0.15 0.24 0.15 0.31 0.15 0.31 0.15 0.34 0.15 0.36 0.15 0.34 0.15 0.36 0.15 0.37
2 0.25 0.17 0.25 0.27 0.25 0.32 0.25 0.32 0.25 0.33 0.25 0.34 0.25 0.36 0.25 0.37 0.25 0.36 0.25 0.36
3 0.13 0.21 0.13 0.29 0.13 0.31 0.13 0.32 0.13 0.35 0.13 0.14 0.13 0.35 0.13 0.36 0.13 0.35 0.13 0.35
4 0.27 0.29 0.27 0.35 0.27 0.37 0.27 0.37 0.27 0.37 0.27 0.26 0.27 0.37 0.27 0.37 0.27 0.37 0.27 0.36
Mean 0.20 0.20 0.20 0.29 0.20 0.31 0.20 0.33 0.20 0.34 0.20 0.34 0.20 0.36 0.20 0.36 0.20 0.36 0.20 0.36
% Increase in oedema 0% 45% 55% 65% 70% 70% 80% 80% 80% 80%
FOR TREATMENT (market formulation)
1 190
to
200
Mar
ket
e
d
form
ula
tio
n
2% 0.25 0.25 0.25 0.28 0.25 0.29 0.25 0.3 0.25 0.23 0.25 0.32 0.25 0.32 0.25 0.33 0.25 0.35 0.25 0.35
2 0.2 0.2 0.2 0.33 0.2 0.34 0.2 0.33 0.2 0.33 0.2 0.35 0.2 0.35 0.2 0.34 0.2 0.34 0.2 0.34
3 0.23 0.23 0.23 0.36 0.23 0.36 0.23 0.38 0.23 0.37 0.23 0.37 0.23 0.38 0.23 0.4 0.23 0.41 0.23 0.41
4 0.24 0.24 0.24 0.27 0.24 0.29 0.24 0.31 0.24 0.39 0.24 0.32 0.24 0.39 0.24 0.41 0.24 0.42 0.24 0.42
Mean 0.23 0.23 0.23 0.31 0.23 0.32 0.23 0.33 0.23 0.33 0.23 0.34 0.23 0.36 0.23 0.37 0.23 0.38 0.23 0.39
% Increase in oedema (for Treatment) 0% 34.78% 39.13% 43.48% 43.47 43.48% 56.52% 60.86% 65.21% 69.56%
% Anti-inflammatory effect 0% 22.70% 28.85% 33.10% 37.88 31.67% 29.34% 23.91% 18.48% 13.04%
FOR TREATMENT (MG1)
1 190
to
200 MG
1 2% 0.24 0.24 0.24 0.23 0.24 0.24 0.24 0.25 0.24 0.27 0.24 0.24 0.24 0.25 0.24 0.26 0.24 0.27 0.24 0.28
2 0.17 0.17 0.17 0.27 0.17 0.29 0.17 0.29 0.17 0.31 0.17 0.3 0.17 0.33 0.17 0.35 0.17 0.35 0.17 0.37
3 0.25 0.25 0.25 0.31 0.25 0.32 0.25 0.33 0.25 0.36 0.25 0.34 0.25 0.36 0.25 0.34 0.25 0.37 0.25 0.37
4 0.22 0.22 0.22 0.35 0.22 0.35 0.22 0.37 0.22 0.38 0.22 0.36 0.22 0.38 0.22 0.37 0.22 0.37 0.22 0.38
Mean 0.22 0.22 0.22 0.29 0.22 0.30 0.22 0.31 0.22 0.3 0.22 0.31 0.22 0.33 0.22 0.33 0.22 0.34 0.22 0.35
% Increase in oedema (for Treatment) 0% 31.81% 36.36% 40.90% 36.36% 45.45% 50% 50% 54.54% 59.09%
% Anti-inflammatory effect 0% 29.29% 33.88% 37.06% 48.05% 41.55% 37.5% 37.5% 31.81% 26.13%
FOR TREATMENT (MG2)
1 190
to
200 MG
2 2% 0.24 0.25 0.24 0.25 0.24 0.27 0.24 0.27 0.24 0.25 0.24 0.25 0.24 0.25 0.24 0.27 0.24 0.27 0.24 0.28
2 0.19 0.2 0.19 0.29 0.19 0.32 0.19 0.31 0.19 0.31 0.19 0.31 0.19 0.33 0.19 0.36 0.19 0.35 0.19 0.37
3 0.27 0.28 0.27 0.33 0.27 0.34 0.27 0.35 0.27 0.35 0.27 0.35 0.27 0.36 0.27 0.35 0.27 0.37 0.27 0.37
4 0.26 0.23 0.26 0.37 0.26 0.35 0.26 0.39 0.26 0.37 0.26 0.37 0.26 0.38 0.26 0.38 0.26 0.37 0.26 0.38
Mean 0.24 0.24 0.24 0.31 0.24 0.32 0.24 0.33 0.24 0.32 0.24 0.32 0.24 0.33 0.24 0.34 0.24 0.34 0.24 0.35
% Increase in oedema (for Treatment) 0% 29.16% 33.33% 37.5% 33.33% 33.33% 37.5% 41.66% 41.66% 45.83%
% Anti-inflammatory effect 0% 35.18% 39.39% 42.30% 52.38% 52.38% 53.12% 47.91% 47.91% 42.70%
Table 16 Stability studies as per ICH guidelines
(a) 30°C/65% RH 6 months Intermediate stability
(b) 40°C/75% RH 6 months Accelerated study
Faizi Muzaffar & U. K. Singh . Int. Res. J. Pharm. 2017, 8 (9)
103
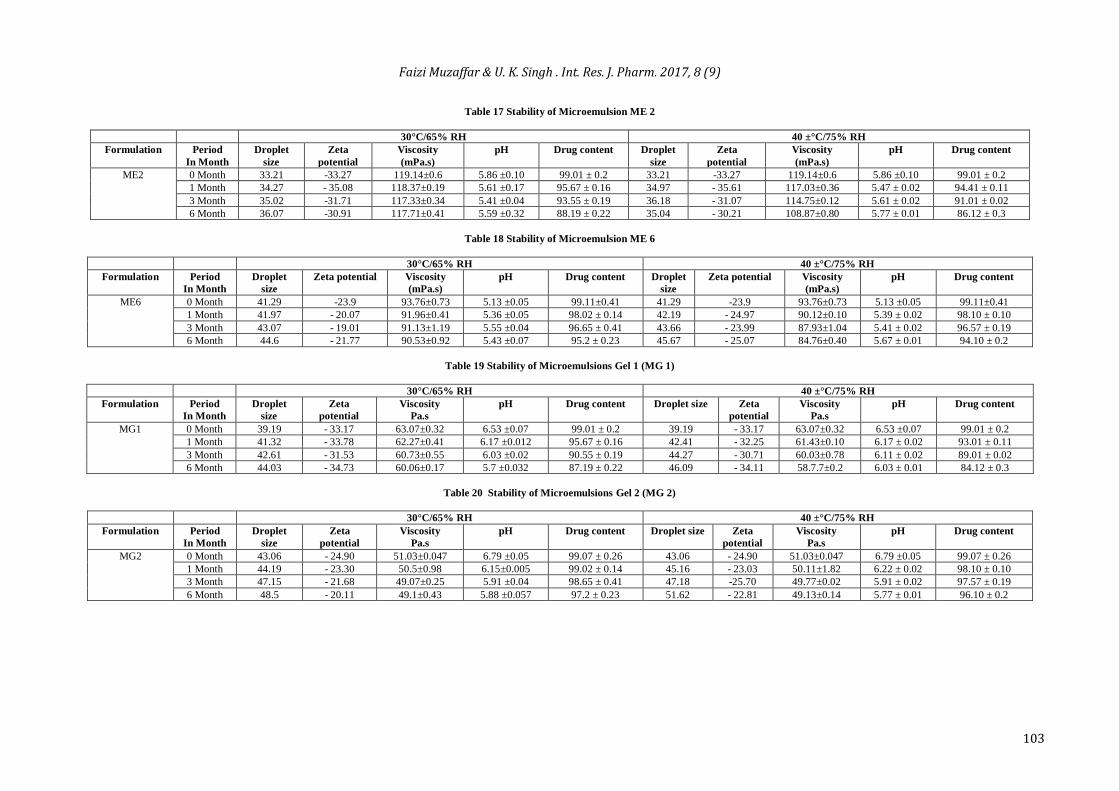
Table 17 Stability of Microemulsion ME 2
30°C/65% RH 40 ±°C/75% RH
Formulation Period
In Month
Droplet
size
Zeta
potential
Viscosity
(mPa.s)
pH Drug content Droplet
size
Zeta
potential
Viscosity
(mPa.s)
pH Drug content
ME2 0 Month 33.21 -33.27 119.14±0.6 5.86 ±0.10 99.01 ± 0.2 33.21 -33.27 119.14±0.6 5.86 ±0.10 99.01 ± 0.2
1 Month 34.27 - 35.08 118.37±0.19 5.61 ±0.17 95.67 ± 0.16 34.97 - 35.61 117.03±0.36 5.47 ± 0.02 94.41 ± 0.11
3 Month 35.02 -31.71 117.33±0.34 5.41 ±0.04 93.55 ± 0.19 36.18 - 31.07 114.75±0.12 5.61 ± 0.02 91.01 ± 0.02
6 Month 36.07 -30.91 117.71±0.41 5.59 ±0.32 88.19 ± 0.22 35.04 - 30.21 108.87±0.80 5.77 ± 0.01 86.12 ± 0.3
Table 18 Stability of Microemulsion ME 6
30°C/65% RH 40 ±°C/75% RH
Formulation Period
In Month
Droplet
size
Zeta potential Viscosity
(mPa.s)
pH Drug content Droplet
size
Zeta potential Viscosity
(mPa.s)
pH Drug content
ME6 0 Month 41.29 -23.9 93.76±0.73 5.13 ±0.05 99.11±0.41 41.29 -23.9 93.76±0.73 5.13 ±0.05 99.11±0.41
1 Month 41.97 - 20.07 91.96±0.41 5.36 ±0.05 98.02 ± 0.14 42.19 - 24.97 90.12±0.10 5.39 ± 0.02 98.10 ± 0.10
3 Month 43.07 - 19.01 91.13±1.19 5.55 ±0.04 96.65 ± 0.41 43.66 - 23.99 87.93±1.04 5.41 ± 0.02 96.57 ± 0.19
6 Month 44.6 - 21.77 90.53±0.92 5.43 ±0.07 95.2 ± 0.23 45.67 - 25.07 84.76±0.40 5.67 ± 0.01 94.10 ± 0.2
Table 19 Stability of Microemulsions Gel 1 (MG 1)
30°C/65% RH 40 ±°C/75% RH
Formulation Period
In Month
Droplet
size
Zeta
potential
Viscosity
Pa.s
pH Drug content Droplet size Zeta
potential
Viscosity
Pa.s
pH Drug content
MG1 0 Month 39.19 - 33.17 63.07±0.32 6.53 ±0.07 99.01 ± 0.2 39.19 - 33.17 63.07±0.32 6.53 ±0.07 99.01 ± 0.2
1 Month 41.32 - 33.78 62.27±0.41 6.17 ±0.012 95.67 ± 0.16 42.41 - 32.25 61.43±0.10 6.17 ± 0.02 93.01 ± 0.11
3 Month 42.61 - 31.53 60.73±0.55 6.03 ±0.02 90.55 ± 0.19 44.27 - 30.71 60.03±0.78 6.11 ± 0.02 89.01 ± 0.02
6 Month 44.03 - 34.73 60.06±0.17 5.7 ±0.032 87.19 ± 0.22 46.09 - 34.11 58.7.7±0.2 6.03 ± 0.01 84.12 ± 0.3
Table 20 Stability of Microemulsions Gel 2 (MG 2)
30°C/65% RH 40 ±°C/75% RH
Formulation Period
In Month
Droplet
size
Zeta
potential
Viscosity
Pa.s
pH Drug content Droplet size Zeta
potential
Viscosity
Pa.s
pH Drug content
MG2 0 Month 43.06 - 24.90 51.03±0.047 6.79 ±0.05 99.07 ± 0.26 43.06 - 24.90 51.03±0.047 6.79 ±0.05 99.07 ± 0.26
1 Month 44.19 - 23.30 50.5±0.98 6.15±0.005 99.02 ± 0.14 45.16 - 23.03 50.11±1.82 6.22 ± 0.02 98.10 ± 0.10
3 Month 47.15 - 21.68 49.07±0.25 5.91 ±0.04 98.65 ± 0.41 47.18 -25.70 49.77±0.02 5.91 ± 0.02 97.57 ± 0.19
6 Month 48.5 - 20.11 49.1±0.43 5.88 ±0.057 97.2 ± 0.23 51.62 - 22.81 49.13±0.14 5.77 ± 0.01 96.10 ± 0.2
Faizi Muzaffar & U. K. Singh . Int. Res. J. Pharm. 2017, 8 (9)
104
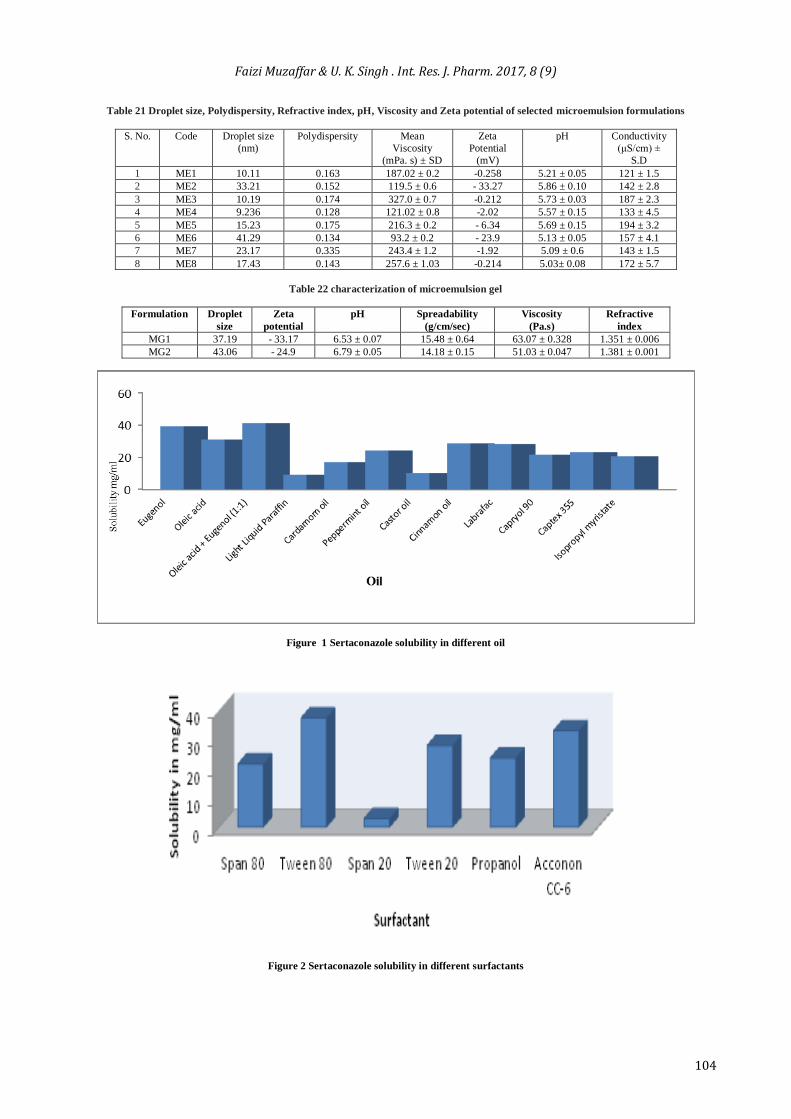
Table 21 Droplet size, Polydispersity, Refractive index, pH, Viscosity and Zeta potential of selected microemulsion formulations
S. No. Code Droplet size
(nm)
Polydispersity Mean
Viscosity
(mPa. s) ± SD
Zeta
Potential
(mV)
pH Conductivity
(μS/cm) ±
S.D
1 ME1 10.11 0.163 187.02 ± 0.2 -0.258 5.21 ± 0.05 121 ± 1.5
2 ME2 33.21 0.152 119.5 ± 0.6 - 33.27 5.86 ± 0.10 142 ± 2.8
3 ME3 10.19 0.174 327.0 ± 0.7 -0.212 5.73 ± 0.03 187 ± 2.3
4 ME4 9.236 0.128 121.02 ± 0.8 -2.02 5.57 ± 0.15 133 ± 4.5
5 ME5 15.23 0.175 216.3 ± 0.2 - 6.34 5.69 ± 0.15 194 ± 3.2
6 ME6 41.29 0.134 93.2 ± 0.2 - 23.9 5.13 ± 0.05 157 ± 4.1
7 ME7 23.17 0.335 243.4 ± 1.2 -1.92 5.09 ± 0.6 143 ± 1.5
8 ME8 17.43 0.143 257.6 ± 1.03 -0.214 5.03± 0.08 172 ± 5.7
Table 22 characterization of microemulsion gel
Formulation Droplet
size
Zeta
potential
pH Spreadability
(g/cm/sec)
Viscosity
(Pa.s)
Refractive
index
MG1 37.19 - 33.17 6.53 ± 0.07 15.48 ± 0.64 63.07 ± 0.328 1.351 ± 0.006
MG2 43.06 - 24.9 6.79 ± 0.05 14.18 ± 0.15 51.03 ± 0.047 1.381 ± 0.001
Figure 1 Sertaconazole solubility in different oil
Figure 2 Sertaconazole solubility in different surfactants
Faizi Muzaffar & U. K. Singh . Int. Res. J. Pharm. 2017, 8 (9)
105
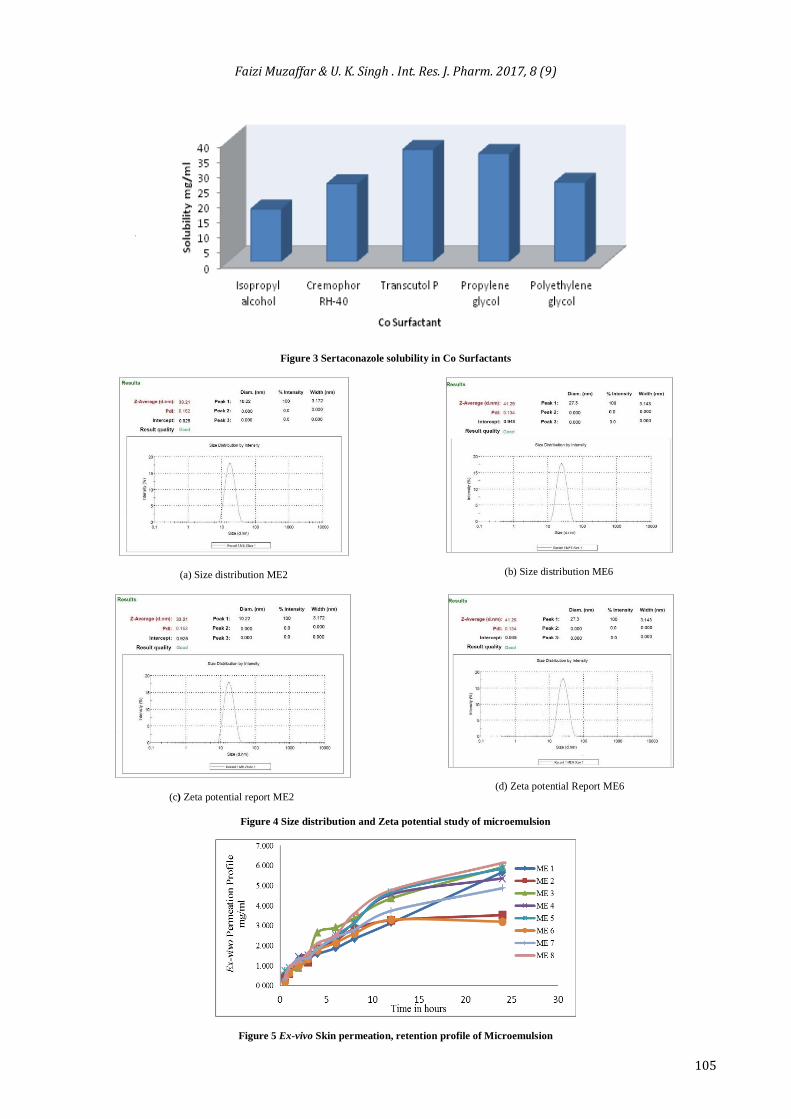
Figure 3 Sertaconazole solubility in Co Surfactants
(a) Size distribution ME2
(b) Size distribution ME6
(c) Zeta potential report ME2
(d) Zeta potential Report ME6
Figure 4 Size distribution and Zeta potential study of microemulsion
Figure 5 Ex-vivo Skin permeation, retention profile of Microemulsion
Faizi Muzaffar & U. K. Singh . Int. Res. J. Pharm. 2017, 8 (9)
106
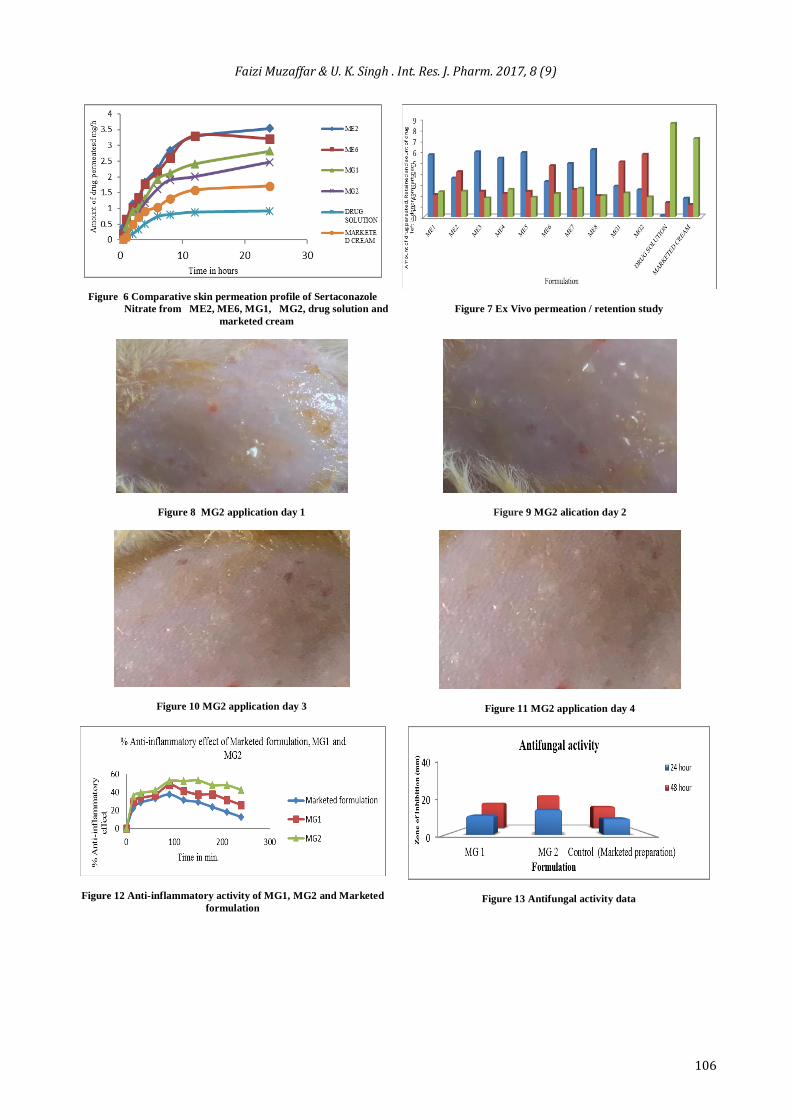
Figure 6 Comparative skin permeation profile of Sertaconazole
Nitrate from ME2, ME6, MG1, MG2, drug solution and
marketed cream
Figure 7 Ex Vivo permeation / retention study
Figure 8 MG2 application day 1
Figure 9 MG2 alication day 2
Figure 10 MG2 application day 3
Figure 11 MG2 application day 4
Figure 12 Anti-inflammatory activity of MG1, MG2 and Marketed
formulation
Figure 13 Antifungal activity data
Faizi Muzaffar & U. K. Singh . Int. Res. J. Pharm. 2017, 8 (9)
107
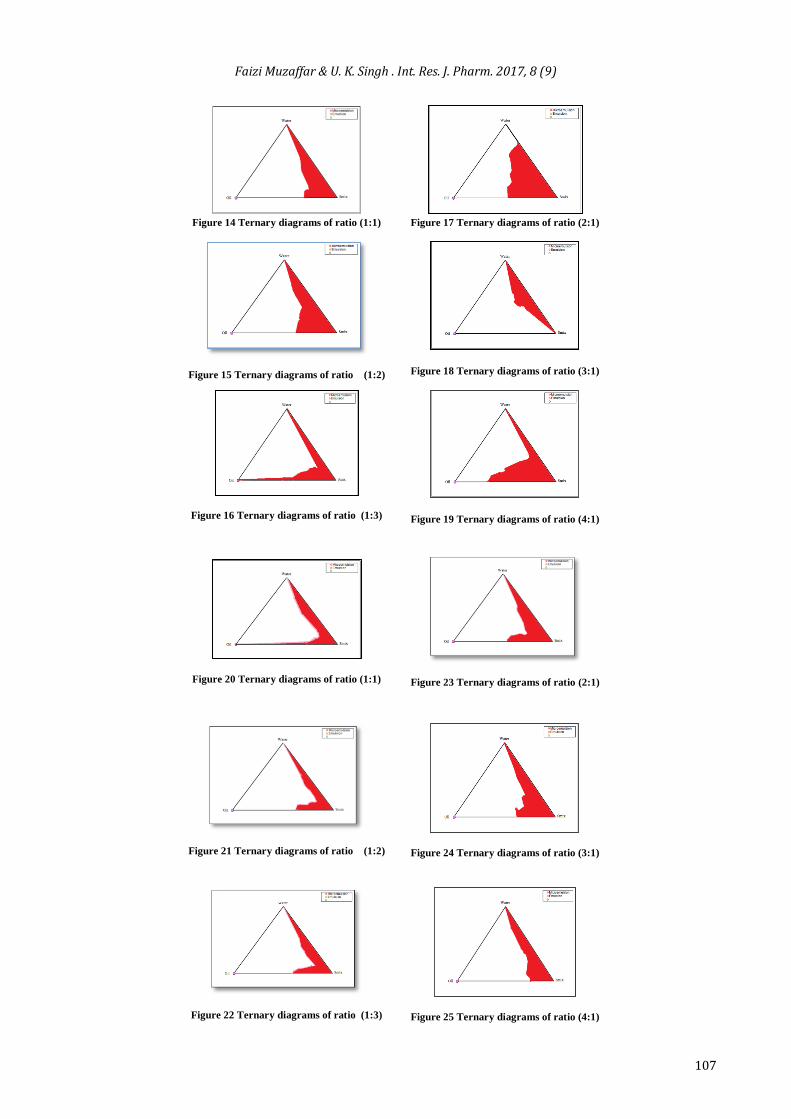
Figure 14 Ternary diagrams of ratio (1:1) Figure 17 Ternary diagrams of ratio (2:1)
Figure 15 Ternary diagrams of ratio (1:2)
Figure 18 Ternary diagrams of ratio (3:1)
Figure 16 Ternary diagrams of ratio (1:3)
Figure 19 Ternary diagrams of ratio (4:1)
Figure 20 Ternary diagrams of ratio (1:1)
Figure 23 Ternary diagrams of ratio (2:1)
Figure 21 Ternary diagrams of ratio (1:2)
Figure 24 Ternary diagrams of ratio (3:1)
Figure 22 Ternary diagrams of ratio (1:3)
Figure 25 Ternary diagrams of ratio (4:1)

Faizi Muzaffar & U. K. Singh . Int. Res. J. Pharm. 2017, 8 (9)
108
RESULT AND DISCUSSION
The physicochemical properties of sertaconazole suggest that it has good potential for topical as well as targeted drug delivery.
The important criterion for selection of materials for the microemulsion formulation development is that the components are pharmaceutically acceptable, nonirritant and sensitizing to the skin and fall under the GRAS (Generally Regarded as Safe) category. Non-ionic surfactants are less toxic than ionic surfactants. The higher solubility of the drug in the oil phase is important for microemulsion to maintain the drug in solubilized form. The right blend of low and high hydrophilic lipophilic
balance (HLB) surfactants leads to the formation of a stable microemulsion formulation. In this research, we selected Tween 80 as a surfactant having the HLB value 15. Transient negative interfacial tension and the fluid interfacial film are rarely achieved by the use of a single surfactant, usually necessitating the addition of a co-surfactant. The presence of co-surfactant decreases the bending stress of the interface and allows the interfacial film sufficient flexibility to take up different
curvatures required to form a microemulsion over a wide range of compositions. Thus, two co-surfactants were selected for the study Propylene glycol HLB 2.5 and Transcutol-P with the HLB value of 4.2. Therefore, the aim of the present study was to develop and evaluate thermodynamically stable o/w microemulsion of sertaconazole for topical drug delivery. This microemulsion were prepared by using a combination of Eugenol + oleic acid as oil phase, Tween 80 as a surfactant, Propylene glycol and Transcutol P as co surfactant.
The most important criterion for the screening of components is the solubility of a poorly soluble drug in oil, surfactants, and cosurfactant. Since the aim of this study is to develop a topical formulation, it is important to determine drug solubility in oils, surfactants, and cosurfactant. The solubility of sertaconazole was found to be highest in Eugenol + oleic acid (1:1) 41.13 ± 0.44, maximum solubility in cosurfactant was found in Tween
80 37.33 ± 0.012, two co surfactant were used Propylene glycol solubility 35.66 ± 1.969 and Transcutol P solubility 37.02 ± 1.358. Pseudo-ternary phase diagram
Care was taken to ensure that observations were not made on metastable systems; although the free energy required to form an
emulsion is very low, the formation is thermodynamically stable. The relationship between the phase behavior of a mixture and its composition can be captured with the aid of a phase diagram. Pseudo-ternary phase diagrams were constructed separately for each Smix ratio (Figure. 1), so that o/w microemulsion regions could be identified and microemulsion formulations could be optimized. As two co surfactant were used for the formulation of o/w
microemulsion such as Tween 80: propylene glycol and Tween 80 Transcutol P.
oIl, smIx (Tween 80: Propylene glycol) & Water
In Figure. 14, Smix with a ratio 1:1 showed small microemulsion area. O/w microemulsion region was found towards the Smix rich apex, there was the formation of large emulsion region. In Figure. 15 Smix ratio 1:2 there was the
formation of large microemulsion region and less emulsion region. When cosurfactant was added along with surfactant, the interfacial film became more fluid and no liquid crystalline area was found in the phase diagram. A large o/w microemulsion area was observed. In Figure 16 Smix ratio 1:3, microemulsion region was observed along both oil and water apex. Less
microemulsion region was observed and more emulsion region was formed and microemulsion was less stable. Smix ratio 2:1 Figure 17 has large microemulsion area this may be due to further reduction of the interfacial tension, increasing the
fluidity of the interface, thereby increasing the entropy of the system. There may be greater penetration of the oil phase in the hydrophobic region of the surfactant monomers. As we further increased surfactant concentration in Smix to 3:1 Figure. 18, the microemulsion region decreased as compared to 2:1 and it was confined in between Smix and oil region resulting in the formation of large emulsion area and less stable formulation. When the Smix ratio of 4:1 was studied Figure. 19, the area of
microemulsion increased but result in the formation of the less stable microemulsion. Oil, Smix (Tween 80: Transcutol P) & Water
In Figure. 20, Smix ratio 1:1 showed narrow o/w microemulsion area and a large emulsion region was found. further in Figure 21 and 22 Smix ratio 1:2 and 1:3 same microemulsion region
was obtained, the microemulsion obtained was more stable as compared to 1:1 ratio. Figure 23 Smix ratios 2:1 has microemulsion area more when compared with 1:1, 1:2 and 1:3, the microemulsion obtained was stable in nature, this may be due to further reduction of the interfacial tension, increasing the fluidity of the interface, thereby increasing the entropy of the system. in Smix to 3:1 Figure. 24, the microemulsion region was more at Smix apex this was due to the addition of a large amount of Surfactant. This also results in the formation of gel
type macroemulsion which was not stable for a long duration. Further reduction in microemulsion region was observed in Figure 25 Smix ratio 4:1 It is well known that large amounts of surfactants cause skin irritation, it is therefore important to determine the surfactant concentration properly and use the optimum concentration of surfactant in the formulation. From Pseudoternary phase
diagrams, the formulations in which the amount of oil phase completely solubilized the drug and which could accommodate the optimum quantity of Smix and distilled water were selected for the study. The ratios of the optimized formulation were chosen from all the batches.
Characterization of the microemulsion
Droplet size of microemulsion
The Droplet size of microemulsion range from 9.236 to 41.29 large droplets of microemulsion will result in decreased flux in skin and help in retention of the formulation will lead to better therapeutic effect. The size of optimized microemulsion ME2 and ME6 was found to be 33.21 and 41.92 nm respectively.
Viscosity
Viscosity is an important parameter for topical drug delivery. A formulation having less viscosity will not retain over the skin for a prolonged time. The viscosity of microemulsion was found to 93.2 ± 0.2 to 327.0 ± 0.7. The viscosity of optimized microemulsion was found to be 93.2 ± 0.2 and 119 as given in Table 21.
Zeta Potential
Highly positive or highly negative charge on oil globules indicate higher stability because of the anticipated surface repulsion between similarly charged globules hence inhibiting aggregation of the colloidal oil globules. the optimized
Faizi Muzaffar & U. K. Singh . Int. Res. J. Pharm. 2017, 8 (9)
109
formulation ME2 and ME6 are considered to be stable as the zeta potential was - 33.27 and – 23.9. Figure 4a – 4d
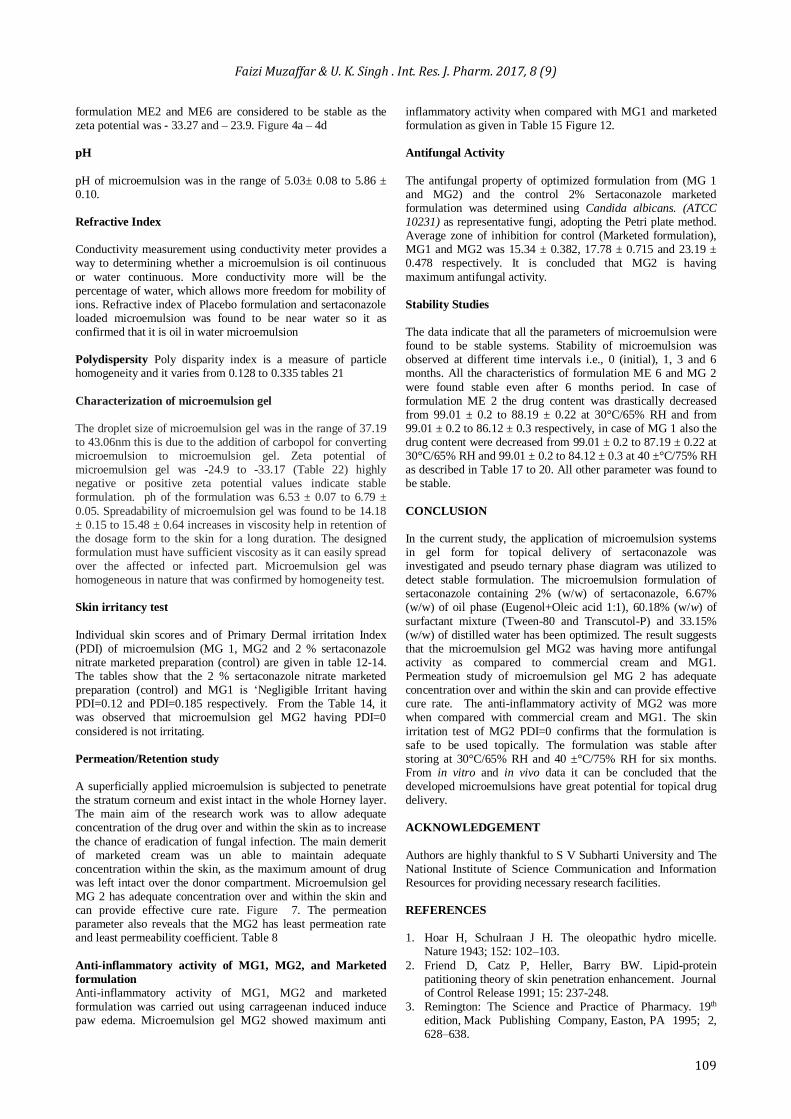
pH
pH of microemulsion was in the range of 5.03± 0.08 to 5.86 ± 0.10.
Refractive Index
Conductivity measurement using conductivity meter provides a way to determining whether a microemulsion is oil continuous
or water continuous. More conductivity more will be the percentage of water, which allows more freedom for mobility of ions. Refractive index of Placebo formulation and sertaconazole loaded microemulsion was found to be near water so it as confirmed that it is oil in water microemulsion
Polydispersity Poly disparity index is a measure of particle homogeneity and it varies from 0.128 to 0.335 tables 21
Characterization of microemulsion gel
The droplet size of microemulsion gel was in the range of 37.19 to 43.06nm this is due to the addition of carbopol for converting microemulsion to microemulsion gel. Zeta potential of microemulsion gel was -24.9 to -33.17 (Table 22) highly negative or positive zeta potential values indicate stable formulation. ph of the formulation was 6.53 ± 0.07 to 6.79 ±
0.05. Spreadability of microemulsion gel was found to be 14.18 ± 0.15 to 15.48 ± 0.64 increases in viscosity help in retention of the dosage form to the skin for a long duration. The designed formulation must have sufficient viscosity as it can easily spread over the affected or infected part. Microemulsion gel was homogeneous in nature that was confirmed by homogeneity test.
Skin irritancy test
Individual skin scores and of Primary Dermal irritation Index (PDI) of microemulsion (MG 1, MG2 and 2 % sertaconazole nitrate marketed preparation (control) are given in table 12-14. The tables show that the 2 % sertaconazole nitrate marketed preparation (control) and MG1 is ‘Negligible Irritant having PDI=0.12 and PDI=0.185 respectively. From the Table 14, it was observed that microemulsion gel MG2 having PDI=0
considered is not irritating.
Permeation/Retention study
A superficially applied microemulsion is subjected to penetrate the stratum corneum and exist intact in the whole Horney layer. The main aim of the research work was to allow adequate concentration of the drug over and within the skin as to increase
the chance of eradication of fungal infection. The main demerit of marketed cream was un able to maintain adequate concentration within the skin, as the maximum amount of drug was left intact over the donor compartment. Microemulsion gel MG 2 has adequate concentration over and within the skin and can provide effective cure rate. Figure 7. The permeation parameter also reveals that the MG2 has least permeation rate and least permeability coefficient. Table 8
Anti-inflammatory activity of MG1, MG2, and Marketed
formulation Anti-inflammatory activity of MG1, MG2 and marketed formulation was carried out using carrageenan induced induce paw edema. Microemulsion gel MG2 showed maximum anti
inflammatory activity when compared with MG1 and marketed formulation as given in Table 15 Figure 12. Antifungal Activity
The antifungal property of optimized formulation from (MG 1 and MG2) and the control 2% Sertaconazole marketed formulation was determined using Candida albicans. (ATCC 10231) as representative fungi, adopting the Petri plate method. Average zone of inhibition for control (Marketed formulation), MG1 and MG2 was 15.34 ± 0.382, 17.78 ± 0.715 and 23.19 ± 0.478 respectively. It is concluded that MG2 is having
maximum antifungal activity. Stability Studies
The data indicate that all the parameters of microemulsion were found to be stable systems. Stability of microemulsion was observed at different time intervals i.e., 0 (initial), 1, 3 and 6 months. All the characteristics of formulation ME 6 and MG 2
were found stable even after 6 months period. In case of formulation ME 2 the drug content was drastically decreased from 99.01 ± 0.2 to 88.19 ± 0.22 at 30°C/65% RH and from
99.01 ± 0.2 to 86.12 ± 0.3 respectively, in case of MG 1 also the drug content were decreased from 99.01 ± 0.2 to 87.19 ± 0.22 at 30°C/65% RH and 99.01 ± 0.2 to 84.12 ± 0.3 at 40 ±°C/75% RH as described in Table 17 to 20. All other parameter was found to be stable.
CONCLUSION
In the current study, the application of microemulsion systems in gel form for topical delivery of sertaconazole was investigated and pseudo ternary phase diagram was utilized to detect stable formulation. The microemulsion formulation of sertaconazole containing 2% (w/w) of sertaconazole, 6.67% (w/w) of oil phase (Eugenol+Oleic acid 1:1), 60.18% (w/w) of
surfactant mixture (Tween-80 and Transcutol-P) and 33.15% (w/w) of distilled water has been optimized. The result suggests that the microemulsion gel MG2 was having more antifungal activity as compared to commercial cream and MG1. Permeation study of microemulsion gel MG 2 has adequate concentration over and within the skin and can provide effective cure rate. The anti-inflammatory activity of MG2 was more when compared with commercial cream and MG1. The skin
irritation test of MG2 PDI=0 confirms that the formulation is safe to be used topically. The formulation was stable after storing at 30°C/65% RH and 40 ±°C/75% RH for six months. From in vitro and in vivo data it can be concluded that the developed microemulsions have great potential for topical drug delivery.
ACKNOWLEDGEMENT
Authors are highly thankful to S V Subharti University and The National Institute of Science Communication and Information Resources for providing necessary research facilities.
REFERENCES
1. Hoar H, Schulraan J H. The oleopathic hydro micelle. Nature 1943; 152: 102–103.
2. Friend D, Catz P, Heller, Barry BW. Lipid-protein patitioning theory of skin penetration enhancement. Journal of Control Release 1991; 15: 237-248.
3. Remington: The Science and Practice of Pharmacy. 19th edition, Mack Publishing Company, Easton, PA 1995; 2, 628–638.
Faizi Muzaffar & U. K. Singh . Int. Res. J. Pharm. 2017, 8 (9)
110
4. Yalkowsky S H, Roseman, T J. Teclinique of Solubilizing of drugs by co solvent. Drugs and Pharmaceutical Science, Marcel Dekker Inc 1981, 12, 91-134.
5. Aulton M E. Pharmaceutics: The science of dosage form
design, second edition, Churchill Livingstone,2002:120. 6. Azeem A, Rizwan M, Ahmad F J, Iqbal Z, Khar R Ket al.,
Nanoemulsion Components Screening and Selection. A Technical Note, American Association of Pharmaceutical Scientists 2009; 10:1: 69-76
7. Shakeel F, Baboota S, Ahuja A, Ali J, Aqil M et al., Nanoemulsions as vehicles for transdermal delivery of aceclofenac. American Association of Pharmaceutical
Scientists 2007; 8: E1-E9. 8. Faizi M, Singh U K. RP-HPLC and UV Spectrophotometric
methods for estimation of Sertaconazole nitrate in the microemulsion. Journal of Chemical and Pharmaceutical Research 2016; 8:740-745.
9. Baboota S, Shakeel F, Ahuja A, Ali J, Design development and evaluation of novel nanoemulsion formulations for the transdermal potential of celecoxib. Acta Pharmaceutica
2007; 57: 315-332. 10. Paolino D, Ventura C A, Nishi A, Puglisi Y, Fresta Y.
Lecithin microemulsion for topical administration of ketoprofen, percutaneous adsorption through human skin and in vivo human skin tolerability, International journal of pharmaceutics 2002; 244: 21-31.
11. Attwood D, Kreuter J. Colloidal Drug Delivery System.
New York, Marcel Dekker 1994; 31‑71. 12. Shah D O. Micelles, Microemulsion and Monolayers.
Science and technology Marcel Dekker 1998;1-610.
13. Ashish Y, Pawar, Vilas M, Aurangabadkar, Sunil K, Mahajan et al., formulation development and evaluation of topical microemulsion gels for nimesulide. Journal of Pharmacy Research 2011; 4: 1004-1006.
14. Bajpai M, Sharma P K, Mittal A. A study of the oleic acid oily base for the tropical delivery of dexamethasone microemulsion formulation. Asian Journal of Pharmaceutics 2009: 3: 208-214.
15. Shinoda K, Lindman B. Organised surfactant systems. Microemulsions, Langmuir 1987; 3:135–149.
16. Talegaonkar S, Azeem A, Ahmad FJ, Khar RK et al., Microemulsions: A Novel Approach to Enhanced Drug Delivery, Recent Patents on Drug Delivery & Formulation 2008;2: 238-257.
17. Jadhav KR, Jadhav S, Kadam S L, Design V J et al., Evaluation of Microemulsion Based Drug Delivery System;
International Journal of Advances in Pharmaceutical Sciences 2010;1: 156-166.
18. Lieberman HA, Rieger MM, Banker GS. Pharmaceutical Dosage Forms, Disperse systems, New York, Marcel Dekker 2006; 3: 339-344.
19. Lachman L, Lieberman H A, Kanig J L, The Theory and Practice of Industrial Pharmacy, 3rd ed. Lea and Fibiger 1986; 510-511.
20. Claudia S, Adriana M, Carlucci C, Study of In Vitro Drug
Release and Percutaneous absorption of fluconazole from topical dosage forms, American Association of Pharmaceutical Scientists, 2010; 11:2: 986–993.
21. Mrunali R, Rashmin B, Jolly R, Kashyap B, Ajay S, Investigating the effect of vehicle on in vitro skin permeation of ketoconazole applied in oil in water microemulsions, Acta Pharmaceutica Sciencia 2010; 52: 65-77.
22. Kaur P, Kakkar S, topical delivery of antifungal agents, expert opinion drug deli 2010; 7: 1303-1327.
23. Spiclin P, Homar M, Zupancic-Valant A, Gasperlin M. Sodium ascorbyl phosphate in topical microemulsions, International Journal of Pharmaceutics 2003; 256: 65–73.
24. Rhee YS, Choi JG, Park ES, Chi SC. Transdermal delivery of ketoprofen using microemulsions. International Journal of Pharmaceutics 2001; 228: 161-170.
25. Kawakami K, Yoshikawa T, Hayashi T, Nishihara Y, Masuda K. Microemulsion formulation for enhanced absorption of poorly soluble drugs. Journal of Control Release 2002: 81: 75- 82.
26. Moulik S P, Paul B K, Structure, dynamics and transport properties of micro emulsions, Advances in Colloid and Interface Science 1998; 78: 99-195.
27. Lucero M J, Vigo J, Leon M J. A study of shear and
compression deformations on hydrophilic gels of International Journal of Pharmaceutics 1994; 106: 125–133.
28. Mehta S K, Kavaljit X X, Bala K. Phase behavior, structural effects, volumetric and transport properties in non-aqueous microemulsions. Physical reviews 1999; 59: 4317-4325.
29. Podlogar F, Gasperlin M, Tomsic M, Jamnik A, Rogac M. Structural characterisation of water-Tween 40n microemulsions using different experimental methods.
International Journal of Pharmaceutics 2004; 276:115-128. 30. Vijayalakshmi G, Amitava M, Chandrasekaran N. Mustard
oil microemulsion formulation and evaluation of the bactericidal activity. International Journal of Pharmacy and Pharmaceutical Sciences 2012; 4: 497-500.
31. Salerno C, Bregni. Study of In Vitro Drug Release and percutaneous absorption of fluconazole from topical dosage forms. American Association of Pharmaceutical Scientists 2010; 11: 2: 986-993.
32. Zhu W, Guo C, Yu A, Gao Y, Cao F et al., Microemulsion based hydrogel formulation of penciclovir for topical delivery, International Journal of Pharmaceutics 2009; 378: 152–158.
33. Chen L, Tan F, Wang J, Liu F. Microemulsion: A novel transdermal delivery system to facilitate skin penetration of indomethacin. Die Pharmazie 2012; 67:319: 18-23.
34. Gasco MR. Microemulsions in the pharmaceutical field in
perspectives and applications, Industrial applications of microemulsions. New York, Marcel Dekker Inc 1997; 97-122.
35. Das B, Nayak A K, Nanda U. Topical gels of lidocaine hydrochloride using cashew gum and Carbopol 940: Preparation and in vitro skin permeation, International Journal of Biological Macromolecules 2013; 62: 514-517.
36. Pereira E, Scolari P, Gasco M. Transdermal permeation of
apomorphine through hairless mouse skin from microemulsions. International Journal of Pharmaceutics 2001; 226: 47-51.
37. Shishu, Rajan S, Kamalpreet. Development of novel microemulsion based topical formulations of acyclovir for the treatment of cutaneous herpetic infections. American Association of Pharmaceutical Scientists, 2009; 10: 559-65.
38. Laithy HM, El-Shaboury K MF. The development of cutting
lip gels and microemulsion gel for topical administration of fluconazole. American Association of Pharmaceutical Scientists 2002; 3: 35.
39. Chakole CM, Shinde MA, Khadatkar SN. Formulation and development of novel combined clobetasol propionate and fusidic acid ointment. International Journal of chem tech, Research 2009; 1: 103-116
40. OECD. Acute dermal irritation,corrosion. In OECD Guidelines for Testing of Chemicals. Guideline 1992; 404:
6. 41. Purewal L, Gupta BN, Pande MS. Development and
Evaluation of Herbal Formulations for Hair Growth. Journal of Chemistry 2008; 5: 34-38.
42. Winter CA, Risley EA, Nuss GW. Carrageenan induced edema in hind paw of the rat as an assay for anti-

Faizi Muzaffar & U. K. Singh . Int. Res. J. Pharm. 2017, 8 (9)
111
inflammatory drugs. Proceedings of the Society for Experimental Biology and Medicine 1962; 111: 544–547
43. Shekarachi M, Pirali-Hamedhani M, Navidpour L, Adib N and Shafiee. A Synthesis, antibacterial and antifungal
activities of 3aryl-5-(pyridine-3-yl)4,5-dihydropyrrole-1-carbothioamide derivatives. Journal of the Iranian Chemical Society 2008; 5:1:150-158.
44. Kini S, Gandhi AM. Novel 2-pyrazoline derivatives as potential antibacterial and antifungal agents. Indian journal of pharmaceutical science 2008; 70: 1:102-105.
45. Prashanth KV, Chauhan NS, Padh H, Rajani M. Search for antibacterial antifungal agents from selected Indian
medicinal plants. Journal of Ethnopharmacology 2006; 107:182–188.
46. Perez C, Paul M, Bezique P. An Antibiotic assay by the agar well diffusion method. Alta biomed. Group experiences 1990; 15: 113.
47. Kataria, S, Rees GD, M J Lawrence. Gelatin-stabilised microemulsion-based organogens rheology and application in iontophoretic transdermal drug delivery. Journal of controlled release 1999; 60: 2: 355-365.
48. Block LH, Lieberman HA, Banker G S. Pharmaceutical emulsions, and microemulsions Pharmaceutical Dosage Forms 2001; 1: 47-110
49. Date AA, Nagarsenker M. Design and evaluation of self-nano emulsifying drug delivery systems for cefpodoxime paroxetine. International journal of pharmaceutics 2007: 329: 2: 166-172.
Cite this article as:
Faizi Muzaffar and U. K. Singh. Design development and evaluation of topical microemulsion. Int. Res. J. Pharm. 2017;8(9):95-111 http://dx.doi.org/10.7897/2230-8407.089164
Source of support: Nil, Conflict of interest: None Declared
Disclaimer: IRJP is solely owned by Moksha Publishing House - A non-profit publishing house, dedicated to publish quality research, while every effort has been taken to verify the accuracy of the content published in our Journal. IRJP cannot accept any responsibility or liability for the site content and articles published. The views expressed in articles by our contributing authors are not necessarily thos e of IRJP editor or editorial board members.

![SYNTHESIS, SPECTROSCOPIC AND BIOLOGICAL ...produce the metal containing cross-linking agents with required properties [3]. Benzothiophene systems and their substituted derivatives](https://static.fdocuments.in/doc/165x107/5ed2a8f7b9f87260d87dbf2b/synthesis-spectroscopic-and-biological-produce-the-metal-containing-cross-linking.jpg)


![Title Transition-Metal-Free Synthesis of Carbazoles …...applications in organic EL.[24] Scheme 3. S N Ar-based synthesis of indoles Electron-deficient benzothiophene dioxide 8 showed](https://static.fdocuments.in/doc/165x107/5e80f9b9674685482916bfc2/title-transition-metal-free-synthesis-of-carbazoles-applications-in-organic.jpg)

![Halogen and Hydrogen Bonding Benzothiophene Diol ...The nature of the halogen bond and the forces involved have been investi-gated by several research groups.[4] The halogen bond interac-tion](https://static.fdocuments.in/doc/165x107/607b435b03e7652c244f17f4/halogen-and-hydrogen-bonding-benzothiophene-diol-the-nature-of-the-halogen-bond.jpg)


