DOI: 10.18697/ajfand.76.16855 CASSAVA CHIPS … cassava chips were grated and duplicate 2.5 g...
20
DOI: 10.18697/ajfand.76.16855 11457 DOI: 10.18697/ajfand.76.16855 CASSAVA CHIPS QUALITY AS INFLUENCED BY CULTIVAR, BLANCHING TIME AND SLICE THICKNESS Abok EO 1* , Ooko GA 1 , and MW Okoth 1 Abok Elisha *Corresponding author email: [email protected] 1 Department of Food Science, Nutrition and Technology, University of Nairobi, P.O Box 29053 – 00625, Kangemi, Nairobi, Kenya
Transcript of DOI: 10.18697/ajfand.76.16855 CASSAVA CHIPS … cassava chips were grated and duplicate 2.5 g...
DOI: 10.18697/ajfand.76.16855 11457
DOI: 10.18697/ajfand.76.16855
CASSAVA CHIPS QUALITY AS INFLUENCED BY CULTIVAR,
BLANCHING TIME AND SLICE THICKNESS
Abok EO1*, Ooko GA1, and MW Okoth1
Abok Elisha
*Corresponding author email: [email protected]
1Department of Food Science, Nutrition and Technology, University of Nairobi, P.O
Box 29053 – 00625, Kangemi, Nairobi, Kenya
DOI: 10.18697/ajfand.76.16855 11458
ABSTRACT
Cassava forms part of diets in Kenya with both the roots and leaves being consumed as
food. The short shelf-life of 72 hours and cyanogenic glucosides limit the extent of
utilization. Currently, fried cassava chips and crisps are increasingly being consumed as
snacks; and fried cassava chips are produced by street processors. The quality and safety
of these products is not known, therefore, the current study was to establish the influence
of cassava cultivar, blanching time and slice thickness on quality of fried cassava chips.
Moisture, vitamin C and cyanide content in the raw cassava cultivars were determined
before processing. The three raw cassava cultivars coded as MH95/0183, MM96/2480
and Fumba chai were washed, peeled and sliced into thickness of 6 mm, 10 mm and 20
mm. Equal groups of the slices were blanched at 950C for 0 minutes, 5 minutes and 10
minutes each and then subjected to frying temperature of 1700C. The physico-chemical
and sensory properties of fried cassava chips were determined. Dry matter content,
vitamin C content and cyanide levels significantly (p < 0.05) differed among the three
raw cultivars except in MH95/0183 and MM96/2480. A strong positive relationship (r =
0.98) existed between moisture and cyanide contents in the raw cultivars. Mean cyanide
levels in the three roots was: 37.04 mg/kg, 16.37 mg/kg and 48.48 mg/kg in MH95/0183,
MM96/2480 and Fumba chai, respectively. Dry matter content was 36.79 %, 37.69 %
and 30.42 % in MH95/0183, MM96/2480 and Fumba chai. The physico-chemical and
sensory properties significantly (p < 0.05) differed within and across the cultivars as
affected by processing conditions. Mean cyanide range was 1.4 - 11 mg/kg, oil content
ranged 3.78 - 18.48 % and vitamin C content ranged 7.59 - 50.48 mg/100 g. Significant
(p < 0.05) relationship (r = 0.707) existed between slice thickness and the redness color
parameter. Cultivar, slice thickness and blanching time form important yardsticks in
processing fried cassava chips. Proper choice of these parameters is, therefore, important
in processing quality and safe cassava fries. Slice thickness of 6 mm combined with long
blanching time of 10 minutes result in fried cassava chips with low and acceptable
cyanide content as well as satisfactory consumer preference based on color, texture,
oiliness and overall acceptability.
Key words: cyanide, quality, cassava, slice thickness, cultivar, blanching, consumer
preference
DOI: 10.18697/ajfand.76.16855 11459
INTRODUCTION
Cassava (Manihot esculenta) is an herbaceous perennial food crop of the low land tropics
[1, 2, 3, 4] and is a major component of diets in Kenya. The two major varieties grown
are sweet and bitter varieties [5, 6] which are classified on the basis of the cyanogenic
glucosides (Linamarin and Lotaustralin) contents of their roots and leaves [7, 8].
In traditional Kenyan society, both the roots and the leaves are used as food, the roots are
consumed as fresh boiled or roasted and in some cases dried and used in flour mixes for
porridge and ugali (stiff porridge), while the leaves are used as vegetable [9]. Currently,
cassava crisps and fried chips are popularly consumed as snack in the coastal region of
Kenya [10].
Slight variation in the nutritional quality of the root is notable [11]; the root hydrocyanide
content ranges from 1-1550 ppm [12] with sweet varieties having hydrocyanide values
less than 50 ppm while bitter varieties have values as high as 100 ppm [6]. Cassava roots
contain 62.5 % water, 34.7 % starch [13], 1.2 % protein [14], 0.3 % fat, and 36 mg/100
g of vitamin C while the leaves contain 80.5 % water, 9.6 % starch, 6.8 % protein, 1.3 %
fat and 265 mg/100 g vitamin C [15]. Significant amounts of iron, phosphorous and
calcium are also contained in the root [16]. Blanching reduces the cyanide levels by about
54 % [12]. It also washes off surface bound sugars and serves to even out variations of
sugar concentrations at the surface of chips: this is vital in development of lighter and
more uniform color on frying [17] thereby enhancing the overall acceptability of the fried
chips. Blanched chips are less hardy and need remarkably less force (5.89 N) to break
[17]. During frying, the hot cooking oil replaces the free moisture in the chips as they
cook, and is dependent on chip thickness, frying temperature and cultivar. Moisture
content in fried potato chips ranges from 25.3 % to 55.1 % and the percent fat is in the
range of 11.1 % to 22.3 % [18].
Utilization of cassava is compromised by its toxic hydrogen cyanide and short shelf-life
of 72 hours post-harvest [19, 20]. Increased promotion of cassava value addition has
resulted in street chips producers in Mombasa and Nairobi counties; however, the product
quality and safety are unknown. To advise the processing industry accordingly, it is
essential to evaluate the suitability of various cassava cultivars for processing. The
objective of this study was to determine quality of fried cassava chips obtained from
selected Kenyan cultivars MH95/0183, MM96/2480 and Fumba chai as influenced by
processing conditions of blanching time and slice thickness.
MATERIALS AND METHODS
Raw materials Fresh cassava root cultivars coded as MH95/0183, MM96/2480 and Fumba chai were
collected from Kenya Agricultural and Livestock Research Organization (KALRO)
Kakamega, and transported to University of Nairobi, Department of Food Science,
Nutrition and Technology for analysis. Color and texture of the fried chips was
determined at Jomo Kenyatta University of Agriculture and Technology (JKUAT),
Department of Food Science and Technology.

DOI: 10.18697/ajfand.76.16855 11460
Experimental design A pre-test – post-test control experimental design consisting of 3 slice thicknesses of 6
mm by 6 mm, 10 mm by 10 mm, and 20 mm by 20 mm commonly used by street
processors in Nairobi and Mombasa counties; 2 blanching times at 95oC (5 mins and 10
mins) based on the capacity of the blancher at disposal at the time of the experiment and
3 purposively selected cassava cultivars MH95/0183, MM96/2480 and Fumba chai were
used.
Pre-processing operations The collected cassava cultivars were washed thoroughly with clean water, peeled and
then manually sliced to thicknesses of 6 mm by 6 mm, 10 mm by 10 mm and 20 mm by
20 mm in readiness for blanching and then fried.
Determination of moisture content Moisture content in the raw cassava root cultivars and fried cassava chips was determined
as per AOAC [21], Official method 935.29 by drying 5 g of the sample in air oven at
105oC for 5 hrs.
Determination of cyanide content Cyanide (HCN) content in the fresh and fried samples of cassava chips was determined
by alkaline titration method as described by AOAC [21], official method 915.03B.
Determination of vitamin C content Approximately 2 g of each sample was extracted and stabilised with 25 mls of TCA
(trichloro-acetic acid) then titrated using 0.001 N N-Bromosuciinamide and starch as
indicator [23]. Titre volume of N-Bromosuciinamide was then used in calculation to
determine vitamin C using the formula
V*C*(176/178)*100/weight of the sample = mg/100 g of Vitamin C, where V is titre
volume, and C is Bromosuciinamide concentration.
Determination of oil content
Fried cassava chips were grated and duplicate 2.5 g samples were put into thimbles, 8-hr
Soxhlet extraction was conducted using analytical grade petroleum ether (boiling point
40-60oC ), described by AOAC [22] official method 945.16.
Color measurement Fries color was measured using a color spectrophotometer (NF 333, Nippon Denshoku,
Japan) using the CIE Lab L*, a* and b* color scale [23].
Texture measurement Texture measurement was performed by a puncture test using a Texture Analyzer (Sun
rheometer Compac 100, Sun scientific Co. Ltd, Japan) equipped with a wedge probe
imitating front teeth [23].
DOI: 10.18697/ajfand.76.16855 11461
Blanching
The pre-processed clean peeled drain dried slices were then grouped equally into 3
batches for steam blanching at 95°C for 0 minutes, 5 min and 10 min (for the 3 batches)
using the pilot plant blancher at the Department of Food Science, Nutrition and
Technology, University of Nairobi. The blanched slices were then dried to remove free
water before frying [17].
Frying
Before frying, the liquid Rina vegetable oil from Pwani Oil Industries (the oil at disposal
at the time of frying) was heated for about 10 mins until the required temperature of
170°C, was reached. Each blanched batch of slices was then deep fried until the bubbling
ceased as described by Elfnesh et al. [17].
Sensory evaluation The sensory evaluation test was conducted at the Department of Food Science, Nutrition
and Technology, University of Nairobi, sensory evaluation laboratory. Ten experienced
panelists consisting of students, and faculty staff of the University were selected to rate
the quality attributes. A seven - point hedonic scale was used to rate flavor (bitterness),
color, texture, oiliness and overall acceptability. Coded samples were presented to each
panelist separately in similar glass plates at 4.00 pm. Water was provided to the panelists
to rinse their mouth before and between testing samples [17].
Data analysis Analysis of variance (ANOVA) and least significant difference test for the variables was
conducted using GenStat 15th Edition software for statistical analysis (p < 0.05).
Correlation analysis was performed by IBM SPSS statistics 20 software to determine
linear relationship (p < 0.01 and p < 0.05) between: objective color measurements and
color likeness by sensory panelists, oil content measured and the oiliness perceived by
sensory panelists, texture as perceived by sensory panelists and the machine texture
determination and the association between moisture content and treatment of slice
thickness and blanching time.
RESULTS
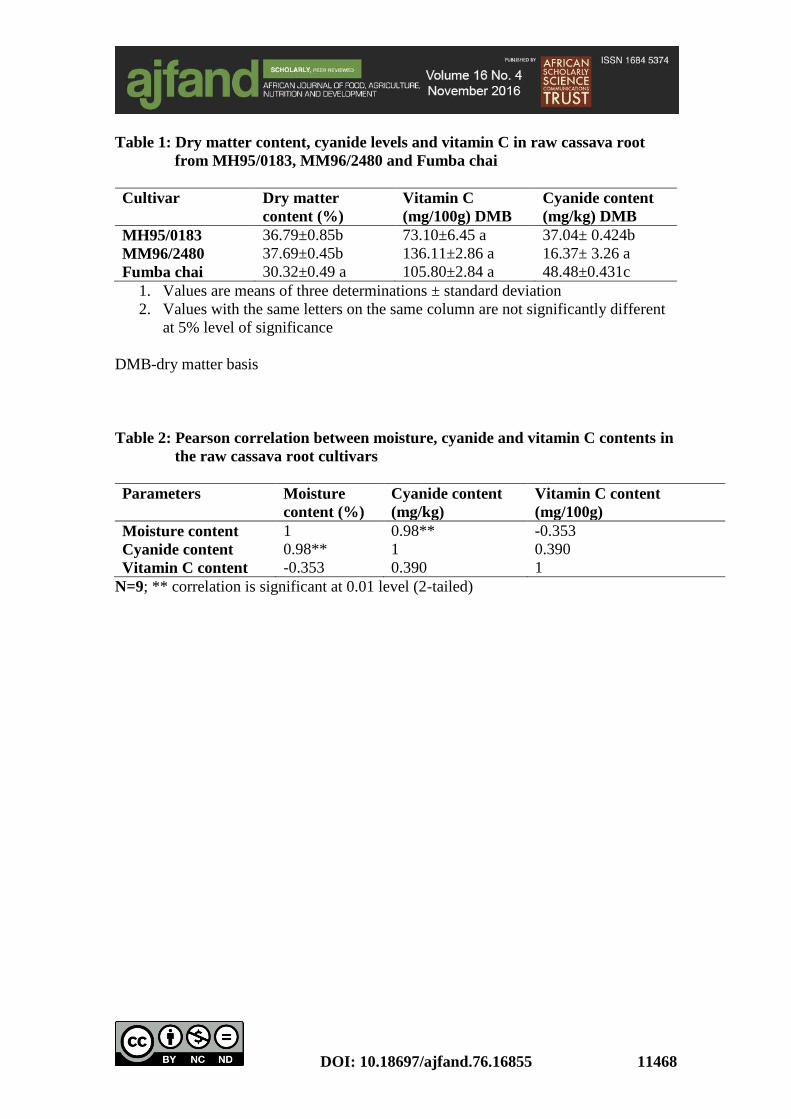
Cyanide, vitamin C and dry matter content of raw cassava roots Table 1 shows the mean values and standard deviations of dry matter content, cyanide
levels and vitamin C obtained from the three cassava root cultivars. Fumba chai had the
lowest dry matter content of 30.32 % and highest cyanide content of 48.48 mg/kg,
whereas MM96/2480 had the highest dry matter content of 37.69 % and lowest mean
cyanide content of 16.37 mg/kg. MH95/0183 had the lowest vitamin C content of 73.10
mg/100 g and MM96/2480 had the highest vitamin C content of 136.11 mg/100 g. Dry
matter content recorded insignificant difference (p < 0.05) between MH95/0183 and
MM96/2480, but, these values differed significantly (p < 0.05) from those of Fumba chai.
There was insignificant difference (p > 0.05) in vitamin C. Cyanide differed significantly
(p < 0.05) among the three raw cassava root cultivars.
DOI: 10.18697/ajfand.76.16855 11462
Raw roots Moisture content, Cyanide and vitamin C correlation
Table 2 indicates the Pearson correlation values between moisture, cyanide and vitamin
C contents in the raw cassava roots. There was a significant (p < 0.01) strong positive
relationship between moisture content and cyanide content (r = 0.98). A weak positive
relationship existed between cyanide and vitamin C contents (r = 0.390).
Moisture and cyanide contents of fried cassava chips
Table 3 indicates the influence of cultivar, blanching time and slice thickness on both
moisture and cyanide content. MH95/0183 blanched for 10 minutes and with a slice
thickness of 6 mm had the lowest moisture content of 10.09 % while Fumba chai,
unblanched (zero minutes) with slice thickness of 20 mm, had the highest moisture
content of 40.74 %. Both slice thickness and blanching time showed significant (p <
0.05) effect on moisture content.
Most of the chips’ moisture content differed significantly (p < 0.05) across the column
except Fumba chai blanched for 5 mins and slice thickness of 6 mm, and MM96/2480
blanched for 10 minutes and 6 mm slice thickness. Fumba chai of zero minutes blanching
and 6 mm thickness insignificantly (p > 0.05) differed from MM96/2480 of 5 minutes
blanching and 6 mm thickness.
Fumba chai blanched for 10 minutes with a slice thickness of 6 mm had the lowest
cyanide content of 1.41 mg/kg, while MH95/0183 at zero minutes blanching and 20 mm
slice thickness had the highest cyanide content of 11.51 mg/kg. Within cultivars, the
mean cyanide content differed significantly (p < 0.05) as affected by both blanching time
and slice thickness. Across the cultivars some insignificant variations were registered (p
< 0.05) and this can be attributed to the variations in initial moisture and cyanide content
in the raw cassava root cultivars.
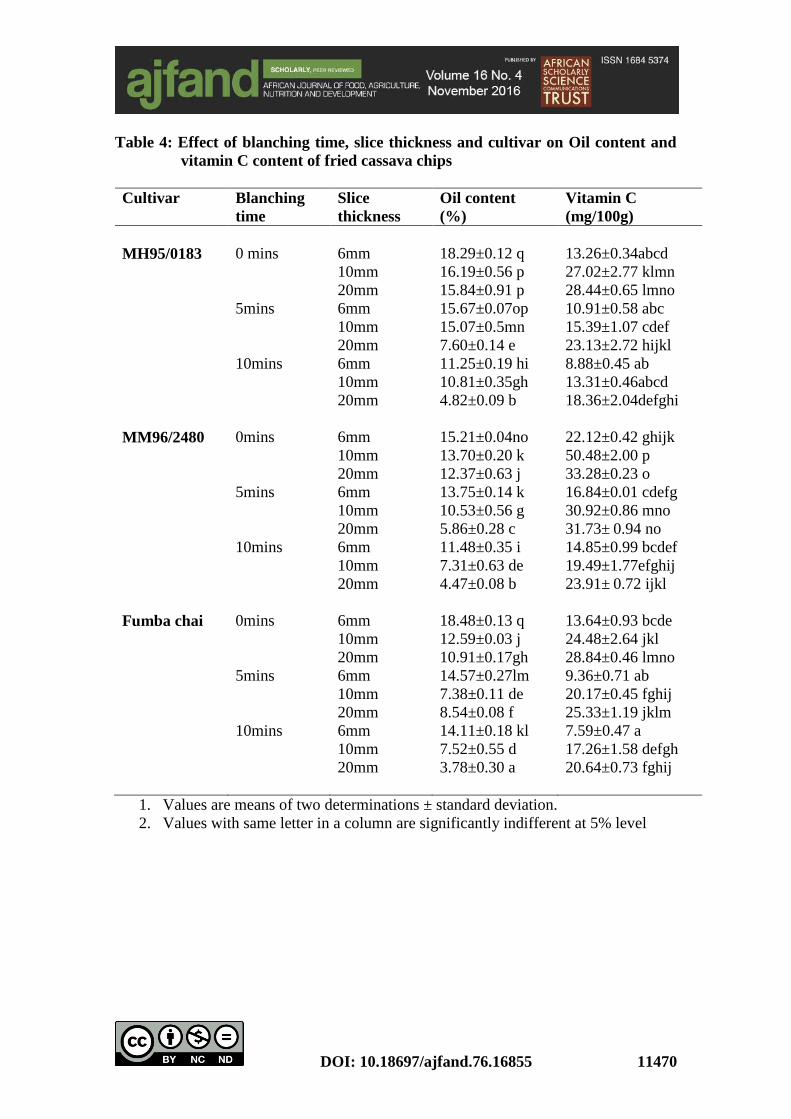
Vitamin C and oil contents of fried cassava chips Vitamin C and oil contents of the fried cassava chips as influenced by blanching time
and slice thickness from MH95/0183, MM96/2480 and Fumba chai are shown in table
4. Fumba chai with slice thickness of 20 mm and 10 minutes blanching had the lowest
mean oil content of 3.78 %, while unblanched 6mm thick Fumba chai had the highest
mean oil content of 18.48 %. Fumba chai blanched for 10 minutes and slice thickness of
6 mm had the lowest amount of vitamin C of 7.59 mg/100 g. MM96/2480 at 0 minutes
blanching and thickness of 10 mm had the highest amount of 50.48 mg/100 g vitamin C.
Significant differences (p < 0.05) were observed within the cultivar and across the
cultivars for both vitamin C and oil content. The influence of blanching time and slice
thickness on the physico-chemical properties in relation to each other is indicated in table
5.
Slice thickness had a significant (p < 0.01) strong positive relationship to moisture
content, cyanide content and vitamin C. On the other hand, it showed a significant (p <
0.01) strong negative association to the oil content (r = - 0.608). Moisture and cyanide
contents had a significant (p < 0.01) positive relationship (r = 0.606) and this was also
observable in the raw cassava root cultivars. Vitamin C showed a significant (p < 0.01)
positive relationship to moisture content (r = 0.764). Similarly, cyanide showed

DOI: 10.18697/ajfand.76.16855 11463
significant (p < 0.01) relationship to blanching time (r = -0.783) and slice thickness (r =
0.419). Oil content had a significant (p < 0.01) negative association to moisture content
(r = - 0.361).
Fried cassava chips texture and color Mean values and standard deviation of the fried cassava chips textural response and color
parameters measured is tabulated in table 6.
MM96/2480 blanched for 10 minutes and thickness of 20 mm showed less resistance to
penetrating force with a force of 1.365 N while MH95/0183 at zero minutes blanching
and 6 mm thickness showed the highest resistance with a force of 5.67 N. Significant
differences (p < 0.05) are noted in the hardness of chips with little insignificant variations
across cultivars.
Chips with thin slice thickness and long blanching time showed high L* (lightness color)
values which tended to white color as opposed to thicker slices. Fumba chai 20 mm and
blanching at zero minutes had the lowest L* value of 44.33, while MM96/2480 10 mm
thick and 10 minutes blanching had the highest value of 77.2. Similarly, the a* (redness
factor) values were affected, Fumba chai 6mm thick and 5 minutes blanching had the
lowest a* value of 0.46 while Fumba chai 20 mm thick and 0 minutes blanching had the
highest a*value of 10.9. b* (yellowness factor) mean values followed similar trends as
the L* and a* mean values. Significant (p < 0.05) differences occurred within and across
the cultivars for all the lightness, redness and yellowness color parameter indicators.
Organoleptic properties of the fried cassava chips The organoleptic properties of flavor, color, texture and overall acceptability that have a
close association with the physico-chemical properties are also affected as indicated by
results in Table 7.
The fried cassava chips differed significantly (p < 0.05) in terms of color, texture, oiliness
and overall acceptability. MM96/2480 6 mm thick and 10 minutes blanching (C2, 10, 6)
had the most preferred color, texture, oiliness and overall acceptability. Thick
unblanched chips received little preference, MM96/2480 20 mm thick and zero minutes
blanching (C2,0,20) had the least likeness in terms of oiliness and overall acceptability,
and MH95/0183 20 mm and zero minutes blanching (C1,0,20) had the least preference
to color.
A significant (p < 0.05) positive relationship (r = 0.449) existed between color perceived
by consumer and the L* color parameter. Similarly, a significant (p < 0.05) negative
association (r = - 0.449) occurred between a* color parameter and the consumer
perceived color. Consumer preference to the fried cassava chips decreased with the
increase in oil content (r = - 0.255). A very weak positive insignificant association (r =
0.047) was observed between the measured texture and consumer perceived texture
preference.

DOI: 10.18697/ajfand.76.16855 11464
DISCUSSION
Dry mater, cyanide and vitamin C content in the raw cassava root cultivars Mean dry matter content was in the range of 30 % to 38 %, vitamin C in the range of 73
mg/100 g to 136 mg/100 g and cyanide content in the range of 16 mg/kg to 49 mg/kg in
the three raw cassava roots. The observed cyanide contents in the raw cassava roots are
similar to findings by Nweke et al. [15] and below the 50 mg/kg recommended in sweet
varieties [6]. Significant amounts of vitamin C was detected in the three raw cassava
roots [16]. Despite being grown in the same place, the inherent genetic composition of
the cultivars expressed themselves as noted by significant (p < 0.05) variations in dry
matter content, cyanide content and vitamin C content except between MH95/0183 and
MM96/2480 that showed insignificant variations in their dry matter and cyanide
composition as indicated in table 1.
A strong positive relationship (r = 0.98) which was significant (p < 0.01) between
moisture content and cyanide content in raw cassava cultivars is attributed to solubility
of hydrocyanide acid in water [15], and also explains why Fumba chai had the highest
moisture content corresponding to high cyanide levels. Even though vitamin C is water
soluble, its levels is independent of moisture content and apparent to cultivar as explained
by MM96/2480 that had the lowest moisture content but recorded the highest levels of
vitamin C.
Cyanide and moisture content of fried cassava chips influenced by blanching and
slice thickness The mean moisture content of fried cassava chips from the three cultivars was in the
range of 10- 35 % which partially concur to the mean moisture content of potato chips
reported by Sherri et al. [18]. The moisture content of fried cassava chips with 6 mm
thickness and 10 minutes blanching time were below the range of 25.3 % to 55.1 %
reported by Sherri et al. [18] which was moisture content from potato chips with
blanching time and slice thickness treatments unreported.
Even though the chips from the three cultivars differed significantly (p < 0.05), slice
thickness greatly influenced this as indicated by a strong positive relationship (r = 0.737)
between moisture content and slice thickness. Cyanide that is bound within the water
phase of the tissues responded in a similar way with a significant (p < 0.01) strong
negative relationship (r = - 0.783) to blanching time.
Increased blanching time from zero minutes to 10 minutes increased the amount of heat
energy absorbed from the hot blanching water, the absorbed energy aided in disruption
of the intact tissue at longer blanching time [12, 24]. More exudation of water from
disrupted tissues occurs: the water then diffuses to the blanching media at a rate that is
dependent on the diffusion distance explained by the slice thickness. The heat and mass
transfer that occurs during deep fat processing that results in water vaporization also
contributes positively to the negative correlation observed [25]. Vaporization results in
collapse of tissue through loss of other chemical constituents in the vaporized water [17].
Chopping into slices and blanching also detoxified the chips of cyanide [12]. Most of the
DOI: 10.18697/ajfand.76.16855 11465
fried cassava chips had cyanide levels less than 10 mg/kg, which is the recommended
level for safe consumable products by food standards code.
Effect of blanching and slice thickness on Oil and vitamin C contents of fried
cassava chips Oil content in fried cassava chips was in the range of 4 – 20 % with 70 % of the mean
values within the range of 11.1 - 22.35 % fat content of potato chips reported by Sherri
et al. [18]. Slices that were 20 mm thick had the lowest oil uptake below 11 %. The
variation is explained by differences in genetic composition between cassava and potato.
Frying time, food surface area (slice thickness), moisture content of food explained by
significant relationship between oil content and moisture content (r = - 0.361) and frying
oil influenced the amount of absorbed oil in the chips [26]. Fried foods at optimum frying
temperature and time have optimal oil absorption [27] as observed in most of the fried
cassava chips.
Disruption and collapse of tissue resulting from increased heat energy from hot blanching
water with time, reduced the tissues resistance to oil ingression [17]. Larger slice
thicknesses (long penetration distance) offers more resistance to oil ingression into the
interior and consequently low oil content in fried chips of 20 mm thick.
Vitamin C is heat sensitive and thus showed a significant (p < 0.01) inverse relationship
(r = -0.478) to blanching time. Mass transfer resulting from both blanching and frying
temperature but dependent on slice thickness, contributes to loss of water soluble vitamin
C through vaporization in combination of other chemical constituents as the tissues
collapse [17, 25].
Texture and Color of fried cassava chips Resistance to oil ingression into the interior offered by the larger slice thickness of 20
mm resulted in overheating at the chips surface only and consequently less hardy texture
within the interior indicated by the significant (p < 0.05) negative correlation to the
texture by slice thickness (r = - 0.482). Similarly, blanching collapses the tissues prior to
frying shown by a significant (p < 0.01) inverse relationship (r = - 0.579) to fried chips
texture [17]. Most of the mean texture values are less than the ones reported by Elfnesh
et al. [17], since their chips only had a single slice thickness at a single blanching time.
Unblanched chips with large slice thickness of 20 mm had L* values that tended towards
the dark tan color observed in potato chips [17]. As the slice thickness increased, the
resistance to oil ingression into the interior of the chips during frying increased, frying
oil temperature in combination to the resistance by large slice thickness resulted in
overheating on the chips surface and consequently darkening of the chips at the surface.
There was a significant (p < 0.05) positive correlation of slice thickness to the redness
value a* (r = 0.707). Blanching washed off surface sugars and served to even out
variations of sugar concentrations at the surface of cassava chips. Consequently, an
observed development of lighter and more uniform color on frying indicated by a
significant (p < 0.01) positive correlation between blanching time (r = 0.671) and the

DOI: 10.18697/ajfand.76.16855 11466
mean L* values indicator for lightness color parameter. Blanching also reduces the
formation probability of carcinogenic acrylamide in potato chips during frying [28].
Sensory properties of fried cassava chips Sensory properties of color, texture, oiliness and overall acceptability significantly (p <
0.05) differed across the cultivars. Consumer fried cassava chips preference significantly
(r = 0.463) increased as the lightness color parameter tended towards white color. Dark
tan color originating from large slice thickness and non-blanching pre-treatments [28]
with high a* values, significantly (p < 0.05) impacted negatively (r = - 0.449) on
consumer color preference.
Oil content and consumer perception of the fried cassava chips oiliness are negatively
correlated (r = - 0.225). Tissue collapse dependent on blanching time and slice thickness
subsequently impacted on moisture content and the surface area that are key factors
influencing hot oil ingress during frying [26]. Oil content insignificantly (p < 0.05)
influenced consumer oiliness perception of the chips. Nevertheless, slight difference was
detectable with reduced likeness as oil content of the chips increased.
Fried cassava chips texture difference was not significantly detectable by the consumers,
shown by a weak relationship (r = 0.047) between the objective texture measurement and
the sensory texture perception. Color, texture and oiliness preference increased as the L*
values for lightness color tended to white. It was the thin slices at longer blanching time
that had higher L* values implying optimal oil absorption and desirable quality of fried
cassava chips [17, 29]. The redness color parameter, a* values negatively influenced
consumer preference for color, texture and oiliness. Large chips slices which were
unblanched had low lightness color values that tended to dark tan and a corresponding
high a* values [28]. This was detectable by consumer panelists that showed a negative
response in preference of the unblanched large sliced fried cassava chips.
CONCLUSION
Dry matter, cyanide and vitamin C content in raw cassava roots significantly vary with
cultivar. Blanching time and slice thickness collapse the tissue and influence the surface
area for mass transfer during frying contributing significantly to enhanced fried cassava
chips quality. Destruction of cyanogenic glucosides and leaching of surface sugars that
are implicated in off flavor and color is also achieved. Consumers also responded
positively to sensory properties of the thin blanched fried cassava chips. Large slice
thickness of 20 mm, which is used mainly by current processors gave undesirable fried
cassava chips quality, on the other hand blanching time of 10 minutes on 6 mm chips
thickness produced preferred fried cassava chips with satisfactory safety based on low
cyanide levels. Therefore, it is essential to incorporate blanching and slice thickness on
various cassava cultivars as a yardstick for quality development and maintenance.

DOI: 10.18697/ajfand.76.16855 11467
ACKNOWLEDGEMENTS
To God who always has a stake in any activity with a successful outcome, be all glory
and honor. Department of Food Science, Nutrition and Technology, University of
Nairobi is highly acknowledged for creating an enabling environment and for the
technical support.
DOI: 10.18697/ajfand.76.16855 11468
Table 1: Dry matter content, cyanide levels and vitamin C in raw cassava root
from MH95/0183, MM96/2480 and Fumba chai
Cultivar Dry matter
content (%)
Vitamin C
(mg/100g) DMB
Cyanide content
(mg/kg) DMB
MH95/0183 36.79±0.85b 73.10±6.45 a 37.04± 0.424b
MM96/2480 37.69±0.45b 136.11±2.86 a 16.37± 3.26 a
Fumba chai 30.32±0.49 a 105.80±2.84 a 48.48±0.431c
1. Values are means of three determinations ± standard deviation
2. Values with the same letters on the same column are not significantly different
at 5% level of significance
DMB-dry matter basis
Table 2: Pearson correlation between moisture, cyanide and vitamin C contents in
the raw cassava root cultivars
Parameters Moisture
content (%)
Cyanide content
(mg/kg)
Vitamin C content
(mg/100g)
Moisture content 1 0.98** -0.353
Cyanide content 0.98** 1 0.390
Vitamin C content -0.353 0.390 1
N=9; ** correlation is significant at 0.01 level (2-tailed)

DOI: 10.18697/ajfand.76.16855 11469
Table 3: Moisture and cyanide contents of fried cassava chips as influenced by
cultivar, slice thickness and blanching time
Cultivar Blanching
time
Slice
thickness
Moisture content
(%)
Cyanide content
(mg/Kg)
MH95/0183
0mins
6mm
16.71±0.82 b
6.12±0.001 gh
10mm 32.88±2.55 ghijk 6.90±0.86 h
20mm 40.45±1.29 lm 11.51±0.66j
5mins 6mm 10.38±0.78 a 5.67± 0.19efgh
10mm 29.38±2.65 fgh 5.49±0.24efgh
20mm 34.67±0.74 ghijkl 5.39±0.07efgh
10mins 6mm 10.09±0.22 a 2.13±0.01ab
10mm 23.29±2.45 cde 4.21±0.04cdef
20mm 28.85±3.95 efg 4.42±0.16 cdef
MM96/2480 0mins 6mm 26.20±2.02 def 6.79±0.07 h
10mm 35.73±1.69 ijklm 9.95±0.78ij
20mm 37.67±0.08 klm 11.25±0.23j
5mins 6mm 22.70± 0.54 cd 3.97±0.02cde
10mm 31.41±0.24 fghij 5.22±0.11efgh
20mm 34.82±0.87 hijkl 6.25±0.0.049h
10mins 6mm 21.66±0.58 bcd 3.12±0.023 abc
10mm 30.37±0.19 fghij 4.23±0.02 cdef
20mm 32.91±0.65 ghijk 5.10±0.01 defgh
Fumba chai 0mins 6mm 22.96±0.85 cde 5.87± 0.66 fgh
10mm 34.92±0.60hijklm 6.81±0.78 h
20mm 40.74±0.43 m 8.91±0.26 i
5mins 6mm 20.95±0.38 bcd 3.20±0.01abc
10mm 32.88±1.33 ghijk 4.21±0.08 cdef
20mm 35.83±2.10 jklm 6.81±0.80 h
10mins 6mm 17.91±0.44 bc 1.41±0.47a
10mm 29.86±0.33 fghi 3.38±0.22 bcd
20mm 32.08±0.48 fghijk 2.65±0.73 abc
1. Values are means of two determinations ± standard deviation
2. Values with the same letter in the same column are not significantly different at
5% level of significance
DOI: 10.18697/ajfand.76.16855 11470
Table 4: Effect of blanching time, slice thickness and cultivar on Oil content and
vitamin C content of fried cassava chips
Cultivar Blanching
time
Slice
thickness
Oil content
(%)
Vitamin C
(mg/100g)
MH95/0183
0 mins
6mm
18.29±0.12 q
13.26±0.34abcd
10mm 16.19±0.56 p 27.02±2.77 klmn
20mm 15.84±0.91 p 28.44±0.65 lmno
5mins 6mm 15.67±0.07op 10.91±0.58 abc
10mm 15.07±0.5mn 15.39±1.07 cdef
20mm 7.60±0.14 e 23.13±2.72 hijkl
10mins 6mm 11.25±0.19 hi 8.88±0.45 ab
10mm 10.81±0.35gh 13.31±0.46abcd
20mm 4.82±0.09 b 18.36±2.04defghi
MM96/2480 0mins 6mm 15.21±0.04no 22.12±0.42 ghijk
10mm 13.70±0.20 k 50.48±2.00 p
20mm 12.37±0.63 j 33.28±0.23 o
5mins 6mm 13.75±0.14 k 16.84±0.01 cdefg
10mm 10.53±0.56 g 30.92±0.86 mno
20mm 5.86±0.28 c 31.73± 0.94 no
10mins 6mm 11.48±0.35 i 14.85±0.99 bcdef
10mm 7.31±0.63 de 19.49±1.77efghij
20mm 4.47±0.08 b 23.91± 0.72 ijkl
Fumba chai 0mins 6mm 18.48±0.13 q 13.64±0.93 bcde
10mm 12.59±0.03 j 24.48±2.64 jkl
20mm 10.91±0.17gh 28.84±0.46 lmno
5mins 6mm 14.57±0.27lm 9.36±0.71 ab
10mm 7.38±0.11 de 20.17±0.45 fghij
20mm 8.54±0.08 f 25.33±1.19 jklm
10mins 6mm 14.11±0.18 kl 7.59±0.47 a
10mm 7.52±0.55 d 17.26±1.58 defgh
20mm 3.78±0.30 a 20.64±0.73 fghij
1. Values are means of two determinations ± standard deviation.
2. Values with same letter in a column are significantly indifferent at 5% level

DOI: 10.18697/ajfand.76.16855 11471
Table 5: Correlation between slice thickness, blanching time and physico-chemical
properties of cassava chips
Moisture
content
(%)
Cyanide
content
(g/kg)
Oil content
(%)
Vitamin C
content
(mg/100g)
Thickness (mm) 0.737** 0.419** -0.608** 0.496**
Blanching (mins) -0.337* -0.783** -0.634** -0.478**
Moisture (%) 1 0.606** -0.361** 0.764**
Cyanide (g/kg) 0.606** 1 0.299* 0.728**
Oil content (%) -0.361** 0.299* 1 -0.155
Vitamin C (mg/100g) 0.764** 0.728** -0.155 1
N=54; ** Correlation is significant at 0.01 level (2-tailed)
*Correlation significant at 0.05 level (2-tailed)

DOI: 10.18697/ajfand.76.16855 11472
Table 6: Mean texture and color measurements of fried cassava chips from the three
cultivars
Cultivar/
blanching time
Slice
thickness
Texture (N) L* a* b*
MM95/013
0mins
6mm
5.670±0.048 o
66.1±0.5fghij
1.3±0.7abce
15.9±1.7 abc
10mm 3.236±0.145 jk 64.5±0.8 efghi 5.4±0.4 gh 37.6±3.0 l
20mm 3.208±0.148 jk 49.0±0.7 ab 9.7±0.4 jk 27.3±1.7 ijk
5mins 6mm 3.952±0.366 l 67.7 ±0.2ghijkl 1.2±0.8 abcd 14.8±1.1 ab
10mm 2.542±0.087efgh 71.7±1.9 ijklm 1.5±0.2abcde 24.9±2.1eghij
20mm 2.720±0.044 ghi 58.9±1.6 cdef 7.033±0.4 hi 30.4±0.6 k
10mins 6mm 3.222±0.164 jk 69.3±1.0hijklm 1.4±0.3abcde 18.2±0.6abcdef
10mm 2.118±0.091 cde 62.5±2.0 defgh 1.4±0.6 abcde 20.4±1.3 cdefg
20mm 1.628± 0.097 ab 67.5±3.4ghijkl 2.0±0.4 abcde 29.7±1.5 jk
MM96/280
0mins 6mm 5.598±0.303 o 55.4±3.1 bcd 1.5±0.1 abcde 17.5±1.8abcdef
10mm 3.540±0.224 kl 51.3±5.0 abc 1.4±1.3 abcde 13.1±3.6 a
20mm 3.062±0.053 ij 56.8±2.5 bcde 8.1± 1.4ij 28.2±1.2 jk
Fumba chai
0mins 6mm 3.688±0.077 l 57.0±3.5 bcde 0.4±0.3 a 14.5±1.3ab
10mm 2.900±0.072 hij 57.3±2.3 bcde 8.6±0.3 ij 26.5±0.7hijk
20mm 2.218±0.072cdef 44.3±1.5 a 10.9±0.8 k 21.5±0.2defgh
5mins 6mm 2.596±0.075 fgh 64.6±3.8efghi 0.4± 0.4a 18.0±2.9abcdef
10mm 2.540±0.154efgh 67.63±2.8ghijkl 1.6±0.2abcde 18.6±1.4bcdef
20mm 2.014±0.086 bc 50.7±2.9 abc 9.6±0.9 jk 26.0±1.1hijk
10mins 6mm 2.046±0.084 bc 71.9±1.6 ijklm 0.8±0.1 ab 21.6±0.5defgh
10mm 2.086±0.079 cd 73.2 ±0.8 jklm 1.3±0.1abcde 26.1±0.3hijk
20mm 1.546±0.121 a 68.8±1.1ghijklm 2.4±0.6bcdef 26.37±1.5 hijk
MM96/2480
5mins 6mm 5.052±0.047 n 66.9±5.0ghij 0.9±0.5 ab 17.2±1.5 abcd
10mm 2.846± 0.820hijk 72.0±1.4ijklm 0.9±0.1 ab 26.8±0.6 hijk
20mm 2.474±0.817defh 60.2±0.7defg 5.6±0.5 gh 25.1±0.3ghij
10mins 6mm 4.586±0.177 m 67.5±1.1defghijk 1.1±0.5 abc 17.4±0.7abcde
10mm 2.396±0.131 cdeg 77.2±0.1 km 3.2±0.0 cef 22.2±0.2 efghi
20mm 1.365±0.194 a 64.1±1.6 efghi 4.1±0.4 fg 29.1±0.8 jk 1. Values are means of five determinations ± standard deviation,
2. Values with the same letters in the same column are not significantly different at 5% level of
significance

DOI: 10.18697/ajfand.76.16855 11473
Table 7: Sensory properties of fried cassava chips from MM96/2480, MH95/0183
and Fumba chai
Treatment Color Texture Oiliness Acceptability
C1,0,6 3.0±0.8 abc 4.2±0.7abcdef 3.0±0.8abcde 3.8±0.7abcdef
C1,0,10 3.0±0.7abc 2.6±1.1 abc 3.4±1.5 abcdef 3.0±0.7 ab
C1,0,20 2.6±0.9 ab 2.6±0.8 abc 2.6±0.5 ab 3.0±0.7 ab
C1,5,6 5.0±0.7 dfghij 4.8±0.8 acdef 3.8±0.8abcdefh 4.2±0.9 abcdefg
C1,5,10 3.6±0.5 abcdef 3.8±0.8 abcde 3.8±0.8abcdefh 3.8±0.7 abcdef
C1,5,20 4.0±0.abcdefgh 2.0±0.8 a 2.7±0.5 abc 3.0±0.3 abc
C1,10,6 5.2±0.8 fghij 5.0±1.2 acdef 5.4±1.1 fgh 5.0±1.0bcdefgh
C1,10,10 4.2±0.8abcdefg 4.4±0.9 abcdef 4.0±0.8abcdefh 4.0±1.0 abcdefg
C1,10,20 4.0±1.0abcdefg 4.6±1.1 abcdef 5.2±0.8cefgh 4.4±1. abcdefgh
C2,0,6 3.6±0.5 abcdef 3.6±0.5 abcd 3.6±1.1 abcdef 4.4±0.5abcdefh
C2,0,10 2.6±0.9 ab 3.0±0.7 abcd 2.8±0.8 abcd 4.0±0.8 abcdefg
C2,0,20 2.4±0.5 a 2.2±0.8 ab 2.0±1.0 a 2.4±0.5 a
C2,5,6 5.6±0.5 ghij 5.4±1.1 adef 6.0±0.7 h 6.4±0.9 ch
C2,5,10 4.4±0.5bcdefghi 4.8±0.7 acdef 5.0±0.8 cdefgh 4.8±1.3 bcdefgh
C2,5,20 3.6±0.5 abcdef 3.0±0.8 abcd 3.2±0.7 abcdef 3.6±1.1 abcd
C2,10,6 6.6±0.5 hj 6.4±0.9 f 6.0±1.0 h 6.0±0.7 ce
C2,10,10 4.2±0.8 abcdefg 4.4±1.1 abcdef 4.2± 1.0abcdefgh 4.4±0.5abcdefgh
C2,10,20 4.0±0.7abcdefi 4.2±0.8 abcdef 4.2±1.3abcdefgh 4.2±0.8 abcdefg
C3,0,6 3.6±0.9 abcdef 3.2±0.8 abcd 3.2±0.7 abcdef 3.6±0.5abcd
C3,0,10 2.8±0.8abc 4.6±1.5 abcdef 4.6±1.1 bcdefgh 3.4±0.5 abcd
C3,0,20 3.0±0.7 abcde 3.2±0.8 abcd 3.2±0.8 abcdef 3.4±0.5 abcd
C3,5,10 5.2±0.8fghij 5.4±1.1 adef 4.6±0.5 bcdefgh 5.4±1.1 cdefgh
C3,5,20 4.6±1.1 cdefghi 4.8±0.8 acdef 4.8±0.4 bcdefgh 5.2±0.8 cdefgh
C3,10,6 4.6±1.1 cdefghi 5.4±1.6 adef 5.8±1.3 gh 5.4±0.5 cdefgh
C3,10,10 4.6±0.5 cdefghi 6.2±0.8 ef 5.8±0.8 gh 5.4±1.1 cdefgh
C3,10,20 4.2±0.8abcdefg 4.4±0.5 abcdef 5.0±0.7 cdefgh 4.8±0.8 bcdefgh
1. C1, C2 and C3 are MH95/0183, MM96/2480 and Fumba chai, respectively.
2. The ordering of C1, 0, 6 shows the cultivar, blanching time and slice thickness, respectively
3. Values are means ± standard deviations. Significant different at 5% level (different letters)

DOI: 10.18697/ajfand.76.16855 11474
REFERENCES
1. Nwosu JN, Owuamanam CI, Omeire GC and C Eke Quality parameters of
bread produced from substitution of wheat flour with cassava flour using soybean
as an improver. American Journal of Research Communication; (2014); 2(3): 99-
118.
2. Olanbiwoninu AA and SA Odunfa Enhancing the Production of Reducing
Sugars from Cassava Peels by Pretreatment Methods. International Journal of
Science and Technology; (2012); 2(9): 35-42.
3. Nassar NM and R Ortiz Cassava improvement, challenges and impacts. Journal
of Agricultural Science; (2007); 145: 163-171.
4. Barratt N, Chitundu D, Dover O, Elsingal J, Eriksson S, Guma L, Haggblade
M, Haggblade S, Henn TO, Locke FR, O’Donnell C, Smith C and T Stevens Cassava as drought insurance, Food security implications of cassava trials in
central Zambia. Agrekon; (2006); 45(1): 106 -123.
5. Erhabor PO and CO Emokaro Relative Technical efficiency of cassava
farmers in the three Agro-Ecological zones of Edo state, Nigeria. Journal of
Applied Science; (2007); 7(19): 2818-2823.
6. Wilson WM and DL Dufour Why “bitter” cassava? The productivity of bitter
and sweet cassava in Tukanoan Indian settlement in Northwest Amazon. Journal
of Economic Botany; (2002); 56(1): 49-57.
7. Uyoh EA, Udensi O, Natui V and I Urua Effect of different processing methods
on cyanide content of garri from four cultivars of cassava. Journal of Food,
Agriculture and Environment; (2007); 5(3-4): 105-107.
8. Etonihu AC, Olajubu O, Ekanem EO and SS Bako Titrimetric evaluation of
cyanogens in parts of some Nigerian cassava species. Pakistan Journal of
Nutrition; (2011); 10(3): 260-263.
9. Umuhozariho MG, Shayo NB, Msuya1 JM and PYK Sallah Cyanide and
selected nutrients content of different preparations of leaves from three cassava
species. African Journal of Food science; (2014); 8(3): 122-129.
10. International Institute of Tropical Agriculture (IITA). Cassava Recipes for
Household Food Security. http://www.iita.org/c/documentlibrary/593f240d-7fc9
(2006): 10-25: Accessed on 15th June, 2015.
11. Chaves AL, Sanchez T, Jaramillo G, Bedoya JM, Echeverry J, Bolanos EA,
Ceballos H and CA Iglesias Variation of quality traits in cassava roots evaluated
in landraces and improved clones. Euphytica; (2005); 143: 125-133.

DOI: 10.18697/ajfand.76.16855 11475
12. Cardoso AP, Mirione E, Ernesto M, Massaza F, Cliff J and MR Haque Processing of cassava roots to remove cyanogens. Journal of Food Composition
Analysis; (2005); 18: 451-460.
13. Tonukari NJ Cassava and the future of starch. Electronic Journal of
Biotechnology; (2004); 7(1): 05-08.
14. Salcedo D, Valle AD, Sanchez B, Ocasio V, Ortiz A, Marquez P and D
Siritunga Comparative evaluation of physiological post-harvest root
deterioration of 25 cassava accessions: visual verses hydroxycoumarins
fluorescent accumulation analysis. African Journal of Agricultural Research;
(2010); 5: 3138-3144.
15. Nweke FI, Dunstan SC, Spencer DSC and TK Lyman Cassava
Transformation. University Press, Michigan State, USA; (2002): 272.
16. Enidiok SE, Attah LE and CA Otuechere Evaluation of moisture, Total
cyanide and fiber contents of Garri produced from cassava varieties obtained
from Awassa in Southern Ethiopia. Pakistan Journal of Nutrition; (2008); 7(5):
625-629.
17. Elfnesh F, Tekalign T and W Solomon Processing quality of improved potato
cultivars as influenced by growing environment and blanching. African Journal
of Food Science; (2011); 5(6): 324-332.
18. Sherri NS, Jill FK and HI Cliff Lipid and Moisture Content of Commercial
Reduced-Fat Deep-Fried Potatoes Compared to Advertised Claim. Journal of
Food Research; (2014); 3(5): 45.
19. Adepoju OT, Adekola YG, Mustapha SO and SI Ogunola Effect of processing
methods on nutrient retention and contribution of cassava to nutrient intake of
Nigerian consumers. African Journal of Food, Agricultural and Nutritional
development; (2010); 4(7): 422-426.
20. Oluwole OB, Olatunji OO and SA Odunfa Process technology for conversion
of dried cassava chips into gari. Nigerian Food Journal; (2004); 22: 65-77.
21. AOAC. Association of Official Analytical Chemists. AOAC International 16th
edition, Washington DC; (2007).
22. A0AC. Association of Official Analytical Chemists international (AOAC). 18th
edition, Washington DC; (2005).
23. Abong’ GO, Okoth MW, Imungi JK and JN Kabira Effect of slice thickness
and frying temperature on color, texture and sensory properties of crisps made
from four Kenyan potato cultivars. American Journal of Food Technology;
(2011); 6(9): 753-762.

DOI: 10.18697/ajfand.76.16855 11476
24. Siritunga D and R Sayre Engineering cyanogen synthesis and turnover in
cassava (Manihot esculenta). Journal of Plant Molecular Biology; (2004); 56:
661–669.
25. Maneerote J, Noomhorm A and PS Takhar Optimization of processing
condition to reduce the oil intake to enhance physico-chemical properties of deep
fried rice crackers. Journal of Food Science and Technology; (2009); 42: 805-
812.
26. Moreira DL, Guimaraes EF and MC Kaplan Butyl-3, 4-
methylenedioxybenzene as a major constituent of the essential oil from Ottonia
anisum. Journal of Essential Oil Research; (1997); 9: 565-568.
27. Choe E and DB Min Chemistry of deep-fat frying oils. Journal of Food Science;
(2007); 72(5): 77-86.
28. Pedreschi F, Moyano P, Kaack K and K Granby Color changes and
acrylamide formation in fried potato slices. Food Research International; (2005);
38(1): 01-09.
29. Boskou G, Salta FN, Chiou A, Troullidou E and NK Andrikopoulos Content
of trans-2, 4-decadienal in deep-fried and pan-fried potatoes. European Journal
of Lipid Science and Technology; (2006); 108: 109–115.


![DOI: 10.18697/ajfand.74.15105 MICROBIOLOGICAL ANALYSIS OF ... · DOI: 10.18697/ajfand.74.15105 10846 and are responsible for mastitis [10]. The RBS norm for pathogenic microorganisms](https://static.fdocuments.in/doc/165x107/5eb144eab4adf67a2963ed7a/doi-1018697ajfand7415105-microbiological-analysis-of-doi-1018697ajfand7415105.jpg)