DOI: 10.1355/ae33-1a The Economy-wide Impact of a Uniform ...
23
Journal of Southeast Asian Economies Vol. 33, No. 1 (2016), pp. 1–22 ISSN 2339-5095 print / ISSN 2339-5206 electronic © 2016 ISEAS–Yusof Ishak Institute 1 DOI: 10.1355/ae33-1a Ditya A. Nurdianto is a Second Secretary from the Ministry of Foreign Affairs of the Republic of Indonesia and currently posted at the Permanent Mission of the Republic of Indonesia to the United Nations, the World Trade Organization, and other International Organizations in Geneva, 16, rue de Saint-Jean, 1203 Geneva, Switzerland; email: [email protected] Budy P. Resosudarmo is an Associate Professor at the Arndt-Corden Division of Economics, Crawford School of Economics and Government, The Australian National University, Canberra, ACT 2000, Australia; email: budy. [email protected] The Economy-wide Impact of a Uniform Carbon Tax in ASEAN Ditya A. Nurdianto and Budy P. Resosudarmo The main goal of this study is to analyse the benefits and losses associated with cooperation among ASEAN members in mitigating their CO 2 emissions, particularly by implementing a uniform carbon tax across ASEAN. To achieve this goal, this paper uses a multi-country computable general equilibrium model for ASEAN, known as the Inter-Regional System of Analysis for ASEAN model. This study finds that the implementation of a carbon tax scenario is an effective means of reducing carbon emissions in the region. However, this environmental gain could come at a cost in terms of GDP contraction and reduction in social welfare, i.e. household income. Nevertheless, Indonesia and Malaysia can potentially gain from the implementation of a carbon tax as it counteracts price distortions due to the existence of heavy energy subsidies in these two countries. Keywords: ASEAN, carbon tax, climate change, computable general equilibrium model. 1. Introduction The Association of Southeast Asian Nations (ASEAN) was founded on 8 August 1967. The Declaration forming this association was signed by the foreign ministers of Indonesia, Malaysia, the Philippines, Singapore and Thailand. The aim and purpose were to foster cooperation in economic, social, cultural, technical, educational and other fields, as well as the promotion of regional peace and stability through abiding respect for justice and the rule of law as well as adherence to the principles of the United Nations Charter (Khoman 1992). Over time, due to the relative success of this association in achieving its goals, ASEAN membership has expanded to also include Brunei, Cambodia, Laos, Myanmar and Vietnam. To enhance the benefits of collaboration among members, in 2003, the idea of creating an ASEAN Economic Community by 2015 was proposed
Transcript of DOI: 10.1355/ae33-1a The Economy-wide Impact of a Uniform ...
Journal of Southeast Asian Economies Vol. 33, No. 1 (2016), pp. 1–22 ISSN 2339-5095 print / ISSN 2339-5206 electronic
© 2016 ISEAS–Yusof Ishak Institute 1
DOI: 10.1355/ae33-1a
Ditya A. Nurdianto is a Second Secretary from the Ministry of Foreign Affairs of the Republic of Indonesia and currently posted at the Permanent Mission of the Republic of Indonesia to the United Nations, the World Trade Organization, and other International Organizations in Geneva, 16, rue de Saint-Jean, 1203 Geneva, Switzerland; email: [email protected]
Budy P. Resosudarmo is an Associate Professor at the Arndt-Corden Division of Economics, Crawford School of Economics and Government, The Australian National University, Canberra, ACT 2000, Australia; email: [email protected]
The Economy-wide Impact of a Uniform Carbon Tax in ASEAN
Ditya A. Nurdianto and Budy P. Resosudarmo
The main goal of this study is to analyse the benefits and losses associated with cooperation among ASEAN members in mitigating their CO2 emissions, particularly by implementing a uniform carbon tax across ASEAN. To achieve this goal, this paper uses a multi-country computable general equilibrium model for ASEAN, known as the Inter-Regional System of Analysis for ASEAN model. This study finds that the implementation of a carbon tax scenario is an effective means of reducing carbon emissions in the region. However, this environmental gain could come at a cost in terms of GDP contraction and reduction in social welfare, i.e. household income. Nevertheless, Indonesia and Malaysia can potentially gain from the implementation of a carbon tax as it counteracts price distortions due to the existence of heavy energy subsidies in these two countries.
Keywords: ASEAN, carbon tax, climate change, computable general equilibrium model.
1. Introduction
The Association of Southeast Asian Nations (ASEAN) was founded on 8 August 1967. The Declaration forming this association was signed by the foreign ministers of Indonesia, Malaysia, the Philippines, Singapore and Thailand. The aim and purpose were to foster cooperation in economic, social, cultural, technical, educational and other fields, as well as the promotion of regional peace
and stability through abiding respect for justice and the rule of law as well as adherence to the principles of the United Nations Charter (Khoman 1992). Over time, due to the relative success of this association in achieving its goals, ASEAN membership has expanded to also include Brunei, Cambodia, Laos, Myanmar and Vietnam.
To enhance the benefits of collaboration among members, in 2003, the idea of creating an ASEAN Economic Community by 2015 was proposed
16-0494 JSEAE 01.indd 1 24/3/16 9:20 am

2 Journa l o f Sou theas t As ian Economie s Vo l . 33 , No . 1
(Morada 2008; Simon 2008). The main goal was to create a single market and production base by allowing the free movement of goods, services, investments and skilled labour. Establishing deeper cooperation among members in response to global issues was another objective.
As the world needs to reduce the amount of greenhouse gas (GHG) it emits (Stern 2006), one issue that emerged globally in the early 2000s is climate change. ASEAN countries’ GHG emissions are not insignificant (ADB 2009; ASEAN 2009). Hence, leaders of ASEAN see the need to act together in response to this issue and plan to do so. At the Third East Asia Summit (EAS) on 21 November 2007, leaders reaffirmed the need to tackle climate change based on the principles set out by the United Nations Framework Convention on Climate Change (UNFCCC) through the Singapore Declaration on Climate Change, Energy, and Environment. The declaration aims, among other things, to deepen understanding of the region’s vulnerability to climate change and to implement appropriate mitigation and adaptation measures. These include intensifying ongoing operations to improve energy efficiency and the use of cleaner energy, promoting cooperation in afforestation and reforestation, as well as continuing support and initiatives under the UNFCCC (ASEAN 2007; ASEAN 2009). Among concrete measures, the Forty-first ASEAN Ministerial Meeting in July 2008 delegated the responsibility of mainstreaming climate change actions into ASEAN programmes to the ASEAN sectoral bodies on energy efficiency, transportation, and forestry (ADB 2009).
One option under consideration is to put a price on carbon emissions (Letchumanan 2010; Jotzo and Mazouz 2010; ASEAN+3 Research Group 2011). Carbon pricing takes advantage of the market mechanism in deciding where emissions should be reduced. It raises the price of goods that have associated carbon emissions in their production. Goods and services that embody high emissions will see greater increases in price than those that embody low emissions. The economic reaction to the price signal automatically implements the lower cost abatement options (Pearce 1991; Goulder
1995; Bovenberg 1999; Glomm, Kawaguchi and Sepulveda 2008; Indonesian Ministry of Finance 2009; World Bank 2010).
Left unaddressed by ASEAN members so far has been a deep understanding as to how the implementation of uniform carbon pricing policies across ASEAN countries would affect their economies. Would these policies represent a serious threat to growth? Which household groups — rural versus urban or rich versus poor households — in their countries would have to shoulder the greatest burden of these policies? In other words, would this policy be regressive or progressive towards income distribution? The main objective of this paper, hence, is to analyse the socio-environmental-economic impact of a carbon pricing policy in ASEAN. A case study of a carbon tax, or a levy on carbon dioxide (CO2) emissions,1 is chosen since this policy will affect all members of ASEAN.2
Works analysing the impact of carbon tax on individual ASEAN country are available, such as the ones by: Corong (2008) on the Philippines; Coxhead, Wattanakuljarus and Chan (2013) on Vietnam; and Yusuf and Resosudarmo (2015) on Indonesia. However, none of these works take into account the impact of a policy implemented in an ASEAN country on other ASEAN countries. This paper builds a multi-country computable general equilibrium (CGE) model called the Inter-Regional System of Analysis for ASEAN (IRSA-ASEAN) to look at the impact of implementing such a tax in terms of environmental improvement, economic growth, and income distribution in ASEAN countries. Due to data availability, analysis will be focused on Indonesia, Malaysia, the Philippines, Singapore, Thailand and Vietnam.3 Thus far, this is the first paper to analyse the impact of a uniform carbon tax policy on ASEAN economies.
The next section of this paper provides the literature review regarding the assessment of the impact of a carbon tax on the economy. After that, this paper provides a brief overview of the methodology used in this study, namely the IRSA-ASEAN model, sources of data and simulation scenarios conducted. This is followed by a presentation of the results and analysis
16-0494 JSEAE 01.indd 2 24/3/16 9:20 am

Apr 2016 Nurd ian to and Resosudarmo: Un i fo rm Carbon Tax i n ASEAN 3
arising from the use of the IRSA-ASEAN model to simulate several policy scenarios related to the implementation of a carbon tax in the region. The last part of this paper concludes and discusses policy implication.
2. Carbon Tax
Environmental tax policies have become increasingly frequent in recent years. One reason for this is an increasing concern about the quality of the natural environment; environmental taxes are generally an efficient instrument for environment protection. The second reason involves the revenues from environmental taxes. These revenues can be used to cut other distortionary taxes. In this way, the government may reap a “double-dividend”, i.e. not only a cleaner environment but also a less distortionary tax system (Pearce 1991; Goulder 1995; Bovenberg 1999; Glomm, Kawaguchi and Sepulveda 2008).
Nevertheless, several studies, including the one by Schob (2005), theoretically argue that an environmental tax may have a multitude of possible effects which are sensitive to the underlying institutional framework. The double-dividend theory in which a revenue-neutral tax shift may yield environmental gains at virtually no cost does not always hold up. While there are significant environmental benefits associated with a tax shift, these gains are not generally costless.
Despite debate on the cost of an environmental tax to control the quality of the environment, recent studies argued that revenue-raising environmental policies are more efficient than non-revenue-raising ones because of the revenue-recycling effect (Morgenstern 1995). However, the tax type, “recycling policy”, and economic model significantly influence the chance a double-dividend effect can be obtained (Lai 2009).
The term recycling policy refers to revenue recycling, that is, using new revenues from environment-related taxes to decrease pre-existing distortionary taxes. Other forms of financial recycling are also possible, such as lump-sum transfers to households or industries, consisting of recycling revenues to households or to industries in
the form of one-off payments (Patuellia, Nijkampb and Pelsb 2005). There is increasing evidence that the way in which tax revenues are recycled is a key factor in meeting a country’s economic and environmental objectives (Welsch 1996; Corong 2008; Yusuf and Resosudarmo 2015).
A carbon tax is one type of environmental tax. The early works on the impact of a carbon tax on the economy include Poterba (1991), Pearson and Smith (1991) and Hamilton and Cameron (1994); while some of the more recent ones are those of Ojha (2009), Grainger and Kolstad (2009) and Cororaton and Corong (2009). According to these works, there are some caveats associated with the implementation of a carbon tax.
One such caveat is the regressive nature of a carbon tax in as much as it imposes the heaviest burden on the lower income groups (Grainger and Kolstad 2009). Most of the studies on this issue, however, concern developed countries (Baranzini, Goldemberg and Speck 2000). Among others are those by Brännlund and Nordstrom (2004), Oladosu and Rose (2007), Leach (2009), and Callan et al. (2009), which all confirm that a carbon tax or energy tax in developed countries is regressive.
For developing countries, among the few are the works by Shah and Larsen (1992), Brenner, Riddle and Boyce (2007), Corong (2008), Ojha (2009), Coxhead, Wattanakuljarus and Chan (2013), and Yusuf and Resosudarmo (2015). The papers show such regressivity is less pronounced with respect to household expenditure. Literature on this issue hence concludes that the regressivity of carbon taxes should be less of a concern in developing than in developed countries.
Another note of caution deals with the so-called “rebound effect”, i.e. a situation in which the implementation of carbon tax, instead of reducing, actually induces a higher level of carbon emissions. The first channel of a possible rebound effect is as follows. A high energy price due to a carbon tax, besides being expected to reduce energy usage, also increases the efficiency of energy use. The rebound effect occurs when the increase in energy efficiency increases energy consumption in such that this increased consumption offsets the
16-0494 JSEAE 01.indd 3 24/3/16 9:20 am
4 Journa l o f Sou theas t As ian Economie s Vo l . 33 , No . 1
energy savings that might otherwise be achieved (Sorrell and Dimitropoulos 2008; Sorrell 2009). The second channel occurs when the recycling of revenue from a carbon tax results in increased consumption of energy, offsetting the expected energy savings due to a carbon tax. Indeed, various empirical studies and simulations have indicated that the rebound effect occurs in many countries. Among them are Brännlund, Ghalwash and Nordström (2007) in the case of Sweden, Barker, Ekins and Foxon (2007) in the case of the United Kingdom, Mizobuchi in the case of Japan (2008), and Holm and Englund (2009) in the cases of United States of America and Western Europe. This paper aims to observe whether the implementation of a uniform carbon tax in ASEAN induces a situation of double-dividend, is regressive and/or creates a rebound effect.
3. Methods
3.1 Inter-Regional System of Analysis for ASEAN (IRSA-ASEAN) Model
The IRSA-ASEAN model is a multi-country CGE model that stems from other developments in CGE modelling over the last twenty years; some of these sources of inspiration are direct and easily identified, including one of the first CGE models for Indonesia by Lewis (1991), the GTAP model (Hertel 1997), the Globe model (McDonald, Thierfelder and Robinson 2007) and IRSA-Indonesia5 (Resosudarmo et al. 2008; Resosudarmo et al. 2011). The IRSA-ASEAN model is a unique model in its own right, both structure-wise and purpose-wise. The IRSA-ASEAN model itself is a multi-country model that solves at the country level, meaning that optimizations are performed at this level. This approach allows for variation in price as well as in quantity for each country to be observed using this model. This approach enables observation of the impact of a shock specific to one country compared with other countries, the whole ASEAN economy, and within the country itself.
The IRSA-ASEAN model includes six ASEAN member countries, namely, Indonesia, Malaysia, the Philippines, Singapore, Thailand and Vietnam.
As optimization is performed at the country level, and taking into account the “sovereignty” element of each country, the model uses neither a bottom-up nor a top-down approach.4 Each country is instead connected through commodity flows, i.e. trade of goods and services, as well as transfer flows, i.e. remittances and savings-investments. The model also allows direct transfer of primary factors of production, e.g. fragmentation. However, due to data scarcity, this last feature is not included in the empirical study. As a consequence of the sovereignty element in the IRSA-ASEAN model, each country has its own balance of payments as well as savings and investment accounts. Each country deals directly with other countries in terms of trading and is allowed its own set of tariff barriers. For example, in the IRSA-ASEAN model, each country can export/import goods and services directly to/from the rest of the world (ROW).
Another important highlight of the IRSA- ASEAN model deals with the issue of double- dividends. The model internalizes the double-dividend hypothesis by explicitly incorporating various recycling mechanisms. In this regard, aside from the government increasing its expenditure, the carbon tax revenue can either be recycled directly to households, e.g. by a direct one-time lump-sum cash transfer to low-income households, or recycled back to industry, e.g. by indirect tax reduction, so that it creates a less distortionary tax system, or supposedly so.
Figure 1 shows the basic flow of commodities and production structures in each country. XTOT(i,d) is output, XINT_S(c,i,d) is the intermediate good, and XPRIM(i,d) is the primary input. Meanwhile, XTRAD_R(c,r,d) is the domestic5 demand, which becomes XTRAD_R(c,d) as the domestic demand composite, XD_S(c,d) is the domestic and import6 demand composite, and XFAC(f,i,d) is the demand for a factor of production. The following defines the subscript notations:
c commodity;d destination of commodity in domestic
country;f factors of production, labour, and capital;h households;
16-0494 JSEAE 01.indd 4 24/3/16 9:20 am

Apr 2016 Nurd ian to and Resosudarmo: Un i fo rm Carbon Tax i n ASEAN 5
FIGURE 1Production Structure of the IRSA-ASEAN Model
RecycleXFAC(f,i,d)
XINT_S(c,i,d)XPRIM(i,d)
XTOT(i,d)
XTRAD(c,r,d)
XTRAD_R(c,d)
XD(c,"dom",d)XD(c,"imp",d)
XEXP(c,r)
XHOU_S(c,h,d) XGOV_S(c,d) XINV_S(c,d)
XD_S(c,d)
CES
Leontie
Import Tariffs
Indirect Taxes
XIMP(c,d)
Armington
XD(c,s,d)
16-0494 JSEAE 01.indd 5 24/3/16 9:20 am

6 Journa l o f Sou theas t As ian Economie s Vo l . 33 , No . 1
i industry;r source of commodity in domestic country;
ands source of commodity, composite between
domestic country and import.
Note that XEXP(c,r) represents exports to the rest of the world, while the term XIMP(c,d) refers to imports from the rest of the world. Meanwhile, XHOU_S(c,h,d) represents household demand, XGOV_S(c,d) represents government demand, and XINV_S(c,d) represents investment demand. Also note that indirect taxes affect production output while import taxes affect composite demand.7
At the first stage, with only five factors of production, a constant elasticity of substitution (CES) function can be used to determine the demand for primary factors. At the second stage, a firm’s objective is to maximize profit with a Leontief production function. The Leontief production function determines the relationship between all the inputs, a composite of primary factors and intermediate goods, to outputs. Admittedly, one notable limitation to this setup is that endogenous substitution between intermediate inputs is not allowed.
Final users of commodity c consist of households, governments, and investors. Households maximize a Cobb-Douglas utility function subject to a budget constraint. Governments and investor choose their combination of commodities based on a constant budget share. Lastly, the following closures are incorporated into the IRSA-ASEAN model to guarantee that the system is solvable:
• All factor supplies are exogenous;• Unskilled and skilled labour are mobile;• Land, natural resources, capital are immobile;• All household and corporate saving rates are
exogenous;• All shares of inter-institutional transfer rates are
exogenous;• World import prices are exogenous;• Indirect tax and import tariff rates are exogenous;
and• Output price index is set as a numeraire.
Since land, natural resources and capital are set to be immobile across sectors and a Leontief production function is utilized in the IRSA-ASEAN model, the model produces short-run impacts of a policy simulation.
The CO2 emission model is upheld as a separate model; yet it is also integrated into the CGE model. Emissions basically come from households and industrial sectors due to fossil fuel consumption; in this model, namely only the consumption of coal, petroleum products, and manufactured gas.8 Once the value of the respective fossil fuel consumption is determined, it is possible to determine the volume and estimate the CO2 emissions.
In reality, CO2 emissions, as well as other greenhouse gases, also depend on combustion technology, operating conditions, control technology, as well as on maintenance and age of the equipment implemented (Lee 2008). However, as noted by IPCC, OECD and EIA (1997), few countries have such data. Likewise, the IRSA-ASEAN model ignores these refinements and calculates carbon emissions solely from fossil fuel combustion of coal, petroleum products, and manufactured gas.
The amount of carbon tax in the IRSA-ASEAN model is transformed into a sales tax for the consumption and use of fossil fuels — namely only the consumption of coal, petroleum products, and manufactured gas — borne by households and industries (Adams, Horridge and Parmenter 2000; Yusuf and Resosudarmo 2015). Revenue from these taxes is collected by the government.
Another distinctive feature of the IRSA-ASEAN model is its connection to a microsimulation model to disaggregate the four household groups, namely Rural-Low, Urban-Low, Rural-High, and Urban-High.9 Once a solution has been found for a particular simulation, through the microsimulation model, household groups are disaggregated further into 100 groups based on population percentile groups in both rural and urban areas. The microsimulation basically disaggregates household expenditure for each commodity using an expenditure share coefficient for each percentile household group.10
16-0494 JSEAE 01.indd 6 24/3/16 9:20 am

Apr 2016 Nurd ian to and Resosudarmo: Un i fo rm Carbon Tax i n ASEAN 7
3.2 Data Sources
For empirical results, the IRSA-ASEAN model uses the Social Accounting Matrix for ASEAN (ASEAN-SAM) which has been calibrated from the input-output (I-O)-based Global Trade Analysis Project (GTAP) Version 7 Data Base with parameter values, e.g. value-added and Armington elasticities, also obtained from this source. The database uses a common reference year of 2004 and a common currency of US dollars (US$ million) for all six countries in the region. The database has been heavily modified using various country-specific datasets, e.g. social accounting matrices and household income/expenditure surveys, so as to provide greater insight and flexibility for policy analysis.
The additional datasets required to build the so-called ASEAN-SAM are as follows. For Indonesia, the additional data needed are the (1) 2005 Social Accounting Matrix, and (2) 2005 Inter-Regional Social Accounting Matrix (Resosudarmo et al. 2008); for Malaysia, the (1) 2004/2005 Household Expenditure Survey, (2) 2004 Distribution and Use of Income Accounts and Capital Accounts, (3) 2000 Population and Housing Census, and (4) 1970 Social Accounting Matrix (Pyatt, Round and Denes 1984); for the Philippines, the (1) 2006 Family Income Expenditure Survey, (2) 2000 Social Accounting Matrix (Cororaton and Corong 2009), and (3) 1997 Family Income Expenditure Survey; for Singapore, the (1) 2008 Yearbook of Statistics, and (2) 2002/2003 Report on the Household Expenditure Survey; for Thailand, the (1) 2008 Key Statistics, (2) 2002 Household Socio-Economic Survey, and (3) 1998 Social Accounting Matrix (Li 2002); and for Vietnam, the (1) 2004 Living Standard Survey, and (2) 1997 Social Accounting Matrix (Nielsen 2002). Other datasets needed are the 2010 World Development Indicators, 2008 ASEAN Statistical Yearbook, 2005 ASEAN Statistical Yearbook, 2005 Bilateral Remittance Estimates (Ratha and Shaw 2007), 2005 International Energy Prices (Metschies 2005), and 2004 Combustion-Based CO2 Emissions Data for GTAP Version 7 (Lee 2008).
Procedures in constructing the ASEAN-SAM for modelling purposes are divided into three
phases. The first phase involves the preparation of the GTAP Version 7 Data Base and transforming it into SAMs for the six individual countries a là McDonald, Thierfelder and Robinson (2007). Phase 2 is a set of steps required to transform each individual SAM a là McDonald, Thierfelder and Robinson (2007) into a standard SAM form by completing international and domestic transfers. Phase 3 is when all individual SAMs are combined to form the ASEAN-SAM. Some adjustments are needed to combine these individual SAMs. Table 1 provides a detailed list of sets of the ASEAN-SAM, while Table 2 provides selected economic indicators from the ASEAN-SAM.
3.3 Policy Simulations: Carbon Tax Implementation
With regards to policy simulations, as mentioned before, this study focuses on the economic impact of carbon tax policies. Even using only this single instrument, i.e. the carbon tax, there are many ways in which this policy can be implemented and modelled. The simulations of the model presented in this paper focus on the implementation of symmetric policies, which simply means that the chosen policy is implemented across the board in all six countries. A relatively modest uniform carbon tax policy, i.e. a US$10 per ton of CO2 emissions, is chosen in this paper, as this also follows previous work of the Indonesian Ministry of Finance (2009).
The analyses are divided into three different scenarios to simulate three possible recycling mechanisms that may be implemented. These mechanisms deal with the revenue generated from the carbon tax policy implemented by the respective government as explained previously. The first recycling mechanism (SIM1) assumes that the government retains all the revenue generated and thereby increases its consumption proportionally where the total increase equals the carbon tax revenue.
The second mechanism (SIM2) assumes that the government redistributes 50 per cent of the revenue back to households in the form of a direct
16-0494 JSEAE 01.indd 7 24/3/16 9:20 am

8 Journa l o f Sou theas t As ian Economie s Vo l . 33 , No . 1
cash transfer to improve social welfare. In this variant, in order to conform to the real world, the government only redistributes cash to poor households in both rural and urban areas.11 Hence, transfer shares between rural-low and urban-low income households are weighted based on the poverty incidence, i.e. the percentage of population below the national poverty line. Effectively, with greater poverty incidence in rural areas, low-income households in these areas receive a greater
share of the cash transfer compared to low-income households in urban areas. Logically, of course, high-income households in both rural and urban areas do not receive these cash transfers.
Meanwhile, the third variant (SIM3) assumes that the government uses 50 per cent of the carbon tax revenue to reduce other distortionary taxes in order to achieve a double dividend. In the IRSA-ASEAN model, the respective government proportionally redistributes the revenue obtained
TABLE 1List of Sets
Production Sectors Regions
Agriculture Trade Indonesia
Farming Transportation Malaysia
Forestry Communication Philippines
Fishing Financial services Singapore
Coal Public administration, defence, Thailand
Oil health, and education Vietnam
Gas Dwellings and other services Rest of the World
Minerals nec
Food and beverages Factors Institutions
Textile and leather products
Wood and paper products Unskilled labour Rural-Low Household
Petroleum and coal products Skilled labour Rural-High Household
Chemical, rubber, and Land Urban-Low Household
plastic products Natural resources Urban-High Household
Mineral products nec Capital Corporate
Metal products Government
Manufacturing Other Accounts
Electricity
Gas manufacture distribution Indirect Tax
Water Import Tax
Construction Saving-Investment
16-0494 JSEAE 01.indd 8 24/3/16 9:20 am

Apr 2016 Nurd ian to and Resosudarmo: Un i fo rm Carbon Tax i n ASEAN 9
TABLE 2Selected Economic Indicators from the 2005 ASEAN-SAM
IDN MYS PHL SGP THA VNM
Macroeconomic Indicators
(in US$ million)Private Consumption 174,751 37,373 58,936 55,286 86,874 29,139Government Consumption 20,035 11,641 8,754 13,911 16,129 2,798Fixed Investment 49,317 17,316 14,118 31,396 40,344 15,073Export 89,212 154,873 51,491 169,961 121,174 32,660Import 88,496 107,987 48,969 161,818 108,691 36,666Gross Domestic Product 244,819 113,214 84,330 108,737 155,831 43,003
Sectoral Disaggregation
(in US$ million)Agriculture 33,917 6,299 10,004 304 13,590 6,405Manufacture 96,033 72,203 31,414 29,220 68,253 22,935Service 124,752 36,397 43,059 77,289 79,855 13,687
Average Expenditure per Capita
(in US$)Rural-Low 388 844 193 602 207Rural-High 1,522 1,601 1,205 1,429 539Urban-Low 540 939 194 7,966 1,093 165Urban-High 1,682 3,325 2,104 21,222 4,696 1,328
Population
(in thousand)Rural 114,975 8,438 32,004 44,350 60,720Urban 101,469 16,736 51,908 4,167 20,928 21,312
Poverty Incidence (using national poverty lines)(in percentage)Rural 21.1 13.2 41.4 12.6 45.0Urban 14.4 3.8 15.0 4.0 9.0
CO2 Emissions (from fossil fuel combustion only)Total CO2 Emissions (in kiloton) 357,387 145,012 76,641 40,838 216,977 86,708CO2 Emissions per Capita (in ton) 1.65 5.76 0.91 9.80 3.32 1.05CO2 Emission Intensity 1.46 1.28 0.91 0.38 1.39 2.02(in kiloton/USD million)
16-0494 JSEAE 01.indd 9 24/3/16 9:20 am

10 Journa l o f Sou theas t As ian Economie s Vo l . 33 , No . 1
back to industries through a negative indirect tax. This scheme is intended to achieve a less distortionary tax system.
4. Results and Discussions
Table 3 shows the short-run impacts on emissions, macroeconomic indicators, and household expenditure, when implementing a carbon tax of US$10 per ton of CO2 emissions on all countries.12 It is important to note that all changes are calculated at the original price level, meaning that their changes are real changes.
In order to understand why and how changes occur when a carbon tax is implemented, particularly when performing a welfare analysis, a more detailed examination must be conducted at the sectoral level. Table 4 shows selected sectoral prices. It is important to note that Table 4 also implicitly shows changes from the original prices. This implies, for example, that a coal price of 1.29 in Indonesia means that the price of coal has increased by 29 per cent in Indonesia after a carbon tax of US$10 per ton of CO2 has been implemented in the form of a sales tax to industries and households.
Following the changes in commodity prices, production activities change as well. Table 5 shows the real sectoral value-added changes in per cent. Note that this table does not show real output changes because it is more important at this stage to look at the industrial changes while avoiding changes that arise from the export and import of commodities. The distinction is important, as value-added changes will affect households more than output changes. Also, the changes are in per cent. Lastly, from top to bottom, the first four sectors are categorized as agriculture, followed by twelve sectors categorized as manufacturing, and ten sectors as services.
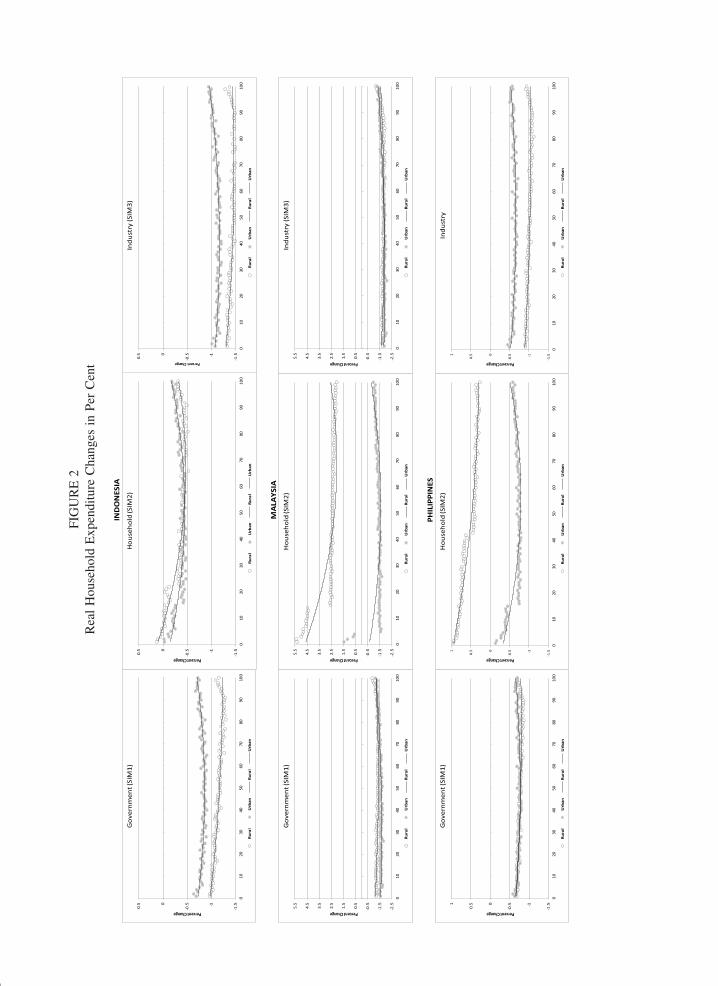
The overall impact on households can be seen from Table 3. However, to see the progressive or regressive nature of the carbon tax, it is necessary to disaggregate households further into 100 categories based on population percentile for both rural and urban areas. The percentile grouping goes from the poorest to richest based on their
respective initial total expenditure. Figure 2 illustrates the percentage change in real household consumption by percentile group.
To further understand the impact of a carbon tax policy on low income households, this paper also observes the impact of simulated poverty policies (percentage of those living below each country’s poverty line). The results can be seen in Table 6, which shows the poverty rate before and after each simulation.
4.1 Environmental and Macroeconomic Impacts
From Table 3, it can be seen that implementing a carbon tax with any recycling variants reduces carbon emissions, i.e. there is no indication of a rebound effect, at least in the short run. However, this gain for the environment may come at a cost in terms of contraction in the GDP as well as real household expenditure. Redistributing revenue generated to low-income households appears to alleviate the cost associated with the rising price of energy; but this comes at a cost in terms of greater GDP reduction in some cases. Furthermore, this type of recycling mechanism diminishes carbon emissions reduction. This is as expected due to the fact that redistributing revenue to low-income households increases their expenditure. Bearing in mind that households also produce carbon emissions through the consumption of fossil fuels, an increase in their expenditure thus entails an increase in their carbon emissions. This creates some level of “local” rebound, although not enough to affect the net effect.13
Of more interest is how a carbon tax affects each country differently. Determining which countries stand to gain the most from a carbon tax scheme is actually as one would expect, regardless of how the revenue generated might be redistributed. For Indonesia and Malaysia, a carbon tax has a positive effect on the overall economy. However, some sectors will more likely be adversely affected than others, namely the manufacturing sector followed by the agricultural sector; whereas the service sector will actually benefit from the implementation of a carbon tax — assuming that the government retains all the revenue generated
16-0494 JSEAE 01.indd 10 24/3/16 9:20 am

Apr 2016 Nurd ian to and Resosudarmo: Un i fo rm Carbon Tax i n ASEAN 11
TAB
LE
3M
acro
econ
omic
Res
ults
CO
2R
eal
GD
PR
eal
Sect
oral
Cha
nge
(%)
Rea
l H
ouse
hold
Exp
endi
ture
Cha
nge
(%)
%%
Agr
i.M
anuf
.Se
rv.
Rur
al-L
owU
rban
-Low
Rur
al-H
igh
Urb
an-H
igh
Gov
ernm
ent
(SIM
1)
Indo
nesi
a–3
.76
–0.2
5–0
.14
–0.3
2–0
.75
–1.1
6–1
.27
–1.2
6–0
.18
Mal
aysi
a–4
.06
–0.0
4–0
.01
–0.1
8–0
.46
–1.3
6–1
.54
–1.1
3–1
.35
Phili
ppin
es–2
.99
–0.0
4–0
.08
–0.4
3–0
.25
–0.7
7–0
.71
–0.7
7–0
.73
Sing
apor
e–0
.95
–0.0
1–0
.02
–0.3
5–0
.12
–0.3
2–0
.34
Tha
iland
–2.3
8–0
.14
–0.1
8–0
.74
–0.3
2–0
.91
–0.6
4–1
.14
–1.0
6V
ietn
am–6
.29
–0.3
3–0
.06
–1.1
2–0
.87
–1.8
4–1
.83
–1.7
7–1
.55
Hou
seho
ld (
SIM
2)
Indo
nesi
a–3
.46
–0.2
7–0
.01
–0.0
7–0
.47
–2.1
8–0
.12
–1.3
2–0
.96
Mal
aysi
a–3
.74
–0.0
6–0
.17
–0.0
7–0
.02
–7.1
6–0
.76
–1.3
6–1
.56
Phili
ppin
es–2
.82
–0.0
3–0
.05
–0.1
8–0
.07
–5.8
5–0
.43
–0.8
8–0
.96
Sing
apor
e–0
.88
–0.0
1–0
.04
–0.2
6–0
.09
–0.4
5–0
.37
Tha
iland
–2.0
8–0
.08
–0.0
1–0
.38
–0.1
4–3
.69
–0.3
9–1
.32
–1.5
3V
ietn
am–5
.77
–0.2
2–0
.14
–0.6
5–0
.32
–2.4
4–0
.26
–1.8
1–1
.81
Indu
stry
(SI
M3)
Indo
nesi
a–3
.34
–0.2
6–0
.02
–0.5
5–0
.12
–1.6
1–1
.66
–1.3
5–0
.32
Mal
aysi
a–4
.03
–0.0
4*
–0.2
4–0
.33
–2.7
6–2
.61
–0.7
8–0
.99
Phili
ppin
es–3
.35
–0.0
5–0
.09
–0.2
8–0
.12
–1.7
6–0
.63
–1.0
2–0
.66
Sing
apor
e–0
.94
–0.0
1–0
.05
–0.1
6–0
.02
–0.5
1–0
.22
Tha
iland
–2.4
9–0
.14
–0.1
2–0
.38
–0.0
4–2
.59
–1.3
5–2
.25
–0.7
7V
ietn
am–3
.67
–0.2
2–0
.24
–0.2
4–1
.19
–1.9
6–2
.62
–1.8
5–2
.65
Not
e: *
— N
eglig
ible
Val
ue
16-0494 JSEAE 01.indd 11 24/3/16 9:20 am

12 Journa l o f Sou theas t As ian Economie s Vo l . 33 , No . 1
TABLE 4Selected Sectoral Price Changes
Indonesia Malaysia Philippines Singapore Thailand Vietnam
Government (SIM1)
Coal 1.29 1.24 1.25 1.39 1.24 1.22Petroleum Products 1.19 1.11 1.13 1.07 1.08 1.15Manufactured Gas 1.01 1.02 1.01 1.03 1.02 1.01Electricity 1.03 1.03 1.03 1.02 1.02 1.01Transportation 1.02 1.02 1.01 1.01 1.01 1.06
Household (SIM2)
Coal 1.29 1.24 1.25 1.39 1.25 1.22Petroleum Products 1.19 1.12 1.13 1.07 1.08 1.15Manufactured Gas 1.01 1.02 1.01 1.03 1.01 1.01Electricity 1.03 1.03 1.03 1.02 1.02 1.01Transportation 1.02 1.02 1.01 1.01 1.01 1.06
Industry (SIM3)
Coal 1.34 1.22 1.12 1.27 1.14 1.78
Petroleum Products 1.04 0.98 0.87 0.97 0.89 1.56Manufactured Gas 1.06 1.01 0.87 0.99 0.91 1.55Electricity 1.08 1.01 0.89 0.98 0.91 1.54Transportation 1.06 1.01 0.88 0.97 0.91 1.62
and recycles it all back through its increase in expenditure.
All the other countries, on the other hand, exhibit a common pattern that is opposite to that of Indonesia and Malaysia. Although beneficial in terms of environmental improvement, it comes at the cost of a contraction to their respective economies. This is especially true in the case of Vietnam, as it will most likely suffer the most in terms of economic contraction with respect to all variants. Regarding sectoral changes, these countries also exhibit the same pattern as Indonesia and Malaysia, with the manufacturing sector most likely to be adversely affected, followed by the agricultural sector, which will most likely gain.
In terms of overall change, it is quite obvious why Indonesia and Malaysia are most likely to benefit as opposed to the other countries. In these countries, fuel is subsidized14 so that introducing a carbon tax is similar to reducing subsidies
(Yusuf and Resosudarmo 2008; Ahmad, Kadir and Shafie 2011). In other words, a carbon tax actually promotes efficiency by creating a less distortionary tax system in which the double-dividend hypothesis and the no-regret option apply. This is not true in the other countries as they do not subsidize to the extent of Indonesia and Malaysia. As such, introducing a carbon tax will most likely create a more distortionary tax system, with Vietnam suffering the most, followed by Thailand, the Philippines, and Singapore. The fact that the Philippines and Singapore do not subsidize fuel at all allows a more efficient adjustment to take place in their respective economies so that they do not suffer as much as Vietnam and Thailand.
Meanwhile, although recycling mechanisms do not affect the overall results in terms of emission reduction and economic contraction, they significantly affect sectoral changes and household expenditure. When part of the carbon
16-0494 JSEAE 01.indd 12 24/3/16 9:20 am

TAB
LE
5R
eal
Sect
oral
Val
ue-A
dded
Cha
nges
in
Per
Cen
t
Indo
nesi
aM
alay
sia
Phili
ppin
esSi
ngap
ore
Thai
land
Viet
nam
GO
V(S
IM1)
HO
U(S
IM2)
IND
(SIM
3)G
OV
(SIM
1)H
OU
(SIM
2)IN
D(S
IM3)
GO
V(S
IM1)
HO
U(S
IM2)
IND
(SIM
3)G
OV
(SIM
1)H
OU
(SIM
2)IN
D(S
IM3)
GO
V(S
IM1)
HO
U(S
IM2)
IND
(SIM
3)G
OV
(SIM
1)H
OU
(SIM
2)IN
D(S
IM3)
Agr
icul
ture
–0.1
20.
040.
000.
050.
150.
03–0
.06
0.07
–0.0
30.
020.
050.
06–0
.13
0.02
–0.0
60.
080.
210.
32
Farm
ing
–0.1
20.
07–0
.02
–0.0
20.
26–0
.07
–0.1
60.
04–0
.25
0.02
0.05
0.08
–0.2
7–0
.03
–0.1
4–0
.06
0.21
0.00
Fore
stry
–0.3
8–0
.20
0.07
0.06
0.12
0.10
–0.0
8–0
.02
–0.0
80.
010.
010.
02–0
.11
–0.0
1–0
.07
–0.2
8–0
.07
0.51
Fish
ing
–0.1
4–0
.04
–0.1
20.
020.
14–0
.03
–0.0
30.
03–0
.02
0.02
0.03
0.03
–0.1
8–0
.11
–0.1
9–0
.29
–0.0
40.
06
Coa
l–0
.02
–0.0
10.
00–0
.04
0.01
–0.0
2–0
.79
–0.7
7–0
.91
0.00
0.00
0.00
–0.2
9–0
.19
–0.2
6–0
.16
–0.0
60.
16O
il–0
.05
–0.0
4–0
.03
–0.0
3–0
.02
–0.0
3–0
.17
–0.1
6–0
.13
–0.0
4–0
.04
–0.0
3–0
.04
–0.0
2–0
.02
0.01
0.06
0.14
Gas
–0.0
10.
000.
000.
010.
010.
01–0
.96
–0.8
3–1
.04
0.00
0.00
0.00
–0.0
7–0
.01
–0.0
2–2
.96
–2.7
0–1
.43
Min
eral
s ne
c–0
.42
–0.2
7–0
.10
–0.9
0–0
.78
–0.6
5–0
.13
–0.0
9–0
.14
–0.4
9–0
.38
–0.2
9–0
.13
–0.0
7–0
.10
–1.4
0–1
.20
–0.3
0Fo
od a
nd b
ever
ages
–0.5
7–0
.06
–0.0
1–0
.25
–0.0
20.
04–0
.26
0.06
–0.0
60.
000.
150.
15–0
.43
–0.1
4–0
.08
–0.5
00.
100.
90Te
xtile
and
leat
her
prod
ucts
–1.5
3–0
.91
0.28
–0.6
1–0
.31
0.21
–0.4
3–0
.19
–0.1
8–0
.03
0.11
0.34
–0.5
4–0
.03
0.03
–0.5
00.
142.
66W
ood
and
pape
r pr
oduc
ts–0
.64
–0.3
50.
34–0
.37
–0.1
50.
07–0
.56
–0.4
3–0
.43
0.07
0.15
0.21
–0.5
8–0
.25
–0.1
4–0
.87
–0.5
00.
95Pe
trole
um a
nd c
oal
pro
duct
s–7
.65
–7.4
1–6
.96
–5.3
5–5
.08
–5.1
7–4
.63
–4.4
3–4
.99
–3.0
2–2
.90
–2.6
2–5
.03
–4.7
5–5
.14
–6.0
0–5
.45
–2.5
0
Che
mic
al, r
ubbe
r, an
d p
last
ic p
rodu
cts
–2.3
1–1
.68
–0.5
8–0
.64
–0.4
0–0
.17
–0.6
1–0
.40
–0.4
3–0
.86
–0.7
9–0
.69
–1.1
8–0
.81
–0.4
9–2
.47
–1.8
30.
52
Min
eral
pro
duct
s ne
c–2
.89
–2.3
9–1
.82
–2.0
0–1
.74
–1.7
5–2
.46
–2.2
2–3
.05
–0.1
1–0
.03
0.03
–2.1
4–1
.83
–2.1
3–2
.14
–1.6
9–1
.16
Met
al p
rodu
cts
–1.6
5–1
.14
–0.1
1–0
.99
–0.7
0–0
.28
–0.4
3–0
.25
–0.2
8–0
.26
–0.1
50.
14–1
.06
–0.6
8–0
.40
–3.2
5–2
.54
0.03
Man
ufac
turin
g–1
.45
–0.8
80.
15–0
.04
0.28
0.57
–0.3
2–0
.08
–0.1
30.
030.
120.
34–0
.46
–0.1
00.
13–1
.36
–0.7
50.
38
Elec
trici
ty–2
.01
–1.7
4–1
.78
–0.5
0–0
.32
–0.6
2–0
.96
–0.8
3–1
.04
–0.4
3–0
.41
–0.4
9–0
.59
–0.3
4–0
.62
–1.9
3–1
.23
–0.7
2G
as m
anuf
actu
re
dis
tribu
tion
–0.9
8–0
.76
–0.4
3–0
.36
–0.1
8–0
.30
–0.9
5–0
.83
–1.0
3–1
3.39
–13.
37–1
3.62
–0.6
4–0
.31
–0.4
9–2
.07
–1.3
7–0
.73
Wat
er–1
.83
–1.2
6–1
.45
0.02
0.04
0.01
–0.2
50.
00–0
.20
–0.0
70.
02–0
.04
–0.0
50.
08–0
.06
–0.7
20.
030.
15C
onst
ruct
ion
–0.9
9–0
.43
0.01
–1.2
4–1
.06
–1.3
9–0
.69
–0.4
3–2
.98
–0.2
6–0
.14
–0.1
2–1
.40
–1.0
0–2
.35
–1.3
3–1
.09
–5.0
6Tr
ade
–0.3
70.
10–0
.22
–0.3
80.
09–0
.07
–0.3
00.
01–0
.25
–0.0
60.
080.
06–0
.34
0.01
–0.3
3–1
.54
–0.9
10.
54Tr
ansp
orta
tion
–2.5
3–2
.19
–2.0
0–7
.68
–7.4
8–7
.32
–2.6
9–2
.52
–2.9
9–0
.47
–0.4
0–0
.32
–3.7
5–3
.41
–3.7
6–1
7.64
–17.
27–1
0.39
Com
mun
icat
ion
–0.5
2–0
.16
–0.0
8–0
.01
0.18
0.01
–0.4
9–0
.20
–0.4
60.
000.
050.
02–0
.37
–0.0
5–0
.28
–0.1
60.
391.
17Fi
nanc
ial s
ervi
ces
–0.6
6–0
.25
–0.0
51.
010.
680.
48–0
.53
–0.1
7–0
.52
0.09
0.15
0.23
–0.3
8–0
.01
–0.1
7–0
.59
0.15
1.02
Publ
ic a
dmin
istra
tion,
d
efen
ce, h
ealth
, and
e
duca
tion
10.3
05.
563.
128.
514.
462.
873.
972.
034.
181.
440.
780.
168.
474.
526.
329.
495.
36–0
.32
Dw
ellin
gs a
nd o
ther
s
ervi
ces
–0.2
10.
03–0
.12
0.16
0.26
0.17
–0.2
7–0
.10
–0.2
6–0
.01
0.06
0.02
–0.1
50.
08–0
.17
–1.0
1–0
.64
–0.1
9
16-0494 JSEAE 01.indd 13 24/3/16 9:20 am
FIG
UR
E 2
Rea
l H
ouse
hold
Exp
endi
ture
Cha
nges
in
Per
Cen
t
IND
ON
ESIA
MA
LAYS
IA
PHIL
IPPI
NES
0
0.5
010
2030
4050
6070
8090
100
Rura
lU
rban
Rura
lU
rban
0
0.5
010
2030
4050
6070
8090
100
Rura
lU
rban
Rura
lU
rban
0
0.5
010
2030
4050
6070
8090
100
Rura
lU
rban
Rura
lU
rban
0.5
1.5
2.5
3.5
4.5
5.5
010
2030
4050
6070
8090
100
Rura
lU
rban
Rura
lU
rban
0.5
1.5
2.5
3.5
4.5
5.5
010
2030
4050
6070
8090
100
Rura
lU
rban
Rura
lU
rban
0.5
1.5
2.5
3.5
4.5
5.5
010
2030
4050
6070
8090
100
Rura
lU
rban
Rura
lU
rban
0
0.51
010
2030
4050
6070
8090
100
Rura
lU
rban
Rura
lU
rban
0
0.51
010
2030
4050
6070
8090
100
Rura
lU
rban
Rura
lU
rban
0
0.51
010
2030
4050
6070
8090
100
Indu
stry
Rura
lU
rban
Rura
lU
rban
16-0494 JSEAE 01.indd 14 24/3/16 9:20 am
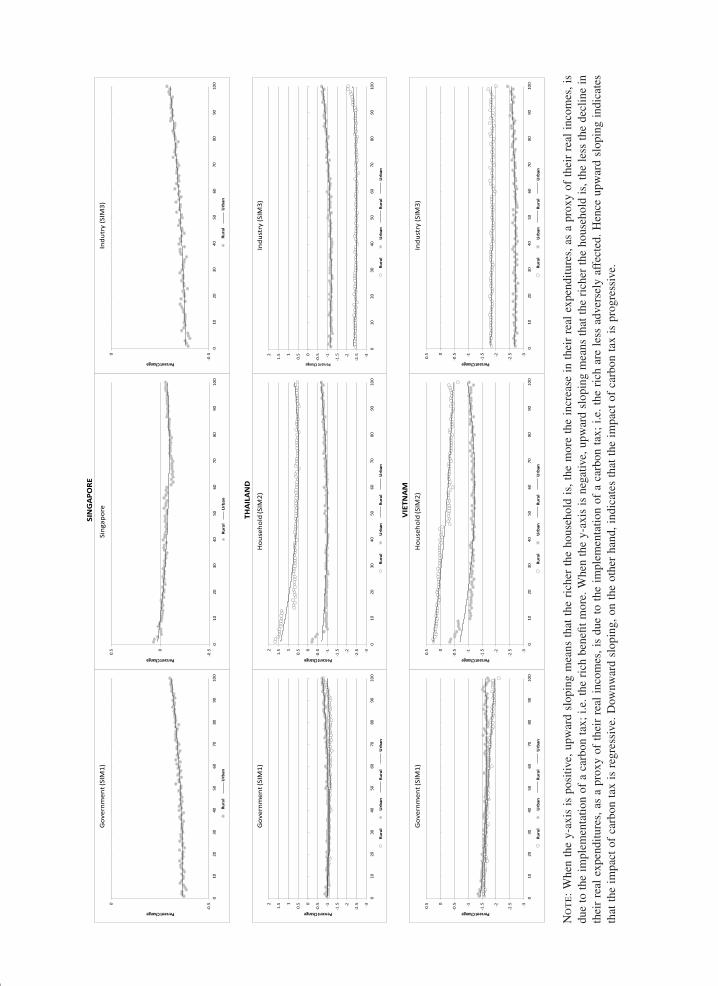
Not
e: W
hen
the
y-ax
is i
s po
sitiv
e, u
pwar
d sl
opin
g m
eans
tha
t th
e ri
cher
the
hou
seho
ld i
s, t
he m
ore
the
incr
ease
in
thei
r re
al e
xpen
ditu
res,
as
a pr
oxy
of t
heir
rea
l in
com
es, i
s du
e to
the
im
plem
enta
tion
of a
car
bon
tax;
i.e
. the
ric
h be
nefit
mor
e. W
hen
the
y-ax
is i
s ne
gativ
e, u
pwar
d sl
opin
g m
eans
tha
t th
e ri
cher
the
hou
seho
ld i
s, t
he l
ess
the
decl
ine
in
thei
r re
al e
xpen
ditu
res,
as
a pr
oxy
of t
heir
rea
l in
com
es, i
s du
e to
the
im
plem
enta
tion
of a
car
bon
tax;
i.e
. the
ric
h ar
e le
ss a
dver
sely
aff
ecte
d. H
ence
upw
ard
slop
ing
indi
cate
s th
at t
he i
mpa
ct o
f ca
rbon
tax
is
regr
essi
ve. D
ownw
ard
slop
ing,
on
the
othe
r ha
nd, i
ndic
ates
tha
t th
e im
pact
of
carb
on t
ax i
s pr
ogre
ssiv
e.
VIE
TNA
M
SIN
GA
PORE
THA
ILA
ND
0
010
2030
4050
6070
8090
100
Rura
lU
rban
0
010
2030
4050
6070
8090
100
Rura
lU
rban
0
0.51
1.52
010
2030
4050
6070
8090
100
Rura
lU
rban
Rura
lU
rban
0
0.51
1.52
010
2030
4050
6070
8090
100
Rura
lU
rban
Rura
lU
rban
0
0.51
1.52
010
2030
4050
6070
8090
100
Rura
lU
rban
Rura
lU
rban
0
0.5
010
2030
4050
6070
8090
100
Rura
lU
rban
Rura
lU
rban
0
0.5
010
2030
4050
6070
8090
100
Rura
lU
rban
Rura
lU
rban
0
0.5
010
2030
4050
6070
8090
100
Rura
lU
rban
Rura
lU
rban
0
0.5
010
2030
4050
6070
8090
100
Sing
apor
e
Rura
lU
rban
16-0494 JSEAE 01.indd 15 24/3/16 9:20 am

16 Journa l o f Sou theas t As ian Economie s Vo l . 33 , No . 1
tax revenue is recycled back to low-income households in both rural and urban areas (SIM2), the first thing to note is that these two household groups are no longer as adversely affected as before. Those in the lower income bracket are somewhat compensated by the changes as they are given a lump sum cash transfer by their respective governments. As household expenditure patterns are different from government expenditure patterns, this in turn changes the sectoral output as the household consumption share is higher for manufacturing and agricultural goods than for services, compared to the government consumption share pattern. As such, these two sectors are somewhat compensated by increased consumption as opposed to the previous recycling mechanism.
As for the third recycling mechanism (SIM3) where the government reduces indirect taxes, the first obvious thing to note is that households are no longer compensated, so that their expenditure consumption pattern changes are closer to the first recycling mechanism. However, changes in sectoral output are more erratic as a few things are happening at the same time, e.g. carbon sales tax, indirect taxes and price changes.
One final important thing to note is that the recycling mechanisms do not have much impact on the overall results, in terms of carbon emission reduction and real GDP change, which is logical. As such, in terms of overall achievement, recycling mechanisms do not matter, although for practical policy purposes, they become very important in terms of feasibility and acceptability.
4.2 Price and Industrial Impacts
Table 4 shows that once a carbon tax is implemented, the price of coal, petroleum products, and manufactured gas immediately increases. The price of coal increases the most followed by petroleum products and manufactured gas, as coal is the “dirtiest” in terms of CO2 content compared to the others. Changes in these commodity prices have a secondary effect, with the electricity and transportation sectors affected the most as these two sectors are the largest energy users. The logic is quite straightforward with regard to the first two recycling mechanisms but not with the third (SIM3).15
When the third recycling mechanism is implemented, other changes occur simultaneously
TABLE 6Poverty Rate in Per Cent
Initial Government Household Industry(SIM1) (SIM2) (SIM3)
Indonesia Rural 21.1 21.52 21.13 21.65Urban 14.4 14.67 14.50 14.78
Malaysia Rural 13.2 13.84 19.38 16.71Urban 13.8 14.08 13.72 14.53
Philippines Rural 41.4 42.50 40.65 41.33Urban 15.0 15.27 15.19 15.23
Thailand Rural 12.6 13.04 12.07 14.78Urban 14.0 15.31 15.28 15.37
Vietnam Rural 45.0 49.11 45.64 49.16Urban 19.0 19.32 19.15 19.58
Note: Singapore is not included in the table and subsequent analysis as it does not have an existing poverty incidence.
16-0494 JSEAE 01.indd 16 24/3/16 9:20 am

Apr 2016 Nurd ian to and Resosudarmo: Un i fo rm Carbon Tax i n ASEAN 17
that affect prices. Indirect tax reductions directly affect production activities, meaning that prices change in a different way to the other two recycling mechanisms. As indirect taxes differ greatly between countries, e.g. the existence of fuel subsidies in Indonesia and Malaysia, the third recycling mechanism affects the same sectors differently across countries.
Table 5 shows that the manufacturing sectors undergo a general contraction. Meanwhile, the agricultural sectors are not affected as much, whereas service sectors generally contract, with the exception of government-related sectors. This implies that households that rely on income from the manufacturing sector are likely to suffer the most from an income reduction, which in turn reduces their ability to consume. Meanwhile, those in the agricultural sector will most likely be unaffected income-wise, although price changes may still affect their consumption level. Those who are most likely to gain are households in the service sector, particularly government-related sectors such as defense, health, and education.
4.3 Distributional Impacts
Bear in mind, a carbon tax is generally regressive in developed countries and less so in developing countries (Shah and Larsen 1992; Brenner, Riddle and Boyce 2007; Yusuf and Resosudarmo 2015). Although most ASEAN countries would fall under the developing country category, with the exception of Singapore, a quick glance at Figure 2 may not provide such a straightforward answer. Singapore, understandably the most developed country in the region, shows clearly the regressive nature of the carbon tax. Moving to the right on the horizontal axis, the trend shows an upward sloping line that indicates how the richer the household is, the less adversely affected it is by the implementation of a carbon tax.
Vietnam, on the other hand, clearly shows the opposite, so that the richer the household is, the more adversely affected it is by the implementation of a carbon tax. This is, of course, in accordance with the fact that Vietnam is the least developed country in the region in economic terms.
For Indonesia, Malaysia, the Philippines and Thailand, the results are not as clear, exhibiting a U-shape pattern. Although seemingly contradictory, the results are to be expected. These four countries fall neither under the high-income or developed country category such as Singapore nor under the low-income or developing category such as Vietnam. They are transitional economies, right in between those two categories.
The U-shape actually shows that those who are relatively poorer in their respective countries exhibit the same pattern as Vietnam does in representing a developing country in which a carbon tax is progressive; thus a downward sloping trend line. However, the few at the right end of the horizontal axis, i.e. the rich and richest, actually exhibit the same pattern as Singapore does in representing a developed country in which a carbon tax is regressive; thus an upward sloping trend line. Hence, this U-shape might demonstrate the typical impact of a carbon tax in middle-income and upper low-income countries.
Furthermore, for Indonesia, the Philippines and Thailand, those living in rural areas are more adversely affected than those living in urban areas. The reverse is true for Malaysia. This difference arises from the population composition, with Malaysia being more urbanized than the others so that the overall adverse effect is greater in urban than in rural areas. Nevertheless, the U-shape pattern holds and the turning point in Malaysia occurs sooner for those in urban areas compared to the other three countries.
Moreover, Figure 2 also shows the results when the second recycling mechanism (SIM2) is implemented. It shows that households are better off as they are less adversely affected by the carbon tax than in the previous scenario (SIM1). This is because in the second recycling policy, low-income households are given a one-time, lump-sum cash transfer. In Malaysia, the Philippines, Thailand, and Vietnam, rural households are much better off than urban households in Indonesia. This difference can easily be explained as low-income rural households receive a much greater share than low-income urban households as the share transfer is based on the poverty incidence ratio. In these
16-0494 JSEAE 01.indd 17 24/3/16 9:20 am
18 Journa l o f Sou theas t As ian Economie s Vo l . 33 , No . 1
countries, rural households receive at least twice the cash transfer in total of urban households. As for Indonesia, although more transfers are made in rural areas, the amount is less than twice that of urban households.
As for the third recycling mechanism (SIM3), Figure 2 shows that it is somewhat harder to find a similar pattern in this case because it does not directly affect households. Changes to households are the result of changes in the industrial sector. As such, it is much harder to predict the impact on households. However, the U-shape pattern holds for Indonesia, Malaysia, the Philippines, and Thailand although they are all affected in different ways; with Vietnam beginning to show the same U-shape pattern. Meanwhile, Singapore exhibits the same pattern as in the first recycling mechanism.
From Table 6, it is clear that without any direct compensation to households, as in SIM1 and SIM3, the poverty incidence in all countries increases, both in rural and urban areas. On the other hand, in some cases, the government can reduce the poverty rate if poor households are compensated through a direct fund transfer scheme (SIM2). Even in cases where the poverty incidence increases, the adverse effect is still less when compared to other recycling mechanisms.
5. Conclusions and Policy Implications
The main goal of this study is to understand the impact of coordinated and non-coordinated carbon tax policies on the economy and environmental performance of each country within ASEAN. This question is a relevant one, since, first, though progress has been slow, the ASEAN community will most likely soon have to synchronize various policies; and second, some ASEAN member countries are among the top polluters in terms of CO2 emissions, so much so that they will have to react soon to control their emissions.
In order to answer the above question, a multi-country CGE model for ASEAN, known as the IRSA-ASEAN, has been constructed. An ASEAN-SAM was also constructed previously as the main dataset for the CGE. This ASEAN-SAM is one of
the first comprehensive data systems available for ASEAN, and hence the IRSA-ASEAN becomes one of the more comprehensive economic models for the region. Through the IRSA-ASEAN, a few conclusions can be reached with regard to the implementation of a carbon tax in ASEAN. First, in general and at least in the short-run period, a carbon tax is an effective way of reducing carbon emissions. For most ASEAN countries, even if the revenue from this tax is recycled back to the economy, it does not seem to induce a rebound effect, i.e. more use of energy and so more emissions.
Second, it is not obvious that ASEAN countries can always expect a double-dividend phenomenon to occur when they implement a combination of a carbon tax and a recycling policy. It is quite likely that implementing a carbon tax will lead to economic contraction in these countries. Recycling the carbon tax revenue, although of utmost importance in terms of softening the impact of this policy on economic growth and household incomes, does not always induce a double-dividend phenomenon. This implies that the phenomenon must be taken into consideration not only in absolute but also in relative terms, if ASEAN countries are to find the first best solution among the different policy options.
Third, as each country responds differently to the implementation of a carbon tax, particularly with regards to revenue re-distribution, an across the board implementation will create “winners” and “losers”. Indonesia and Malaysia are the potential winners as during the period of this paper’s analysis they subsidize their respective energy sectors, meaning that a carbon tax actually acts as a compensatory mechanism that will promote efficiency and a less distortionary tax system, or in this case one arising from an energy sector subsidy.16 Vietnam is the likely loser as the implementation of a carbon tax creates an additional distortionary tax with the only possible gain in terms of environmental improvement, which comes at a great cost in terms of a relatively large economic reduction. The Philippines, Singapore and Thailand can still gain from the implementation, depending on what
16-0494 JSEAE 01.indd 18 24/3/16 9:20 am

Apr 2016 Nurd ian to and Resosudarmo: Un i fo rm Carbon Tax i n ASEAN 19
their respective governments do with the revenue. Although an economic reduction is unavoidable, the cost is not that great, and also comes with great benefits in terms environmental improvement and social equity.
Fourth, in terms of distributional impact, a carbon tax is strictly progressive in Vietnam and strictly regressive in Singapore. For Indonesia, Malaysia, the Philippines, and Thailand a carbon tax is progressive for those in up to the 70 to 90 percentile income group and regressive for those at the right-end tail, or higher, income group.
Fifth, in terms of poverty, without direct compensation to households, a carbon tax will increase the poverty incidence in all countries. Although a carbon tax may still adversely affect households, even with direct compensation to poor households, the impact will be mitigated. In fact, in some cases, such a transfer would actually decrease the existing poverty incidence in a country. As such, of all the possible recycling mechanisms, direct compensation to poor households may be the most feasible and acceptable option in political, economic, and social terms.
The policy recommendations are as follows. First, ASEAN countries are encouraged to implement a carbon tax policy, as it is an effective
mechanism to reduce CO2 emissions, at least in the short run. However, for cases such as the Philippines, Singapore, Thailand and Vietnam, this gain for the environment comes at a price in terms of economic contraction. As such, a carbon tax may be effective to reduce CO2 emissions, but could be politically difficult to implement.
Second, ASEAN countries might want to recycle revenues from a carbon tax back to low income households and those adversely affected in their countries — complicated as this might be — as the implementation of a carbon tax does induce losses in some sectors, as well as adversely affecting certain segments of society.
Acknowledgement
The authors would like to thank the Economy and Environment Program for Southeast Asia (EEPSEA) for providing financial support for this research. Nurdianto contributed to the paper in his personal capacity. The views and opinions expressed in the paper do not necessarily reflect the official policy or position of the Ministry of Foreign Affairs or other Indonesian government agency. All mistakes are the authors’ own responsibility.
NOTES
1. In this paper, the definition of a carbon tax is limited to a levy on the emission of carbon dioxide only; and thus, the term “carbon tax” refers to a CO2 tax and is used interchangeably.
2. Also note that a policy to reduce deforestation is also an important climate change policy for ASEAN. However, this will be important mostly for Indonesia and Malaysia.
3. Brunei Darussalam, Cambodia, Lao PDR and Myanmar are not included due to the severe lack of data. 4. This is in line with real world evidence in which unlike the EU, ASEAN is not a supranational organization. 5. Note that the word “domestic” composite here refers to goods from within the country and within ASEAN. 6. The word “import” refers to extra-ASEAN imports. 7. The model does not specifically deal with non-tariff barriers, or assumes the levels of non-tariff barrier in each
country in the model do not change throughout the policy simulation scenarios. 8. Note that the model does not take into account CO2 emissions from land use change and deforestation since in
this paper, carbon tax paper is expected to only be applied to coal, petroleum products and manufactured gas. 9. The terms “rural” and “urban” are quite straightforward, while the terms “low” and “high” refer neither to the
poverty line nor half of the population. The terms instead refer to those below and above the average income per capita or (whenever possible) the average income per household respectively.
10. Complete equations of the CGE Model can be seen in Nurdianto and Resosudarmo (2014), which is available at <http://lp3e.fe.unpad.ac.id/wopeds/201411.pdf>.
11. Since the number of poor households in Singapore is trivial, in this case only the cash transfer is distributed to all low-income households.
16-0494 JSEAE 01.indd 19 24/3/16 9:20 am

20 Journa l o f Sou theas t As ian Economie s Vo l . 33 , No . 1
12. Typically between one to four years.13. The different reduction of CO2 emission among the three scenarios (SIM1, SIM2 and SIM3) is due to the
differing consumption patterns of government, households and industry. Industry’s consumption pattern is the most energy intensive and creates the highest “local” rebound. Government’s consumption pattern is the least energy intensive and so creates the least “local” rebound.
14. Malaysia and Indonesia have removed fuel subsidies in December 2014 and January 2015, respectively, and are using a managed float. Results in this paper apply when these two countries implemented subsidies on fuel.
15. This result might have something to do with the difference in the level of relative energy intensity (in terms of monetary units) and energy demand elasticity by industries in ASEAN countries in the model. For example, the higher prices in Vietnam might be due to the fact that their industries tend to spend relatively more on energy and have relatively more inelastic energy demands than other ASEAN countries.
16. Another important issue to be discussed is the impact of removal energy subsidy policy in Indonesia and Malaysia. However, discussing subsidy removals is beyond the limits of this paper.
REFERENCES
Adams, P., J. Horridge and B. Parmenter. “MMRF-GREEN: A Dynamic, Multi-sectoral, Multi-regional Model of Australia”. Centre of Policy Studies/IMPACT Centre Working Papers no. Op-94. Clayton: The Centre of Policy Studies, Monash University, 2000.
Ahmad, S., Kadir, M.Z.A.A. and Shafie S. “Current Perspective of the Renewable Energy Development in Malaysia”. Renewable and Sustainable Energy Reviews 15, no. 2 (2011): 897–904.
ADB. The Economics of Climate Change in Southeast Asia: A Regional Review. Manila: Asian Development Bank, 2009.
ASEAN. Declaration on Climate Change, Energy, and the Environment. Singapore: Association of Southeast Asian Nations, 2007.
———. Fourth ASEAN State of the Environment Report 2009. Jakarta: ASEAN Secretariat, 2009.ASEAN+3 Research Group. Fiscal and Financial Impacts of the Climate Change and Policy Challenges in East Asia,
Hanoi: National Institute of Finance, Ministry of Finance, Vietnam, 2011 <http://www.asean.org/storage/images/archive/documents/ASEAN+3RG/1011/FR/20.pdf>.
Baranzini, A., J. Goldemberg and S. Speck. “A Future for Carbon Taxes”. Ecological Economics 32, no. 3 (2000): 395–412.
Barker, T., P. Ekins, and T. Foxon. “Macroeconomic Effects of efficiency Policies for Energy-Intensive industries: The Case of the UK Climate Change Agreements, 2000–2010”. Energy Economics 29 (2007): 760–78.
Bovenberg, A.L. “Green Tax Reforms and the Double Dividend: an Updated Reader’s Guide”. International Tax and Public Finance 6 (1999): 421–43.
Brännlund, R. and J. Nordstrom. “Carbon Tax Simulations Using a Household Demand Model”. European Economic Review 48, no. 1 (2004): 211–33.
———, T. Ghalwash, and J. Nordström. “Increased Energy Efficiency and the Rebound Effect: Effects on Consumption and Emissions”. Energy Economics 29 (2007): 1–17.
Brenner, M.D., M. Riddle, and J.K. Boyce. “A Chinese Sky Trust? Distributional Impacts of Carbon Charges and Revenue Recycling in China”. Energy Policy 35, no. 3 (2007): 1771–84.
Callan, T., S. Lyons, S. Scott, R.S.J. Tol and S. Verde. “The Distributional Implication of a Carbon Tax in Ireland”. Energy Policy 37, no. 2 (2009): 407–12.
Corong, E. “Tariff Reductions, Carbon Emissions, and Poverty: An Economy-wide Assessment of the Philippines”. ASEAN Economic Bulletin 25, no. 1 (2008): 20–31.
Cororaton, C. and E. Corong. Philippine Agricultural and Food Policies: Implications on Poverty and Income Distribution. Washington, D.C: International Food Policy Research Institute, 2009.
Coxhead, I., A. Wattanakuljarus and N.V. Chan. “Are carbon taxes good for the poor? A general equilibrium analysis for Vietnam”. World Development 51, no. 1 (2013): 119–31.
Glomm, G., D. Kawaguchi and F. Sepulveda. “Green taxes and double dividends in a dynamic economy”. Journal of Policy Modelling 30 (2008): 19–32.
Goulder, L.H. “Environmental Taxation and the ‘Double Dividend’: A Reader’s Guide”. International Tax and Public Finance 2, no. 2 (1995): 157–83.
Grainger, C.A. and C.D. Kolstad. “Who Pays a Price on Carbon?”. NBER Working Paper no. 15239. Cambridge, MA: National Bureau of Economic Research, 2009.
16-0494 JSEAE 01.indd 20 24/3/16 9:20 am
Apr 2016 Nurd ian to and Resosudarmo: Un i fo rm Carbon Tax i n ASEAN 21
Hamilton, K. and G. Cameron. “Simulating the Distributional Effects of a Canadian Carbon Tax”. Canadian Public Policy 20, no. 4 (1994): 385–99.
Hertel, T.W. Global Trade Analysis: Modeling and Applications. Cambridge: Cambridge University Press, 1997.Holm, S. and G. Englund. “Increased Ecoefficiency and Gross Rebound Effect: Evidence from USA and Six European
Countries 1960–2002”. Ecological Economics 68 (2009): 879–87.Indonesian Ministry of Finance. Indonesia Green Paper: Economic and Fiscal Policy Strategies for Climate Change
Mitigation in Indonesia. Jakarta: Ministry of Finance of the Republic of Indonesia and Australia Indonesia Partnership, 2009.
IPCC, OECD and IEA. IPCC Guidelines for National Greenhouse Gas Inventories. Paris: Intergovernmental Panel on Climate Change, Organization for Economic Cooperation and Development and International Energy Agency, 1997.
Jotzo, F. and S. Mazouz. “Indonesia’s Climate Change Challenge: Economic Policy for Effective and Efficient Mitigation”. Indonesian Quarterly 38, no. 1 (2010): 23–40.
Khoman, T. “ASEAN Conception and Evolution”. In The ASEAN Reader, compiled by Sharon Siddique et al. Singapore: Institute of Southeast Asian Studies, 1992.
Lai, Y. “Is a Double Dividend Better than a Single Dividend?”. Journal of Institutional and Theoretical Economics 165 (2009): 342–63.
Leach, A.J. “The Welfare Implications of Climate Change Policy”. Journal of Environmental Economics and Management 57, no. 2 (2009): 151–65.
Lee, H. “The Combustion-Based CO2 Emissions Data for GTAP Version 7 Data Base, Center for Global Trade Analysis”. West Lafayette, IN: Purdue University, 2008.
Letchumanan, R. “Is there an ASEAN Policy on Climate Change.” In Climate Change: Is Southeast Asia Up to the Challenge?. LSE IDEAS Special Reports no. SR004. London: London School of Economics, 2010 <http://www.lse.ac.uk/IDEAS/publications/reports/pdf/SR004/ASEC.pdf>.
Lewis, J.D. “A Computable General Equilibrium (CGE) Model of Indonesia”. HIID Series of Development Discussion Papers no. 378. Cambridge, MA: Harvard Institute of International Development, 1991.
Li, J.C. “A 1998 Social Accounting Matrix (SAM) for Thailand”. Trade and Macroeconomic Division Discussion Paper no. 95. Washington, D.C: International Food Policy Research Institute, 2002.
McDonald, S., K. Thierfelder and S. Robinson. “Globe: A SAM Based Global CGE Model using GTAP Data”. USNA Departmental Working Paper. Annapolis: United States Naval Academy Department of Economics, 2007.
Metschies, G.P.M. “International Fuel Prices 2005: 4th Edition – 172 Countries”. Eschborn: Deutsche Gesellschaft für Technische Zusammenarbeit (GTZ) as commissioned by Federal Ministry for Economic Cooperation and Development, 2005.
Mizobuchi, K. “An Empirical Study on the Rebound Effect Considering Capital Costs”. Energy Economics 30 (2008): 2486–516.
Morada, N.M. “ASEAN at 40: Prospects for Community Building in Southeast Asia”. Asia-Pacific Review 15, no. 1 (2008): 36–55.
Morgenstern, R. “Environmental Taxes: Dead or Alive”. Discussion Paper no. 96-03. Washington, D.C: Resources for the Future, 1995.
Nielsen, C.P. “Social Accounting Matrices for Vietnam 1996 and 1997”. Trade and Macroeconomic Division Discussion Paper no. 86. Washington, D.C: International Food Policy Research Institute, 2002.
Nurdianto, D.A. and B.P. Resosudarmo. “The Inter-Regional System of Analysis for ASEAN: A Manual”. Working Papers in Economics and Development Studies (WoPEDS) no. 201411. Bandung: Department of Economics, Padjadjaran University, 2014 <http://lp3e.fe.unpad.ac.id/wopeds/201411.pdf>.
Ojha, V.P. “Carbon Emissions Reduction Strategies and Poverty Alleviation in India”. Environment and Development Economics 14, no. 3 (2009): 323–48.
Oladosu, G. and A. Rose. “Income Distribution Impacts of Climate Change Mitigation Policy in the Susquehanna River Basin Economy”. Energy Economics 29, no. 3 (2007): 520–44.
Patuellia, R., P. Nijkampb and E. Pelsb. “Environmental Tax Reform and the Double Dividend: A Meta-Analytical Performance Assessment”. Ecological Economics 55 (2005): 564–83.
Pearce, D.W. “The Role of Carbon Taxes in Adjusting to Global Warming”. Economic Journal 101 (1991): 938–48.Pearson, M. and S. Smith. “The European Carbon Tax: An Assessment of the European Commission’s Proposals”.
London: Institute for Fiscal Studies, 1991.Poterba, J.M. “Is the Gasoline Tax Regressive?”. NBER Working Papers no. 3578. Cambridge, MA: National Bureau
of Economic Research, 1991.
16-0494 JSEAE 01.indd 21 24/3/16 9:20 am

22 Journa l o f Sou theas t As ian Economie s Vo l . 33 , No . 1
Pyatt, G., J.I. Round, and J. Denes. “Improving the Macroeconomic Data Base: A SAM for Malaysia, 1970”. World Bank Staff Working Paper no. 646. Washington, D.C: International Bank for Reconstruction and Development, 1984.
Ratha, D. and W. Shaw. “South-South Migration and Remittances”. World Bank Working Paper no. 102. Washington, D.C: International Bank for Reconstruction and Development, 2007.
Resosudarmo, B.P., A. Ramayandi, A.A. Yusuf and M.D. Siyaranamual. “Technical Note and Manual for Inter Regional System of Analysis for Indonesia in Five Regions (IRSA-Indonesia5)”. 2008.
———, A.A. Yusuf, D. Hartono and D.A. Nudianto. “Regional Economic Modelling for Indonesia: Implementation of IRSA-INDONESIA5”. Journal of Indonesian Economy and Business 26, no. 3 (2011): 287–309.
Schob, R. “The Double-Dividend Hypothesis of Environmental Taxes: A Survey”. In The International Yearbook of Environmental and Resource Economics 2005/2006: A Survey of Current Issue, edited by H. Folmer and T. Tientenberg, pp. 223–79. Cheltenham: Edward Elgar, 2005.
Shah, A. and B. Larsen. “Carbon Taxes, the Greenhouse Effect, and Developing Countries”. Policy Research Working Paper Series no. 957, The World Bank, 1992.
Simon, S. “ASEAN and Multilateralism: The Long, Bumpy Road to Community”. Contemporary Southeast Asia: A Journal of International and Strategic Affairs 30 no. 2 (2008): 264–92.
Sorrell, S. “The Rebound Effect: Definition and Estimation”. In International Handbook on the Economics of Energy, edited by Evans, J. and Hunt, L.C., pp. 199–233. Cheltenham: Edward Elgar, 2009.
——— and J. Dimitropoulos. “The Rebound Effect: Microeconomic Definitions, Limitations, and Extensions”. Ecological Economics 65 (2008): 636–49.
Stern, N. Stern Review: The Economics of Climate Change. London: H.M. Treasury, 2006.Welsch, H. “The Carbon Tax game: Differential Tax Recycling in a Two-Region General Equilibrium Model of the
European Community”. Weltwirtschaftliches Archiv 132, no. 2 (1996): 356–77.World Bank. Climate Change and Fiscal Policy: A Report for APEC. Washington, D.C.: Office of the Chief Economist
East Asia and Pacific, World Bank, 2010.Yusuf, A.A. and B.P. Resosudarmo. “Mitigating Distributional Impact of Fuel Pricing Reform: The Indonesian
Experience”. ASEAN Economic Bulletin 25, no. 1 (2008): 32–47.——— and B.P. Resosudarmo. “On the Distributional Effect of Carbon Tax in Developing Countries: The Case of
Indonesia”. Environmental Economics and Policy Studies 17 (2015): 131–56.
16-0494 JSEAE 01.indd 22 24/3/16 9:20 am

Reproduced with permission of the copyright owner. Further reproduction prohibited withoutpermission.


![TRN AC-DC iVS Release 1.3 (2020-03-02).ppt [Read-Only] · 11.0v k 17a 31a 68a 136.3a 10a 4a 1a 1a 1a 9.9 - 12.1 12.0V L 17A 30A 62.5A 125A 10A 4A 1A 1A 1A 10.8 - 13.2 14.0V M 14A](https://static.fdocuments.in/doc/165x107/5edf2442ad6a402d666a7dfa/trn-ac-dc-ivs-release-13-2020-03-02ppt-read-only-110v-k-17a-31a-68a-1363a.jpg)