
doi: 10.1007/978-1-4939-7216-6 2
36
Chapter 2 Comparative Genomics as a Foundation for Evo-Devo Studies in Birds Phil Grayson, Simon Y.W. Sin, Timothy B. Sackton, and Scott V. Edwards Abstract Developmental genomics is a rapidly growing field, and high-quality genomes are a useful foundation for comparative developmental studies. A high-quality genome forms an essential reference onto which the data from numerous assays and experiments, including ChIP-seq, ATAC-seq, and RNA-seq, can be mapped. A genome also streamlines and simplifies the development of primers used to amplify putative regulatory regions for enhancer screens, cDNA probes for in situ hybridization, microRNAs (miRNAs) or short hairpin RNAs (shRNA) for RNA interference (RNAi) knockdowns, mRNAs for misexpression studies, and even guide RNAs (gRNAs) for CRISPR knockouts. Finally, much can be gleaned from comparative genomics alone, including the identification of highly conserved putative regulatory regions. This chapter provides an overview of laboratory and bioinformatics protocols for DNA extraction, library preparation, library quantification, and genome assembly, from fresh or frozen tissue to a draft avian genome. Generating a high-quality draft genome can provide a developmental research group with excellent resources for their study organism, opening the doors to many additional assays and experiments. Key words Genome assembly, Library preparation, Avian, Bird, Developmental genomics, ALLPATHS-LG, Comparative genomics 1 Introduction 1.1 Avian Developmental and Genomic Resources A long history of study has made the chicken into an important model for analyzing developmental patterns and processes across diverse time scales and cell types [1]. Avian developmental biology is not limited to chicken: developmental staging systems for quail, zebra finch, and emu are also available [2–4]. Arguably one of the most important advancements for developmental or molecular avian research was the sequencing of the chicken (Gallus gallus) genome in 2004 [5]. In the 10 years that followed, more than 50 additional avian genomes have been published, most of them with the December 2014 release of the Science Special Issue, “A Flock of Genomes,” examining data from 48 bird species (see [6, 7]). The last 2 years have seen an increasing rate of avian genome Guojun Sheng (ed.), Avian and Reptilian Developmental Biology: Methods and Protocols, Methods in Molecular Biology, vol. 1650, DOI 10.1007/978-1-4939-7216-6_2, © Springer Science+Business Media LLC 2017 11
Transcript of doi: 10.1007/978-1-4939-7216-6 2

Chapter 2
Comparative Genomics as a Foundation for Evo-DevoStudies in Birds
Phil Grayson, Simon Y.W. Sin, Timothy B. Sackton, and Scott V. Edwards
Abstract
Developmental genomics is a rapidly growing field, and high-quality genomes are a useful foundation forcomparative developmental studies. A high-quality genome forms an essential reference onto which thedata from numerous assays and experiments, including ChIP-seq, ATAC-seq, and RNA-seq, can bemapped. A genome also streamlines and simplifies the development of primers used to amplify putativeregulatory regions for enhancer screens, cDNA probes for in situ hybridization, microRNAs (miRNAs) orshort hairpin RNAs (shRNA) for RNA interference (RNAi) knockdowns, mRNAs for misexpressionstudies, and even guide RNAs (gRNAs) for CRISPR knockouts. Finally, much can be gleaned fromcomparative genomics alone, including the identification of highly conserved putative regulatory regions.This chapter provides an overview of laboratory and bioinformatics protocols for DNA extraction, librarypreparation, library quantification, and genome assembly, from fresh or frozen tissue to a draft aviangenome. Generating a high-quality draft genome can provide a developmental research group withexcellent resources for their study organism, opening the doors to many additional assays and experiments.
Key words Genome assembly, Library preparation, Avian, Bird, Developmental genomics,ALLPATHS-LG, Comparative genomics
1 Introduction
1.1 Avian
Developmental
and Genomic
Resources
A long history of study has made the chicken into an importantmodel for analyzing developmental patterns and processes acrossdiverse time scales and cell types [1]. Avian developmental biologyis not limited to chicken: developmental staging systems for quail,zebra finch, and emu are also available [2–4]. Arguably one of themost important advancements for developmental or molecularavian research was the sequencing of the chicken (Gallus gallus)genome in 2004 [5]. In the 10 years that followed, more than 50additional avian genomes have been published, most of them withthe December 2014 release of the Science Special Issue, “A Flock ofGenomes,” examining data from 48 bird species (see [6, 7]). Thelast 2 years have seen an increasing rate of avian genome
Guojun Sheng (ed.), Avian and Reptilian Developmental Biology: Methods and Protocols, Methods in Molecular Biology,vol. 1650, DOI 10.1007/978-1-4939-7216-6_2, © Springer Science+Business Media LLC 2017
11

sequencing; at the time of writing, the total number of draft birdgenomes available in public databases has soared to over 70. Withan eventual goal of generating draft genomes of all 10,500 speciesof living birds, the Bird 10,000 Genomes (B10K) project haspromised to increase this total even more rapidly [8].
1.2 Avian Genomes Avian genomes are relatively small, around 1–1.26 Gb, and low inrepetitive elements compared to other amniotes [6, 9]. These twofactors make achieving high-quality reference genomes relativelystraightforward for research groups with the necessary protocolsand infrastructure, including a few key instruments for librarypreparation and quantification, and access to Illumina sequencingmachines. In the last several years, our laboratory has produced anumber of high-quality draft genomes of birds. Each genome hasrequired approximately two full lanes of Illumina HiSeq 2500 v4high-output sequencing to achieve reasonable coverage and quality.The ALLPATHS-LG assembly approach [10] used by our groupmade a strong showing during the Assemblathon 2 comparativestudy of assembly methods and has since been applied frequentlyacross diverse vertebrate taxa [11]. Sequencing technology is rap-idly changing, as discussed in Subheading 1.4 below, and while thestrategy outlined here has proved to be robust and cost-effective inour hands, new approaches will likely surpass the ALLPATHS-LG/Illumina strategy in both cost and quality in the near future.
1.3 ALLPATHS-LG
and Basic Sequencing
Strategies
The ALLPATHS-LG assembly algorithm requires at minimum asingle overlapping fragment library (e.g., 220 bp library sequencedusing 2 � 125 bp paired-end reads), as well as a jumping library(e.g., 3 kb Nextera Mate Pair Library, also sequenced using2 � 125 bp reads). The jumping library allows the assembler to“jump” over stretches of repetitive DNA because each end of amate pair read provides linkage information about bases that appearapproximately 3 kb from one another in the genome. In the prepa-ration of the jumping library, DNA is “tagmented” (fragmentedand tagged with junction adapters in one step using transposase)and then circularized (junction adapter to junction adapter), suchthat DNA on either side of the junction (the mate pairs) originatedapproximately 3 kb away on the same strand in the native genomicDNA. The circularized DNA is then fragmented a second time andonly junction adapter-containing fragments are collected and usedto produce the library. For genomes that are larger and morecomplex than those of birds, a larger jumping library (e.g., 6 kb)or a fosmid jumping library (e.g., 40 kb) can be incorporated tospan long stretches of repeats [10].
Here, we report basic assembly statistics from 17 unpublisheddraft avian genomes generated in our laboratory to serve as a guidewhen planning the sequencing depth per library and total coveragefor a new avian ALLPATH-LG project (Table 1). Genomes from
12 Phil Grayson et al.

Table 1Assembly statistics for 17 unpublished avian genomes assembled using ALLPATHS-LG
Commonspeciesname
Latin speciesname
Estimatedgenomesize (Gb)
Totalcoverage
ContigN50(kb)
ScaffoldN50(Mb)
Fragmentreads (E+08)
Jumpreads(E+08)
Totalreads(E+08)
Emu Dromaiusnovaehollandiae
1.31 64.8 139 3.32 5.01 3.98 8.99
Southerncassowary
Casuariuscasuarius
1.37 54.1 133 3.70 4.19 4.60 8.79
Greatspottedkiwi
Apteryx haastii 1.35 44.4 106 1.36 2.95 2.77 5.72
Littlespottedkiwi
Apteryx owenii 1.36 60.5 128 1.62 4.48 4.52 8.99
Okaritobrown kiwi
Apteryx rowi 1.40 54.3 120 1.67 3.58 4.36 7.94
Greaterrhea
Rheaamericana
1.24 59.9 68.7 4.08 3.90 3.76 7.66
Lesser rhea Rhea pennata 1.27 42.4 55.9 3.85 3.13 3.31 6.44
Thickettinamou
Crypturelluscinnamomeus
1.20 47.5 50.3 2.43 2.70 3.22 5.92
Elegantcrestedtinamou
Eudromiaelegans
0.96 68.0 98.8 3.28 3.43 3.29 6.72
Chileantinamou
Nothoproctaperdicaria
1.01 76.2 75.8 3.35 4.29 3.36 7.66
Leach’sstormpetrel
Oceanodromaleucorhoa
1.24 79.5 165 8.58 4.40 5.83 10.2
Wanderingalbatross
Diomedeaexulans
1.22 28.3 42.8 1.10 1.50 2.06 3.56
Wavedalbatross
Phoebastriairrorata
1.24 41.1 63.0 1.51 2.24 2.76 5.00
Short-tailedalbatross
Phoebastriaalbatrus
1.23 41.5 56.7 1.52 2.27 2.65 4.92
Laysanalbatross
Phoebastriaimmutabilis
1.25 59.4 81.4 1.62 3.97 2.96 6.93
Black-footedalbatross
Phoebastrianigripes
1.25 67.1 81.9 1.53 4.40 3.57 7.98
Northerncardinal
Cardinaliscardinalis
1.10 58.8 114 3.66 3.36 3.68 7.04
Avian Comparative Genomics 13

our laboratory were sequenced exclusively on Illumina HiSeq2500s using 2 � 125 bp reads from Illumina HiSeq SBS V4 high-output sequencing runs alone, or in combination with a smallproportion of reads (generated during test runs) using rapid runmode at 2� 150 bp. Multiplexing and sequencing were carried outwith the aim of providing between 500 million and 1 billion paired-end reads (between 1 and 2 lanes of a v4 flow cell) per genome.Because sequencing comprises the largest portion of the total costin generating a draft genome, the genome of the wandering alba-tross (Diomedea exulans), at only 356 million reads and 28.3�coverage, cost approximately one half of the higher coverage gen-omes (e.g., the emu (Dromaius novaehollandiae)).
Scaffold and contig N50 scores are commonmetrics of genomequality, defined as the length of the element (scaffold or contig)above which 50% of the genome exists in elements of that length orlonger. Following assembly, each contig contains mostly contigu-ous DNA sequence. Contigs are linked together with stretches ofunknown bases in between to generate scaffolds. Reads from jump-ing libraries span regions that are difficult to sequence or assemble,aiding in the assembly of both contigs and scaffolds. Some trends ingenome quality that emerge from analyzing the 17 avian genomeassemblies include:
1. Contig N50 correlates with the total number of raw reads(both jumping and fragment) (Fig. 1).
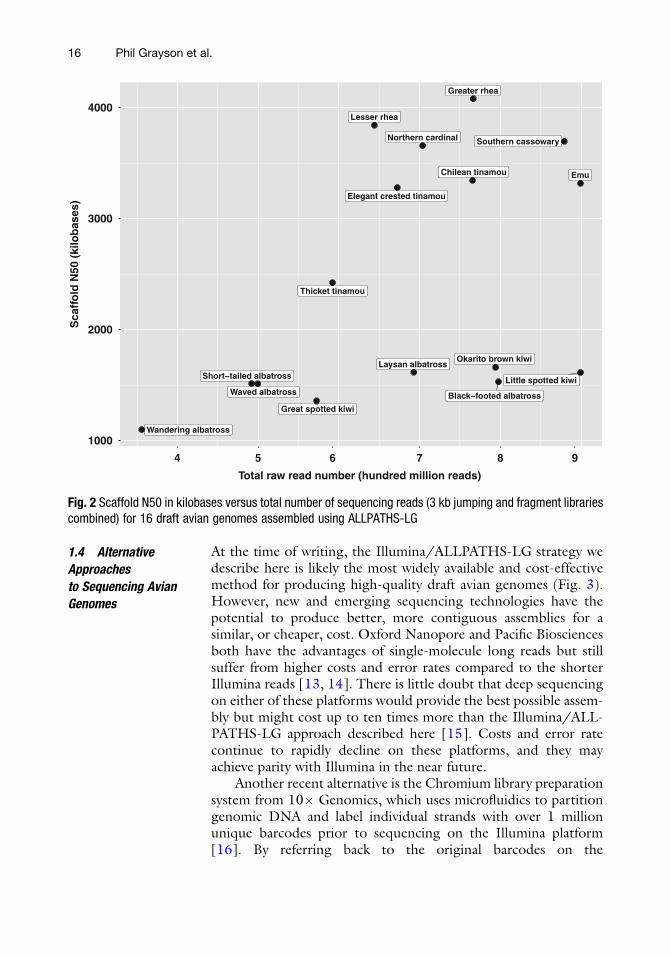
2. Scaffold N50 also correlates with the total raw read number, butthe correlation is less strong than for contig N50 (Fig. 2). Twogroups emerge in this graph, one that appears to benefit fromdeeper sequencing and one that does not (assemblies from thelatter group have scaffoldN50 values below 2Mb). Despite highsequencing depth in the two kiwi and two albatrosses near thebottom right of the figure, the scaffold N50 is low. The qualityof the input DNA, properties of the genomes (e.g., repeatcontent or types), or other factors could explain this pattern.
3. We note several caveats regarding increasing sequencing depthas a means to achieve increased quality of assembly. Our labo-ratory has experimented with increasing sequencing depthwithout creating additional libraries in two instances, once fora very low coverage assembly of the waved albatross (Phoebas-tria irrorata) and once as an attempt to improve the 67�coverage assembly of the black-footed albatross (Phoebastrianigripes) (Table 1). For the waved albatross, the first assemblywas produced with approximately 21� coverage, with contigand scaffold N50 values of 3.06 � 104 and 7.87 � 105 bp,respectively. By increasing the coverage to over 40�, thisassembly was greatly improved (see Table 1). However, forthe black-footed albatross, nearly doubling the coverage to
14 Phil Grayson et al.
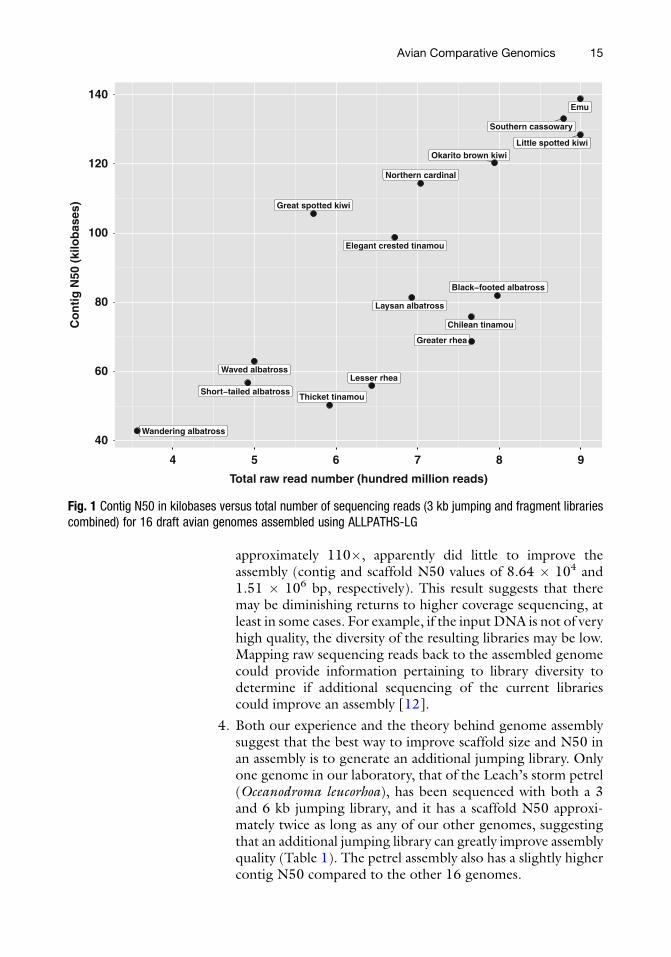
approximately 110�, apparently did little to improve theassembly (contig and scaffold N50 values of 8.64 � 104 and1.51 � 106 bp, respectively). This result suggests that theremay be diminishing returns to higher coverage sequencing, atleast in some cases. For example, if the input DNA is not of veryhigh quality, the diversity of the resulting libraries may be low.Mapping raw sequencing reads back to the assembled genomecould provide information pertaining to library diversity todetermine if additional sequencing of the current librariescould improve an assembly [12].
4. Both our experience and the theory behind genome assemblysuggest that the best way to improve scaffold size and N50 inan assembly is to generate an additional jumping library. Onlyone genome in our laboratory, that of the Leach’s storm petrel(Oceanodroma leucorhoa), has been sequenced with both a 3and 6 kb jumping library, and it has a scaffold N50 approxi-mately twice as long as any of our other genomes, suggestingthat an additional jumping library can greatly improve assemblyquality (Table 1). The petrel assembly also has a slightly highercontig N50 compared to the other 16 genomes.
Great spotted kiwi
Little spotted kiwiOkarito brown kiwi
Black−footed albatross
Northern cardinal
Southern cassowary
Thicket tinamou
Emu
Elegant crested tinamou
Laysan albatross
Chilean tinamou
Greater rhea
Lesser rhea
Short−tailed albatross
Waved albatross
Wandering albatross40
60
80
100
120
140
4 5 6 7 8 9
Total raw read number (hundred million reads)
Co
nti
g N
50 (
kilo
bas
es)
Fig. 1 Contig N50 in kilobases versus total number of sequencing reads (3 kb jumping and fragment librariescombined) for 16 draft avian genomes assembled using ALLPATHS-LG
Avian Comparative Genomics 15
1.4 Alternative
Approaches
to Sequencing Avian
Genomes
At the time of writing, the Illumina/ALLPATHS-LG strategy wedescribe here is likely the most widely available and cost-effectivemethod for producing high-quality draft avian genomes (Fig. 3).However, new and emerging sequencing technologies have thepotential to produce better, more contiguous assemblies for asimilar, or cheaper, cost. Oxford Nanopore and Pacific Biosciencesboth have the advantages of single-molecule long reads but stillsuffer from higher costs and error rates compared to the shorterIllumina reads [13, 14]. There is little doubt that deep sequencingon either of these platforms would provide the best possible assem-bly but might cost up to ten times more than the Illumina/ALL-PATHS-LG approach described here [15]. Costs and error ratecontinue to rapidly decline on these platforms, and they mayachieve parity with Illumina in the near future.
Another recent alternative is the Chromium library preparationsystem from 10� Genomics, which uses microfluidics to partitiongenomic DNA and label individual strands with over 1 millionunique barcodes prior to sequencing on the Illumina platform[16]. By referring back to the original barcodes on the
Great spotted kiwi
Little spotted kiwi
Okarito brown kiwi
Black−footed albatross
Northern cardinal Southern cassowary
Thicket tinamou
Emu
Elegant crested tinamou
Laysan albatross
Chilean tinamou
Greater rhea
Lesser rhea
Short−tailed albatross
Waved albatross
Wandering albatross1000
2000
3000
4000
4 5 6 7 8 9
Total raw read number (hundred million reads)
Sca
ffo
ld N
50 (
kilo
bas
es)
Fig. 2 Scaffold N50 in kilobases versus total number of sequencing reads (3 kb jumping and fragment librariescombined) for 16 draft avian genomes assembled using ALLPATHS-LG
16 Phil Grayson et al.

unfragmented DNA, the assembly algorithm can identify the origi-nal native DNA molecule from which a particular read is derived,thus generating haplotype-phased genomes with high scaffold andcontig N50. The additional costs of the library preparation for thisapproach compared to that for standard Illumina are relativelymodest, but the efficiency and performance of the algorithms andmethods in nonhuman contexts are not yet clear [17].
1.5 Draft Genomes
as Foundations
for Developmental
Genomics
The first steps in sequencing a genome are the most critical. Thehigh cost of errors during library preparation or quantificationoften places genome projects out of reach for many research labora-tories. Our goal for this chapter was to provide an overview of anaccessible method for generating draft avian genomes, allowing
0
200
400
0 5 10 15 20
Scaffold N50 (megabases)
Co
nti
g N
50 (
kilo
bas
es)
Assembly MethodALLPATHS−LG
Celera v.6.1CLC Genomics Workbench v. 4.9MaSuRCA v.1.9.2PCAP v. 2008Ray Software v.3
SOAPdenovo
Fig. 3 Contig N50 in kilobases versus scaffold N50 in megabases for 17 draft avian genomes assembled in ourlaboratory alongside published avian genomes available from NCBI categorized by assembly method (totaln ¼ 72). NCBI avian genomes were included if the metadata contained assembly method, contig N50 andscaffold N50 values. This figure does not display the chicken or great tit (Parus major) since their contig N50(chicken) and scaffold N50 (great tit) values are five and four times greater than all the other species,respectively. ALLPATHS-LG provides excellent contig N50 values and good scaffold N50 values across aviansamples. Since gene annotation (and mapping of short reads for epigenomic assays) relies more heavily onlarge contigs than large scaffolds, the ALLPATHS-LG approach is appropriate for developmental genomics
Avian Comparative Genomics 17

laboratories to take advantage of new approaches to developmentalbiology allowed by comparative genomics (Fig. 4).
The identification of regulatory regions is of key importance formany developmental and evolutionary investigations. Comparativegenomic studies have identified conserved non-exonic elements(CNEEs), which are stretches of noncoding sequence that areconserved across divergent taxa, evolve more slowly than a bench-mark neutral rate, and are usually comprised of fourfold degeneratesites of protein-coding regions. These CNEEs, which are oftenidentified through the phastCons program following whole-genome alignment [18], appear to serve developmental regulatoryroles. When tested in a transgenic mouse enhancer assay, 115 out of231 of the highly conserved human genomic regions drovereporter gene expression in various murine tissues, suggesting con-served enhancer activity [19].
Because of the important role of CNEEs in development, manycomputational methods have been used to predict their origins,functions, and the effect of repeated losses of orthologous elementsacross diverse taxa [18, 20–23]. Recent studies in birds suggest thatCNEEs play an important role in evolutionary diversification and inthe origin of morphological novelties, such as feathers [21, 24].CNEE discovery techniques have proven to be most powerfulwhen coupled with genomic assays for tissue-specific regulatoryactivity. Using a 60-way vertebrate alignment for CNEE identifica-tion, alongside chromatin immunoprecipitation (ChIP)-seq data foractive enhancer marks (histone 3 lysine 27 acetylation or H3K27ac)from developing mouse limbs, Booker et al. were able to identify andexperimentally validate novel regulatory regions (referred to as bataccelerated regions or BARs due to their rapid evolutionary rate inbat lineages) implicated in the development of the bat wing andconduct comparative in situ hybridization experiments on genes
Draft Genome
Gene Expression Gene RegulationGenome Evolution Gene Manipulation
Gene Evolutionor Loss
Conserved Element Acceleration or Loss
In situ Hybridization
ComparativeRNA-Seq
Genome Annotation Chromosome
Comfirmation Capture
ChIP-Seq
ATAC-Seq
Over/Misexpression
KnockdownExperiments
Genome Editing
Enhancer Screens
Fig. 4 A draft genome provides a developmental research group with the opportunity to explore many areas,including gene expression, gene manipulation, gene regulation, and genome evolution
18 Phil Grayson et al.

neighboring BARs of interest [25]. Since CNEEs are often foundclustered near key developmental genes [20], interesting patterns ofCNEE evolution can also aid in the generation of candidate gene listsfor traits of interest.
Another recent paper on development and evolution of batlimbs used a similar comparative genomics approach to identifyadditional BARs [26]. These authors then examined comparativeRNA-seq, in situ hybridization and both H3K27me3 (repressivemark) and H3K27ac (active mark) ChIP-seq data across threedevelopmental stages to identify regulatory changes and expressiondifferences for RNAs (both coding and long noncoding) implicatedin shaping bat forelimb development through differential mesen-chymal condensation.
In pigeons, comparative genomics, cross-strain breeding, anddevelopmental experiments alongside ChIP-seq from developinglimbs allowed researchers to suggest that genes implicated in theorigins of feathered feet inmultiple pigeon breeds drive an alterationof limb identity, with the developing feathered hindlimbs displayinga localized shift toward forelimb-specific expression patterns of Tbx5and Pitx1 through cis-regulatory changes [27]. Furthermore, theauthors identified similar Tbx5 expression patterns in the developinghindlimbs of convergently feathered chicken breeds [27]. In otherTbx5 research, an assay that identifies stretches of open chromatinfrom live intact cells (ATAC-seq) uncovered a CNEE present inhumans, bony fish, and cartilaginous fish that appears to serve anessential role in the evolution of paired appendages across jawedvertebrates [28]. Injection of this enhancer region alongside tbx5ainto finless zebrafish (Danio rerio) embryos rescued the finned phe-notype, while injecting tbx5a alone was ineffective [28]. All of thedevelopmental studies described above used comparative genomicsalongside cutting-edge genomic and epigenomic assays for theirmodel and trait of interest, illustrating the utility of one or moredraft genomes for driving developmental research.
1.6 Overview Themethods section begins with avian tissue and ends with draft denovo genome assemblies (Fig. 5). Each section follows one or morepublished protocol(s) from the kits and instruments recommended;DNA extraction (Subheading 3.1) follows the protocol from the E.Z.N.A. Tissue DNA Kit. Fragment Library Preparation (Subhead-ing 3.2) follows protocols from the Qubit dsDNA HS Assay Kit,PrepX ILM 32i DNA Library Kit, IntegenX PCR Cleanup
Tissue DNA Extraction (3.1)
Fragment Library Preparation (3.2)
Jumping (Mate Pair) Library Preparation (3.3)
Library Quantification and Quality Control (3.4)
ALLPATHS-LG Assembly (3.5) Genome
Fig. 5 Overview of methods presented in this chapter to produce ALLPATHS-LG genome assembly startingfrom high-quality avian tissue
Avian Comparative Genomics 19

8 Protocol, and the Covaris S220 instrument. Jumping (Mate Pair)Library Preparation (Subheading 3.3) follows protocols from theQubit, Covaris, Nextera Mate Pair Sample Preparation Kit, andPippin Prep instruments. Library Quantification and Quality Con-trol (Subheading 3.4) follows protocols from Qubit, the HighSensitivity DNA Kit for the Agilent Bioanalyzer, and the KAPALibrary Quantification Kit for next-generation sequencing. ALL-PATHS-LG assembly (Subheading 3.5) utilizes commands fromFastq, cutadapt, Trim Galore!, and ALLPATHS-LG manuals.Notes (Subheading 4) interspersed throughout the Materials andMethods provide tips and best practices that have benefitted ourlaboratory throughout these protocols.
This chapter serves as a general guide to achieving high-qualitydraft genomes of birds, but we recommend referring to the proto-cols included in the kits themselves or updated online becausecompanies often modify their protocols as they change reagentsor optimize key steps.
2 Materials
2.1 DNA Extraction
and Quality Control
1. Tissue sample (see Note 1).
2. DNA extraction kit such as E.Z.N.A. Tissue DNA Kit (cat. No.D3396, Omega bio-tek).
3. Standard 1.7 mL microcentrifuge tubes.
4. RNase A.
5. 100% ethanol.
6. 100% isopropanol.
7. Sterile scalpel blades.
8. Agarose.
9. 10� TAE buffer (cat. No. 15558042, Thermo Fisher).
10. 1 kb DNA Ladder and 6� loading dye (cat. No. N3232,NEB).
11. Agarose gel electrophoresis system.
12. Gel imager.
13. SYBR Safe DNA Gel Stain (cat. No. S33102, Thermo Fisher).
2.2 Fragment Library
Preparation
1. DNA from Subheading 2.1.
2. Qubit Fluorometer.
3. Qubit dsDNAHS Assay Kit (cat. No. Q32854, Thermo FisherScientific).
4. Qubit assay tubes (cat. No. Q32856, Life Technologies) orAxygen PCR-05-C tubes (cat. No. 10011-830, VWR).
5. Apollo 324 NGS Library Preparation System (see Note 2).
20 Phil Grayson et al.
6. Apollo consumables (see Note 3): PCR strip-tubes, microtiterplates, filter tips, piercing tips, PCR strip-caps, reservoirs, and1.1 mL tubes (cat. No. 300019, 300026–300029, 300031,and 300033, respectively).
7. PrepX ILM 32i DNA Library Kit (see Note 2) (cat. No.400076, Wafergen).
8. PrepX Complete ILMNDNA Barcodes (cat. No. 400077-1 to400077-5, Wafergen).
9. Covaris S220 shearing device and microTUBE holder.
10. Covaris microTUBE (6 � 16 mm) glass tubes (cat. No.520045, Covaris).
11. 70% EtOH.
12. 2.5 M NaCl.
13. UltraPure DNAse/RNAse-free distilled water (cat. No.10977023, Thermo Fisher Scientific). This will be referred toas water throughout.
2.3 Jumping [Mate
Pair] Library
Preparation
1. Nextera Mate Pair Sample Preparation Kit (cat. No. FC-132-1001, Illumina).
2. Qubit Fluorometer.
3. Qubit dsDNAHS Assay Kit (cat. No. Q32854, Thermo FisherScientific).
4. Qubit assay tubes (cat. No. Q32856, Life Technologies) orAxygen PCR-05-C tubes (cat. No. 10011-830, VWR).
5. Covaris S220 shearing device and microTUBE holder.
6. Covaris T6 (6 � 32 mm) glass tubes (cat. No. 520031,Covaris).
7. Covaris Snap-Cap (8 mm) Teflon Silicone Septa (cat. No.520042, Covaris).
8. Pippin Prep.
9. Pippin Prep 0.75% agarose gel cassettes with ethidium bromide(cat. No. CSD7510, Sage Science).
10. Maxymum Recovery 1.7 mL microcentrifuge tubes (cat. No.MCT-175-L-C, Axygen).
11. Genomic DNA Clean and Concentrator Kit (cat. No. D4010or D4011, Zymo Research)
12. AMPure XP beads (cat. No. A63880, Beckman Coulter).
13. Dynabeads M-280 Streptavidin magnetic beads (cat. No. 112-05D, Invitrogen).
14. Magnetic rack for 1.7 mL microcentrifuge tubes; MagnaRack,for example (cat. No. CS15000, Invitrogen).
Avian Comparative Genomics 21

2.4 Library
Quantification
and Quality Control
1. Agilent 2100 Bioanalyzer.
2. High Sensitivity DNA Kit for Bioanalyzer (cat. No. 5067-4626, Agilent Technologies).
3. KAPA Library Quantification Kit for next-generation sequenc-ing (cat. No. KK4824, Kapa Biosystems). Catalog numberabove is for the universal kit.
4. qPCR thermocycler.
5. Preferred diluent (10 mM Tris–HCl, pH 8.0 and optional0.05% Tween 20).
6. qPCR plates or tubes with clear sealing film or lids.
2.5 ALLPATHS-LG
Assembly
1. Computer with FastQC installed. Available here:http://www.bioinformatics.babraham.ac.uk/projects/fastqc/.
2. Computer with cutadapt installed. Available here:http://cutadapt.readthedocs.io/en/stable/installation.html.
3. Computer with Trim Galore! installed. Available here:http://www.bioinformatics.babraham.ac.uk/projects/trim_galore/.
4. High memory (>256 Gb) server running ALLPATHS-LG (seeNote 4). Available here: http://software.broadinstitute.org/allpaths-lg/blog/.
3 Methods
3.1 DNA Extraction 1. This section follows the protocol from the E.Z.N.A. TissueDNA Kit (see Note 5).
2. Preheat blocks or water baths to 55 and 70 �C, place elutionbuffer at 70 �C, and add appropriate volume of 100% ethanoland 100% isopropanol to DNA wash buffer and HBC buffer,respectively (varies with kit size), before beginning.
3. Weigh and mince 30 mg of tissue. Place in 1.7 mL microcen-trifuge tube.
4. Add 220 μL TL Buffer and flick-mix by hand. Do not vortex atany point (see Note 6).
5. Add 25 μL OB Protease solution and mix.
6. Incubate at 55 �C with agitation, either constant shaking orfrequent flick-mixing every 20–30 min (see Note 7).
7. Once tissue is digested, add 4 μL RNase A (100 mg/mL) per30 mg tissue and incubate for 2 min at room temperature. Thiswill remove RNA from your sample and allow you to betterdetermine the quality of your DNA sample on an agarose gel.
22 Phil Grayson et al.

8. Centrifuge at maximum speed (use max speed for all DNAextraction spins) for 5 min and transfer supernatant to sterile1.7 mL microcentrifuge tube.
9. Add 220 μL BL Buffer and mix thoroughly.
10. Incubate at 70 �C for 10 min.
11. Add 220 μL of 100% ethanol and mix thoroughly.
12. Transfer full volume to HiBind DNAMini Column placed in acollection tube.
13. Centrifuge at max speed for 1 min.
14. Discard filtrate and replace collection tube.
15. Add 500 μL HBC buffer (ensure that 100% isopropanol hasbeen added).
16. Centrifuge at max speed for 30 s.
17. Discard collection tube and filtrate. Apply new collection tubeto column.
18. Add 700 μL DNA wash buffer (ensure that 100% ethanol hasbeen added).
19. Centrifuge at max speed for 30 s.
20. Discard filtrate and replace collection tube.
21. Repeat 700 μL DNA wash buffer steps one additional time.
22. Centrifuge empty column and collection tube for 2 min toremove excess wash buffer.
23. Transfer column to new collection tube and centrifuge for 1additional minute to remove excess wash buffer.
24. Transfer HiBind DNA Mini Column into sterile nuclease-free1.7 mL microcentrifuge tube.
25. Add 100–200 μL heated 70 �C elution buffer to column.Incubate columns at 70 �C for 2 min.
26. Centrifuge for 1 min. Second elution can be carried out withadditional elution buffer.
27. Make 1� TAE stock from 10� TAE buffer using dH2O.
28. Based on total volume of 1� TAE used, weigh and mix inappropriate amount of agarose to create 0.5–1% agarose gel.Microwave and mix solution until homogeneous and cool untilcomfortably warm to the touch. Add SYBR Safe (approxi-mately 1 μL per 10 mL of gel solution). Pour, harden, load,and run gel at 120 V.
29. When the gel is imaged, samples should show single band withlittle to no streaking underneath (Fig. 6).
Avian Comparative Genomics 23

3.2 Fragment Library
Preparation
1. This section follows protocols from Qubit dsDNA HS AssayKit, PrepX ILM 32i DNA Library Kit, IntegenX PCR Cleanup8 Protocol, and the Covaris S220 instrument.
2. Following the Qubit dsDNA HS Assay Kit protocol, quantifyDNA prior to library preparation. The full protocol is includedbelow.
3. Label tops of assay tubes for samples and two standards.
4. Calculate and mix the appropriate volume for Qubit workingsolution for all samples and standards in a plastic microcentri-fuge or Falcon tube. The working solution is composed of
Fig. 6 Composite image of a 1 kb ladder (1 kb) and three DNA extractions usingslightly different methods on tissues stored under identical conditions (frozen inRNA later at �80 �C) to show differences in DNA quality. The first sample (MR)was muscle tissue that was lysed for only 3 h and treated with RNAse A beforeextraction, the second (LR) is liver tissue treated in the same way, and the lastsample (LNR–far right) is a piece from the same liver sample after being lysedovernight (18 h) without the addition of RNAse A. RNAse A (or the shorter lysisstep) appears to have cleaned up some of the extended smear seen in LNRcompared to LR. We utilized MR for genome sequencing since it appeared tohave the least degradation
24 Phil Grayson et al.

Qubit dsDNA HS reagent diluted 1:200 in Qubit dsDNA HSBuffer. Each sample requires 199 μL of working solution (if thereadings are too low using 199 μL, the Qubit protocol allowsvolumes as low as 180 μL for samples), and the two standardsboth require 190 μL.
5. Each tube will be brought to 200 μL with standard or sample,vortexed, and incubated at room temperature for 2 min beforereading (see Note 8).
6. On the Qubit, select DNA, then dsDNA High Sensitivity.
7. Read standard 1 and then standard 2.
8. Read sample and calculate concentration on the Qubit screenbased on volume of sample used (e.g., 1 μL sample with 199 μLof working solution).
9. Following the Wafergen Biosystems PrepX ILM 32i DNALibrary Kit protocol, the DNA concentration working rangeis 0.067–6.67 ng/μL. All our libraries were generated near thetop end of this range.
10. Turn on Covaris and water bath at least 30 min prior to use.
11. Fill water tank with distilled water between the 10 and 15 onthe fill scale, which should result in a reading between 10 and15 on the run scale once the apparatus is lowered into the tankand water is displaced.
12. Turn the machine on and open the SonoLab software.
13. Allow the water to degas and reach optimal temperature(e.g., 6 �C).
14. To fragment DNA, pipette 50–130 μL of sample through thepre-slit cap on a Covaris microTUBE.
15. Place microTUBE in microTUBE holder and place holder inCovaris (see Note 9).
16. For 220 bp insert size, set the following protocol on theSonoLab software: duty cycle/duty factor, 10%; intensity, 4(peak power intensity on the S220 is set to 140); cycles/bursts,200; time/cycle, 9 s; number of cycles, 8; and total processtime, 72 s.
17. Press run. Following fragmentation, remove sample and placeon ice.
18. Prior to Apollo setup, anneal universal Wafergen adapters andbarcodes in their plate using a two-step thermocycler protocol(95 �C for 5 min, 70 �C for 15 min).
19. Remove plate from thermocycler and cool on bench. Add 6 μLof water to each well and mix. Reseal plate after use and store at�20 �C. This is only done once (not each time a librarypreparation is carried out).
Avian Comparative Genomics 25

20. To utilize adapters, mix 2 μL of adapter (from the plate above)with 13 μL of water for each Apollo run (this is the adaptermix). Keep on ice.
21. To make Apollo ligation mix (per four reactions), combine52.8 μL of PrepX Ligase Buffer, 4.4 μL of PrepX LigaseEnzyme, and 8.8 μL of water. Keep on ice.
22. Turn on Apollo and select Library Prep, DNA, ILM, and220 bp.
23. Follow the on-screen instructions for setup of Apolloconsumables.
24. Once the “Cooling” notification disappears, load the followingin PCR strip-tubes as instructed on screen: 15 μL of Covaris-sheared sample, 15 μL of adapter mix, and 64 μL of ligationmix (per four reactions).
25. Load 225 μL of 2.5 M NaCl (supplied by Wafergen) to theApollo microtiter plate as instructed on screen (per fourreactions).
26. Add water and 70% ethanol to reservoirs 1 and 3 as instructedon screen.
27. Load the enzyme strip(s) and place retention plates on blocks 3and 4 as instructed on screen.
28. Close the instrument door and press “Run.” The run will endin 3 h, 20 min.
29. Retrieve products from block 3, rows 9–12. The librariesshould be ~15 μL.
30. Qubit libraries as above and prepare the PrepX PCR reactionmixture (25 μL of PrepX PCRMaster Mix, 2 μL of PrepX PCRPrimers, 5 ng total of Apollo library, and water to make up thetotal volume to 50 μL).
31. Run the following PCR protocol: 98 �C for 30 s followed byfive cycles of 98 �C for 10 s, 60 �C for 30 s, and 72 �C for 30 s.Following the five cycles, hold at 72 �C for 300 s and hold at4 �C until removed from the thermocycler.
32. Proceed to PCR Cleanup 8 Protocol on the Apollo. WarmAMPure Beads to room temperature and vortex thoroughlyjust prior to running protocol.
33. Turn on the Apollo. Press “Utility Apps” and “PCRCleanup 8.”
34. Place empty consumables, 6 mL of 100% ethanol, and 6 mL ofwater on the Apollo deck as instructed on screen.
35. Once “Cooling” has disappeared, place strips containing 50 μLof sample and those containing 50 μL of freshly vortexedAMPure beads on Apollo deck as instructed on screen.
26 Phil Grayson et al.
36. Press “Run.”
37. After 16 min, collect clean products from Block 3, Row 4, andplace on ice.
38. Bring 10 μL of clean library up to 15 μL with water.
39. Proceed to library quantification and quality control.
3.3 Jumping [Mate
Pair] Library
Preparation
1. This section follows protocols from the Nextera Mate PairSample Preparation Kit and the Qubit, Covaris, and PippinPrep instruments.
2. For the Gel-Plus protocol (using the Pippin Prep), the NexteraMate Pair Library Prep Reference Guide recommends 4 μg ofinput DNA.
3. Quantify DNA with Qubit as described in Subheading 3.2.
4. Thaw the Tagment Buffer Mate Pair on ice.
5. Set a heat block to 55 �C.
6. Add 4 μg of gDNA to 1.7 mL microcentrifuge tube (maxvolume 308 μL).
7. Make up remainder of 308 μL with water.
8. Add 80 μL of Tagment Buffer Mate Pair.
9. Add 12 μL of Mate Pair Tagment Enzyme.
10. Flick-mix (do not vortex) and collect volume at the bottom ofthe tube using minicentrifuge.
11. Incubate for 30 min at 55 �C.
12. Purify the tagmentation reaction using the Zymo GenomicDNA Clean & Concentrator kit. Begin by adding two volumes(2 � 400 ¼ 800 μL) of Zymo ChIP DNA Binding Buffer tothe tagmentation reaction. Pipette to mix.
13. Transfer up to 800 μL of mixture to Zymo-Spin IC-XL columnin a collection tube.
14. Centrifuge at top speed for 30 s. Discard flow-through.
15. Add remaining reaction to column and repeat previous step.
16. If this is the first time using the Zymo kit, add 24 mL 100%ethanol to the 6 mL (or 96 mL 100% ethanol to the 24 mL)DNA Wash Buffer concentrate.
17. Wash two times by adding 200 μL of Zymo DNAWash Bufferto the column, spinning at top speed for 1 min and discardingthe flow-through.
18. Centrifuge the empty column at top speed with the lid open for1 min to remove excess wash buffer. Discard the collectiontube and transfer the column to a new Axygen MaxymumRecovery 1.7 mL microcentrifuge tube (see Note 10).
Avian Comparative Genomics 27

19. Add 30 μL of Resuspension Buffer (RSB fromNextera Kit) andincubate at room temperature for 1 min before centrifuging for1 min at full speed to elute purified DNA (see Note 11).
20. DNA can be stored at�20 �C for up to 24 h at this step, but tocomplete the protocol in 2 days, immediately proceed to thenext step (see Note 12).
21. Thaw 10� Strand Displacement Buffer and dNTPs at roomtemperate and place on ice when completely thawed.
22. Set heat block to 20 �C.
23. To the 30 μL of purified tagmented DNA sample, add 132 μLwater, 20 μL of 10� Strand Displacement Buffer, 8 μL ofdNTPs, and 10 μL of strand displacement polymerase.
24. Flick-mix and collect volume at the bottom of the tube usingminicentrifuge.
25. Incubate for 30 min at 20 �C. During this time, removeAMPure XP beads from 4 �C and allow them to reach roomtemperature.
26. Purify strand displacement mix using AMPure XP beads. Beginby vortexing beads thoroughly (vortex beads often to ensurethey are evenly dispersed).
27. Prepare 800–900 μL of 70% ethanol per library preparation.
28. To the 200 μL of strand displaced DNA, add 100 μL of freshlyvortexed AMPure XP beads.
29. Flick-mix and collect volume at bottom of the tube usingminicentrifuge.
30. Incubate at room temperature for 15 min repeating the previ-ous step every 2 min.
31. Place on magnetic rack for 5–10 min.
32. Leave tube on rack to remove and discard all supernatantwithout disturbing beads.
33. Leave tube on rack for two washes with 400 μL of 70% ethanol,removing and discarding supernatant after 30 s (see Note 13).
34. Once all supernatant has been removed, allow the beads to dryon the magnetic rack for 10–15 min. Small volumes of super-natant can be collected manually with a 10 μL pipette tipduring the drying step.
35. Add 30 μL of RSB and remove tube from magnetic rack.
36. Flick-mix and collect volume at the bottom of the tube usingminicentrifuge.
37. Incubate at room temperature for 5 min. Your sample is now inthe supernatant.
38. Place on magnetic rack for 5 min.
28 Phil Grayson et al.

39. Carefully collect supernatant and pipette to new 1.7 mLmicro-centrifuge tube.
40. DNA can be stored at �20 �C for up to 7 days at this step, butto complete the protocol in 2 days, proceed to the next step.
41. Size selection can be carried out using the Sage Science 0.75%cassette in the Pippin Prep for jumping libraries up to 8 kb.This will be described below. For jumping libraries 8–10 kb insize (which our lab has not utilized), size selection can becarried out with agarose gel electrophoresis, followed by a gelcleanup kit, or the BluePippin from Sage Science.
42. Turn on Pippin Prep. Click “Protocol Editor.”
43. Select “NEW.”
44. Select appropriate cassette (0.75%).
45. Select “End Run when Elution is Completed.”
46. Under “Reference Lane,” select a lane number for the markerD, then “apply reference to all lanes.”
47. Select “Range” and supply values (e.g., 2–5 or 4–8 kb). If thePippin Prep only allows tight cuts with the 0.75% cassette,supply your target size (e.g., 3 or 6 kb). Save the protocol.
48. Fill the rinse cassette with distilled water and place into theoptical nest. Close the lid and wait 20 s.
49. Press CALIBRATE button on screen. This will prompt themessage, “Calibration not done.”
50. Place the calibration fixture dark side down over the five LEDdetectors on the rinse cassette.
51. Close the lid and ensure that 0.80 is in target setting.
52. Click CALIBRATE. If calibration is OK, press EXIT and pro-ceed to samples.
53. The cassette is constructed as follows from left to right: Nega-tive Buffer Chambers, Sample Wells, Elution Modules, andPositive Buffer Chambers.
54. Inspect the 0.75% cassette for damage to the gel and ensurethat buffer reservoirs are a minimum of 50% full (add buffer ifnecessary). Do not use lanes that appear to be damaged.
55. Look at underside of cassette to ensure that there are nobubbles under the gel (between the gel and the plastic). Donot use lanes where gel bubbles appear to be present.
56. Tilt Positive Buffer Chambers up to gather bubbles near farright wall. Tap sides and bottom of cassette gently to dislodgeany small bubbles between the Elution Modules and the Posi-tive Buffer Chambers.
Avian Comparative Genomics 29

57. Place the cassette into the optical nest of the Pippin Prep whilemaintaining this position to ensure that bubbles do not gettrapped between the Elution Modules and the Positive BufferChambers.
58. Place one hand on cassette and slowly remove adhesive stripsby the white tabs provided.
59. Remove old buffer from Elution Modules and replace with40 μL of fresh electrophoresis buffer (see Note 14).
60. Seal the Elution Modules with adhesive tape strips provided.
61. Fill Sample Wells to maximum with buffer if any are not full.
62. Test continuity by closing the lid and pressing the TEST but-ton on screen.
63. Once PASS appears on the screen, hit RETURN (seeNote 15).
64. Combine entire 30 μL of supernatant from AMPure beadpurification with 10 μL of room temperature loading solution.
65. Flick-mix and collect volume at the bottom of the tube usingminicentrifuge.
66. Remove 40 μL of buffer from Sample Well in target lane. Donot puncture agarose.
67. Add 40 μL of sample to Sample Well.
68. Repeat for additional samples and for marker D.
69. Begin run.
70. Once run is complete, carefully remove the adhesive strip overthe Elution Modules one at a time and transfer size-selectedproduct into new 1.7 mL microcentrifuge tube (see Note 14).
71. Purify the DNA from the Pippin Prep by once again using theZymo Genomic DNA Clean & Concentration Kit, but notethat the protocol different from above (see Note 16).
72. Pipette to mix five volumes of ChIP Binding Buffer into thePippin Prep elution.
73. Transfer the mixture to a Zymo-Spin IC-XL column in acollection tube.
74. Centrifuge at top speed for 30 s. Discard flow-through.
75. Wash two times by adding 200 μL of Zymo DNAWash Bufferto the column, spinning at top speed for 1 min and discardingthe flow-through.
76. Discard the collection tube and transfer the column to a new1.7 mL microcentrifuge tube.
77. Add 10 μL of RSB directly to the column matrix and incubateat room temperature for 1 min before centrifuging for 30 s atfull speed to elute purified DNA.
30 Phil Grayson et al.
78. DNA can be stored at�20 �C for up to 24 h at this step, but tocomplete the protocol in 2 days, proceed to the circularizationstep.
79. Run Qubit dsDNA HS Assay on samples as described in Sub-heading 3.2.
80. Utilize up to 600 ng of purified DNA for the circularizationreaction (see Note 17).
81. Thaw Circularization Buffer at room temperature and thenplace on ice.
82. Set heat block to 30 �C.
83. Using up to 600 ng of DNA from the previous step, addenough water to make the total volume 268 μL, then 30 μLof Circularization Buffer 10�, and 2 μL of CircularizationLigase.
84. Flick-mix and collect volume at the bottom of the tube usingminicentrifuge.
85. Incubate overnight (12–16 h) at 30 �C. This is a good stoppingpoint for day 1.
86. Set two heat blocks to 37 and 70 �C.
87. Thaw Stop Ligation Buffer and place on ice.
88. Add 9 μL of exonuclease to overnight circularization reaction.
89. Flick-mix and collect volume at the bottom of the tube usingminicentrifuge.
90. Incubate for 30 min at 37 �C.
91. During this incubation, turn on and prepare the Covaris S220.
92. Fill the reservoir with distilled water and allow machine todegas.
93. Chill Covaris S220 water bath to 6 �C.
94. Incubate samples from above for 30 min at 70 �C.
95. During this incubation, set up Covaris S220 protocol.
96. Set intensity to 8 (or peak power intensity to 240 on the S220),duty cycle/duty factor to 20%, cycles per burst to 200, andtime to 40 s.
97. Flick-mix and add 12 μL of Stop Ligation Buffer to samples.
98. Flick-mix and collect volume at the bottom of the tube usingminicentrifuge.
99. Transfer the entire volume of sample (~320 μL) to a Covaris T6tube. Fill tube with water if space remains after the addition ofsample. Carefully place the snap cap onto tube and press firmly(see Note 18).
Avian Comparative Genomics 31
100. Snap the T6 tube into the tube holder and place it into theCovaris S220.
101. Shear the DNA and transfer to a new 1.7 mLmicrocentrifugetube on ice.
102. Vortex and shake M-280 Streptavidin magnetic beads toresuspend.
103. Transfer 20 μL of M-280 Streptavidin magnetic beads perlibrary preparation to a new 1.7 mL microcentrifuge tube.
104. Place on magnetic rack for 1–2 min.
105. Remove and discard supernatant.
106. Wash the beads two times by adding 40 μL of Bead BindBuffer for every 20 μL of original beads, incubating for1–2 min, and removing all supernatant.
107. Remove the beads from the magnetic rack and add 300 μL ofBead Bind Buffer per 20 μL of original beads. Mix thoroughlyand spin down.
108. Add 300 μL of beads in Bead Bind Buffer to 300 μL ofsheared DNA.
109. Incubate for 15 min at 20 �C. Every 2 min during thisincubation, flick-mix and collect volume at the bottom ofthe tube using minicentrifuge. Do not spin for more than asecond to avoid pelleting the beads.
110. Following incubation, spin briefly in a minicentrifuge(5–10 s).
111. Place tube on the magnetic rack for 1–2 min. During thisincubation, remove the End Repair Mix from the freezer andthaw at room temperature. Once thawed, move the EndRepair Mix to ice.
112. Remove and discard supernatant from microcentrifuge tube.
113. Wash four times with Bead Wash Buffer by adding 200 μL ofBead Wash Buffer to the beads, flick-mixing and spinningdown for 1–2 s, placing the mixture on the magnetic rackfor 30 s, and removing all supernatant.
114. Wash two times with RSB by adding 200 μL of RSB to thebeads, flick-mixing and spinning down for 5–10 s, placing themixture on the magnetic rack for 30 s, and removing anddiscarding all supernatant. The supernatant from the secondwash should not be removed until the End Repair Mix isthawed (from above) and the End Repair Mixture (in nextstep) has been made. Set a heat block to 30 �C during thisstep.
115. For each library preparation, mix 40 μL of End Repair Mixand 60 μL of water to create the End Repair Mixture.
32 Phil Grayson et al.

116. Remove all supernatant from tubes.
117. Spin briefly (approximately 5 s) on the minicentrifuge tocollect additional supernatant.
118. Remove all excess supernatant with a 10 μL pipette.
119. Add 100 μL of End Repair Mixture to beads.
120. Flick-mix and collect volume at the bottom of the tube usingminicentrifuge.
121. Incubate for 30 min at 30 �C. During this incubation, placeA-TailingMix on surface of ice in ice bucket (it will not thaw ifplaced into the ice).
122. Following incubation, spin in a minicentrifuge for 5–10 s.
123. Place the tube on magnetic rack for 1 min. If the A-TailingMix has not thawed on ice, begin thawing at room tempera-ture now.
124. Remove and discard supernatant.
125. Wash four times with Bead Wash Buffer by adding 200 μL ofBead Wash Buffer to the beads, flick-mixing and spinningdown for 5–10 s, placing the mixture on the magnetic rackfor 30 s, and removing all supernatant.
126. Wash two times with RSB by adding 200 μL of RSB to thebeads, flick-mixing and spinning down for 5–10 s, placing themixture on the magnetic rack for 30 s, and removing anddiscarding all supernatant. The supernatant from the secondwash should not be removed until the A-Tailing Mix isthawed (from above) and the A-tailing reaction mixture (innext step) has been made. Set a heat block to 37 �C duringthis step.
127. For each reaction, mix 12.5 μL A-Tailing Mix and 17.5 μL ofwater to create the A-tailing reaction mixture.
128. As above, remove all supernatant from the tube, spin for5–10 s, and then remove excess using a 10 μL pipette.
129. Add 30 μL of A-tailing reaction mixture.
130. Flick-mix and collect volume at the bottom of the tube usingminicentrifuge.
131. Incubate for 30 min at 37 �C. During this incubation, thawDNA Adapter Indexes and Stop Ligation Buffer at roomtemperature. Once thawed, place on ice. Select individualDNA Adapters for each library (see Note 19).
132. To the 30 μL A-tailing reaction mix, add 2.5 Ligation Mix,4 μL water, and 1 μL of unique DNA Adapter Index. Recordwhich adapter has been used for each library.
133. Flick-mix and collect volume at the bottom of the tube usingminicentrifuge.
Avian Comparative Genomics 33

134. Incubate for 10 min at 30 �C. During this incubation, placethe Enhanced PCR Master Mix and PCR Primer Cocktailtubes at room temperature until thawed. Once thawed,place on ice.
135. Add 5 μL of Stop Ligation Buffer.
136. Spin for 5–10 s in a minicentrifuge.
137. Wash four times with Bead Wash Buffer by adding 200 μL ofBead Wash Buffer to the beads, flick-mixing and spinningdown for 5–10 s, placing the mixture on the magnetic rackfor 30 s, and removing all supernatant.
138. Wash two times with RSB by adding 200 μL of RSB to thebeads, flick-mixing and spinning down for 5–10 s, placing themixture on the magnetic rack for 30 s, and removing anddiscarding all supernatant. The supernatant from the secondwash should not be removed until the Enhanced PCRMasterMix and PCR Primer Cocktail have thawed and the PCRreaction mixture (in next step) has been made.
139. For each library preparation, mix 20 μL of Enhanced PCRMaster Mix, 5 μL of PCR Primer Cocktail, and 25 μL of waterto create the PCR reaction mixture.
140. Program a thermocycler with the following PCR program:98 �C for 30 s, followed by 10–15 cycles of 98 �C for 10 s;60 �C for 30 s; and 72 �C for 30 s (see Note 20). Followingthese cycles, hold at 72 �C for 5 min and hold at 4 �C.
141. As above, remove and discard supernatant, spin tube to col-lect excess supernatant, replace the tube on the magnetic rack,and remove excess with a 10 μL pipette.
142. Add 50 μL of PCR reaction mixture to the beads and pipetteto mix.
143. Transfer the mixture to PCR tubes and run PCR program.
144. Following PCR, the library can be kept at �20 �C for up to7 days. This is a good stopping point for day 2.
145. Bring AMPure XP beads to room temperature.
146. Prepare 400 μL of fresh 70–80% ethanol per library.
147. Place PCR tubes on magnetic rack for 1 min. If necessary,pipette product from PCR tube into new 1.7 mL microcen-trifuge tube to use the same magnetic rack from previoussteps.
148. Transfer 45 μL of bead-separated solution (containinglibrary) to a new 1.7 mL microcentrifuge tube.
149. Add 30 μL of freshly vortexed AMPure XP beads to thisvolume.
34 Phil Grayson et al.

150. Flick-mix and collect volume at the bottom of the tube usingminicentrifuge.
151. Incubate at room temperature for 5 min.
152. Place on magnetic rack for 5 min.
153. Remove and discard supernatant.
154. Wash two times with 70%–80% ethanol by adding 200 μL ofethanol to the beads, incubating for 30 s, and removing thesupernatant. If beads are disturbed, allow them to settle oncemore before removing supernatant.
155. Dry the beads for 10–15 min. Remove excess ethanol duringthis time with a 10 μL pipette tip.
156. Remove the tube from the magnetic rack and resuspend beadsin 20 μL of RSB. Flick-mix and collect volume at the bottomof the tube using minicentrifuge.
157. Incubate at room temperature for 5 min.
158. Incubate on the magnetic rack for 5 min. The library is now inthe supernatant.
159. Transfer the supernatant to a new 1.7 mL microcentrifugetube and proceed to library quantification and qualitycontrol.
3.4 Library
Quantification
and Quality Control
1. This section follows protocols fromQubit, the High SensitivityDNA Kit for the Agilent Bioanalyzer, and the KAPA LibraryQuantification Kit for next-generation sequencing.
2. Run Qubit dsDNA HS Assay as described in Subheading 3.2for all libraries.
3. To gain a better measure of library concentration and sizedistribution, run samples on Agilent 2100 Bioanalyzer HSDNA chip (see Note 21).
4. Up to 11 samples and 1 ladder can be run on an Agilent 2100Bioanalyzer High Sensitivity DNA chip. The assay requires1 μL of sample; dilute a small volume of each original libraryto approximately 1 ng/μL if necessary, and run from low tohigh concentration in well order on the Bioanalyzer chip.
5. As described in the Agilent High Sensitivity DNA Kit guide,bring High Sensitivity DNA dye concentrate and High Sensi-tivity DNA gel matrix to room temperature for around 30 min.
6. Vortex these tubes and combine 15 μL of dye concentrate with300 μL of gel matrix. Vortex to mix and transfer to spin filter(provided with kit).
7. Centrifuge for 10 min at 2300 � g. Discard the filter and labelthe gel-dye mix with the date (it is stable when stored at 4 �C inthe dark for 6 weeks).
8. Ensure that the electrode is clean (see Note 22).
Avian Comparative Genomics 35
9. Place the electrode in the electrode cartridge, and insert intobioanalyzer.
10. Examine back of the HS DNA chip to ensure that it does notappear broken.
11. Pipette 9 μL of gel-dye mix into the well labeled with the G inthe black circle.
12. Place chip in priming station and close lid until click.
13. Set timer for 60 s and steadily press plunger on syringe until itrests under the silver clip.
14. After 60 s, release the silver clip. Watch for the plunger torebound to at least 0.3 mL on the syringe (more likely0.7 mL or above) and wait for it to stop moving.
15. Remove the chip and inspect the capillaries on the back of thechip for bubbles. Do not proceed if bubbles are present. Cleanthe priming station and begin again with a new chip.
16. Pipette 9 μL of gel-dye mix into the remaining 3 G wells.
17. Load 5 μL of High Sensitivity DNA marker into all remainingwells.
18. Warm samples to 37 �C for 1–2 min (while proceeding to thenext step).
19. Place chip into the chip vortexer. Vortex starting from 0 rpmand ramping up to 2000–2200 rpm over a few seconds. Leaveat 2200 rpm for 60 s.
20. Load 1 μL of sample (or water) into all Sample Wells and 1 μLof ladder into ladder well.
21. Vortex as above. Use chip within 5min tominimize evaporation.
22. Open Expert software and select High Sensitivity DNA underAssays, DNA.
23. Once the run is complete, calculate size and concentration oflibraries.
24. Following the bioanalyzer run, fragment libraries should benormally distributed with an average size of ~400 bp andjumping libraries often appear negative skewed with an averagesize of ~750 bp (Fig. 7). If additional peaks appear on theBioanalyzer run, these can potentially be size-selected outusing an additional cleaning step with AMPure XP beads.The ratio of beads used will be based on the size of thefragment being removed and the fragment that is to be kept.
25. Following Qubit and Bioanalyzer quantification, librariesshould undergo a final quantification step using qPCR. TheKAPA kits provide standards of known size with Illuminaadapters to allow the most accurate quantification of the num-ber of adapter-ligated molecules (those that will be sequenced)in a given library.
36 Phil Grayson et al.

26. Thaw all KAPA kit components on ice. Ensure that they arewell mixed at each step.
27. Given that all libraries are at approximately 1–10 ng/μL, begina serial dilution as described below (see Note 23).
28. Starting from the concentration described above, samples willbe diluted to a final concentration of 1:200,000. This finalconcentration will be run alongside a 1:20,000 dilution. Onepossible set of volumes for this serial dilution is described here,where each successive step uses a volume from the previous stepand the current concentration is listed for each step: (a) Add1 μL library to 9 μL of water – 1:10. (b) Add 5 μL of previousdilution to 45 μL of preferred diluent – 1:100. (c) Add 5 μL of
Fig. 7 Example electropherograms from an HS DNA Assay run on the Agilent 2100 Bioanalyzer for a Nextera3 kb jumping library (a) and Apollo 220 bp fragment library (b). In the traces (left panel A and B), peaksrepresent the lower marker (green LM at left), the library (grey Library at center), and the upper marker (purpleUM at right). In the Gel Image (right panel), the same color scheme is used, and the library is present betweenthe green LM (at bottom) and the purple UM (at top). Average sizes are approximately 750 and 400 bp for thejumping and fragment libraries, respectively
Avian Comparative Genomics 37

previous dilution to 45 μL of preferred diluent – 1:1000. (d)Add 5 μL of previous dilution to 45 μL of preferred diluent –1:10,000. (e) Add 25 μL of previous dilution to 25 μL ofpreferred diluent – 1:20,000. (f) Add 25 μL of previous dilu-tion to 100 μL of preferred diluent – 1:100,000. (g) Add 25 μLof previous dilution to 25 μL of preferred diluent – 1:200,000(see Note 24).
29. As described in the KAPA Library Quantification Kit TechnicalData Sheet, when using the kit for the first time, add 1 mL of10� Primer Premix to 2� KAPA SYBR FAST qPCR MasterMix 5 mL bottle. Vortex reaction mixture very briefly.
30. Based on the qPCR instrument that will be used, low or highROX might be recommended. Check manufacturerinstructions.
31. Each standard (1–6), library sample (1:20,000 and 1:200,000dilutions), and a single no template control should be run intriplicate at 20 μL per replicate.
32. Calculate the number of samples needed and create a mastermix of 12 μL reaction mixture with 4 μL of water (or 3.6 μL ofwater with 0.4 μL of 50� ROX high or low if necessary) foreach sample (plus extra volumes for error).
33. In a qPCR plate, pipette 48 μL of master mix into each firstreplicate well. For each sample, three technical replicates arecarried out. To begin, the mixture is pipette once into the firstof three wells (e.g., A1 gets 48 μL of master mix, while A2 andA3 are left blank for now).
34. Pipette 12 μL of standard, sample, or water for no templatecontrol into each first replicate well and mix thoroughly.
35. Pipette 20 μL from first replicate well into second and thirdreplicate wells. Using our example from above, A1 now has 48μL of master mix and 12 μL of standard, sample, or water (60μL total), while A2 and A3 are currently empty. Distribute thisvolume evenly across the three replicate wells by pipetting 20μL from A1 to A2 and from A1 to A3.
36. Seal plate with clear film, spin down briefly, and place ininstrument.
37. Set up instrument to read SYBR green and label the six tenfolddilution standards (from 20 to 0.0002 pM) if possible insoftware.
38. Run qPCR with 95 �C denaturation for 5 min, followed by35 cycles of 95 �C for 30 s and 60 �C for 45 s with plate read(increase to 90 s if jumping libraries are included). Followingamplification, add melt curve analysis at 65–95 �C.
39. Following qPCR run, check qPCR for adapter dimers (a dou-ble peak following the main peak in the melt curve). Additional
38 Phil Grayson et al.

bead cleanups can remove adapter dimers, and qPCR should berun again to properly quantify libraries following this step.
40. If melt curve analysis looks clean, proceed to the calculation ofefficiency. Remove any major outliers and plot the average Cqof the six standards against the log of their pM concentrations.
41. Calculate the slope andR2 (which should be above 0.99). Ensurethat efficiency is between 90 and 110% using a website such ashttps://www.thermofisher.com/us/en/home/brands/thermo-scientific/molecular-biology/molecular-biology-learning-center/molecular-biology-resource-library/thermo-scientific-web-tools/qpcr-efficiency-calculator.html
42. If all above values are within acceptable ranges, the Cq andquantity scores given for each sample can be utilized.
43. Multiply each quantity by the original dilution (20,000 or200,000) and correct for library size with the following for-mula: (452/library size) � average quantity. This formulacorrects for the difference in size between the library and thestandards. Divide the output of this formula by 1000 to obtainnM (see Note 25).
44. Multiplex libraries to concentrations requested by sequencingcenter to fit individual budget and experimental needs.
3.5 ALLPATHS-LG
Assembly
1. This section utilizes commands from the Fastq, cutadapt,TrimGalore!, and ALLPATHS-LG manuals.
2. All commands contain curly braces, {}, to indicate names (files,folders, etc.,) that need to be changed by the user to reflect thespecific data being processed. Remove the curly braces andinput user-specific information.
3. To run FastQC on one fastq file, use the command:
fastqc –outdir {outdir_name} {fastq_file.fq}
4. Repeat above command line for each fastq file.
5. Run TrimGalore! on each individual library to remove adapterswith commands in steps below (see Note 26).
6. For fragment libraries, use the command:
trim_galore –paired –phred33 –output_dir {outdir_name} –
stringency 1 -e 0.1 {reads1.fq} {reads2.fq}
7. For jumping libraries, use the command:
trim_galore –paired –nextera –phred33 –output_dir
{outdir_name} –stringency 1 -e 0.1 {reads1.fq}
{reads2.fq}
8. Run FastQC once again on trimmed reads. Verify that there areno overrepresented or adapter sequences according to theFastQC output.
Avian Comparative Genomics 39

9. Write the groups and libs files required by ALLPATHS-LG.Both are comma-separated files. They should be named {spe-cies}_groups.csv and {species}_libs.csv. The top line of each isthe header and should appear as listed below. Asterisks areutilized in the file path to include both read directions. Thelibrary_name column must remain the same between the twofiles. It is underlined in this protocol.
10. Make the group csv file required by ALLPATHS-LG. This filecontains three comma-separated columns, for example:
group_name,library_name,file_name
{species220},{frag},/{full_path_to}/{species_frag_}*.fastq.gz
{species3kb},{jump3kb},/{full_path_to}/{species_jump_}*.fastq.gz
11. Make the libs csv file required by ALLPATHS-LG. This filecontains 12 comma-separated columns. Based on the typevalue (either fragment or jumping), fill frag_size and frag_std-dev or insert_size and insert_stddev, respectively. Empty col-umns are allowed. An example appears below:
library_name,project_name,organism_name,type,paired,frag_size,
frag_stddev,insert_size,insert_stddev,read_orientation,genomic_-
start,genomic_end
{frag},{avianGenome},{genusSp},fragment,1,220,{22},,,inward,,
{jump3kb},{avianGenome},{genusSp},jumping,1,,,3000,{300},outward,,
12. Create the directory structure for ALLPATHS-LG. See below:
mkdir -p {REFERENCE}/{DATA}/{RUN}/
Here, REFERENCE is the same {species} used in the groupsand libs file names, DATA is arbitrary (e.g., version), and RUNis the iteration (e.g., date).
13. Prepare the ALLPATHS-LG inputs. Run command:
PrepareAllPathsInputs.pl DATA_DIR¼{full_path_to/REFER-ENCE/DATA/} PLOIDY¼2 IN_GROUPS_CSV¼${species}_groups.csv IN_LIBS_CSV¼${species}_libs.csv > ${species}_pre-
p_log.log
14. Assemble the genome. See below:
RunAllPathsLG PRE¼{full_path_to} REFERENCE_NAME¼{REFER-ENCE} DATA_SUBDIR¼{DATA} RUN¼{RUN} HAPLOIDIFY¼TRUETHREADS¼{user_choice_based_on_resources} OVERWRITE¼TRUE1> ${species}_output(see Note 27)
15. Examine ALLPATHS-LG report (assembly.report) to viewstatistics.
40 Phil Grayson et al.

4 Notes
1. Tissue can be fresh or frozen, but must be of high quality forthe jumping library. DNA degradation can be examined on agel as seen in Fig. 6.
2. The Apollo 324 NGS Library Preparation System was utilizedalongside the Wafergen Biosystems PrepX ILM 32i DNALibrary Kit for fragment library preparation in this protocol.This is not essential. The steps pertaining to use of the Apolloand this kit can be replaced with protocols from other librarypreparation kits if these libraries will be made entirely by hand,so long as the fragment library created this way is the appropri-ate size (i.e., the insert size is small enough, or the reads arelong enough, that the paired-end sequencing reads willoverlap).
3. When setting up the Apollo, only use Wafergen Apollo con-sumables unless otherwise instructed.
4. The compute required for ALLPATHS-LG is quite sizable,with our assemblies ranging from 257 to 389 GB of peakmemory. If your lab does not have access to a supercomputeror server for this step, check with other departments at theuniversity (e.g., physics and structural chemistry). Two addi-tional options available in the United States are Amazon WebServices (available at https://aws.amazon.com/ec2/?nc2¼h_m1) and the Extreme Science and Engineering Discovery Envi-ronment (XSEDE), funded by the National Science Founda-tion (available here: https://www.xsede.org/) [29]. To obtainALLPATHS-LG, follow the link provided in the methods sec-tion to download the latest version and the ALLPATHS-LGmanual. To install ALLPATHS-LG, consult the system admin-istrator and the ALLPATHS manual. Regardless of computeresources utilized, speaking with a system or network adminis-trator is always a good place to start when planning to installand/or run a memory-intensive program.
5. Prior to using any buffer, enzyme, etc. from a kit, ensure that itis completely thawed. Mix as directed and spin briefly (a fewseconds) in a tabletop minicentrifuge to collect the volume inthe bottom of the tube. Always keep enzymes on ice when inuse and return them promptly to �20 �C when not in use(unless otherwise instructed).
6. Although recommended in the protocol for the E.Z.N.A. Tis-sue DNA Kit (as well as many other DNA extraction proto-cols), do not vortex your samples during DNA extraction asthis could shear DNA, resulting in lower-quality jumpinglibraries. Flick-mix by holding the tube near the lid and flickingthe bottom portion repeatedly.
Avian Comparative Genomics 41
7. As described in the E.Z.N.A. Tissue DNA Kit Protocol, differ-ent tissues will require varied incubation times for successfullysis. Mechanically cutting the tissue into small pieces prior tothe lysis will speed the process up substantially. The incubationtime and agitation method might require some optimization inyour laboratory in order to get the highest-quality DNA fromyour available tissue. Decreasing lysis time and speed of agita-tion could reduce shearing of DNA during lysis.
8. To obtain the most accurate quantification of samples, aim toread each tube as close to 2 min after the addition of thesample/standard and the vortex mixing. Leaving approxi-mately 30–60 s between mixing of each sample or standardwill allow time for the reading and recording of measurements.
9. Do not allow the sample to run with visible bubbles, since thesecan interfere with Covaris shearing.
10. Throughout this protocol, it is recommended that AxygenMaxymum Recovery 1.7 mL microcentrifuge tubes should beused to minimize product loss. Care should be taken by theunfamiliar when opening and closing these tubes, since thesame properties that allow for maximum recovery of the prod-uct also provide an environment from which the product willsometimes “jump” when agitated. It is recommended thattime is spent practicing with small volumes of water in thesetubes before beginning a library preparation.
11. Incubation in RSB prior to the elution spin with the Zymo kithas been increased to 5 min with no discernible differences(positive or negative) on the outcome of the protocol.
12. Prior to freezing (or continuing on with the protocol), theNextera Mate Pair Reference Guide suggests running 1 μL ofproduct mixed with 7 μL of water in an Agilent DNA 12000Bioanalyzer run to assess the tagmentation (this protocolrequires a different kit than the Agilent HS DNA Bioanalyzerrun described in steps 3–24 in Subheading 3.4). Our labora-tory has never carried out this quality control step for thegeneration of many 3 kb jumping libraries (and one 6 kbjumping library), but it can be utilized to determine the distri-bution of sizes created by the tagmentation reaction in order toinform size selection ranges on the Pippin Prep. The protocoldescribed herein appears to work well in our hands to generate3 kb jumping libraries without the need to visualize the sizedistribution at this stage.
13. Add ethanol slowly to avoid disturbing beads on tube wall. Ifbeads are disturbed, allow adequate time for beads to settlesince your library is bound to the beads at this stage. Bemindful of the tendency for a sample (especially when com-bined with beads) to “jump” from the Axygen Maxymum
42 Phil Grayson et al.

Recovery 1.7 mL microcentrifuge tubes when the tubes aresnapped open or closed.
14. When removing and replenishing buffer to the Elution Mod-ules of the Pippin Prep Cassette, gently insert pipette tip intomodule until the bottom is reached (if the tip is not longenough or the wrong shape, use different tips). The bottomof the module is sticky or tacky. Slowly dislodge the pipette tipfrom the bottom and pipette as close to the bottom as possible.Avoid introducing bubbles by following this procedure andnot pushing past the first resistance on the pipette (do notblow out). This same strategy applies to removing sampleonce the run has completed. Additionally, the starting buffervolume of 40 μL does not fill the entire depth of the ElutionModule (total space is ~65 μL). Do not overfill the ElutionModule.
15. There are two columns on the Pippin Prep continuity testwindow. If the failure appears on the left (the separationlane), do not use the lane. If the failure appears on the right(the elution channel), it is okay to use that channel for refer-ence since there will be nothing to collect. Replacing the 40 μLof electrophoresis buffer in the Elution Module and retestingthe continuity might fix a failure on the elution lane (the rightside of the window).
16. The Zymo purification step described here is a new addition tothe Nextera Mate Pair Reference Guide. Our laboratory hasnot tested this step but based on the Nextera protocol, itshould be included in here.
17. The Nextera Mate Pair Reference Guide provides an expectedyield of 150–400 ng of DNA following the Pippin Prep proto-col. In our laboratory, concentrations between ~1.25 and5 ng/μL are common immediately following the Pippin Prep(prior to the new Zymo purification, while the sample is still in~40–65 μL). This range of concentrations (including thosebelow the expected 150 ng total listed in the Nextera MatePair Reference Guide) has worked well, and there does notappear to be any discernible difference in library qualitybetween those at the low or high end of this range. Loweryields at this step might decrease the diversity of reads, but thishas not been tested in our laboratory.
18. Since bubbles can interfere with Covaris shearing, ensure thatan appreciable volume of sample has not escaped during place-ment of the tube into the tube holder. A small bubble is likelyto form at this stage (which should not be a concern), but alarge bubble could be problematic. Attempt to keep the bubblecontained against the cap so that results are consistent acrosssamples.
Avian Comparative Genomics 43

19. Some planning is useful at this step since base diversity in theadapters is necessary for proper demultiplexing of samples aftersequencing is complete. The Nextera Mate Pair ReferenceGuide suggests the following options if you are multiplexingfour or fewer libraries together for a sequencing run. UseAD006 (with AD012) or AD005 (with AD019) for 2-plexing.For 3-plexing, use AD002 (with AD007 and AD019), AD005(with AD006 and AD015), or either of the 2-plex options withany third adapter. Use AD005 (with AD006, AD012, andAD019), AD002 (with AD004, AD007, and AD016), or any3-plex option and any other adapter for 4-plexing. For anymultiplex above four libraries, utilize any of the 4-plex optionsand then add in additional adapters as needed.
20. The number of cycles for the PCR step can be set between 10and 15 depending on the amount of input DNA (followingPippin Prep) and concerns about library diversity. Fewer cycleswill result in lower overall library yield, but more cycles candecrease library diversity by resulting in overrepresentation ofhighly amplified sequence. In our laboratory, 12 cycles arecommonly used for most preparations with around150–200 ng of DNA following Pippin Prep for 3 kb libraries.The Nextera Mate Pair Reference Guide suggests using onlyten cycles if there are at least 200 ng of DNA following PippinPrep and the jump is less than 8 kb, but 15 cycles if the inputDNA was lower than 200 ng regardless of insert size.
21. The Agilent TapeStation can also be used for quantificationand visualization of the Apollo library but is not compatiblewith the Nextera kit due to the Y-shaped adapters utilized inthe jumping library.
22. A sonicator bath does an excellent job of cleaning the elec-trode. Following this, spray the electrode with 70% ethanol anduse compressed nitrogen to dry. If a sonicator is not available,the electrode should be cleaned immediately after every run asfollows: load 350 μL of nuclease-free water into electrodecleaning chips and rinse the electrode by placing the chip intothe Bioanalyzer and closing the lid for 1 min. Repeat one totwo more times with fresh water. Allow electrode to air dry.
23. Depending upon the success of all library preparation steps andthe number of PCR cycles that were used for each library,1–10 ng/μL is a reasonable starting point. Often the jumpinglibrary will require a 1:10 dilution to reach this concentration,but if some libraries are slightly lower than this range, theycould still sequence well. The KAPA kit will give the bestquantification, and these values should be discussed with atechnician at the sequencing center to plan your multiplex.
24. Possibly the most important aspect of obtaining accurate andprecise measures from the KAPA qPCR step is effective sample
44 Phil Grayson et al.

mixing. Small pipetting errors will accumulate quickly, and ifdilutions are not homogeneous at the time of pipetting, thiswill also add error. Pipette mixing 20–50 times at each mixingstep appears to reduce noise in the final data.
25. Following KAPA library quantification, the technicians at oursequencing center recommend correcting the final nM concen-tration by a factor of 0.75 before multiplexing (e.g., librarycalculated to be 1 nM is reported to the sequencing center as0.75 nM). In their experience, this factor produces optimalcluster density on their sequencers. Contact the technicians atyour sequencing center to determine if they have recommen-dations for any correction following KAPA quantification.
26. Although we currently recommend Trim Galore! as written inthe methods section for the adapter trimming, all genomesdiscussed in this chapter were trimmed using trimmomatic. Itrequires the generation of an adapter’s file that provides trim-momatic with the specific adapter sequences utilized (e.g.,Nextera and Apollo). The command for this is available here:github.com/tsackton/ratite-genomics/blob/master/assembly/trim_fastq.sh
27. THREADS¼{user_choice_based_on_resources} is the numberof threads requested based on system infrastructure. Addition-ally, if assembling an inbred or low polymorphism genome,HAPLODIFY¼FALSE might provide better results, but ourgenomes from wild and zoo specimens have been assembledwith better success using HAPLODIFY¼TRUE.
References
1. Stern CD (2005) The chick: a great modelsystem becomes even greater. Dev Cell 8:9–17
2. Nagai H, Mak S-S, Weng W et al (2011)Embryonic development of the emu, Dro-maius novaehollandiae. Dev Dyn 240:162–175
3. Padgett CS, Ivey WD (1960) The normalembryology of the coturnix quail. Anat Rec137:1–11
4. Murray JR, Varian-Ramos CW, Welch ZS et al(2013) Embryological staging of the ZebraFinch, Taeniopygia guttata. J Morphol274:1090–1110
5. Hillier LW, Miller W, Birney E et al (2004)Sequence and comparative analysis of thechicken genome provide unique perspectiveson vertebrate evolution. Nature 432:695–716
6. Zhang G, Li C, Li Q et al (2014) Comparativegenomics reveals insights into avian genome evo-lution and adaptation. Science 346:1311–1320
7. Jarvis ED, Mirarab S, Aberer AJ et al (2014)Whole genome analyses resolve the early
branches in the tree of life of modern birds.Science 346:1320–1331
8. Zhang G (2015) Bird sequencing project takesoff. Nature 522:34
9. Bonneaud C, Burnside J, Edwards SV (2008)High-speed developments in avian genomics.BioScience 58:587–595
10. Gnerre S, Maccallum I, Przybylski D et al(2011) High-quality draft assemblies of mam-malian genomes from massively parallelsequence data. Proc Natl Acad Sci U S A108:1513–1518
11. Bradnam KR, Fass JN, Alexandrov A et al(2013) Assemblathon 2: evaluating de novomethods of genome assembly in three verte-brate species. GigaScience 2:10
12. Langmead B, Salzberg SL (2012) Fast gapped-read alignment with Bowtie 2. Nat Methods9:357–359
13. Goodwin S, Gurtowski J, Ethe-Sayers S et al(2015) Oxford nanopore sequencing and de
Avian Comparative Genomics 45

novo assembly of a eukaryotic genome.Genome Res 25(11):1750–1756
14. Rhoads A, Au KF (2015) PacBio sequencingand its applications. Genomics, ProteomicsBioinformatics 13:278–289
15. Gordon D, Huddleston J, Chaisson MJ et al(2016) Long-read sequence assembly of thegorilla genome. Science 352:aae0344
16. Mostovoy Y, Levy-Sakin M, Lam J et al (2016)A hybrid approach for de novo human genomesequence assembly and phasing. Nat Methods13:12–17
17. Weisenfeld NI, Kumar V, Shah P et al (2017)Direct determination of diploid genomesequences. Genome Res 27(5):757–767
18. Siepel A, Bejerano G, Pedersen JS et al (2005)Evolutionarily conserved elements in verte-brate, insect, worm, and yeast genomes.Genome Res 15:1034–1050
19. Visel A, Prabhakar S, Akiyama JA et al (2008)Ultraconservation identifies a small subset ofextremely constrained developmental enhan-cers. Nat Genet 40:158–160
20. Lowe CB, Kellis M, Siepel A et al (2011) Threeperiods of regulatory innovation during verte-brate evolution. Science (New York, NY)333:1019–1024
21. Lowe CB, Clarke JA, Baker AJ et al (2015)Feather development genes and associated reg-ulatory innovation predate the origin of dino-sauria. Mol Biol Evol 32:23–28
22. Marcovitz A, Jia R, Bejerano G (2016)“Reverse genomics” predicts function ofhuman conserved noncoding elements. MolBiol Evol 33:1358–1369
23. Hiller M, Schaar BT, Bejerano G (2012)Hundreds of conserved non-coding genomicregions are independently lost in mammals.Nucleic Acids Res 40:11463–11476
24. Seki R, Li C, Fang Q, Hayashi S, Egawa S, HuJ, Xu L, Pan H, Kondo M, Sato T, MatsubaraH, Kamiyama N, Kitajima K, Saito D, Liu Y,Thomas M, Gilbert P, Zhou Q, Xu X, ShiroishiT, Irie N, Tamura K, Zhang G (2017) Func-tional roles of Aves class-specific cis-regulatoryelements on macroevolution of bird-specificfeatures. Nat Commun 8:14229
25. Booker BM, Friedrich T, Mason MK et al(2016) Bat accelerated regions identify a batforelimb specific enhancer in the HoxDLocus. PLoS Genet 12(3):e1005738
26. Eckalbar WL, Schlebusch SA, Mason MK et al(2016) Transcriptomic and epigenomic charac-terization of the developing bat wing. NatGenet 48:528–536
27. Domyan ET, Kronenberg Z, Infante CR et al(2016) Molecular shifts in limb identity under-lie development of feathered feet in twodomestic avian species. elife 5:1–21
28. Adachi N, Robinson M, Goolsbee A et al(2016) Regulatory evolution of Tbx5 and theorigin of paired appendages. Proc Natl Acad Sci113:10115–10120
29. Towns J, Cockerill T, Dahan M, Foster I,Gaither K, Grimshaw A, Hazlewood V,Lathrop S, Lifka D, Peterson GD, Roskies R,Ray Scott J, Wilkens-Diehr N (2014) XSEDE:accelerating scientific discovery. Comput SciEng 16(5):62–74
46 Phil Grayson et al.


![doi: 10.1007/978-1-4939-9841-8 20 - Springer · dromic repeats/CRISPR-associated endonuclease (CRISPR/ Cas9) system [5, 6], following the observation that the type II Luigi Gnudi](https://static.fdocuments.in/doc/165x107/5f4017f60cb31d56bb0039e5/doi-101007978-1-4939-9841-8-20-springer-dromic-repeatscrispr-associated-endonuclease.jpg)


