Does Vertical Integration Affect Firm Performance ...
46
Does Vertical Integration Affect Firm Performance? Evidence from the Airline Industry Silke J. Forbes University of California, San Diego Mara Lederman Rotman School of Management, University of Toronto Abstract This paper investigates whether the operational performance of vertically integrated firms differs from that of non-integrated firms. Our setting is the U.S. airline industry. All of the large U.S. network carriers use regional partners to operate some of their short- and medium-haul routes. However, some regional partners are owned while others are independent and managed through contracts. Using detailed flight-level data, we estimate whether an airline’s use of an owned - rather than independent - regional partner at an airport affects its delays and cancellations on the flights that it itself operates out of that airport. We find that integrated airlines perform systematically better than non-integrated airlines at the same airport on the same day. Furthermore, we find that the performance advantage of integrated airlines more than doubles on days with highly adverse weather conditions. Because adverse weather requires airlines to make real- time adjustments to their planned schedules, this finding suggests that the benefits of ownership are particularly high when firms need to make a greater number of ex ante non-contracted adaptation decisions. We interpret these findings as providing evidence that independent regionals’ incentives – in particular, their incentives to execute non-contracted schedule adjustments - are less closely aligned with those of the airline for which they are operating. We believe that this work is one of the first to both document the performance implications of vertical integration decisions as well as shed light on the underlying source of this difference. . JEL codes: L22, L25 Key words: Vertical Integration; Firm Boundaries; Firm Performance; Airlines We thank Kenneth Corts, Julie Cullen, Luis Garicano, Robert Gibbons, Scott Masten, Anita McGahan and seminar and conference participants at the Harvard-MIT Organizational Economics Seminar, Loyola Marymount University, the University of Rochester (Simon Business School), the University of Southern California (Marshall School of Business), the University of Toronto (Rotman School of Management), the Allied Social Science Association Conference and the International Society for New Institutional Economics Conference for helpful comments and suggestions. All errors are our own.
Transcript of Does Vertical Integration Affect Firm Performance ...
Does Vertical Integration Affect Firm Performance? Evidence from the Airline Industry
Silke J. Forbes University of California, San Diego
Mara Lederman Rotman School of Management, University of Toronto
Abstract This paper investigates whether the operational performance of vertically integrated firms differs from that of non-integrated firms. Our setting is the U.S. airline industry. All of the large U.S. network carriers use regional partners to operate some of their short- and medium-haul routes. However, some regional partners are owned while others are independent and managed through contracts. Using detailed flight-level data, we estimate whether an airline’s use of an owned - rather than independent - regional partner at an airport affects its delays and cancellations on the flights that it itself operates out of that airport. We find that integrated airlines perform systematically better than non-integrated airlines at the same airport on the same day. Furthermore, we find that the performance advantage of integrated airlines more than doubles on days with highly adverse weather conditions. Because adverse weather requires airlines to make real-time adjustments to their planned schedules, this finding suggests that the benefits of ownership are particularly high when firms need to make a greater number of ex ante non-contracted adaptation decisions. We interpret these findings as providing evidence that independent regionals’ incentives – in particular, their incentives to execute non-contracted schedule adjustments - are less closely aligned with those of the airline for which they are operating. We believe that this work is one of the first to both document the performance implications of vertical integration decisions as well as shed light on the underlying source of this difference. .
JEL codes: L22, L25
Key words: Vertical Integration; Firm Boundaries; Firm Performance; Airlines We thank Kenneth Corts, Julie Cullen, Luis Garicano, Robert Gibbons, Scott Masten, Anita McGahan and seminar and conference participants at the Harvard-MIT Organizational Economics Seminar, Loyola Marymount University, the University of Rochester (Simon Business School), the University of Southern California (Marshall School of Business), the University of Toronto (Rotman School of Management), the Allied Social Science Association Conference and the International Society for New Institutional Economics Conference for helpful comments and suggestions. All errors are our own.

2
I. Introduction
Economists have long been interested in the question of what determines firm
boundaries. There is now a large theoretical literature that seeks to answer this question,
with much of it emphasizing the role of incomplete contracts.1 There is now also a
growing empirical literature that seeks to test predictions of this theory. Most of this
literature develops hypotheses that relate boundary decisions to transaction characteristics
which proxy for the difficult-to-measure variables that appear in the theory.2 For
example, this approach has frequently been used to test whether asset specificity or
complexity – factors that make complete contracts more difficult to write - affect the
likelihood that a transaction is organized internally; see, among others, Monteverde and
Teece (1982), Anderson and Schmittlein (1984), Masten (1984), Masten and Crocker
(1985), Joskow (1985, 1987), and Hubbard (2001).
While evidence on the determinants of firms’ boundary decisions is now plentiful,
evidence on the implications of firms’ boundary decisions remains in short supply. In
particular, there is still little empirical work that examines whether - and by how much -
the tradeoffs identified in the incomplete contracting literature actually affect firms’
outcomes.3 For example, does vertical integration improve investment incentives or
increase the degree of coordination across transactions? Indeed, the dearth of this type of
empirical evidence has recently been noted by several prominent scholars. For example,
in recent work on the implications of vertical integration for investment, Mullainathan
and Scharfstein (2001) state that “…while we know something about the forces that
determine firm boundaries, we know relatively little about how these boundaries affect
actual firm behavior. This is a major limitation in our understanding of the nature of the
firm.” Similarly, speculating on the future of empirical research on firm boundaries,
1 At the broadest level, three perspectives can be considered to co-exist in this literature: agency theory (see Alchian and Demsetz, 1972, and Holmström, 1982), transaction costs theory (see Williamson, 1975, 1985) and property rights theory (see Grossman and Hart, 1986, and Hart and Moore, 1990). Gibbons (2005) provides a summary and attempt to synthesize these theories. 2 See Hubbard (2008) for a more detailed discussion of the evolution of this empirical literature. 3 Lafontaine and Slade (2007) survey the evidence on vertical integration and firm boundaries. Their discussion of the consequences of vertical mergers reveals that there is some evidence on how vertical integration affects variables such as profits, prices and costs. However, most of these papers are testing predictions from market-power based theories of vertical integration (such as double-marginalization or foreclosure) and not from incomplete contracting based theories. The latter is the focus of this work.
3
Hubbard (2008) identifies work that “quantifies the impact of firm boundaries on
economic outcomes” as an avenue worthy of pursuit. Such evidence, however, has been
difficult to establish because obtaining data on relevant outcome measures can be
difficult and because firm boundary decisions will typically be endogenous (Masten,
1993).
This paper overcomes both of these difficulties and provides one of the first
pieces of direct evidence that firms’ boundary decisions affect their operational
performance.4 In particular, we find that, operationally, there is a performance advantage
to vertical integration. Moreover, consistent with much of the theoretical literature, we
find that this advantage increases in settings in which a large number of non-contracted
adaptation decisions are likely to be needed. Our empirical setting is the U.S. airline
industry. The large U.S. network carriers, often called “majors”, employ regional airlines
to operate flights on low-density short and medium-haul routes. A regional may be
independently owned and contract with one or more major carriers. Or, a regional may
be wholly-owned by the major with which it partners. There is substantial variation, both
across and within airlines, in the use of owned and independent regional airlines.
To investigate the relationship between vertical integration and operational
performance, we estimate whether use of an owned – rather than independent – regional
at a particular airport affects a major’s performance on the flights that it itself operates
out of that airport. Our empirical setting provides us with four important benefits. First,
we have access to two very detailed flight-level measures of operational performance –
delays and cancellations. Second, we observe many airports at which some majors use
owned regionals while others use independent regionals. This allows us to include fixed
effects for each origin airport-day combination in our regressions, in addition to a rich set
of airline-airport level control variables. Thus, we are able to measure whether – at a
given airport, on a given day - the operational performance of majors using owned
regionals differs from that of majors using independent regionals. Third, our setting
provides us with a credible way of measuring the likelihood that majors will need to
make adjustments to their regionals’ schedules that were not covered in their initial
4 We use the term “operational performance” to distinguish what we measure from measures of overall performance such as profits.
4
contracts. Adverse weather such as heavy rain or snow will necessitate delays and/or
cancellations – for example, because takeoffs and landings need to be spread out or
because planes need to be de-iced. Thus, we can use measures of the daily weather at the
departure airport of a route as proxies for the likelihood that a major and its regional will
need to engage in schedule changes not covered by their initial contract. This allows us
to estimate whether the relationship between ownership and performance changes when
the likelihood of ex ante non-contracted adaptation decisions increases. Finally, the
network structure of the industry allows us to derive instruments for the potentially
endogenous vertical integration decision.
Our results indicate that majors using only integrated regional partners at an
airport experience departure delays that are, on average, 3.3 minutes shorter than those
experienced by majors using only independent regionals. The cancellation rates of
integrated majors are also lower, by about 0.6 percentage points. These are sizeable
effects, given that the average departure delay in our sample is about 13 minutes and the
average cancellation rate is 4 percent. When we allow the effect of ownership to vary
with daily weather conditions, we find that the performance advantage of majors using
owned regionals increases to about 6.5 minutes on days with extreme rain. The results
that use snow as our measure of adverse weather are somewhat weaker, likely due to
measurement issues. However, once we restrict to a winter sample and consider both
delays and cancellations, we consistently find that the performance advantage of majors
using owned regionals also increases on days with snow.
After presenting these and other empirical results, we then discuss what we
believe to be the likely cause of the performance differences that we measure. In
particular, we explain that the contracts used in this industry do not provide independent
regionals with incentives that are fully aligned with those of the major carrier, while the
incentives of owned regional partners are likely to be more closely aligned (even if they
are not perfect). In addition, we discuss why contracts that would replicate the incentives
of ownership are unlikely to exist in our setting. As a result of the incentive
misalignment, independent regionals may be less willing to carry out the schedule
adjustments that their majors request, especially if these adjustments – while profit-
maximizing for the major – impose costs on the regional. Because a major’s own flights
5
and its regional flights at an airport are closely integrated, such “feet-dragging” by an
independent regional can negatively impact a major’s operational performance on its own
flights which is precisely what our regressions find.
We believe that this paper contributes to the literature in several important ways.
First, it is one of the first papers to document that vertical integration indeed affects
operational performance. Second, we do this while controlling for the endogeneity of
integration decisions in a very careful way – both with numerous fixed effects and by
instrumenting for the choice to vertically integrate. Finally, our setting provides us with a
unique opportunity to show that the performance advantage that comes with integration
increases with the ex post probability that firms have to make a larger number of ex ante
non-contracted adaptation decisions. This is an effect that, to our knowledge, has not
been documented before and might be difficult to document in many other contexts.
Our work is most closely related to Novak and Stern (2007) who investigate the
relationship between vertical integration and two specific measures of performance for
automobile manufacturers. They find that integrated firms have a lower level of initial
performance but higher performance improvement over the life of the automobile model.
Thus, their work emphasizes the fact that vertical integration has both costs and benefits
and that firms’ organizational form decisions must reflect a tradeoff of the two.
Similarly, although we find robust evidence of a performance benefit of ownership, one
should not interpret our findings as implying that majors would always better off if they
integrated with their regional carriers. While we are only able to measure the benefits of
integration in our setting, we recognize that there are costs to integrating with a regional
carrier, most notably higher labor costs (see Forbes and Lederman, 2007a).5 Airlines will
trade off these costs against the benefits of integration when deciding which
organizational form to choose.
This paper is also related to a small literature that estimates the effects of vertical
integration on other economic outcomes such as investment, prices or costs.6 Like our
5 Their work investigates how market characteristics affect the choice to vertically integrate and suggests that airlines choose their optimal organizational form by trading off the benefits and costs of vertical integration. Our work here shows that there are indeed measurable benefits to integration and provides evidence on the source of these benefits and their magnitude. 6 As mentioned in footnote three above, Lafontaine and Slade (2007) provides a comprehensive survey of this work.

6
paper, some of this work – such as Ciliberto (2006) on the hospital industry and Kosova
et al. (2007) on the hotel industry – is also motivated by incomplete contracting based
theories of vertical integration while many others are motivated by market power based
theories. Finally, this paper is also related to a small literature that looks at the overall
performance consequences of choosing an organizational form that is inconsistent with
the transaction environment. This literature on so-called “transactional misalignment”
originates with Masten et al. (1991) and includes a number of recent contributions mostly
from the strategy field.
The remainder of the paper is organized as follows. Section II presents the
industry background. Section III describes our empirical approach. Section IV addresses
data and measurement issues and we present our results in Section V. In Section VI, we
discuss the likely sources of the performance differences that we find. A final section
concludes.
II. Industry Background7
Regional airline service represents a large and growing fraction of U.S. domestic
air travel. In 2000, the year of our sample period, about one out of every seven domestic
passengers was traveling on a regional carrier. Regional airlines operate as
“subcontractors” for major U.S. network carriers on low-density short and medium-haul
routes.8 These are routes which are most efficiently served with small aircraft - either
turbo-prop planes or regional jets. Majors subcontract these routes to regional airlines
because regionals have a cost advantage in operating small aircraft. This cost advantage
results from the substantially lower compensation that regional airline employees receive,
relative to the compensation of the major’s own employees.9 It is worth pointing out that
the major network carriers do not operate any small aircraft themselves. Thus, a major’s
7 For a detailed description of the role of regionals in the U.S. airline industry, we refer the reader to Forbes and Lederman (2007b). 8 Examples of such routes include Boston to Burlington, VT, or New York City to Albany, NY. 9 See Forbes and Lederman (2007a) for a discussion of the source of lower labor costs among regional airline employees.
7
decision whether to use a regional to serve a particular route is effectively a decision
about the type of plane to use for that route.10
Regional airlines operate under codeshare agreements with one or more major
carriers. Under these agreements, the regional operates flights on behalf of the major
carrier, who markets and tickets these flights under its own flight designator code. In
addition to using the major’s code, the regional’s flights also share the major’s brand.
Thus, for example, Delta’s regional Comair operates under the name Delta Connection.
Tickets on Comair’s flights are sold by Delta through the same channels that Delta sells
its own tickets. To facilitate passenger connections between a major and its regional,
their schedules, as well as check-in and baggage handling, are closely coordinated.
While one could imagine a variety of governance forms in the relationships
between majors and regionals, empirically we observe two distinct organizational forms.
Either a regional will be independently owned and contract with one or more major
carriers, or a regional will be wholly-owned by the major with which it partners.11 Table
1 lists the major-regional partnerships that were in place in 2000 for the carriers in our
sample. Regional carriers that appear in bold were fully owned by their major partner.
The table shows that there is substantial heterogeneity both across and within majors in
the extent to which regional partners are owned. Some majors own all of their regional
partners, others own none and yet others use a mix of owned and independent regional
carriers.
In the case of an owned regional, the major carrier owns the assets of the regional
but the regional and the major maintain separate operations. The main reason they
separate their operations is so that they can maintain distinct labor contracts (one for the
major’s own employees and one for each of its regional’s employees) and thereby
preserve the cost advantages that regionals provide.12 We use the term “vertical
integration” to refer to the relationship between a major and an owned regional.
10 Forbes and Lederman (2007a) show that the decision to serve a route with a regional carrier is determined by the distance of the route and its density, as measured by endpoint population and hub endpoints. 11 In which case, we do not observe that regional operate flights for competitors of its parent company. 12 If two separate airlines are effectively being operated as a single entity, the unions representing employees at those airlines may file an application with the National Mediation Board (NMB) seeking to have them declared a “single transportation system”. If the application is granted, the unions of the carriers will operate as a single entity.
8
The relationship between majors and independent regionals is governed by
detailed contracts. These contracts specify which routes the regional will serve for the
major, the planes that the regional will use and the schedule of flights. Contracts between
majors and independent regionals generally take one of two forms.13 Historically, most
were revenue-sharing agreements under which the major and regional shared the revenue
from passengers whose itineraries involved travel on both airlines. The last ten years,
however, have seen increasing use of “capacity purchase agreements” under which the
major pays the regional a fixed amount to cover the regional’s operating costs on a block-
hour or flight-hour basis. Capacity-purchase agreements basically allow a major to
purchase the use of the regional’s aircraft and flight crews and other related services.
These agreements are structured so that they insulate a regional from revenue risk but
leave it the residual claimant on profit increases that result from effective management of
costs such as salaries and benefits. Since capacity-purchase agreements have no revenue-
based incentives, they often include incentive payments based on operational
performance or passenger volumes. It is important to emphasize that under both contract
types – revenue-sharing and capacity-purchase – independent regionals face financial
incentives that are based only on the routes that they serve and not on the remainder of
the major’s network.
While contracts between majors and independent regionals specify the schedule
that the major would like the regional to follow, they do not specify the real-time changes
that may have to be made to that schedule. Such changes are common in this industry,
for example as a result of poor weather conditions or air traffic control problems. Real-
time schedule changes are commonly related to flight delays and cancellations. We
therefore briefly explain how rescheduling decisions are made when flying conditions at
an airport dictate that some flights either be held or cancelled. The initial step is that air
traffic control (ATC) decides to reduce the number of allowable takeoffs and landings for
a certain time period. Each airline will be allocated some of the remaining takeoffs and
landings in proportion to the number of flights that the airline had originally scheduled.14
13 This discussion draws on American Institute of Certified Public Accountants (2007) which provides more detail on the various contractual forms in this industry. 14 For example, if ATC decides to reduce the total number of flights by 20 percent, each airline will have to reduce its flights by 20 percent.
9
The airline itself can decide which of its flights to hold or cancel.15 This includes the
major’s own flights and any regional flights that are operated on the major’s behalf.
For both owned and independent regionals, the major decides which flights to
hold or cancel. These decisions then have to be carried out by the regional. It is at this
stage that the regional may not act in the best interest of the major if its incentives
diverge from the major’s. And it is here that the otherwise detailed contracts between
majors and independent regionals are incomplete because they do not specify how
quickly or accurately the regional will carry out the major’s decision. For example, a
regional can engage in “feet-dragging” by slowly deplaning its passengers or not moving
a plane away from its gate as quickly as possible. Because the major and the regional
may share airport facilities, ground crew and departure/arrival slots, this type of behavior
on the part of an independent regional will not only affect the regional’s performance but
may also affect the major’s performance on flights that it operates at the same airport.
III. Empirical Approach
III.A. Empirical Specification
To examine the relationship between ownership and operational performance, we
investigate whether use of an owned – rather than independent – regional at an airport
affects a major’s performance on the flights that it itself operates out of that airport.16 To
implement this, we estimate flight-level regressions in which we regress a major’s delay
on its extent of integration with the regional carrier(s) that it uses at the origin airport of
the flight. We exploit the fact that there are many airports at which some majors use
owned regionals while others use independent regionals and include fixed effects for each
origin airport-day combination in our model. Thus, our estimates of the relationship
between ownership and operational performance are identified from within-airport, cross-
airline variation in organizational form. Put another way, our regressions measure
whether – at a given airport, on a given day - the operational performance of majors
using owned regionals differs from that of majors using independent regionals. 15 In some instances, weather conditions at a flight’s arrival airport dictate that the flight be held at its departure airport. We control for this in our empirical estimation with weather conditions at the arrival airport. 16 Data limitations prevent us from also looking at the impact of ownership on the regional’s operational performance because most regionals are too small to meet BTS reporting requirements.
10
Specifically, we estimate the following equation: tifr
tr
tirir
to
tifr ZXOWNEDPERF εγβδα ++++= 1 (1)
where tirPERF is a measure of airline i’s operational performance on flight f on route r on
day t, toα is an origin airport-date fixed effect, irOWNED measures the extent of airline
i’s ownership of its regionals serving the origin airport of route r, tirX is a vector of
airline-origin and airline-destination control variables (such as the airline’s scale of
operations at the origin), trZ is a vector of (non-airline specific) destination airport
control variables (such as the daily weather conditions at the airport)17, and tifrε is an
error term. Our first set of results focuses on the coefficient 1δ which measures the
average difference in the operational performance of majors using owned and majors
using independent regionals. If there are operational performance benefits to ownership
of a regional, then we should find 1δ <0.
After estimating the average relationship between ownership and operational
performance, we then explore this relationship in a more nuanced way in an attempt to
shed light on what may account for the performance effects of ownership. In particular,
much of the theoretical literature on vertical integration implies that ownership would
have no effect on economic outcomes if contracts were complete. As described in
Section II, contracts between majors and regionals are incomplete since they cannot
specify ex ante the real-time adjustments that a major may have to make to its regional’s
schedule. To investigate whether the performance effects of ownership may result from
the incompleteness of contracts with independent regionals, we identify days on which a
major is more likely to have to make unanticipated changes to its set schedule of flights
due to poor weather conditions. We use measures of the daily weather at an airport as
proxies for the likelihood that flights arriving at or departing from that airport will be
affected by non-contracted schedule adjustments. We interact these weather measures
with our measure of ownership to test if ownership has a different effect on operational
performance on days with particularly adverse weather conditions. We do this by
estimating the following modified version of equation (1):
17 Non-airline specific origin airport controls are captured by the origin airport-date fixed effects.
11
tifr
tr
tir
tririr
to
tfir ZXWEATHEROWNEDOWNEDPERF εγβδδα +++++= *21 (2)
where, trWEATHER is a vector of variables that measure the extent of adverse weather at
the origin airport of route r on day t.18 If there are performance benefits to ownership and
if these are greater on days with adverse weather, then we would find both 1δ <0 and
2δ <0.
III.B. Endogeneity
Because ownership decisions are made by optimizing firms, ownership variables
will typically be endogenous in a performance equation (see Masten, 1993, and Gibbons,
2005). While this is true in our setting as well, endogeneity of the ownership variables in
equations (1) and (2) is perhaps not as large a concern as it might be in other settings.
First, recall that we are measuring if a major’s choice of what type of regional to use for
its regional routes at an airport affects its operational performance on the routes that it
itself serves from that airport. Therefore, any unobservables that we would be concerned
about must be correlated with an airline’s ownership decision on one set of routes and
also affect its performance on a different set of routes.19 Second, recall that we include
origin airport-date fixed effects in all of our models. Therefore, we already control in a
very flexible way for unobservable airport characteristics that may be correlated with
both ownership decisions and airlines’ operational performance. Or, put differently,
because our identification comes from variation across airlines at a given airport, the
endogeneity of the ownership variables must result from unobservables that are
correlated with a particular airline’s ownership decision at an airport and its operational
performance on routes that depart from that airport. For example, suppose that airlines
are more likely to use owned regionals at their hubs and also systematically experience
longer flight delays at their hubs. If we are unable to perfectly control for the relationship
between being a hub carrier and delays, then comparing the performance of majors using
owned regionals at an airport with majors using independent regionals at the airport
18 In both equation (1) and (2), the uninteracted effects of the origin airport weather variables are captured by the origin airport-date fixed effects. 19 However, such unobservables very well may exist since the two sets of routes depart from the same airport and therefore may both be affected by airport or airline-airport characteristics.

12
might confound the effects of using an owned regional with the effects of being a hub
carrier.
We account for this endogeneity concern by instrumenting for airlines’ ownership
decisions. The logic of our instrumental variables approach is best illustrated with an
example (see Figure 1 for a representation of this example). Recall that our ownership
variable measures a major’s extent of ownership with the regional(s) that it uses at a
particular airport - for example, the extent to which Delta uses an owned regional to serve
its regional routes into and out of the Boston airport (routes such as Boston-Albany or
Boston-Burlington).20 We are concerned that there may be unobservable factors that both
affect Delta’s incentives to use an owned regional for these routes as well as affect
Delta’s performance on the routes that it itself serves out of Boston (routes such as
Boston-Atlanta or Boston-Tampa). We require instruments that are correlated with
Delta’s ownership decision in Boston but which do not otherwise affect Delta’s
performance on routes such as Boston-Atlanta. We use characteristics of the endpoint
airports that Delta’s regionals connect to Boston as instruments for Delta’s ownership
decision at the Boston airport – i.e.: we use characteristics of Albany and Burlington as
instruments for Delta’s ownership decision at the Boston airport. In particular, we use
the characteristics that Forbes and Lederman (2007a) found to predict owned regional
use. These characteristics are the average weather conditions at an airport and the extent
to which these airports are integrated into Delta’s network.21 We expect that the average
weather conditions and the degree of network integration of the Albany and Burlington
airports will be correlated with Delta’s ownership decision on these routes but should not
otherwise be correlated with Delta’s performance on other routes that it serves out of
Boston.
While one might question the validity of these instruments given that delays are
thought to propagate through an airline’s network, for several reasons we do not expect
this to be much of a concern in our specific setting. First, aircraft and crew are not shared
across majors and regionals. Thus, the primary mechanism through which delays
20 As we explain in the next section, we measure Delta’s ownership decision at the Boston airport as the sum of its ownership decisions on the regional routes that it operates from the Boston airport. 21 The precise construction of the instruments and the data used for the instruments are described in Appendix A.

13
propagate – aircraft and crew not being where they need to be – does not operate here.
Second, although passengers connect between regional and major flights, if airlines hold
outgoing flights for late incoming passengers, it is typically only the last flight of the day
and we can control directly for this. Finally, to the extent that some correlation in delays
does exist (for example, due to shared airport facilities), it would lead our results to be
biased towards finding that majors using owned regionals perform worse since the work
by Forbes and Lederman (2007a) shows that airlines vertically integrate on routes that are
more likely to experience schedule disruptions.
IV. Data and Measurement
IV.A. Data Sources
Our primary source of data is flight-level on-time statistics from the U.S. Bureau
of Transportation Statistics. This is a flight-level database which contains every flight
operated by all major U.S. carriers.22 We augment these data with information from
several other sources. Data from the Official Airline Guide (OAG) provide us with the
complete flight schedules of all domestic airlines, regionals as well as majors.23 The
OAG data allow us to measure an airline’s total scale of operations as well as the scale of
operations of each of its regional partners, at each airport at which it operates. We
combine these data with information from the Regional Airline Association (RAA) that
shows which regional airlines are owned by a particular major. Together, the OAG and
RAA data allow us to calculate an airline’s extent of vertical integration with its regionals
at each airport at which it operates. Finally, data on the daily weather at each airport are
taken from the National Oceanographic and Atmospheric Administration (NOAA).
IV.B. Construction of the Sample
Our sample year is 2000. Our sample includes all domestic flights operated by
the seven largest network carriers (American, Continental, Delta, Northwest, TWA,
22 Carriers are required to report these data if they account for at least one percent of domestic passenger revenues in the prior year. 23 Our data provide a representative week for each quarter.

14
United and US Airways) departing from the largest 100 U.S. airports.24,25 Beginning
with this sample, we then impose the following restrictions. First, we exclude flights that
depart from or arrive at airports in Alaska, Hawaii, Puerto Rico, Guam or the U.S. Virgin
Islands. This drops eight of the largest 100 airports. Second, because our empirical
approach exploits variation across airlines at an airport in organizational form, we
exclude departure airports at which we do not observe at least one major using each type
of regional. This drops 44 of the largest 100 airports. Third, we drop flights on days for
which any of our weather data for the endpoint airports are missing. Fourth, we exclude
routes to or from New York’s LaGuardia airport because LaGuardia changed its slot
control rules during 2000, resulting in a large increase in delays (see Forbes, forthcoming,
for details). Fifth, because we are relating a major’s departure delay on a route to its
vertical integration with a regional at the departure airport, we exclude routes that depart
from an airport at which the major does not use a regional at all. Finally, we exclude
flights on Saturdays and Sundays so that the variation in an airline’s extent of vertical
integration is not simply capturing within-week fluctuations in regional use. Our final
dataset includes 1,405,729 flights departing from 47 departure airports and arriving at
143 arrival airports on 260 days.
IV.C. Variables
Variable names and definitions appear in Table 2a. Summary statistics are in
Table 2b.
i. Performance and Ownership Measures
Our main dependent variable is Departure Delay which measures the time
between the scheduled departure and the actual departure of an aircraft from the gate.26 If
the actual departure takes place before the scheduled departure (i.e.: a flight departs
24 All of the traditional network carriers employ regionals to some extent. The so-called “low-cost carriers”, such as Southwest Airlines, generally do not subcontract flights to regional carriers. 25 Airport rankings are based on year 2000 enplanements and are compiled by the Federal Aviation Administration. Airport size decreases quite rapidly. For example, the largest airport based on enplanements is Atltanta (39,277,901 passengers), the 20th largest airport is Philadelphia (12,294,051 passengers), the 50th largest is San Antonio (3,528,955) and the 100th largest is Harrisburg (644,180). 26 Thus, our delay measure does not include delays that occur on the runway. We do this intentionally since delays on the runway are less likely to be under the airline’s control.

15
early), we set Departure Delay to zero.27 As reported in Table 2b, the average delay in
our sample is 13 minutes. In some specifications, we replace Departure Delay with
Cancelled which is a dummy variable that equals one if the flight is cancelled. About 4%
of flights in our sample are cancelled. We choose not to include arrival delays in our
analysis because arrival delays are influenced by wind and storm conditions during the
flight, and are thus a fairly noisy measure of an airline’s performance. In contrast, both
departure delays and cancellations are, to a larger extent, under the control of the airline.
To measure the extent of a major’s vertical integration with its regionals at an
airport, we construct Fraction Owned which measures the fraction of all regional flights
that a major has departing from an airport on a day that are operated by a regional that is
owned.28 As Table 2b indicates, the mean of Fraction Owned is 0.51.
ii. Weather Measures
The NOAA data contain daily observations from airport weather stations on the
minimum, average and maximum temperature, and the total accumulated precipitation
(measured in inches). Based on these data, we construct Rain which measures
precipitation on days on which the average temperature is above 32 degrees Fahrenheit
and Snow which measures precipitation on days on which the average temperature is 32
degrees Fahrenheit or less.29 As indicated in Table 2b, the average daily rainfall in our
sample is 0.11 inches and the average daily snowfall is 0.10 inches. Of course, there are
many days on which there is no snow and many airports for which there is never any
snow.30
Our empirical approach requires us to measure “adverse” weather – i.e.: weather
conditions that are likely to necessitate schedule adjustments. We do this in two ways.
First, we use the continuous variables Rain and Snow directly. Second, we attempt to
capture extreme weather. We calculate the 95th percentile of the daily rain distribution
for each airport in our sample. We then construct the dummy variable Rain>95th 27 We run a robustness check in which we leave early departures as negative delays and the results are robust to this change. 28 Note that some majors use owned as well as independent regionals at the same airport. Fraction Owned can therefore take on other values than 0 and 1. 29 We assume an average water equivalent for snow of 8%, i.e. we convert 0.01 inch of accumulated precipitation on days with below freezing temperatures into 0.125 inches of accumulated snow. 30 For this reason, we also present specifications that are only estimated on a “winter” sample.

16
Percentile which equals one if the observed rainfall at the departure airport of a route
exceeds the 95th percentile of that airport’s rain distribution. Thus, roughly speaking,
Rain>95th Percentile captures an airport’s 18 rainiest days of the year.31 We construct
Snow>95th Percentile analogously. The mean of Rain for observations with Rain>95th
Percentile equal to one is 1.26 inches and the mean of Snow for observations with
Snow>95th Percentile equal to one is 3 inches. We construct all of the weather variables
for the both the departure and arrival airport of a flight.
Using the within-airport rain distribution to identify days with “extreme weather”
has two benefits. First, it accounts for the fact that the same weather occurrence may
have a different impact at different airports, depending on that airport’s regular weather
patterns. This is particularly important for the snow measure since a small amount of
snow will generally be a much bigger disruption in a city that does not usually experience
much snow than in a city with regular snowfall.32 Second, this approach to defining days
with extreme weather ensures that bad weather events are observed at all airports in our
sample.33 If we defined extreme weather based on an absolute amount of rain or snow,
then we would only observe extreme weather events at a smaller set of airports.
iii. Airline-Airport Level Control Variables
We control for an airline’s overall scale of operations at the origin airport of a
route as well as its scale of regional operations. We use the OAG data to construct Total
Flights which equals the total number of flights per day that a major has departing from
an airport (including regional flights) and Regional Flights which equals the total
number of daily regional flights that a major has departing from an airport. We construct
these measures for the both the departure and arrival airport of a route, though our main
specifications only control for the airline’s size at the departure airport. In Appendix B,
31 Note that days on which this dummy is equal to zero do not necessarily have zero rain and may still require unanticipated schedule changes. We are simply using this measure to try to capture the difference between the worst days and all other days. 32 Of course, the flip-side of this is that these measures may treat weather events that are very different in absolute terms as equivalent. 33 This is true for the rain measure but not for the snow measure since some airports never experience any snow. However, we have some specifications where we restrict to a “winter” sample that includes only airports that experience some snowfall.

17
we present specifications that add airline-specific characteristics of the arrival airport as
well as specifications that measure an airline’s scale of operations in an alternate way.
iv. Airport Level Characteristics
We construct several variables that measure airport characteristics that can affect
departure delays and/or the likelihood of cancellations. We construct these variables for
both the departure and arrival airports of a flight. However, in most specifications, the
departure airport variables will not be separately identified from the fixed effects that we
include. Note that conditions at the arrival airport can affect departure delays, especially
if the arrival airport has issued a so-called ground stop, which orders all flights that are
scheduled for landing to remain at their departure airport until the ground stop is lifted.
The first variable that we construct is Slot which is a dummy for whether the
airport is slot-controlled.34 We expect delays to be greater at slot-controlled airports
because these airports are highly congested. We also construct Airport Flights which
measures the total number of domestic flights scheduled to depart from (arrive at) an
airport on a given day.35 We construct both of these variables for the departure and
arrival airports of a flight.
V. Results
V.A. First-stage Results
Table 3 presents the results of our first stage regression of Fraction Owned on our
instruments and our exogenous variables. Recall that – for an observation such as a Delta
flight between Boston and Atlanta - our instruments for Delta’s degree of ownership of
its regional(s) at the Boston airport include average characteristics of the endpoint
airports that Delta connects to and from Boston using a regional partner. As the estimates
in Table 3 indicate, all of the instruments have highly significant effects and the signs of
the effects are as in Forbes and Lederman (2007a). Specifically, owned regionals are
more likely to be used when a greater fraction of the regionals’ routes arrive at one of the 34 In our sample, the slot-controlled airports are Chicago O’Hare, John F. Kennedy in New York, and Reagan National in Washington, DC. We have excluded LaGuardia Airport in New York (see above). 35 Airport Flights is constructed from the OAG data which only provide a representative flight schedule for one week of each quarter. Therefore, Airport Flights takes the same value for each Monday of a quarter, each Tuesday of a quarter, etc…
18
major’s hubs and when the endpoints served by the regionals experience greater annual
rain and snowfall. Endpoints with more months with below freezing temperatures are
less likely to be served by owned regionals.36 Joint significance of the instruments is
confirmed by the F-statistics presented at the bottom of Table 3. Most of the other
explanatory variables also have highly significant coefficients.37 The R-squared of the
regression is 0.52.
V.B. The Effect of Ownership on Operational Performance
Table 4 presents the results of estimation of equation (1). In the first column, we
ignore the potential endogeneity of Fraction Owned as well as omit the airport-date fixed
effects. While this simple OLS model is not our preferred specification, it provides a
useful starting point because it allows the coefficients on all of the control variables -
many of which will later be absorbed by fixed effects - to be directly estimated. The
coefficient on Fraction Owned is negative and statistically significant, indicating that
majors that use owned regionals for a larger fraction of their regional flights at an airport
experience shorter delays on their own flights that depart from that airport. The point
estimate implies that majors using only owned regionals experience delays that are 2.8
minutes shorter on average than those experienced by majors using only independent
regionals.
The coefficients on the various sets of control variables in this regression all have
reasonable signs and magnitudes. The estimates on Total Flights and Regional Flights
indicate that flight delays are decreasing in an airline’s total number of flights at the
airport, but increasing in the airline’s number of regional flights. The first effect suggests
that airlines with more total flights at an airport are better able to manage delays.
However, controlling for an airline’s total number of flights, having more regional flights
(of either type) at an airport leads to longer departure delays (on flights operated by the
major itself). This second effect likely results from the fact that large jets cannot take off
as quickly after small aircraft as they would after other large jets. Since airlines tend to
have many of their flights take off at the same time to facilitate passenger connections,
36 Forbes and Lederman (2007a) explain that this result is consistent with the observation that those airports have shorter delays on average. 37 The first-stage regressions also include departure airport-date fixed effects.
19
this will lead to longer delays for a carrier that has a large number of regional flights at an
airport.38 The estimates on the airport-level control variables indicate that flights
departing from or arriving at slot-controlled airports and airports with more total flights
experience longer departure delays. The coefficients on Rain>95th Percentile and
Snow>95th Percentile confirm that rainfall or snowfall that is above the airport’s 95th
percentile causes significant flight delays - approximately 9 minutes of delay if the rain or
snow is at the departure airport and 6 minutes of delay if the rain or snow is at the arrival
airport.
In the second column of Table 4, we add the airport-date fixed effects. With the
inclusion of these fixed effects, Fraction Owned is now identified only by variation in
ownership across airlines at a given airport. The coefficient on Fraction Owned in (4-2)
is again negative and highly significant. Relative to (4-1), the point estimate is slightly
larger in absolute value, suggesting there may be some correlation between use of an
owned regional and unobserved airport characteristics that lead to longer delays. The
airport-date fixed effects absorb the departure airport control variables. The coefficients
on the other control variables are quite similar to those in (4-1) though the estimates on
the arrival airport weather measures are somewhat smaller.
In the third column of the table, we instrument for Fraction Owned using the
instruments described in Section III and estimate the performance equation using two-
stage least squares. We again include airport-date fixed effects. The estimate on
Fraction Owned in this specification is almost identical to that in (4-2) suggesting that
endogeneity of this variable is not that large of a concern. This is perhaps not too
surprising in our context given that the airport-date fixed effects already control for
airport-level unobservables while the main airline-airport characteristic that could be
correlated with ownership – namely, an airline’s scale of operations at the airport – is
explicitly controlled for in the regression. The estimate on Fraction Owned implies that
majors using only owned regionals at an airport experience flight delays that are
approximately 3.3 minutes shorter than the delays experienced by majors at the same
airport and on the same day using only independent regionals. Given that the average
38 This explanation is consistent with Rupp (2005) which finds that smaller aircraft experience significantly longer flight delays.
20
departure delay in our sample is about 13 minutes, this effect is economically quite
significant.39
In the final column of Table 4, we re-estimate (4-3) using Cancelled as the
dependent variable.40 We are interested in seeing if the same relationship between
ownership and performance emerges when performance is measured based on
cancellations. As well, we want to ensure that the shorter delays that majors using owned
regionals experience are not coming at the cost of higher cancellation rates. The results
from (4-4) suggest that this is not the case. The coefficient on Fraction Owned in (4-4)
is negative and statistically significant indicating that majors using owned regionals at an
airport also experience fewer cancellations than majors using independent regionals at
that same airport. Overall, the results in Table 4 clearly suggest that use of an owned -
rather than independent – regional at an airport improves a major’s operational
performance at that airport.
Having established this basic relationship between ownership and performance,
we now explore this relationship in a more nuanced way. In particular, in Table 5, we
add interactions between Fraction Owned and our measures of adverse whether to
investigate whether the relationship between ownership and performance is different on
days on which non-contracted schedule changes are more likely. As mentioned above,
much of the literature on vertical integration emphasizes the role of incomplete contracts.
If complete contracts cannot be written, then integrated and non-integrated firms may
perform differently, especially in situations not covered by contracts. Table 5 explores
whether this is true in our setting. Note that for ease of presentation, we only present the
coefficients on Fraction Owned and its interactions with Rain>95th Percentile and
Snow>95th Percentile. Appendix Table B-2 shows the coefficients on all of the control
variables included in the first specification of this table.41 We instrument for Fraction
Owned and its interactions in all specifications in Table 5.42
39 The results in Forbes (forthcoming) imply that these longer delays would translate into an average reduction in the price of each ticket sold of $4.69 for direct passengers and $2.54 for connecting passengers. 40 Note that the number of observations varies between the specifications with Departure Delay and Cancelled because Departure Delay is missing for flights that are cancelled. 41 Note that once we interact Fraction Owned with the weather variables, we also interact Total Flights, Regional Flights and Airport Flights with the weather variables to ensure that ownership-weather
21
The first column of Table 5 shows the results of adding the weather interactions to
specification (4-3). We again find a negative and statistically significant coefficient on
Fraction Owned. The magnitude of the coefficient is slightly reduced from its
magnitude in (4-3). We also find a negative and statistically significant coefficient on the
interaction of Fraction Owned with Rain>95th Percentile. These estimates suggest that
using owned regionals provides majors with a performance advantage on all days and
that this advantage increases – and indeed doubles – on days with very adverse weather.
The point estimates imply that - on days with rainfall below the 95th percentile of the
airport’s distribution - majors using only owned regionals at the airport experience flight
delays that are approximately 3.1 minutes shorter than the delays experienced by majors
using only independent regionals. On days with rain above the 95th percentile, the
performance advantage of majors who only use owned regionals increases so that their
delays are about 6.5 minutes shorter than the delays of majors who only use independent
regionals. It is important to note that this specification only provides estimates of the
performance advantage of owned regionals in “good” and “bad” weather since the direct
effect of weather is absorbed by the airport-day fixed effects.43
Interestingly, we do not estimate a significant coefficient on the interaction
between Fraction Owned and Snow>95th Percentile. While this may seem surprising
given that we know that snow can have a large impact on flight schedules, we suspect
that our inability to precisely estimate the effect of snow results from several factors.
First, there may be problems with the way in which we measure snow. In particular, we
have a large number of airports that never experience any snow and we have many
airports that experience only small amounts of snow so that the 95th percentile of their
snow distribution is either zero or a very small number. Second, it may be difficult to
detect differences in how well different airlines at an airport deal with snow because large
amounts of snow may simply shut down airports for periods of time. Finally, it may be
interactions are not capturing the mitigating effects of weather on one of these other variables which may be correlated with Fraction Owned. 42 We instrument for the interaction terms using interactions of our instruments with Rain>95th Percentile and Snow>95th Percentile. 43 That is, the negative coefficient on Fraction Owned*Rain>95th Percentile does not imply that owned regionals have shorter delays on bad weather days than good weather days. Rather, it implies that majors using owned regionals have shorter delays on bad weather days than do majors using independent regionals (i.e.: their performance advantage is greater).
22
the case that snow has more of an effect on cancellations than on delays. To deal with
these issues, in the next table, we restrict our sample to what we call a “winter sample”
and experiment with several different measures of snow. We also use Cancelled as an
alternate dependent variable.
In the remaining columns of Table 5, we include additional fixed effects in the
model. Recall that with the airport-date fixed effects, the relationships in our data are
identified by variation across major airlines at a given airport. However, once we include
interactions of Fraction Owned with the daily weather variables, we can also include
fixed effects for each major airline-origin airport combination. These will control for
unobservable differences in operational performance across airlines at a given airport but
will still allow us to identify the coefficients on the interaction terms using variation
across airlines in the change in their performance when there is adverse weather. While
the disadvantage of this specification is that it does not allow the coefficient on Fraction
Owned to be separately identified, the advantage is that it eliminates any concern that an
airline’s ownership decision at an airport may be correlated with unobservable factors
that affect its operational performance.44
We present the results of this specification in (5-2). The coefficients on the
interactions of Fraction Owned with the two weather measures are hardly affected. The
point estimate on Fraction Owned*Rain>95th Percentile implies that the performance
advantage of majors using owned regionals is about 3.3 minutes greater on days with rain
above the airport’s 95th percentile. The interaction with snow is still insignificant. In the
final column of the table, we slightly relax the airline-airport fixed effects and instead
include simple airline fixed effects. These control for average differences in operational
performance across the seven major airlines in our sample. They also allow the
uninteracted Fraction Owned variable to be identified; however, it is only identified by
the set of carriers who utilizes both owned and independent regionals. With the inclusion
of the airline fixed effects, we do not estimate a significant coefficient on Fraction
Owned. This result suggests that, within the set of airlines that use both types of 44 Intuitively, with these additional fixed effects, the endogeneity concern changes from correlation between ownership decisions and unobservables that affect an airline’s performance at an airport to correlation between ownership decisions and unobservables that affect an airline’s change in performance on bad weather days. While we are not particularly concerned about this type of endogeneity, we still instrument for the interaction terms in the model that includes the airline-airport fixed effects.
23
regionals, major airlines does not perform systematically worse at airports at which they
uses owned regionals on days with rain and snow below the 95th percentile. However,
the coefficients on the interaction terms remain unchanged, which implies that the
performance advantage of majors with integrated regionals persists on days with extreme
weather.
V.C. Winter Sample
The specifications in Table 5 did not detect a significant coefficient on Fraction
Owned*Snow>95th Percentile. In Table 6, we try to explore this relationship in a more
detailed way. To eliminate noise from our snow measure, we restrict our sample to
airports that experience some snow on at least 10 days of the year and only look at those
airports from November to March inclusive.45 We use this “winter sample” for all
specifications in Table 6. In the first column, we re-estimate (5-1) on this winter sample.
We again find a negative and statistically significant coefficient on Fraction Owned.
The point estimate on Fraction Owned*Snow>95th Percentile is negative and much
larger than it is in the full sample. It is significant at about the 12% level. We cautiously
interpret this as evidence that the performance advantage of majors using owned
regionals does seem to increase on “snowy” days, but the relationship is clearly
imprecisely estimated. This is likely the case because Snow>95th Percentile captures a
heterogeneous set of snow events. The point estimates in (6-1) imply that - on days with
snowfall below the 95th percentile of the airport’s distribution - majors using only owned
regionals at the airport experience flight delays that are approximately 2 minutes shorter
than the delays of majors who only use independent regionals. On days with snowfall
above the 95th percentile, this performance advantage of majors who only use owned
regionals increases so that their delays are about 7 minutes shorter. The interaction
between Fraction Owned and the rain measures are, not surprisingly, never significant in
the winter sample.46
45 This leaves us with 19 airports. The average snowfall at the airports (in the months we include) is about 0.45 inches. About 19% of the airport-days in this sample experience some snowfall. 46 The airports in this sample experience very little rain during the winter months which are included in this restricted sample.
24
In the second column of Table 6, we use the 99th percentile as the cutoff for our
weather dummies instead of the 95th percentile. We do this to capture more extreme
snow events – in this sample, the mean snowfall on days with Snow>99th Percentile is
about 8 inches while the mean snowfall on days with Snow>95th Percentile is about 3
inches. However, the variance of snowfall across days with Snow>99th Percentile is still
very large. When we use this alternate measure of extreme snow, we again find a
negative coefficient on the interaction with Fraction Owned; however, it is estimated
with a very large standard error. In the third column, we replace Snow>99th Percentile
with the linear Snow variable. The advantage of this variable is that – unlike the
percentile-based variables – it will not classify very different amounts of snow as the
same “event” based on how that amount of snow relates to the airport’s overall
distribution. When we use the linear variable, we find a negative coefficient on Fraction
Owned*Snow. The p-value for this coefficient is 0.17.
As mentioned earlier, part of the reason why we are finding such noisy estimates
on the snow interactions may be because extreme snow is more likely to cause
cancellations than delays. Indeed, average delays are almost identical on days with
Snow>99th Percentile and days with Snow>95th Percentile (23 minutes in both cases)
while cancellation rates are about 1.6 times greater on days with Snow>99th Percentile
(14% of flights as compared to 9% of flights). Given this, in the remainder of Table 6,
we re-estimate the first three specifications using Cancelled as our dependent variable.
In all three columns, we find a negative and statistically significant coefficient on the
uninteracted Fraction Owned term indicating that – consistent with the results in (4-4) on
the full sample – majors using owned regionals experience not only shorter delays, but
also lower cancellation rates. Perhaps more interestingly, in these specifications, we find
negative and statistically significant coefficients on all three of the snow interactions
(though two are only significant at the 10% level). The point estimates on these
interactions terms imply effects that are economically quite significant. For example, the
estimates in (6-4) indicate that – on days with snowfall below the airport’s 95th percentile
– majors using only owned regionals have cancellation rates that are about 1.7 percentage
points lower than majors using only independent regionals. This difference increases by
2.9 percentage points on days with snowfall above the 95th percentile. The estimates in

25
(6-5) imply a difference of 2 percentage points on days with snow below the 99th
percentile and 10.4 percentage points on days with snow above the 99th percentile. To
provide some context for these numbers, in this sample, the mean cancellation rate on
days with snow below an airport 99th percentile is 3.8% while the mean cancellation rate
on days with snow above the airport’s 99th percentile is 14.4%. Overall, we take the
results in Table 6 as additional evidence that the performance advantage of majors using
owned regionals does appear to increase on days on which real-time schedule
adjustments are more likely.
V. D. Robustness to the Selection of Airports
In Table 7, we explore whether and how our main effects change when we modify
the set of airports that we consider. This provides a check on the robustness of the results
and, as well, provides some sense of whether the magnitude of the effects differs at
different types of airports.47 In the first column, we restrict our sample to airports that are
among the 50 largest while in the second column we restrict to airports that are among
the 30 largest. The fact that there is only a small reduction in the number of observations
in (7-1) and (7-2) indicates that eliminating these smaller airports does eliminate a large
number of flights. The pattern of coefficients is robust across these sample changes and
the magnitudes increase slightly as we eliminate smaller airports. The estimates in (7-2),
for example, imply that - on days with rain below the airport’s 95th percentile - majors
using owned regionals experience delays that are about 5.1 minutes shorter than those
experienced by majors using only independent regionals. This more than doubles to
about 10.5 minutes on days with rain above the 95th percentile. The comparable
estimates from Table 5 were about 3.1 minutes and 6.5 minutes. This provides some
evidence that these performance effects may be larger at larger airports.
In the third column of Table 7, we exclude airports that are hubs to one of the
seven majors in our sample. At an airline’s hub, we often observe the hub carrier
operates a large number of regional flights while other carriers operate a very small
number of regional flights. Airlines at non-hubs are more symmetric in terms of their
47 Another way to do this might be to interact our variables of interest with airport characteristics; however, considering different samples allows us to avoid having a large number of triple interactions in our model, which can become difficult to interpret.

26
scale of regional operations. Therefore, even though all of our previous specifications
explicitly control for an airline’s scale of regional operations, we also estimate (7-3)
which includes only non-hubs. Note that this eliminates about one million of our 1.4
million observations. Excluding hub airports eliminates the negative effect of the
uninteracted Fraction Owned variable; however, we still find a negative and statistically
significant effect on the interaction term. Thus, even at non-hubs, majors using owned
regionals appear to perform better on days with particularly bad weather.
Finally, in the fourth column of Table 7, we include all airports but drop majors
who operate a very small number of regional flights at those airports.48 This is again an
attempt to eliminate identification from airports at which carriers are highly asymmetric
in terms of their scale of regional operations. When we modify the sample in this way,
we find negative coefficients on Fraction Owned and its interaction with Rain<95th
Percentile though the latter coefficient is estimated with a large standard error. Overall,
while there is some movement of the coefficients of interest across these various samples,
we take Table 7 as evidence that our results are generally robust across various sets of
airports.
VI. Discussion
Our results reveal a significant difference in the operational performance of
majors who are vertically integrated with their regional carriers and that of majors who
contract with independent regionals. Our findings are derived from specifications with
airport-day fixed effects – that is, our results are identified by comparing majors with
different types of regionals at the same airport on the same day. We have also explored
how performance differences between integrated and non-integrated majors vary with the
daily weather at the departure airport and find that the performance advantage of
ownership increases on days with adverse weather, when airlines have to make more
adaptations to their planned schedules.49 This relationship is robust to the inclusion of
fixed effects for each carrier or each carrier-airport combination which indicates that we
48 Specifically, we drop majors who operate fewer than 10 regional flights per day from the airport. 49 This finding is consistent with Forbes and Lederman’s (2007a) result that majors are more likely to integrate with their regionals when a route tends to experience high levels of rain and snow over the course of the year.

27
are not simply capturing performance differences across airlines due to unobserved
factors that are correlated with their vertical integration decisions.
Schedule disruptions are costly for airlines. The schedules that airlines set in
advance are presumably the ones that maximize the overall profits of their network.
Because disruptions to these schedules in the form of delayed, cancelled or diverted
flights will result in lost profits, airlines will attempt to minimize such disruptions.50
When disruptions do become necessary - for example, because of adverse weather –
airlines will make the schedule adjustments that lead to the smallest possible loss of
profits. This may involve changes to their own flights and/or changes to their flights that
are operated by a regional partner. The results of our empirical analysis indicate that use
of an owned regional improves a major’s ability to minimize costly schedule disruptions.
Since our specifications carefully control for differences across majors in characteristics
that may be correlated with ownership decisions and affect performance, we interpret our
findings as evidence that owned and independent regionals’ differ in their incentives to
execute the schedule adjustments that their majors request of them. At a given airport,
there will be externalities between a major’s regional flights and its own flights since
these flights are integrated into a common network and compete for access to scarce
airport resources. If an independent regional is less willing to carry out the schedule
changes that its major requests, this will, in turn, impair the major’s ability to minimize
costly schedule adjustments on its own flights which is precisely what our regressions
find.
Why would ownership better align the incentives of a regional with the incentives
of its major? Or, put differently, why can contracts not achieve a similar level of
incentive alignment? The large theoretical literature on vertical integration suggests
several reasons why incentives inside firms differ from those between firms. Since our
empirical analysis does not test these theories against each other,51 we will instead
highlight specific contributions from the theoretical literature which, combined with 50 See Forbes (forthcoming) for evidence on how longer flight delays affect average ticket prices. Mayer and Sinai (2003) show that airlines do not set their schedules such that expected delays are zero, but their finding does not imply that airlines would not try to minimize delays within the schedules that they have chosen. 51 Many of these theories render the same empirical predictions for our setting. We therefore see this paper as presenting evidence that is consistent with many of these theories. Whinston (2003), for example, points out that settings in which these theories deliver different predictions may be quite rare.
28
details of our institutional setting, help explain why ownership affects incentives in our
context.
First, recall that independent regionals are compensated based only on the routes
that they serve. Thus, even though their actions will affect a major’s profits on other
parts of its network, the types of contracts used in this industry do not provide
independent regionals with any explicit incentives to act in ways that maximize the
overall profits of the major’s network. While one might question why contracts that
better align an independent regional’s incentives with the major’s are not used, we
believe that such contracts are unlikely to exist. A first candidate for such a contract
would be one that compensates the regional based on the performance of the major’s
entire network. However, the performance of the major’s overall network depends on the
major’s effort as well as on the regional’s effort and both efforts are likely unobservable
to the other party. As a result, a contract that compensates both parties based on the
performance of the network would give rise to moral hazard problems and be unable to
achieve the first-best outcome (see Holmström, 1982). Furthermore, such a contract
would expose the regional carrier to a great deal of risk. Recent changes in the industry –
in particular, a greater reliance on the capacity purchase agreements described in Section
II - suggest that regional carriers should be regarded as risk-averse.
An alternative contractual arrangement would give the major carrier decision
rights to make any ex post adaptation decisions, such as adjustments to the regional’s
flight schedule. This is, in fact, what we observe in practice. However, even this
contractual arrangement does not perfectly align the regional’s incentives with the
major’s because the adaptation decisions that the major orders must be carried out by the
regional. The regional’s employees may shirk or “drag their feet” if they feel aggrieved
by the major’s decisions to cancel or delay their flights (see Hart and Moore,
forthcoming), in particular if the regional bears the full financial cost of the schedule
changes decided upon by the major. In addition to the direct costs imposed by the
schedule adjustments that the major requests, independent regionals may also be reluctant
to execute these changes because of the impact they could have on the regional’s own
performance statistics. Observable metrics such as on-time performance or the
proportion of cancelled flights can be important in seeking new business from other

29
major carriers. For this reason, employees at independent regionals may be particularly
aggrieved when a major decides to delay or cancel the regional’s flights in order to allow
the major’s own flights to depart. Both of these issues are likely to be less important to
owned regionals because, first, the major ultimately bears the costs of changes to the
regional’s schedule and will take this into account, and second, owned regionals do not
perform contract flying for other majors and are therefore less likely to be concerned
about their own performance measures.52
Finally, the incentive problems that exist between majors and independent
regionals are likely to be less pronounced when majors own their regionals because
owned regionals will care more about the profits and overall financial health of the major.
Owned regionals only fly for the major that owns them and, as a result, are heavily
dependent on the profitability of their major’s overall network. Furthermore, if the major
were in financial difficulty and had to divest itself of its regional unit, this might impose
large costs on the regional carrier’s employees who, after divestiture, might have to
accept the lower salaries that prevail at independent regionals.
Although we attribute the performance differences that we measure to differences
in the incentives of owned and independent regionals, one might question whether our
results would not also be explained by differences in the skill levels of owned and
independent regionals. Given that owned regionals tend to have higher labor costs, could
they be employing more skilled employees – in particular, more skilled pilots? We
believe that differences in skills are unlikely to be responsible for the performance effects
that we find. We are measuring the impact of ownership of a regional on the major’s
performance on its own flights. It is hard to imagine how differences in the skill levels of
pilots at owned and independent regionals would lead to differences in the performance
of the majors using those regionals. Specifically, even if owned regionals did have more
skilled pilots, this might affect the frequency and/or severity of incidents and accidents at
the regional but it is unlikely to affect departure delays or cancellations at the regional
52 Theoretically, owned regionals could also contract with other majors, but empirically we do not observe such relationships. A possible explanation for this is that other majors may fear hold-up if they were to contract with a regional that is owned by one of their competitors.
30
which would be the mechanism through which the major’s own flights were affected.53
Furthermore, to be consistent with our findings, differences in the skill levels of pilots at
owned and independent regionals would need to have a greater effect on performance on
days with bad weather. While it is clear why bad weather would magnify incentive
problems that arise from incomplete contracts, it is not obvious why bad weather would
magnify performance effects that result from differences in skills.
VII. Conclusion
This paper has investigated whether – at a given airport, on a given day - the
operational performance of majors using owned regionals differs from that of majors
using independent regionals. Our results indicate that it indeed does. We find that
majors using only owned regionals at an airport experience delays that are about 3
minutes shorter than the delays experienced by majors using only independent regionals.
On days with particularly adverse weather, this performance advantage doubles to about
6 minutes. These findings are both statistically and economically significant. While the
results that use snow as a measure of adverse weather are somewhat weaker, we do find a
consistent pattern when we restrict to a winter sample and consider both delays and
cancellations. Overall, our empirical analysis provides robust evidence that airlines’
ownership decisions do affect their operational performance. We attribute the
performance differences that we find to differences in the incentives of owned and
independent regionals. The fact that the performance effects of ownership increase on
days with bad weather – when non-contracted schedule changes are much more likely –
provides support for our argument that incentive problems arising from the
incompleteness of contracts are important in this setting.
We believe that this paper contributes to the existing literature in several ways.
First, we provide one of the few pieces of direct evidence that there are indeed
performance consequences of vertical integration. Second, we do this while controlling
for the potential endogeneity of integration decisions in a very careful way – both with
numerous fixed effects and by instrumenting for the choice to vertically integrate. Third,
53 Pilot skills might affect arrival delays to some extent because such delays also depend on time spent in flight and landing. We choose not to use arrival delays as a performance measure precisely because they are not as closely related to factors under the airline’s control as departure delays.
31
our setting allows us to not only estimate average performance differences but also how
this performance difference varies as the likelihood of non-contracted adaptation
decisions changes. In particular, the fact that airlines’ ownership decisions are fixed in
the short-run while weather changes on a daily basis provides us with a rich source of
identification that is unavailable in many other settings.
References:
American Institute of Certified Public Accountants (2007), Proposed AICPA Audit and Accounting Guide, Airlines, http://www.aicpa.org/download/exposure/Airline_Guide_ED.pdf Alchian, Armen A. and Harold Demsetz (1972), “Production, Information Costs, and Economic Organization”, American Economic Review 62(5), 777-795. Anderson, Erin and David Schmittlein (1984), “Integration of the Sales Force: An Empirical Examination”, Rand Journal of Economics 15, 385-95. Ciliberto, Frederic (2006), “Does Organizational Form Affect Investment Decisions?”, Journal of Industrial Economics 54 (1), 63-93. Forbes, Silke J. (forthcoming), “The Effect of Air Traffic Delays on Airline Prices”, International Journal of Industrial Organization. Forbes, Silke J. and Mara Lederman (2007a), “Control Rights, Network Structure and Vertical Integration: Evidence from Regional Airlines”, mimeo, University of California, San Diego, and University of Toronto Forbes, Silke J. and Mara Lederman (2007b), “The Role of Regional Airlines in the U.S. Airline Industry”, in Darin Lee (ed.), Advances in Airline Economics II, Elsevier. Gibbons, Robert (2005), “Four Formal(izable) Theories of the Firm?”, Journal of Economic Behavior and Organization 58, 200-245. Grossman, Sanford and Oliver Hart (1986), “The Costs and Benefits of Ownership: A Theory of Vertical and Lateral Ownership”, Journal of Political Economy 94, 691-719. Hart, Oliver and John Moore (1990), “Property Rights and the Nature of the Firm”, Journal of Political Economy 98, 1119-58.

32
Hart, Oliver and John Moore (forthcoming), “Contracts as Reference Points, Quarterly Journal of Economics. Holmström, Bengt (1982), “Moral Hazard in Teams”, Bell Journal of Economics 13, 324-340. Hubbard, Thomas (2001), “Contractual form and market thickness in trucking”, Rand Journal of Economics 32(2), 369-86. Hubbard, Thomas (2008), “Viewpoint: Empirical Research on Firms’ Boundaries”, Canadian Journal of Economics 41(2). Joskow, Paul (1985), “Vertical Integration and Long-Term Contracts: The Case of Coal-Burning Electric Generation Plants”, Journal of Law, Economics, and Organization 1, 33-80. Joskow, Paul (1987), “Contract Duration and Relationship-Specific Investment: Empirical Evidence from Coal Markets”, American Economic Review 77, 168-85. Kosova, Renata, Francine Lafontaine and Rozenn Perrigot (2007), “Organizational Form and Performance: Evidence from the Hotel Industry”, mimeo, University of Michigan. Lafontaine, Francine and Margaret Slade (2007), “Vertical Integration and Firm Boundaries: The Evidence”, Journal of Economic Literature 45(3). Masten, Scott E. (1984), “The Organization of Production: Evidence from the Aerospace Industry”, Journal of Law and Economics 27, 403–17. Masten, Scott (1993), “Transaction Costs, Mistakes, and Performance: Assessing the Importance of Governance”, Managerial and Decision Economics 14(2), 119-129. Masten, Scott E. and Keith Crocker (1985), “Efficient Adaptation in Long-Term Contracts: Take-or-Pay Provisions for Natural Gas”, American Economic Review 75, 1083–93. Masten, Scott E., James W. Meehan, Jr., and Edward A. Snyder (1991), “The Costs of Organization”, Journal of Law, Economics, and Organization 7(1), 1-25. Mayer, Chris and Todd Sinai (2003), “Why Do Airlines Systematically Schedule Their Flights to Arrive Late?”, mimeo, University of Pennsylvania. Monteverde, Kirk, and David Teece (1982), “Supplier Switching Costs and Vertical Integration in the Automobile Industry”, Bell Journal of Economics 13, 206-12. Mullainathan, Sendhil and David Scharfstein (2001) “Do Firm Boundaries Matter?”, American Economic Review Papers and Proceedings, 91(2), 195-199.

33
Novak, Sharon and Scott Stern (2007), “How Does Outsourcing Affect Performance Dynamics? Evidence from the Automobile Industry”, mimeo, Northwestern University. Rupp, Nicholas (2005), “Flight Delays and Cancellations”, mimeo, East Carolina University. Whinston, Michael (2003), “On the Transaction Cost Determinants of Vertical Integration”, Journal of Law, Economics & Organization 19(1), 1-23. Williamson, Oliver E. (1975), Markets and Hierarchies: Analysis and Antitrust Implications, New York, NY: Free Press. Williamson, Oliver E. (1985), The Economic Institutions of Capitalism, New York, NY: Free Press. Williamson, Oliver E. (1991), “Comparative Economic Organization: The Analysis of Discrete Structural Alternatives”, Administrative Science Quarterly 36(2), 269-296.

34
Figure 1 Illustration of Identification Strategy
BOS
ATL
TPA
SFO
ORD
Served by American Airlines ALB
BTVSYR BGR
Served by Delta Air Lines
Served by American’s regional(s)
Served by Delta’s regional(s)

35
Table 1 Majors and Regional Partners in 2000
Regional carriers in bold are fully owned by the major
MAJOR REGIONAL PARTNER American Airlines American Eagle Airlines Business Express Continental Airlines Continental Express Gulfstream International Airlines Delta Air Lines Atlantic Coast Airlines/ACJet Atlantic Southeast Airlines Comair SkyWest Airlines Trans States Airlines Northwest Airlines Express Airlines, I Mesaba Aviation Trans World Airlines Chautauqua Airlines Trans States Airlines United Airlines Air Wisconsin Atlantic Coast Airlines Great Lakes Aviation Gulfstream International Airlines SkyWest Airlines US Airways Mesa Air Group/Air Midwest Allegheny Airlines Mesa Air Group/CCAir Chautauqua Airlines Colgan Airways Commutair Mesa Air Group/Mesa Airlines Piedmont Airlines PSA Airlines
Source: Regional Airline Association (www.raa.org)
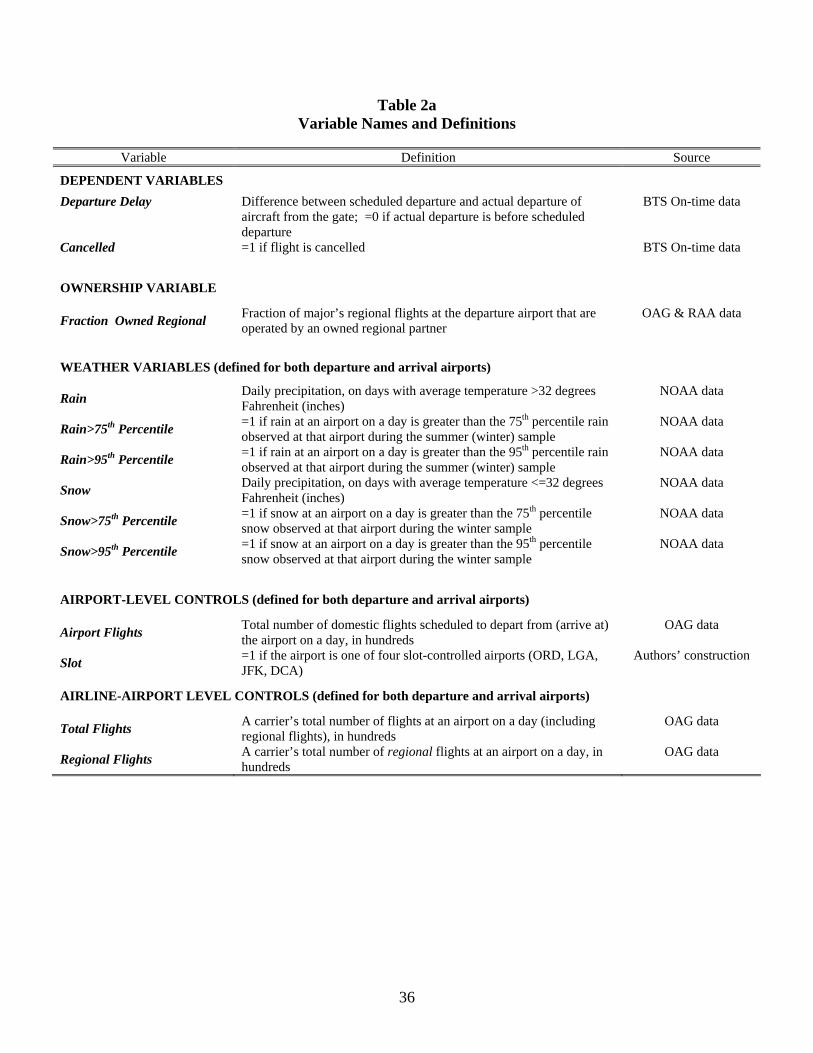
36
Table 2a Variable Names and Definitions
Variable Definition Source
DEPENDENT VARIABLES Departure Delay Difference between scheduled departure and actual departure of
aircraft from the gate; =0 if actual departure is before scheduled departure
BTS On-time data
Cancelled =1 if flight is cancelled BTS On-time data
OWNERSHIP VARIABLE
Fraction Owned Regional Fraction of major’s regional flights at the departure airport that are operated by an owned regional partner
OAG & RAA data
WEATHER VARIABLES (defined for both departure and arrival airports)
Rain Daily precipitation, on days with average temperature >32 degrees Fahrenheit (inches)
NOAA data
Rain>75th Percentile =1 if rain at an airport on a day is greater than the 75th percentile rain observed at that airport during the summer (winter) sample
NOAA data
Rain>95th Percentile =1 if rain at an airport on a day is greater than the 95th percentile rain observed at that airport during the summer (winter) sample
NOAA data
Snow Daily precipitation, on days with average temperature <=32 degrees Fahrenheit (inches)
NOAA data
Snow>75th Percentile =1 if snow at an airport on a day is greater than the 75th percentile snow observed at that airport during the winter sample
NOAA data
Snow>95th Percentile =1 if snow at an airport on a day is greater than the 95th percentile snow observed at that airport during the winter sample
NOAA data
AIRPORT-LEVEL CONTROLS (defined for both departure and arrival airports)
Airport Flights Total number of domestic flights scheduled to depart from (arrive at) the airport on a day, in hundreds
OAG data
Slot =1 if the airport is one of four slot-controlled airports (ORD, LGA, JFK, DCA)
Authors’ construction
AIRLINE-AIRPORT LEVEL CONTROLS (defined for both departure and arrival airports)
Total Flights A carrier’s total number of flights at an airport on a day (including regional flights), in hundreds
OAG data
Regional Flights A carrier’s total number of regional flights at an airport on a day, in hundreds
OAG data
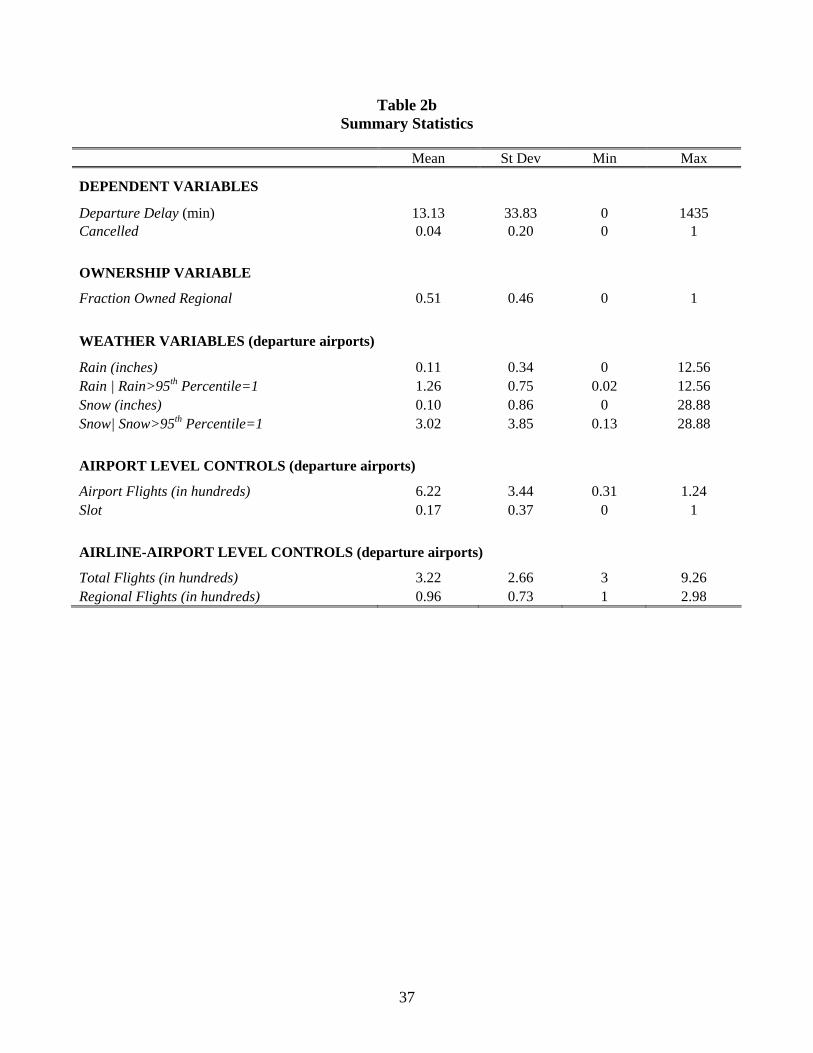
37
Table 2b Summary Statistics
Mean St Dev Min Max
DEPENDENT VARIABLES
Departure Delay (min) 13.13 33.83 0 1435 Cancelled 0.04 0.20 0 1
OWNERSHIP VARIABLE
Fraction Owned Regional 0.51 0.46 0 1
WEATHER VARIABLES (departure airports)
Rain (inches) 0.11 0.34 0 12.56 Rain | Rain>95th Percentile=1 1.26 0.75 0.02 12.56 Snow (inches) 0.10 0.86 0 28.88 Snow| Snow>95th Percentile=1 3.02 3.85 0.13 28.88
AIRPORT LEVEL CONTROLS (departure airports)
Airport Flights (in hundreds) 6.22 3.44 0.31 1.24 Slot 0.17 0.37 0 1
AIRLINE-AIRPORT LEVEL CONTROLS (departure airports)
Total Flights (in hundreds) 3.22 2.66 3 9.26 Regional Flights (in hundreds) 0.96 0.73 1 2.98
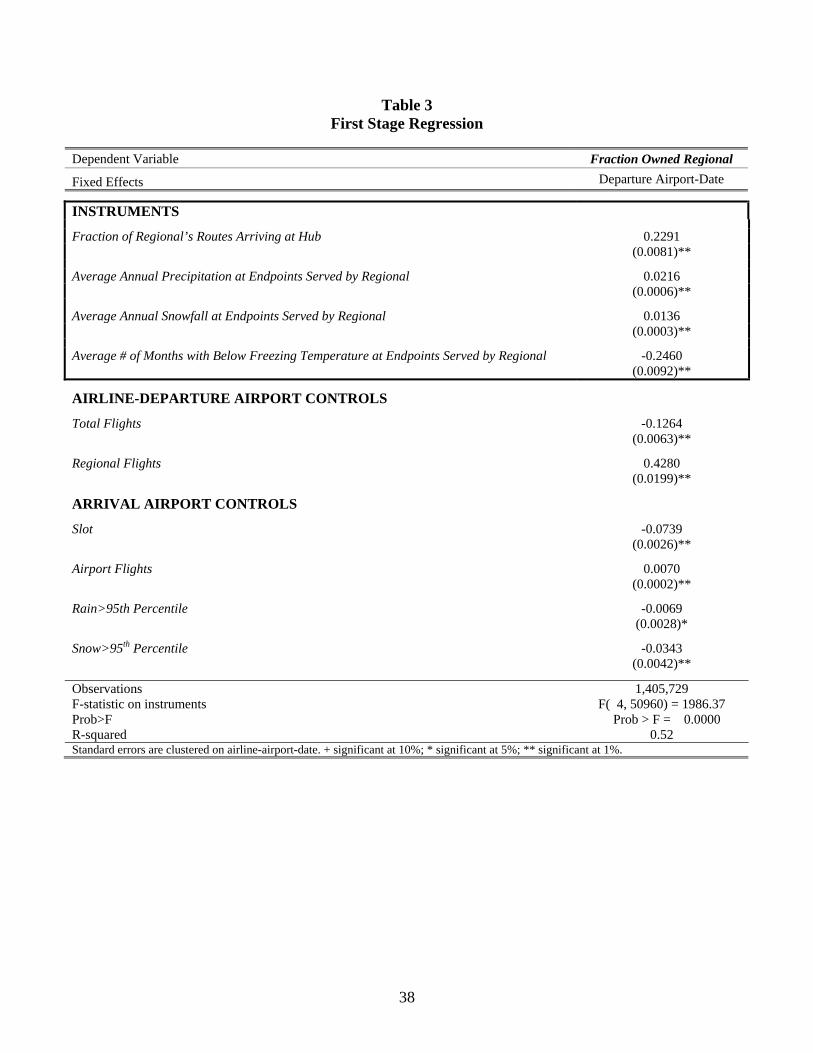
38
Table 3 First Stage Regression
Dependent Variable Fraction Owned Regional
Fixed Effects Departure Airport-Date
INSTRUMENTS
Fraction of Regional’s Routes Arriving at Hub 0.2291 (0.0081)**
Average Annual Precipitation at Endpoints Served by Regional 0.0216 (0.0006)**
Average Annual Snowfall at Endpoints Served by Regional 0.0136 (0.0003)**
Average # of Months with Below Freezing Temperature at Endpoints Served by Regional -0.2460 (0.0092)**
AIRLINE-DEPARTURE AIRPORT CONTROLS
Total Flights -0.1264 (0.0063)**
Regional Flights 0.4280 (0.0199)**
ARRIVAL AIRPORT CONTROLS
Slot -0.0739 (0.0026)**
Airport Flights 0.0070 (0.0002)**
Rain>95th Percentile -0.0069 (0.0028)*
Snow>95th Percentile -0.0343 (0.0042)**
Observations 1,405,729 F-statistic on instruments F( 4, 50960) = 1986.37 Prob>F Prob > F = 0.0000 R-squared 0.52 Standard errors are clustered on airline-airport-date. + significant at 10%; * significant at 5%; ** significant at 1%.
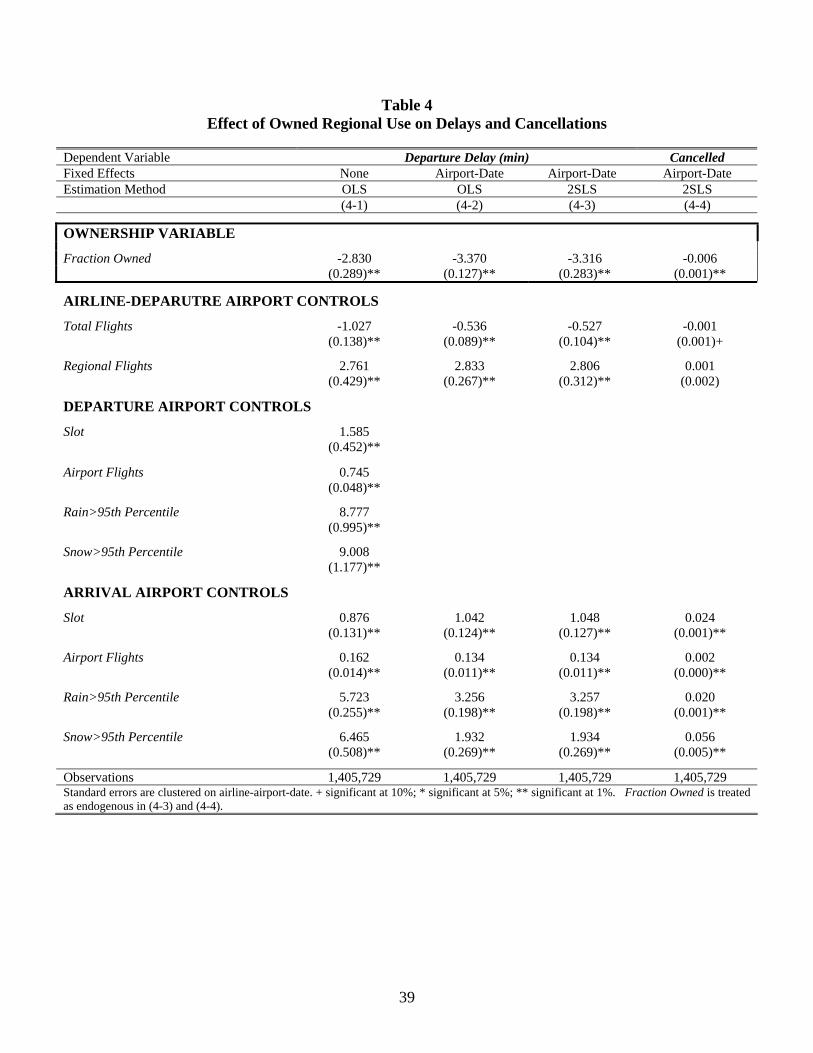
39
Table 4 Effect of Owned Regional Use on Delays and Cancellations
Dependent Variable Departure Delay (min) Cancelled Fixed Effects None Airport-Date Airport-Date Airport-Date Estimation Method OLS OLS 2SLS 2SLS
(4-1) (4-2) (4-3) (4-4)
OWNERSHIP VARIABLE
Fraction Owned -2.830 -3.370 -3.316 -0.006 (0.289)** (0.127)** (0.283)** (0.001)**
AIRLINE-DEPARUTRE AIRPORT CONTROLS
Total Flights -1.027 -0.536 -0.527 -0.001 (0.138)** (0.089)** (0.104)** (0.001)+
Regional Flights 2.761 2.833 2.806 0.001 (0.429)** (0.267)** (0.312)** (0.002)
DEPARTURE AIRPORT CONTROLS
Slot 1.585 (0.452)**
Airport Flights 0.745 (0.048)**
Rain>95th Percentile 8.777 (0.995)**
Snow>95th Percentile 9.008 (1.177)**
ARRIVAL AIRPORT CONTROLS
Slot 0.876 1.042 1.048 0.024 (0.131)** (0.124)** (0.127)** (0.001)**
Airport Flights 0.162 0.134 0.134 0.002 (0.014)** (0.011)** (0.011)** (0.000)**
Rain>95th Percentile 5.723 3.256 3.257 0.020 (0.255)** (0.198)** (0.198)** (0.001)**
Snow>95th Percentile 6.465 1.932 1.934 0.056 (0.508)** (0.269)** (0.269)** (0.005)**
Observations 1,405,729 1,405,729 1,405,729 1,405,729 Standard errors are clustered on airline-airport-date. + significant at 10%; * significant at 5%; ** significant at 1%. Fraction Owned is treated as endogenous in (4-3) and (4-4).
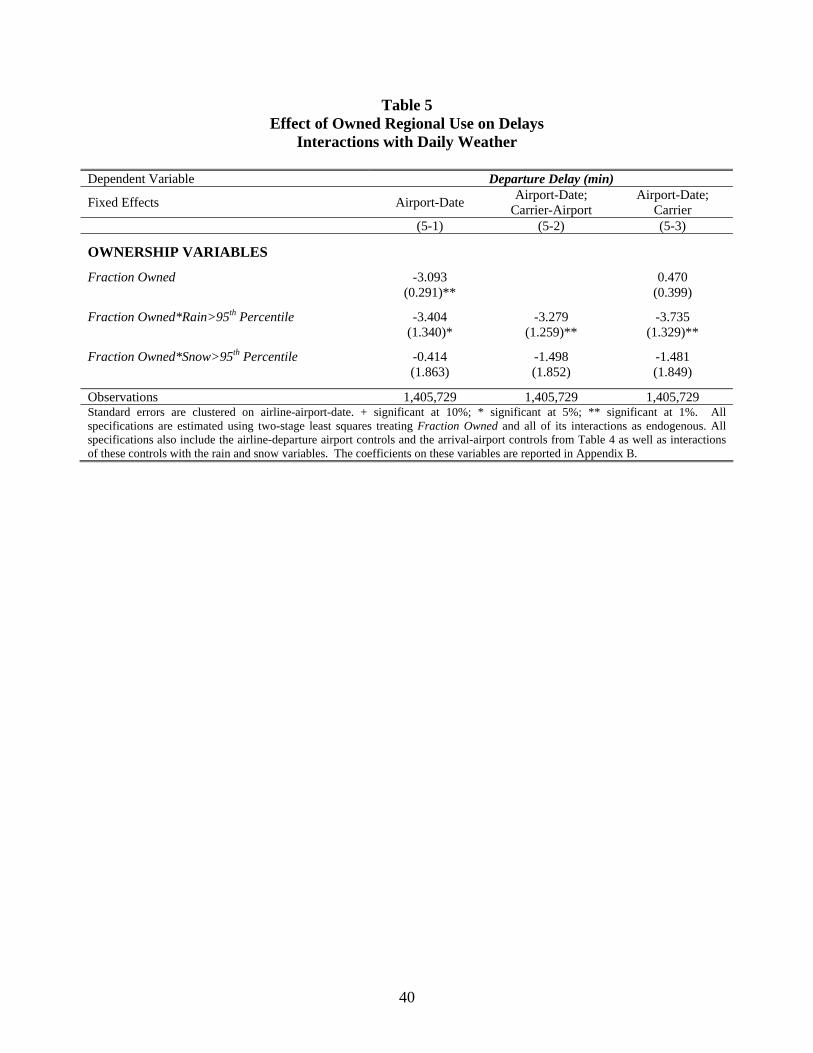
40
Table 5 Effect of Owned Regional Use on Delays
Interactions with Daily Weather
Dependent Variable Departure Delay (min)
Fixed Effects Airport-Date Airport-Date; Carrier-Airport
Airport-Date; Carrier
(5-1) (5-2) (5-3)
OWNERSHIP VARIABLES
Fraction Owned -3.093 0.470 (0.291)** (0.399)
Fraction Owned*Rain>95th Percentile -3.404 -3.279 -3.735 (1.340)* (1.259)** (1.329)**
Fraction Owned*Snow>95th Percentile -0.414 -1.498 -1.481 (1.863) (1.852) (1.849)
Observations 1,405,729 1,405,729 1,405,729 Standard errors are clustered on airline-airport-date. + significant at 10%; * significant at 5%; ** significant at 1%. All specifications are estimated using two-stage least squares treating Fraction Owned and all of its interactions as endogenous. All specifications also include the airline-departure airport controls and the arrival-airport controls from Table 4 as well as interactions of these controls with the rain and snow variables. The coefficients on these variables are reported in Appendix B.
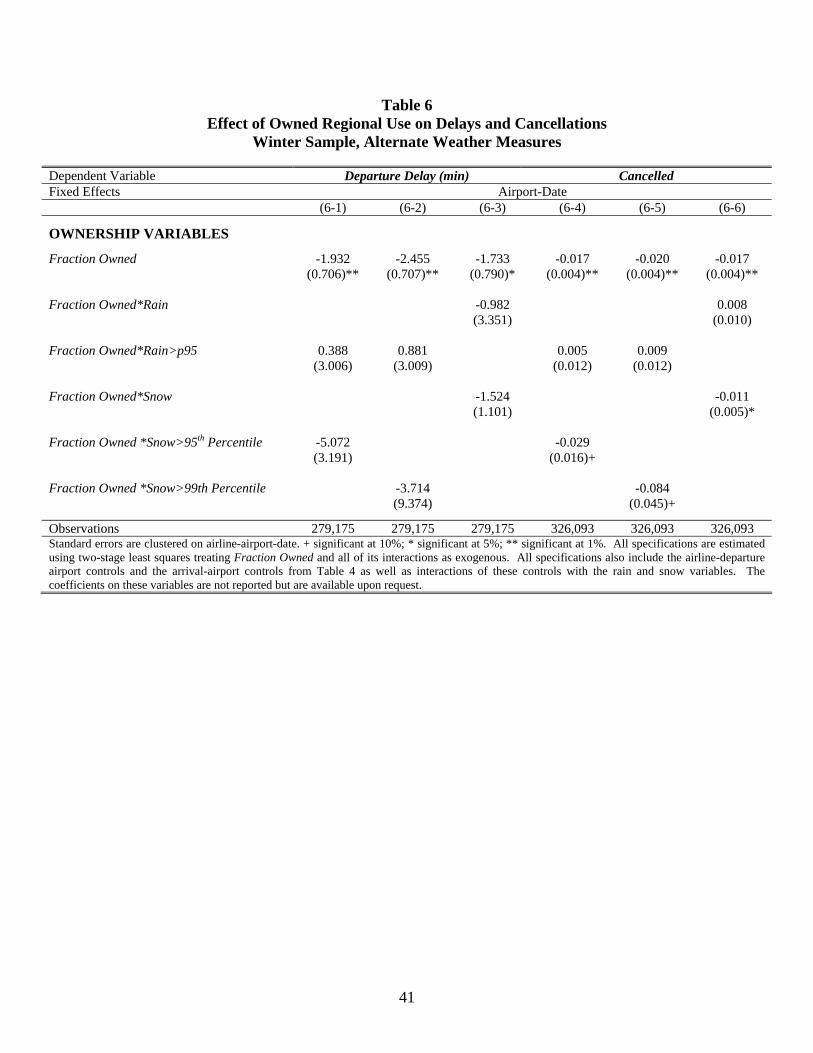
41
Table 6 Effect of Owned Regional Use on Delays and Cancellations
Winter Sample, Alternate Weather Measures
Dependent Variable Departure Delay (min) Cancelled Fixed Effects Airport-Date
(6-1) (6-2) (6-3) (6-4) (6-5) (6-6)
OWNERSHIP VARIABLES
Fraction Owned -1.932 -2.455 -1.733 -0.017 -0.020 -0.017 (0.706)** (0.707)** (0.790)* (0.004)** (0.004)** (0.004)** Fraction Owned*Rain -0.982 0.008 (3.351) (0.010)
Fraction Owned*Rain>p95 0.388 0.881 0.005 0.009 (3.006) (3.009) (0.012) (0.012)
Fraction Owned*Snow -1.524 -0.011 (1.101) (0.005)* Fraction Owned *Snow>95th Percentile -5.072 -0.029 (3.191) (0.016)+ Fraction Owned *Snow>99th Percentile -3.714 -0.084 (9.374) (0.045)+
Observations 279,175 279,175 279,175 326,093 326,093 326,093 Standard errors are clustered on airline-airport-date. + significant at 10%; * significant at 5%; ** significant at 1%. All specifications are estimated using two-stage least squares treating Fraction Owned and all of its interactions as exogenous. All specifications also include the airline-departure airport controls and the arrival-airport controls from Table 4 as well as interactions of these controls with the rain and snow variables. The coefficients on these variables are not reported but are available upon request.
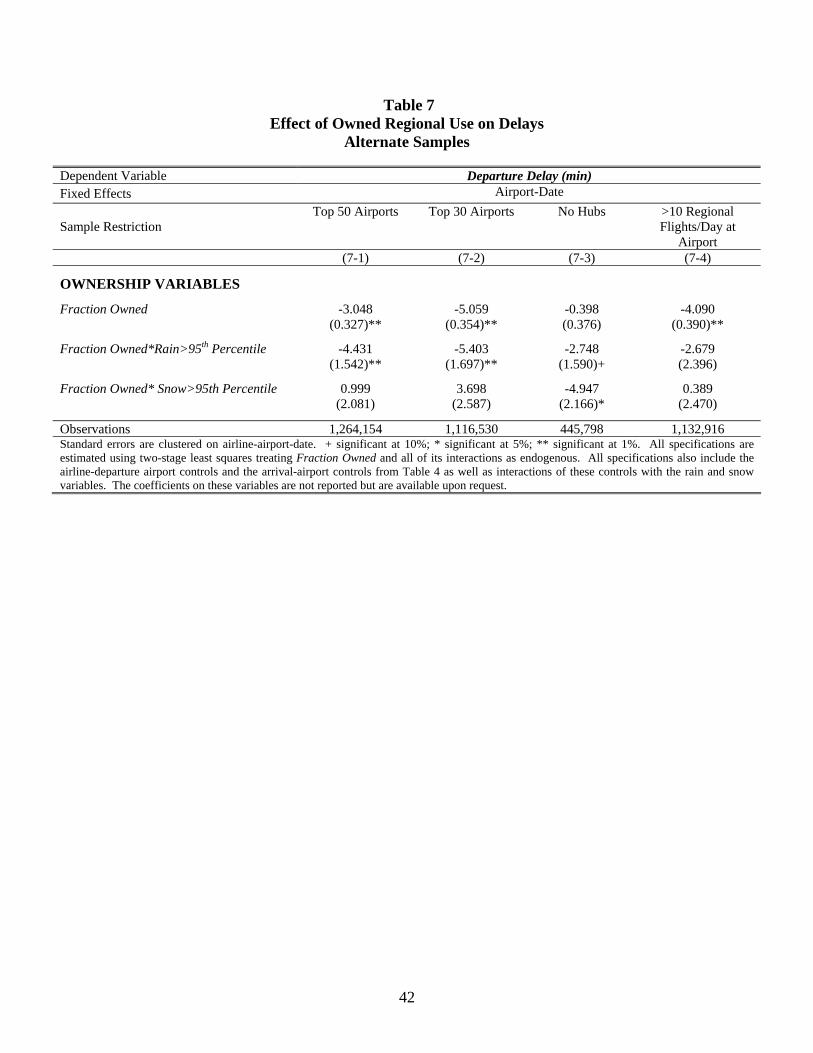
42
Table 7 Effect of Owned Regional Use on Delays
Alternate Samples
Dependent Variable Departure Delay (min) Fixed Effects Airport-Date
Sample Restriction Top 50 Airports Top 30 Airports No Hubs >10 Regional
Flights/Day at Airport
(7-1) (7-2) (7-3) (7-4)
OWNERSHIP VARIABLES
Fraction Owned -3.048 -5.059 -0.398 -4.090 (0.327)** (0.354)** (0.376) (0.390)**
Fraction Owned*Rain>95th Percentile -4.431 -5.403 -2.748 -2.679 (1.542)** (1.697)** (1.590)+ (2.396)
Fraction Owned* Snow>95th Percentile 0.999 3.698 -4.947 0.389 (2.081) (2.587) (2.166)* (2.470)
Observations 1,264,154 1,116,530 445,798 1,132,916 Standard errors are clustered on airline-airport-date. + significant at 10%; * significant at 5%; ** significant at 1%. All specifications are estimated using two-stage least squares treating Fraction Owned and all of its interactions as endogenous. All specifications also include the airline-departure airport controls and the arrival-airport controls from Table 4 as well as interactions of these controls with the rain and snow variables. The coefficients on these variables are not reported but are available upon request.

43
Appendix A -Construction of Instruments Fraction Owned measures the fraction of an airline’s regional flights departing from a given airport that are operated by a regional that is owned. Our instruments for this variable are measures of the characteristics of the endpoint airports that are served from that airport by the regional carrier(s). For example, we instrument for Delta’s value of Fraction Owned at the Boston airport with the characteristics of the endpoint airports that Delta’s regionals serve from Boston. Our choice of instruments is motivated by the analysis in Forbes and Lederman (2007a). Specifically, for each flight that a major’s regional operates from a particular airport, we calculate the following four characteristics of the arrival airport of that flight:
1. Hub: A dummy variable that equals one if the airport is a hub to the major. 2. Precipitation: The average annual precipitation at the airport. This average is
taken over 25 years (1971-1995) of monthly weather data taken from the National Oceanic and Atmospheric Administration (NOAA). When precipitation is frozen (i.e. snow, hail, or freezing rain), this variable measures the water equivalent of the precipitation. Note that this is different from the depth of snowfall. The density of new snow is typically between 5% and 12% of water.
3. Snowfall: The average annual snowfall at the airport. This average is taken over
30 years (1971-2000) of annual snow data and reported by NOAA. 4. # of Freezing Months: The average number of months per year in which the
average daily minimum temperature at the airport is below 32 degrees Fahrenheit. This average is taken over the25 years of monthly weather data from NOAA.
After constructing these four measures for each regional flight from a particular airport, we calculate the average of these four variables over all of the flights that a particular major’s regional(s) operate from a given airport during our sample period. For example, we would calculate the average of these four measures over all of the flights that Delta’s regionals operate from Boston in the year 2000. This provides us four airline-airport level variables that we use as instruments for Fraction Owned (which is also an airline-airport level variable). We call these four variables Fraction of Regional’s Routes Arriving at Hub, Average Annual Precipitation at Endpoints Served by Regional, Average Annual Snowfall at Endpoints Served by Regional, and Average # of Months with Below Freezing Temperature at Endpoints Served by Regional. The results of the first-stage regression of Fraction Owned on these variables, as well as the exogenous variables from the second-stage equation, are presented in Table 3.
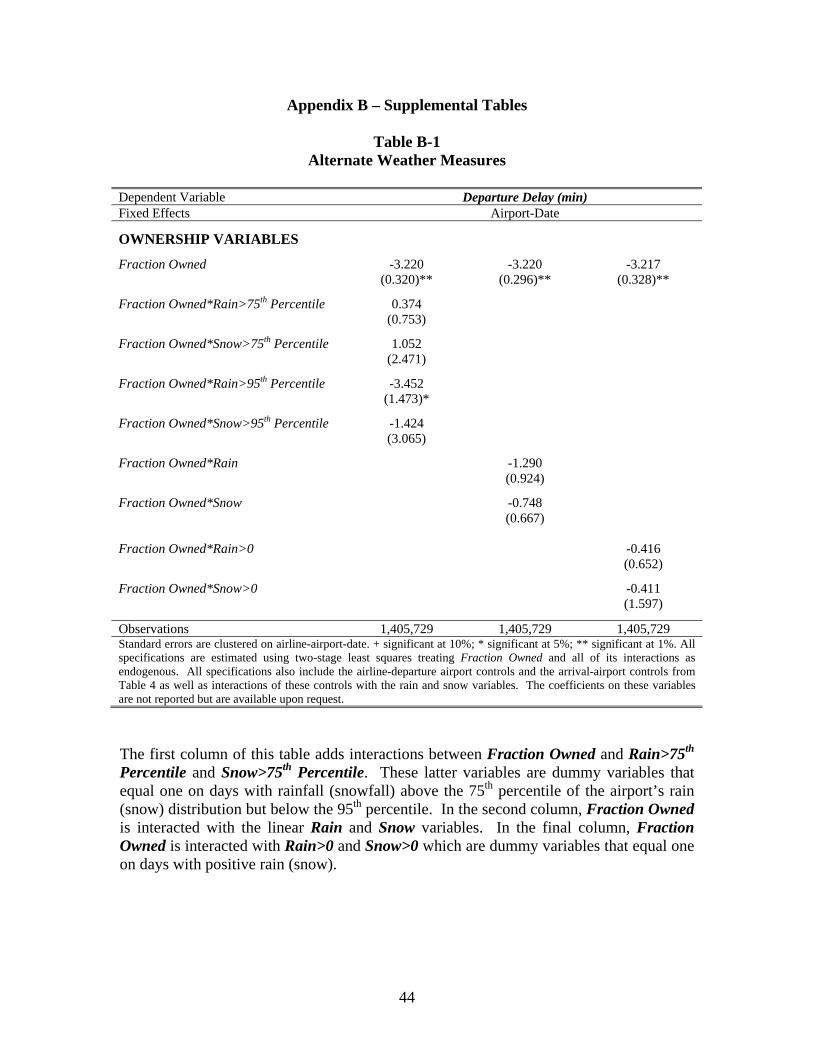
44
Appendix B – Supplemental Tables
Table B-1 Alternate Weather Measures
Dependent Variable Departure Delay (min) Fixed Effects Airport-Date
OWNERSHIP VARIABLES
Fraction Owned -3.220 -3.220 -3.217 (0.320)** (0.296)** (0.328)**
Fraction Owned*Rain>75th Percentile 0.374 (0.753)
Fraction Owned*Snow>75th Percentile 1.052 (2.471)
Fraction Owned*Rain>95th Percentile -3.452 (1.473)*
Fraction Owned*Snow>95th Percentile -1.424
(3.065)
Fraction Owned*Rain -1.290 (0.924)
Fraction Owned*Snow -0.748 (0.667)
Fraction Owned*Rain>0 -0.416 (0.652)
Fraction Owned*Snow>0 -0.411 (1.597)
Observations 1,405,729 1,405,729 1,405,729 Standard errors are clustered on airline-airport-date. + significant at 10%; * significant at 5%; ** significant at 1%. All specifications are estimated using two-stage least squares treating Fraction Owned and all of its interactions as endogenous. All specifications also include the airline-departure airport controls and the arrival-airport controls from Table 4 as well as interactions of these controls with the rain and snow variables. The coefficients on these variables are not reported but are available upon request.
The first column of this table adds interactions between Fraction Owned and Rain>75th Percentile and Snow>75th Percentile. These latter variables are dummy variables that equal one on days with rainfall (snowfall) above the 75th percentile of the airport’s rain (snow) distribution but below the 95th percentile. In the second column, Fraction Owned is interacted with the linear Rain and Snow variables. In the final column, Fraction Owned is interacted with Rain>0 and Snow>0 which are dummy variables that equal one on days with positive rain (snow).

45
Table B-2 Coefficients on Control Variables
(Columns Two through Four include alternate control variables)
Dependent Variable Departure Delay (min) Fixed Effects Airport-Date
OWNERSHIP VARIABLES
Fraction Owned -3.093 -2.302 -2.257 -1.732 (0.291)** (0.249)** (0.297)** (0.249)**
Fraction Owned*Rain>95th Percentile -3.404 -2.976 -3.480 -2.926 (1.340)* (1.201)* (1.342)** (1.193)*
Fraction Owned* Snow>95th Percentile -0.414 -1.225 -0.654 -1.495 (1.863) (1.799) (1.858) (1.799)
AIRLINE-DEPARTURE AIRPORT CONTROLS
Total Flights -0.497 -0.612 (0.104)** (0.105)**
Total Flights*Rain>95th Percentile -0.111 -0.085 (0.612) (0.622) Total Flights*Snow>95th Percentile -1.326 -1.219 (0.842) (0.833)
Regional Flights 2.594 1.137 2.066 0.831 (0.310)** (0.204)** (0.311)** (0.205)**
Regional Flights*Rain>95th Percentile 1.815 0.947 1.738 0.862 (1.943) (1.212) (1.980) (1.216)
Regional Flights*Snow>95th Percentile 5.671 4.516 5.289 4.504 (2.613)* (2.344)+ (2.579)* (2.334)+
Hub 0.176 -0.292 (0.300) (0.304)
Hub*Rain>95th Percentile 0.985 1.194 (1.901) (1.904)
Hub*Snow>95th Percentile -4.137 -3.972 (3.543) (3.527)
AIRLINE-ARRIVAL AIRPORT CONTROLS
Total Flights 0.141 (0.048)**
Total Flights*Rain>95th Percentile -0.527 (0.269)*
Total Flights*Snow>95th Percentile -1.468 (0.381)**
Regional Flights -1.977 -2.682 (0.150)** (0.107)**
Regional Flights*Rain>95th Percentile 2.268 -2.275
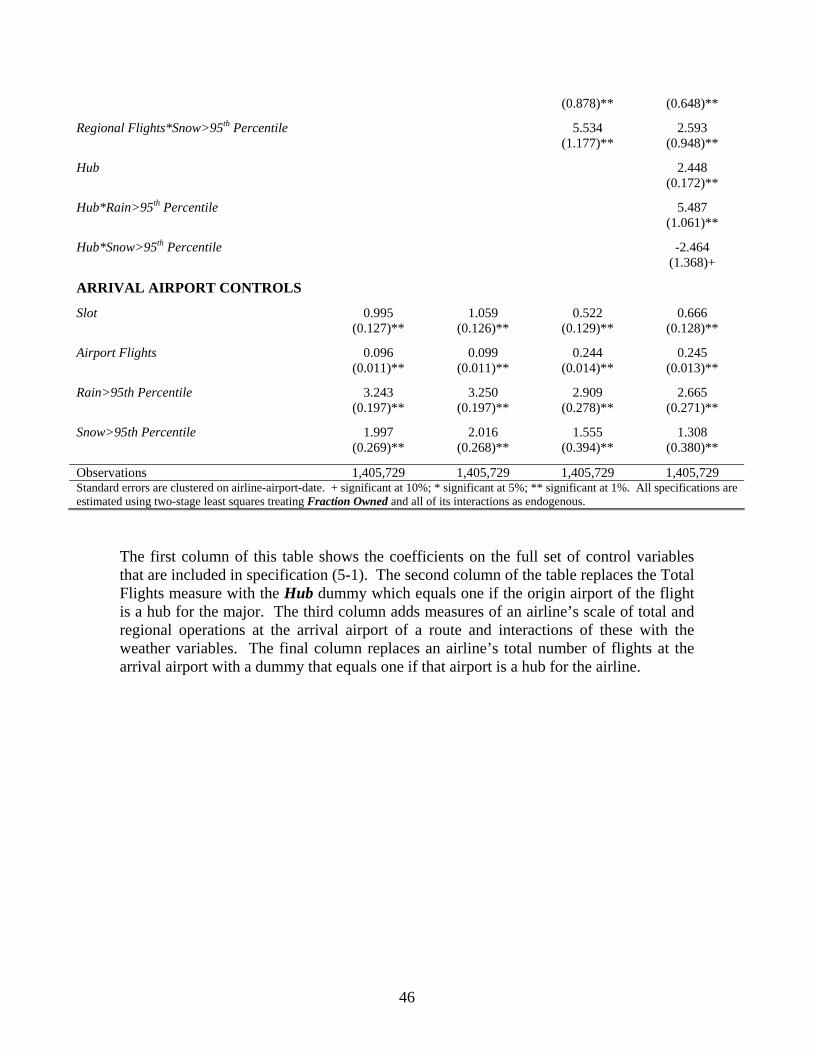
46
(0.878)** (0.648)**
Regional Flights*Snow>95th Percentile 5.534 2.593 (1.177)** (0.948)**
Hub 2.448 (0.172)**
Hub*Rain>95th Percentile 5.487 (1.061)**
Hub*Snow>95th Percentile -2.464 (1.368)+
ARRIVAL AIRPORT CONTROLS
Slot 0.995 1.059 0.522 0.666 (0.127)** (0.126)** (0.129)** (0.128)**
Airport Flights 0.096 0.099 0.244 0.245 (0.011)** (0.011)** (0.014)** (0.013)**
Rain>95th Percentile 3.243 3.250 2.909 2.665 (0.197)** (0.197)** (0.278)** (0.271)**
Snow>95th Percentile 1.997 2.016 1.555 1.308 (0.269)** (0.268)** (0.394)** (0.380)**
Observations 1,405,729 1,405,729 1,405,729 1,405,729 Standard errors are clustered on airline-airport-date. + significant at 10%; * significant at 5%; ** significant at 1%. All specifications are estimated using two-stage least squares treating Fraction Owned and all of its interactions as endogenous.
The first column of this table shows the coefficients on the full set of control variables that are included in specification (5-1). The second column of the table replaces the Total Flights measure with the Hub dummy which equals one if the origin airport of the flight is a hub for the major. The third column adds measures of an airline’s scale of total and regional operations at the arrival airport of a route and interactions of these with the weather variables. The final column replaces an airline’s total number of flights at the arrival airport with a dummy that equals one if that airport is a hub for the airline.