Does Trade Reduce Infant Mortality? Evidence from Sub ... · Does Trade Reduce Infant Mortality?...
48
Does Trade Reduce Infant Mortality? Evidence from Sub-Saharan Africa Pallavi Panda State University of New York, Geneseo [email protected] June 5, 2016 *I would like to thank Hewlett foundation/IIE for awarding the 2013-2015 Hewlett Foundation Dissertation Fellowship in Population, Reproductive Health and Economic Development for this research
Transcript of Does Trade Reduce Infant Mortality? Evidence from Sub ... · Does Trade Reduce Infant Mortality?...
Does Trade Reduce Infant Mortality? Evidence fromSub-Saharan Africa
Pallavi Panda
State University of New York, Geneseo
June 5, 2016
*I would like to thank Hewlett foundation/IIE for awarding the 2013-2015 HewlettFoundation Dissertation Fellowship in Population, Reproductive Health and EconomicDevelopment for this research
Motivation
Many developing countries have opened their economies in the hopesof spurring growth - But does this translate into development?
Free trade can create access to a better variety of goods, increasewomen labor force participation, increase incomes and often leads toimprovements in infrastructure investment (Dollar and Kraay, 2001;Broda and Weinstein, 2006; Wood, 1991; Storeygard, 2013)
This study:
estimates the effect of being exposed to a trade policy (African Growthand Opportunity Act) on infant and neonatal mortalityanalyzes heterogeneous effects both at the macro and micro levelexamines possible pathways

Motivation
Many developing countries have opened their economies in the hopesof spurring growth - But does this translate into development?
Free trade can create access to a better variety of goods, increasewomen labor force participation, increase incomes and often leads toimprovements in infrastructure investment (Dollar and Kraay, 2001;Broda and Weinstein, 2006; Wood, 1991; Storeygard, 2013)
This study:
estimates the effect of being exposed to a trade policy (African Growthand Opportunity Act) on infant and neonatal mortality
analyzes heterogeneous effects both at the macro and micro levelexamines possible pathways
Motivation
Many developing countries have opened their economies in the hopesof spurring growth - But does this translate into development?
Free trade can create access to a better variety of goods, increasewomen labor force participation, increase incomes and often leads toimprovements in infrastructure investment (Dollar and Kraay, 2001;Broda and Weinstein, 2006; Wood, 1991; Storeygard, 2013)
This study:
estimates the effect of being exposed to a trade policy (African Growthand Opportunity Act) on infant and neonatal mortalityanalyzes heterogeneous effects both at the macro and micro level
examines possible pathways
Motivation
Many developing countries have opened their economies in the hopesof spurring growth - But does this translate into development?
Free trade can create access to a better variety of goods, increasewomen labor force participation, increase incomes and often leads toimprovements in infrastructure investment (Dollar and Kraay, 2001;Broda and Weinstein, 2006; Wood, 1991; Storeygard, 2013)
This study:
estimates the effect of being exposed to a trade policy (African Growthand Opportunity Act) on infant and neonatal mortalityanalyzes heterogeneous effects both at the macro and micro levelexamines possible pathways
Context
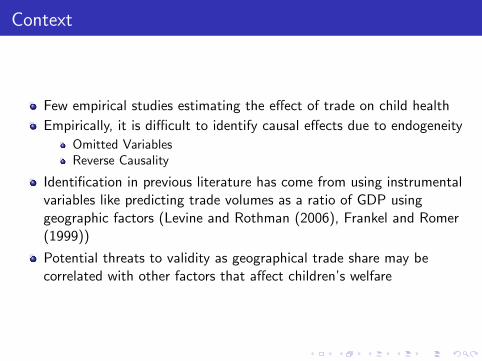
Few empirical studies estimating the effect of trade on child health
Empirically, it is difficult to identify causal effects due to endogeneity
Omitted VariablesReverse Causality
Identification in previous literature has come from using instrumentalvariables like predicting trade volumes as a ratio of GDP usinggeographic factors (Levine and Rothman (2006), Frankel and Romer(1999))
Potential threats to validity as geographical trade share may becorrelated with other factors that affect children’s welfare

Question
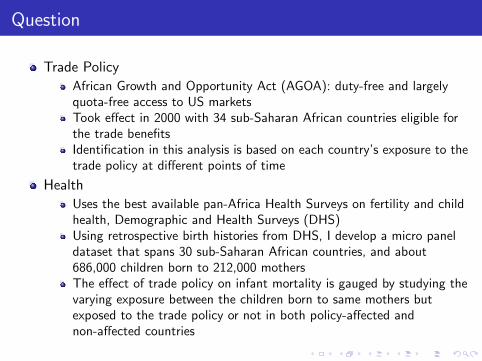
Trade Policy
African Growth and Opportunity Act (AGOA): duty-free and largelyquota-free access to US marketsTook effect in 2000 with 34 sub-Saharan African countries eligible forthe trade benefitsIdentification in this analysis is based on each country’s exposure to thetrade policy at different points of time
Health
Uses the best available pan-Africa Health Surveys on fertility and childhealth, Demographic and Health Surveys (DHS)Using retrospective birth histories from DHS, I develop a micro paneldataset that spans 30 sub-Saharan African countries, and about686,000 children born to 212,000 mothersThe effect of trade policy on infant mortality is gauged by studying thevarying exposure between the children born to same mothers butexposed to the trade policy or not in both policy-affected andnon-affected countries
Question
Trade Policy
African Growth and Opportunity Act (AGOA): duty-free and largelyquota-free access to US marketsTook effect in 2000 with 34 sub-Saharan African countries eligible forthe trade benefitsIdentification in this analysis is based on each country’s exposure to thetrade policy at different points of time
Health
Uses the best available pan-Africa Health Surveys on fertility and childhealth, Demographic and Health Surveys (DHS)Using retrospective birth histories from DHS, I develop a micro paneldataset that spans 30 sub-Saharan African countries, and about686,000 children born to 212,000 mothersThe effect of trade policy on infant mortality is gauged by studying thevarying exposure between the children born to same mothers butexposed to the trade policy or not in both policy-affected andnon-affected countries

Preview of Findings
AGOA reduces
Infant mortality in sub-Saharan Africa by 0.7 percentage points, 9% ofthe sample meanNeonatal mortality by 4.4 death per 1000, 12% of sample mean
AGOA benefits rural and poor mothers more
Effect of AGOA on infant survival is stronger for countries that exportlarge amounts of agricultural goods and mineral ores as compared tooil exporting countries
Decrease in infant mortality is operating through:
change in household income/assetschange in female employment in labor forcechanging health seeking behavior of mothers

AGOA Timeline
Impact on Exports
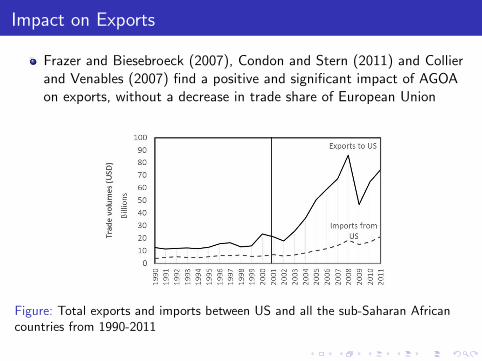
Frazer and Biesebroeck (2007), Condon and Stern (2011) and Collierand Venables (2007) find a positive and significant impact of AGOAon exports, without a decrease in trade share of European Union
Figure: Total exports and imports between US and all the sub-Saharan Africancountries from 1990-2011

Trade Linkages
Mechanism Trade Infant Deaths
Macro Channels
GDP/CapitaIncreasedExports
I
HealthExpenditure
Tax Revenues ?
Inequality ?Pollution Urbanization I
Micro Channels
Employment Income Effect ISubstitution Effect
Healthcareaccess
Realignmentof preferences
I
BargainingPower
IncreasedIncome
I
Variety GainsOpening ofmarkets
I

Data
The micro level health data for the sub-Saharan African countriescomes from the Demographic and Health Surveys (DHS)
Women of reproductive age (15-49 years) are interviewed about thedate of birth and death (if applicable) for up to 20 children they havehad
There are 36 DHS Surveys publically available
Central African Republic, Comoros, Gabon, South Africa, Sudan andTogo were all carried out before AGOA30 surveys are included in this analysis
Datasets across 30 sub-Saharan African countries from DHS collatedusing the recall data to get a micro-dataset, which runs across thesub-Saharan African countries, with the time dimension being thechild birth year

Empirical Strategy
Linear Probability Model, Specification 1
IMRimct = αm + βt + θTct + Ximctδ + µc .t + εimct
IMR is a dummy which takes the value 1 if child i born to mother min country c at time t dies before reaching the age of 1 year
Linear Probability Model, Specification 2
IMRimbct = αm + βbt + θTct + Ximbctδ + µc .t + εimbct
b: Mother’s birth cohort
Standard errors clustered at the country level to take into accountany correlation of the error across space and time within each country

Identification
Residual contains no mother-specific time-varying shocks that mightdrive a correlation between mortality and AGOAE (εimbct |Tct , βbt , αm, µc .t,Ximbct) = 0
To account for this, I include child birth year dummies interacted withmother’s cohort to non-parametrically control for cohort-year fixedeffects
Also control for observable country specific time varying shocks (likeGDP per capita, political regime, commodity prices etc.)IMRimbct = αm + βbt + θTct + Ximbctδ + µc .t + λZct + εimbct

Disentangling the Effects
Difficulty of disentangling the effect of this policy from theprerequisites for being a signatory on the AGOA
Time-invariant heterogeneity regarding geography, history, culture,politics and attitudes etc. are taken care of by the mother fixed effects(αm)The year fixed effects (βt) control for an aggregate time variationinvolving improvement of health technology and year shocks(βbt) controls for changing time of mothers age at birthCountry-specific time trends (µc .t) also allow for differential states ofdevelopment of the countries

Event-Time Study
Figure: These are the θj estimates plotted from estimating this equation:
Deathimct = αc + βt +4∑
j=−4
θjTc,t+j + Xiδ + εimct
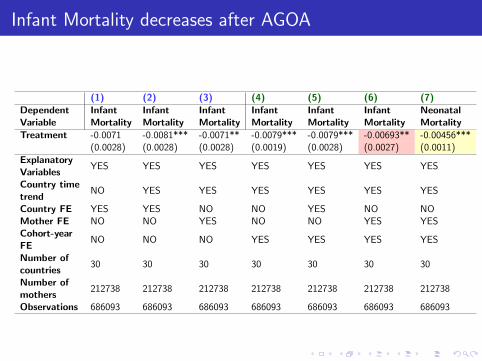
Infant Mortality decreases after AGOA
(1) (2) (3) (4) (5) (6) (7)DependentVariable
InfantMortality
InfantMortality
InfantMortality
InfantMortality
InfantMortality
InfantMortality
NeonatalMortality
Treatment -0.0071 -0.0081*** -0.0071** -0.0079*** -0.0079*** -0.00693** -0.00456***(0.0028) (0.0028) (0.0028) (0.0019) (0.0028) (0.0027) (0.0011)
ExplanatoryVariables
YES YES YES YES YES YES YES
Country timetrend
NO YES YES YES YES YES YES
Country FE YES YES NO NO YES NO NOMother FE NO NO YES NO NO YES YESCohort-yearFE
NO NO NO YES YES YES YES
Number ofcountries
30 30 30 30 30 30 30
Number ofmothers
212738 212738 212738 212738 212738 212738 212738
Observations 686093 686093 686093 686093 686093 686093 686093
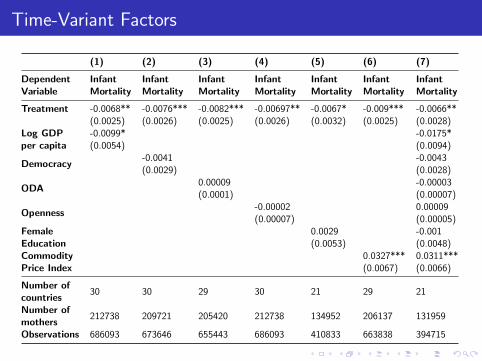
Time-Variant Factors
(1) (2) (3) (4) (5) (6) (7)
DependentVariable
InfantMortality
InfantMortality
InfantMortality
InfantMortality
InfantMortality
InfantMortality
InfantMortality
Treatment -0.0068** -0.0076*** -0.0082*** -0.00697** -0.0067* -0.009*** -0.0066**(0.0025) (0.0026) (0.0025) (0.0026) (0.0032) (0.0025) (0.0028)
Log GDPper capita
-0.0099*(0.0054)
-0.0175*(0.0094)
Democracy-0.0041(0.0029)
-0.0043(0.0028)
ODA0.00009(0.0001)
-0.00003(0.00007)
Openness-0.00002(0.00007)
0.00009(0.00005)
FemaleEducation
0.0029(0.0053)
-0.001(0.0048)
CommodityPrice Index
0.0327***(0.0067)
0.0311***(0.0066)
Number ofcountries
30 30 29 30 21 29 21
Number ofmothers
212738 209721 205420 212738 134952 206137 131959
Observations 686093 673646 655443 686093 410833 663838 394715
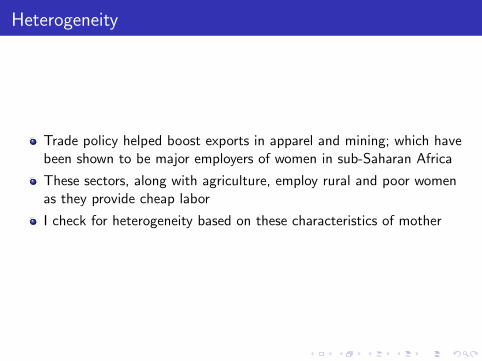
Heterogeneity
Trade policy helped boost exports in apparel and mining; which havebeen shown to be major employers of women in sub-Saharan Africa
These sectors, along with agriculture, employ rural and poor womenas they provide cheap labor
I check for heterogeneity based on these characteristics of mother

Micro Heterogeneity
(1) (2) (3) (4)
Dependent Variable Infant Mortality Infant Mortality Infant Mortality Infant Mortality
Educated-0.0054*(0.0031)
Uneducated-0.0082***(0.0029)
Rural-0.0085***(0.0028)
Urban-0.0018(0.0031)
Poor-0.0102***(0.0028)
Non-Poor-0.0044(0.0029)
Employed-0.0095***(0.0028)
Unemployed-0.0057(0.0038)
F-Stat0.83(0.371)
5.71(0.021)
7.82(0.009)
2.25(0.145)
Number of Countries 30 30 30 28Number of mothers 212732 212738 212738 197632Observations 686075 686093 686093 632951
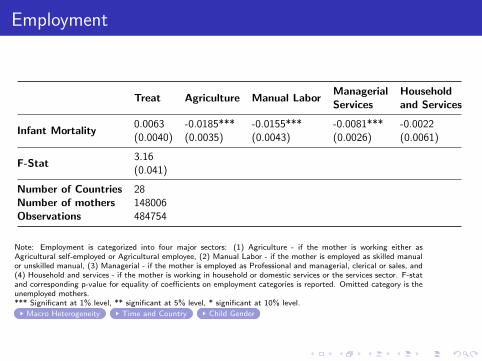
Employment
Treat Agriculture Manual LaborManagerialServices
Householdand Services
Infant Mortality0.0063(0.0040)
-0.0185***(0.0035)
-0.0155***(0.0043)
-0.0081***(0.0026)
-0.0022(0.0061)
F-Stat3.16(0.041)
Number of Countries 28Number of mothers 148006Observations 484754
Note: Employment is categorized into four major sectors: (1) Agriculture - if the mother is working either asAgricultural self-employed or Agricultural employee, (2) Manual Labor - if the mother is employed as skilled manualor unskilled manual, (3) Managerial - if the mother is employed as Professional and managerial, clerical or sales, and(4) Household and services - if the mother is working in household or domestic services or the services sector. F-statand corresponding p-value for equality of coefficients on employment categories is reported. Omitted category is theunemployed mothers.*** Significant at 1% level, ** significant at 5% level, * significant at 10% level.
Macro Heterogeneity Time and Country Child Gender

Channels
Assets/IncomeAGOA –> Incomes increase –> child health investment –> infantmortality falls
Health CareAGOA –> Increased infrastructure –> availability of health careinterventions / Mothers health seeking behavior
EmploymentAGOA –> Change in type of employment –> Increased bargainingpower for women
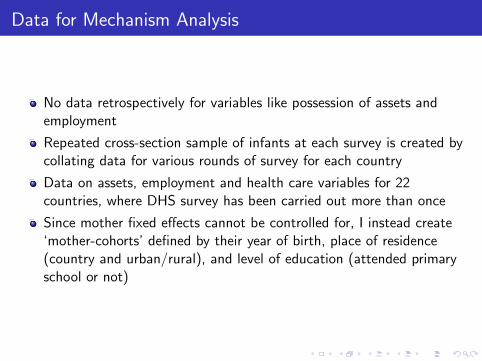
Data for Mechanism Analysis
No data retrospectively for variables like possession of assets andemployment
Repeated cross-section sample of infants at each survey is created bycollating data for various rounds of survey for each country
Data on assets, employment and health care variables for 22countries, where DHS survey has been carried out more than once
Since mother fixed effects cannot be controlled for, I instead create‘mother-cohorts’ defined by their year of birth, place of residence(country and urban/rural), and level of education (attended primaryschool or not)

Channels: Health Care
(1) (2) (3) (4)
Dependent VariableTetanusToxoid
DeliveryAssistance
PipedWater
FlushToilets
Treatment 0.132*** 0.102*** -0.069** -0.008*(0.044) (0.032) (0.025) (0.0048)
Number of countries 22 22 22 22Observations 118784 121797 119705 119657
Note: These estimates are derived from a pooled sample of mothers in multiplesurveys across 22 countries. The sample includes all babies, both living and dead,born within twelve months of survey date.*** Significant at 1% level, ** significant at 5% level, * significant at 10% level.
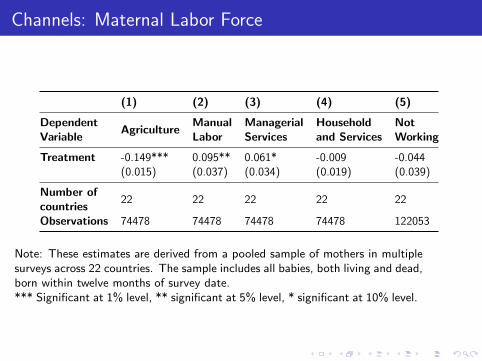
Channels: Maternal Labor Force
(1) (2) (3) (4) (5)
DependentVariable
AgricultureManualLabor
ManagerialServices
Householdand Services
NotWorking
Treatment -0.149*** 0.095** 0.061* -0.009 -0.044(0.015) (0.037) (0.034) (0.019) (0.039)
Number ofcountries
22 22 22 22 22
Observations 74478 74478 74478 74478 122053
Note: These estimates are derived from a pooled sample of mothers in multiplesurveys across 22 countries. The sample includes all babies, both living and dead,born within twelve months of survey date.*** Significant at 1% level, ** significant at 5% level, * significant at 10% level.
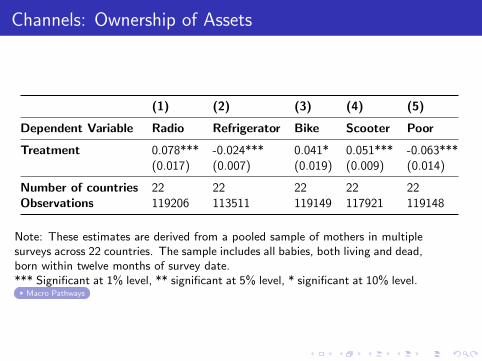
Channels: Ownership of Assets
(1) (2) (3) (4) (5)
Dependent Variable Radio Refrigerator Bike Scooter Poor
Treatment 0.078*** -0.024*** 0.041* 0.051*** -0.063***(0.017) (0.007) (0.019) (0.009) (0.014)
Number of countries 22 22 22 22 22Observations 119206 113511 119149 117921 119148
Note: These estimates are derived from a pooled sample of mothers in multiplesurveys across 22 countries. The sample includes all babies, both living and dead,born within twelve months of survey date.*** Significant at 1% level, ** significant at 5% level, * significant at 10% level.
Macro Pathways

Robustness
Fertility Selection Effect: Mothers affected by AGOA in AGOAaffected countries behave differently than mothers in non-AGOAcountries, if they had been AGOA affected - possibly timing theirbirth Fertility
Fake AGOA Treatment Placebo Test
Dynamics of AGOA Dynamics
Early adopters vs. late adopters - Those who got AGOA in 2001benefit more
Different year of birth cutoffs
Change in definition of ”treatment” Robustness Table
Outliers - Dropping one country at a time Outliers
Country-specific birth order Birth Order
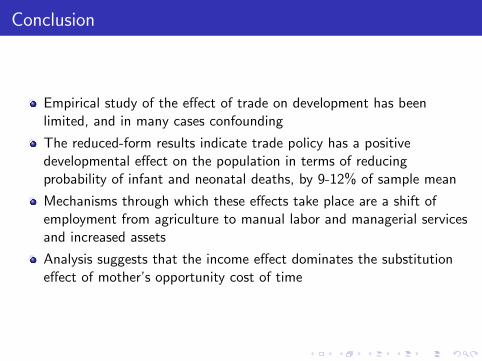
Conclusion
Empirical study of the effect of trade on development has beenlimited, and in many cases confounding
The reduced-form results indicate trade policy has a positivedevelopmental effect on the population in terms of reducingprobability of infant and neonatal deaths, by 9-12% of sample mean
Mechanisms through which these effects take place are a shift ofemployment from agriculture to manual labor and managerial servicesand increased assets
Analysis suggests that the income effect dominates the substitutioneffect of mother’s opportunity cost of time

Thank You
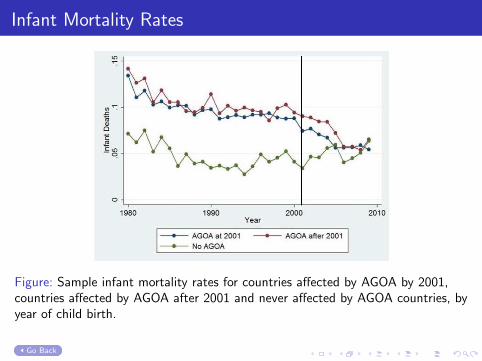
Infant Mortality Rates
Figure: Sample infant mortality rates for countries affected by AGOA by 2001,countries affected by AGOA after 2001 and never affected by AGOA countries, byyear of child birth.
Go Back

Mother Characteristics
Note: Sample means and standard deviations are reported for different samples of mothers. N refers to the number ofobservations in each sample. Column (1) gives the mean and standard deviation for different mother characteristicsfor the whole sample with AGOA affected and non-affected countries. Column (2) reports the same for all mothersin AGOA affected countries. Column (3) reports the sample mean and standard deviation for mothers with two ormore children giving birth before and after AGOA. All variables are categorical variables except mothers age at birth.Column (4) provides a difference in means t-test between (2) and (3).
Go Back

Mean Infant and Neonatal Mortality for Sample of 2+Mothers in AGOA Countries
Note: Sample mean is reported in the top row and number of live birth observations for AGOA affected countriesin the bottom row. Column (1) gives the sample mean and standard deviation for infant and neonatal mortality forthe sample of mothers giving birth both before and after AGOA. Column (2) reports the sample mean and standarddeviation for mothers with two or more children either only before AGOA or after AGOA. N represents the numberof live births.
Go Back
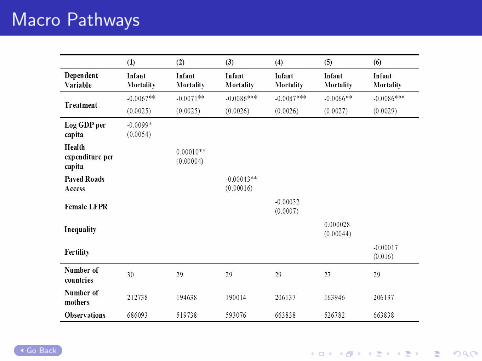
Macro Pathways
Go Back
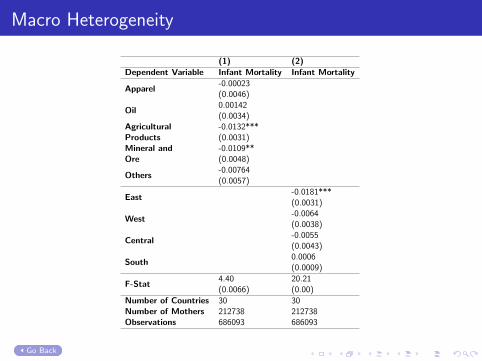
Macro Heterogeneity
(1) (2)Dependent Variable Infant Mortality Infant Mortality
Apparel-0.00023(0.0046)
Oil0.00142(0.0034)
AgriculturalProducts
-0.0132***(0.0031)
Mineral andOre
-0.0109**(0.0048)
Others-0.00764(0.0057)
East-0.0181***(0.0031)
West-0.0064(0.0038)
Central-0.0055(0.0043)
South0.0006(0.0009)
F-Stat4.40(0.0066)
20.21(0.00)
Number of Countries 30 30Number of Mothers 212738 212738Observations 686093 686093
Go Back

Time and Country Heterogeneity
Go Back
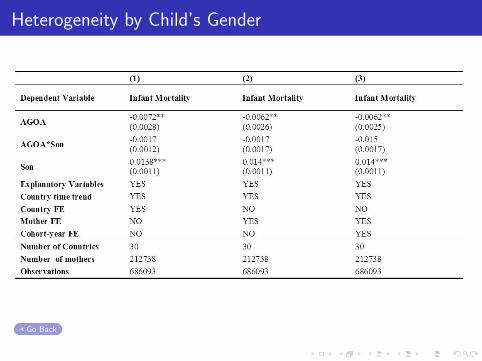
Heterogeneity by Child’s Gender
Go Back
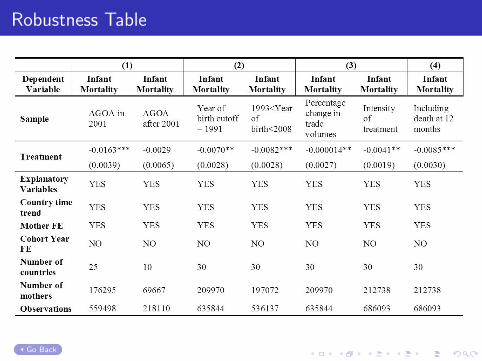
Robustness Table
Go Back
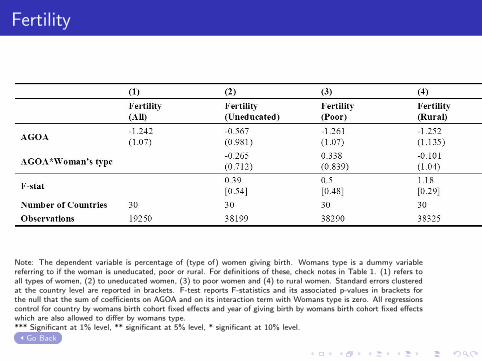
Fertility
Note: The dependent variable is percentage of (type of) women giving birth. Womans type is a dummy variablereferring to if the woman is uneducated, poor or rural. For definitions of these, check notes in Table 1. (1) refers toall types of women, (2) to uneducated women, (3) to poor women and (4) to rural women. Standard errors clusteredat the country level are reported in brackets. F-test reports F-statistics and its associated p-values in brackets forthe null that the sum of coefficients on AGOA and on its interaction term with Womans type is zero. All regressionscontrol for country by womans birth cohort fixed effects and year of giving birth by womans birth cohort fixed effectswhich are also allowed to differ by womans type.*** Significant at 1% level, ** significant at 5% level, * significant at 10% level.
Go Back
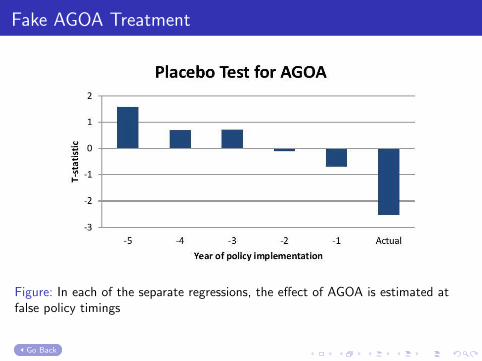
Fake AGOA Treatment
Figure: In each of the separate regressions, the effect of AGOA is estimated atfalse policy timings
Go Back
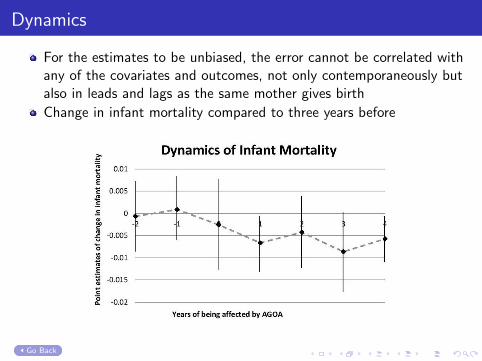
Dynamics
For the estimates to be unbiased, the error cannot be correlated withany of the covariates and outcomes, not only contemporaneously butalso in leads and lags as the same mother gives birth
Change in infant mortality compared to three years before
Go Back
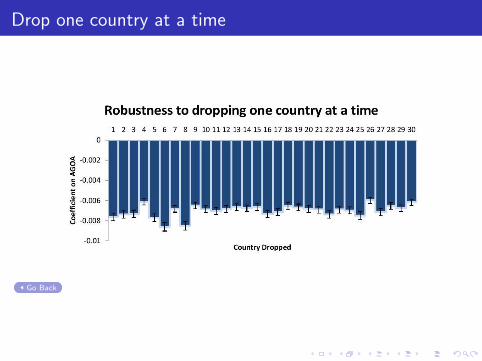
Drop one country at a time
Go Back

Country-Specific Birth Order
Go Back
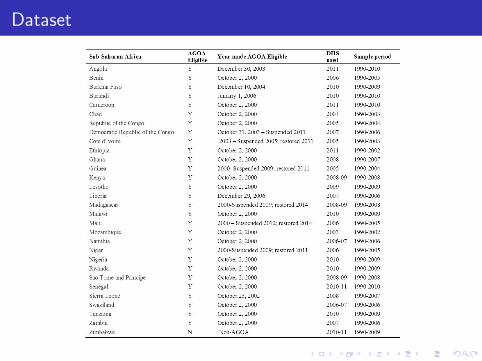
Dataset
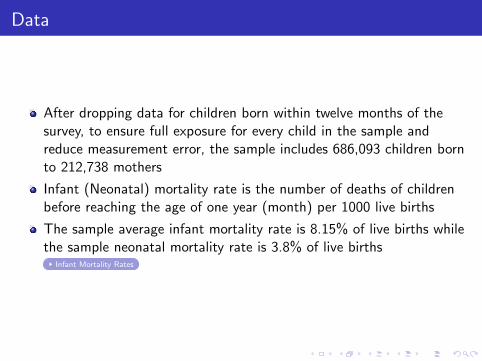
Data
After dropping data for children born within twelve months of thesurvey, to ensure full exposure for every child in the sample andreduce measurement error, the sample includes 686,093 children bornto 212,738 mothers
Infant (Neonatal) mortality rate is the number of deaths of childrenbefore reaching the age of one year (month) per 1000 live births
The sample average infant mortality rate is 8.15% of live births whilethe sample neonatal mortality rate is 3.8% of live births
Infant Mortality Rates

Summary Statistics - Child Variables
(1) (2) (3) (4)All AGOA Non-AGOA t-test
Child VariablesInfant Mortality 0.0815 0.0803 0.089 9.23
UneducatedN
0.0939342382
0.0922295320
0.10447062
8.02
PoorN
0.0902300418
0.0889258369
0.09842049
6.21
RuralN
0.0866501284
0.0853436169
0.09565115
7.98
Neonatal Mortality 0.038 0.038 0.040 3.33Female 0.492 0.492 0.492 -0.05Multiple Births 0.035 0.035 0.033 -2.49Birth Order 3.47 3.47 3.45 -1.93Month of birth 6.15 6.16 6.07 -7.07Mother’s ageat birth
25.68 25.69 25.65 -1.68
N 686093 594578 91515
Mother Characteristics Sample 2+ Mothers
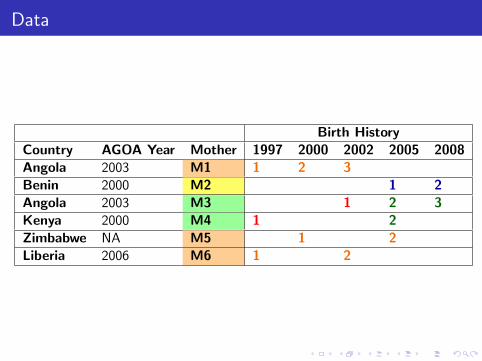
Data
Birth HistoryCountry AGOA Year Mother 1997 2000 2002 2005 2008Angola 2003 M1 1 2 3Benin 2000 M2 1 2Angola 2003 M3 1 2 3Kenya 2000 M4 1 2Zimbabwe NA M5 1 2Liberia 2006 M6 1 2

Pathway Analysis Dataset