Does Rising Student Debt Affect the Home Purchases of ... loan frbny - upjohn.pdf · Does Rising...
30
Upjohn Institute, October 26, 2013 Meta Brown, Andrew Haughwout, Donghoon Lee, Joelle Scally, Wilbert van der Klaauw Does Rising Student Debt Affect the Home Purchases of Young Borrowers? The views presented here are those of the author and do not necessarily reflect those of the Federal Reserve Bank of New York, or the Federal Reserve System
Transcript of Does Rising Student Debt Affect the Home Purchases of ... loan frbny - upjohn.pdf · Does Rising...

Upjohn Institute, October 26, 2013 Meta Brown, Andrew Haughwout, Donghoon Lee, Joelle Scally, Wilbert van der Klaauw
Does Rising Student Debt Affect the
Home Purchases of Young Borrowers?
The views presented here are those of the author and do not necessarily reflect those of the
Federal Reserve Bank of New York, or the Federal Reserve System

2
Higher education is crucial to improving the skill level of American
workers, especially in the face of a rising income and employment gap
across workers with varying education levels.
Due to increasing enrollment and the rising cost of higher education,
student loans play an increasingly important role in financing higher
education.
However, the rapidly increasing burden of student debt is now over $1
trillion, and is attracting special attention from policymakers, the
media, and the public.
We present our analysis on the historical and current situation of
student debt and discuss its implications for the borrowers and the
economy.
Higher Education and Student Debt

3
Data
Accounting for aggregate balance growth
Student loan payment and delinquency
Student loan and Housing and other debt.
Outline

4
The findings discussed here are based on the FRBNY Consumer
Credit Panel (CCP) – a representative sample of consumer credit data
that the New York Fed acquired from Equifax.
FRBNY CCP contains borrower level information on student loan
balance, payment status together with other types of household debt
such as mortgages, credit cards and auto loans – but no information
on federal loans vs. private loans.
This is a source data for “FRBNY Quarterly report on Household debt
and credit” which updates information on student loan borrowers and
related household debt.
www.newyorkfed.org/householdcredit
About the Data
5
Panel of loans, individuals and households based on individual credit reports Ability to track individual borrowers over time: follow individuals with and without student loans (entry and exit), and can link over consolidations, rehabilitations, account transfers due to defaults Ability to link multiple loans for same person at any point in time: multiple student loan accounts, federal and private loans Ability to link individuals in the same household: credit/loan situation of all family members – total exposure and distribution within household, Parents plus loans and parents cosigning for their children
Data. The FRBNY Consumer Credit Panel

6
Representative Panel and Household
Matching
Unique sample design generating a longitudinal quarterly panel of individuals and households from 1999-2013.
Universe: entire US Population with credit files (240 million
individuals per quarter, aged 18 and older.)
Sample selection: random 5% using last 4 digits of SSN + All household members
Household matching: based on home address
Representative sample of US individuals and households (about 40 million individuals per quarter)
Sample Design

7
Longitudinal information on all individual student loans and mortgages Individual account variables: opening date, origination amount,
current balance, origination balance, delinquency status, individual/joint account, term/monthly payment, narrative codes detailing credit events such as default
Borrower level information on auto loans, credit cards Consumer-level auto loan, credit card data: Total
Balance/Number of accounts by Delinquency Status, origination amount and credit limit
Public record information Public record information on bankruptcies, collections, tax liens
Individual characteristics Borrower characteristics: birth year, geographic location (state,
zipcode, census block)
Main Features of FRBNY CCP

for internal use only
Part 1: Growth of Student Loans
8

9
Total student loan balances by age group increasing across all age groups
0
100
200
300
400
500
600
700
800
900
1,000
2004 2005 2006 2007 2008 2009 2010 2011 2012
under 30 30-39 40-49 50-59 60+
33%
Billions of Dollars
17%
12%
5%
33%
Source: FRBNY Consumer Credit Panel / Equifax

10
Non-mortgage balances
Student debt is the only kind of household debt that continued
to rise through the Great Recession and has now the second
largest balance after mortgage debt.
Source: FRBNY Consumer Credit Panel / Equifax
0
100
200
300
400
500
600
700
800
900
1000
0
100
200
300
400
500
600
700
800
900
1000
HELOC Auto Loan Student Loan Credit Card
Billions of Dollars Billions of Dollars

11
Distribution of student loan balance, 2012:Q4
40% of borrowers have balances less than $10,000
3.7% of borrowers have balances greater than $100,000
39.9%
29.8%
17.7%
9.0%
2.2% 0.9% 0.6%
$1-10,000
$10,000-25,000
$25,000-50,000
$50,000-100,000
$100,000-150,000
$150,000-200,000
$200,000+
Balance
Source: FRBNY Consumer Credit Panel / Equifax

12
Number of borrowers and average balance per person
0
10
20
30
40
Mil
lio
ns
Number of borrowers
Each increased by 70% between 2004 and 2012 (7% per year)
Source: FRBNY Consumer Credit Panel / Equifax
0
5
10
15
20
25
Th
ou
sa
nd
s o
f D
oll
ars
Average balance per borrower

13
Student borrowing increasingly prevalent
Source: FRBNY Consumer Credit Panel / Equifax
0%
5%
10%
15%
20%
25%
30%
35%
40%
45%
2004:Q4 2005:Q4 2006:Q4 2007:Q4 2008:Q4 2009:Q4 2010:Q4 2011:Q4 2012:Q4
Share of 25 year olds with student debt

14
Student debt almost tripled between 2004 and 2012 and stands at $966B as of 2012:Q4
70% increase in the number of borrowers
70% increase average balance per person
High inflow:
▫ Increasing number of new borrowers
▫ Taking more years to complete education
Low outflow:
▫ Low repayment rates
▫ High delinquency
Two-thirds of the outstanding balance is held by borrowers under 40 years old
Student loans are now the second-largest form of household debt, after mortgages
Summary 1: Growth of Student Debt

for internal use only
Part 2: Student Debt Delinquency
15

16
6.7 million borrowers, or 17%, are 90+ days delinquent.
30-49 year olds have higher delinquency rates.
Source: FRBNY Consumer Credit Panel / Equifax
0%
5%
10%
15%
20%
25%
30%
35%
40%
age<30 age 30-49 age 50+ all
2004 2008 2012
Share of borrowers 90+ days delinquent (incl. default)

17
not in repayment: balance the
same 14%
not in repayment: balance up
30%
Borrower repayment status, 2012:Q4
About 44% of borrowers
are not yet in active
repayment due to
deferments and
forbearances.
Another way to look at the
delinquency rate is to
consider only those in
active repayment and
remove those who are not
in repayment from the
denominator…
in repayment:
balance delinquent
17%
in repayment: balance not delinquent
39%
Source: FRBNY Consumer Credit Panel / Equifax * Repayment status is defined using the quarterly
change in balance and the current payment status.

18
Delinquency rates higher among borrowers in repayment
Source: FRBNY Consumer Credit Panel / Equifax
0%
5%
10%
15%
20%
25%
30%
35%
40%
age<30 age 30-49 age 50+ all ages
Share of borrowers in repayment 90+ days delinquent
2004 2008 2012
0%
5%
10%
15%
20%
25%
30%
35%
40%
age<30 age 30-49 age 50+ all ages
Share of borrowers 90+ days delinquent
2004 2008 2012

19
Quarterly transition rate of borrowers in repayment from non-delinquent to delinquent
Source: FRBNY Consumer Credit Panel / Equifax
0%
1%
2%
3%
4%
5%
6%
7%
8%
9%
0%
1%
2%
3%
4%
5%
6%
7%
8%
9%
2005 2006 2007 2008 2009 2010 2011 2012

20
About 17% of borrowers are past due on their student debt
more than 90 days in 2012, a large increase from under 10% in
2004
44% of borrowers are not yet in active repayment, and
excluding those, the effective 90+ delinquency rate rises to
more than 30%.
The transition rate among borrowers in active repayment from
current to delinquent has been rising since 2008 from about 7%
to nearly 9%.
Summary 2: Student Debt Delinquency

for internal use only
Part 3: Student debt and other debts
21

22
Non-student debt declined for all borrowers age 25-30 Decline particularly pronounced for borrowers with larger student debt
Source: FRBNY Consumer Credit Panel / Equifax
$0
$10,000
$20,000
$30,000
$40,000
$50,000
$60,000
$0
$10,000
$20,000
$30,000
$40,000
$50,000
$60,000
$0
$1
-10
K
$1
0K
-25
K
$25K
-50K
$5
0K
-75
K
$7
5K
-10
0K
$100K
+
$0
$1
-10
K
$1
0K
-25
K
$2
5K
-50
K
$5
0K
-75
K
$7
5K
-10
0K
$1
00
K+
2005 Student Debt Balance 2012 Student Debt Balance
Average non-student loan balances, age 25-30
auto credit card mortgage HELOC other
2005 Student Debt Balance 2012 Student Debt Balance
23
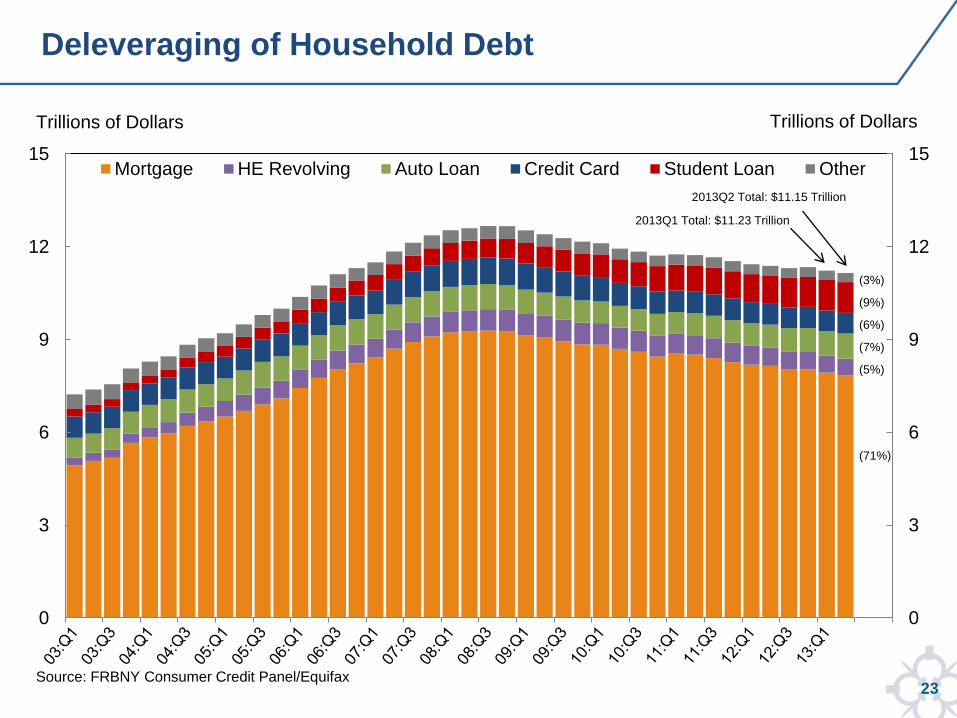
Deleveraging of Household Debt
0
3
6
9
12
15
0
3
6
9
12
15Mortgage HE Revolving Auto Loan Credit Card Student Loan Other
Trillions of Dollars Trillions of Dollars
Source: FRBNY Consumer Credit Panel/Equifax
2013Q1 Total: $11.23 Trillion
2013Q2 Total: $11.15 Trillion
(3%)
(9%)
(6%)
(7%)
(5%)
(71%)

24
Mortgages among student loan borrowers age 25-30 Originations by student loan balance and delinquency status
With delinquent student debt, mortgage origination is very difficult.
The mortgage origination gap across the size of student debt has declined
between 2005 and 2012.
0%
2%
4%
6%
8%
10%
12%
14%
16%
18%
2005:Q4 2006:Q4 2007:Q4 2008:Q4 2009:Q4 2010:Q4 2011:Q4 2012:Q4
no student debt with current student debt
with current 100K+ student debt with 90+ delinquent student debt
Source: FRBNY Consumer Credit Panel / Equifax; Note: delinquency is as of Q4 of previous year
25
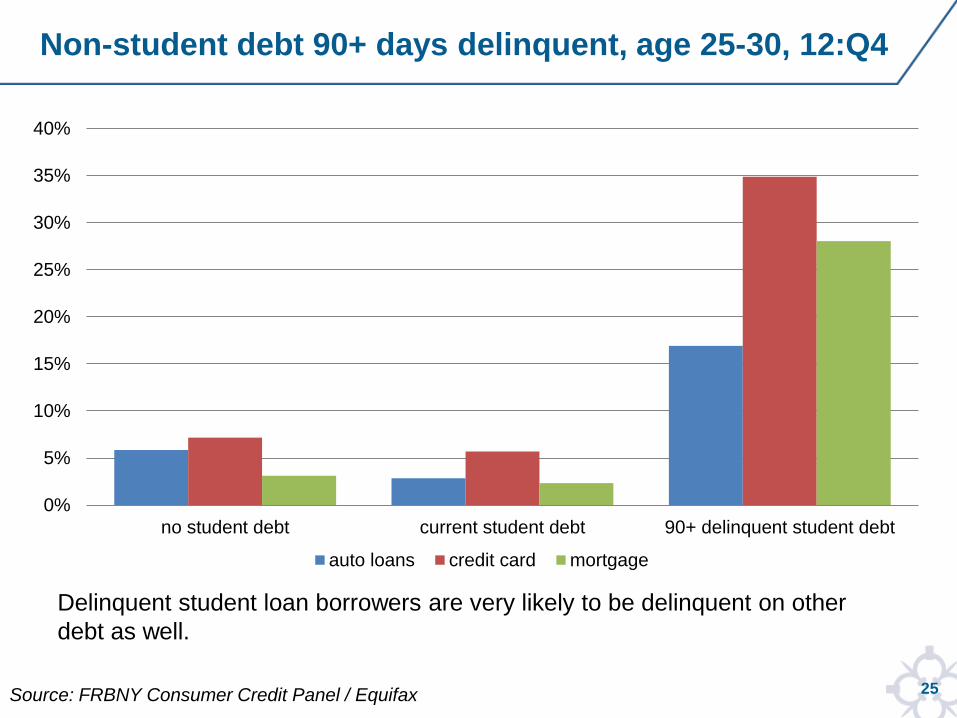
Non-student debt 90+ days delinquent, age 25-30, 12:Q4
Delinquent student loan borrowers are very likely to be delinquent on other
debt as well.
Source: FRBNY Consumer Credit Panel / Equifax
0%
5%
10%
15%
20%
25%
30%
35%
40%
no student debt current student debt 90+ delinquent student debt
auto loans credit card mortgage

26
Young people borrowed less in 2012 compared to 2005, but the
differences were more pronounced among borrowers with high
student loan balances, likely reflecting declines in demand and
access to credit.
Student debt delinquency reduces a young borrower’s ability to
secure other types of credit.
Student loan delinquency is also associated with higher
delinquency rates on other types of debt.
Summary 3: Student Debt and Other Debt
27
Higher education is an important investment among young
workers for better jobs and higher income, but it is
accompanied with a growing student debt burden.
Aggregate student loan balances almost tripled between 2004
and 2012 due to an increasing number of borrowers and higher
balances per borrower.
About 17% of borrowers are delinquent on student debt.
Adjusting for repayment causes the delinquency rate to rise to
over 30%.
The larger burden of student loans and higher delinquencies
may affect borrowers’ access to other types of credit and the
performance of other debt.
Conclusion

for internal use only
APPENDIX
28

29
Appendix A: Why borrow for education?
College graduates have lower unemployment rates, fare
better during recessions, and enjoy wages roughly double
those of high school graduates.
0
200
400
600
800
1000
1200
high schoolgraduates
bachelor's degreeor higher
Me
dia
n D
oll
ars
pe
r W
ee
k
Median Weekly Earnings, 2012:Q4
Dec-2007
Dec-2007
Jun-2009
Jun-2009
Jan-2013
Jan-2013
0
1
2
3
4
5
6
7
8
9
10
High SchoolGraduate
Bachelor's degree
Pe
rce
nt
Unemployment Rate
Source: Bureau of Labor Statistics

30
On our website, we provide:
Updates of our Quarterly Report on Household Debt &
Credit
▫ Balances for Mortgages, Credit Card, Auto, & Student Debt
▫ Delinquency rates
Spreadsheets:
▫ All data featured in the Quarterly Report on Household Debt &
Credit (1999-2013:q1, quarterly)
▫ Student loan
– # borrowers, delinquency rates, average balance
– By state (2004-2012, annual)
– By age group (2012 only)
Appendix B: www.newyorkfed.org/householdcredit