Does Offshoring Pay? Firm-Level Evidence from Japan · Does Offshoring Pay? Firm-Level Evidence...
34
DP RIETI Discussion Paper Series 07-E-005 Does Offshoring Pay? Firm-Level Evidence from Japan Alexander HIJZEN OECD and GEP, University of Nottingham INUI Tomohiko Nihon University TODO Yasuyuki Aoyama Gakuin University The Research Institute of Economy, Trade and Industry http://www.rieti.go.jp/en/
Transcript of Does Offshoring Pay? Firm-Level Evidence from Japan · Does Offshoring Pay? Firm-Level Evidence...

DPRIETI Discussion Paper Series 07-E-005
Does Offshoring Pay? Firm-Level Evidence from Japan
Alexander HIJZENOECD and GEP, University of Nottingham
INUI TomohikoNihon University
TODO YasuyukiAoyama Gakuin University
The Research Institute of Economy, Trade and Industryhttp://www.rieti.go.jp/en/

RIETI Discussion Paper Series 07-E-005
Does Offshoring Pay? Firm-Level Evidence from Japan*
Alexander Hijzen,† Tomohiko Inui‡ and Yasuyuki Todo§
December 2006
Abstract
This paper explores the impact of offshoring, or contracting out of business activities to foreign providers, on firm productivity, using Japanese firm-level data for the period 1994-2000. We find that offshoring has generally a positive effect on productivity growth. This effect is robust to controlling for the possible endogeneity of offshoring with respect to unobserved productivity shocks. Our preferred specification suggests that a one percent increase in offshoring intensity raises productivity growth by 0.17 percent. For the average offshoring firm this implies a 1.8 percent increase in annual productivity growth. These results do not appear to depend much on either the level of technological sophistication of a firms’ industry or a firms’ international orientation. However, we find that the scope for productivity improvements from offshoring depends negatively on the initial level of productivity of the firm.
Keywords: offshoring, international insourcing, domestic sourcing, TFP JEL Code: F14, L23
* This research was conducted as part of a project on industry- and firm-level productivity in Japan undertaken at the Research Institute of Economy, Trade and Industry (RIETI). The authors would like to thank RIETI for providing us the opportunity of conducting this research and the Ministry of Economy, Trade and Industry for providing us valuable datasets. The authors are also grateful to Kyoji Fukao, Tsutomu Miyagawa, Jungsoo Park, Eiichi Tomiura, Masaru Yoshitomi, and seminar participants at the RIETI-21st Century COE Hi-Stat Program Workshop and a RIETI DP seminar for helpful comments and suggestions and Young Gak Kim, Hyeog Ug Kwon and Toshiyuki Matsuura for their help in constructing the dataset. Inui thanks the Japan Society for the Promotion of Science (Grant-in-Aid for Scientific Research). Alexander Hijzen gratefully acknowledges financial support from the Leverhulme Trust (Grant No. F114/BF). The opinions expressed and arguments employed in this paper are the sole responsibility of the authors and do not necessarily reflect those of RIETI or any of the institutions the authors belong to. † OECD and GEP, University of Nottingham. ‡ College of Economics, Nihon University. § Corresponding author. School of International Politics, Economics and Business, Aoyama Gakuin University. Email: [email protected], URL: http://www.sipec-square.net/~yastodo/.
RIETI Discussion Papers Series aims at widely disseminating research results in the form of professional papers, thereby stimulating lively discussion. The views expressed in the papers are solely those of the author(s), and do not present those of the Research Institute of Economy, Trade and Industry.
2
1. Introduction
The rise in offshoring, or contracting out of business activities to foreign providers, has been an
important factor behind the growth in world trade (Yeats, 1998; Yi, 2003). East Asia is not an
exception to the rise in offshoring: The growing geographical specialization along the
value-chain has given rise to the development of sophisticated production sharing arrangements
within East Asia (Ng and Yeats, 1999; Fukao, Ishido and Ito, 2003). In particular, Japanese firms
have increasingly taken advantage of the business opportunities provided through offshoring of
production activities to other East Asian countries (Ando and Kimura, 2005).
Given the importance of these developments, understanding implications of offshoring
should be of significant interest to academics and the policy-making community. However, most
research so far has concentrated on the potentially adverse labor market aspects of offshoring in
developed countries (Feenstra and Hanson, 1996, 1999; Head and Ries, 2002; Hijzen, Görg and
Hine, 2005), and much less attention has been directed towards understanding the benefits of
the offshoring phenomenon. Possible benefits of offshoring include increased firm profitability,
reduced consumer prices and enhanced total factor productivity. In the present paper we focus
on the impact of offshoring on total factor productivity. Offshoring may lead to the
improvement of the productivity of primary factors of domestic production by allowing firms to
specialize in activities they perform relatively well.1 We focus explicitly on goods offshoring
rather than services offshoring which has recently become the centre of the offshoring debate,
but does not come close, as of yet, to the importance of goods offshoring (Amiti and Wei, 2006).
1 Offshoring may also yield important benefits to the economy due to sizeable cost-savings that may translate in either higher firm profits and/or lower consumer prices. However, this aspect of offshoring cannot be examined in the analytical framework of the present paper, as we will later explain.
3
For our analysis of the impact of offshoring on productivity growth we make use of
firm-level data for the Japanese manufacturing sector for the period 1994-2000. One great
advantage of our dataset is that it comprises information on the value of subcontracting to
foreign providers so that we can construct a direct measure of offshoring. This measure includes
both subcontracting at arm’s length, which corresponds to ‘international outsourcing’, and the
purchases of intermediate inputs from a firm’s foreign affiliates. We refer to this broad notion of
offshoring as ‘offshoring’. In addition, we have data on the amount of purchases from a firm’s
foreign subsidiaries, which provides us with a proxy for the extent of international
subcontracting within the firm. Following Olsen (2006) we refer to this second measure as
‘international insourcing’. By including both measures simultaneously we can infer to what
extent the organisational model of offshoring, intra-firm or arm’s length, matter. Finally, we also
consider the effects of subcontracting to domestic providers, which we refer to as ‘domestic
sourcing’.
A number of previous studies have analyzed similar issues using industry-level data. For
the measurement of offshoring, such studies typically rely on input-output data. Egger and
Egger (2006) analyze how international outsourcing affects the productivity of low-skilled
workers employed in the EU manufacturing sector. They find that the rise in international
outsourcing accounted for 6 percent of the increase in value added per worker during the period
1992-1997. Amiti and Wei (2006) analyze the productivity effects of materials and services
offshoring on the productivity of US firms. They find that both materials and services offshoring
have a positive effect on firm productivity, but that the positive effect of services offshoring is
considerably larger, accounting for about 11 percent of productivity growth during the sample
period compared to 5 percent for materials offshoring.
Görg and Hanley (2005) and Görg, Hanley and Strobl (2005) were the first to analyze the
impact of offshoring on productivity using firm-level data. The main advantage of using
4
firm-level data is, no doubt, that it allows one to control for firm heterogeneity. Using data for
Ireland, they find that both materials and services offshoring benefit firm productivity, but that
the benefits only accrue to multinationals and exporters. Criscuolo and Leaver (2005) who focus
exclusively on services offshoring also find a positive impact on productivity, using data for the
United Kingdom.2
To the best of our knowledge, the link between offshoring and productivity has not been
explicitly explored in the context of Japan. Kimura (2002) analyzes the relationship between
subcontracting and productivity, but does not consider international subcontracting. Tomiura
(2005) analyzes the determinants of offshoring decisions. He finds that firms that engage in
offshoring tend to be larger and more productive than firms that do not offshore, suggesting that
there may be sizable fixed costs associated with offshoring.
To preview our results, we find that offshoring and international insourcing have
generally a positive effect on total factor productivity (TFP) growth at the firm level. This effect
is robust to controlling for the possible endogeneity of offshoring and international insourcing
with respect to unobserved productivity shocks by employing the system generalized method of
moments (GMM) estimation developed by Blundell and Bond (1998). The results suggest that a
one percent increase in offshoring intensity raises productivity growth by 0.17 percent. For the
average offshoring firm this implies, ceteris paribus, an annual TFP growth rate that is 1.8
percent higher than that of non-offshoring firms. The positive effect appears to be associated
with both international insourcing and international outsourcing. These results are further fairly
general in the sense that the positive relationship between offshoring and productivity growth
extends across firms with different levels of technological sophistication or international
orientation. However, we find that the scope for productivity improvements from offshoring
2 See Olsen (2006) for an excellent survey on the productivity impact of offshoring.
5
depends negatively on the initial level of productivity of the firm, which indicates that
offshoring may be an effective channel in restoring the competitiveness of less productive firms.
The remainder of this paper is structured as follows. Section 2 discusses the empirical
methodology, whereas Section 3 describes the data and provides some descriptive statistics on
offshoring. In Section 4, we discuss the estimation results, and finally, Section 5 concludes.
2. Empirical Methodology
In line with recent production function studies such as Aghion, Blundell, Griffith, Howitt, and
Prantl (2004), we adopt a two-step estimation procedure in which we first derive a TFP measure
and then estimate the effect of offshoring on the growth of the TFP measure. Compared to a
one-step procedure in which we would directly estimate the impact of offshoring on value added
growth, the two-step procedure has the advantage that we do not need to use the growth of the
capital stock or labor as regressors. Since the capital stock and labor are often highly persistent,
the first-differenced log of capital stock and labor may be close to a white noise. Consequently,
the estimated coefficients on ∆lnK and ∆lnL from regression of ∆lnY are often very different
from commonly accepted values, 1/3 and 2/3, respectively.
2.1 Measures of total factor productivity
In order to analyze the impact of offshoring on firm-level total factor productivity growth, we
start off by defining two measures of total factor productivity (TFP). First, we employ the
chained multilateral index of firm-level TFP based on the methodology in Caves, Christensen
and Diewert (1982) and Good, Nadiri and Sickles (1996). This index is defined as:
( ) ( )
( )( ) ( )( )
11
, 1 1, 1 ,
ln ln ln ln ln
1 1ln ln ln ln ,2 2
tIN
it it t
t
iJt Jt it t J JJ K L J K L
TFP Y Y Y Y
s s J J s s J J
τ ττ
τ τ τ ττ
−=
− −= = =
= − + −
− + − − + −
∑
∑ ∑ ∑ (1)
6
where subscripts i and t represent firm i and year t, respectively. Y refers to value added, K to
capital, L to labor, and siJt is the cost share of factor J for firm i in year t. ln tY , ln tJ , and Jts
are the arithmetic means of ln itY , ln itJ , and iJts , respectively, across all i in the same 2-digit
industry in year t. Equation (1) implies that the multilateral TFP index, INitTFP , measures firm
i's TFP level in year t relative to the TFP level of the hypothetical firm in year 0 whose input
shares are equal to the arithmetic mean of input shares and whose output and input quantities are
equal to the geometric mean of output and input quantities, respectively.
Second, we derive a regression-based measure of firm-level TFP by estimating:
ˆ ˆln ln ln lnBTit it K it L itTFP Y K Lβ β= − − (2)
where ˆKβ and ˆ
Lβ represent estimated capital and labor elasticity, respectively. We estimate
(2) whilst taking account of the potential correlation between factor inputs and the error term.
This may be important when contemporaneous unobserved productivity shocks affect the choice
of factor inputs. The standard method to account for this is by implementing the procedure
proposed by Olley and Pakes (1996) or extensions of the Olley-Pakes procedure such as the one
proposed by Levinsohn and Petrin (2003). As R&D activities are considered to be an important
determinant of TFP growth in Japan we allow for this feature in our empirical model.
Accordingly, we use the method developed by Buettner (2003) that extends the Olley and Pakes
procedure to account for the potential correlation between R&D activities and unobserved
productivity shocks. See Appendix A for more details on Buettner’s (2003) method.
An advantage of the multilateral TFP index given by equation (1) is that we do not need to
assume a specific functional form of the production function, while its drawback is that we have
to assume perfect competition and constant returns to scale. In contrast, a major benefit of the
regression-based TFP measure obtained from Buettner’s (2003) method is that we do not need to
assume constant returns to scale. Its main shortcoming lies in assuming a Cobb-Douglas
7
production function. Therefore, these two measures of TFP can be viewed as complements, and
we will employ both measures to check the robustness of our results with respect to the
measurement of TFP.
2.2 Effect of offshoring on TFP growth
Offshoring may affect TFP mainly because it allows firms to benefit from static and dynamic
gains from specialization. Consider a developed-country firm which has multiple stages of
production process and is more efficient in skill-intensive production stages. Offshoring
labor-intensive or less skill-intensive stages allows the firm to make a more efficient use of
production factors that remain in employment and thus increase the firms’ productivity.
Moreover, the gain from specializing in skill-intensive stages of production process may be
dynamic, rather than static. Young (1991), for example, suggests, that productivity in more
advanced production stages may grow at a higher rate than productivity in less advanced stages,
since the potential of improvements in the productivity through learning by doing are likely to
be more pronounced in more sophisticated production activities than in more standardised
activities which can be offshored. Thus, we would expect that specializing in skill-intensive
production stages through offshoring generates higher growth in productivity due to larger
learning-by-doing effects than in the case of no offshoring.
Based on this argument, we assume that the extent of offshoring has a positive effect on
TFP growth of the firm. We assume the following estimable equation for firm-level TFP growth:
, 1 , 1 , 1 , 1ln lnit i t O i t D i t R i t i t itA A O D Rρ β β β δ α ε− − − −Δ = Δ + + + + + + , (3)
where Ait is one of the two measures of TFP discussed in the previous subsection, and
, 1ln ln lnit it i tA A A −Δ ≡ − . The lagged dependent variable, , 1ln i tA −Δ , is included as a regressor to
8
account for the persistence of TFP growth over time.3 Oi,t-1 and Di,t-1 represent the extent of
offshoring and domestic sourcing, respectively, for firm i in year t - 1. Ri,t-1 is the R&D intensity
for firm i, or the ratio of R&D expenditure to value added. In contrast to Görg and Hanley
(2005), Görg, Hanley and Strobl (2005), and Amiti and Wei (2006), we explicitly control for the
role of the R&D activities in TFP growth. Failing to do so may lead to omitted variable bias,
when the decision to offshore and expenditure on R&D are correlated. δi and αt are firm- and
time-specific effects, respectively, and εit is the error term.
More specifically, the offshoring intensity, O, is represented by the ratio of the expenditure
on subcontracting of products, parts and components to foreign providers to value added of the
firm. We denote this as Offshoring that represents the intensity of offshoring in general,
including international outsourcing and international insourcing. In addition, we employ a
measure of the intensity of international insourcing, a particular type of offshoring, defined as
the ratio of purchases from the firm’s own foreign subsidiaries to value added. This variable,
denoted by International Insourcing, is used to examine the effect of offshoring to the firm’s
own subsidiaries in particular, rather than offshoring in general. By including both measures
simultaneously we can infer to what extent the organisational model of offshoring, intra-firm or
arm’s length, matter. The intensity of domestic sourcing, D, is represented by the ratio of the
expenditure on subcontracting of products, parts and components to domestic providers to value
added and denoted by Domestic Sourcing. The expenditure on international and domestic
subcontracting and purchases from firms’ own foreign subsidiaries are directly reported by each
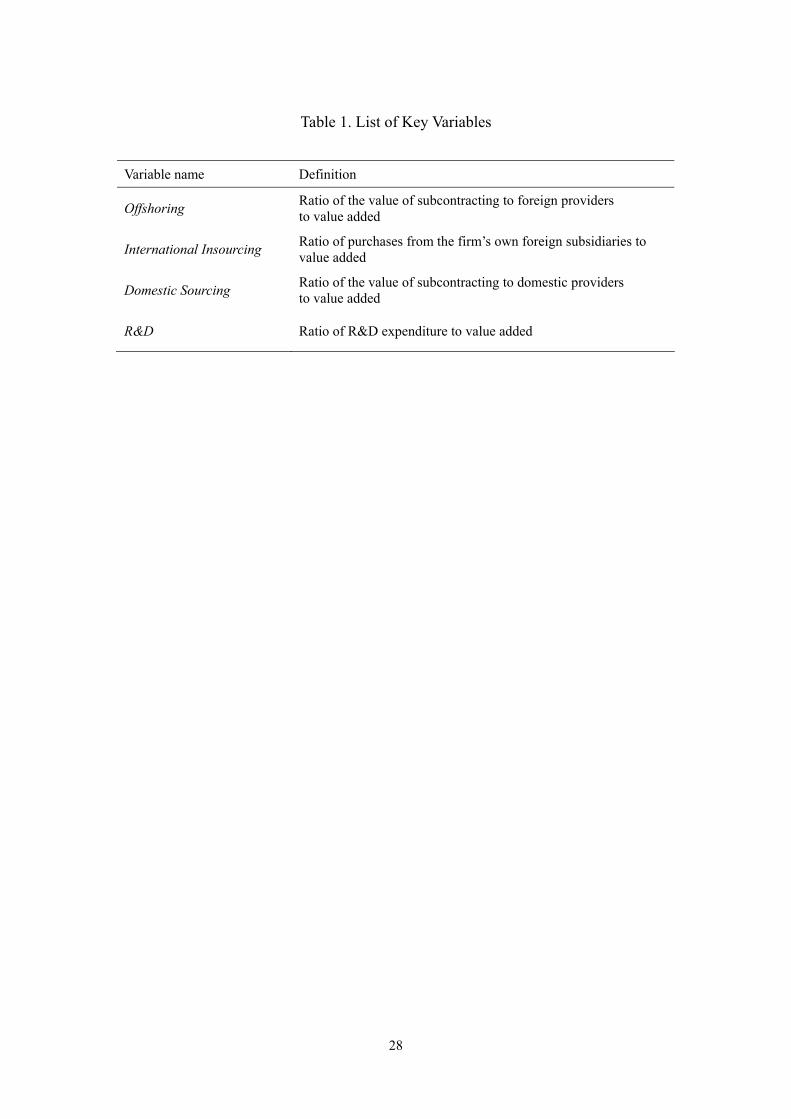
firm. Table 1 summarizes the definition of the key variables used in the present analysis.
3 GMM estimation without the lagged TFP growth as a regressor and GMM estimation with the lagged TFP level lead to the rejection of the null hypothesis that instruments and the error term are orthogonal according to the Hansen J statistic.
9
2.3 Estimation method
An econometric concern that needs to be addressed when estimating equation (3) is the
endogeneity of regressors. In other words, estimation will be biased if firms decide to engage in
offshoring on the basis of any unobserved productivity differences across firms. The direction of
the bias is not immediately clear. When there is a fixed cost of offshoring that induces a
self-selection process so that only the most productive firms offshore, the coefficient on
offshoring will be upward biased. If, on the contrary, low productivity firms engage in defensive
offshore in order to boost their competitiveness, the coefficient on offshoring will be downward
biased. The same applies to our domestic sourcing and R&D variables.
Therefore, we employ the system GMM estimation developed by Blundell and Bond
(1998) to correct for the possible endogeneity of any of our right-hand side variables in equation
(3) and to eliminate firm-specific fixed effects. We use as instruments the first and second lags
of endogenous regressors for the first-differenced equation and their first first-differenced lags
for the level equation. We employ one-step GMM, using robust standard errors.4
Before closing this section, we should note several limitations of our empirical framework.
First, we only allow the offshoring intensity (as well as the domestic sourcing and the R&D
intensity) to shift the iso-product curve, and we do not allow for an effect of offshoring that
leads to the rotation of the iso-product curve. In other words, we only focus on Hicks neutral
productivity effects and disregard the role of offshoring as channel for skill-biased technological
changes as, for example, Feenstra and Hanson (1996) argue. The present empirical model may
thus be considered as a short-run model in which factor shares are constant.5 Second, our
empirical specification only captures partial equilibrium effects and disregards general
4 We also include the full set of industry-year dummies (note that this does not mean industry dummies and year dummies) in equation (3). 5 This characterization is convenient for the present case as we are interested in the benefits of offshoring to the firm rather than the distributional issues which have preoccupied the lion’s share of the existing literature.
10
equilibrium effects. In the long-run, however, general equilibrium effects are also likely to affect
productivity, if, for example, individual offshoring decisions at the firm level are concentrated in
certain sectors so as to induce sector-wide technological change.6 Finally, gains from offshoring
discussed here refer exclusively to the increase in the productivity growth of the factors that
remain in employment. It should be emphasized that although firms often engage in offshoring
to reduce costs through lower input prices, the present methodology employing TFP based on
real inputs and output does not capture the cost-saving motive of offshoring.
3. Data Description and Summary Statistics
The data employed in this paper are drawn from Kigyo Katsudo Kihon Chosa (Basic Survey of
Enterprise Activities), which is conducted annually by the Ministry of Economy, Trade and
Industry (METI). This dataset covers all firms with more than 50 employees and 30 million yen
of assets in manufacturing, mining and commerce industries. Participation in the survey for
those firms is compulsory. The survey was first conducted in 1991, and then annually from 1994
onward. We restrict ourselves to manufacturing firms during the period 1994-2000, since for
more recent years no information on domestic or international subcontracting is available.7
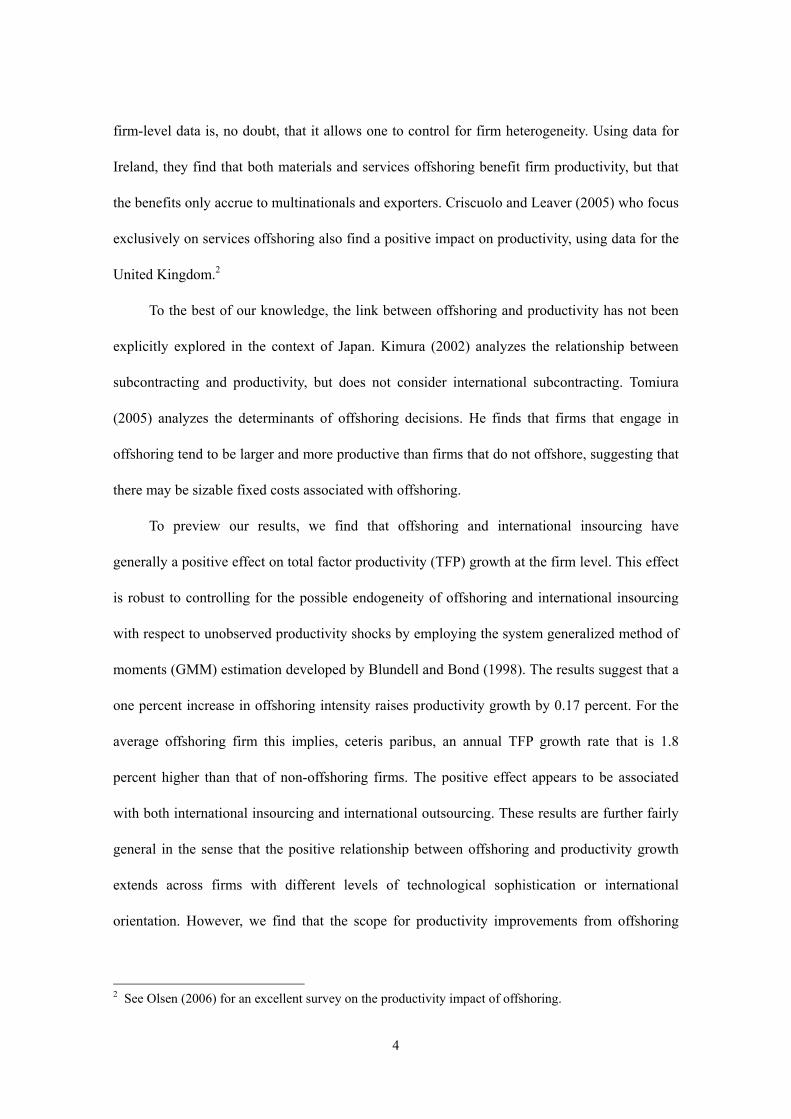
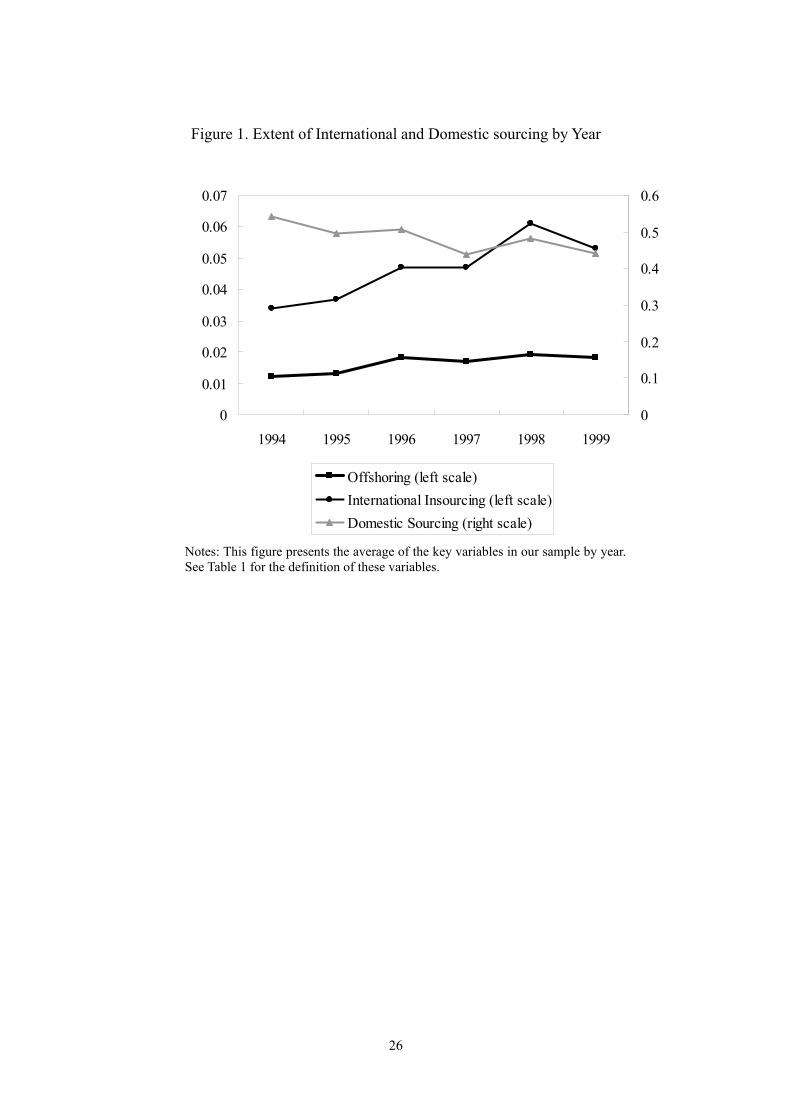
Figure 1 provides time trends in the measures of offshoring and domestic sourcing. During
the period 1994-1999, the average of offshoring intensity (Offshoring) rises from 1.2% to 1.8%
in terms of value added, whereas the international insourcing intensity (International
Insourcing) rises from 3.4% to 5.3%. In contrast to the increasing trend in the offshoring and
international insourcing intensity, the trend in the domestic sourcing intensity is negative.8
6 See Kohler (2004) and Hijzen (2006) for more details of such general equilibrium effects. 7 Data for 2000 are only used to construct the growth rate of TFP, whereas data for the period 1994-1999 contain information on offshoring and domestic sourcing. 8 However, given the short nature of our panel any inferences regarding the time trend should be taken with caution.
11
It is worth noting that International Insourcing in our dataset is greater on average than
Offshoring. This may be surprising as in our definitions above international insourcing was
represented as a subset of offshoring. The fact that this is not the case in practice reflects
differences in the product coverage of both variables. International Insourcing includes all
intermediate purchases from the firms’ foreign subsidiaries, whereas Offshoring includes only
the value of subcontracted production activities to foreign providers. The former may therefore
include the imports of raw material and capital goods which are not excluded from the latter.
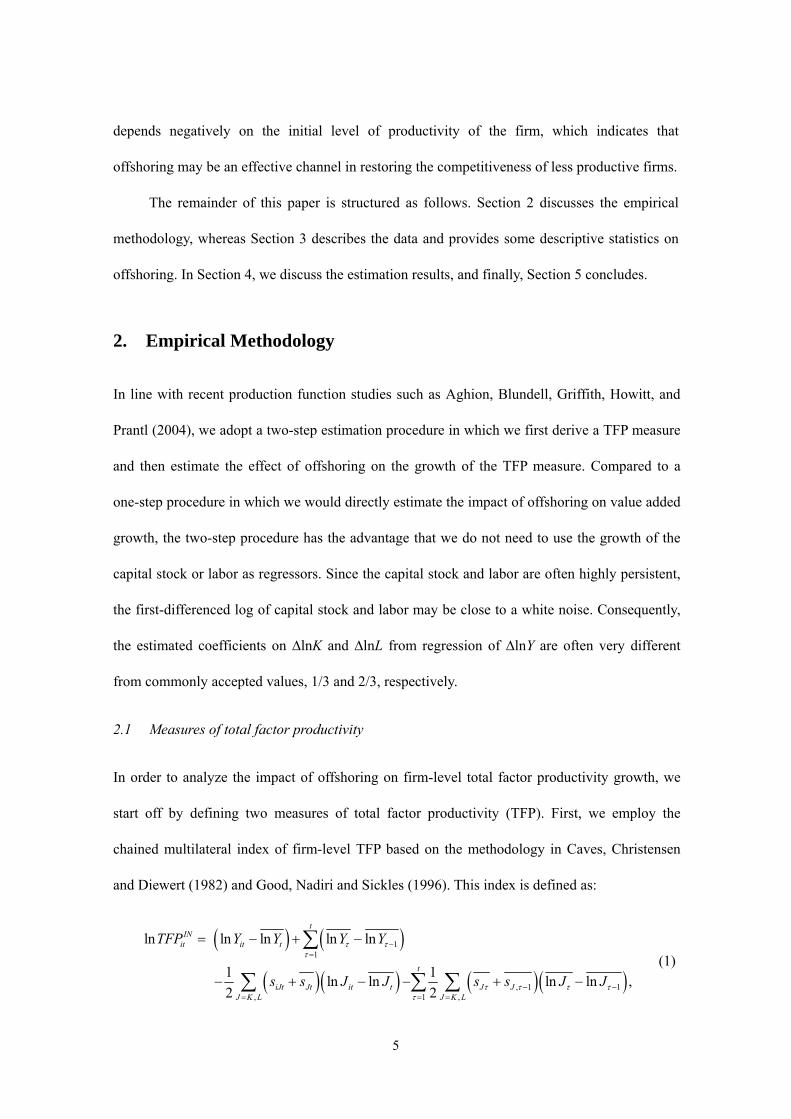
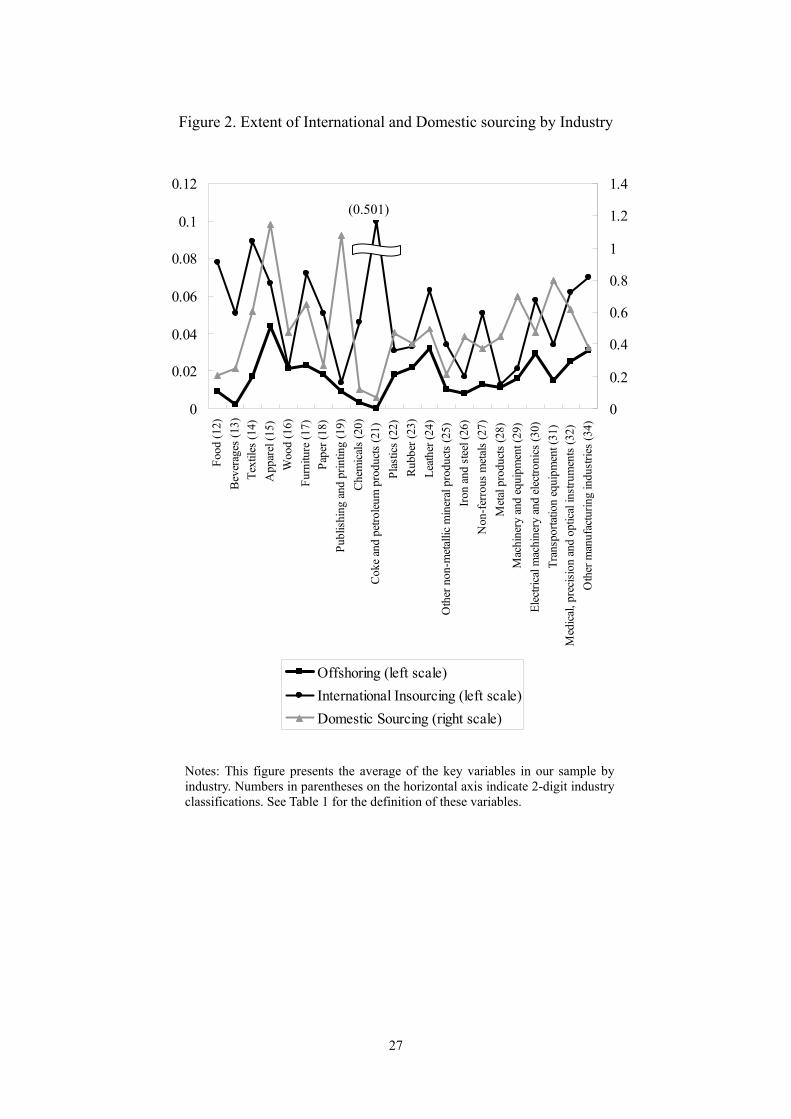
Figure 2 represents the offshoring intensity across different industries. It shows significant
differences across industries. According to the offshoring measure, the apparel and leather
industries appear to be the most active offshoring industries in Japan. Both industries are
relatively intensive users of unskilled labor and well-known examples of import offshoring
industries. The presence of large foreign-home wage differentials are likely to play an important
role in explaining the offshoring decisions in these two industries. These two are followed by the
electrical machinery and electronics industry and the medical, precision and optical instruments
industry, which on average are high-technology industries but also contain less skill-intensive
production processes.
Figure 2 also shows that industries with large offshoring intensity tend to exhibit large
international insourcing intensity as well. There are, however, some exceptions. Most notably,
the coke and petroleum products industry shows an extremely large International Insourcing,
while showing an Offshoring close to zero. This can be explained by the wider product coverage
of our International Insourcing measure as compared to our Offshoring measure.
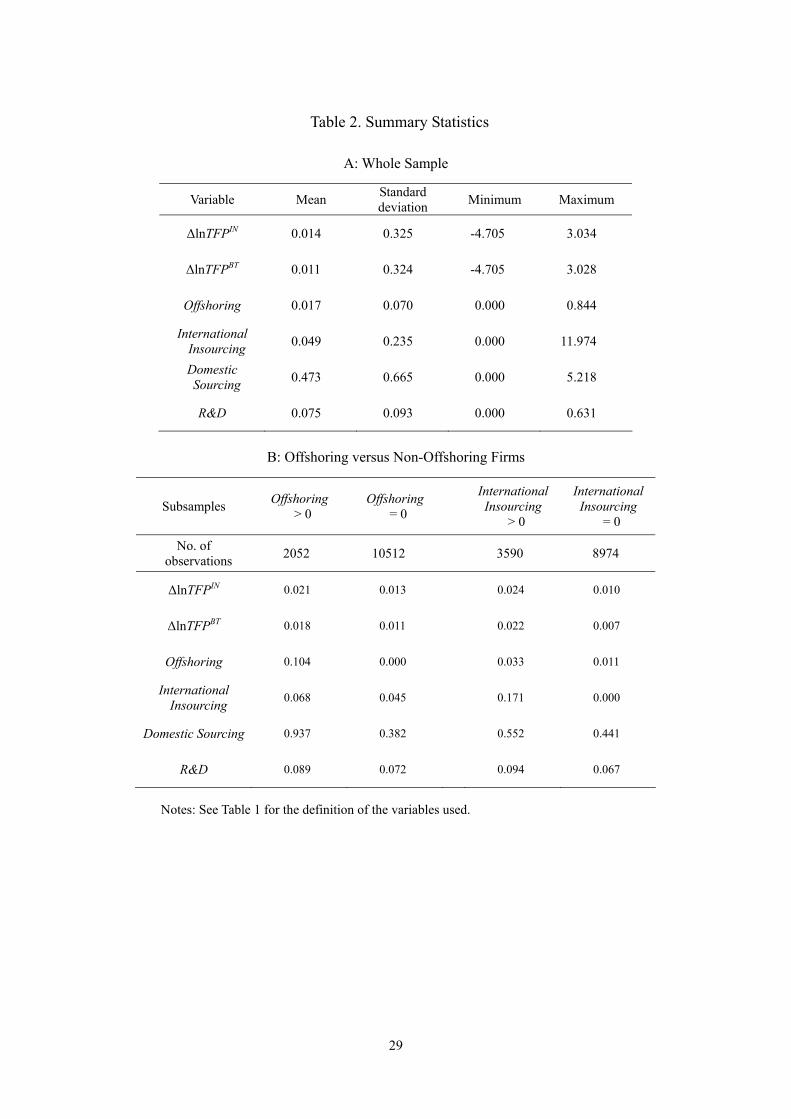
We present summary statistics for the regressand and regressors in panel A of Table 2,
whereas panel B of the same table distinguishes between firms that offshore and that do not
offshore. We are particularly interested in the relationship between offshoring and productivity
growth. The descriptive statistics indicate that firms that engage in offshoring or international

12
insourcing exhibit faster productivity growth and larger domestic sourcing and R&D intensity
than other firms. In our formal econometric analysis we will now examine whether offshoring in
fact leads to faster productivity growth, controlling for other possible factors and unobserved
productivity shocks or whether offshoring firms merely do so because they experience higher
productivity growth.
4. Results
4.1 Baseline results
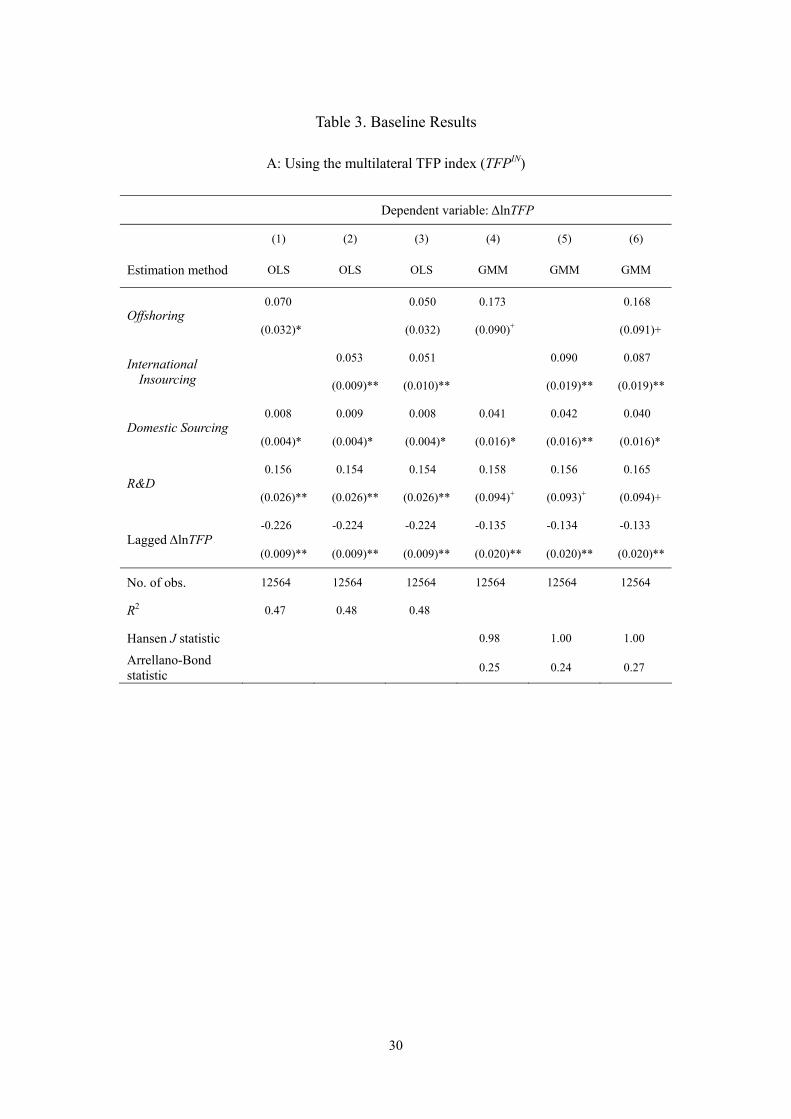
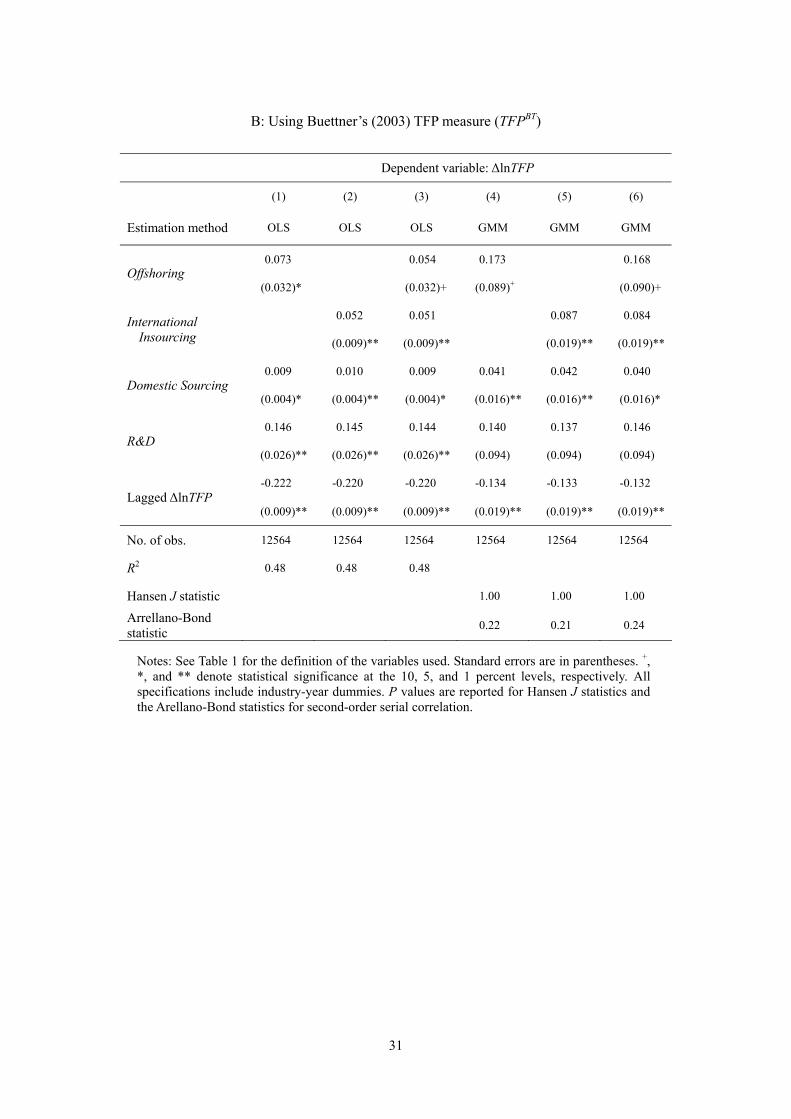
Table 3 presents the baseline results on the impact of offshoring on TFP growth. The results in
Table 3A are based on estimations using the multilateral index of TFP, whereas results in Table
3B are based on estimations using Buettner’s (2003) regression-based measure of TFP. Since the
results are virtually identical for both measures of TFP, we will concentrate on the results based
on the multilateral TFP index.9
Although our benchmark estimation method is the system GMM, as we previously
explained, we first look at the results from ordinary least squares (OLS) reported in columns 1-3
of Table 3A for reference. The results in columns 1 and 2 show that offshoring and international
insourcing have a positive and significant effect on TFP growth when included separately, but
that the effect of offshoring becomes insignificant when the two variables are included together
as regressors (column 3). The extent of domestic sourcing and R&D activities shows a
significant and positive effect on TFP growth in all of the three specifications. However, these
results may be biased when offshoring decisions are taken on the basis of unobserved
productivity differences between firms captured by the error term.
9 The correlation coefficient of the two measures of TFP growth is 0.99.
13
In order to take account of the possible endogeneity problem associated with the OLS
regressions, we re-estimate our model employing the system GMM and report the results in
columns 4-6 of Table 3A. In all specifications, the Hansen J statistic and the Arrellano-Bond
statistic presented in the last two rows suggest that the instruments are orthogonal to the error
term and that there is no serial correlation in the error term. The system GMM estimations point
at statistically significant effects of offshoring and international insourcing on total factor
productivity in all specifications,. Moreover, these effects are larger than the results from the
OLS estimations suggesting that the OLS results are downward biased due a positive
contemporaneous correlation between offshoring and unobserved productivity shocks and
accordingly a negative correlation between offshoring and first-differenced productivity shocks
(ε in equation [3]).10
More specifically, the GMM results suggest that a 1-percentage point increase in the
offshoring intensity raises TFP growth by 0.17 percentage points. Using the mean of the
offshoring intensity in Table 2, this result suggests that for the average offshoring firm, which
has a mean offshoring intensity of 0.104, average annual TFP growth is 1.8-percentage points
higher11 than had it not engaged in offshoring, everything else equal. Similarly, firms that
engage in international insourcing experience, on average, a 1.5 percentage increase in TFP
growth than firms that do not engage in international insourcing. Thus, we conclude that the
effect of offshoring and international insourcing on TFP growth is quantitatively large and
positive.
When we use both of the offshoring intensity and the international insourcing intensity as
regressors, we find that both have a positive and significant effect (column 6 of Table 3A). The
positive effect of the offshoring intensity even after controlling for the international insourcing
10 Amiti and Wei (2006) also observe that the effect of offshoring increases once they control for the correlation between offshoring and unobserved productivity shocks. 11 0.104 * 0.17 = 0.01768.
14
intensity implies that international outsourcing, or contracting out of production activities to
foreign firms that are not the firm’s own foreign subsidiaries, also has a positive impact on TFP
growth. In other words, offshoring production activities improves firms’ TFP growth regardless
of the organisational mode, intra-firm or arm’s length, that is adopted.
In addition to the offshoring and international insourcing intensity, the domestic sourcing
intensity has a positive and significant impact on TFP growth in all specifications. Since
Offshoring and Domestic Sourcing represent the ratio to value added of purchases of
intermediate inputs from foreign and domestic suppliers we can directly compare the effect of
offshoring and domestic sourcing by looking at the coefficients of the two variables. Column 6
of Table 3A reports that the coefficient of Offshoring is 0.168 whereas the coefficient of
Domestic Sourcing is 0.040. These results indicate that contracting out a particular production
process to foreign suppliers leads to a fourfold improvement in TFP growth compared to the
case when contracting out the same production process to domestic suppliers.12
4.2 Differences in the size of the effect of offshoring across firms
So far, we have estimated the effect of offshoring on TFP growth, ignoring the possible variation
in its size across firms. However, the size of the effect of offshoring may be expected to differ
for a number of reasons. First, the offshoring effect may vary across industries. Firms in
high-technology industries that engage in offshoring may be able to specialize in highly
sophisticated production stages that involve substantial learning-by-doing effects. However, for
offshoring firms in low-technology industries the potential of such learning effects may be more
limited since their specialized production stages are not as sophisticated as in high-technology
12 However, since offshoring firms are likely to incur larger initial search costs to select providers than firms that source domestically, this evidence does not necessarily suggest a larger net benefit from offshoring than that from domestic sourcing. However, this evidence does suggest that the net benefit from offshoring may be larger than that from domestic sourcing for firms with low search costs of offshoring.

15
industries. If this is the case, we would expect to observe a larger offshoring effect on TFP
growth in high-technology industries than in low-technology industries.
Second, Görg, Hanley and Strobl (2005) suggest that the benefits from offshoring may
vary in the level of the search costs of selecting foreign suppliers. Görg, Hanley and Strobl
(2005) therefore split the sample between multinationals and domestic firms, and exporters and
non-exporters, based on the conjecture that experience in foreign markets may lower the search
costs for foreign suppliers. The results by Görg, Hanley and Strobl (2005) confirm their
predictions.
Third, the benefits from offshoring may depend on a firms’ current productivity level. For
firms that have already achieved a high productivity level, the benefits from offshoring may be
smaller since the opportunity for further productivity growth is likely to be small.
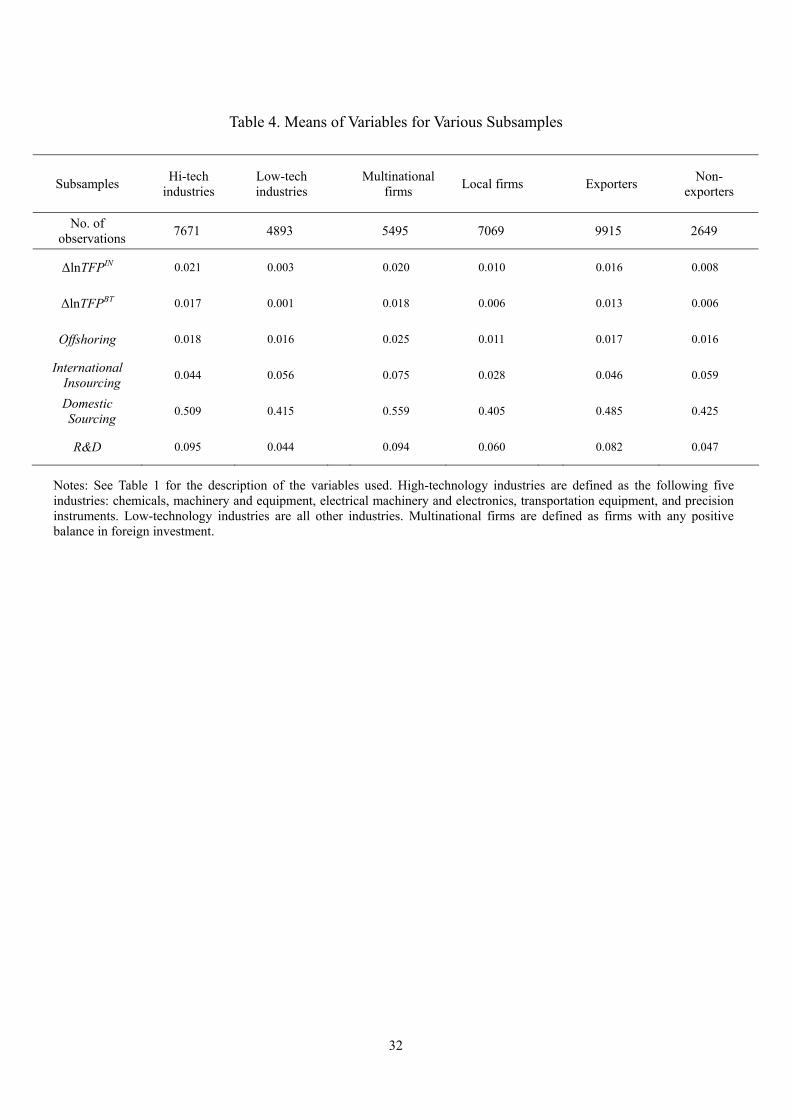
To see whether the benefits from offshoring differ across different types of firm, we split
the sample to two sub-samples in the following three ways and report the mean of key variables
for those subsamples in Table 4: firms in high- and low-technology industries13; multinational
and local firms; and exporting and non-exporting firms. In Table 4, we do not observe any major
differences in terms of their offshoring or international insourcing intensity between high- and
low-tech industries, or between exporters and non-exporters. However, we do observe, perhaps
not surprisingly, that multinationals are more important offshorers than purely domestic firms.
Multinationals, after all, have access to an international production work which may be destined,
or at the very least, may be expected to facilitate offshoring arrangements.
To formally examine how the size of the effect of offshoring on productivity depends on
industry- and firm-characteristics, we augment equation (3) with an interaction term between the
offshoring measure and a dummy variable for certain industry- and firm-characteristics. First,
13 High-technology industries are defined as the following 5 industries: chemicals, machinery and equipment, electrical machinery and electronics, transportation equipment, and precision instruments. Low-technology industries are all other industries.
16
we use a dummy variable which is one for firms in high-technology industries and zero
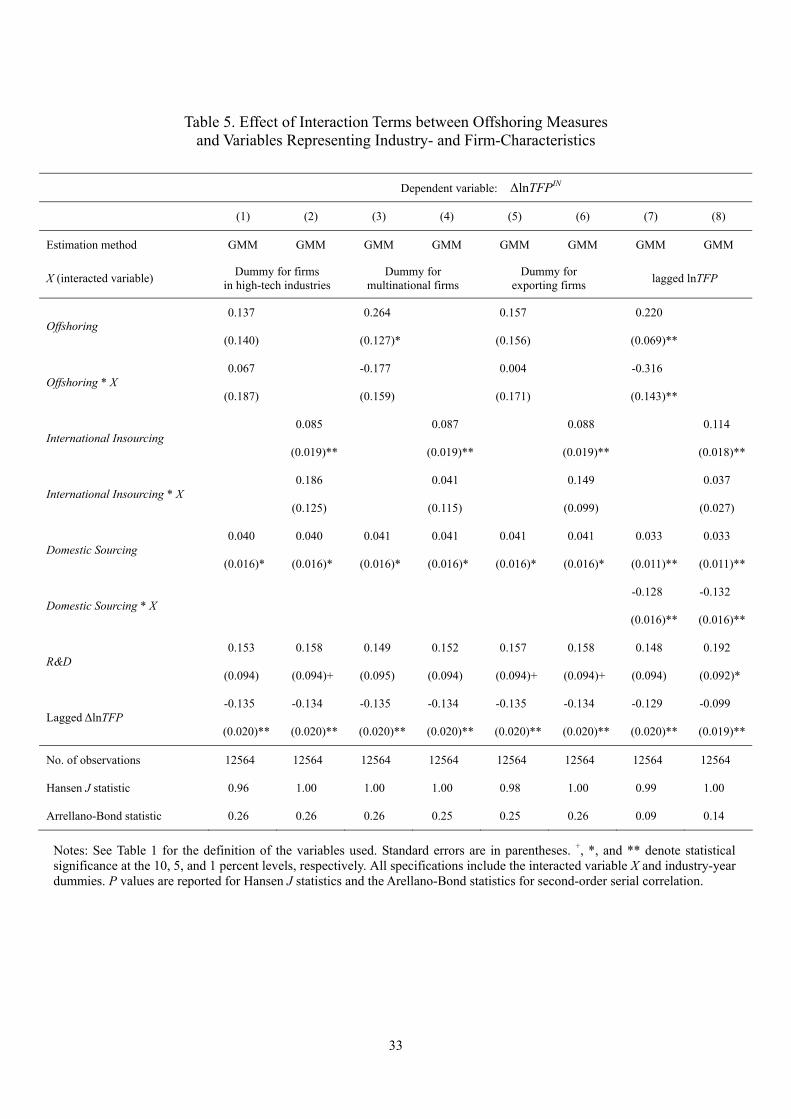
otherwise. The GMM results reported in columns 1 and 2 of Table 5 indicate that the effect of
either interaction term between the dummy variable and Offshoring or International Insourcing
is not statistically significant at conventional levels.14 These results are inconsistent with the
conjecture put forward above. The effect of offshoring in low-technology industries is as large as
the effect of offshoring in high-technology industries. This suggests that learning effects do not
depend on the level of technological sophistication of one’s industry.
Second, we estimate whether the effect of offshoring differs between multinational and
domestic firms and between exporting and non-exporting firms using interaction dummies for
multinational firms and for exporting firms. The GMM results presented in columns 3-6 of Table
5 show that the coefficients on the interaction terms are insignificant. At first sight, these results
seem to inconsistent with the hypothesis and the empirical results presented by Görg et al.
(2005) that multinationals and exporters benefit more from offshoring than other firms. However,
we should note that Görg et al. (2005) find a larger effect of offshoring on the level of
productivity for multinationals and exporters, while here we focus on the effect of offshoring on
productivity growth. Thus, the disparity between the results of the present study and those by
Görg et al. (2005) suggests that the advantage of multinationals and exporters due to lower
search costs of selecting suitable foreign suppliers is static, rather than dynamic. In other words,
lower search costs for multinationals and exporters benefit those firms only one time when they
start offshoring, but the benefit vanishes in later years.
Finally, in order to examine how the firm’s current productivity level affects the impact of
offshoring, we interact the offshoring variables with the lagged TFP level and include the
resulting interaction term as an additional regressor. The GMM results reported in columns 7-8
14 The result in column 1 of Table 6 indicates that the effect of Offshoring is insignificant. This result is probably generated by multicollinearity between Offshoring and the interaction term between Offshoring and the dummy variable for high-tech industries. The correlation coefficient of the two variables is 0.77.
17
of Table 5 indicate that including the interaction terms does not greatly affect the estimates for
the offshoring and international insourcing intensity. However, we find that the interaction term
has a negative and significant effect in the two specifications. This evidence indicates that firms
with a lower level of TFP benefit more from offshoring than firms with a higher TFP level
probably due to latecomers’ advantage, being consistent with our presumption above.15 Thus,
offshoring appears to provide an effective strategy for less productive firms to catch up with
their competitors.
5. Concluding Remarks
In the present paper, we explore the impact of offshoring on firm productivity growth, using
firm-level data for the Japanese manufacturing industries during the period 1994-2000. We find
that offshoring has generally a positive effect on productivity growth. This effect is robust to
controlling for the possible endogeneity of offshoring with respect to unobserved productivity
shocks. We further find that the size of the effect of offshoring does not vary between firms in
high- and low-technology industries, between multinationals and domestic firms, or between
exporting and non-exporting firms. This evidence suggests that offshoring has a positive impact
on productivity growth for a wide range of firms. Finally, the impact of offshoring is found to
depend negatively on the productivity level of the firm, indicating that offshoring provides an
effective channel to restore competitiveness for less productive firms.
Although our findings shed some light on the offshoring literature, we should note that
our results need to be interpreted with care. First, the cost-saving effect cannot be examined in
the framework of our analysis using TFP based on real output and inputs. Second, our analysis
is based on a production function and thus disregards general-equilibrium effects. Therefore, the 15 The interaction term between the lagged TFP level and the domestic sourcing intensity has also a negative and significant effect, indicating that latecomers’ advantage can be applied to domestic sourcing.

18
results of the present paper should be interpreted at the level of the individual firm and cannot
be straightforwardly be used to make inferences about the total effect of offshoring on the
Japanese economy.
19
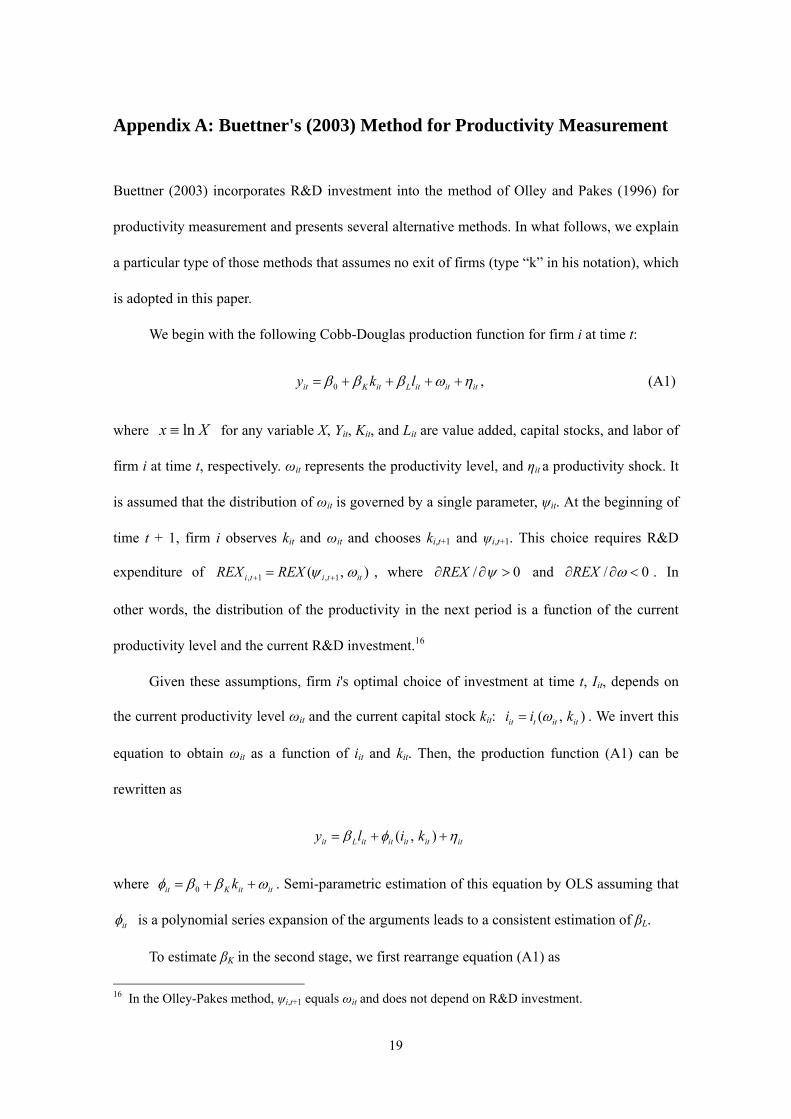
Appendix A: Buettner's (2003) Method for Productivity Measurement
Buettner (2003) incorporates R&D investment into the method of Olley and Pakes (1996) for
productivity measurement and presents several alternative methods. In what follows, we explain
a particular type of those methods that assumes no exit of firms (type “k” in his notation), which
is adopted in this paper.
We begin with the following Cobb-Douglas production function for firm i at time t:
0β β β ω η= + + + +it K it L it it ity k l , (A1)
where lnx X≡ for any variable X, Yit, Kit, and Lit are value added, capital stocks, and labor of
firm i at time t, respectively. ωit represents the productivity level, and ηit a productivity shock. It
is assumed that the distribution of ωit is governed by a single parameter, ψit. At the beginning of
time t + 1, firm i observes kit and ωit and chooses ki,t+1 and ψi,t+1. This choice requires R&D
expenditure of , 1 , 1( , )ψ ω+ +=i t i t itREX REX , where / 0ψ∂ ∂ >REX and / 0ω∂ ∂ <REX . In
other words, the distribution of the productivity in the next period is a function of the current
productivity level and the current R&D investment.16
Given these assumptions, firm i's optimal choice of investment at time t, Iit, depends on
the current productivity level ωit and the current capital stock kit: ( , )ω=it t it iti i k . We invert this
equation to obtain ωit as a function of iit and kit. Then, the production function (A1) can be
rewritten as
( , )β φ η= + +it L it it it it ity l i k
where 0φ β β ω= + +it K it itk . Semi-parametric estimation of this equation by OLS assuming that
itφ is a polynomial series expansion of the arguments leads to a consistent estimation of βL.
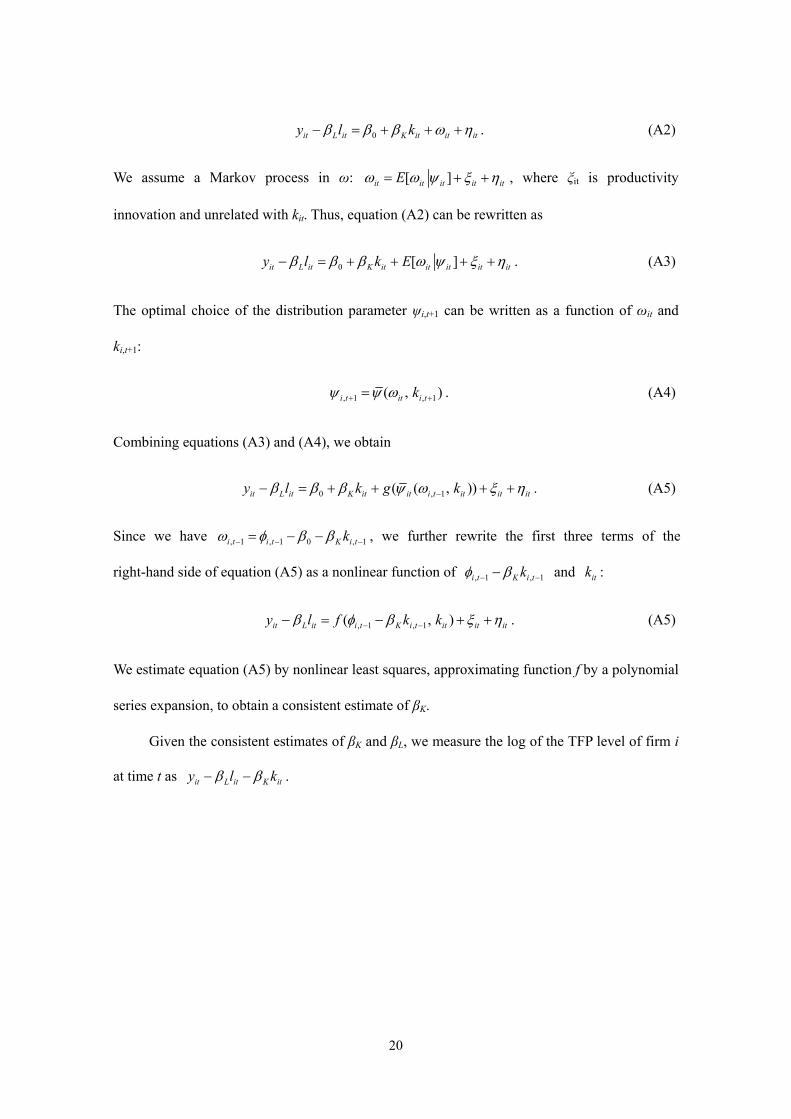
To estimate βK in the second stage, we first rearrange equation (A1) as
16 In the Olley-Pakes method, ψi,t+1 equals ωit and does not depend on R&D investment.
20
0β β β ω η− = + + +it L it K it it ity l k . (A2)
We assume a Markov process in ω: [ ]ω ω ψ ξ η= + +it it it it itE , where ξit is productivity
innovation and unrelated with kit. Thus, equation (A2) can be rewritten as
0 [ ]β β β ω ψ ξ η− = + + + +it L it K it it it it ity l k E . (A3)
The optimal choice of the distribution parameter ψi,t+1 can be written as a function of ωit and
ki,t+1:
, 1 , 1( , )ψ ψ ω+ +=i t it i tk . (A4)
Combining equations (A3) and (A4), we obtain
0 , 1( ( , ))it L it K it it i t it it ity l k g kβ β β ψ ω ξ η−− = + + + + . (A5)
Since we have , 1 , 1 0 , 1i t i t K i tkω φ β β− − −= − − , we further rewrite the first three terms of the
right-hand side of equation (A5) as a nonlinear function of , 1 , 1i t K i tkφ β− −− and itk :
, 1 , 1( , )it L it i t K i t it it ity l f k kβ φ β ξ η− −− = − + + . (A5)
We estimate equation (A5) by nonlinear least squares, approximating function f by a polynomial
series expansion, to obtain a consistent estimate of βK.
Given the consistent estimates of βK and βL, we measure the log of the TFP level of firm i
at time t as β β− −it L it K ity l k .
21
Appendix B: Construction of Variables
This appendix provides supplementary information on the construction of our dataset.17 To
construct data employed in the present analysis, we use firm-level data from Kigyo Katsudo
Kihon Chosa (KKKC, Basic Survey of Enterprise Activities) and industry-level data from the
Japan Industry Productivity (JIP) Database 2006. The JIP Database 2006 is constructed by the
Firm- and Industry-Level Productivity Research Group organized in the Research Institute of
Economy, Trade and Industry (RIETI) of Japan and headed by Kyoji Fukao and Tsutomu
Miyagawa. The JIP Database 2006 includes various data during the period 1970-2002 at the
3-digit industry level, including price deflators of output, intermediate inputs, and capital goods
and input-output matrices. The complete database is available at the web site of RIETI
(http://www.rieti.go.jp).
Real sales is defined as nominal total sales reported in KKKC deflated by the output
deflator at the 3-digit level taken from the JIP Database. The nominal value of intermediate
inputs is defined as the sum of costs of goods sold and general and administrative expense
minus labor costs and the value of depreciation. The nominal value of intermediate inputs is
deflated by the intermediate-goods deflator also taken from the JIP Database to obtain the real
value of intermediate inputs. Real value added is defined as real sales less the real value of
intermediate inputs.
Firms' real capital stock represents the real value of the stock of tangible fixed assets
excluding land, since the book value of land may not reflect the true value of the land, in
particular if the land was purchased long time ago. However, the value of land owned by each
firm is available only in the KKKC data for 1995 and 1996, although information on the total
17 When importing raw datasets, we heavily relied on Stata programs written by Toshiyuki Matsuura for
Matsuura (2004).
22
value of tangible fixed assets including land is available for all years. Therefore, we estimate the
nominal value of tangible fixed assets excluding land of firm i in industry j in year t, NomKijt, by
multiplying the firm's total tangible assets including land by one minus industry j's average
share of the land value in the total tangible fixed assets in 1995 and 1996. Then, we derive the
real capital stock of firm i in industry j in year t, Kijt, from NomKijt, using the industry total of
nominal tangible fixed assets excluding land, ∈
=∑jt ijti jNomK NomK , and the estimated real
value of the corresponding variable, Kjt, taken from the JIP Database:
/= ×ijt ijt jt jtK NomK K NomK . Kjt, is obtained by the perpetual inventory method, using
industry-level data on fixed capital formation during the period 1975-2000 and industry-level
data on fixed assets in 1975.
Labor inputs are measured in the man-hour base. Since information on working hours for
each firm is not available in KKKC, we use the industry average of working hours taken from
the JIP Database. R&D expenditure of each parent firm is deflated by the industry price deflator
of intermediate inputs.
We limit our sample to firms whose TFP level, R&D expenditure, the measure of
offshoring, and the measure of domestic sourcing are available for at least five consecutive
years during the seven-year period 1994-2000. Then, to alleviate biases due to outliners, we
drop firms whose R&D, offshoring, or domestic sourcing intensity is among the top 1 percent.
23
References
Aghion, P., R. Blundell, R. Griffith, P. Howitt, and S. Prantl (2004), “Entry and Productivity Growth: Evidence from Microlevel Panel Data,” Journal of European Economic Association, Vol. 2, Iss. 2-3, 265–376.
Amiti, M. and S. Wei (2006), “Services Offshoring and Productivity: Evidence from the United States,” NBER Working Paper, No. 11926.
Blundell, R., and S. Bond (1998), “Initial Conditions and Moment Restrictions in Dynamic Panel Data Models,” Journal of Econometrics, Vol. 87, Iss. 1, pp. 115–143.
Branstetter, L. (2001), “Are knowledge spillovers international or intranational in scope? Microeconometric evidence from the U.S. and Japan,” Journal of International Economics Vol. 53, pp. 53–79.
Buettner, T. (2003), “R&D and the Dynamics of Productivity,” unpublished, London School of Economics.
Caves, D. W., L. R. Christensen, and E. W. Diewert (1982), “Multilateral Comparisons of Output, Input, and Productivity Using Superlative Index Numbers,” Economic Journal, Vol. 92, Iss. 365, pp. 73–86.
Criscuolo, C. and M. Leaver (2005), “Offshore Outsourcing and Productivity,” presented at OECD Conference on Globalisation of Production, 14-15 November 2005.
Egger, P. and H. Egger (2006), "International Outsourcing and the Productivity of Low-skilled Labor in the EU,” Economic Inquiry, Vol. 44, Iss. 1, pp. 98-108
Feenstra, R. C. and G. H. Hanson (1996), “Globalization, Outsourcing, and Wage Inequality,” American Economic Review, Vol. 86, Iss. 2, pp. 240-245.
Feenstra, R. C. and G. H. Hanson (1999), “The Impact of Outsourcing and High-Technology Capital on Wages: Estimates for the United States, 1979-1990,” Quarterly Journal of Economics, Vol. 114, Iss. 3, pp. 907-941.
Fukao, K., H. Ishido, and K. Ito (2003), “Vertical Intra-Industry Trade and Foreign Direct Investment in East Asia,” Journal of the Japanese and International Economies, Vol. 17, Iss. 4, pp. 468-506.
Good, D. H., M. I. Nadiri, and R. C. Sickles (1996), “Index Number and Factor Demand Approaches to the Estimation of Productivity,” NBER Working Paper, No. 5790.
24
Görg, H. and A. Hanley (2005),"International Outsourcing and Productivity: Evidence from the Irish electronics Industry,” North American Journal of Economics and Finance, Vol. 16, Iss. 2, pp. 255-269.
Görg, H., A. Hanley and E. Strobl (2005),"Productivity effects of international outsourcing: Evidence from plant level data", mimeo, University of Nottingham.
Head, K. and J. Ries (2002), “Offshore Production and Skill Upgrading by Japanese Manufacturing Firms,” Journal of International Economics, Vol. 58, No. 1, pp. 81-105.
Hijzen, A. (2006), “International Outsourcing, Technological Change and Wage Inequality,” Review of International Economics, forthcoming.
Hijzen, A., H. Görg, and R. C. Hine (2005), “International outsourcing and the skill structure of labor demand in the United Kingdom,” Economic Journal, Vol. 115, pp. 860-878.
Jaffe, A. B., M. Trajtenberg, and R. Henderson (1993), Geographic localization of knowledge spillovers as evidenced by patent citations, Quarterly Journal of Economics, Vol. 108, Iss. 3, pp. 577–598.
Kimura, F. (2002), “Subcontracting and the Performance of Small and Medium Firms in Japan,” Small Business Economics, Vol. 18, Iss. 1-3, pp. 163-175.
Kimura, F. and M. Ando (2005), “Two-Dimensional Fragmentation in East Asia: Conceptual Framework and Empirics,” International Review of Economics and Finance, Vol. 14, Iss. 3, pp. 317-348.
Kohler, W. (2004), "International Outsourcing and Factor Prices with Multistage Production,” Economic Journal, forthcoming.
Levinsohn, J. and A. Petrin (2003), “Estimating Production Functions Using Inputs to Control for Unobservables,” Review of Economic Studies, Vol. 70, Iss. 2, pp. 317-341.
Matsuura, Toshiyuki, 2004, Estimation of economic activity of Japanese multinationals, Keizai Toukei Kenkyu, Vol. 32, pp. 1–16.
Ng, F. and A. Yeats (1999), “Production Sharing in East Asia: Who Does What for Whom and Why?,” World Bank Working Paper, No. 2197.
Olley, S. G. and A. Pakes (1996), “The Dynamics of Productivity in the Telecommunications Equipment Industry,” Econometrica, Vol. 64. Iss. 6, pp. 1263-1297.
Olsen, K. B. (2006), “Productivity Impacts of Offshoring and Outsourcing: A Review,” OECD Science, Technology and Industry Working Papers, 2006/1.
25
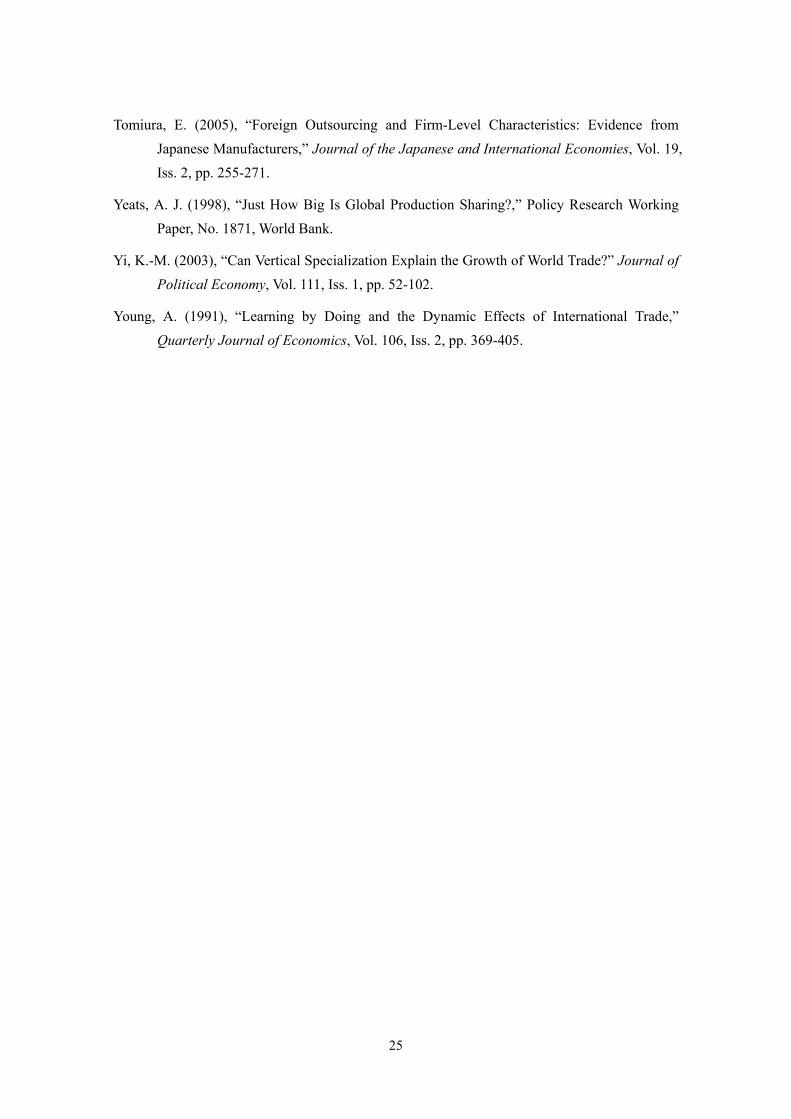
Tomiura, E. (2005), “Foreign Outsourcing and Firm-Level Characteristics: Evidence from Japanese Manufacturers,” Journal of the Japanese and International Economies, Vol. 19, Iss. 2, pp. 255-271.
Yeats, A. J. (1998), “Just How Big Is Global Production Sharing?,” Policy Research Working Paper, No. 1871, World Bank.
Yi, K.-M. (2003), “Can Vertical Specialization Explain the Growth of World Trade?” Journal of Political Economy, Vol. 111, Iss. 1, pp. 52-102.
Young, A. (1991), “Learning by Doing and the Dynamic Effects of International Trade,” Quarterly Journal of Economics, Vol. 106, Iss. 2, pp. 369-405.
26
Figure 1. Extent of International and Domestic sourcing by Year
0
0.01
0.02
0.03
0.04
0.05
0.06
0.07
1994 1995 1996 1997 1998 19990
0.1
0.2
0.3
0.4
0.5
0.6
Offshoring (left scale)International Insourcing (left scale)Domestic Sourcing (right scale)
Notes: This figure presents the average of the key variables in our sample by year. See Table 1 for the definition of these variables.
27
Figure 2. Extent of International and Domestic sourcing by Industry
0
0.02
0.04
0.06
0.08
0.1
0.12
Food
(12)
Bev
erag
es (1
3)Te
xtile
s (1
4)A
ppar
el (1
5)W
ood
(16)
Furn
iture
(17)
Pape
r (18
)Pu
blis
hing
and
prin
ting
(19)
Che
mic
als
(20)
Cok
e an
d pe
trole
um p
rodu
cts
(21)
Plas
tics
(22)
Rub
ber (
23)
Lea
ther
(24)
Oth
er n
on-m
etal
lic m
iner
al p
rodu
cts
(25)
Iron
and
ste
el (2
6)N
on-f
erro
us m
etal
s (2
7)M
etal
pro
duct
s (2
8)M
achi
nery
and
equ
ipm
ent (
29)
Elec
trica
l mac
hine
ry a
nd e
lect
roni
cs (3
0)Tr
ansp
orta
tion
equi
pmen
t (31
)M
edic
al, p
reci
sion
and
opt
ical
inst
rum
ents
(32)
Oth
er m
anuf
actu
ring
indu
strie
s (3
4)
0
0.2
0.4
0.6
0.8
1
1.2
1.4
Offshoring (left scale)International Insourcing (left scale)Domestic Sourcing (right scale)
Notes: This figure presents the average of the key variables in our sample by industry. Numbers in parentheses on the horizontal axis indicate 2-digit industry classifications. See Table 1 for the definition of these variables.
(0.501)
28
Table 1. List of Key Variables
Variable name Definition
Offshoring Ratio of the value of subcontracting to foreign providers to value added
International Insourcing Ratio of purchases from the firm’s own foreign subsidiaries to value added
Domestic Sourcing Ratio of the value of subcontracting to domestic providers to value added
R&D Ratio of R&D expenditure to value added
29
Table 2. Summary Statistics
A: Whole Sample
Variable Mean Standard deviation Minimum Maximum
ΔlnTFPIN 0.014 0.325 -4.705 3.034
ΔlnTFPBT 0.011 0.324 -4.705 3.028
Offshoring 0.017 0.070 0.000 0.844
International Insourcing 0.049 0.235 0.000 11.974
Domestic Sourcing 0.473 0.665 0.000 5.218
R&D 0.075 0.093 0.000 0.631
B: Offshoring versus Non-Offshoring Firms
Subsamples Offshoring > 0
Offshoring = 0
International Insourcing
> 0
International Insourcing
= 0
No. of observations 2052 10512 3590 8974
ΔlnTFPIN 0.021 0.013 0.024 0.010
ΔlnTFPBT 0.018 0.011 0.022 0.007
Offshoring 0.104 0.000 0.033 0.011
International Insourcing 0.068 0.045 0.171 0.000
Domestic Sourcing 0.937 0.382 0.552 0.441
R&D 0.089 0.072 0.094 0.067
Notes: See Table 1 for the definition of the variables used.
30
Table 3. Baseline Results
A: Using the multilateral TFP index (TFPIN)
Dependent variable: ΔlnTFP
(1) (2) (3) (4) (5) (6)
Estimation method OLS OLS OLS GMM GMM GMM
0.070 0.050 0.173 0.168 Offshoring
(0.032)* (0.032) (0.090)+ (0.091)+
0.053 0.051 0.090 0.087 International Insourcing (0.009)** (0.010)** (0.019)** (0.019)**
0.008 0.009 0.008 0.041 0.042 0.040 Domestic Sourcing
(0.004)* (0.004)* (0.004)* (0.016)* (0.016)** (0.016)*
0.156 0.154 0.154 0.158 0.156 0.165 R&D
(0.026)** (0.026)** (0.026)** (0.094)+ (0.093)+ (0.094)+
-0.226 -0.224 -0.224 -0.135 -0.134 -0.133 Lagged ΔlnTFP
(0.009)** (0.009)** (0.009)** (0.020)** (0.020)** (0.020)**
No. of obs. 12564 12564 12564 12564 12564 12564
R2 0.47 0.48 0.48
Hansen J statistic 0.98 1.00 1.00
Arrellano-Bond statistic 0.25 0.24 0.27
31
B: Using Buettner’s (2003) TFP measure (TFPBT)
Dependent variable: ΔlnTFP
(1) (2) (3) (4) (5) (6)
Estimation method OLS OLS OLS GMM GMM GMM
0.073 0.054 0.173 0.168 Offshoring
(0.032)* (0.032)+ (0.089)+ (0.090)+
0.052 0.051 0.087 0.084 International Insourcing (0.009)** (0.009)** (0.019)** (0.019)**
0.009 0.010 0.009 0.041 0.042 0.040 Domestic Sourcing
(0.004)* (0.004)** (0.004)* (0.016)** (0.016)** (0.016)*
0.146 0.145 0.144 0.140 0.137 0.146 R&D
(0.026)** (0.026)** (0.026)** (0.094) (0.094) (0.094)
-0.222 -0.220 -0.220 -0.134 -0.133 -0.132 Lagged ΔlnTFP
(0.009)** (0.009)** (0.009)** (0.019)** (0.019)** (0.019)**
No. of obs. 12564 12564 12564 12564 12564 12564
R2 0.48 0.48 0.48
Hansen J statistic 1.00 1.00 1.00
Arrellano-Bond statistic 0.22 0.21 0.24
Notes: See Table 1 for the definition of the variables used. Standard errors are in parentheses. +, *, and ** denote statistical significance at the 10, 5, and 1 percent levels, respectively. All specifications include industry-year dummies. P values are reported for Hansen J statistics and the Arellano-Bond statistics for second-order serial correlation.
32
Table 4. Means of Variables for Various Subsamples
Subsamples Hi-tech industries
Low-tech industries
Multinational firms Local firms
Exporters Non-
exporters
No. of observations 7671 4893 5495 7069
9915 2649
ΔlnTFPIN 0.021 0.003 0.020 0.010
0.016 0.008
ΔlnTFPBT 0.017 0.001 0.018 0.006
0.013 0.006
Offshoring 0.018 0.016 0.025 0.011
0.017 0.016
International Insourcing 0.044 0.056 0.075 0.028
0.046 0.059
Domestic Sourcing 0.509 0.415 0.559 0.405
0.485 0.425
R&D 0.095 0.044 0.094 0.060
0.082 0.047
Notes: See Table 1 for the description of the variables used. High-technology industries are defined as the following five industries: chemicals, machinery and equipment, electrical machinery and electronics, transportation equipment, and precision instruments. Low-technology industries are all other industries. Multinational firms are defined as firms with any positive balance in foreign investment.
33
Table 5. Effect of Interaction Terms between Offshoring Measures and Variables Representing Industry- and Firm-Characteristics
Dependent variable: ΔlnTFPIN
(1) (2) (3) (4) (5) (6) (7) (8)
Estimation method GMM GMM GMM GMM GMM GMM GMM GMM
X (interacted variable) Dummy for firms in high-tech industries
Dummy for multinational firms
Dummy for exporting firms lagged lnTFP
0.137 0.264 0.157 0.220 Offshoring
(0.140) (0.127)* (0.156) (0.069)**
0.067 -0.177 0.004 -0.316 Offshoring * X
(0.187) (0.159) (0.171) (0.143)**
0.085 0.087 0.088 0.114 International Insourcing
(0.019)** (0.019)** (0.019)** (0.018)**
0.186 0.041 0.149 0.037 International Insourcing * X
(0.125) (0.115) (0.099) (0.027)
0.040 0.040 0.041 0.041 0.041 0.041 0.033 0.033 Domestic Sourcing
(0.016)* (0.016)* (0.016)* (0.016)* (0.016)* (0.016)* (0.011)** (0.011)**
-0.128 -0.132 Domestic Sourcing * X
(0.016)** (0.016)**
0.153 0.158 0.149 0.152 0.157 0.158 0.148 0.192 R&D
(0.094) (0.094)+ (0.095) (0.094) (0.094)+ (0.094)+ (0.094) (0.092)*
-0.135 -0.134 -0.135 -0.134 -0.135 -0.134 -0.129 -0.099 Lagged ΔlnTFP
(0.020)** (0.020)** (0.020)** (0.020)** (0.020)** (0.020)** (0.020)** (0.019)**
No. of observations 12564 12564 12564 12564 12564 12564 12564 12564
Hansen J statistic 0.96 1.00 1.00 1.00 0.98 1.00 0.99 1.00
Arrellano-Bond statistic 0.26 0.26 0.26 0.25 0.25 0.26 0.09 0.14
Notes: See Table 1 for the definition of the variables used. Standard errors are in parentheses. +, *, and ** denote statistical significance at the 10, 5, and 1 percent levels, respectively. All specifications include the interacted variable X and industry-year dummies. P values are reported for Hansen J statistics and the Arellano-Bond statistics for second-order serial correlation.