Buyer Behavior MKTG 407 What is Consumer Behavior? (Ch1-Ch2) Affect & Cognition (Ch3)

HAL Id: hal-01360028https://hal-unilim.archives-ouvertes.fr/hal-01360028v2
Preprint submitted on 16 Nov 2017
HAL is a multi-disciplinary open accessarchive for the deposit and dissemination of sci-entific research documents, whether they are pub-lished or not. The documents may come fromteaching and research institutions in France orabroad, or from public or private research centers.
L’archive ouverte pluridisciplinaire HAL, estdestinée au dépôt et à la diffusion de documentsscientifiques de niveau recherche, publiés ou non,émanant des établissements d’enseignement et derecherche français ou étrangers, des laboratoirespublics ou privés.
Does Mobile Money Affect Saving Behavior? Evidencefrom a Developing Country
Serge Ky, Clovis Rugemintwari, Alain Sauviat
To cite this version:Serge Ky, Clovis Rugemintwari, Alain Sauviat. Does Mobile Money Affect Saving Behavior? Evidencefrom a Developing Country. 2017. �hal-01360028v2�

1
Does mobile money affect saving behavior?
Evidence from a developing country
Serge Ky a, 1, Clovis Rugemintwari a and Alain Sauviat a
a Université de Limoges, LAPE, 5 rue Félix Eboué, 87031 Limoges Cedex, France
(Forthcoming in The Journal of African Economies)
Abstract
We investigate whether the use of mobile money can help individuals build savings to face predictable and
unpredictable life events. Studying the case of Burkina Faso, we use hand-collected data from individual
responses to a survey we designed and conducted between May and June 2014. Our main results show that,
although it is not possible to detect any correlation between using mobile money and saving for predictable
events, it seems to increase the propensity of individuals to save for health emergencies. We also find robust
evidence suggestive that using mobile money increases the propensity of disadvantaged groups such as
rural, female, less educated individuals and individuals with irregular income to save for health emergencies.
In our further investigations, we address the mechanisms underlying individual saving behavior. We find
that safety and the possibility to transfer money within the sub-region associated with mobile money may
be factors that increase the propensity of mobile money users to save for health emergencies. Overall, our
results are in line with policymakers’ agenda worldwide to increase financial outreach and improve financial
inclusion by using mobile technologies. (JEL Classification D14, G23, O12)
Keywords: mobile money, savings, financial inclusion, sub-Saharan Africa, Burkina Faso
1This paper benefited from discussions with Philippe Rous, Isabelle Distinguin and Ruth Tacneng. We are grateful for
their helpful suggestions and advice. We thank Idrissa M. Ouédraogo, Kassoum Zerbo, François Seck Fall, Denis
Akouwerabou who were helpful in designing and conducting our survey. We also thank our discussants Jann
Goedecke, Erwan Le Saout, Pauline Rossi and the participants at the 4th European Microfinance Research Conference,
the 32nd International Symposium on Money, Banking and Finance and the 64th Annual Meeting of the French
Economic Association for their helpful comments and discussions. Mamadou Diallo and Tidiane Ouédraogo from the
BCEAO allowed us to access data on financial inclusion in West African Economic and Monetary Union (WAEMU);
their helpful assistance is acknowledged as well. The usual disclaimer applies. Corresponding Author. Tel: + 33 5 55
14 92 51. Fax: 05 55 14 92 06. E-mail address : [email protected]

2
1. Introduction
In developing countries, limited access to formal financial institutions makes individuals
and households rely mainly on informal networks to build up savings. Such informal saving
mechanisms include saving in livestock or jewels, saving at home “under a mattress”, saving with
a neighbor or, in a more organized way, participating in a Rotating Savings and Credit Associations
(ROSCAs)2. However, these informal saving devices provide an insurance which is well known to
be risky, inappropriate and incomplete. For instance, to deal with unexpected events such as health
deterioration, which is very common in sub-Saharan Africa, it is crucial to have access to liquid
assets to benefit from appropriate medical services. Holding too much cash is not an appropriate
solution at least for two reasons. First, this way of saving is subject to theft or “taxes” by friends
or relatives for assistance. Second, savers face self-control problems through “temptation goods”
that make it difficult for them to postpone an important part of their consumption (Banerjee and
Mullainathan, 2010).
Our paper is at the intersection of different strands of the literature addressing mobile
money, saving patterns, formal financial access and usage. More specifically, our main goal in this
paper is to examine the impact of using mobile money as a soft commitment device on individuals’
saving behavior. This investigation is relevant to policy agendas of governments and international
organizations which aim at improving people’s lives by developing financial inclusion. The
growing financial innovation of mobile money such as the use of a cell phone as an electronic
wallet (e-wallet) allows individuals to transfer purchasing power by using simple short messaging
services (SMS) technology and to store value through cash in and cash out functions. Moreover,
mobile money users may deposit funds for free but are taxed for withdrawals and transfers. Thus,
by storing value in their mobile money account, people are insured against theft and unneeded
expenditures because of the withdrawal and transfer fees which encourage them to cash out or
transfer money only when the need arises3. In fact, money transfers between users are not only a
simple deposit-transfer-withdraw transaction but some users keep the mobile money as savings
(Mbiti and Weil, 2013). However, the cost of transferring money from users of mobile money to
1Rotating Savings and Credit Association (ROSCA) is a saving group involving many parties who know one another
that meets on a regular basis. At each meeting, group members make a fixed mandatory contribution which goes into
a “pot” that is then assigned to one of the members. For more details, see Ambec and Treich (2007), Dupas and
Robinson (2013b) and Smets (2000). 3 Therefore, the withdrawal and money transfer fees serve as a soft commitment device.

3
non-users is higher than the cost of withdrawals and debited to the user account. This pricing
schedule may lead users to keep their mobile money or only transact with non-users in case of
emergencies. Mobile money is also characterized by unique features that equip it with certain
advantages such as mobiquity, affordability, speed, safety and security through a Personal
Identification Number (PIN), especially the SIM card4, that allows to lock the mobile money
account at anytime, everywhere and without the risk of falsification. By using mobile money,
individuals can easily exchange cash for e-money or vice-versa with mobile money agents across
the country. Once the deposit is made, they can either keep it safe in the mobile phone as savings
or transfer the balance via SMS to any other mobile phone in the country or overseas5. The recipient
does not need to have a mobile money subscription and the mobile phone can be registered on a
competing network. It is hence essential for mobile money users to have convenient access to cash
in/out options in order for them to convert their cash into electronic money and vice versa.
Moreover, certified agents have to hold sufficient balance of electronic money or cash, allowing
retail agents to rebalance their liquidity (convert electronic money into cash, and vice versa) to
ensure the efficiency of users’ cash in/out functions.
Mobile money has recently risen to the forefront of development agendas in less developed
countries. Although considerable research has been conducted in this field, most of it has focused
on the case of M-PESA in Kenya6. Key findings that emerge from these previous investigations
show that mobile money adoption reduces monetary and security costs of transferring money
compared to traditional means of money transfers such as the use of Western Union, MoneyGram,
or transport companies (Mbiti and Weil, 2011). In a similar vein, it is shown that by reducing
transaction costs, mobile money adoption has substantial impact on the size and the frequency of
remittances that ultimately allows households to smooth consumption and share risk (Jack and Suri,
2014). Mas and Mayer (2011) suggest and describe how mobile money can be used to create a safe
saving account where individuals can deposit small amounts of money for more immediate needs.
4 The Subscriber Identification Module (SIM) card refers to a smart card inside mobile phones. It contains an
encryption key that secures the user’s PIN on entry. For more, see (Eijkman et al., 2010; Mbiti and Weil, 2011). 5 Especially in Ivory Coast where a large community of Burkinabe lives. A recent study by Lonie et al. (2013) shows
that there are about 6 millions of mobile money subscribers in Ivory Coast in December 2013. Mobile money is
therefore an important channel which Burkinabe immigrants may use in order to send money at home. 6 M-PESA was launched in 2007 and is considered as the most successful mobile money system in the world. Since
its launch, M-PESA registration has grown exponentially from 21% in 2008 to 75% of the Kenyan adult population in
November 2014 (The Economist, 2014). For more details, see CFSP (2013) and Jack and Suri (2011).

4
Mas and Kumar (2008) describe how a mobile phone can be seen as an opportunity of delivering
basic banking services to poor people who have less alternatives than rich people. In fact, a mobile
phone can act as a virtual bank card by storing information about the user and the mobile money
account into the subscriber identity module (SIM) card inside the phone. Thus, it can be used to
initiate securely transactions request and authorization. Therefore, although it does not pay interest,
storing mobile value in the phone provides the same benefits that a traditional bank saving account
provides with an additional benefit in cash. Related to our investigation, Mbiti and Weil (2011)
find that while M-PESA is mainly used for money transfers, it also serves as a storage of value by
decreasing the use of informal saving mechanisms such as ROSCA. Along this line, Demombynes
and Thegeya (2012) find empirically that individuals registered with M-PESA are more likely to
save than those who are not registered with M-PESA. In a field experiment in Afghanistan
Blumenstock, Callen and Koepke (2015) who show that the use of mobile money for salary
payment results in cost savings for the employer, emphasize that it may have in the long term an
impact on the total savings of employees. Other studies document analytically that people may
prefer mobile money account to keep money for emergencies while for long-term savings, they
would use tools that limit access to cash (such as bank accounts or participation into a ROSCA)
(Mbarathi and Diga, 2014; Morawczynski and Pickens, 2009). In this paper, our aim is to
empirically test these conjectures. We study the impact of mobile money adoption on individual
saving behavior by distinguishing savings for immediate purposes (i.e. health shocks, financial
shocks) from savings for long-term purposes which are rather predictable (i.e. to develop an
activity).
Our choice to focus on savings cannot be overemphasized. Indeed, saving is one of the key
aspects of financial practices that any individual has to assume himself. Savings help people
manage vulnerabilities and build an asset base, which can be used to lessen the risk of incidence of
adverse shocks (Hulme, Moore and Barrientos, 2009). Particularly in developing countries, people
often face a variety of negative shocks related to ill-health or death of a family member which can
overwhelm their means and hence hamper economic activity and development. This is why in such
an environment, providing people with an appropriate saving technology can help them deal with
unpredictable life events (Christen and Mas, 2009). In this regard, building on recent empirical
5
findings by Dupas and Robinson (2013b)7, which show that simply providing a safe place to keep
money is sufficient to increase preventative health savings, we investigate whether using mobile
money can help individuals increase their propensity to save for health emergencies, particularly
those with less access to formal financial instruments.
At the macroeconomic-level, saving rates are positively associated with future economic
growth. Evidence, however, suggests that in less developed countries, people lack access to formal
financial services (e.g. saving account), which hinders their propensity to save. The lack of banking
infrastructure and its low coverage network as well as high transaction costs, financial illiteracy
and the lack of information are often cited as the main causes of the low access to formal financial
services (Allen et al., 2014; Dermish et al., 2012; Jack and Suri, 2014; Ondiege, 2010). The
unbanked individuals are generally poor, live in rural area with precarious and irregular incomes,
and often rely on microfinance and informal finance to realize their financial projects (Kendall,
2010; Mas and Mayer, 2011; Mas, 2010; Rutherford, 2002). Microfinance institutions play an
important role in providing formal financial services to the excluded people (Ondiege, 2010). In
many developing countries, they have made a critical contribution by providing first microcredits
and later on microsavings and also by locating their branches in places neglected by banks.
However, the cost of operating microfinance institutions remains very high leading to high
transaction costs supported by customers. This is why people still need more access to appropriate
financial products that meet their needs especially good saving and payment services including
remittances and insurance (Beck et al., 2009; Karlan and Morduch, 2009).
Our paper contributes to the aforementioned literature in two main ways. First, our study is
the first that empirically tests the impact of mobile money on saving patterns by distinguishing
savings for unpredictable events and savings for anticipated events. More specifically, we examine
whether mobile money users are more likely to save for health emergencies or save to develop an
activity than mobile money non-users. Second, to the best of our knowledge the existent studies on
mobile money only describe the potential impact of this new technology on poor people financial
7 Dupas and Robinson (2013b) perform a field experiment on 771 individuals in rural Kenya to test the effects of four
innovative commitment saving devices through the “mental accounting”. The Safe Box, the Lockbox, the Health
Savings Account and the Health Pot were provided to four groups to buildup savings for preventative and emergencies
health expenses. They find that simply providing a safe place to save was sufficient to increase health savings by 66%.
They also report that earmarking was helpful when funds were put toward emergencies or for individuals that are
frequently taxed by friends and relatives.
6
management. Our detailed data set enables us to go further and test whether the use of mobile
money has an impact on saving behavior of disadvantaged groups such as low and irregular
incomes, rural, female and less educated. On the whole, the lack of empirical studies in this area
may be due primarily to data scarcity (i.e. no readily available secondary databases) and costly
collection of primary data. For our study, we use hand-collected data from a survey conducted in
Burkina Faso, a country where many initiatives are increasingly implemented to improve the
expansion of mobile money.
Using individual responses to a survey we conducted between May and June 2014 in
Burkina Faso, we utilize the logistic model to study whether mobile money affects people saving
behavior. Our main results show that using mobile money services is positively associated with the
propensity of individuals to save for unpredictable events, such as health emergencies. We do not,
however, detect any association between mobile money and savings for anticipated objectives. By
taking into account the outreach, i.e. existing disparities in the access and usage of formal financial
services, our results show that mobile money increases the propensity of rural, female, less
educated individuals and individuals with irregular income to save for health emergencies. These
results taken together have important policy implications. By helping individuals build their
savings to face unanticipated events, facilitating mobile money adoption appears to be an important
way to improve financial inclusion.
The remainder of the paper is organized as follows. In the next section, we discuss the
research framework. Section 3 describes our survey design and data collection. It also provides
background information on the adoption of mobile money and the state of existing financial
services in Burkina Faso. In section 4 we present our model specification and follow this with the
results in section 5. Section 6 presents the discussion of potential mechanisms through which
mobile money can affect saving behavior and we conclude in section 7.
2. Research Framework
Two distinguishing features arise from the existing literature (Batista and Vicente, 2016;
Kendall, 2010; Mas, 2010; Mas and Mayer, 2011; Mbiti and Weil, 2011; Morawczynski and
Pickens, 2009; Rutherford, 2002). First, despite the lack of easy access to formal financial services
in developing countries, poor people manage to save although they mainly do so through informal

7
mechanisms, and second the adoption of mobile money may or may not affect saving behavior.
Generally, its impact on saving behavior may depend on two important aspects: the purpose of
saving (unpredictable events, short term vs. predictable, long term) and the outreach based on
exogenous characteristics (i.e. gender, location, education and incomes).
2.1. Mobile money adoption and saving for unpredictable and predictable events
In developing countries, people often have to rely on informal saving mechanisms to
manage their finances, as an alternative, due to the lack of access to formal financial services such
as saving accounts. Because of this, several initiatives have been undertaken either by private or
government entities to promote branchless banking such as mobile money. In some cases though,
as we discuss hereafter, informal saving mechanisms may fit the needs of the individuals to save
for anticipated objectives and hence make less relevant the reliance on the innovation of mobile
money.
For long term projects, informal saving mechanisms such as participating in savings groups
(ROSCAs), or investing in land, jewels and livestock, may be considered convenient. Indeed, to
deal with anticipated events like starting up or developing a business, people can easily sell their
physical assets since the date of the event is preset. For individuals participating in ROSCAs, they
can preset the startup date according to the date they are assigned to receive the pot, as many
ROSCAs use a predetermined order to allocate the savings pot. Yet, these saving mechanisms
involve high risk taking. For instance, some ROSCAs disband and often without warning.
Moreover, holding illiquid assets expose individuals to loss or theft and assets depreciation
(Christen and Mas, 2009; Mas, 2010; Morawczynski, 2009). In this context, we suppose that
individuals may consider adopting mobile money as an alternative saving device because mobile
money account is personal and relatively safe, and they can easily determine their own target to
reach in order to realize their investment project. However, several studies show that planning for
long term objectives requires less access to the money (Mbarathi and Diga, 2014; Morawczynski
and Pickens, 2009). In the same vein, Dupas and Robinson (2013a) provide evidence that
expanding savings access, especially bank accounts, increases business investment. Thus, using
saving devices which restrict access to cash until a target date is attained would be more adequate
to plan for anticipated objectives. Thereby, as mobile money increases access to cash, it may have

8
less or no impact on saving for predictable events compared to saving for unanticipated events for
which, as we argue below, mobile money may prove to be better-suited.
To deal with unpredictable events such as health emergencies, people need adequate saving
instruments that facilitate access to cash. Selling land, jewels or animals quickly in response to
adverse health shocks is not easy and may not always be reliable. Similarly, in the case where
individuals participate in ROSCAs, since there is a typically predetermined order, it is impossible
to access the money immediately when an emergency comes up. In such circumstances, some
people turn to relatives for help. These relatives, however, may not have liquid savings and
therefore would have to sell assets (Collins et al., 2009). Mobile money may thus be particularly
prominent in this regard by providing easy access to cash for emergency purposes. This conjecture
is supported by the findings of Dupas and Robinson (2013b) who show through a field experiment
in Kenya that simply providing a safe place to keep money is sufficient to increase preventive
health savings. This result highlights that to build savings for unpredictable events, individuals
need a safe place which allows them to get back their money when the need arises. In this context,
we expect that using mobile money should have a positive impact on individuals saving behavior
for unanticipated events such as health emergencies. Some caution is, however, in order. The liquid
savings option provided by the mobile money, accessible anywhere and anytime, could increase
family assistance and hence, it may have a negative impact on individual savings. Moreover, the
withdrawal tax feature of mobile money may help people resist unneeded expenditures on the one
hand but it may discourage them to put money in their account and dismiss its effects on savings
on the other hand. Our empirical investigation aims at determining which effect dominates over
the other.
2.2. Mobile money adoption and the “triple whammy”
In their frequently cited book, The portfolios of the poor, Collins et al. (2009) highlight that
in developing countries people not only have to cope with (1) low incomes but that these incomes
are also (2) irregular and that (3) too few financial instruments are available to help individuals in
their management. They term this the “triple whammy”8. Given the huge disparities in access to
formal financial services that exist depending, among other things, on the location, gender, income
8 The “triple whammy”: low incomes, irregularity; and a lack of tools (Collins et al. 2009, p.16).

9
or education of the population, it is crucial to take this dimension into consideration while
examining the impact of mobile money adoption on the saving behavior.
a) Low, irregular vs. High, regular incomes
In less developed countries where a significant fraction of the population lives under the
national poverty line, poor people incomes are not just low, but also they are often irregular.
Moreover, it is shown that poor individuals, unlike rich people, are more likely to save their small
amount of money through a variety of informal mechanisms (Banerjee and Duflo, 2007; Chowa,
Masa and Sherraden, 2012; Christen and Mas, 2009; Collins et al., 2009; Mas, 2010) despite their
risky nature. Recent research, however, describes how individuals have increasingly turned to
mobile money as a storage device to keep smaller amounts of money (Morawczynski, 2009).
Moreover, Demombynes and Thegeya (2012) highlight that aside from this, mobile money serves
as a saving device which ensures safety against the dangers of theft and which is inaccessible to
relatives. Therefore one may expect that, in the presence of good saving tools such as mobile money
which is reliable, safe and affordable, individuals with low and/or irregular incomes would be
inclined to rely on it to build their savings.
b) Low vs. High access to formal financial instruments
The location (rural vs. urban), gender (female vs. male) and the level of education are key
determinants of accessibility to formal financial services. Firstly, the breakdown of financial
infrastructure shows disparities between rural and urban areas. In most sub-Saharan African
countries rural areas are the most populated, representing 60% of the total African population but
where the activities of commercial banks remain underdeveloped (Dupas et al., 2012; Mas, 2010;
Ondiege, 2010). Almost all formal financial institutions are concentrated in urban areas leaving
rural areas underserved. People living in rural areas vs. urban areas have less access to a wide range
of financial services to cope up with life events, both anticipated and unanticipated. Mobile money
can potentially help bridge this gap as a growing number of people uses this new technology as an
alternative to traditional banking. Morawczynski (2009) shows that in Kenya, people living in
urban areas are less likely to use their M-PESA account to save because they have formal saving

10
mechanisms to meet their saving needs. Other arguments include the fact that people may need to
keep their money into a bank account to build a relationship with the financial institution to access
credit in the future. In urban areas, the impact of mobile money on individuals’ saving patterns -
both unpredictable and predictable, should hence be minimal. Furthermore, Dupas et al. (2012)
show that in rural Kenya the lack of formal bank accounts is a serious obstacle for people to save.
In this context, we expect that providing individuals in rural areas with access to mobile money
services may increase their propensity to save (Aker and Mbiti, 2010; Allen et al., 2014; Christen
and Mas, 2009; Dupas and Robinson, 2013b).
Secondly, all else being equal, women remain comparatively more excluded from the
financial sector and hence, have less access to formal financial services such as saving accounts
and loans than men (Demirgüç-Kunt, Klapper, and Singer, 2013). They are consequently found to
rely mainly on informal mechanisms (ROSCAs, money-lenders …). Without a bank account, it is
more difficult to build up savings and/or receive public benefits or remittances from family
members living abroad (Demirgüç-Kunt et al. 2013). Dupas and Robinson (2013a) provide robust
evidence that shows how women are more in need of formal saving devices than men. In a
randomized field experiment in Kenya, they find that increasing access to basic savings bank
account which does not pay interest, increases women savings while men’s saving behavior is not
impacted. This is why one may conjecture that women adoption of mobile money may have a
comparatively greater impact on their saving behavior than men. Our investigation thus allows
determining whether mobile money has the potential to cut back gender inequalities.
Finally, financial literacy or financial knowledge is yet to receive enough attention although
there has been growing attention in the recent past. Recent research shows that across developed
and developing countries the level of financial literacy remains very low (Karlan, Ratan and
Zinman, 2014; Lusardi and Mitchell, 2014). Unsurprisingly, the unbanked population has relatively
low level of education. Hence, it is difficult for them to understand various financial services that
are available to them. This should partly explain their preference to use informal saving methods.
Mobile money being affordable and easy to use, we can expect less educated people to adopt it for
their saving purposes.
To sum up, we consider that if mobile money can significantly allow individuals to enhance
their saving behavior, our research framework suggests the following questions:

11
(i) Does the use of mobile money increase the capacity of individuals to save, particularly
for unpredictable events such as health emergencies?
(ii) To the extent that mobile money is affordable, easy to use and available anywhere
throughout the country, do disadvantaged groups such as individuals with low and
irregular incomes, rural, female and less educated individuals benefit from the use of
mobile money to increase their savings?
3. Survey design and data collection
We answer these questions by using individual-level data on the usage of mobile money
combining with socio-demographics information collected through a survey we designed and
conducted in Burkina Faso in 2014. The lack of official administrative data on actual uses of mobile
money, saving behavior, health expenditures and several other microeconomic data especially at
regional level constraints us to rely on hand-collected information even if we acknowledge that
self-reported data may entail biases and limit the generality of the findings. Prior to a detailed
examination of the characteristics about the location and population considered in our survey, it is
worth providing an overview of the state of existing financial services in Burkina Faso.
3.1. Background on mobile money and access to financial services in Burkina Faso
Burkina Faso is a low-income country with a GDP per capita estimated at just 761 USD
and about 47% of its population live under the national poverty line as of 2013 (World Bank, 2015).
The country’s financial system is still in its infancy even in comparison to other African low-
income countries9. There are about 13% of the population that have an account at a formal financial
institution (bank account, post office, credit union and microfinance institutions); in contrast, this
rate is around 35% in Ghana, 55% in Kenya and 69% in South Africa as of 2011 (Global Financial
Inclusion Database, 2015). The access to a bank account remains limited in the country and the
9 We provide in Appendix Table A.7 statistics on access to financial services for Burkina Faso, Sub-Saharan Africa
and Low-income countries.

12
central bank (BCEAO) 10 estimates the bankarization rate at about 4.6% (BCEAO, 2011). In
Burkina Faso, among individuals living in urban area, about 35% have a formal financial account,
while in rural area only 12% have formal financial account (Global Financial Inclusion Database,
2015). This disparity in the access to formal finance is not confined to the location, approximately
12% of female have an account at formal financial institution compared to 15% of male.
Over the course of the past decade, cell (or mobile) phone coverage and adoption in Burkina
Faso have increased substantially. While about 0.20% of the population had access to mobile phone
in 2000, the number of subscribers has increased to over 47% in 2011, and continued to rise
dramatically in the past few years to reach 60% in 2012 and 65% in 2013 (Group Special Mobile
Association intelligence, 2015). In addition to basic services of mobile phones (calls, SMS), other
services have been introduced over the past two years, namely, mobile financial services or mobile
money. In the country, there are three mobile operators Airtel, Telmob and Telecel, but only the
first two offer mobile money services which were launched respectively in 2012 (Airtel Money)
and 2013 (MobiCash).
Since the launch of mobile money, the number of registered users has continuously
increased and has been multiplied by seventeen between 2011 and 2014 11 (Financial Access
Survey, IMF, 2015). Ignoring multiple accounts held by individuals into each mobile money
providers, this implies that about 5% of the adult population had gained access to mobile money in
two years. Subscription to mobile money service is free of charge but requires an initial account
balance of 500 FCFA (around $1 US). The network of agents plays a key role in the adoption and
usage of mobile money by making the conversion from cash to e-money and vice versa, more
accessible and efficient for customers. In this regard, the number of mobile money agents has
increased substantially from 483 in 2012 to 3,688 in May 2014 (Financial Access Survey, IMF,
2015). At any mobile money agent, depositing funds is free of charge whereas withdrawals are
charged according to the amount. No interest is earned on account balances and mobile money
providers do not make loans. Regarding money transfers, there is a fee 12 per SMS transfer
10 BCEAO: Banque Centrale des Etats de l’Afrique de l’Ouest. It is the Central Bank of the eight countries including
Burkina Faso, of West Africa Economic and Monetary Union (WAEMU). 11 The number of registered users grow from 70 509 in 2011, 134 583 in 2012, 828 727 in 2013 to reach 1 242 476 in
2014 (Financial Access Survey, IMF, 2015). 12 In our case study, the pricing schedule used by mobile money providers is a combination of a tiered/banded pricing
and percentage based pricing (Garg, 2011). For more details, see the Appendix A.6.

13
according to the mobile money provider. Withdrawal and transfer fees are deducted from user’s
accounts and details given in the appendix A.6 indicate that fees increase with the amount and are
highly penalizing for small amounts. Hence, this creates an incentive for small amounts owners to
keep it in their mobile money account in line with the soft commitment hypothesis at the core of
this paper.
3.2. Survey location and survey population
In May 2014, we undertook a survey of 500 randomly selected people across one region of
Burkina Faso. The country has 13 regions divided into many rural and urban municipalities. Due
to budgetary constraints that did not allow us to extend the survey throughout the entire territory,
only the central region was considered for the sample frame. This region counts about 13% of
Burkina’s population and is divided into one urban municipality with 12 districts and six rural
municipalities with 172 districts. It is the most populated region and where the supply of formal
financial institutions and to some extent the supply of mobile money institutions13 are relatively
concentrated.
The survey location is determined on the basis of the following criteria: the first is the
existence of at least one formal financial institution into retained municipalities -which we check
through the national institute of statistics and demography (INSD) of Burkina Faso report on
financial institutions14. The second criterion is the availability of mobile phone services that we
assess through the availability of mobile operator signal. As stated above, the area covered by the
sample frame is the central region and consists of one urban municipality, “Ouagadougou”, and six
rural municipalities among which only four have at least one formal financial institution. We then
randomly select among the four, one municipality that is “Saaba”15. We finally randomly choose
two districts for each municipality, i.e. two urban districts in Ouagadougou and two rural districts
in Saaba.
13 The central region is the second after the western region where mobile money agents are concentrated (29% for
central region and 45% for western region). 14 Note that among the two districts of the rural municipality considered in our study, there is one district where formal
financial institutions are inexistent. 15 In the rural municipality, Saaba, only two formal financial institutions one microfinance and one credit union
institutions are present.
14
To form our target population, we interview 125 individuals in each district by following
an n-th individual starting from the center of the district along the main directions of walk in the
district. The individuals interviewed in each district have to live in the concerned district to avoid
double interview. We decided to have a balanced sample of users and non-users of mobile money
because, as emphasized above, our aim is to capture the impact of mobile money on saving
behavior. Thus, individuals are interviewed until we obtain half of the sample to be users of mobile
money irrespective of the municipalities. However, there is no restriction regarding individual-
level characteristics (gender, location, education level, level and types of incomes) in the sample.
A paper-based questionnaire was distributed to a total of 500 participants with 500 FCFA
(about $1 US) unit of call time incentive. The questionnaire combined qualitative and quantitative
questions to elicit in-depth information about users and non-users of mobile money including
individuals’ socio-demographic characteristics. All research variables were measured using
multiple-item scales and based on previous studies (Demirguc-kunt and Klapper, 2012;
International Finance Corporation, 2011) with some changes to tailor them to our context. Most of
the items were coded on dichotomous responses and on 5-point Likert scale. Our respondents were
interviewed from 20 May to 28 June 2014. Participants who use the mobile money through their
own cell phone or another cell phone were classified as users while participants who did not use
the mobile money were classified as non-users. At the end of the survey, our sample consisted of
40516 respondents with 50.5% of mobile money users and 49.5% of non-users.
3.3. Data and summary statistics
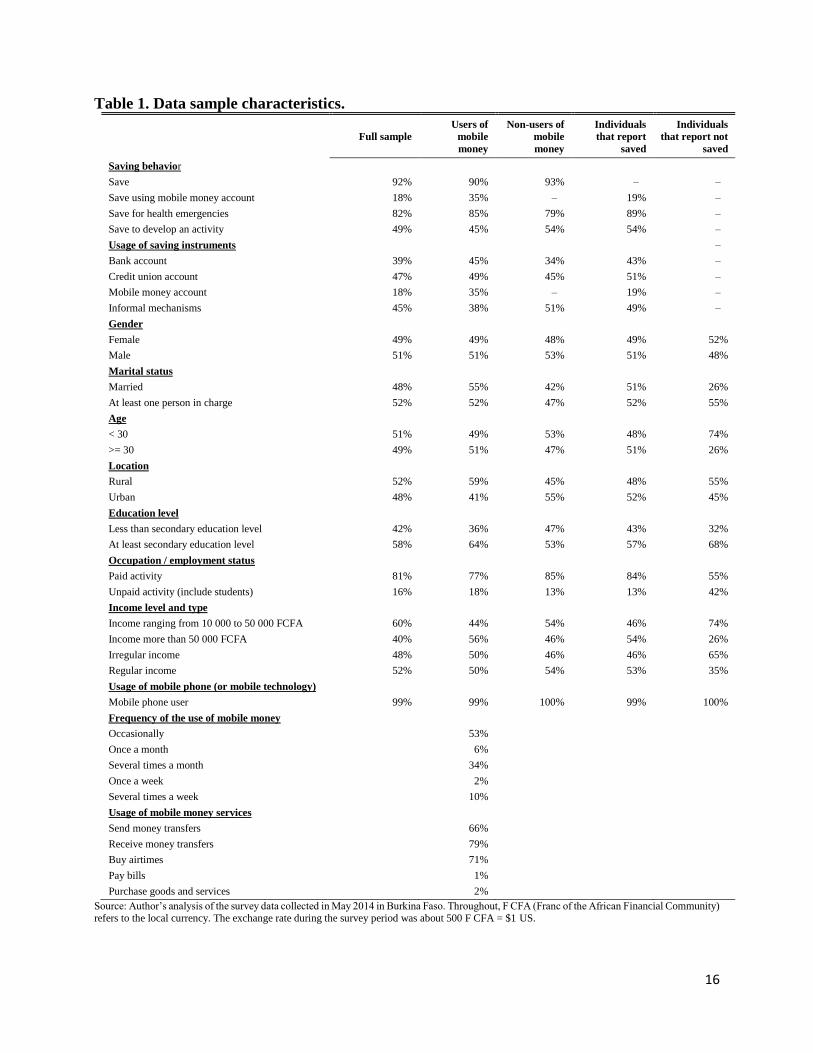
Descriptive statistics (Table 1) show that, in our sample, most individuals saved regardless
of their income levels. The share of individuals that reported saved is 92%; 89% of which saved
for health emergencies while 54% saved to develop an activity. Regarding the gender, our sample
is made of 51% of men and 49% of women. About 48% reported being married and the mean of
age is about 31 years while 52% reported having at least one person in charge, and more than half
of all individuals had at least secondary education level (more than six years of school). For the
employment status, about 81% reported having a paid activity, while 16% were unemployed. More
16 We ended up with a final sample of 405 respondents due to mistakes made during the process by some interviewers
and respondents alike.

15
than half of all individuals have a monthly income ranging from 10,000 to 50,000 FCFA (around
$20 to $100 US), and about 48% of all individuals had irregular income.
Considering the two sub-samples of mobile money users and non-users it appears that
mobile money users are more inclined to save for unpredictable events than non-users, while it is
the opposite concerning saving for predictable purposes. We also notice that while mobile money
users have more access to bank and credit union accounts than non-users, around 51% of non-users
of mobile money use informal saving mechanisms compared to 38% for users of mobile money.
Looking at the individual-level characteristics, the two groups reflect similar structures expect for
marital situation with about 55% of mobile money users reported being married compared to 42%
of non-users. Similarly, around 59% of mobile money users are located in rural areas compared to
45% of non-users. Reports also show that around 44% of mobile money users have a monthly
income ranging from 10,000 to 50,000 FCFA compared to 54% of mobile money non-users.
In our data, 99%17 of the sample use a mobile phone. Regarding the frequency of use of the
204 mobile money users interviewed during the survey, 53% report using occasionally mobile
money services. Majority of the mobile money users indicate to use the service to make person-to-
person remittances: 79% receive transfers and 66% send transfers. Buying airtime stands at 71%
of users, and a small share uses it to pay bills (about 1%) and services (about 2%). 90% of mobile
money users report to have saved during the past 12 months and among those, 35% saved using
mobile money. Breaking down the responses according to the purpose of saving, we find that 85%
of users report having saved to cope with health emergencies and 45% to develop an activity.
17 This rate of mobile phone usage in our sample is higher than the average rate of mobile phone subscription in Burkina
Faso which stands at 65% as of 2013 and may raise questions about the generality of our findings. Therefore, we
consider an alternative data survey collected at the country level provided by the Global Findex (2015) and find results
that support our conclusions. Results are reported in Appendix Table A.5.2.
16
Table 1. Data sample characteristics.
Full sample
Users of
mobile
money
Non-users of
mobile
money
Individuals
that report
saved
Individuals
that report not
saved
Saving behavior
Save 92% 90% 93% – –
Save using mobile money account 18% 35% – 19% –
Save for health emergencies 82% 85% 79% 89% –
Save to develop an activity 49% 45% 54% 54% –
Usage of saving instruments –
Bank account 39% 45% 34% 43% –
Credit union account 47% 49% 45% 51% –
Mobile money account 18% 35% – 19% –
Informal mechanisms 45% 38% 51% 49% –
Gender
Female 49% 49% 48% 49% 52%
Male 51% 51% 53% 51% 48%
Marital status
Married 48% 55% 42% 51% 26%
At least one person in charge 52% 52% 47% 52% 55%
Age
< 30 51% 49% 53% 48% 74%
>= 30 49% 51% 47% 51% 26%
Location
Rural 52% 59% 45% 48% 55%
Urban 48% 41% 55% 52% 45%
Education level
Less than secondary education level 42% 36% 47% 43% 32%
At least secondary education level 58% 64% 53% 57% 68%
Occupation / employment status
Paid activity 81% 77% 85% 84% 55%
Unpaid activity (include students) 16% 18% 13% 13% 42%
Income level and type
Income ranging from 10 000 to 50 000 FCFA 60% 44% 54% 46% 74%
Income more than 50 000 FCFA 40% 56% 46% 54% 26%
Irregular income 48% 50% 46% 46% 65%
Regular income 52% 50% 54% 53% 35%
Usage of mobile phone (or mobile technology)
Mobile phone user 99% 99% 100% 99% 100%
Frequency of the use of mobile money
Occasionally 53%
Once a month 6%
Several times a month 34%
Once a week 2%
Several times a week 10%
Usage of mobile money services
Send money transfers 66%
Receive money transfers 79%
Buy airtimes 71%
Pay bills 1%
Purchase goods and services 2%
Source: Author’s analysis of the survey data collected in May 2014 in Burkina Faso. Throughout, F CFA (Franc of the African Financial Community) refers to the local currency. The exchange rate during the survey period was about 500 F CFA = $1 US.

17
4. Model specification and endogeneity issue
In this section, we describe our empirical specifications used to test the relationship between
the use of mobile money and saving choices, as well as the potential heterogeneity effects of mobile
money depending on individuals’ characteristics. We also discuss the endogeneity issue related to
the use of mobile money and how we propose to deal with it.
a) Model specification
We use a logistic model to examine the impact of mobile money usage on individual saving
patterns considering the following specification18:
iii ICMMuseryPROB 3211 (1)
where is the cumulative distribution function of logistic distribution.
In the equation (1), iy is our dependent variable that characterizes individual saving
behavior. It is a binary variable that alternatively stands for: save for unpredictable events, save for
anticipated objectives, save for health emergencies and save to develop an activity19. These latter
two dependent variables are measured through the following questions: “During the past 12
months, did you save some of your money to develop an activity?”; “to cope with health
emergencies?” Other propositions were offered as well to the respondents but we retain saving for
health emergencies and saving to develop an activity20. Thus, save for health emergencies
Table 2. Definitions of the variables. 18 In our logit estimations we use robust standard errors to take into account undetected (or possible) specification
errors regarding the right hand side variables (Freedman, 2006) but all our main conclusions remain unchanged when
using standard errors (i.e. by assuming homoskedacity) (results are available upon request). 19 Our first two alternative dependent variables: saving for unpredictable events and saving for anticipated shocks were
constructed by aggregating the responses obtained about the objectives of individual’s savings (Table 2). In our
questionnaire we ask the following question “During the past 12 months, did you save some of your money for
education spending?”; “to develop an activity?”; “to repay a loan?”; “for a potential decrease in income?”; “to
cope with health emergencies?”; “for a ceremony (wedding, funeral)?” However, only saving for health emergencies
and saving to develop an activity were mainly retained. This is consistent with previous studies on the importance of
commitment devices on saving behavior which consider health emergencies (Dupas and Robinson, 2013b; Mbarathi
and Diga, 2014) or savings for enterprise development (Ashraf et al., 2010; Dupas and Robinson, 2013a). The relatively
low response rate on the other objectives of savings also motivated us to focus on the two motives. 20 See footnote 18 about the rationale of this choice.

18
Variable Definition Obs. Mean
Mobile money user
(MM user)
Reply to the question: Do you use mobile money services? Encoded as
yes = 1, no = 0 405 0.5
Save for
unpredictable events
Indicate when respondent's saving was for unpredictable purposes,
encoded as (save for health emergencies, and/or save for an eventual
decrease in income = 1, others = 0)
374 0.93
Save for health
emergencies
Reply to the question: During the past 12 months, did you save to cope
with health emergencies? Encoded as yes = 1, no = 0 374 0.89
Save for predictable
events
Indicate when respondent's saving was for predictable events, encoded
as (save for education, save to develop an activity, save to repay a loan
and/or save for a ceremony such as wedding or funeral = 1, others = 0)
375 0.70
Save to develop an
activity
Reply to the question: During the past 12 months, did you save to
develop an activity? Encoded as yes = 1, no = 0 372 0.53
Individuals’ characteristics
Age Indicate the age of respondent 404 30.55
Male Indicate the gender of respondent, Encoded as Male = 1, Female = 0 405 0.51
Married Indicate the marital situation of respondent, Encoded as Married = 1,
Single = 0 405 0.48
At least one person
in charge
Indicate if the respondent has or not dependent, Encoded as Having
dependent = 1, otherwise = 0 401 0.53
Education Indicate the education level of respondent, Encoded as Illiterate = 1,
Primary = 2, Secondary = 3, University = 4 402 2.67
Rural Indicate the location of respondent, Encoded as Rural = 1, Urban = 0 405 0.52
Occupation Indicate the employment status of respondent, Encoded as (Employed,
Entrepreneur, Merchant, Farmer) = 1, (Unemployed, Student) = 0 391 0.84
Income
Indicate the monthly income of respondent, encoded as Less than
10,000 FCFA = 1, 10,000 to 50,000 FCFA = 2, 50,000 to 150,000
FCFA = 3, 150,000 to 300,000 FCFA = 4, 300,000 to 500,000 FCFA =
5, More than 500,000 FCFA = 6
405 2.61
Irregular income Indicate the type of income of respondent, encoded as Irregular = 1,
Regular = 0 403 0.48
Note: Throughout, F CFA (Franc of the African Financial Community) refers to the local currency. The exchange rate during the survey period was about 500 F CFA = $1 US.
19
takes the value one if respondent indicates save for health emergencies, and zero otherwise.
Similarly, save to develop an activity equals to one if respondent saves to develop an activity, and
zero otherwise21. iMMuser is the independent variable of interest that stands for the use of mobile
money. It is a dummy variable equal to one if the individual reports using mobile money and zero
otherwise. iIC is a vector for controls (age, gender, marital situation, at least one person in charge,
education level, location, occupation or employment status, level and type of income). We present
in Table 2 the variables’ definitions along with some summary statistics.
If both users and non-users of mobile money do not differ in terms of their propensity to
save, the coefficient 2 should not be significantly different from zero. If users of mobile money
are more capable to save than non-users, then 2 should be positive and statistically different from
zero.
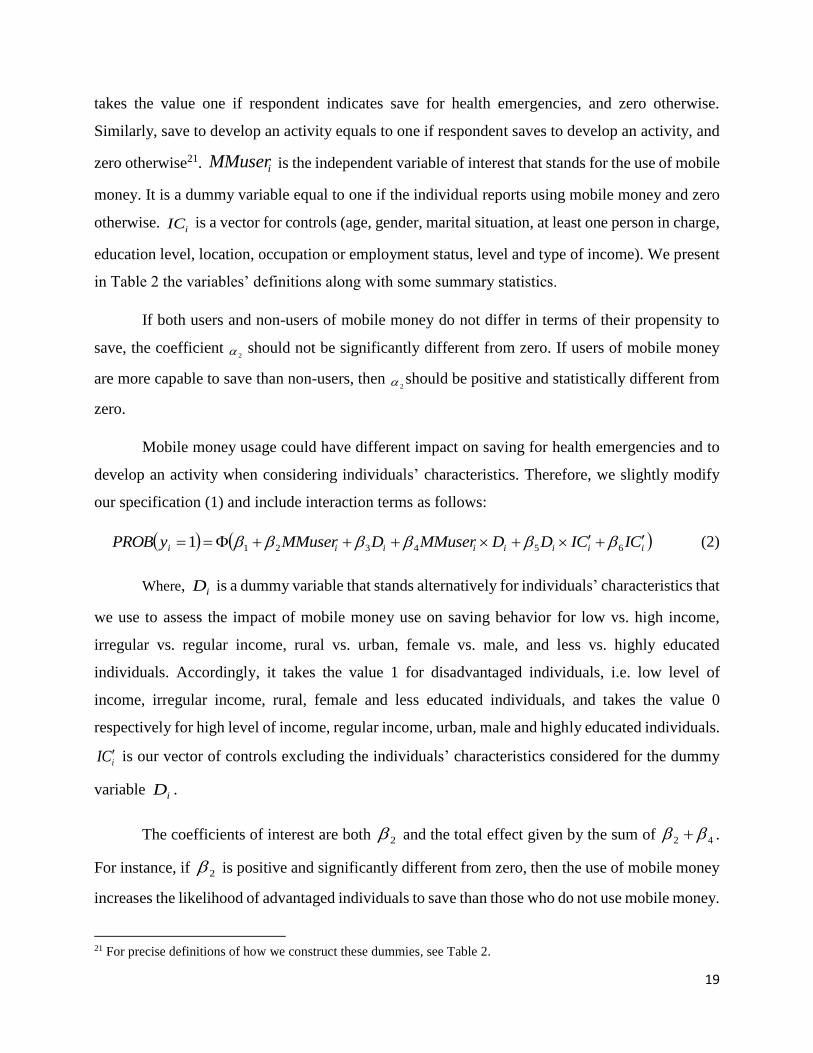
Mobile money usage could have different impact on saving for health emergencies and to
develop an activity when considering individuals’ characteristics. Therefore, we slightly modify
our specification (1) and include interaction terms as follows:
iiiiiiii CICIDDMMuserDMMuseryPROB 6543211 (2)
Where, iD is a dummy variable that stands alternatively for individuals’ characteristics that
we use to assess the impact of mobile money use on saving behavior for low vs. high income,
irregular vs. regular income, rural vs. urban, female vs. male, and less vs. highly educated
individuals. Accordingly, it takes the value 1 for disadvantaged individuals, i.e. low level of
income, irregular income, rural, female and less educated individuals, and takes the value 0
respectively for high level of income, regular income, urban, male and highly educated individuals.
iCI is our vector of controls excluding the individuals’ characteristics considered for the dummy
variable iD .
The coefficients of interest are both 2 and the total effect given by the sum of 42 .
For instance, if 2 is positive and significantly different from zero, then the use of mobile money
increases the likelihood of advantaged individuals to save than those who do not use mobile money.
21 For precise definitions of how we construct these dummies, see Table 2.

20
Similarly, if disadvantaged individuals who use mobile money have more likelihood to save than
those who do not use mobile money then, 42 should be positive and significantly different
from zero.
b) Endogeneity issue
To identify the causal effect in our equation of mobile money on saving choices, we must
assume that the variable “mobile money user” is exogenous and uncorrelated with the error term.
However, this may not be the case because, as stressed above, access to formal financial services
is very limited in Burkina Faso. This lack of access may lead individuals to rely on informal
mechanisms to manage their finances. Although mobile money was initially launched for money
transfers, individuals may use it to save due to its convenience (safety and ease of access) even if
it does not pay any interest (Demombynes and Thegeya, 2012; Dermish et al. 2012).
The endogeneity problem suspected here stems from the simultaneous determination of the
use of mobile money and saving choices of individuals22. Thus, to tackle the potential endogeneity
issue we perform an instrumental variable (IV) linear probability model (LPM) using 2SLS
estimator (Angrist and Pischke, 2008). Given that we have one potential endogenous variable, the
use of mobile money, we need at least one instrumental variable. Therefore, we use one excluded
instrument, the distance to the nearest mobile money proposed by Jack and Suri (2014). We assess
this distance by using the answer to the following question: “What distance did you travel to reach
a mobile money agent?” The responses are encoded on a 5-point Likert scale, 1 (less than 1 km), 2
(1 to 2 km), 3 (2 to 5 km), 4 (5 to 10 km) and 5 (more than 10 km). The underlying hypothesis of
this instrument is that access to mobile money agents is required for cash in/out functions that
allows for an effective use of mobile money. However, the distance to the nearest mobile money
agent may not be correlated with individuals' characteristics that could affect saving for specific
purposes. This is plausible in our case because in Burkina Faso, mobile money agents are mainly
made of retail outlets who decide to start mobile money business on top of their existing business
22 Additional likely sources of bias may be due to the choice of areas covered by our survey. We discuss in Appendix
A.5 about the external validity of our study and use nationally representative data from Global Financial Inclusion
Database (World Bank, 2015) that overcome the geographical selection problem to check the consistency of our
estimations. Also Batista and Vicente (2016), who randomize the introduction of mobile money across geographical
locations of rural Mozambique, find results that support our findings.

21
in order to diversify their services and incomes. Importantly, these retail agents are usually
shopkeepers or small businessmen who sell mobile accessories and they are often located in remote
areas near the poor households. Although mobile money operators (and partner bank branches)
have their own mobile money agents who are more likely to be located near places where there are
income generating activities, the cost of installation is such that mobile money providers may favor
the retail outlets. In all cases, given that the network of mobile operators covers around 80% of the
country (GSMA, 2015), mobile money services are offered in low income areas as well. This is
further supported by Munyegera and Matsumoto (2016) who show that the decision of mobile
money providers for licensing an agent is related to the prescribed requirements regardless of the
geographical and socio-economic characteristics of the agent’s location23.
We expect the coefficient of this variable distance to have a negative sign as the further
individuals are from mobile money agents, the harder it will be to access mobile money services,
and this may reduce adoption/usage of mobile money. In Tables 3 to 7 we do not present first-stage
regressions (to save space) but we show F statistic on the instruments for both MM user and its
interactions and the Kleibergen-Paap F statistic along with the corresponding Stock-Yogo critical
values at 10% for the relevance of the instrument.
5. Results
Table 3 presents our results about the impact of using mobile money on the propensity to
save for unpredictable events, to save for health emergencies, to save for predictable events and, to
save in order to develop an activity (columns 1 to 4). We report in columns 5 to 8 the results
obtained by estimating the IV linear probability model (LPM) using 2SLS estimator24. However,
the null hypothesis of exogeneity25 related to the use of mobile money is not rejected across all our
estimations. In the columns 1 and 2, we find that the coefficient of the variable of interest (MM
23 We check whether the distance to the nearest mobile money agent is correlated with individuals’ characteristics in
our analysis. We find little evidence that distance to agent is associated with individuals’ characteristics (results are
available upon request). Jack and Suri (2014) also show that the rollout of agents is uncorrelated with wealth among
other factors. 24 Results from the IV linear probability model (LMP) using 2SLS estimator are obtained using the ivreg2 command
from Stata. 25 We use the endogeneity test proposed by Baum, Schaffer and Stillman (2007) and its statistic is numerically equal
to a Hausman test statistic under conditional homoskedasticity.

22
user) is positive and significantly different from zero. But in columns 3 and 4 this coefficient is not
statistically significant. Thus, the propensity to save for unpredictable purposes and for health
emergencies is respectively about 326 and 2.5 times higher for users of mobile money than non-
users. This effect is by contrast not significant on individuals’ propensity to build up savings for
predictable events and savings to develop an activity. Thus, these results indicate that mobile
money usage helps to build savings for health emergencies while there is no difference between
users and non-users in their saving behavior for long term objectives such as to develop their
activity. As highlighted in our research framework (section 2.1), these findings may support
therefore the fact that as mobile money increases access to cash, individuals would use it for
unanticipated events such as health emergencies. By contrast, they would prefer other means,
perhaps relatively less liquid devices, to save for predictable events (or long term objectives)27.
This is in line with Mbarathi and Diga (2014) and Morawczynski and Pickens (2009) who argue
that people may use mobile money account for emergencies while for long-term savings, they
would prefer tools that limit access to cash (such as bank accounts due to long distance or
participation into a ROSCA). Our findings are also consistent with those of Batista and Vicente
(2016) who randomize the introduction of mobile money across geographical locations in rural
Mozambique and find that mobile money is associated with less vulnerability to shocks and with
less agricultural and business investment (which could be associated with savings for predictable
purposes).
26 The coefficients reported in all our tables are the log odds of the use of mobile money on saving patterns. To obtain
the odds ratio, we simply compute the exponential of log odds. 27 In the next section, we discuss in detail the potential mechanisms or pathways behind these findings.

23
Table 3. Saving choices and mobile money28.
Logit regressions IV regressions
Save for
unpredictable
purposes
Save for health
emergencies
Save for
predictable
events
Save to develop
an activity
Save for
unpredictable
events
Save for health
emergencies
Save for
predictable
events
Save to develop
an activity
(1) (2) (3) (4) (5) (6) (7) (8)
MM user 1.091** 0.922** -0.512 -0.142 0.055* 0.076** -0.107** -0.022
(0.527) (0.379) (0.324) (0.295) (0.031) (0.038) (0.046) (0.047)
Age 0.206 0.070 0.354** 0.438** 0.014 0.013 0.070*** 0.063***
(0.286) (0.261) (0.160) (0.181) (0.021) (0.024) (0.021) (0.024)
Age squared -0.002 -0.000 -0.004 -0.006** -0.000 -0.000 -0.001*** -0.001**
(0.004) (0.004) (0.002) (0.003) (0.000) (0.000) (0.000) (0.000)
Married 0.196 -0.084 -0.449 -0.936*** 0.018 -0.013 -0.050 -0.147***
(0.701) (0.550) (0.350) (0.356) (0.049) (0.055) (0.053) (0.054)
Rural 0.0605 0.143 0.219 -0.949*** -0.002 0.014 0.040 -0.139***
(0.438) (0.400) (0.322) (0.359) (0.030) (0.039) (0.047) (0.048)
Male 0.179 0.006 0.308 0.254 0.005 -0.005 0.045 0.008
(0.505) (0.386) (0.318) (0.329) (0.030) (0.037) (0.047) (0.048)
Occupation -0.262 0.896 0.528 2.842*** -0.006 0.102 0.154* 0.253***
(0.998) (0.576) (0.542) (0.938) (0.044) (0.072) (0.088) (0.077)
Irregular income -0.471 -0.113 1.544*** 2.499*** -0.029 -0.006 0.242*** 0.435***
(0.547) (0.451) (0.318) (0.376) (0.034) (0.042) (0.049) (0.053)
Person in charge 0.291 -0.036 0.0418 -0.014 0.019 -0.004 0.004 0.000
(0.411) (0.331) (0.291) (0.284) (0.026) (0.033) (0.041) (0.042)
Education 0.629*** 0.382* -0.236 -0.610*** 0.041** 0.041** -0.020 -0.107***
(0.232) (0.208) (0.197) (0.185) (0.016) (0.021) (0.027) (0.029)
Income -1.376 -0.675 -1.771 -1.334 -0.086 -0.064 -0.049 -0.122
(1.325) (1.402) (1.594) (1.222) (0.066) (0.116) (0.143) (0.164)
Income squared 0.141 0.100 0.477 0.346* 0.008 0.008 0.027 0.041*
(0.198) (0.223) (0.312) (0.198) (0.009) (0.017) (0.021) (0.025)
Constant -0.849 -0.830 -5.009* -7.576** 0.667** 0.465 -0.843** -0.500
(4.020) (3.801) (2.961) (3.242) (0.308) (0.382) (0.364) (0.406)
Observations 352 352 353 350 352 352 353 350
Pseudo R2 / R2 0.120 0.075 0.285 0.359 0.060 0.054 0.310 0.403
Wald χ2 (H0: nullity of coefficients)
32.31*** 23.08** 40.96*** 71.39***
Likelihood ratio test χ2
(H0: nullity of coefficients) 25.47** 24.62** 93.51*** 204.46***
% correct prediction (y=1) 77.91% 52.26% 75.96% 85.79%
% correct prediction (y=0) 61.54% 69.05% 73.85% 78.75%
First stage F-stat on instrument for MM user 51.40*** 51.40*** 51.87*** 50.79***
Kleibergen-Paap Wald rk F-stat (H0:
equation is weakly identified) 51.40 51.40 51.87 50.79
Stock-Yogo critical values (10%) 16.38 16.38 16.38 16.38
Endogeneity test of MM user (H0:
Exogeneity) 2.555 2.175 2.555 2.555
p-value 0.110 0.140 0.110 0.110
Pagan-Hall t-test (H0: homoskedasticity) 24.248** 17.939 31.895*** 30.372***
Note: Dependent variables: save for unpredictable purposes, save for health emergencies, save for predictable events and save to develop an activity are all
dummies. Save for unpredictable purposes equal to 1 if respondents save for health emergencies and/or save for a potential decrease in income, and 0 otherwise.
Save for health emergencies takes the value 1 if respondents indicate to save for health emergencies, and 0 otherwise. Similarly, save for predictable events equal to 1 if respondents save to develop an activity or, save for education or, save to repay a loan and/or save for a ceremony (such as wedding or funeral), and 0
otherwise. Save to develop an activity also takes the value 1 if respondents save to develop an activity, and o otherwise. The variable of interest, MM user is also
a dummy that equal to 1 if respondents use mobile money, and 0 otherwise. The coefficients reported in the table are the log odds of the use of mobile money on saving patterns. To obtain the odds ratio, we simply compute the exponential of log odds. Robust standard errors are in brackets. *** Significant at the 1% level,
** Significant at the 5% level, * Significant at the 10% level.
28 The correlation matrix is provided in the Appendix A.1. Married and age which are highly correlated (0.61) were introduced
alternately in the regression and we obtained similar results.

24
Regarding our control variables, we find that only education matters when considering
columns 1 and 2. Its positive and significant coefficient indicates that increasing the education level
is positively and significantly correlated with the propensity to save for unpredictable purposes or
for health emergencies.
Across the two remaining columns, particularly column 4, the reported results show that
instead of mobile money usage, it is rather the socio-demographic characteristics that are
significantly associated with individual saving behavior for long term objectives such as to develop
an activity. Precisely, we find age, occupation and irregular income to be positively and
significantly related to saving to develop an activity while married, rural and, counterintuitively,
education are negatively and significantly correlated with saving to develop an activity. The
negative and significant coefficient associated with age squared implies a hump-shape relationship
between saving to develop an activity and age. This is consistent with the life-cycle hypothesis
stressing that individuals spread their lifetime consumption over their lives by accumulating
savings during earning years and maintaining consumption levels during retirement. Individuals’
employment status (occupation) gives important information that may determine their saving
behavior. Intuitively, individuals who have a paid activity are more inclined to save than
unemployed people. The results show the coefficient associated with individuals’ employment
status positive and significant. This result implies as expected that individuals having a paid activity
are more likely to save to develop an activity than those without a paid activity. Regarding the
positive and significant coefficient associated with irregular income, it may reflect the behavior of
individuals who care about stabilizing their incomes. This is consistent with the permanent-income
hypothesis assuming that people attempt to maintain a fairly constant standard of living even
though their incomes may vary considerably.
Turning to the control variables that are negatively and significantly associated with saving
to develop an activity, marital situation (married) may reflect the “size effect” which emphasizes
that a household of more than one individual would have less propensity to save to develop an
activity than a single individual. Regarding geographical location (rural), compared to individuals
living in urban area, those living in rural area have lower access to alternative means of saving for
long term purposes as formal financial institutions

25
Table 4. Saving choices and mobile money: Low, irregular vs. High, regular incomes.
Logit regressions IV regressions
Save for health
emergencies Save to develop an
activity Save for health
emergencies Save to develop an
activity
Total effect
Total effect
Total effect
Total effect
(1) (2) (3) (4) (5) (6) (7) (8)
MM user 1.824*** 0.395 0.118** 0.077 (0.672) (0.484) (0.051) (0.061)
Low income 12.731* 8.462 1.195 -1.007
(6.788) (7.175) (0.805) (0.816)
MM user x Low income -1.417* 0.407 -1.207* -0.812* -0.079 0.039 -0.206** -0.130* (0.841) (0.505) (0.658) (0.447) (0.077) (0.058) (0.091) (0.067)
Controls included YES YES YES YES Low income x Controls included YES YES YES YES
Observations 352 350 352 350 Pseudo R2 / R2 0.120 0.422 0.080 0.442 Wald χ2 (H0: nullity of coefficients) 25.25 /
Likelihood ratio test χ2 (H0: nullity of
coefficients) 36.34** 234.84***
% correct prediction (y=1) 86.77% 87.37%
% correct prediction (y=0) 38.10% 76.25%
First stage F-stat on instrument for MM user 495.98*** 505.48***
First stage F-stat (MM user x Low income) 670.67*** 667.87*** Kleibergen-Paap Wald rk F-stat (H0: equation is weakly identified) 9.07 9.02 Stock-Yogo critical values (10%) 7.03 7.03 Endogeneity test of MM user and MM user x Low income (H0: Exogeneity) 2.067 0.172 p-value 0.356 0.917
Pagan-Hall t-test (H0: homoskedasticity) 29.704* 46.977*** Logit regressions IV regressions
Save for health
emergencies
Save to develop an
activity Save for health
emergencies
Save to develop an
activity
Total
effect
Total
effect
Total
effect
Total
effect
(1) (2) (3) (4) (5) (6) (7) (8)
MM user 0.201 0.092 0.033 0.020
(0.539) (0.416) (0.049) (0.062)
Irregular income -9.490 -18.824* -0.688 -2.218** (7.845) (10.336) (0.789) (0.987)
MM user x Irregular income 1.891** 2.092*** -0.807 -0.715 0.107 0.140** -0.120 -0.101 (0.907) (0.729) (0.677) (0.533) (0.074) (0.055) (0.088) (0.062)
Controls included YES YES YES YES Low income x Controls included YES YES YES YES
Observations 352 350 352 350
Pseudo R2 / R2 0.155 0.430 0.103 0.478
Wald χ2 (H0: nullity of coefficients) 34.27* 112.06***
Likelihood ratio test χ2 (H0: nullity of
coefficients) 45.34*** 238.70***
% correct prediction (y=1) 87.10% 87.89%
% correct prediction (y=0) 57.14% 77.50%
First stage F-stat on instrument for MM user 430.97
*** 438.30***
First stage F-stat (MM user x Irregular income) 13.03*** 12.32***
Kleibergen-Paap Wald rk F-stat (H0: equation is weakly identified) 9.63 9.56 Stock-Yogo critical values (10%) 7.03 7.03 Endogeneity test of MM user and MM user x Irregular income (H0: Exogeneity) 2.030 0.581 p-value 0.362 0.748
Pagan-Hall t-test (H0: homoskedasticity) 36.442** 46.644***
Note: Dependent variables: save for health emergencies and save to develop an activity. Save for health emergencies takes the value 1 if respondents indicate to save for health emergencies, and 0 otherwise. Save to develop an activity also takes the value 1 if respondents save to develop an activity, and o otherwise. The
coefficients reported in the table are the log odds of the use of mobile money on saving patterns. To obtain the odds ratio, we simply compute the exponential of log
odds. Robust standard errors are in brackets. Low income individuals are those with less than 50,000 F CFA (around $100US) per month. Irregular income individuals are those who specify having irregular income by answering the following question: “Do you have regular or irregular income?” The responses are
encoded as irregular income = 1, and regular income = 0. Controls included: age, age squared, married, rural, male, occupation, irregular income, at least one person
in charge, education level, income level and income squared. According to the individual-level characteristics used we remove respectively controls income level and income squared, and irregular income. *** Significant at the 1% level, ** Significant at the 5% level, * Significant at the 10% level.

26
are mainly concentrated in urban area. As regards to our counterintuitive result which shows that
education is negatively and significantly linked to the propensity to save in order to develop an
activity, one explanation may be that in our sample highly educated individuals are likely to be
those who are still attending university while less educated individuals are likely to be employed
suggesting that they will comparatively have more inclination to save to develop their activity.
Moreover, highly educated individuals may have better access to credit in formal financial
institutions than less educated individuals as they may be more financially literate. They are hence
more likely to understand the various financial services available to them and do not face
difficulties to fill out loan applications.
Our discussion in the research framework (section 2.2) also stressed how the relationship
between mobile money and saving behavior may depend on particular exogenous characteristics.
Accordingly, in Table 4, we present our results obtained by distinguishing individuals on the basis
of the level and the type of their incomes. Our assumption is that individuals with low or irregular
incomes may find the innovation of mobile money convenient and hence rely more on it to save
than people who benefit from high or regular incomes. Our reported results reject our hypothesis
on low income but confirm that on irregular income. In fact, they show that for low income
individuals, the use of mobile money has no effect on users’ propensity to save for health
emergencies and discloses a slight significant effect (at 10%) but negative on user behavior to save
for developing an activity. By contrast, as far as high income individuals are concerned, our results
show a positive and highly significant coefficient of usage of mobile money on the propensity to
save for health emergencies. These results may therefore suggest the existence of a “threshold
income” effect beyond which the use of mobile money is positively and significantly associated
with saving for health emergencies. Regarding the type of income, we find as expected that the
coefficient associated with our variable of interest (MM user) is positive and significant only for
individuals with irregular incomes indicating that the propensity to save for health emergencies is
8 times higher for mobile money users than for non-mobile money users.
We now consider our remaining set of characteristics that may influence how the usage of
mobile money affects saving. Table 5 takes this into account and distinguishes individuals on the

27
Table 5. Saving choices and mobile money: Low vs. High access to formal financial instruments. Logit regressions IV regressions
Save for health emergencies Save to develop an activity Save for health emergencies Save to develop an activity Total effect Total effect Total effect Total effect
(1) (2) (3) (4) (5) (6) (7) (8)
MM user 0.823 0.043 0.070 0.043
(0.544) (0.468) (0.059) (0.060)
Rural -13.544 -29.023*** -1.176 -1.792*
(9.591) (8.445) (0.928) (1.001)
MM user x Rural 0.218 1.041* -0.466 -0.424 -0.003 0.067 -0.112 -0.069 (0.763) (0.535) (0.650) (0.451) (0.078) (0.050) (0.086) (0.061)
Controls included YES YES YES YES Low income x Controls included YES YES YES YES Observations 352 350 352 350
Pseudo R2 / R2 0.108 0.431 0.076 0.467
Wald χ2 (H0: nullity of coefficients) 40.49** 495.98***
Likelihood ratio test χ2 (H0: nullity of
coefficients) 33.30* 239.11***
% correct prediction (y=1) 84.84% 87.37%
% correct prediction (y=0) 42.86% 79.38%
First stage F-stat on instrument for MM user 482.75*** 481.54***
First stage F-stat (MM user x Rural) 8.05*** 7.87***
Kleibergen-Paap Wald rk F-stat (H0: equation is weakly identified) 8.04 7.85 Stock-Yogo critical values (10%) 7.03 7.03 Endogeneity test of MM user and MM user x Rural (H0: Exogeneity) 1.770 0.806
p-value 0.413 0.668
Pagan-Hall t-test (H0: homoskedasticity) 29.075 40.634**
Logit regressions IV regressions Save for health emergencies Save to develop an activity Save for health emergencies Save to develop an activity Total effect Total effect Total effect Total effect
(1) (2) (3) (4) (5) (6) (7) (8)
MM user -0.017 -0.293 -0.027 -0.023
(0.580) (0.439) (0.054) (0.073)
Female 13.313* -31.173*** 1.272 -1.709**
(6.827) (7.375) (0.784) (0.819)
MM user x Female 2.041** 2.024*** 0.265 -0.027 0.210*** 0.183*** 0.002 -0.021 (0.881) (0.663) (0.644) (0.471) (0.078) (0.057) (0.097) (0.063)
Controls included YES YES YES YES Low income x Controls included YES YES YES YES Observations 352 350 352 350
Pseudo R2 / R2 0.147 0.388 0.105 0.423
Wald χ2 (H0: nullity of coefficients) 42.59*** 395.49***
Likelihood ratio test χ2 (H0: nullity of
coefficients) 43.31*** 218.41***
% correct prediction (y=1) 82.26% 86.32%
% correct prediction (y=0) 47.62% 80.63%
First stage F-stat on instrument for MM user 451.42*** 454.38***
First stage F-stat (MM user x Female) 575.46*** 574.35***
Kleibergen-Paap Wald rk F-stat (H0: equation is weakly identified) 9.00 8.95 Stock-Yogo critical values (10%) 7.03 7.03 Endogeneity test of MM user and MM user x Female (H0: Exogeneity) 2.460 0.264
p-value 0.292 0.876
Pagan-Hall t-test (H0: homoskedasticity) 42.226*** 35.491**
Logit regressions IV regressions Save for health emergencies Save to develop an activity Save for health emergencies Save to develop an activity Total effect Total effect Total effect Total effect
(1) (2) (3) (4) (5) (6) (7) (8)
MM user 0.321 0.036 0.010 0.040
(0.564) (0.430) (0.048) (0.058)
Less educated -19.899** -16.608** -1.236 -2.146**
(7.944) (7.649) (0.780) (0.885)
MM user x Less educated 1.404 1.725** -0.405 -0.369 0.125* 0.135** -0.142 -0.102 (0.905) (0.708) (0.696) (0.547) (0.073) (0.055) (0.095) (0.076)
Controls included YES YES YES YES Low income x Controls included YES YES YES YES Observations 355 353 352 350
Pseudo R2 / R2 0.144 0.420 0.110 0.459
Wald χ2 (H0: nullity of coefficients) 250.04*** 255.12***
Likelihood ratio test χ2 (H0: nullity of
coefficients) 41.78*** 231.74***
% correct prediction (y=1) 88.50% 84.97%
% correct prediction (y=0) 47.62% 81.88%
First stage F-stat on instrument for MM user 409.68*** 427.73***
First stage F-stat (MM user x Less education) 437.21*** 437.08***
Kleibergen-Paap Wald rk F-stat (H0: equation is weakly identified) 12.38 12.40
Stock-Yogo critical values (10%) 7.03 7.03
Endogeneity test of MM user and MM user x Less educated (H0: Exogeneity) 2.984 7.706
p-value 0.225 0.812
Pagan-Hall t-test (H0: homoskedasticity) 30.953 42.194***
Note: Dependent variables: save for health emergencies and save to develop an activity. Save for health emergencies takes the value 1 if respondents indicate to save for health emergencies, and
0 otherwise. Save to develop an activity also takes the value 1 if respondents save to develop an activity, and o otherwise. The coefficients reported in the table are the log odds of the use of mobile
money on saving patterns. To obtain the odds ratio, we simply compute the exponential of log odds. Standard errors are in brackets. Less educated individuals are those with primary education
level or less (about six years of schooling at best). Controls included: age, age squared, married, rural, male, occupation, irregular income, at least one person in charge, education level, income
level and income squared. According to the individual-level characteristics used we remove respectively controls rural, male and education level. *** Significant at the 1% level, ** Significant at
the 5% level, * Significant at the 10% level.

28
basis of their location, gender and education level29. It presents estimates of the relation between
the use of mobile money and the propensity to save for health emergencies and saving to develop
an activity by distinguishing individuals assumed to have low access from those assumed to have
high access to formal financial instruments. Overall, the reported results indicate that while the use
of mobile money does not make any difference in the saving behavior for relatively advantaged
groups (urban, male and highly educated individuals), it does however increase the probability of
saving for health emergencies for disadvantaged groups (rural, female and less educated
individuals in columns 2). More precisely, our findings show that for individuals living in rural
area, female or less educated, the propensity to save for health emergencies is respectively about
3, 6 and 4 times higher for mobile money users than for those who are not.
To sum up, our findings taken altogether show interestingly that mobile money technology
may help bridge the gap between disadvantaged individuals who have less access to formal
financial services and advantaged individuals and may hence foster financial inclusion. Indeed,
mobile money appears to be attractive and appropriate for usually excluded groups (rural, female,
individuals with less education and those who earn irregular incomes) to build their savings to face
unexpected health emergencies30.
6. Why mobile money may increase saving for health emergencies? Discussion of potential
mechanisms
One of our main results shows that a simple use/adoption of the mobile money technology
increases people propensity to save for health emergencies. This result naturally raises the
following question: Why is using mobile money positively and significantly associated with the
propensity to save for health emergencies? – Is it due to the safety, low cost of services, quality
29 Less educated individuals are those who have primary education level at best (about six years of schooling) and
highly educated individuals those with secondary education level or more. 30 Alternatively, in Appendix A.5.2, we use a survey data conducted on 1,000 people in Burkina Faso available in the
Global Financial Inclusion Database (World Bank, 2015) in order to check the robustness of our main findings. While
the GFI dataset allows us to replicate our core analysis, it does not however provide some key individual-level
characteristics such as location or type of income.

29
and/or accessibility of the mobile money? Since our data do not enable us to conclusively answer
this question, we instead discuss in this section some conjectures as to possible answers.
We see two possible reasons why mobile money users are more likely to save for health
emergencies than non-users. The first is that to save for health emergencies individuals need a
saving account that allows them to avoid unneeded expenditures. Individuals hardly resist the
temptation to spend on unnecessary items money they have at hand (Banerjee and Mullainathan
2010) which reduces their propensity to face healthcare expenses. The second explanation may be
that people traditionally rely on saving mechanisms that require high degree of commitment (i.e.
ROSCA) whereas saving for unpredictable events requires easy access to liquidity. Indeed, to
liquidate land or livestock quickly and costlessly when a shock were to occur is not possible.
Therefore, to deal with unanticipated illness shocks people need to save outside these illiquid
assets. Mobile money provides people with an individual account that allows them to deposit it for
free and securely. The networks of mobile money agents who insure cash in and cash out services
allow users to access cash when the need arises. The mobile money providers, however, charge
individuals 1% of the withdrawn amount. It is assumed that when individuals decide to save
through their mobile money account, this involves implicitly their willing to support withdrawal
fees. These fees may therefore play as a soft commitment which benefits individuals with self-
control issues to buildup savings by avoiding unneeded expenditures.
Shefrin and Thaler (1988) show that self-control problems, as a part of a broader set of
time-inconsistent preferences, play a key role when studying saving behavior. Self-control implies
that the trade-off between short term gratification and long term benefits entails a conflict that
manifests through temptations. Individuals usually face “temptation goods” which give utility in
the present but not in the future, and “non-temptation goods” which give utility both in the present
and the future (Banerjee and Mullainathan, 2010). When people, particularly from poor countries
such as Burkina Faso that we study, spend their money in “temptation goods” such as cigarettes,
coffee, and alcohol, it becomes more difficult for them to put aside a portion of their money. Thus,
reducing temptation through a commitment saving product should increase savings and
consequently increase savers’ financial capacity to face unpredictable events. However, the
effectiveness of a saving product in overcoming these barriers depends on the type of commitment
it provides. Dupas and Robinson (2013b) show that simply providing a saving technology with a

30
soft commitment such as a box with a lock and key allows people to buildup savings for health
emergencies. Meanwhile, Ashraf, Karlan and Yin (2010) find that providing individuals with a
high commitment saving product affect people savings. They show that saving product that restricts
withdrawals until people reach a specific goal or a specified month when large expenditures were
expected, for example the beginning of school or Christmas, increased individuals’ savings. These
findings appear to reflect that soft commitment saving devices may be adequate to plan for
unexpected events while a high commitment may be necessary for long term planning savings.
To provide evidence on the potential mechanisms through which mobile money users may
have more propensity to save for health emergencies than non-users, we consider our model (2)
and use the following specification:
iiiiiiii ICICMotivMotivMMuserMotivMMuseryPROB 6543211 (3)
where is the cumulative distribution function of logistic distribution.
We consider the same dependent variable as in equation (2) where iy stands here only for
save for health emergencies. iIC is similar to the vector for controls in equation (1). iMotiv is our
proxy of the independent variable of interest that we define as individuals’ motivations to continue
using or start using the mobile money. It derives from the following question “What are the reasons
that could motivate you to continue using or start using the mobile money?” Each respondent rates
the following five motivations: “A safe place to make deposits”; “Low cost of money transfers”;
“Possibility of money transfers throughout the country”; “Possibility of money transfers within the
sub-region (Ivory Coast)”; “An increase in the number of mobile money agents” using a 5-point
Likert scale ranging from 1 (Not at all important) to 5 (Very important). We compute a dummy
variable for each motivation which takes the value zero when the rating is 1 or 2 (not at all important
and not important), and takes the value one when the rating is 3, 4 or 5 (moderately important,
important or very important)31. The coefficients of interest are 2 and the total effect given by
42 . If 2 and 42 are positive and significant, then mobile money increases propensity to
save for health emergencies irrespective of the strength of the motivation.
31 Table A.2 in the Appendix presents descriptive statistics of the proxy for the five dummy variables.

31
Table 6. Usage and perception of mobile money and saving for health emergencies. Save for health emergencies
Logit regressions IV regressions
Safe place to
make
deposits
Low cost of
money
transfers
Transfers throughout
Burkina
Faso
Transfer within
the sub-
region
(CI)
Increase mobile
money
agent
Safe place
to make
deposits
Low cost
of money
transfers
Transfers throughout
Burkina
Faso
Transfer within
the sub-
region
(CI)
Increase mobile
money
agent
(1) (2) (3) (4) (5) (6) (7) (8) (9) (10)
MM user 0.548 3.574** 0.811 -0.060 1.460 -0.073 0.435 0.221 -0.028 0.129 (1.074) (1.648) (1.890) (1.001) (1.226) (0.116) (0.297) (0.381) (0.116) (0.159)
Safe place to make deposits -6.184 -0.882
(6.949) (0.705)
MM user x Safe place 0.799 0.223*
(1.230) (0.133)
Total effect 1.347** 0.150** (0.600) (0.065)
Low cost of money transfers -0.073 0.098
(0.922) (0.097)
MM user x Low cost -0.688 -0.097 (0.423) (0.079)
Total effect 2.886** 0.340
(1.242) (0.219)
Transfers throughout Burkina
Faso -0.203 0.057
(0.815) (0.095)
MM user x Transfers
throughout Burkina Faso 0.004 -0.039
(0.491) (0.096)
Total effect 0.816 0.182
(1.415) (0.285)
Transfer within the sub-region
(CI) -10.356 -0.790
(8.182) (0.747)
MM user x Transfer within the
sub-region (CI) 1.757 0.199
(1.169) (0.143)
Total effect 1.697*** 0.171**
(0.603) (0.085)
Increase mobile money agent -1.162 -0.057 (0.863) (0.075)
MM user x Increase mobile
money agent -0.202 -0.018
(0.380) (0.047)
Total effect 1.258 0.112 (0.877) (0.114)
Controls included YES YES YES YES YES YES YES YES YES YES
Motivations x Controls included YES YES YES YES YES YES YES YES YES YES Observations 351 350 351 351 351 351 350 351 351 351 Pseudo R2 0.175 0.145 0.126 0.164 0.134 0.123 0.103 0.088 0.112 0.081
Wald χ2 (H0: nullity of
coefficients) 49.79*** 43.30** 39.17** 42.13** 43.45**
Likelihood ratio test χ2 (H0:
nullity of coefficients) 50.52*** 43.18** 38.05** 47.87*** 40.20**
% correct prediction (y=1) 72.49% 72.40% 70.55% 84.47% 66.02%
% correct prediction (y=0) 71.43% 66.67% 64.29% 61.90% 71.43%
First stage F-stat on instrument for MM user 62.20*** 61.35*** 712.15*** 23.68*** 179.51***
First stage F-stat on instrument for MM user x Motivation 7.31*** 25.97*** 577.29*** 5.21*** 47.67*** Kleibergen-Paap Wald rk F-stat 10.96 53.89 2.32 22.64 68.37
Stock-Yogo critical values (10%) 7.03 7.03 7.03 7.03 7.03
Endogeneity test of MM user and MM user x Motivation 2.102 3.423 1.816 4.016 1.336
p-value 0.350 0.181 0.403 0.134 0.513
Pagan-Hall t-test (H0: homoskedasticity) 46.891*** 35.409* 27.725 38.467** 33.447
Note: Dependent variable: Save for health emergencies, is a dummy that takes the value 1 if respondents indicate to save for health emergencies, and 0 otherwise. Robust standard
errors are in brackets. Controls included: age, age squared, married, rural, male, occupation, irregular income, at least one person in charge, education level, income level and
income squared. Table A.2 in the Appendix gives definitions and summary statistics of the independent variables. *** Significant at the 1% level, ** Significant at the 5% level,
* Significant at the 10% level.

32
If 2 is not significant but 42 is positive and significant, then mobile money increases this
propensity only for users with strong motivation.
Our findings (Table 6) show that the coefficients of interest (total effect) related to the
perception of mobile money as a safe place to make deposits and possibility to transfer money
within the sub-region are positive and significant (columns 1 and 4). These findings imply that
perception of mobile money as a safe place to make deposits and capable of facilitating money
transfers within the sub-region (especially Ivory Coast) may be the channels through which the use
of mobile money positively affects the likelihood to save for health emergencies. By contrast, both
coefficients of interest related to the perceptions of mobile money as lowering cost of transfers
being positive and significant (columns 3 and 4), it implies that for this motivation, differences in
the perception do not distinguish mobile money users’ propensity to save for health emergencies.
Mobile money users may cope with emergencies not only through savings but also through
incoming remittances. Unfortunately, the way our survey was designed (the question we ask is
whether individuals save to cope with health emergencies) does not allow us to check this other
possible channel. Nevertheless, we examine and confirm previous evidence regarding the higher
propensity of mobile money users to receive money transfers than non-users (Table 7). Several
studies show that mobile money (i) increases the number and size of remittances by reducing the
cost of money transfers, and (ii) allows mobile money users to face shocks compared to non-users
(Batista and Vicente, 2016; Jack and Suri, 2014; Mbiti and Weil, 2011).
Overall, our findings suggest that one of the main reasons why mobile money users are
more likely to save for health emergencies is because of safety that mobile money provides. These
results support the findings of Dupas and Robinson (2013b) which indicate that providing people
with a safe place to save increases savings for health emergencies. In addition, the possibility to
easily transfer money within the sub-region, especially Ivory Coast, is also a factor that may explain
the gap between mobile money users and non-users propensity to save for health emergencies32.
32 Mobile money transfers within the sub-region especially Ivory Coast is then an important channel for the large
community of Burkinabe immigrants to help family members in case of emergency. For more detail see footnote 4.

33
Table 7. Receiving money transfers and mobile money. Full sample.
Receiving money transfers
Logit regressions IV regressions
(1) (2)
MM user 1.828*** 0.405***
(0.287) (0.051)
Age 0.351*** 0.063***
(0.136) (0.023)
Age squared -0.005*** -0.001***
(0.002) (0.000)
Married -0.018 -0.012
(0.313) (0.056)
Rural -1.086*** -0.201***
(0.310) (0.049)
Male 0.117 0.024
(0.261) (0.045)
Occupation -1.148** -0.191**
(0.523) (0.084)
Irregular income 0.768** 0.128**
(0.313) (0.053)
Person in charge 0.086 0.008
(0.248) (0.044)
Education 0.127 0.013
(0.160) (0.030)
Income 2.353** 0.445***
(0.914) (0.152)
Income squared -0.361** -0.069***
(0.150) (0.026)
Constant -8.391*** -1.035**
(2.397) (0.409)
Observations 374 374
Pseudo R2 / R2 0.202 0.237
Wald χ2 (H0: nullity of coefficients) 63.81***
Likelihood ratio test χ2 (H0: nullity of coefficients) 123.19***
% correct prediction (y=1) 74.90%
% correct prediction (y=0) 66.67%
First stage F-stat on instrument for MM user 55.44***
Kleibergen-Paap Wald rk F-stat (H0: equation is weakly identified) 55.44
Stock-Yogo critical values (10%) 16.38
Endogeneity test of MM user (H0: Exogeneity) 2.297
p-value 0.130
Pagan-Hall t-test (H0: homoskedasticity) 12.909
Note: Dependent variable: Receiving money transfers is a dummy variable that equals 1 if respondents receive money transfers, and 0 otherwise.
Robust standard errors are in brackets. Controls included: age, age squared, married, rural, male, occupation, irregular income, at least one person in charge, education level, income level and income squared. *** Significant at the 1% level, ** Significant at the 5% level, * Significant at the
10% level.

34
7. Conclusion
In Burkina Faso as well as in other less developed countries, limited access to formal
financial services lead people to rely mainly on informal finance. In the presence of predominant
use of informal savings mechanisms, self-insurance against unexpected life events such as health
shocks can be unmet. This may lower productivity which in turn negatively impacts the economic
activity and growth. In this context, providing people with a convenient device to save can reduce
their vulnerabilities to health emergencies. In low income countries, financial access have
important implications on people well-being and poverty reduction.
The objective of this paper is to analyze the impact of mobile money as a soft commitment
device on saving behavior. We use an original dataset from a survey we conducted in Burkina Faso
using 50% of mobile money users and 50% of non-users. Our results are consistent with previous
findings on the effects of soft commitment devices on the propensity to save for health
emergencies. In line with Dupas and Robinson (2013b), we find that the use of mobile money
increases the likelihood of individuals to save for health emergencies. Indeed, mobile money users
are more prone to save for unexpected health shocks than non-users, while there is no difference
between users and non-users of mobile money to save for predictable events. Taking into account
disparities in financial access, we show that mobile money increases the propensity of rural, female,
less educated and individuals with irregular income to save for health emergencies. In our further
investigations, we address the issue about the possible mechanisms or pathways through which
using mobile money helps increase the propensity to save for health emergencies. We find that
safety and the possibility to transfer money within the sub-region associated with mobile money to
count among possible explanations.
The potential for mobile technology and mobile money specifically to transform the lives
of the poor, while palpable, is so far little documented. Governments and especially Central Banks
in developing countries have done a lot in this sense to increase the supply of mobile money
services throughout the country. However, despite these efforts, mobile money adoption remains
low in some countries such as Burkina Faso compared to the success in Kenya or that of the
neighbor Ivory Coast. This low adoption may stem from the existing inconsistencies of legal and
regulatory framework of electronic money system in Burkina Faso (Musuku et al., 2011). Hence,
putting in place consistent policy and regulatory reforms that cover all mobile money services and
providers may foster mobile money system development and improve formal financial inclusion.

35
Moreover, specific strategies are needed to increase the access and usage of mobile money. One
leverage on which Central Banks may act is through the expansion of electronic money issuers and
retailer agents. By doing so, it may reinforce competitiveness in the financial system and hence
reduce costs and increase efficiency. The involvement of governments in the development of
mobile money can also increase the confidence of the population to adopt this new financial
innovation. More specifically, partnerships could be established between governments and mobile
money issuers for employee’s payments and for the collection of taxes. The traceability of the
various operations conducted through mobile money could also be put forward for the credibility
of this new system.
Nevertheless, a key outstanding question left for future investigation is what this innovative
savings product would do to existing use of financial mechanisms such as the use of informal and
formal finance. An empirical study of De Koker and Jentzsch (2013) on the role of transparency in
the usage of formal or informal finance in eight African countries finds that a share of the
population continues to use informal services despite being “financially included” customers.
Hence, an increase in access to formal services such as mobile banking does not necessarily result
in an immediate reduction of usage of informal services. Future research is needed to provide
evidence on the role of mobile money as a complement or substitute of formal and/or informal
finance.
36
References
Aker, J. C. and Isaac M. Mbiti (2010) “Mobile Phones and Economic Development in Africa.”
Journal of Economic Perspectives 24(3):207–32.
Allen, F., C. Elena, C. Robert, Q. Jun, S. Lemma and V. Patricio (2014) “The African Financial
Development and Financial Inclusion Gaps.” Journal of African Economies 23(5):614–42.
Ambec, S. and N. Treich (2007) “Roscas as Financial Agreements to Cope with Self-Control
Problems.” Journal of Development Economics 82:120–37.
Angrist J. D. and J. S. Pischke (2008) “Mostly Harmless Econometrics : An Empiricist ’ S
Companion.” Massachusettts I nstitute of Technology and The London school of Economics
(March):290.
Ashraf, N., D. Karlan and W. Yin (2010) “Female Empowerment: Impact of a Commitment
Savings Product in the Philippines.” World Development 38:333–44.
Banerjee, A. and S. Mullainathan (2010) “The Shape of Temptation: Implications for the Economic
Lives of the Poor.” National Bureau of Economic Research Working Paper Series 1–49.
Banerjee, A. and E. Duflo (2007) “The Economic Lives of the Poor.” Journal of Economic
Perspectives 21(1):1–22.
Batista, C. and P. C. Vicente (2016) “Introducing Mobile Money in Rural Mozambique: Evidence
from a Field Experiment.” Working Paper.
Baum, C. F., M. E. Schaffer and S. Stillman (2007) “Enhanced Routines for Instrumental
Variables/generalized Method of Moments Estimation and Testing.” The Stata Journal
7(4):465–506.
Banque Centrale des Etats de l'Afrique de l'Ouest (BCEAO). 2011. Rapport Annuel de La
Commission Bancaire.
Beck, T., A. Demirgüç-Kunt and P. Honohan (2009) “Access to Financial Services: Measurement,
Impact, and Policies.” World Bank Research Observer 24:119–45.
Blumenstock, J. E., M. Callen and L. Koepke (2015) “Promises and Pitfalls of Mobile Money in
Afghanistan : Evidence from a Randomized Control Trial.” Working Paper, Washington
University.
Chowa, G., R. Masa and M. Sherraden (2012) “Wealth Effects of an Asset-Building Intervention
Among Rural Households in Sub-Saharan Africa.” Journal of the Society for Social Work and
Research 3(4):329–45.
Christen, B. and I. Mas (2009) “It’s Time to Address the Microsavings Challenge, Scalably.”
Enterprise Development and Microfinance 20:274–85.

37
Collins, D., J. Morduch, S. Rutherford and O. Ruthven (2009) Portfolios of the Poor: How the
World’s Poor Live on $2 a Day. Princeton University Press.
Consortium on Financial Systems and Poverty. 2013. “The Rise and Impact of M-PESA.” Research
Brief 1:1–8.
Demirguc-kunt, A. and L. Klapper (2012) “Measuring Financial Inclusion. The Global Findex
Database.’’ Policy research working paper, World Bank 6025(April):1–61.
Demirgüç-Kunt, A., L. Klapper and D. Singer (2013) “Financial Inclusion and Legal
Discrimination against Women: Evidence from Developing Countries.” World Bank Policy
Working Paper 6416 (April).
Demombynes, G. and A. Thegeya (2012) “Kenya’s Mobile Revolution and the Promise of Mobile
Savings.” World Bank Policy Research Working Paper 5988 (March).
Dermish, A., C. Kneiding, P. Leishman and I. Mas (2012) “Branchless and Mobile Banking
Solutions for the Poor : A Survey of the Literature.” Innovations: Technology, Governance,
Globalization 6(4):81–98.
Dupas, P., S. Green, A. Keats and J. Robinson (2012) “Challenges in Banking the Rural Poor:
Evidence from Kenya’s Western Province.” NBER Working Paper No. 17851.
Dupas, P. and J. Robinson (2013a) “Savings Constraints and Microenterprise Development:
Evidence from a Field Experiment in Kenya.” American Economic Journal: Applied
Economics 5(1):163–92.
Dupas, P. and J. Robinson (2013b) “Why Don’t the Poor Save More? Evidence from Health
Savings Experiments.” American Economic Review 103:1138–71.
Eijkman, F., J. Kendall and I. Mas (2010) “Bridges to Cash: The Retail End of M-Pesa.” Savings
and Development 34(2):219–52.
Freedman, D. A. (2006) “On The So-Called ‘Huber Sandwich Estimator’ and ‘Robust Standard
Errors.’” The American Statistician 60(4):299–302.
Garg, N. (2011) “Pricing for E/M-Banking.” MicroSave Briefing Note # 107 1–2.
Hulme, D., K. Moore and A. Barrientos (2009) “Assessing the Insurance Role of Microsavings.”
DESA Working Paper 83.
Jack, W. and T. Suri (2011) “Mobile Money : The Economics of M-PESA 1.” National Bureau of
Economic Research Working Paper 16721 1–30.
Jack, W. and T. Suri (2014) “Risk Sharing and Transactions Costs: Evidence from Kenya’s Mobile
Money Revolution.” American Economic Review 104:183–223.
Karlan, D. and J. Morduch (2009) “Access to Finance.” NYU Wagner Research Paper No. 2011-

38
03. 1–86.
Karlan, D., A. L. Ratan and J. Zinman (2014) “Savings by and for the Poor: A Research Review
and Agenda.” Review of Income and Wealth 60(1):36–78.
Kendall, J. (2010) “A Penny Saved: How Do Savings Accounts Help the Poor?” Financial Access
Initiative, Focus Note (2005):1–22.
De Koker, L. and N. Jentzsch (2013) “Financial Inclusion and Financial Integrity: Aligned
Incentives?” World Development 44:267–80.
Lonie, S., M. Martinez and R. Oulai (2013) “Overview of COTE D ’ IVOIRE: Mobile Financial
Services Market Data 2013.” International Finance Corporation, World Bank Group.
Lusardi, A. and O. S. Mitchell (2014) “The Economic Importance of Financial Literacy : Theory
and Evidence.” Journal of Economic Literature 52(1):5–44.
Mas, I. (2010) “Savings for the Poor.” World Economics 11(4):1–12.
Mas, I. and K. Kumar (2008) “Banking on Mobiles: Why, How, for Whom?” Consultative Group
to Assist the Poor, Focus Note, No. 48 (June):1–28.
Mas, I. and C. Mayer (2011) “Savings as Forward Payments : Innovations on Mobile Money
Platforms.” Forthcoming as Chapter 10 in “Financial inclusion for poverty alleviation:
Banking on the unbanked.” Essam Yassin Mohammed and Zenebe Bashaw Uraguchi (eds).
London: Routledge. (September):1–14.
Mbarathi, N. and D. Kathleen (2014) "Savings and Mobile Banking Services amongst Poor Women
within Kenya’s Rural Agricultural Sector."
Mbiti, I. and D. Weil (2011) “Mobile Banking: The Impact of M-Pesa in Kenya.” NBER Working
Paper No. 17129.
Mbiti, I. and D. N. Weil (2011) “Mobile Banking: The Impact of M-PESA in Kenya.” National
Bureau of Economic Research.
Mbiti, I. and D. N. Weil (2013) “The Home Economics of E-Money: Velocity, Cash Management,
and Discount Rates of M-Pesa Users.” American Economic Review 103(3):369–74.
Morawczynski, O. (2009) “Saving Through the Mobile Phone - The Case of M-PESA.”
MicroBanking Bulletin (19):7–14.
Morawczynski, O. and M. Pickens (2009) “Poor People Using Mobile Financial Services:
Observations on Customer Usage and Impact from M-PESA.” Consultative Group to Assist
the Poor (August).
Munyegera, G. K. and T. Matsumoto (2016) “Mobile Money, Remittances, and Household
Welfare: Panel Evidence from Rural Uganda.” World Development 79:127–37.

39
Musuku, T. B., M. Chiara and A. M. Mason (2011) “Lowering the Cost of Payments and Money
Transfers in UEMOA Africa Trade Policy Notes.” World Bank, Africa Trade Policy Notes,
Notes #23 1–9.
Ondiege, P. (2010) “Mobile Banking in Africa : Taking the Bank to the People.” Africa Economic
Brief 1(8).
Rutherford, S. (2002) “Money Managers: The Poor and Their Savings.” MicroSave Briefing Note
# 13 1–2.
Shefrin, H. M. and R. H. Thaler (1988) “The Behavioral Life-Cycle Hypothesis.” Economic
Inquiry 26(4):609–43.
Smets, P. (2000) “ROSCAs as a Source of Housing Finance for the Urban Poor: An Analysis of
Self-Help Practices from Hyderabad, India.” Community Development Journal 35(1):16–30.
The World Bank Group (2015) Data (online), www.data.worldbank.org
The Global Financial Inclusion (Global Findex) Database, World Bank Group (2015).
www.datatopics.worldbank.org
Wooldridge, J. M. (2002) “Econometric Analysis of Cross Section and Panel Data.” The MIT
Press.

40
Appendix
Table A.1. Correlation matrix for the full sample.
Save for
unpredictable
events
Save for
health
emergencies
Save for
predictable
purposes
Save to
develop an
activity
MM user
Distance Age Age
squared Married Rural Male Occupation
Irregular income
At least one
person in
charge
Education Income Income squared
Save for
unpredictable events
1
Save for
health
emergencies
0.768 1
Save for
predictable purposes
-0.006 0.076 1
Save to develop an
activity
-0.108 -0.043 0.534 1
MM user 0.146 0.151 -0.089 -0.086 1
Distance -0.088 -0.096 0.127 0.069 -0.888 1
Age 0.074 0.125 0.208 0.184 -0.027 0.043 1
Age squared 0.068 0.115 0.200 0.154 -0.045 0.060 0.990 1
Married 0.066 0.088 0.132 0.102 0.131 -0.070 0.607 0.579 1
Rural 0.010 0.064 -0.055 0.041 0.146 -0.088 0.251 0.245 0.226 1
Male 0.028 0.026 0.020 0.030 0.007 0.009 0.267 0.254 0.107 0.032 1
Occupation -0.048 0.083 0.256 0.390 -0.078 0.069 0.430 0.384 0.348 0.158 0.114 1
Irregular
income -0.081 -0.006 0.211 0.472 0.042 -0.030 0.100 0.080 0.105 0.302 -0.096 0.197 1
At least one
person in charge
0.036 0.002 0.061 0.056 0.107 -0.097 -0.002 -0.009 0.024 -0.030 -0.008 0.047 0.015 1
Education 0.143 0.074 -0.051 -0.336 0.162 -0.126 -0.147 -0.139 -0.169 -0.227 0.017 -0.391 -0.358 -0.013 1
Income -0.001 0.069 0.206 0.179 0.071 -0.043 0.441 0.426 0.358 -0.052 0.271 0.342 -0.131 0.055 0.127 1
Income
squared 0.007 0.070 0.201 0.172 0.070 -0.047 0.427 0.417 0.349 -0.078 0.255 0.297 -0.145 0.063 0.135 0.976 1
Note: Distance is our excluded instrument, the distance to the nearest mobile money agent, that we measure using a 5-point Likert scale, 1 (less than 1 km), 2 (1 to 2 km), 3 (2 to 5 km), 4 (5 to 10 km) and 5 (more than 10 km).
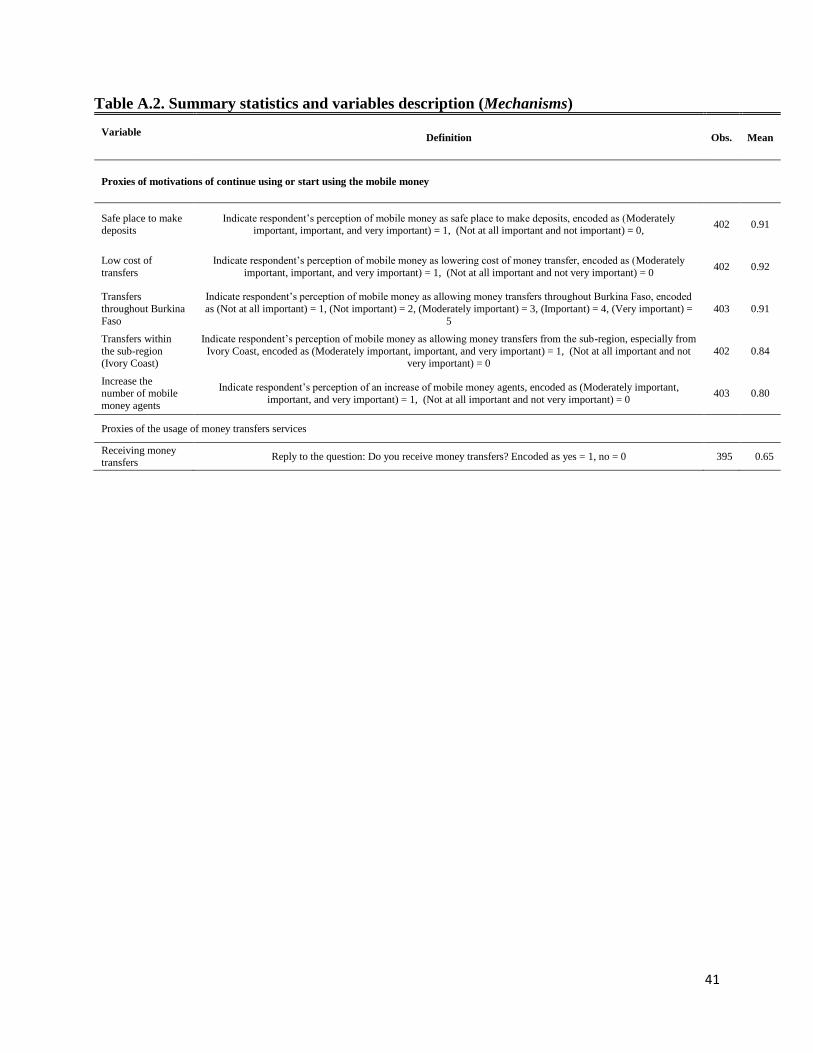
41
Table A.2. Summary statistics and variables description (Mechanisms)
Variable Definition Obs. Mean
Proxies of motivations of continue using or start using the mobile money
Safe place to make deposits
Indicate respondent’s perception of mobile money as safe place to make deposits, encoded as (Moderately important, important, and very important) = 1, (Not at all important and not important) = 0,
402 0.91
Low cost of
transfers
Indicate respondent’s perception of mobile money as lowering cost of money transfer, encoded as (Moderately
important, important, and very important) = 1, (Not at all important and not very important) = 0 402 0.92
Transfers
throughout Burkina
Faso
Indicate respondent’s perception of mobile money as allowing money transfers throughout Burkina Faso, encoded
as (Not at all important) = 1, (Not important) = 2, (Moderately important) = 3, (Important) = 4, (Very important) =
5
403 0.91
Transfers within
the sub-region (Ivory Coast)
Indicate respondent’s perception of mobile money as allowing money transfers from the sub-region, especially from
Ivory Coast, encoded as (Moderately important, important, and very important) = 1, (Not at all important and not very important) = 0
402 0.84
Increase the number of mobile
money agents
Indicate respondent’s perception of an increase of mobile money agents, encoded as (Moderately important,
important, and very important) = 1, (Not at all important and not very important) = 0 403 0.80
Proxies of the usage of money transfers services
Receiving money transfers
Reply to the question: Do you receive money transfers? Encoded as yes = 1, no = 0 395 0.65
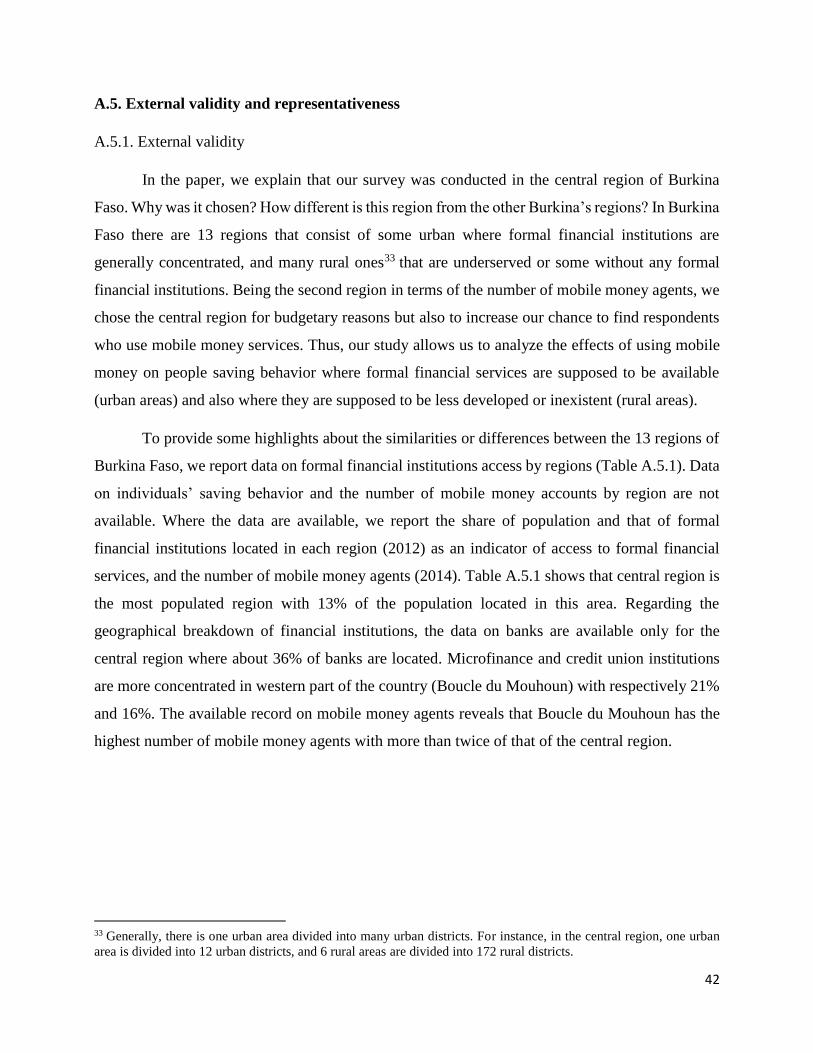
42
A.5. External validity and representativeness
A.5.1. External validity
In the paper, we explain that our survey was conducted in the central region of Burkina
Faso. Why was it chosen? How different is this region from the other Burkina’s regions? In Burkina
Faso there are 13 regions that consist of some urban where formal financial institutions are
generally concentrated, and many rural ones33 that are underserved or some without any formal
financial institutions. Being the second region in terms of the number of mobile money agents, we
chose the central region for budgetary reasons but also to increase our chance to find respondents
who use mobile money services. Thus, our study allows us to analyze the effects of using mobile
money on people saving behavior where formal financial services are supposed to be available
(urban areas) and also where they are supposed to be less developed or inexistent (rural areas).
To provide some highlights about the similarities or differences between the 13 regions of
Burkina Faso, we report data on formal financial institutions access by regions (Table A.5.1). Data
on individuals’ saving behavior and the number of mobile money accounts by region are not
available. Where the data are available, we report the share of population and that of formal
financial institutions located in each region (2012) as an indicator of access to formal financial
services, and the number of mobile money agents (2014). Table A.5.1 shows that central region is
the most populated region with 13% of the population located in this area. Regarding the
geographical breakdown of financial institutions, the data on banks are available only for the
central region where about 36% of banks are located. Microfinance and credit union institutions
are more concentrated in western part of the country (Boucle du Mouhoun) with respectively 21%
and 16%. The available record on mobile money agents reveals that Boucle du Mouhoun has the
highest number of mobile money agents with more than twice of that of the central region.
33 Generally, there is one urban area divided into many urban districts. For instance, in the central region, one urban
area is divided into 12 urban districts, and 6 rural areas are divided into 172 rural districts.

43
Table A.5.1. Access to formal financial services by region in Burkina Faso.
Region
Population Banks Microfinance Credit union Mobile money
agents
2012 2014
Boucle du
Mouhoun 10% Na 21% 16% 238
Cascades 4% Na 2% 5% na
Centre 13% 36% 9% 12% 152
Centre-Est 8% Na 4% 10% na
Centre-Nord 8% Na 7% 5% na
Centre-Ouest 8% Na 10% 5% na
Centre-Sud 4% Na 7% 2% na
Est 9% Na 5% 8% 34
Hauts-Bassins 11% Na 12% 13% na
Nord 8% Na 9% 9% 43
Palreau-Central 5% Na 2% 3% na
Sahel 7% Na 10% 6% na
Sud-Ouest 4% Na 3% 6% na
Source: Ministère de l’Economie et des Finances, 2014. The number of mobile money agents is provided by the mobile money provider Airtel
money as of 2014. The terminology “Central region” used throughout the paper corresponds to the region “Centre” of this Table.

44
A.5.2. Impact of mobile money on individuals’ saving behavior using an alternative source of
data.
We use a survey data conducted on 1,000 people in Burkina Faso available in the Global
Financial Inclusion Database (World Bank, 2015) in order to check the robustness of our main
findings. While the database has the advantage of covering the whole country34, it remains limited
in providing individual-level characteristics such as location or type of income but allows us to
replicate our core analysis.
Table A.5.2 presents the results. We use a logit model that mimics our equations (1) and
(2) and two dependent variables for save for emergency and save to develop an activity. While the
survey does not precisely identify savings for health emergencies, we define a proxy, save for
emergency, indicating how individuals cope with an emergency. This proxy is a dummy variable
that equals to one if respondents indicate that it is very possible to come up with emergency funds
through savings, and equals to zero otherwise. For the second dependent variable, save to develop
an activity, we define a proxy that indicates if individuals save to start, operate, or grow a business
or farm. This proxy is also a dummy that equals to one if respondents indicate that they saved to
start, operate, or grow a business or farm, and equals to zero otherwise. We control for age, gender,
education level, and income quintile. Due to lack of data, we only examine the heterogeneity of
effects of mobile money on individuals’ saving behavior by considering low vs. high income,
female vs. male, and less vs. highly educated individuals.
Overall, consistent with our findings, the results show that the use of mobile money
increases the propensity of individuals to save for emergencies. The results also show that mobile
money increases the propensity to save for emergencies especially for female and less educated
individuals supporting our findings on disadvantaged groups.
34 Individual probability weights are used to make the sample nationally representative.

45
Table A.5.2. Saving choices and mobile money: using Global Financial Inclusion Database. Save for health emergencies
Full sample
Low vs. High income Female vs. Male Less vs. Highly educated
Total
effect Total
effect Total
effect (1) (2) (3) (4) (5) (6) (7)
MM user 0.945** 0.829** 0.357 0.389 (0.378) (0.405) (0.450) (0.473)
Individuals’ characteristics 1.323 -1.685 -0.585
(1.705) (1.963) (1.956)
MM user x Individuals’
characteristics 0.215 1.044 1.123 1.480** 0.910 1.299**
(0.802) (0.692) (0.780) (0.637) (0.765) (0.601)
Controls included YES YES YES YES
Individuals’ characteristics
x Controls included YES YES YES YES
Observations 846 846 846 846
Pseudo R2 0.078 0.071 0.082 0.085
Wald χ2 (H0: nullity of
coefficients) 43.26*** 47.60*** 44.00*** 70.98***
Likelihood ratio test χ2 (H0: nullity of coefficients)
166.44*** 160.24*** 170.35*** 172.92***
Save to develop an activity
Full sample
Low vs. High income Female vs. Male Less vs. Highly educated
Total
effect Total
effect Total
effect (1) (2) (3) (4) (5) (6) (7)
MM user 0.425 -0.433 0.987* 0.929** (0.473) (0.474) (0.586) (0.473)
Individuals’ characteristics -1.543 -3.091 0.487
(2.367) (2.656) (4.245)
MM user x Individuals’
characteristics 2.016** 1.583** -1.392 -0.405 -0.802 0.127
(0.921) (0.789) (1.005) (0.816) (0.875) (0.736)
Controls included YES YES YES YES
Individuals’ characteristics x Controls included
YES YES YES YES
Observations 999 999 999 999
Pseudo R2 0.096 0.099 0.102 0.098
Wald χ2 (H0: nullity of
coefficients) 55.40*** 44.43*** 56.94*** 81.45***
Likelihood ratio test χ2 (H0: nullity of coefficients)
82.24*** 84.66*** 87.40*** 83.71***
Note: Dependent variables: save for emergency and save to develop an activity are all dummies. Save for emergency equals to 1 if respondents
indicate coming up with emergency funds through savings, and 0 otherwise. Save to develop an activity equals to 1 if respondents indicate save to
start, operate, or grow business or farm, and 0 otherwise. The variable of interest, MM user is a binary variable that takes the value 1 if respondents has mobile money account, and 0 otherwise. To obtain the odds ratio, we simply compute the exponential of log odds. Robust standard errors are in
brackets. Controls included: age, age squared, female, education level, income quintile and income quintile squared. According to the individual-
level characteristics we remove respectively controls income quintile and income quintile squared, female and education level. *** Significant at the 1% level, ** Significant at the 5% level, * Significant at the 10% level.
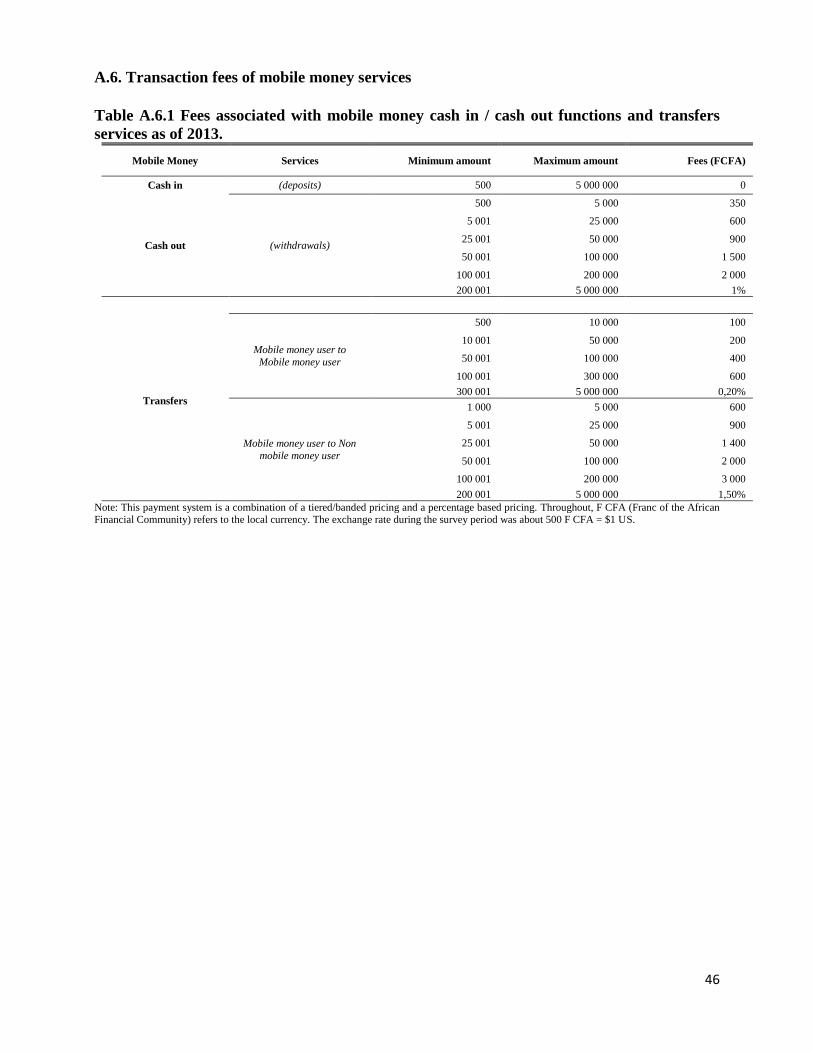
46
A.6. Transaction fees of mobile money services
Table A.6.1 Fees associated with mobile money cash in / cash out functions and transfers
services as of 2013.
Mobile Money Services Minimum amount Maximum amount Fees (FCFA)
Cash in (deposits) 500 5 000 000 0
Cash out (withdrawals)
500 5 000 350
5 001 25 000 600
25 001 50 000 900
50 001 100 000 1 500
100 001 200 000 2 000
200 001 5 000 000 1%
Mobile money user to
Mobile money user
500 10 000 100
10 001 50 000 200
50 001 100 000 400
100 001 300 000 600
Transfers 300 001 5 000 000 0,20%
Mobile money user to Non
mobile money user
1 000 5 000 600
5 001 25 000 900
25 001 50 000 1 400
50 001 100 000 2 000
100 001 200 000 3 000
200 001 5 000 000 1,50%
Note: This payment system is a combination of a tiered/banded pricing and a percentage based pricing. Throughout, F CFA (Franc of the African Financial Community) refers to the local currency. The exchange rate during the survey period was about 500 F CFA = $1 US.

47
Table A.7. Access to financial services. Burkina Faso Sub-Saharan Africa Low income
Account (% age 15+)
All adults 14.4 34.2 27.5
Women 12.6 29.9 23.9
Adults belonging to the poorest 40% 8.9 24.6 19.4
Adults living in rural area 13.0 29.2 24.8
Financial institution account (% age 15+)
All adults 13.4 28.9 22.3
Mobile account (% age 15+)
All adults 3.1 11.5 10.0
Domestic remittances in the past year (% age 15+)
Sent remittances 18.5 28.7 18.3
Receive remittances 26.7 37.2 25.6
Savings in the past year (% age 15+)
Saved at a financial institution 8.7 15.9 9.9
Saved using a savings club or person outside the family 18.0 23.9 16.3
Saved any money 50.8 59.6 46.5
Saved for a farm or business 15.3 22.7 16.7
Source: Global Financial Inclusion (Global Findex) Database, World Bank, 2015. Account denotes the percentage of respondents who report having
an account (by themselves or together with someone else) at a bank or another type of financial institution or report personally using a mobile money service in the past 12 months.