Does Media Coverage of Stocks Affect Mutual Funds’ Trading...
44
- 1 - Does Media Coverage of Stocks Affect Mutual Funds’ Trading and Performance? November, 2011 Lily H. Fang INSEAD Joel Peress INSEAD Lu Zheng University of California, Irvine Abstract We study the relation between mutual fund trades and mass-media coverage of stocks. Stocks receiving media coverage are more heavily bought by funds in the aggregate. Funds exhibit heterogeneity in their propensity to buy media-covered stocks, and this propensity is negatively related to future fund performance. Funds in the highest propensity decile underperform funds in the lowest propensity decile by 1.5% to 2% per year. These results do not extend to fund sells, likely due to funds’ inability to sell short. Funds with high propensity to buy media-coverage stocks do so persistently. These results suggest that professional investors are subject to limited attention, and such behavior harms their investment performance. The paper was previously circulated under the title “Stock media coverage, mutual fund trading and performance”. We thank seminar participants at the 2011 AFA meeting, INSEAD, and Hong Kong University for helpful comments. We thank William Fisk, Shirish Tatikonda, Pradeed Mittal, Ananda Kumar, Sriram Ganesan, and Sriram Subramaniam for assistance with the data collection process. Huiping Zhang and Chunmei Lim provided excellent research assistance. Lily H. Fang is at INSEAD; email: [email protected]. Joel Peress is at INSEAD; email: [email protected]. Lu Zheng is at Paul Merage School of Business, University of California, Irvine; email: [email protected].
Transcript of Does Media Coverage of Stocks Affect Mutual Funds’ Trading...
- 1 -
Does Media Coverage of Stocks Affect Mutual Funds’ Trading and Performance?
November, 2011
Lily H. Fang INSEAD
Joel Peress INSEAD
Lu Zheng University of California, Irvine
Abstract
We study the relation between mutual fund trades and mass-media coverage of stocks. Stocks receiving media coverage are more heavily bought by funds in the aggregate. Funds exhibit heterogeneity in their propensity to buy media-covered stocks, and this propensity is negatively related to future fund performance. Funds in the highest propensity decile underperform funds in the lowest propensity decile by 1.5% to 2% per year. These results do not extend to fund sells, likely due to funds’ inability to sell short. Funds with high propensity to buy media-coverage stocks do so persistently. These results suggest that professional investors are subject to limited attention, and such behavior harms their investment performance.
The paper was previously circulated under the title “Stock media coverage, mutual fund trading and performance”. We thank seminar participants at the 2011 AFA meeting, INSEAD, and Hong Kong University for helpful comments. We thank William Fisk, Shirish Tatikonda, Pradeed Mittal, Ananda Kumar, Sriram Ganesan, and Sriram Subramaniam for assistance with the data collection process. Huiping Zhang and Chunmei Lim provided excellent research assistance. Lily H. Fang is at INSEAD; email: [email protected]. Joel Peress is at INSEAD; email: [email protected]. Lu Zheng is at Paul Merage School of Business, University of California, Irvine; email: [email protected].

- 2 -
Introduction
Mass media disseminates information to a broad audience, much more so than traditional
corporate channels such as company disclosures or analyst reports. Thus, mass media coverage
is a good proxy for the amount of attention market participants pay to a particular event, even if
it does not contain the latest news. In fact, corporate news is typically first released on business
newswires and often appears in mass media only with a delay. The recent literature provides
increasing evidence of a connection between media and the stock market.1 Does mass media
coverage affect the investment behavior of professional investors? In this paper, we investigate
how the media coverage of stocks affects mutual funds’ trading and performance. Specifically,
we analyze funds’ propensity to buy and sell stocks covered by the media. We then examine
whether the cross-sectional variation in this propensity predicts fund performance.
It is easy to see how individual investors’ investment decisions may be influenced by the
media. Buying and selling a stock involve a sequence of decisions that require the investor’s
attention, a scarce cognitive resource (Kahneman (1973)). After all, an investor is unlikely to
“pull the trigger” on a stock trade unless he has paid some attention to the stock. For individual
investors who typically lack the capabilities to learn about many securities, media coverage can
play a significant role in familiarizing them with certain stocks and putting these stocks on their
radar screen. There is increasing evidence that individual investors are more likely to trade
“attention grabbing” stocks such as those featured in the media (e.g., Barber and Odean (2008)).
How mass media affects the behaviors of mutual fund managers, however, is much less
clear. Due to lead-times in the editorial process, mass print media—in contrast to professional
newswires—is unlikely to convey genuine news to the market. In an efficient market, fund
1 Fang and Peress (2009), Tetlock (2011), and Engelberg et al (2011) are examples of a growing literature that examines the relation between media coverage and the stock market. Section 1 contains a more detailed literature review.

- 3 -
managers are thus unlikely to be able to generate superior returns by reacting to articles in The
Wall Street Journal, for example, and as such, their trades and performance may not be related to
mass-media coverage at all. This is our null hypothesis.
On the other hand, moving away from informational efficiency, there are two opposing
reasons why professional traders may favor highly covered stocks. First, if fund managers—like
retail investors—suffer from limited attention, then their investment decisions could be
influenced by “attention-grabbing” media coverage. Identifying stocks to buy from thousands of
potential names involves a high search cost. By drawing attention to the mentioned stocks, mass
media lowers the search cost associated with these stocks, making investors more likely to trade
them than those out of the media lime light. But because such trading behavior is not motivated
by superior information and instead reflects a shortage of cognitive resources, we expect this
trading pattern to be associated with inferior investment performance. We call this the “limited
attention hypothesis”. Under this hypothesis, we also expect the correlation between media
coverage and trades to be stronger for buys than for sells, because of the presence of short-sale
constraints: while the manager needs to identify buy opportunities from the universe of listed
stocks, he can only sell what is already in his portfolio, a much smaller set for which limited-
attention should be less of a problem.
Alternatively, fund managers may attempt to exploit behavioral biases exhibited by less
sophisticated investors, such as individuals, who trade mostly attention-grabbing stocks heavily
covered by the media. If such attention-driven trades lead to price anomalies, then fund
managers may rationally concentrate their trades in the same high-coverage stocks in order to
profit from the mispricing. In this case, as with the limited attention hypothesis, we expect fund
managers to buy and sell high-coverage stocks more than low-coverage stocks. But in this
- 4 -
instance, the trading pattern should be associated with superior fund performance. We label this
the “smart funds hypothesis”. Note that it is not clear a priori how the correlation between
trades and stocks’ media coverage will differ between buys and sells under this hypothesis. On
the one hand, high-coverage stocks tend to earn lower returns on average than low-coverage
stocks (Fang and Peress (2009)), which suggests that sophisticated investors on the look for
pricing anomalies will probably find more sell than buy opportunities involving high-coverage
stocks. On the other hand, the short sale constraints inhibit funds’ ability to fully implement a
strategy of selling stocks to exploit any potential overpricing.
In this paper, we examine whether mutual fund trades are related to media coverage of
stocks, and if so, how this impacts fund performance. We have two main empirical findings.
First, in the aggregate, funds’ buys are significantly affected by stocks’ media coverage: stocks
receiving more media coverage tend to be bought more heavily by funds, even after controlling
for size and a number of other stock characteristics that have previously been shown to influence
funds’ trades. Funds’ sells, on the other hand, are not significantly related to stocks’ media
coverage.
Second, funds exhibit heterogeneity in their propensity to buy highly-covered stocks.
When we sort funds on their propensity to buy media stocks (“buy media” for short), we find a
negative relation between this propensity and fund performance. Funds in the highest propensity
decile underperform funds in the lowest decile by 1.5% to 2% per year depending on the
performance metric used. High-propensity funds also significantly underperform passive
benchmark models, whereas low-propensity funds do not. In other words, mutual funds’
underperformance relative to passive benchmarks is concentrated among funds that display a
high propensity to buy media stocks. These findings support the limited attention hypothesis.

- 5 -
These results mainly pertain to funds’ buys, but not to their sells. Funds’ propensity to
sell media stocks (“sell media” for short) is largely unrelated to their performance. This
asymmetry between buys and sells is also consistent with the limited attention hypothesis and
could be related to funds’ short-sale constraints which makes the search cost for sells lower than
that for buys.
Further supporting the notion that a high propensity to buy media stocks reflects a lack of
cognitive resources, we find that this propensity is relatively persistent: The top 20% of funds
with the highest propensity to buy media continue to display a higher propensity in the five years
after initial sorting. An additional test shows that the negative relation between funds’
propensity to buy media and future fund performance is due to funds’ buying high-media
coverage stocks rather than merely holding these stocks.
Overall, our findings are consistent with the notion that even professional investors suffer
from limited attention: their preference for buying high-coverage stocks reflects limited attention,
and such behavior hurts their investment performance. This observation contributes to our
understanding of the connections between the media and capital markets. Several papers
document that the overall amount of attention a stock receives affects its valuation (e.g.
DellaVigna and Pollet (2009), Hirshleifer et al. (2009), Fang and Peress (2009)). But so far,
attention-driven trading has mainly been established for individual investors, who collectively
have a limited influence on market-wide pricing beyond the very short term and small stocks.2
Documenting that limited attention extends to mutual fund managers—who collectively control
more than 20% of the U.S. stock market—and hurts their performances helps strengthen the link
between attention-driven trading and asset pricing patterns.
2 Individuals’ buying pressure can influence stock prices, but the effect documented in the literature is typically short-term. The literature review section contains a more detailed discussion.

- 6 -
The rest of the paper is organized as follows. Section 1 reviews related literature. Section
2 describes our data. Section 3 examines stocks’ media coverage and aggregate fund trading.
Section 4 studies the cross-sectional relation between funds’ propensity to trade media-coverage
stocks and future fund performance. Section 5 concludes.
1. Related Literature
Our paper relates to two main strands of literature. First, it contributes to the stream of
research that studies the influence of attention, and more specifically the media, on stock market
outcomes. Second, it contributes to the literature on mutual fund performance.
According to classic theory, mass print media should have no effect on the stock market
because it typically does not reveal genuinely new information. The growing evidence in favor
of a significant media impact on the stock market is therefore better understood in light of
theories involving limited investor attention. Attention is a scarce cognitive resource; it is
selective and requires effort (Kahneman (1973)). Even if stories about companies in mass print
media contain no genuine news, the coverage shifts the stocks onto investors’ radar screen,
lowering the search cost of identifying which stocks to trade. As a case in point, Huberman and
Regev (2001) report that the trading volume and stock price of EntreMed (a drug company)
soared on the day that a New York Times article reported on a new cancer drug from the company,
even though the same story had been published in Nature and other newspapers five months
before. This example suggests that media coverage can affect both the trading and pricing of
securities simply by drawing attention to them.
The recent theoretical literature has examined consequences of investor limited attention.
Hirshleifer, Lim, and Teoh (2011) provide a model in which limited attention explains both over-

- 7 -
and under-reaction to different earnings components. DellaVigna and Pollet (2007) present
theory and evidence that investors exhibit inattention to distant future and this behavior leads to
predictable returns based on known demographic trends. Peng and Xiong (2006) argue that
limited attention leads to category-learning behavior, i.e., investors tend to process market and
sector-wide information rather than firm-specific information. Hirshleifer and Teoh (2003) show
that when investors have limited attention, firms’ methods for presenting information (keeping
information constant) can affect market prices.
Empirical evidence that attention limitations affect trading, especially among retail
investors, is accumulating. Barber and Odean (2008) show that individual investors tend to
purchase stocks that grab their attention, such as stocks in the news, stocks experiencing high
abnormal trading volume, and stocks with extreme one-day returns. Engelberg and Parsons
(2011) compare the trading behavior of investors who have access to differing coverage of the
event, and conclude that media reporting has a causal impact on investor trades. Solomon et al.
(2011) show that stocks’ media coverage affects how investors allocate capital to mutual funds:
fund flows are more sensitive to underlying stock returns when the stocks have been featured in
the media.
A number of papers indicate that attention limitations also impact asset pricing.
Individual investors’ trading attributable to limited attention is found to be typically related to
short-term price movements. Da et al. (2011) show that search frequency in Google captures
individual investor attention and is related to short-term stock price patterns. Tetlock (2011)
finds that stale news stories (stories that are textually similar to previous stories about the same
firm) nonetheless trigger trading by retail investors and short-term price movements. Engelberg
et al. (2011) report short-term price spikes after stocks are recommended by Jim Cramer on the
- 8 -
popular TV show Mad Money. In the context of earnings announcements, DellaVigna and Pollet
(2009), Hirshleifer et al. (2009) and Peress (2008) find that the post-earnings announcement drift
strengthens while the event-return and trading volume weaken, when the announcement is issued
respectively on a Friday, or days when there are numerous earnings releases by other firms and
accompanies by more media coverage. Regarding long-term returns, Fang and Peress (2009)
document that stocks highly covered by mass media have significantly lower returns than stocks
not covered by media, even after controlling for other risk factors. The authors attribute this
pattern to Merton’s investor recognition hypothesis, which can be rooted in investors’ limited
attention. Hou, Peng and Xiong (2006) report that the momentum effect is stronger when there is
more intense investor attention. They use trading volume as a proxy for investor attention.
We contribute to the literature on media and limited attention by documenting how
professional investors’ trading and performance are affected by media coverage. Our findings
complement the existing evidence in two ways. First, we extend the evidence on attention-
driven behavior from individuals to professional investors. Besides our paper, Corwin and
Coughenour (2008) is a notable exception that documents limited attention among professionals.
They show that NYSE specialists reduce the provision of liquidity for some of their assigned
stocks when they are distracted by events affecting other stocks. Their context does not allow
for the analysis of how limited attention impacts investment performance. Second we find
evidence that limited attention can impact fund performance beyond the very short run.
Our paper is also related to the literature on mutual fund performance. One strand of this
literature indicates that manager and fund characteristics are related to skill. For example,
Chevalier and Ellison (1999) document that younger managers and managers who attended
colleges with higher average SAT scores earn higher returns. Chen, Hong, Huang, and Kubik

- 9 -
(2002) indicate that smaller funds tend to out-perform larger funds due to diseconomies of scale
in the fund management industry. Cremers and Petajisto (2009) show that funds that deviate
most from their benchmark indices outperform their benchmarks both before and after expenses.
We are careful to control for known fund characteristics such as size and age that are associated
with performance.
A number of recent papers indicate that superior performance can stem from superior
information. Kacperczyk, Sialm, and Zheng (2005) find that mutual fund managers who hold
industry-concentrated portfolios perform better after controlling for risk and style differences.
Nanda, Wang, and Zheng (2004) provide evidence that fund families following more focused
investment strategies across funds perform better. These papers suggest that portfolio
concentration may be driven by superior information, which translates into superior risk-adjusted
performance. But the source of the superior information is not clear. One possibility is that
superior information is “endowed”: some managers may just have higher innate ability
(Chevalier and Ellison (1999)) or better access to information thanks to connections (Cohen,
Frazzini, and Malloy (2008)). An alternative explanation is that attention is limited: under scarce
cognitive resources, managers may be better able to develop special knowledge by focusing
attention on a narrow set of stocks. Consistent with this explanation, Coval and Moskowitz
(1999, 2001) show that mutual funds exhibit a strong investment preference for locally
headquartered firms for which they appear to have an informational advantage. This suggests
that familiarity and proximity could be a source of superior information. In contrast, our
evidence suggests that familiarity associated with media coverage is not a source of superior
information and is likely related to investors’ limited attention.

- 10 -
Our result is related to Kacperczyk and Seru (2007) in which the authors quantify the
extent to which funds’ trades are influenced by changes in consensus analyst recommendations,
which they call Reliance on Public Information (RPI). They find that RPI has a negative relation
with fund performance. Broadly speaking, our paper and Kacperczyk and Seru (2007) both
support the notion that fund performance is negatively related to managers’ tendency to rely on
public information. But not only is mass media more mainstream than analyst coverage, we also
show that the number of newspaper articles about a stock alone can affect trading and
performance. Our empirical setup thus offers a direct way to gauge the effect of limited attention
on fund trades and performance.
2. Data and Descriptive Statistics
For the purpose of this study, we build a dataset that combines information on stocks’
media coverage with mutual fund performance and holdings.
We collected comprehensive media coverage data from NexisLexis for all NYSE stocks
and 500 randomly selected Nasdaq stocks for the period 1/1/1993 - 12/31/2002.3 We include
articles published about our sample stocks in four major daily newspapers with nationwide
circulation: USA Today, the Wall Street Journal, the New York Times, and the Washington Post.
Together, they account for 11% of the average weekday newspaper circulation in the U.S.. Fang
and Peress (2009) argue that coverage in these four national papers is likely to be representative
of most of the coverage of the corporate sector.4 In each calendar quarter of the 10-year period,
we count the total number of articles published in the four newspapers about each firm in our
3 These data are the same as those used in Fang and Peress (2009). 4 LexisNexis classifies the relevance of an article to a company by a variable called the “relevance score”. We consider articles that have relevance scores of above 90%, which constitute “major references” to a company according to LexisNexis. Scores in the 80% - 89% range are described as “Strong Passing References” and those in the 50% - 79% range as “Weak Passing References”.

- 11 -
sample.5 The stocks in our media sample are then matched by name to the CRSP stock database
and to mutual fund holdings data.
Our mutual fund sample is constructed by merging the CRSP Survivorship Bias Free
Mutual Fund Database with the Thompson Financial CDA/Spectrum holdings database using
MFLink provided by WRDS. The CRSP mutual fund database includes information on fund
returns, total net assets, fees, investment objectives, fund age and other fund characteristics. The
CDA/Spectrum database provides stockholdings of individual mutual funds, collected from the
funds’ SEC filings or voluntary reports. We restrict our analysis to open-end domestic equity
mutual funds. Specifically, we include in the sample the funds that are classified as aggressive
growth (AG), growth (G), growth and income (GI) by CDA/Spectrum; index funds are excluded.
For funds with multiple share classes, we eliminate the duplicated funds and compute the fund-
level variables by aggregating across the different share classes.6 We also exclude funds which
hold less than 10 stocks and those which manage less than $5 million. Fund holdings are merged
with the CRSP monthly stock file and the Compustat database to obtain stock-level information,
such as market capitalization, B/M ratio, etc. Our data is adjusted for stock splits and dividends.
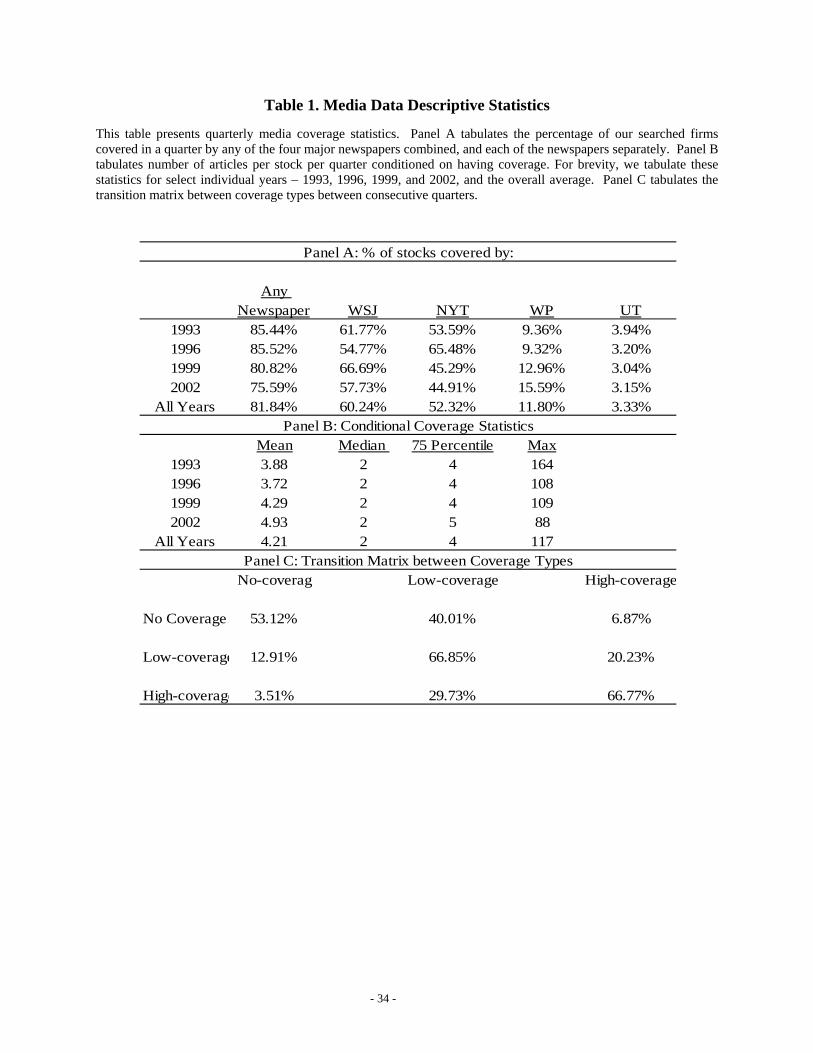
Table 1 shows descriptive statistics for our media data. Panel A tabulates the fraction of
firms covered by all four major newspapers combined, as well as by each paper separately.
Coverage is measured on a quarterly basis, and then averaged across quarters in a given year.
One striking observation is that media coverage overall is not very high: even among our sample
stocks which primarily consists of large NYSE stocks, only about 80% of stocks get some
coverage during an average quarter. The Wall Street Journal provides the most coverage – about
5 We use calendar quarter as the frequency of our analysis throughout this paper. The 1st-4th quarters of each year are defined by report dates (Rdate) equaling April, July, October, and January (of the next year) respectively. 6 For most variables, we use a value-weighted average for the fund-level observation. For fund age, we use the oldest of all share classes.
- 12 -
60% of stocks get some coverage during a quarter. Coverage by the New York Times is
comparable at 55%. Coverage by the Washington Post and USA Today is considerably lower, at
11% and 3% respectively. Panel B shows statistics conditional on being covered. This panel
reveals that media coverage is skewed: The median number of articles about a stock is 2 per
quarter, whereas the mean is about 4, closer to the 75th percentile. Finally, Panel C shows a
transition matrix among media coverage types from quarter to quarter. Each quarter, we divide
the sample of stocks into no-, low-, and high-media coverage bins. No-coverage stocks are first
identified and the remaining stocks are then split into two equal-size groups, the high- (above
median) and low- (below median) coverage groups. The transition matrix indicates that the
intensity of media coverage is persistent, as the diagonal elements in this matrix are much larger
than the off-diagonal elements. In other words, stocks with no- (low-, high) coverage tend to
continue to have no- (low-, high) coverage. These patterns are consistent with those reported in
Fang and Peress (2009).
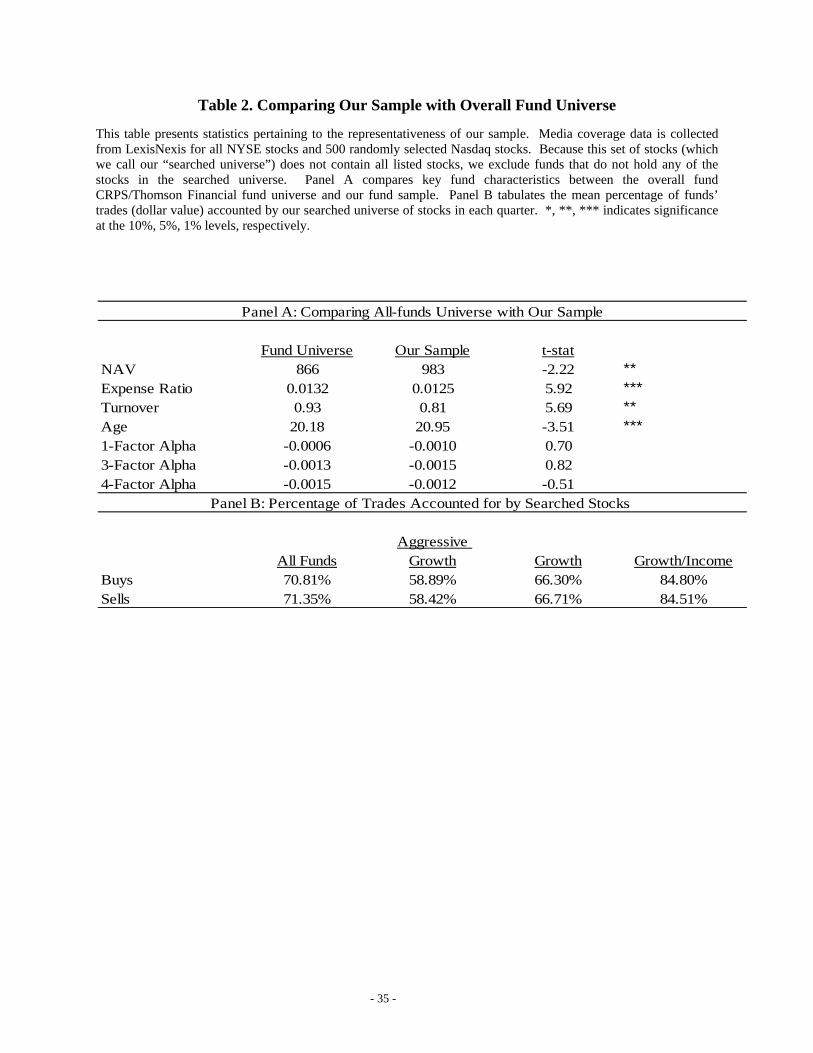
Table 2 provides summary statistics on the mutual fund sample. Because we do not have
media data for all stocks held by all funds – we searched all NYSE stocks and 500 randomly
selected NASDAQ stocks – we exclude funds that do not hold any of the stocks from our
searched list. One question is therefore whether the resulting fund sample differs from the fund
universe. Panel A of Table 2 compares our fund sample to the overall CRSP fund universe.
Results here indicate that our screening resulted in a sample of funds that are similar in terms of
performance, but a little larger and older, with slightly lower expense ratios and turnover than the
CRSP universe. We will control for these fund characteristics and fund investment styles in the
regression analysis.

- 13 -
Panel B tabulates the proportion of funds’ buys and sells that are accounted for by our
searched stocks. For each quarter t, we calculate the dollar value of fund f’s buys and sells in
stock i as follows:
1,,,,1,,,,,,, if )($ tiftiftiftiftitif nsharesnsharesnsharesnsharespricebuy (1a)
1,,,,1,,,,,,, if )($ tiftiftiftiftitif nsharesnsharesnsharesnsharespricesell (1b)
where tiprice , is stock i’s price at the end of quarter t, tifnshares ,, and 1,, tifnshares fund f’s
holdings in stock i at the end of quarter t and t-1, respectively.7 Overall, the stocks for which we
collected media coverage information represent roughly 70% of funds’ trades. Interestingly, the
proportion is highest for GI funds (about 84%), followed by growth funds (66%) and aggressive
growth funds (58%). These differences may be driven by the fact that aggressive growth funds
tend to be smaller and more concentrated in small-cap stocks, and our stock sample with media
coverage data consists mainly of large NYSE stocks. Overall, these numbers indicate that stocks
in our dataset account for a significant portion of funds’ trades.
3. Fund Trading and Media Coverage in the Aggregate
In this section, we analyze whether fund trading in the aggregate is related to media
coverage. Table 3 tabulates the uni-variate relation between aggregate fund trading and the
amount of media coverage a stock receives. Each quarter, we divide the sample of stocks into
no-, low-, and high-media coverage groups. As before, no-coverage stocks are first identified
and the remaining stocks are split into the high-coverage and low-coverage groups using the
median as the cutoff. For each stock, we calculate the total dollar amount of buys and sells in
7 Stock prices and number of shares data are all adjusted for stock splits and dividends. Specifically, we merge mutual fund holding data with CRSP stock data and use the cumulative adjustment factor to make the necessary adjustments.

- 14 -
each quarter by all funds in the sample. These stock-level trading amounts are then aggregated
by media-coverage type to measure the value of aggregate trading for all stocks of a particular
media-coverage type. Finally, the resulting numbers are scaled by the funds’ aggregate holdings
of the same set of stocks at the end of the previous quarter. This scaling is important because it
removes biases that could arise due to differences in firm size and prior holdings. Thus the
numbers reported answer the following question: “What are the percentages of buys/sells in
these stocks relative to their total prior positions held by the funds?”
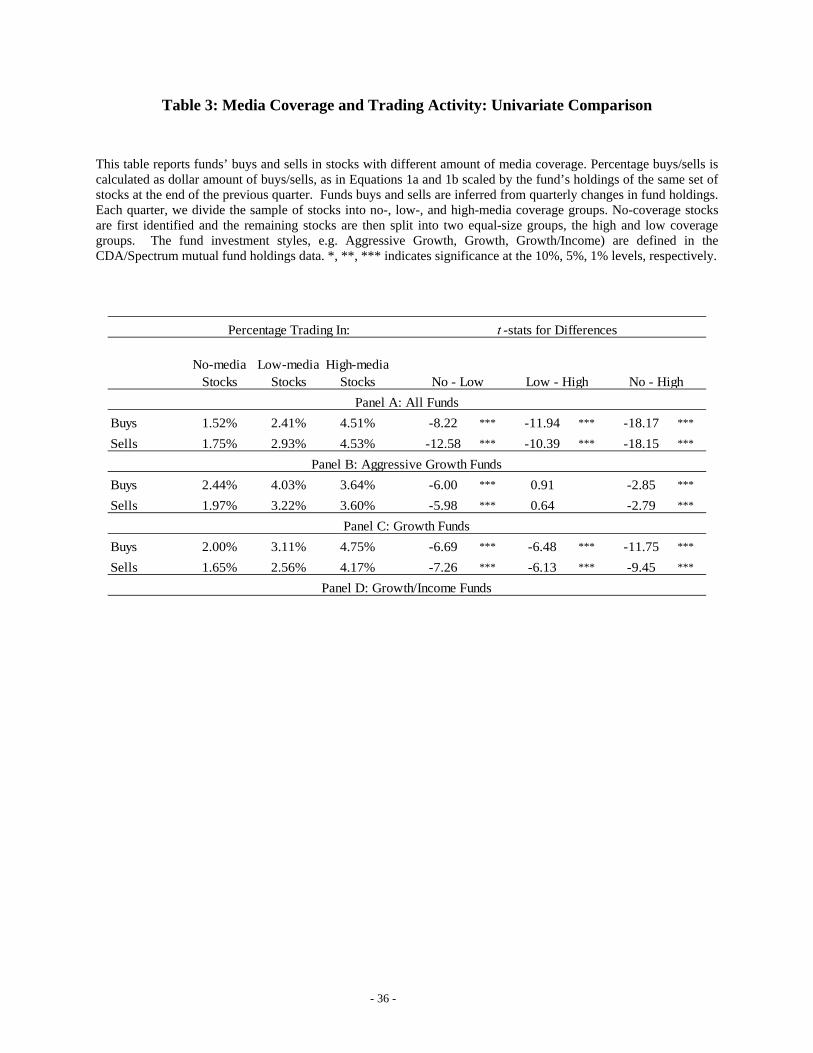
Results in Table 3 indicate that in the aggregate, mutual funds trade high-coverage stocks
more than low-, or no-coverage stocks. For example, total buys in high-coverage stocks is on
average 4.51% of funds’ aggregate prior holdings, whereas total buys in low- and no-coverage
stocks are 2.41% and 1.52% of holdings, respectively. Thus, buying in high-coverage stocks is
almost three times as intense as in no-coverage stocks. Similar patterns holds for sells. Panels
B-D indicate that Aggressive Growth, Growth, and Grown/Income funds all exhibit this
tendency to trade high-coverage stocks; but the strength of this “preference” is somewhat
different. Growth/Income funds seem to exhibit the strongest preference for high-coverage
stocks, while Aggressive Growth funds exhibit the weakest such preference.
In Table 4, we isolate the impact of media coverage on fund trades from that of other
stock characteristics by estimating panel regressions of funds’ buys and sells on stocks’ media
coverage proxies and a list of control variables. Four proxies of coverage are used. In Model 1
we use the log of (one plus) the number of newspaper articles about a firm in a given quarter. In
Model 2 uses a discrete variable “coverage type”, which equals 0, 1, and 2 for no, low-, and
high-coverage types, respectively. In Model 3 we use two binary variables. The “covered
indicator” equals 1 if the stock received media coverage and 0 otherwise; the “High coverage

- 15 -
indicator” equals 1 if the stock received above-median coverage and 0 otherwise. The control
variables include firm size, size squared (to capture potential non-linearity in the relationship
between trading and firm size), book-to-market ratio, and past returns. We include quarter and
fund fixed effects, and cluster the standard errors by stock.
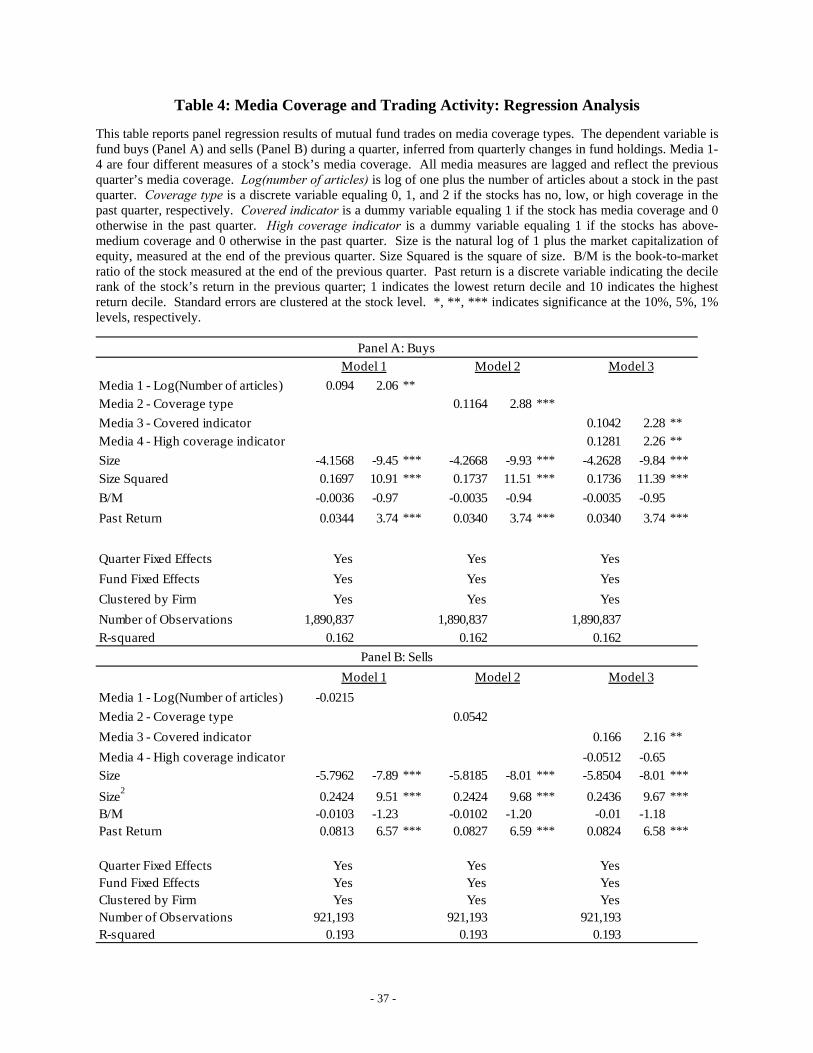
Results in this table indicate that more media coverage is associated with more fund buys
even after controlling for relevant firm characteristics. The different proxies for coverage are
positively and statistically significant across all models. The effect is economically large: Since
the dependent variable is amount of buys in millions of dollars, the coefficient in Model 3
indicates that on average a fund buys $100,000 more of a stock with media coverage than of a
stock without media coverage in a quarter. Since we have close to 1,000 funds each quarter, this
means that funds’ aggregate buy of a stock with media coverage exceed that of a stock without
media coverage by about $100 million! The estimation also shows that stocks receiving high
(above-median) coverage are bought even more.
In contrast to buys, funds’ aggregate sells are not strongly influenced by media coverage,
once other firm characteristics are controlled for in the regression. Panel B shows that the media
coverage proxies are generally insignificant in the regression for sells – though most of their
signs are positive. Only in Model 3 is the coverage dummy significant; but the high (above-
median) coverage dummy has no incremental impact.
Overall, results in this section indicate that, in the aggregate, stocks with more coverage
are bought more heavily by mutual funds than stocks with less coverage. This pattern is much
weaker with sells, presumably because short-sell constraints restrict the set of stocks funds can
sell to those which they already own and therefore pay attention to. Notably, funds’ preference
for buying high-coverage stocks does not just reflect a bias toward large-cap stocks as size is

- 16 -
controlled for; moreover, our universe of stocks consists of mainly NYSE stocks which are large
compared to the overall stock universe to begin with. Our finding that mutual fund buys are
positively related to a stock’s media coverage is linked to, but distinct from Falkenstein (1996)
who documents that mutual fund holdings are positively related to a stock’s “visibility” proxied
by its media coverage.8
The trading patterns we document—the positive influence of media coverage on buys and
its weak impact on sells–are consistent with the notion that funds’ attention is limited. Indeed,
limited attention will manifest more clearly in buys than sells, since constrained investors can
only sell the stocks that they already hold while needing to choose stocks to buy from a huge
universe – in other words, the search costs are lower for sells than for buys. However, this
evidence is not sufficient to conclude that funds suffer from limited attention. If the propensity
to trade media-coverage stocks is indeed symptomatic of funds’ limited attention, then it should
also be associated with poor performance; if instead it reflects funds’ attempts to benefit from
pricing anomalies among stocks traded by inattentive investors, then we expect it to be
associated with superior performance. We further distinguish between the two hypotheses in the
next section by examining fund performance.
4. Cross-sectional Analysis
4.1. Funds’ Propensity to Buy and Sell Media Stocks
The previous section shows that aggregate fund buys are positively related to stocks’
media coverage in the recent past. In this section, we analyze the cross-sectional variation in
8 Falkenstein (1996) uses the number of news stories reported in major newspapers, including the ones used in our study.
- 17 -
funds’ propensities to buy and sell highly covered stocks, and how such propensities are related
to future fund performance.
For each fund and quarter, we calculate the fund’s propensity to buy media stocks
(PROPENSITY_BUY_MEDIA) by first estimating the following regression:
tiftitftitftitftif SizeCoverageCoverageBuy ,,1,3
,2,2
,1,1
,,, **$ , (2)
where tifbuy ,,$ is the dollar amount of fund f’s buy in stock i during quarter t, and qtiCoverage ,
is the (log of) the number of articles published about stock i during quarter t-q, Sizei,t-1 is the (log
of) market capitalization of equity at the end of quarter t-1. 9 We use lagged values for the
explanatory variables so that they are exogenous to this quarter’s trading activity.10 To ensure
that a representative sample of trades is used for the estimation, we use only fund quarters for
which media data is available for at least 50% of the fund’s trades measured by dollar amount.
We include firm size in equation (2) because media coverage is closely related to firm
size (Fang and Peress (2009)) and size may also significantly influence funds’ trades. If size is
excluded from the equation, one concern would be that the media variables may simply be
picking up a size effect. In order to isolate the explanatory power of the lagged media coverage
variables for trades over and above that of firm size, we use the partial R2 of the media variables.
Specifically, fund f’s propensity to buy media stocks (PROPENSITY_BUY_MEDIA) for quarter
t is calculated as:
_ , 2 2 (3)
9 Results reported here use the past two quarters of media coverage. In unreported robustness checks (available upon request), we use the past three and four quarters and find qualitatively similar results. Quantitatively, the effects are slightly stronger using three or four lags of media data. 10 Using lagged media helps alleviate the reverse causality problem in which stocks are featured in the media in a given quarter because funds heavily trade them in that quarter.

- 18 -
where PartialR2lag1 and PartialR2lag2 denote the partial R2 associated with the two lagged media
variables. For each explanatory variable, the partial R2 measures the proportion of unexplained
variation in the dependent variable (fund buys or sells) that is explained with the addition of that
variable. Therefore PROPENSITY_BUY_MEDIA calculated in equation (3) captures the
explanatory power of media coverage alone for fund’s buys after controlling for size. If we used
the total R2 from equation (2), we would overstate the explanatory power of media coverage by
including the effect of size. The fund’s propensity to sell media-coverage stocks
(PROPENSITY_SELL_MEDIA) is defined analogously.
Repeating the above procedure, we obtain a PROPENSITY_BUY_MEDIA and a
PROPENSITY_SELL_MEDIA for each fund in each quarter. We then examine how the funds’
future performances in the cross-section are related to these measures. Our
PROPENSITY_BUY_MEDIA and PROPENSITY_SELL_MEDIA measures are similar in spirit
to the “Reliance on Public Information” (RPI) measure used in Kacperczyk and Seru (2007),
defined as the R2 of a regression of changes in fund holdings on lagged changes in consensus
analyst stock recommendations.
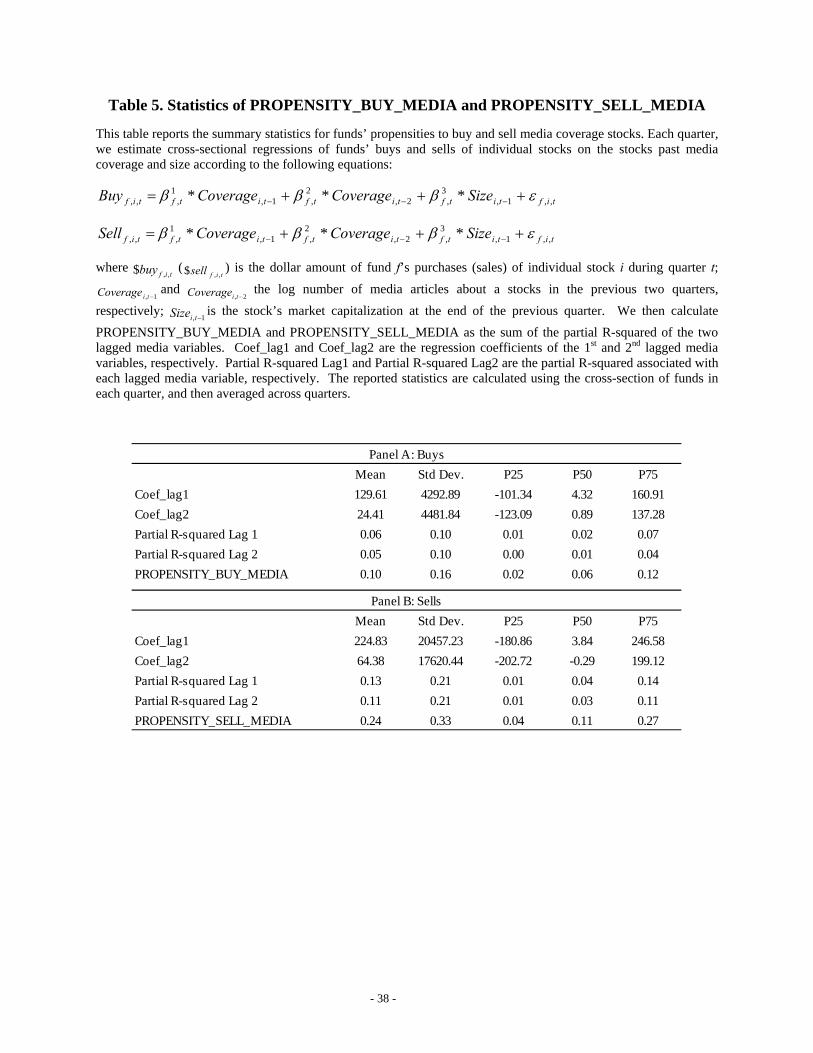
Table 5 reports statistics for funds’ PROPENSITY_BUY_MEDIA and
PROPENSITY_SELL_MEDIA measures. Panel A shows the distribution of the coefficient
estimates on the lagged media variables in equation (2), and the associated partial R2. The
statistics are calculated using the cross-section of funds in each quarter, and then averaged across
quarters. On average, the beta estimates are positive, which is consistent with the findings in the
previous section. But the panel reveals considerable heterogeneity in the effects of the media
variables in Equation (2). We also observe that both the coefficients on the media variables and
the PROPENSITY_BUY_MEDIA and the PROPENSITY_SELL_MEDIA measures are

- 19 -
positively skewed, indicating that the impact of coverage on trade is very strong for some funds.
In unreported calculations, we find that PROPENSITY_BUY_MEDIA and
PROPENSITY_SELL_MEDIA are positively correlated, but the correlation is only 10%,
indicating that funds have different motives for sells from buys.
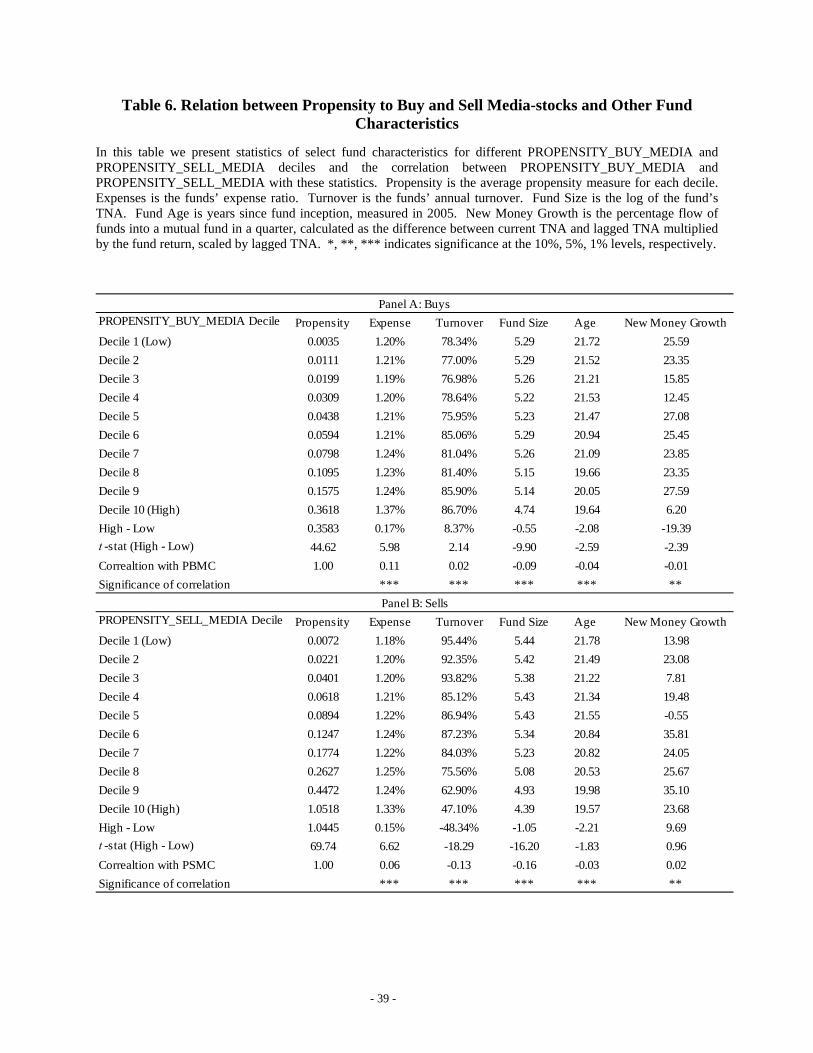
Table 6 reports the relation between funds’ PROPENSITY_BUY_MEDIA,
PROPENSITY_SELL_MEDIA and other fund characteristics. We sort funds into deciles based
on the propensity measures, and tabulate average fund characteristics for each decile. The table
indicates that PROPENSITY_BUY_MEDIA is positively related to fund expenses and turnover,
and negatively related to fund size, age, and new money growth. These patterns suggest that
funds with high propensity to buy media-coverage stocks incur higher costs for portfolio
turnover; they tend to be smaller and younger funds which may have access to fewer resources.
On the other hand, PROPENSITY_SELL_MEDIA is negatively related to turnover and
positively related to new money growth. The asymmetry between the two measures in their
relation to other fund variables again suggests that different factors are driving funds’ tendencies
to buy and sell high-coverage stocks.
4.2. Propensity to Buy/Sell with Media Coverage and Fund Performance
In this section, we examine the relation between funds’ propensities to buy and sell
media-coverage stocks and future fund performance. Under the limited attention hypothesis,
fund managers trade high-coverage stocks for the same reasons that individual investors do:
these stocks are on their radar screen. Since such trading is not motivated by superior
information or insight, we expect this behavior to be related to inferior fund performance. On
the other hand, under the smart funds hypothesis, managers trade high-coverage stocks to take

- 20 -
advantage of any mispricing generated by less attentive investors. Such trading should be related
to superior performance.
To test these hypotheses, we begin by sorting funds into deciles based on their
PROPENSITY_BUY_MEDIA and PROPENSITY_SELL_MEDIA measures each quarter and
compare various fund performance measures in the subsequent quarter. The performance
measures we examine include the CAPM alpha, Fama-French 3-factor alpha, Carhart 4-factor
alpha, the conditional 4-factor alpha based on Ferson and Schadt (1996), and the manipulation-
proof measure proposed by Ingersoll et al. (2007).
The alphas from the factor models have been widely used in the fund literature. To
calculate alphas, for each fund each month, we estimate factor loadings from the time-series
regressions of excess fund returns on factor returns using the previous 30 months of data.
Alphas are then calculated as the realized fund return minus the expected fund return.
Ingersoll et al. (2007) show that popular performance measures such as the alpha and the
Sharpe ratio can be gamed, and that a non-skilled fund manager may appear skillful based on
these measures. They propose a manipulation-proof measure based on historical fund returns as
follows:
1
1
1/11
ln)1(
1ˆT
tftt rr
Tt
(4)
where T is the total number of observations over the performance evaluation period, ∆t is the
length of time between observations (i.e., 1/12 for our monthly return sample), rt is a fund’s rate
of return for month t , and rft is the risk-free rate at month t. can be viewed as a relative risk-
aversion coefficient, to make holding the benchmark portfolio optimal for uninformed managers.

- 21 -
The authors estimated that is between 2 and 4 if the CRSP value-weighted return is the
benchmark portfolio. Our test results are qualitatively similar when we use = 2 to 4
respectively. For brevity, we report results using = 3 in the tables. Thus, the manipulation-
proof performance measure is calculated using monthly fund return and risk-free rate with a
relative risk-aversion coefficient of 3.
Table 7 reports the results. In Panels A and B, funds are sorted according to
PROPENSITY_BUY_MEDIA and PROPENSITY_SELL_MEDIA, respectively. We find a
strong negative relation between PROPENSITY_BUY_MEDIA and fund performance. Using
various performance measures, Decile 1 (low PROPENSITY_BUY_MEDIA) funds out-perform
Decile 10 (high PROPENSITY_BUY_MEDIA) funds by 11 (the conditional 4-factor alpha) to
21 (the CAPM alpha) basis points per month. These differences are statistically significant and
imply annual return differences ranging from 1.3% to 2.5%. The manipulation-proof measure
yields a performance difference of 17 basis points per month or slightly over 2% per year.
To visualize this effect, we plot in Figure 1a funds’ average monthly returns in the
quarter after portfolio formation against their PROPENSITY_BUY_MEDIA decile ranks. A
clear negative relation emerges between PROPENSITY_BUY_MEDIA and subsequent fund
performance, regardless of the performance measure used. In addition to comparing the relative
performance across deciles, we also compare each decile to its respective benchmarks. In
unreported tests, we find that while the various performance metrics of Decile 1 funds (funds
with low propensity to buy media stocks) are statistically indistinguishable from zero, the same
metrics for Decile 10 funds (funds with high propensity to buy media-coverage stocks) are
significantly negative. Thus, a high propensity to buy media-coverage stocks is related to under-
performance in the cross-section, as well as under-performance relative to standard benchmarks.

- 22 -
In contrast, Panel B of Table 7 shows that there is no negative relation between
PROPENSITY_SELL_MEDIA and future fund performance. The performance differences
between high and low PROPENSITY_SELL_MEDIA funds are indistinguishable from zero.
Figure 1b, which plots fund performance against PROPENSITY_SELL_MEDIA deciles, reveals
a basically flat relation. In fact, if anything, Decile 10 (high PROPENSITY_SELL_MEDIA)
funds here seem to perform slightly better than other funds (though the difference is statistically
insignificant). Thus, there is an asymmetry between buys and sells: while there is a strong
negative relation between funds’ propensity to buy media-coverage stocks and funds’
performance, such a pattern is not discernible in sells. This asymmetry echoes the asymmetry
between buys and sells documented earlier that fund aggregate buys are significantly affected by
media coverage, while their aggregate sells are not. These asymmetries are consistent with the
limited attention hypothesis in the presence of short-sale constraints, which predicts that the
correlation of stocks’ media coverage with fund buys should be higher than with fund sells, and
that the propensity to buy media-stocks should be negatively related to performance.
Table 8 uses panel regressions to further investigate the relation between funds’
propensity to buy or sell high-media stocks and future fund performance. The dependent
variables are funds’ monthly alphas and the main independent variable are funds’
PROPENSITY_BUY_MEDIA decile rank (Panel A) and PROPENSITY_SELL_MEDIA decile
rank (Panel B). We group funds into deciles rather than rely on the point estimate of the
propensity measures in order to reduce estimation noise. As control variables we include fund
size, log of fund size (to allow for non-linear relation between fund size and return), fund
expense ratio, turnover, age (measured in 2005), style indicators, the average size of stocks held
by the funds, and also the fund’s “active share” (Cremers and Petajisto (2009)).

- 23 -
Regression results in Table 8 confirm the robustness of the negative relation between
PROPENSITY_BUY_MEDIA and fund performance. The coefficient on the propensity decile
rank is negative and significant in all regressions. Since the results are reported in basis points,
the coefficient of negative 1.35 in the 4-factor model indicates that a 10% increase in
PROPENSITY_BUY_MEDIA rank is associated with a reduction in monthly 4-factor alpha by
1.35 basis points. Thus, funds in the top PROPENSITY_BUY_MEDIA decile underperform
funds in the lowest decile by 1.46% (1.35*9*12) per year. Also consistent with the uni-variate
results, we find that there is generally no relation between PROPENSITY_SELL_MEDIA and
fund performance.
Coefficients on the control variables are generally of the expected sign. For example, we
find that fund expense ratio is significantly negatively related to fund performance. Funds’
active share on the other hand is generally positively related to performance. These results are
consistent with prior evidence.
In summary, we find a strong negative relation between a fund’s propensity to buy high-
coverage stocks and the fund’s subsequent performance. The 10% of the funds with the highest
propensity to buy media-coverage stocks under-perform the 10% of the funds with the lowest
such propensity by about 2% per year depending on the performance metric. On the other hand
there is little relation between the fund’s propensity to sell high-coverage stocks and its
subsequent performance. These findings support the view that a high propensity to buy media-
coverage stocks is a consequence of limited attention among some fund managers.
- 24 -
5. Additional analysis
5.1. Persistence in propensity to buy media-coverage stocks
If funds’ propensity to buy high-coverage stocks reflects their limited attention, we
expect this propensity to be a persistent fund characteristic. Table 9 presents evidence on the
persistence of PROPENSITY_BUY_MEDIA.11 In Panel A, we examine persistence within a
year by regressing funds’ current-quarter PROPENSITY_BUY_MEDIA on its lagged values in
the past four quarters. The coefficient estimates indicate that the current propensity is
significantly positively predicted by all four lags, suggesting persistence. The economic
magnitude is sizeable: increasing a fund’s rank by one unit over the previous year leads to a rise
in the current rank of approximately 0.4. Panel B shows transition matrices between
PROPENSITY_BUY_MEDIA quintile ranks one, two, and five years after the initial sorting. If
PROPENSITY_BUY_MEDIA ranks are not persistent, we expect to see 20% across the cells.
We find evidence of persistence especially among funds with the highest
PROPENSITY_BUY_MEDIA measures (quintile 5). After one year, 31% of quintile-5 funds
remain in quintile 5 (50% more than a random sort would produce), 54% of them are in either
quintile 4 or quintile 5 (35% more than a random sort would produce). Even after five years, 26%
remain in quintile 5 and 46% are in either quintile 4 or quintile 5.
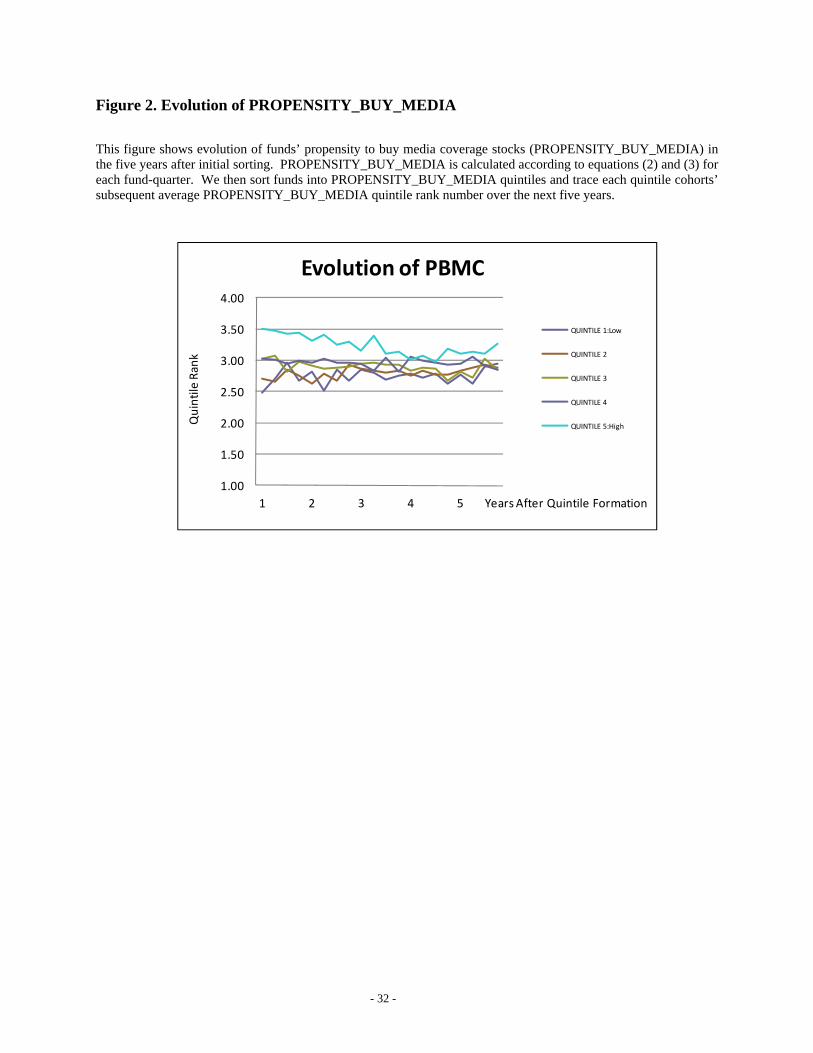
Figure 2 plots the evolution of funds’ PROPENSITY_BUY_MEDIA ranks over five
years. After we sort funds into PROPENSITY_BUY_MEDIA quintiles each quarter, we trace
each cohort and report their average subsequent quintile ranks over time. While there is clearly
11 For brevity, in this draft we do not report persistence results on PROPENSITY_SELL_MEDIA. We also focus on buys in the reported results here because Section 4 shows that while propensity to buy media stocks is negatively related to fund performance, the relation between propensity to sell media stocks and fund performance is weak. In unreported analysis we find that PROPENSITY_SELL_MEDIA is also persistent, with similar patterns to PROPENSITY_BUY_MEDIA.

- 25 -
evidence of mean-reversion, quintile 5 funds tend to have higher PROPENSITY_BUY_MEDIA
ranks than all other quintiles over the entire five year period.
Collectively, the evidence in this section suggests that funds’ propensity to buy media-
coverage stocks is persistent, especially among high-propensity and thus under-performing funds.
5.2 Trading vs. Holding
Section 4 documents a strong negative relation between PROPENSITY_BUY_MEDIA
and future fund performance. One may wonder whether the inferior performance of high-
PROPENSITY_BUY_MEDIA funds does not result from these funds actively buying high
coverage stocks, but is simply due to their passive holding of such stocks. Fang and Peress
(2009) document that there is a significant return dispersion between high-coverage and low-
coverage stocks, with low-coverage stocks earning a risk premium over high-coverage stocks (3%
per year on average). It could be that high-PROPENSITY_BUY_MEDIA funds simply hold
high-coverage stocks which yield lower returns.
To investigate this hypothesis, we measure funds’ propensity to hold media-coverage
stocks, PROPENSITY_HOLD_MEDIA, in an analogous fashion to the way we calculated
PROPENSITY_BUY_MEDIA and PROPENSITY_SELL_MEDIA, replacing trades with
holdings. Table 10 reports alphas for funds sorted on their PROPENSITY_HOLD_MEDIA
measures. If funds’ holdings explain a significant portion of the return differences we
documented earlier, we expect to observe the same negative relationship between
PROPENSITY_HOLD_MEDIA and alpha as reported between PROPENSITY_BUY_MEDIA
and alpha.
- 26 -
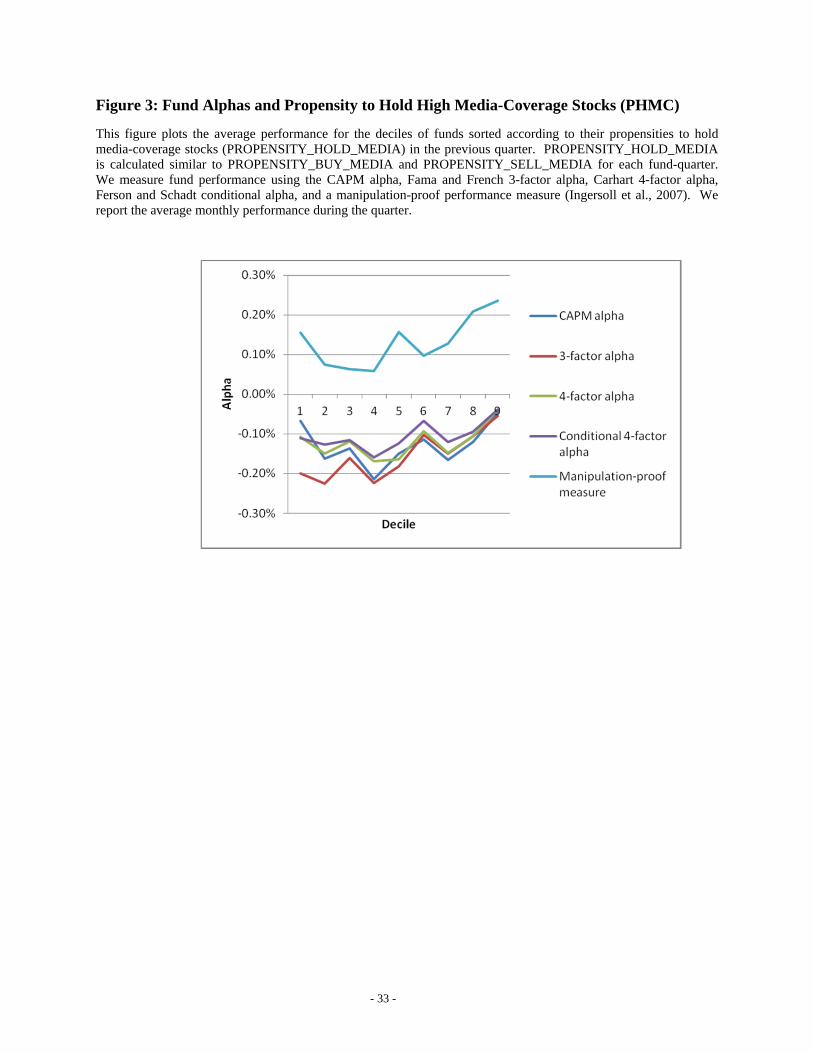
Table 10 reveals that sorting funds based on their propensity to hold media-coverage
stocks generates virtually no return difference in the cross-section. The difference in the 1-, 3-,
4-factor, and conditional 4-factor alphas between the top and bottom decile funds are positive, 2,
14, 7, and 7 basis points per month respectively, none of which are statistically significant. Thus,
we conclude that our results pertaining to PROPENSITY_BUY_MEDIA are not driven by funds
simply holding high coverage stocks; rather they are driven by funds buying high-coverage
stocks.
6. Conclusions
Recent research offers increasing evidence that media affects individual investors’
trading behavior by drawing their limited attention to certain assets.
In this paper, we extend the analysis by asking whether and how mass media influences
the way professional managers trade. To do so, we construct a measure of each mutual fund’s
propensity to buy or sell stocks covered in the media. Our empirical findings suggest that, on
average, funds tend to buy stocks with media coverage more heavily than those without. Funds
sells on the other hand, are less influenced by media. In the cross-section, we find that funds
with a high propensity to buy media-coverage stocks perform significantly worse relative to both
funds with a low propensity and to passive benchmarks by about 1.3%-2% per year. This
performance differential is strong among fund buys but virtually inexistent among sells. We also
document that funds with a high propensity to buy media-coverage stocks exhibit persistence in
this trading behavior. We confirm that the under-performance of these funds are not driven by
these funds simply holding high-coverage stocks which have been documented to earn lower
returns; but rather, their under-performance is due to their buys of high-coverage—and

- 27 -
presumably attention-grabbing—stocks. Overall these findings indicate that professional fund
managers, at least a subset of them, are subject to limited attention and rely on mass media to
bring certain stocks onto their radar screen, and that such behavior harms their performance.

- 28 -
References
Barber, Brad, and Terry Odean, 2008, All that glitters: The effect of attention on the buying behavior of individual and institutional investors, Review of Financial Studies 21, 785-818. Carhart, M. M., 1997, On persistence in mutual fund performance, Journal of Finance 52, 57–82. Chen, J., H. Hong, M. Huang, and J. Kubik, 2004, Does fund size erode performance? Liquidity, organizational diseconomies and active money management, American Economic Review 94(5), 1276-1302. Chevalier, Judith and Glenn Ellison, 1999. Are some mutual fund managers better than others? Cross-sectional patterns in behavior and performance, Journal of Finance 54(3), pages 875-899. Cohen, L., A. Frazzini, and C. Malloy, 2008, The small world of investing: Board connections and mutual fund returns, Journal of Political Economy 116, 951-979. Coval, Joshua D., and Tobias J. Moskowitz, 1999, Home bias at home: Local equity preference in domestic portfolios, Journal of Finance 54, 2045–2074. Coval, Joshua D., and Tobias J. Moskowitz, 2001, The geography of investment: informed trading and asset prices, Journal of Political Economy 109 (4), 811–841. Corwin, S. and J. Coughenour, 2008, Limited attention and the allocation of effort in securities trading, Journal of Finance 63, 3031-3067. Cremers, Martijn and Petajisto, Antti, 2009, How active is your fund manager? A new measure that predicts performance, Review of Financial Studies 22, 3329-3365. Da, Z., J. Engelberg, and P. Gao, In search of attention, Journal of Finance 66, 1461-1499. DellaVigna, S. & J. Pollet, 2007, Demographics and Industry Returns, American Economic Review 97, 1667-1702. DellaVigna, S., and J. Pollet, 2009, Investor inattention and Friday earnings announcements. Journal of Finance 64: 709-749. Engelberg, J., and C. Parsons, 2011, The causal impact of media in financial markets, Journal of Finance 66, 67-97. Engelberg, J., C. Sasseville, and J. Williams, 2011, Market madness? The case of Mad Money, Management Science, forthcoming. Falkenstein, E., 1996, Preferences For stock characteristics as revealed by mutual fund portfolio holdings, Journal of Finance 51(1), 111-135.

- 29 -
Fang, Lily H. and Peress, Joel, 2009, Media coverage and the cross-section of stock returns, Journal of Finance, 64, 2023-2052.
Fama, E. F. and K. R. French, 1993, Common risk factors in the return on bonds and stocks, Journal of Financial Economics 33, 3-53. Ferson, Wayne E., and Rudi W. Schadt, 1996, Measuring Fund Strategy and Performance in Changing Economic Conditions, Journal of Finance 51, 425-461. Hirshleifer, D. and S. H. Teoh, 2003, Limited attention, information disclosure, and financial reporting, Journal of Accounting & Economics 36, 337-386. Hirschleifer, D., S. Lim, S. Teoh, 2009. Driven to distraction: Extraneous events and underreaction to earnings news. The Journal of Finance 64, 2289-2235.
Hirshleifer, D., S. Lim, and S. H. Teoh, 2011, Limited investor attention and stock market misreactions to accounting information, Review of Asset Pricing Studies, forthcoming.
Hou, K., Peng, L., and Xiong, W., 2006, A Tale of Two Anomalies: The Implication of Investor Attention for Price and Earnings Momentum, Working Paper.
Huberman, G., and T. Ragev, 2001, Contagious Speculation and a Cure for Cancer: A Non-Event that Made Stock Prices Soar, Journal of Finance 56, 387-396.
Ingersoll, J., M. Spiegel, W. Goetzmann, and I. Welch. 2007. Portfolio Performance Manipulation and Manipulation-proof Performance Measures, Review of Financial Studies 20: 1503-46.
Kacperczyk, M., and Seru, A., 2007, Fund manager user of public information: New evidence on managerial skills, Journal of Finance, 485-528. Kacperczyk, M. C. Sialm, and L. Zheng, 2005, On the industry concentration of actively managed equity mutual funds, Journal of Finance 60, 1983-2012. Kahneman, 1973, Attention and Effort, Prentice-Hall, Englewood, NJ. Nanda, V., Z. J. Wang, and L. Zheng, 2004, “Family Values and the Star Phenomenon: Strategies of Mutual Fund Families,” Review of Financial Studies 17(3), 667-698. Peress, Joel, 2008, Media coverage and investors’ attention to earnings announcements. Working paper, INSEAD. Peng, L. and W. Xiong, 2006, Investor attention, overconfidence and category learning, Journal of Financial Economics 80, 563-602. Solomon, D., E. Soltes, and D. Sosyura, 2011, The perils of public failure: the effect of portfolio holdings and media coverage on mutual fund flows, working paper.

- 30 -
Tetlock, Paul C., 2011, All the news that’s fit to reprint: Do investors react to stale information? Review of Financial Studies 24, 1481-1512.

- 31 -
Figure 1.a PROPENSITY_BUY_MEDIA and subsequent fund performance
This figure plots the performance in the subsequent quarter for the deciles of funds sorted by the funds’propensity to buy media coverage stocks (PROPENSITY_BUY_MEDIA). PROPENSITY_BUY_MEDIA is calculated according to equations (2) and (3) for each fund-quarter. We measure fund performance using the CAPM alpha, Fama and French 3-factor alpha, Carhart 4-factor alpha, Ferson and Schadt conditional alpha, and a manipulation-proof performance measure (Ingersoll et al., 2007). We report the average monthly performance during the quarter.
Figure 1.b PROPENSITY_SELL_MEDIA and subsequent fund performance
This figure plots the average performance for the deciles of funds sorted by their propensity to sell media coverage stocks (PROPENSITY_SELL_MEDIA). PROPENSITY_SELL_MEDIA is calculated according to equations (2) and (3) for each fund-quarter. We measure fund performance using the CAPM alpha, Fama and French 3-factor alpha, Carhart 4-factor alpha, Ferson and Schadt conditional alpha, and a manipulation-proof performance measure (Ingersoll et al., 2007). We report the average monthly performance during the quarter.
‐0.30%
‐0.20%
‐0.10%
0.00%
0.10%
0.20%
0.30%
1 2 3 4 5 6 7 8 9 10Alpha
Decile
CAPM alpha
3‐factor alpha
4‐factor alpha
Conditional 4‐factor alpha
Manipulation‐proof measure
‐0.30%
‐0.20%
‐0.10%
0.00%
0.10%
0.20%
0.30%
1 2 3 4 5 6 7 8 9 10
Apha
Decile
CAPM alpha
3‐factor alpha
4‐factor alpha
Conditional 4‐factor alpha
Manipulation‐proof measure
- 32 -
Figure 2. Evolution of PROPENSITY_BUY_MEDIA
This figure shows evolution of funds’ propensity to buy media coverage stocks (PROPENSITY_BUY_MEDIA) in the five years after initial sorting. PROPENSITY_BUY_MEDIA is calculated according to equations (2) and (3) for each fund-quarter. We then sort funds into PROPENSITY_BUY_MEDIA quintiles and trace each quintile cohorts’ subsequent average PROPENSITY_BUY_MEDIA quintile rank number over the next five years.
1.00
1.50
2.00
2.50
3.00
3.50
4.00
1 2 3 4 5
Quintile Rank
Years After Quintile Formation
Evolution of PBMC
QUINTILE 1:Low
QUINTILE 2
QUINTILE 3
QUINTILE 4
QUINTILE 5:High
- 33 -
Figure 3: Fund Alphas and Propensity to Hold High Media-Coverage Stocks (PHMC)
This figure plots the average performance for the deciles of funds sorted according to their propensities to hold media-coverage stocks (PROPENSITY_HOLD_MEDIA) in the previous quarter. PROPENSITY_HOLD_MEDIA is calculated similar to PROPENSITY_BUY_MEDIA and PROPENSITY_SELL_MEDIA for each fund-quarter. We measure fund performance using the CAPM alpha, Fama and French 3-factor alpha, Carhart 4-factor alpha, Ferson and Schadt conditional alpha, and a manipulation-proof performance measure (Ingersoll et al., 2007). We report the average monthly performance during the quarter.
- 34 -
Table 1. Media Data Descriptive Statistics
This table presents quarterly media coverage statistics. Panel A tabulates the percentage of our searched firms covered in a quarter by any of the four major newspapers combined, and each of the newspapers separately. Panel B tabulates number of articles per stock per quarter conditioned on having coverage. For brevity, we tabulate these statistics for select individual years – 1993, 1996, 1999, and 2002, and the overall average. Panel C tabulates the transition matrix between coverage types between consecutive quarters.
Any Newspaper WSJ NYT WP UT
1993 85.44% 61.77% 53.59% 9.36% 3.94%1996 85.52% 54.77% 65.48% 9.32% 3.20%1999 80.82% 66.69% 45.29% 12.96% 3.04%2002 75.59% 57.73% 44.91% 15.59% 3.15%
All Years 81.84% 60.24% 52.32% 11.80% 3.33%
Mean Median 75 Percentile Max1993 3.88 2 4 1641996 3.72 2 4 1081999 4.29 2 4 1092002 4.93 2 5 88
All Years 4.21 2 4 117
No-coverag Low-coverage High-coverage
No Coverage 53.12% 40.01% 6.87%
Low-coverage 12.91% 66.85% 20.23%
High-coverage 3.51% 29.73% 66.77%
Panel A: % of stocks covered by:
Panel B: Conditional Coverage Statistics
Panel C: Transition Matrix between Coverage Types
- 35 -
Table 2. Comparing Our Sample with Overall Fund Universe
This table presents statistics pertaining to the representativeness of our sample. Media coverage data is collected from LexisNexis for all NYSE stocks and 500 randomly selected Nasdaq stocks. Because this set of stocks (which we call our “searched universe”) does not contain all listed stocks, we exclude funds that do not hold any of the stocks in the searched universe. Panel A compares key fund characteristics between the overall fund CRPS/Thomson Financial fund universe and our fund sample. Panel B tabulates the mean percentage of funds’ trades (dollar value) accounted by our searched universe of stocks in each quarter. *, **, *** indicates significance at the 10%, 5%, 1% levels, respectively.
Fund Universe Our Sample t-statNAV 866 983 -2.22 **
Expense Ratio 0.0132 0.0125 5.92 ***Turnover 0.93 0.81 5.69 **
Age 20.18 20.95 -3.51 ***
1-Factor Alpha -0.0006 -0.0010 0.703-Factor Alpha -0.0013 -0.0015 0.824-Factor Alpha -0.0015 -0.0012 -0.51
All FundsAggressive
Growth Growth Growth/IncomeBuys 70.81% 58.89% 66.30% 84.80%Sells 71.35% 58.42% 66.71% 84.51%
Panel A: Comparing All-funds Universe with Our Sample
Panel B: Percentage of Trades Accounted for by Searched Stocks
- 36 -
Table 3: Media Coverage and Trading Activity: Univariate Comparison
This table reports funds’ buys and sells in stocks with different amount of media coverage. Percentage buys/sells is calculated as dollar amount of buys/sells, as in Equations 1a and 1b scaled by the fund’s holdings of the same set of stocks at the end of the previous quarter. Funds buys and sells are inferred from quarterly changes in fund holdings. Each quarter, we divide the sample of stocks into no-, low-, and high-media coverage groups. No-coverage stocks are first identified and the remaining stocks are then split into two equal-size groups, the high and low coverage groups. The fund investment styles, e.g. Aggressive Growth, Growth, Growth/Income) are defined in the CDA/Spectrum mutual fund holdings data. *, **, *** indicates significance at the 10%, 5%, 1% levels, respectively.
No-media Stocks
Low-media Stocks
High-media Stocks
Buys 1.52% 2.41% 4.51% -8.22 *** -11.94 *** -18.17 ***
Sells 1.75% 2.93% 4.53% -12.58 *** -10.39 *** -18.15 ***
Buys 2.44% 4.03% 3.64% -6.00 *** 0.91 -2.85 ***
Sells 1.97% 3.22% 3.60% -5.98 *** 0.64 -2.79 ***
Buys 2.00% 3.11% 4.75% -6.69 *** -6.48 *** -11.75 ***
Sells 1.65% 2.56% 4.17% -7.26 *** -6.13 *** -9.45 ***
Panel B: Aggressive Growth Funds
Panel C: Growth Funds
Panel D: Growth/Income Funds
t -stats for Differences
No - Low Low - High No - High
Panel A: All Funds
Percentage Trading In:
- 37 -
Table 4: Media Coverage and Trading Activity: Regression Analysis
This table reports panel regression results of mutual fund trades on media coverage types. The dependent variable is fund buys (Panel A) and sells (Panel B) during a quarter, inferred from quarterly changes in fund holdings. Media 1-4 are four different measures of a stock’s media coverage. All media measures are lagged and reflect the previous quarter’s media coverage. Log(number of articles) is log of one plus the number of articles about a stock in the past quarter. Coverage type is a discrete variable equaling 0, 1, and 2 if the stocks has no, low, or high coverage in the past quarter, respectively. Covered indicator is a dummy variable equaling 1 if the stock has media coverage and 0 otherwise in the past quarter. High coverage indicator is a dummy variable equaling 1 if the stocks has above-medium coverage and 0 otherwise in the past quarter. Size is the natural log of 1 plus the market capitalization of equity, measured at the end of the previous quarter. Size Squared is the square of size. B/M is the book-to-market ratio of the stock measured at the end of the previous quarter. Past return is a discrete variable indicating the decile rank of the stock’s return in the previous quarter; 1 indicates the lowest return decile and 10 indicates the highest return decile. Standard errors are clustered at the stock level. *, **, *** indicates significance at the 10%, 5%, 1% levels, respectively.
Media 1 - Log(Number of articles) 0.094 2.06 **
Media 2 - Coverage type 0.1164 2.88 ***
Media 3 - Covered indicator 0.1042 2.28 **
Media 4 - High coverage indicator 0.1281 2.26 **
Size -4.1568 -9.45 *** -4.2668 -9.93 *** -4.2628 -9.84 ***
Size Squared 0.1697 10.91 *** 0.1737 11.51 *** 0.1736 11.39 ***
B/M -0.0036 -0.97 -0.0035 -0.94 -0.0035 -0.95
Past Return 0.0344 3.74 *** 0.0340 3.74 *** 0.0340 3.74 ***
Quarter Fixed Effects Yes Yes Yes
Fund Fixed Effects Yes Yes Yes
Clustered by Firm Yes Yes Yes
Number of Observations 1,890,837 1,890,837 1,890,837R-squared 0.162 0.162 0.162
Media 1 - Log(Number of articles) -0.0215
Media 2 - Coverage type 0.0542
Media 3 - Covered indicator 0.166 2.16 **
Media 4 - High coverage indicator -0.0512 -0.65Size -5.7962 -7.89 *** -5.8185 -8.01 *** -5.8504 -8.01 ***
Size2
0.2424 9.51 *** 0.2424 9.68 *** 0.2436 9.67 ***
B/M -0.0103 -1.23 -0.0102 -1.20 -0.01 -1.18Past Return 0.0813 6.57 *** 0.0827 6.59 *** 0.0824 6.58 ***
Quarter Fixed Effects Yes Yes YesFund Fixed Effects Yes Yes YesClustered by Firm Yes Yes YesNumber of Observations 921,193 921,193 921,193R-squared 0.193 0.193 0.193
Model 1 Model 2 Model 3Panel A: Buys
Model 1 Model 2 Model 3
Panel B: Sells
- 38 -
Table 5. Statistics of PROPENSITY_BUY_MEDIA and PROPENSITY_SELL_MEDIA
This table reports the summary statistics for funds’ propensities to buy and sell media coverage stocks. Each quarter, we estimate cross-sectional regressions of funds’ buys and sells of individual stocks on the stocks past media coverage and size according to the following equations:
tiftitftitftitftif SizeCoverageCoverageBuy ,,1,3
,2,2
,1,1
,,, ***
tiftitftitftitftif SizeCoverageCoverageSell ,,1,3
,2,2
,1,1
,,, ***
where tifbuy ,,$ (
tifsell ,,$ ) is the dollar amount of fund f’s purchases (sales) of individual stock i during quarter t;
1, tiCoverage and 2, tiCoverage the log number of media articles about a stocks in the previous two quarters,
respectively; 1, tiSize is the stock’s market capitalization at the end of the previous quarter. We then calculate
PROPENSITY_BUY_MEDIA and PROPENSITY_SELL_MEDIA as the sum of the partial R-squared of the two lagged media variables. Coef_lag1 and Coef_lag2 are the regression coefficients of the 1st and 2nd lagged media variables, respectively. Partial R-squared Lag1 and Partial R-squared Lag2 are the partial R-squared associated with each lagged media variable, respectively. The reported statistics are calculated using the cross-section of funds in each quarter, and then averaged across quarters.
Mean Std Dev. P25 P50 P75
Coef_lag1 129.61 4292.89 -101.34 4.32 160.91
Coef_lag2 24.41 4481.84 -123.09 0.89 137.28
Partial R-squared Lag 1 0.06 0.10 0.01 0.02 0.07
Partial R-squared Lag 2 0.05 0.10 0.00 0.01 0.04
PROPENSITY_BUY_MEDIA 0.10 0.16 0.02 0.06 0.12
Mean Std Dev. P25 P50 P75
Coef_lag1 224.83 20457.23 -180.86 3.84 246.58
Coef_lag2 64.38 17620.44 -202.72 -0.29 199.12
Partial R-squared Lag 1 0.13 0.21 0.01 0.04 0.14
Partial R-squared Lag 2 0.11 0.21 0.01 0.03 0.11
PROPENSITY_SELL_MEDIA 0.24 0.33 0.04 0.11 0.27
Panel A: Buys
Panel B: Sells
- 39 -
Table 6. Relation between Propensity to Buy and Sell Media-stocks and Other Fund Characteristics
In this table we present statistics of select fund characteristics for different PROPENSITY_BUY_MEDIA and PROPENSITY_SELL_MEDIA deciles and the correlation between PROPENSITY_BUY_MEDIA and PROPENSITY_SELL_MEDIA with these statistics. Propensity is the average propensity measure for each decile. Expenses is the funds’ expense ratio. Turnover is the funds’ annual turnover. Fund Size is the log of the fund’s TNA. Fund Age is years since fund inception, measured in 2005. New Money Growth is the percentage flow of funds into a mutual fund in a quarter, calculated as the difference between current TNA and lagged TNA multiplied by the fund return, scaled by lagged TNA. *, **, *** indicates significance at the 10%, 5%, 1% levels, respectively.
PROPENSITY_BUY_MEDIA Decile Propensity Expense Turnover Fund Size Age New Money Growth
Decile 1 (Low) 0.0035 1.20% 78.34% 5.29 21.72 25.59
Decile 2 0.0111 1.21% 77.00% 5.29 21.52 23.35
Decile 3 0.0199 1.19% 76.98% 5.26 21.21 15.85
Decile 4 0.0309 1.20% 78.64% 5.22 21.53 12.45
Decile 5 0.0438 1.21% 75.95% 5.23 21.47 27.08
Decile 6 0.0594 1.21% 85.06% 5.29 20.94 25.45
Decile 7 0.0798 1.24% 81.04% 5.26 21.09 23.85
Decile 8 0.1095 1.23% 81.40% 5.15 19.66 23.35
Decile 9 0.1575 1.24% 85.90% 5.14 20.05 27.59
Decile 10 (High) 0.3618 1.37% 86.70% 4.74 19.64 6.20
High - Low 0.3583 0.17% 8.37% -0.55 -2.08 -19.39
t -stat (High - Low) 44.62 5.98 2.14 -9.90 -2.59 -2.39
Correaltion with PBMC 1.00 0.11 0.02 -0.09 -0.04 -0.01
Significance of correlation *** *** *** *** **
PROPENSITY_SELL_MEDIA Decile Propensity Expense Turnover Fund Size Age New Money Growth
Decile 1 (Low) 0.0072 1.18% 95.44% 5.44 21.78 13.98
Decile 2 0.0221 1.20% 92.35% 5.42 21.49 23.08
Decile 3 0.0401 1.20% 93.82% 5.38 21.22 7.81
Decile 4 0.0618 1.21% 85.12% 5.43 21.34 19.48
Decile 5 0.0894 1.22% 86.94% 5.43 21.55 -0.55
Decile 6 0.1247 1.24% 87.23% 5.34 20.84 35.81
Decile 7 0.1774 1.22% 84.03% 5.23 20.82 24.05
Decile 8 0.2627 1.25% 75.56% 5.08 20.53 25.67
Decile 9 0.4472 1.24% 62.90% 4.93 19.98 35.10
Decile 10 (High) 1.0518 1.33% 47.10% 4.39 19.57 23.68
High - Low 1.0445 0.15% -48.34% -1.05 -2.21 9.69
t -stat (High - Low) 69.74 6.62 -18.29 -16.20 -1.83 0.96
Correaltion with PSMC 1.00 0.06 -0.13 -0.16 -0.03 0.02
Significance of correlation *** *** *** *** **
Panel A: Buys
Panel B: Sells

- 40 -
Table 7. Propensity to Buy and Sell Media Stocks and Future Fund Performance: Uni-variate Sorts
This table reports various measures of future fund performance for fund deciles sorted by the funds’ propensity to buy media coverage stocks (PROPENSITY_BUY_MEDIA), and by the funds’ propensity to sell media coverage stocks (PROPENSITY_SELL_MEDIA). PROPENSITY_BUY_MEDIA and PROPENSITY_SELL_MEDIA are estimated according to equations (2) and (3) for each fund-quarter. Performance measures for the next quarter are tabulated. Figures are reported in decimal points per month.
CAPM Alpha
Fama-French Alpha
4-factor Alpha
Conditional 4-factor Alpha
Manipulation -proof Measure
Decile 1 (Low) -0.0004 -0.0013 -0.0007 -0.0007 0.0021Decile 2 -0.0011 -0.0014 -0.0009 -0.0012 0.0014Decile 3 -0.0009 -0.0014 -0.0010 -0.0008 0.0017Decile 4 -0.0006 -0.0012 -0.0008 -0.0004 0.0024Decile 5 -0.0015 -0.0016 -0.0012 -0.0012 0.0012Decile 6 -0.0014 -0.0019 -0.0017 -0.0016 0.0011Decile 7 -0.0012 -0.0018 -0.0015 -0.0009 0.0013Decile 8 -0.0014 -0.0014 -0.0014 -0.0013 0.0010Decile 9 -0.0015 -0.0017 -0.0015 -0.0010 0.0010Decile 10 (High) -0.0026 -0.0023 -0.0018 -0.0018 0.0005High - Low -0.0021 -0.0010 -0.0011 -0.0011 -0.0017t -stat (High - low) -3.5444 -2.0836 -2.1553 -1.8953 -2.9269
CAPM Alpha
Fama-French Alpha
4-factor Alpha
Conditional 4-factor Alpha
Manipulation -proof Measure
Decile 1 (Low) -0.0012 -0.0015 -0.0012 -0.0010 0.0016t-stat -1.0752 -2.8085 -1.9902 -1.7331 0.3040Decile 2 -0.0012 -0.0016 -0.0013 -0.0011 0.0014Decile 3 -0.0014 -0.0019 -0.0016 -0.0012 0.0014Decile 4 -0.0017 -0.0020 -0.0015 -0.0011 0.0014Decile 5 -0.0009 -0.0015 -0.0012 -0.0012 0.0016Decile 6 -0.0013 -0.0015 -0.0014 -0.0015 0.0012Decile 7 -0.0015 -0.0020 -0.0017 -0.0013 0.0011Decile 8 -0.0014 -0.0014 -0.0012 -0.0009 0.0008Decile 9 -0.0014 -0.0018 -0.0013 -0.0010 0.0011Decile 10 (High) -0.0009 -0.0012 -0.0005 -0.0007 0.0016High - Low 0.0003 0.0003 0.0007 0.0004 0.0000t -stat (High - low) 0.3727 0.5936 1.6660 0.7736 -0.0155
Panel A: Sorting by PROPENSITY_BUY_MEDIA
Panel B: Sorting by PROPENSITY_SELL_MEDIA

- 41 -
Table 8: Propensity to Buy and Sell Media-coverage Stocks and Future Fund Performance: Panel Regressions
This table examines the relation between funds’ propensity to buy media-coverage stocks (PROPENSITY_BUY_MEDIA, Panel A), and funds’ propensity to sell media-coverage stocks (PROPENSITY_SELL_MEDIA, Panel B) and future fund performance using panel regression setting. PROPENSITY_BUY_MEDIA and PROPENSITY_SELL_MEDIA are estimated according to equations (2) and (3) for each fund quarter, and decile ranks are used in the regression. The dependent variables are measures of funds’ performance in the next quarter, measured in basis points per month. Propensity_decile is the decile rank of the relevant propensity measure. Fund size is the natural log of 1 plus the fund’s TNA. Fund family size is the natural log of one plus the fund family TNA. Expense is the fund’s expense ratio. Turnover is the funds’ annual turnover. Fund age is years since fund inception, measured in 2005. AG and G are indicator variables for Aggressive Growth, and Growth funds, respectively. Active Share is the funds’ share of portfolio holdings that differ from benchmark index (Cremers and Petajisto (2009)). Average Firm Size is the average size score (in a scale between 1-small cap stocks to 5-large cap stocks) of the stocks that the fund holds. All independent variables are lagged by one quarter. The t-statistics reported are based on robust standard errors clustered by fund. *, **, *** indicates significance at the 10%, 5%, 1% levels, respectively.
Coef. t-stat Coef. t-stat Coef. t-stat Coef. t-stat Coef. t-statPROPENSITY Decile -1.7830 -4.36 *** -0.8310 -2.64 *** -1.3510 -4.33 *** -0.7290 -2.09 ** -2.1170 -4.84 ***Fund Size 0.0010 0.71 0.0030 3.48 *** 0.0010 0.92 0.0010 0.65 0.0010 1.20Fund Family size 0.0000 -0.38 -0.0020 -2.70 *** -0.0010 -1.06 0.0000 -0.32 0.0000 -0.57Expense -1.3930 -4.33 *** -0.7890 -3.18 *** -1.4230 -5.80 *** -1.1980 -4.36 *** -0.9130 -2.76 ***Turnover -0.0010 -1.00 0.0000 -0.43 -0.0050 -4.90 *** -0.0030 -2.88 *** -0.0070 -4.64 ***Age -0.0090 -3.52 *** -0.0070 -3.85 *** -0.0070 -3.67 *** -0.0060 -2.66 *** -0.0060 -2.32 **Aggressive Growth -0.0090 -1.57 0.0050 1.14 -0.0210 -5.18 *** -0.0030 -0.70 -0.0300 -5.21 ***Growth -0.0020 -0.82 0.0070 3.51 *** -0.0070 -3.47 *** -0.0010 -0.50 -0.0130 -4.46 ***Active Share 0.0090 1.31 -0.0140 -2.69 *** 0.0200 3.97 *** 0.0170 3.06 *** 0.0050 0.78Average Firm Size -0.0080 -4.63 *** 0.0010 1.02 -0.0030 -1.83 * 0.0030 1.92 * -0.0070 -3.77 ***Intercept 0.0360 2.62 *** -0.0140 -1.34 0.0090 0.88 -0.0040 -0.37 0.2470 17.1 ***Number of observations 18,634 18,634 18,634 18,634 21,439 R-squared 0.137 0.075 0.097 0.058 0.784
Panel A: PROPENSITY_BUY_MEDIA and future fund performanceManipulation -proof CAPM Alpha 3-Factor Alpha 4-Factor Alpha Cond'l 4-Factor Alpha
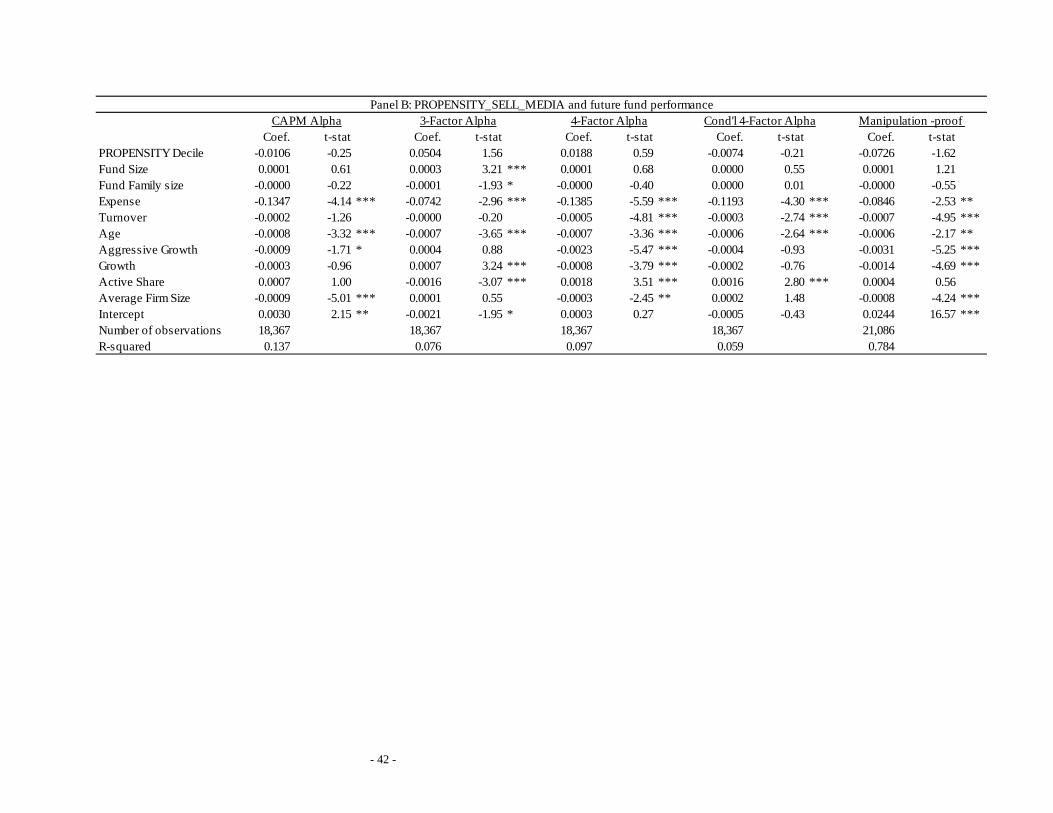
- 42 -
Coef. t-stat Coef. t-stat Coef. t-stat Coef. t-stat Coef. t-statPROPENSITY Decile -0.0106 -0.25 0.0504 1.56 0.0188 0.59 -0.0074 -0.21 -0.0726 -1.62Fund Size 0.0001 0.61 0.0003 3.21 *** 0.0001 0.68 0.0000 0.55 0.0001 1.21Fund Family size -0.0000 -0.22 -0.0001 -1.93 * -0.0000 -0.40 0.0000 0.01 -0.0000 -0.55Expense -0.1347 -4.14 *** -0.0742 -2.96 *** -0.1385 -5.59 *** -0.1193 -4.30 *** -0.0846 -2.53 **Turnover -0.0002 -1.26 -0.0000 -0.20 -0.0005 -4.81 *** -0.0003 -2.74 *** -0.0007 -4.95 ***Age -0.0008 -3.32 *** -0.0007 -3.65 *** -0.0007 -3.36 *** -0.0006 -2.64 *** -0.0006 -2.17 **Aggressive Growth -0.0009 -1.71 * 0.0004 0.88 -0.0023 -5.47 *** -0.0004 -0.93 -0.0031 -5.25 ***Growth -0.0003 -0.96 0.0007 3.24 *** -0.0008 -3.79 *** -0.0002 -0.76 -0.0014 -4.69 ***Active Share 0.0007 1.00 -0.0016 -3.07 *** 0.0018 3.51 *** 0.0016 2.80 *** 0.0004 0.56Average Firm Size -0.0009 -5.01 *** 0.0001 0.55 -0.0003 -2.45 ** 0.0002 1.48 -0.0008 -4.24 ***Intercept 0.0030 2.15 ** -0.0021 -1.95 * 0.0003 0.27 -0.0005 -0.43 0.0244 16.57 ***Number of observations 18,367 18,367 18,367 18,367 21,086R-squared 0.137 0.076 0.097 0.059 0.784
4-Factor Alpha Cond'l 4-Factor Alpha Manipulation -proof CAPM Alpha 3-Factor AlphaPanel B: PROPENSITY_SELL_MEDIA and future fund performance
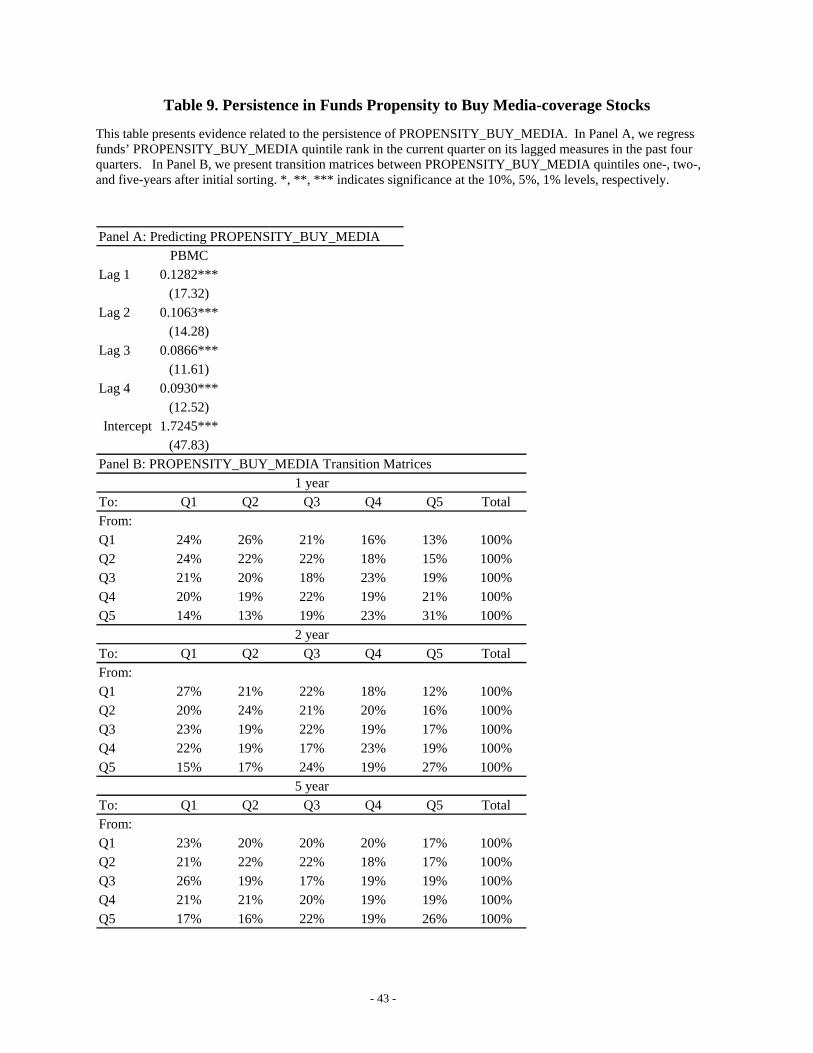
- 43 -
Table 9. Persistence in Funds Propensity to Buy Media-coverage Stocks
This table presents evidence related to the persistence of PROPENSITY_BUY_MEDIA. In Panel A, we regress funds’ PROPENSITY_BUY_MEDIA quintile rank in the current quarter on its lagged measures in the past four quarters. In Panel B, we present transition matrices between PROPENSITY_BUY_MEDIA quintiles one-, two-, and five-years after initial sorting. *, **, *** indicates significance at the 10%, 5%, 1% levels, respectively.
Panel A: Predicting PROPENSITY_BUY_MEDIAPBMC
Lag 1 0.1282***(17.32)
Lag 2 0.1063***(14.28)
Lag 3 0.0866***(11.61)
Lag 4 0.0930***(12.52)
Intercept 1.7245***(47.83)
Panel B: PROPENSITY_BUY_MEDIA Transition Matrices
To: Q1 Q2 Q3 Q4 Q5 TotalFrom:Q1 24% 26% 21% 16% 13% 100%Q2 24% 22% 22% 18% 15% 100%Q3 21% 20% 18% 23% 19% 100%Q4 20% 19% 22% 19% 21% 100%Q5 14% 13% 19% 23% 31% 100%
To: Q1 Q2 Q3 Q4 Q5 TotalFrom:Q1 27% 21% 22% 18% 12% 100%Q2 20% 24% 21% 20% 16% 100%Q3 23% 19% 22% 19% 17% 100%Q4 22% 19% 17% 23% 19% 100%Q5 15% 17% 24% 19% 27% 100%
To: Q1 Q2 Q3 Q4 Q5 TotalFrom:Q1 23% 20% 20% 20% 17% 100%Q2 21% 22% 22% 18% 17% 100%Q3 26% 19% 17% 19% 19% 100%Q4 21% 21% 20% 19% 19% 100%Q5 17% 16% 22% 19% 26% 100%
2 year
1 year
5 year
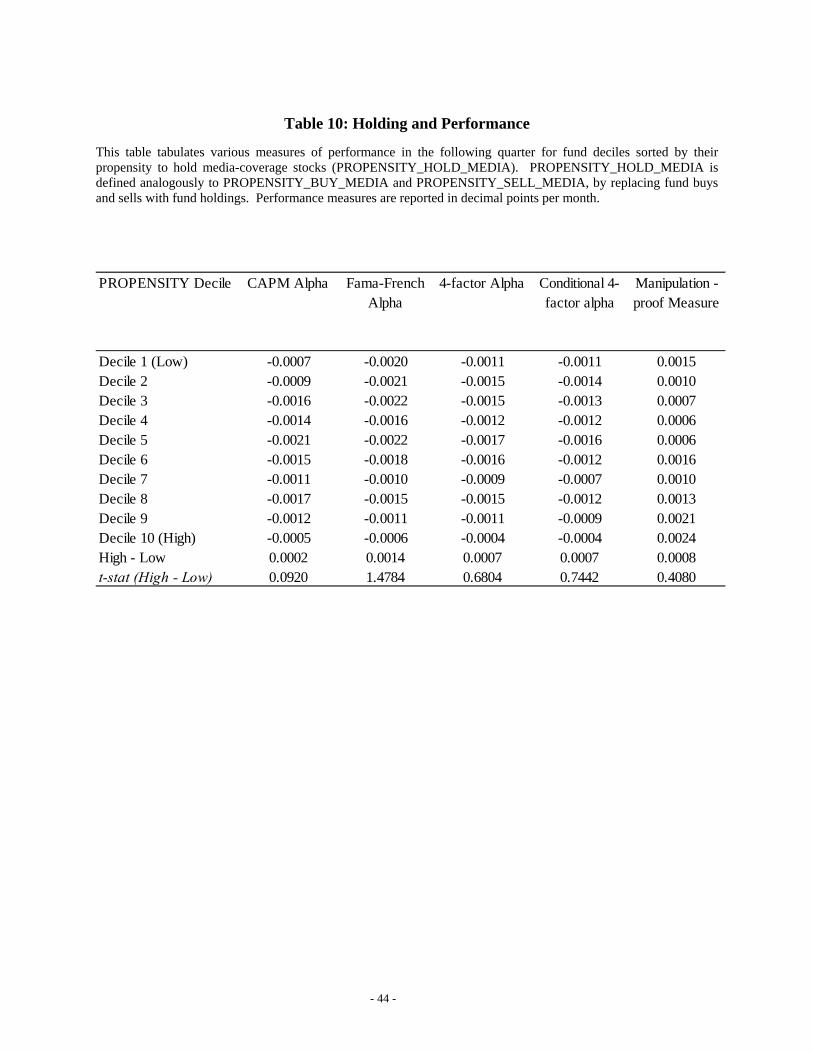
- 44 -
Table 10: Holding and Performance
This table tabulates various measures of performance in the following quarter for fund deciles sorted by their propensity to hold media-coverage stocks (PROPENSITY_HOLD_MEDIA). PROPENSITY_HOLD_MEDIA is defined analogously to PROPENSITY_BUY_MEDIA and PROPENSITY_SELL_MEDIA, by replacing fund buys and sells with fund holdings. Performance measures are reported in decimal points per month.
PROPENSITY Decile CAPM Alpha Fama-French Alpha
4-factor Alpha Conditional 4-factor alpha
Manipulation -proof Measure
Decile 1 (Low) -0.0007 -0.0020 -0.0011 -0.0011 0.0015Decile 2 -0.0009 -0.0021 -0.0015 -0.0014 0.0010Decile 3 -0.0016 -0.0022 -0.0015 -0.0013 0.0007Decile 4 -0.0014 -0.0016 -0.0012 -0.0012 0.0006Decile 5 -0.0021 -0.0022 -0.0017 -0.0016 0.0006Decile 6 -0.0015 -0.0018 -0.0016 -0.0012 0.0016Decile 7 -0.0011 -0.0010 -0.0009 -0.0007 0.0010Decile 8 -0.0017 -0.0015 -0.0015 -0.0012 0.0013Decile 9 -0.0012 -0.0011 -0.0011 -0.0009 0.0021Decile 10 (High) -0.0005 -0.0006 -0.0004 -0.0004 0.0024High - Low 0.0002 0.0014 0.0007 0.0007 0.0008t-stat (High - Low) 0.0920 1.4784 0.6804 0.7442 0.4080