Does Infrastructure Contribute To Economic Growth? Micro ... · Does Infrastructure Contribute To...
21
Dr Atif Ansar Blavatnik School of Government University of Oxford Does Infrastructure Contribute To Economic Growth? Micro-level Evidence From Transportation Projects In China
Transcript of Does Infrastructure Contribute To Economic Growth? Micro ... · Does Infrastructure Contribute To...

Dr Atif Ansar
Blavatnik School of Government
University of Oxford
Does Infrastructure Contribute To Economic
Growth? Micro-level Evidence From
Transportation Projects In China
© Atif Ansar, all rights reserved Disruptive Thinking. Delivered.
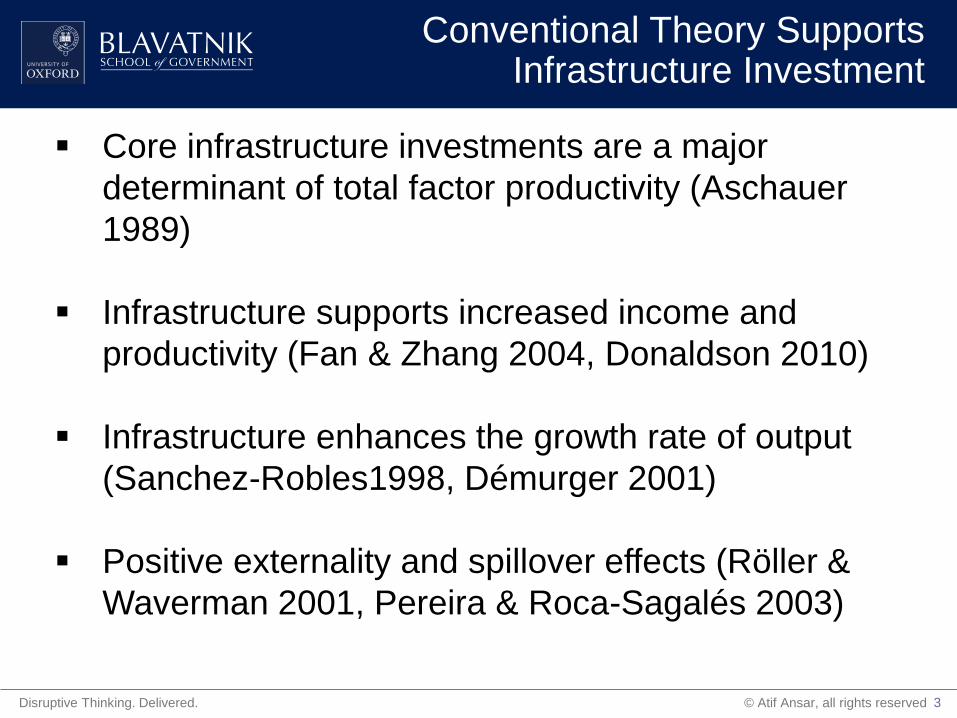
Conventional Theory Supports Infrastructure Investment
Core infrastructure investments are a major
determinant of total factor productivity (Aschauer
1989)
Infrastructure supports increased income and
productivity (Fan & Zhang 2004, Donaldson 2010)
Infrastructure enhances the growth rate of output
(Sanchez-Robles1998, Démurger 2001)
Positive externality and spillover effects (Röller &
Waverman 2001, Pereira & Roca-Sagalés 2003)
3

© Atif Ansar, all rights reserved Disruptive Thinking. Delivered.
Conventional Theory: Propositions
Proposition 1
- A larger stock of infrastructure will fuel economic growth by raising
private investment.
Proposition 2
- Non-military infrastructure investment acts as a cost-saving mechanism
through productivity gains of input factors even in the private sector.
Proposition 3
- Infrastructure causes growth by reducing the cost of production and
transportation of goods and services, which increases competitiveness.
Proposition 4
- Investment in infrastructure creates wider economic benefits.
4

© Atif Ansar, all rights reserved Disruptive Thinking. Delivered.
1. Creates direct employment
2. Large share of domestic inputs relative to imports
3. Improves productivity by lowering producer costs
4. Benefits consumers through better services
5. Has potential for improving environment
Why Infrastructure Investments Appear So Appealing
Fine Print: If it is done right!
5

© Atif Ansar, all rights reserved Disruptive Thinking. Delivered.
Case in Point: China
6 6
6
Case in Point: China
1. In the five years 2004-8,
China has spent more on
infrastructure in real terms
than in the whole of the 20th
Century.
2. In the four years 2005-8,
China has built as many
miles of high-speed rail as
Europe in two decades.

© Atif Ansar, all rights reserved Disruptive Thinking. Delivered.
Large
Dams
-11%
7 of 10
44%
10%
8.6
96%
Olympics
7.0
Roads
5.5
Energy
7.8
IT
3.3
Links
8.0
Rail
Ø duration (years)
Cost overrun 219% 20% 36% 107% 34% 45%
Benefits
shortfall n/a 10% n/a -29% n/a -51%
Frequency of
cost overrun 10 of 10 9 of 10 6 of 10 5 of 10 9 of 10 9 of 10
Schedule
overrun 0% 38% 38% 37% 23% 45%
Cost
Black Swans 6% 7% 18% 5% 9% 6%
5.3
Infrastructure & Growth Paradox
7
Infrastructure Major Project Performance Map*
Despite tall claims in the theoretical literature about the macro-level positive effects of large
infrastructure investments, the economic, social, and environmental track record at the project-level is
strikingly poor. Can the macro versus micro-level evidence be reconciled?
*Source: Bent Flyvbjerg, Atif Ansar, Alexander Budzier, Chantal Cantarelli, Allison Stewart and colleagues, University of Oxford.
© Atif Ansar, all rights reserved Disruptive Thinking. Delivered.
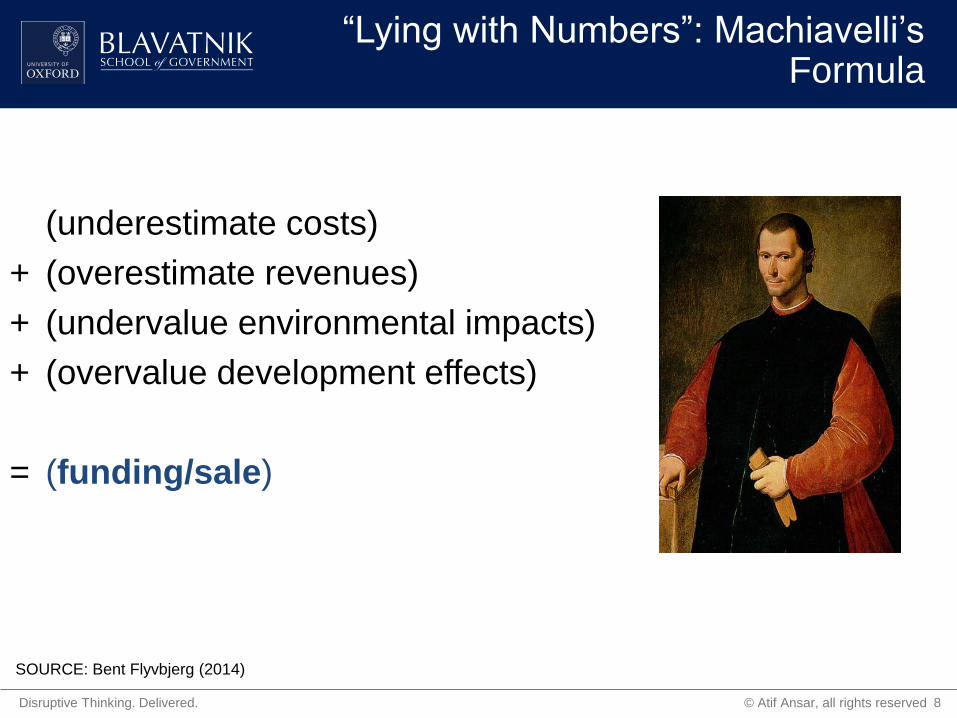
“Lying with Numbers”: Machiavelli’s Formula
(underestimate costs)
+ (overestimate revenues)
+ (undervalue environmental impacts)
+ (overvalue development effects)
= (funding/sale)
8
SOURCE: Bent Flyvbjerg (2014)

© Atif Ansar, all rights reserved Disruptive Thinking. Delivered.
Inverted Darwinism
Max(B/C) at approval
= Max(benefit shortfall, cost overrun) at implementation
= Max (size and frequency of disasters)
= Survival of the un-fittest!
9
SOURCE: Bent Flyvbjerg (2009)
© Atif Ansar, all rights reserved Disruptive Thinking. Delivered.
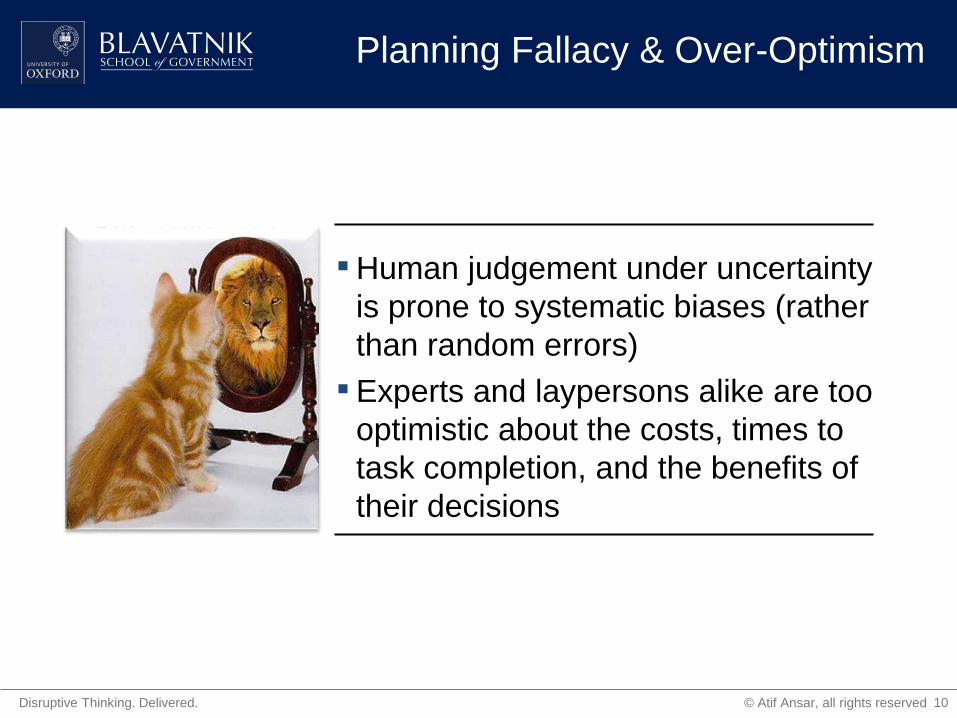
Planning Fallacy & Over-Optimism
10
▪ Human judgement under uncertainty
is prone to systematic biases (rather
than random errors)
▪ Experts and laypersons alike are too
optimistic about the costs, times to
task completion, and the benefits of
their decisions

© Atif Ansar, all rights reserved Disruptive Thinking. Delivered.
Data & Methods
11
Methodologically, our approach is motivated by the use of multiple cases grounded in Eisenhardt’s (1989, 1991) call that
by enabling the identification of “cross-case patterns” (Eisenhardt, 1989: 540), “multiple cases are a powerful means to
create theory because they permit replication and extension among individual cases” (Eisenhardt, 1991: 620)
We chose to study six typical cases of road transportation investments in China financed by the World Bank (WB)
and/or the Asian Development Bank (ADB)
We chose WB/ADB (collectively, International Financial Institutions, IFIs) financed projects for the following reasons:
i) IFI documents are broadly consistent from project to project making it possible to conduct cross-case comparisons
across time and geography;
ii) Documents are publicly available, or disclosure can be sought, and open to public challenge with regards to their
veracity;
iii) Documents contain valid, reliable, and verifiable ex ante and ex post data on the physical scope, schedule, cost,
and demand of projects—most of the essential data we needed that fit our criteria to evaluate investment outcomes
as also described in seminal planning literature (Pickrell, 1989, 1992; Flyvbjerg et al. 2002, 2003).
We chose road transportation projects as our empirical setting because:
i) On the demand-side, road transportation is considered to be one of the most basic and homogenous social goods
with inelastic demand. Reducing transport costs is seen as the essential feature of infrastructure investments.
Consequently, literature suggests that demand for roads is easily predictable. If the conventional theory could be
shown to be weak in its application even to roads, its overall validity can be brought under serious doubt.
ii) On the supply-side, the design of conventional road assets and networks are seen as a widely studied engineering
problem, or what conventional theory might consider “a standardized production technology” (Sidak and Spulber,
1997). The cost of supplying roads should contain few surprises, the convention theory predicts.
We chose China because:
i) The country has experienced high economic growth routinely associated with its high infrastructure spending
ii) China is perceived to be competitive advantage in delivering infrastructure due to low input costs, an autocratic
political system and perceived high demand due to a large population.
© Atif Ansar, all rights reserved Disruptive Thinking. Delivered.
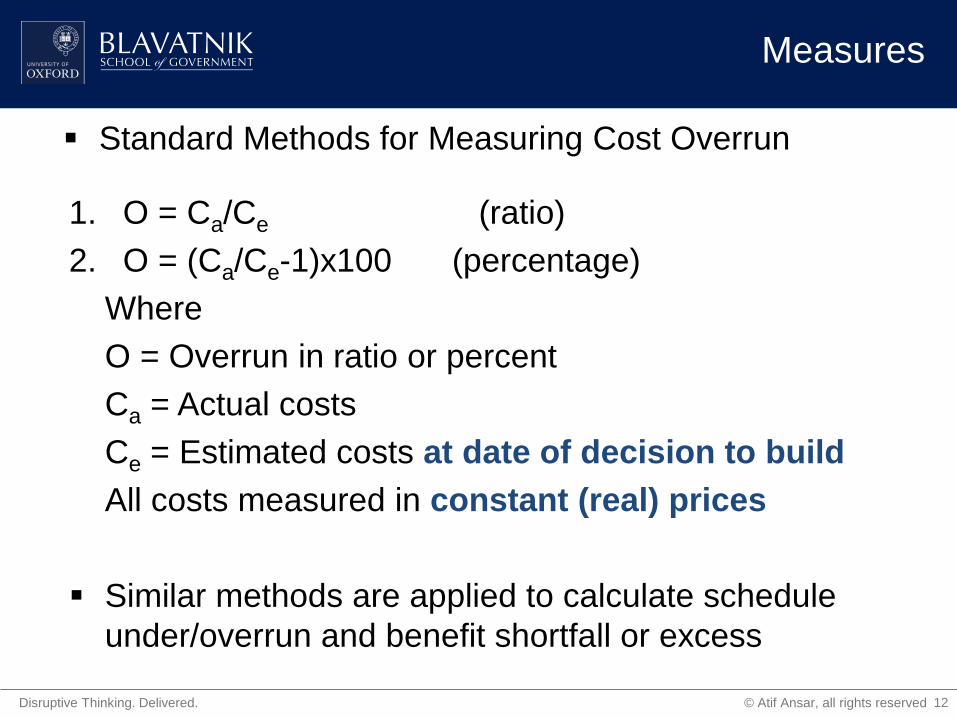
Measures
1. O = Ca/Ce (ratio)
2. O = (Ca/Ce-1)x100 (percentage)
Where
O = Overrun in ratio or percent
Ca = Actual costs
Ce = Estimated costs at date of decision to build
All costs measured in constant (real) prices
Similar methods are applied to calculate schedule
under/overrun and benefit shortfall or excess
12
Standard Methods for Measuring Cost Overrun

© Atif Ansar, all rights reserved Disruptive Thinking. Delivered.
Evidence from China
World Bank or
Asian
Development Bank
ID
Project Name Type Physical Features, at opening
Date of
Decision
(DoD) to
Build
(yr:mo)
Estimated
Schedule
(Years)
Actual
Schedule
(Years)
Schedule
Overrun
Ratio
Cost
Overrun
Ratio (RMB
constant
prices)
Benefit
Shortfall
Ratio
1387-PRC
Baodi-Shanhaiguan
(section of Beijing-
Qinhuangdao (Jing-
Qin)) Expressway,
1995-1999
Road - Expressway 199 km toll expressway, 2X2 lns, 3.75 m width
for each driving lane. 1995:5 5.1 3.7 0.73 1.15 0.59
1325-PRC
Chuxiong-Dali
Expressway, 1994-
1998
Road - Expressway 179 km toll expressway, 2X2 lns 1994:4 4.1 4.3 1.05 1.31 0.47
P040513 Luoyang-Sanmenxia
Highway, 1996-2001 Road - Expressway
136 km toll expressway, 2X2 lns, including
supply and installation of electrical, electronic
and mechanical equipment for toll collection,
telecommunication and lighting facilities, as well
as construction of service areas and
management and maintenance buildings
1996:5 5.1 5.6 1.1 1.24 0.55
P003530 Sanyuan-Tongchuan
Highway, 1987-1993
Road - Class 1
Highway
51.3 km toll Class 1 Highway, 2X2 lns,
(includes an additional 15.1 km two-lane class
II highway)
1987:6 3.6 6 1.67 1.44 0.51
P041268
Tucheng-Changsha
Expressway, 1999-
2002
Road - Expressway
183 km toll expressway, 2X2 lns, (an additional
30km of 2 lane interconnecting approaches).
Includes 11 interchanges, service areas,
facilities for expressway administration and
maintenance and electrical and mechanical
(E&M) installations for toll collection, traffic
monitoring, telecommunications and lighting.
1999:6 3.2 3.4 1.06 1.26 0.76
1691-PRC
Yuanjiang-Mohei
Expressway, 1999-
2003
Road - Expressway
147 km toll expressway, 2X2 lns, including nine
interchanges as planned at appraisal, large and
medium bridges totaling about 31,409 linear
meters, and tunnels totaling about 12,764 linear
meters. 3 service areas.
1999:01 4.8 5 1.04 1.24 0.51
13
© Atif Ansar, all rights reserved Disruptive Thinking. Delivered.
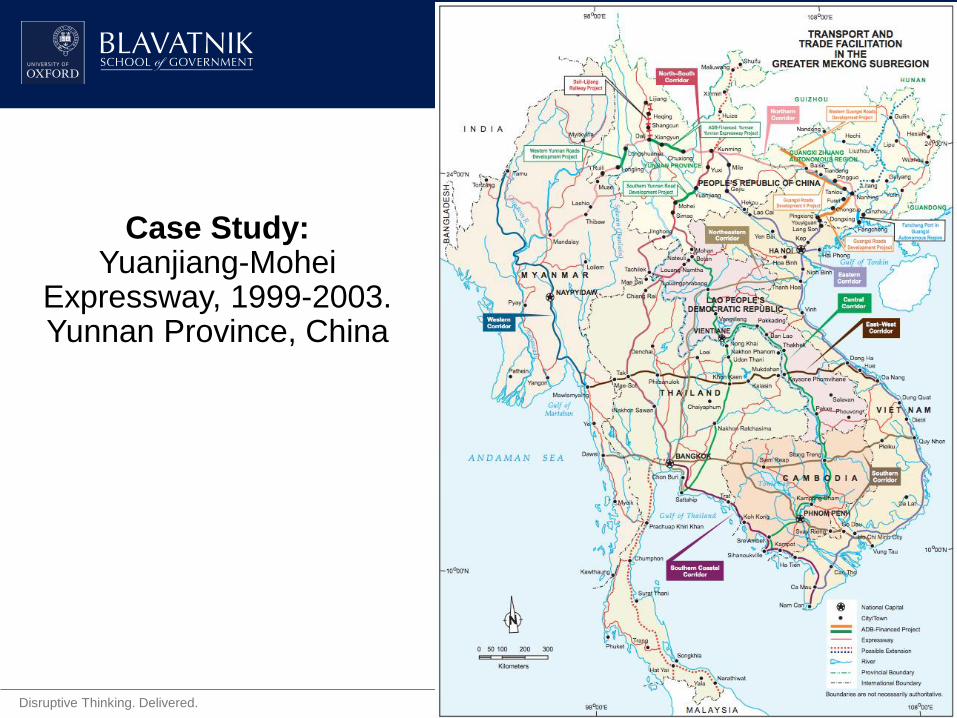
Case Study: Yuanjiang-Mohei
Expressway, 1999-2003. Yunnan Province, China
14

© Atif Ansar, all rights reserved Disruptive Thinking. Delivered.
(4,000.00)
(3,000.00)
(2,000.00)
(1,000.00)
-
1,000.00
2,000.00
3,000.00
1999 2004 2009 2014 2019
CAPEX O&M REVENUES
ADB’s Estimates of Financial Return at Appraisal1
1SOURCE: Asian Development Bank 1999 (p. 82). China Southern Yunnan Road Development Project. Report and Recommendation of the President, Report
No: 30081, 1 May 1999, Manila: Asian Development Bank. [ADB ID: 1691-PRC]. Document can be accessed at:
http://www.adb.org/projects/documents/southern-yunnan-road-development-project
RMB -5695.3 million
CAPEX* O&M* REVENUES*
1999 -569.50 - -
2000 -1,708.60 - -
2001 -1,993.40 - -
2002 -854.30 - -
2003 -569.50 -3.50 128.30
2004 - -14.40 553.30
2005 - -14.70 607.90
2006 - -15.10 654.10
2007 - -15.50 703.10
2008 - -15.90 754.90
2009 - -16.40 809.80
2010 - -16.80 877.20
2011 - -17.30 938.00
2012 - -24.90 1,002.50
2013 -214.10 -309.80 1,071.00
2014 - -21.00 1,142.60
2015 - -21.40 1,218.40
2016 - -21.70 1,298.50
2017 - -22.10 1,383.20
2018 - -22.50 1,472.80
2019 - -22.90 1,567.60
2020 - -23.40 1,668.00
2021 - -23.80 1,771.30
2022 - -24.30 1,880.60
2023 -2,740.60 -47.10 1,497.20
NPV @ 5% k
(RMB million)
-2,847.86
-550.28
4,208.25
10th year - 2007
15th year - 2012
25th year - 2023
IRR over the road’s life = 10.9%
*Undiscounted
Forecasted traffic 1st yr = 5,064 Medium Truck Equivalent (MTE)
Forecasted toll = RMB 1.97 per km
15

© Atif Ansar, all rights reserved Disruptive Thinking. Delivered.
ADB’s Estimates of Financial Return at Completion
1SOURCE: Asian Development Bank 2006 (p. 54). China Southern Yunnan Road Development Project. Project Completion Report, Report No: 30081, 1
February 2006, Manila: Asian Development Bank. [ADB ID: 1691-PRC]. Document can be accessed at: http://www.adb.org/projects/documents/southern-
yunnan-road-development-project
2Contant (1999) Yuan.
1
RMB -7068.7
million
NPV @ 5% k < 0 for
all time horizons
O&M costs and
periodic upgrade
costs miraculously
reduced nearly 80%!
RMB -309.8 million
to only RMB -37.0
million without
explanation
16
© Atif Ansar, all rights reserved Disruptive Thinking. Delivered.
Traffic Forecasts: Before vs. After
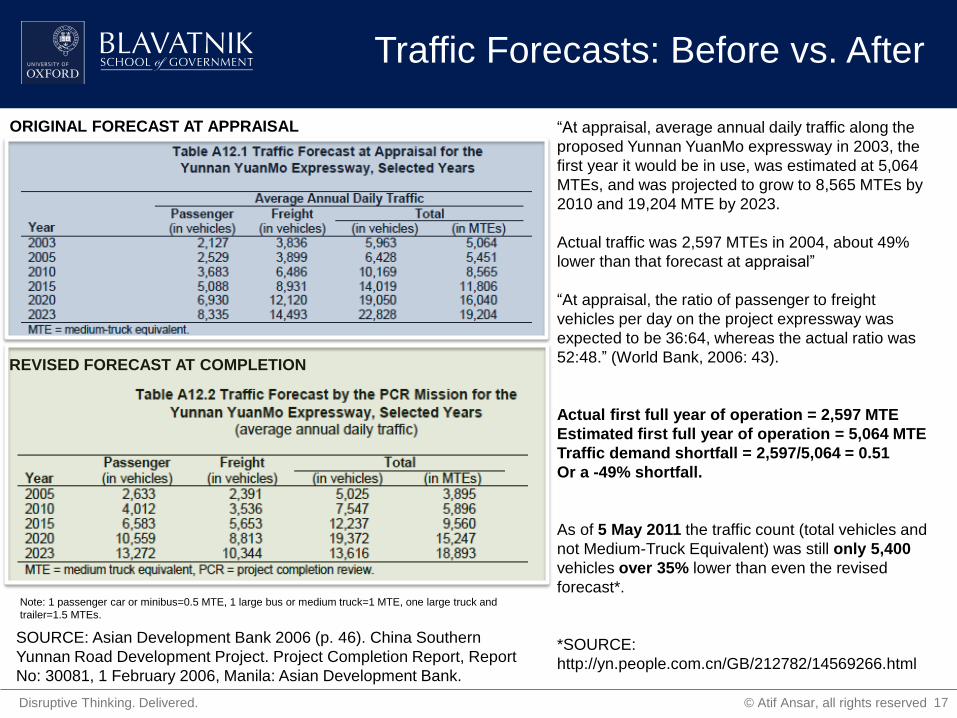
SOURCE: Asian Development Bank 2006 (p. 46). China Southern
Yunnan Road Development Project. Project Completion Report, Report
No: 30081, 1 February 2006, Manila: Asian Development Bank.
“At appraisal, average annual daily traffic along the
proposed Yunnan YuanMo expressway in 2003, the
first year it would be in use, was estimated at 5,064
MTEs, and was projected to grow to 8,565 MTEs by
2010 and 19,204 MTE by 2023.
Actual traffic was 2,597 MTEs in 2004, about 49%
lower than that forecast at appraisal”
“At appraisal, the ratio of passenger to freight
vehicles per day on the project expressway was
expected to be 36:64, whereas the actual ratio was
52:48.” (World Bank, 2006: 43).
Actual first full year of operation = 2,597 MTE
Estimated first full year of operation = 5,064 MTE
Traffic demand shortfall = 2,597/5,064 = 0.51
Or a -49% shortfall.
As of 5 May 2011 the traffic count (total vehicles and
not Medium-Truck Equivalent) was still only 5,400
vehicles over 35% lower than even the revised
forecast*.
*SOURCE:
http://yn.people.com.cn/GB/212782/14569266.html
Note: 1 passenger car or minibus=0.5 MTE, 1 large bus or medium truck=1 MTE, one large truck and
trailer=1.5 MTEs.
ORIGINAL FORECAST AT APPRAISAL
REVISED FORECAST AT COMPLETION
17

© Atif Ansar, all rights reserved Disruptive Thinking. Delivered.
Traffic Forecasts: Before vs. After
SOURCE: ADB (1999: 31)
“Giving due consideration to affordability
by road users and other social and
economic impacts, the existing weighted,
average toll rates are lower than those
proposed at appraisal: CNY0.92 per km–
MTE compared with CNY1.97 per km–
MTE.”
SOURCE: ADB (2006: 11).
ORIGINAL FORECAST AT APPRAISAL
REALITY AT COMPLETION
Actual Weighted Avg. Toll Rate = RMB 0.92
Estimated Weighted Avg. Toll Rate Toll = RMB 1.97
Toll price shortfall = 0.92/1.97 = 0.47
Or a -53% shortfall.
18

© Atif Ansar, all rights reserved Disruptive Thinking. Delivered.
The Incredibly Shrinking Revenues
19
What effect do traffic counts 35-
49% lower than estimated and toll
prices 53% lower than estimated
have on cash flows?
V * P = R
0.65V * 0.47P = 0.31R
Volume (V)
PR
ICE
(P
)
Total Revenues

© Atif Ansar, all rights reserved Disruptive Thinking. Delivered.
The Real Financial Return At Completion
CAPEX* O&M* REVENUES*
1999 - - -
2000 -668.70 - -
2001 -1,546.40 - -
2002 -1,780.10 - -
2003 -1,432.00 - -
2004 -1,641.50 -4.70 108.00
2005 - -0.50 165.99
2006 - -1.60 182.37
2007 - -2.90 196.23
2008 - -4.20 210.93
2009 - -5.60 226.47
2010 - -7.00 242.94
2011 - -8.80 263.16
2012 - -0.70 281.40
2013 - -2.70 300.75
2014 - -4.80 321.30
2015 -260.60 -37.00 342.78
2016 - -9.40 365.52
2017 - -1.90 389.55
2018 - -4.70 414.96
2019 - -7.60 441.84
2020 - -0.60 470.28
2021 - -3.30 500.40
2022 - -6.20 531.39
2023 - -9.20 564.18
2024 - -2.40 560.00
2025 -3,420.00 -5.70 560.00
(4,000.00)
(3,000.00)
(2,000.00)
(1,000.00)
-
1,000.00
2,000.00
3,000.00
1999 2004 2009 2014 2019 2024
CAPEX O&M REVENUES
NPV @ 5% k
(RMB million)
-5,444.46
-4,729.88
-3,232.89
10th year - 2007
15th year - 2012
25th year - 2023
IRR over the road’s life ~ -20.0%
CAGR
*Undiscounted
20
SOURCE: ADB (2006: 54)

© Atif Ansar, all rights reserved Disruptive Thinking. Delivered.
Obfuscation Gets Worse with “Wider Economic Benefits”
Before (RMB million) AFTER (RMB million)
VOC Savings VOT Savings VOA Savings
Total Wider
Economic
Benefits
VOC Savings VOT Savings VOA Savings
Benefits from
additional
traffic
generated
Total Wider
Economic
Benefits
1999 - - - - - - - - -
2000 - - - - - - - - -
2001 - - - - - - - - -
2002 - - - - - - - - -
2003 310.80 6.80 15.90 333.50 - - - - -
2004 1,245.00 28.20 64.80 1,337.90 263.13 20.25 33.26 17.30 333.93
2005 1,247.70 29.60 66.80 1,344.00 394.50 30.35 49.86 25.94 500.65
2006 1,245.60 30.70 68.50 1,344.80 467.40 38.91 53.72 30.18 590.22
2007 1,248.30 31.90 70.60 1,350.70 552.79 49.73 57.86 35.13 695.50
2008 1,251.10 33.10 72.90 1,357.10 652.70 63.37 62.31 40.88 819.25
2009 1,254.10 34.50 75.50 1,364.10 769.51 80.56 67.08 47.57 964.72
2010 1,253.00 36.10 79.10 1,368.20 905.97 102.20 72.19 55.35 1,135.71
2011 1,258.70 37.60 82.40 1,378.80 1,061.71 124.01 79.34 62.26 1,327.32
2012 1,262.80 39.20 86.30 1,388.30 1,242.19 150.39 87.18 70.02 1,549.78
2013 1,260.70 40.80 90.70 1,392.20 1,451.18 182.28 95.77 78.76 1,807.99
2014 1,265.00 42.50 95.60 1,403.10 1,692.98 220.83 105.19 88.58 2,107.58
2015 1,269.60 44.40 101.10 1,415.10 1,972.56 267.41 115.51 99.63 2,455.10
2016 1,276.80 46.30 107.30 1,430.40 2,295.59 323.67 126.81 112.05 2,858.13
2017 1,283.20 48.30 114.30 1,445.90 2,668.59 391.61 139.19 126.03 3,325.43
2018 1,281.50 50.50 122.30 1,454.20 3,099.03 473.64 152.75 141.75 3,867.18
2019 1,288.50 52.80 131.10 1,472.40 3,595.49 572.65 167.61 159.43 4,495.17
2020 1,308.60 55.20 141.20 1,504.90 4,167.76 692.11 183.87 179.31 5,223.06
2021 1,318.80 57.80 152.40 1,528.90 4,388.21 747.43 197.13 200.06 5,532.83
2022 1,297.90 60.50 165.10 1,523.40 4,611.63 806.96 211.34 223.22 5,853.15
2023 1,012.30 47.50 134.50 1,194.40 4,836.38 871.02 226.56 249.05 6,183.01
2024 Not included
5,060.41 939.90 242.85 277.87 6,521.03
20225 5,281.24 1,013.93 260.30 310.03 6,865.50
EIRR 17.40% 16.80%
VOA = value of accident, VOC = vehicle operating cost, VOT = value of time.
21
© Atif Ansar, all rights reserved Disruptive Thinking. Delivered.
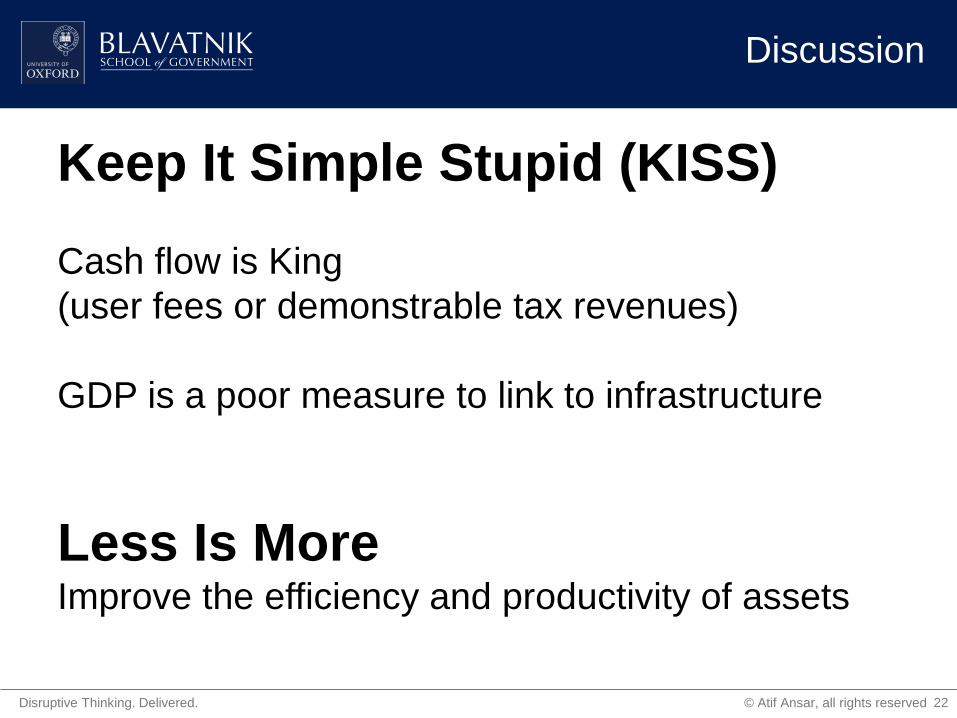
Discussion
22
Keep It Simple Stupid (KISS)
Cash flow is King
(user fees or demonstrable tax revenues)
GDP is a poor measure to link to infrastructure
Less Is More Improve the efficiency and productivity of assets