Does Improved Governance Contribute to Sustainable...
25
Does Improved Governance Contribute to Sustainable Forest Management? Nalin Kishor Arati Belle SUMMARY. This paper explores the hypothesis that improving gover- nance is beneficial in reducing deforestation. The hypothesis is tested by including six objectively constructed measures of governance as explan- atory variables in an econometric model of the causes of deforestation. Analysis of cross-section data for 90 countries shows an indirect but strong impact of governance on deforestation, working through per ca- pita income. However, the evidence to support a direct beneficial impact of improved governance on deforestation is quite weak. The paper ar- gues that if the main objective is to reduce deforestation especially in the short run then undertaking reforms directly related to the forest sector such as in the areas of forest policy, scientific forest management, and forest law enforcement and compliance are likely to be the most effec- tive both in terms of cost and outcomes. However, improving overall governance should not be ignored as it is likely to yield long term bene- Nalin Kishor and Arati Belle are both affiliated with The World Bank. The views expressed in this paper are strictly the authors’ and do not necessarily re- flect those of the World Bank or any of its affiliated agencies. Helpful comments from the participants at the Yale conference and an anonymous referee are acknowledged. Address correspondence to: Nalin Kishor, The World Bank, 1818 H St. Room# J4-005MC5-771, Washington, DC 20433 (E-mail: [email protected]). [Haworth co-indexing entry note]: “Does Improved Governance Contribute to Sustainable Forest Man- agement?.” Kishor, Nalin, and Arati Belle. Co-published simultaneously in Journal of Sustainable Forestry (Food Products Press, an imprint of The Haworth Press, Inc.) Vol. 19, No. 1/2/3, 2004, pp. 55-79; and: Cut- ting Crime: Strategies for Addressing Illegal Logging in the Tropics (ed: Ramsay M. Ravenel, Ilmi M. E. Granoff, and Carrie Magee) Food Products Press, an imprint of The Haworth Press, Inc., 2004, pp. 55-79. Single or multiple copies of this article are available for a fee from The Haworth Document Delivery Service [1-800-HAWORTH, 9:00 a.m. - 5:00 p.m. (EST). E-mail address: [email protected]]. http://www.haworthpress.com/web/JSF 2004 by The Haworth Press, Inc. All rights reserved. Digital Object Identifier: 10.1300/J091v19n01_04 55 Please note that this electronic prepublication galley may contain typographical errors and may be missing artwork, such as charts, photographs, etc. Pagination in this version will differ from the published version.
Transcript of Does Improved Governance Contribute to Sustainable...
Does Improved Governance Contributeto Sustainable Forest Management
Nalin KishorArati Belle
SUMMARY This paper explores the hypothesis that improving gover-nance is beneficial in reducing deforestation The hypothesis is tested byincluding six objectively constructed measures of governance as explan-atory variables in an econometric model of the causes of deforestationAnalysis of cross-section data for 90 countries shows an indirect butstrong impact of governance on deforestation working through per ca-pita income However the evidence to support a direct beneficial impactof improved governance on deforestation is quite weak The paper ar-gues that if the main objective is to reduce deforestation especially in theshort run then undertaking reforms directly related to the forest sectorsuch as in the areas of forest policy scientific forest management andforest law enforcement and compliance are likely to be the most effec-tive both in terms of cost and outcomes However improving overallgovernance should not be ignored as it is likely to yield long term bene-
Nalin Kishor and Arati Belle are both affiliated with The World BankThe views expressed in this paper are strictly the authorsrsquo and do not necessarily re-
flect those of the World Bank or any of its affiliated agencies Helpful comments fromthe participants at the Yale conference and an anonymous referee are acknowledged
Address correspondence to Nalin Kishor The World Bank 1818 H St RoomJ4-005MC5-771 Washington DC 20433 (E-mail nkishorworldbankorg)
[Haworth co-indexing entry note] ldquoDoes Improved Governance Contribute to Sustainable Forest Man-agementrdquo Kishor Nalin and Arati Belle Co-published simultaneously in Journal of Sustainable Forestry(Food Products Press an imprint of The Haworth Press Inc) Vol 19 No 123 2004 pp 55-79 and Cut-ting Crime Strategies for Addressing Illegal Logging in the Tropics (ed Ramsay M Ravenel Ilmi M EGranoff and Carrie Magee) Food Products Press an imprint of The Haworth Press Inc 2004 pp 55-79 Singleor multiple copies of this article are available for a fee from The Haworth Document Delivery Service[1-800-HAWORTH 900 am - 500 pm (EST) E-mail address docdeliveryhaworthpresscom]
httpwwwhaworthpresscomwebJSF 2004 by The Haworth Press Inc All rights reserved
Digital Object Identifier 101300J091v19n01_04 55
Please note that this electronic prepublication galley may contain typographical errors and may be missingartwork such as charts photographs etc Pagination in this version will differ from the published version
fits including enhanced effectiveness of reforms within the forestry sec-tor [Article copies available for a fee from The Haworth Document DeliveryService 1-800-HAWORTH E-mail address ltdocdeliveryhaworthpresscomgtWebsite lthttpwwwHaworthPresscomgt 2004 by The Haworth Press IncAll rights reserved]
KEYWORDS Deforestation illegal logging forest policy scientificforest management tenure governance corruption rule of law
THE PROBLEMTHE NATURE AND IMPACT OF FOREST CRIMES
The problem of illegal logging and corruption and other forest crimes suchas wildlife poaching trade in endangered species arson and theft is globaland pervasive Examples of illegal practices in the forestry sector include un-lawful occupation of forest land by rural families or corporations interna-tional trade in protected species logging outside concession boundarieslogging in protected areas undergrading and misclassifying species timbersmuggling transfer pricing in timber trade timber processing without a li-cense etc (Contreras 2002) Furthermore illegal acts and forest crimes ofvarious kinds are common everywhere in developing as well as developed na-tions and in all major forest typesndashtropical temperate and boreal (Callister1999 Contreras 2002)
Recent estimates indicate that as much as 15 of global timber trade in-volves illegalities and corrupt practices A case study of timber trade showsthat illegally harvested ramin can be purchased in Indonesia for about US$20m3 and (after being routed through Malaysia and Singapore) is sold tohigh-end users in the USA for US$1000m3 (EIA 2001) Illegal logging inpublic lands worldwide is estimated to cause losses in assets and revenue inexcess of US$10 billion annually (Baird 2001)
Some examples of forest crimes at the country level include (Contreras2002 Glastra 1999)
bull Canada where violations were detected in 55 of areas designated forprotection
bull Brazil where a presidential commission concluded that fully 71 of themanagement plans in concessions did not comply with the law
bull Russia where 20 of timber logged is in violation of the lawbull PNG where $20 million a year were being lost to illegal practicesbull Cambodia where only 10 of logging was legal (estimate for 1997)bull Cameroon where one-third of the timber cut was undeclared (estimate
for 1992-93)
56 Cutting Crime Strategies for Addressing Illegal Logging in the Tropics
Forest crimes pose a threat to the sustainable management of forest re-sources everywhere They also lead to a leakage of resources (tax revenues inparticular) that legitimately belong in the government treasury A low-end es-timate of the royalties reforestation fund and export taxes payments that arenot being paid to the Government of Indonesia on stolen timber amount toUS$ 600 million per annum This amount is more than twice what the govern-ment spent on subsidized food programs for the poor in 2001 (Baird 2001) Inaddition illegal logging and other forest crimes put at risk the livelihoods ofthe poor and directly threaten ecosystems and biodiversity in protected areasand parks across the world (Contreras 2002 Thomas et al 2000) In overallterms poor governance and weak law and order is likely to contribute to accel-erated deforestation and forest degradation
Efforts by international development agencies at assisting client countriesto control illegal logging and improve governance in the sector have had lim-ited success in slowing down deforestation The constraints to effective actionstem from several factors a weak and resource constrained forest departmentvested interest groups particularly commercial ones weak or nonexistentvoiceparticipation of critical stakeholders poor rule of law and ineffective ju-dicial and police systems paucity of useful information and the lack ofhigh-level political commitment regional cooperation and collaboration amongthe producing and consuming nations
Effectiveness of measures within the forestry sector is likely to be compro-mised if the quality of overall governance in the economy is poor particularlyif the forestry sector is large and has strong linkages with the rest of the econ-omy However regardless of whether the forestry sector is large or small onewould expect that the probability of success of reforms aimed at improvinggovernance in the sector is highest if they are accompanied by economy-widereforms aimed at improving overall governance Otherwise following Gres-hamrsquos Law-which states that if counterfeit money is not controlled it will sup-plant legal tender and lead to monetary anarchy-bad practices will likely driveaway the good policies (Johnston and Doig 1999 World Bank 1997)
The basic aim of this paper is to quantitatively explore some of these ideasby analyzing cross-section data on deforestation for 90 countries The paperwill estimate an econometric model of the causes of deforestation but will de-part from traditional models in an important way by testing six different mea-sures of governance as explanatory variables Here governance is ldquounbundledrdquointo six main measurable components Rule of law Control of corruptionGovernment effectiveness Lack of Regulatory Burden Voice and Account-ability and Political Stability and lack of Violence Governance measures aredefined in detail in section III of the paper
There are several advantages to this approach First the model will enable avaluable insight into the relative contribution of ldquotraditionalrdquo variables (such
Theoretical Approaches to Understanding Forest Governance 57
as per capita incomes population density and roads) vis-agrave-vis governance andcorruption to deforestation This will be useful in prioritizing policy reformoptions Second the model will indicate which among the six governancemeasures have the most impact on deforestation In turn this can identify areasof governance most requiring improvement and attention Finally (apart fromthe information revealed from the empirical regularities) the statistical ap-proach will help identify the ldquooutliersrdquo Analysis of the outliers will yieldvaluable insights in both types of countriesndashthose characterized byndashpoor qual-ity of governance and low levels of deforestation and those characterized byhigh quality of governance with high deforestation
THE FRAMEWORK AND THE ldquoDRAMATIS PERSONAErdquo
Forests provide multiple benefits to a multitude of users If not carefullymanaged this multiplicity of users can create situations of conflict leading toresource misuse Thus Sustainable Forest Management (SFM) (defined fromthe broad perspective of preserving all ecosystem services for the present andall future generations) requires attention to a range of issues (legislation prop-erty rights capacity to implement etc for example) and the need to involve anumber of actors (government local stakeholders NGOs private sector etc)This has two important implications for the design of strategic approachesFirst the overall state of governance is one of several critical sets of factors de-termining outcomes in the sector (Kaimowitz 2001 Kaimowitz and Angelsen1999) In other words while improvement in governance is a necessary condi-tion for SFM it cannot be sufficient by itself But by the same token gover-nance issues cannot be ignored otherwise the success of other reform efforts inforestry will likely be short-lived And second several stakeholders will needto be involved in any realistic strategy aimed at improving governance Inother words any effective strategy to promote lasting SFM will likely requirea multi-pronged approach (Kishor 2002)
Figure 1 illustrates conceptually the 4 major sets of factorsndashforest policyscientific forest management overall governance and specific forest law en-forcementndashwhich collectively influence SFM
A comprehensive strategy to promote SFM will therefore require action on4 fronts
i Actions to promote sustainable forest management via forest policyreforms
ii Actions to encourage adoption of scientific forest management tech-niques
iii Actions to promote a better overall quality of governance in the econ-omy and
58 Cutting Crime Strategies for Addressing Illegal Logging in the Tropics
iv Actions to improve law enforcement and promote specific anticor-ruption efforts in the forestry sector
Key actions in the area of forest policy include Clarification of propertyrights setting the right level of taxes and royalties use of market-based instru-ments etc Well-designed forest policies can simultaneously achieve eco-nomic and environmental and conservation objectives at the same time asstrengthening compliance and easing the problem of law enforcement (Magrathand Grandalski 2001) Rational reasonable and enforceable forest policiesare necessary to ensure that other measures to improve governance and reducecorruption have positive and lasting impacts For example if there is exces-sive reliance on command and control type approaches in policy enforcementis likely to be problematic Reforming policy in the direction of greater use ofmarket-based instruments will simultaneously make for a better climate ofgovernance As another illustration ensuring that property rights to land areclear and non-controversial will enable the rule of law to be implemented ef-fectively and prevent the abuse of forest lands It is also important to note thatthe issue is not simply of designing better forest policy but also policy whichcan be translated into easily enforceable legislation with minimum scope forcontroversial and discretionary interpretation (Rosenbaum 2002 Bekhechi2001)
Scientific forest management plans must be based on a careful consider-ation of management objectives an assessment and inventory of the resourcebase and its projected trajectory an estimation of a budget and resource re-quirements and provision for evaluation and plan revisions However anITTO study indicated that the extent of tropical forests being managed under
Theoretical Approaches to Understanding Forest Governance 59
Forest Policy
Forest Law Enforcement
Overall Governance
ScientificForest Mgmt
FORESTS (localnational and
global values)
FIGURE 1 Factors Impacting Forests
sustainable yield systems was negligible (Poore 1989) An assessment a de-cade later found that while significant progress had been made the challengesof full and coordinated implementation of management plans remained inade-quately addressed (ITTO 2000) It is clear that poor quality of routine forestmanagement will have serious repercussions on SFM Improving the qualityof forest management also reduces the scope for forest crimes such as loggingin excess of allowable cuts logging in vulnerable areas etc (bin Buang 2001Magrath and Grandalski 2001) ldquoWin-winrdquo examples of the sort describedabove need to be identified and the synergy they offer to counter forest crimesexploited to the full while developing a strategy to fight corruption and im-prove governance in forestry to promote SFM
Improving the overall quality of governance requires a system of checksand balances in society that restricts arbitrary actions and bureaucratic harass-ment and promotes voice and participation by the population (Thomas et al2000) Equally importantly it reduces the scope for the elite to ldquocapturerdquo thestate to serve their own interests and fosters the rule of law In theory reformsmay be necessary in several areas and a practical approach rests on a thoroughexamination of the actual situation with respect to the structure of govern-ment political accountability a competitive private sector quality of manage-ment of the public sector and the status of civil society with respect to voiceand participation In particular there is widespread agreement that corruptionis a fundamental symptom of public sector malfunction and public sector re-forms are a key component in any anticorruption approach (World Bank2000)
Finally SFM will include a specific forest law enforcement and compli-ance system A recent and important body of work focuses at the impacts ofspecific monitoring and law enforcement initiatives as applying exclusively tothe forest sector The main message emerging from this literature is that spe-cific steps within forestry to improve monitoring and enforcement aimed atcontrolling forest crimes do matter But these are not sufficient in of them-selves to ensure compliance and other prerequisite steps are necessary (Magrathand Grandalski 2001 Melle and Beck 2001) These (precursive) steps con-sist of making improvements in forest policy forest management regimes andgovernance In this context forest law enforcement is seen as a supplement topoor policies poor management and weak governance and institutions Thethree most important components of a forest law enforcement system are pre-vention detection and suppression (i) Prevention includes actions geared toreducing the opportunities for illegal acts such as the formulation of goodmanagement plans reduction in discretionary powers of forest officials en-couraging whistleblowers etc (ii) Detection includes monitoring and surveil-lance to determine if and where crime is occurring This kind of information iscrucial for setting priorities and for evaluating other elements of the enforce-ment program and (iii) Suppression almost inevitably involves the use of
60 Cutting Crime Strategies for Addressing Illegal Logging in the Tropics
force after unlawful activities have occurred or while they are underway Sup-pression of illegal activity should be the last recourse in a forest law enforce-ment program because suppression measures pose risks to agency personnelthe public and the lawbreaker (Magrath and Grandalski 2001)
GOVERNANCE DEMYSTIFIED
What is Governance And Corruption
Governance is defined as the manner in which power is exercised in themanagement of a countryrsquos economic and social resources Good governanceis epitomized by predictable open and enlightened policymaking (that istransparent processes) a bureaucracy imbued with a professional ethos an ex-ecutive arm of government accountable for its actions and a strong civil soci-ety participating in public affairs and all behaving under the rule of law(World Bank 2000) Governance encompasses the capacity to formulate andimplement sound policies and the respect of the citizens and the state for theinstitutions that govern economic and social interactions among them It alsoincludes the process of selecting monitoring and replacing governments(Kaufmann et al 1999a 1999b)
It is important to emphasize that governance is not just about the organiza-tion the employees and the policies of the apparatus of government of a coun-tryndashit extends far beyond that to include the key role and contributions of otherstakeholders as well-eg the role of civil society in electing a government therole of the private sector in complying with rules and regulations governingconcession management etc This point assumes critical importance in anystrategy for improving governance Thus improvements in governance canand indeed should be the responsibility of all stakeholders-government policy-makers private sector executives parliamentarians academics and civil soci-ety at large Any strategy to improve governance needs to be multi-pronged(Thomas et al 2000)
Corruption by contrast is commonly defined to be the abuse of public officefor private gain or for the benefit of a group to which one owes allegiance(Bardhan 1997) Corruption is most often associated with misuse of power bycivil servants and politicians but it can exist in any situation where there ismisuse of power (Stapenhurst and Kpundeh 1997) However corruption isusually not a cause but a symptom of the weakness of the state and indicatesthe need for institutional reforms for its control
Unbundling Governance and Measuring its Quality
Starting with the broad notion of governance as defined above governancecan be logically subdivided into six main measurable components Rule of
Theoretical Approaches to Understanding Forest Governance 61
law Control of corruption Government effectiveness Lack of regulatory bur-den Voice and accountability and Political stability and lack of violence(Kaufmann et al 1999a)
Rule of lawndashThe rule of law is best defined as the opposite of the rule bypowerful men or women Rule of law includes issues such as the protec-tion of property rights enforceability of contracts and maintaining theeffectiveness and independence of the judiciary and the perceptions ofthe incidence of both violent and nonviolent crimes In overall terms thiscomponent refers to that aspect of governance that measures the successof a society in developing an environment in which fair and predictablerules form the basis for economic and social interactions
Control of corruption (or graft)ndashThe presence of corruption is often amanifestation of a lack of respect on part of both the one who corruptsand the one who is corrupted for the societal rules governing the interac-tion between the two The existence of corruption itself is often seen as asymptom of weak or poor governance and this component measures theperception of corruption by society
Government effectivenessndashThis component focuses on the quality ofpolicymaking and refers to the ldquoinputsrdquo required for the government tobe able to formulate and implement good policies and to deliver publicservices This combines perceptions of the quality of provision of publicservices the quality of the bureaucracy the competence of civil ser-vants the independence of the civil service from political pressures andthe credibility of government commitment to its policies
Lack of regulatory burdenndashThis component focuses on the content ofthe policies themselves It includes measures of the incidence of marketunfriendly policies such as price controls and inadequate bank supervi-sion as well as the perceptions of burdens imposed by excessive regula-tion in areas such as environmental management foreign trade andbusiness development
Voice and accountabilityndashThis includes indicators of governance deal-ing with various aspects of the political process civil liberties politicalrights and the freedom of the press This component measures the extentto which the citizens of a country are able to participate in the selectionand the running of governments This also includes the independence ofthe media that plays an important role in monitoring and holding ac-countable those in authority
62 Cutting Crime Strategies for Addressing Illegal Logging in the Tropics
Political stability and lack of violencendashThis includes indicators thatmeasure perceptions of the likelihood that the government in power willbe destabilized or overthrown by possibly unconstitutional andor vio-lent means This component captures the idea that the quality of gover-nance in a country may be compromised by the likelihood of ldquocatastrophicrdquochanges in government that have a direct impact on the continuity of pol-icies
Empirical Measurement of the Quality of Governance
Unbundling ldquogovernancerdquo into its key components is useful for several rea-sons
i It enables more precision in policy discussions of which aspects ofgovernance require most improvement and attention and to identifyspecific steps through which that might be achieved
ii By allowing for a relatively precise measure of its components it en-ables a benchmarking of the quality of governance in a country and totrack the changes in its quality over time
iii It enables a statistical analysis of how the quality of governance im-pacts upon desired developmental outcomes such as increase in percapita incomes reduction in infant mortality increases in literacy re-duction in deforestation and expansion of area under sustainable forestmanagement control of pollution etc
iv It allows for a comparison of the development experience across coun-tries In particular the linkages between governance and developmentoutcomes will likely yield a useful learning experience from cross-country analysis
Kaufmann et al (1999a 1999b) have analyzed hundreds of cross-countryindicators as proxies for various aspects of governance These are based onmore than 150 measures produced by more than 12 different organizationsThey are drawn from various published and unpublished sources spanning pri-vate forecasting and business risk organizations think-tanks and other NGOsThey include the results of surveys carried out by multilateral and other orga-nizations such as the Business Environment Risk Intelligence Standard andPoors European Bank for Reconstruction and Development Economist Intel-ligence Unit Freedom House etc They are based on surveys of experts firmsand citizens and cover a wide range of topics perceptions of political stabilityand the business climate views on the efficiency of public service provisionopinions on respect for the rule of law and perceptions of corruption
As an illustration of this approach we present the results for the measure-ment of the rule-of-law (See Figure 2) Included in this measure are aspects
Theoretical Approaches to Understanding Forest Governance 63
3
2
1
0
1
2
3
GOOD
Normalized Index
166 CountriesPOOR
Note Blue dots represent mean estimates forthe governance indicator The thin vertical linesrepresent standard errors around theseestimates
Congo Rep
IndonesiaEcuadorNepal
Russian Federation
VietnamBolivia Brazil
Armenia
Ghana
Belize
Philippines
Papua New Guinea
Tanzania
Argentina
Egypt Arab Rep
MalaysiaChile
Korea Rep
JapanCanadaGermany
FIGURE 2 Country Performance on the Rule of Law Index
Source ldquoGovernance Mattersrdquo by Daniel Kaufmann Aart Kraay and Pablo Zoido-Lobaton May 1999 (Kaufmann et al 1999b) httpwwwimforgex-ternalpubsftfandd200006kaufhtm
64
such as the enforceability of contracts variability in the application of the ruleof law applied across groups within the country police effectiveness in safe-guarding personal property size of a black market etc In the figure countriesare ordered along the horizontal axis according to their rankings while thevertical axis indicates the estimates of the rule of law for each country Thevertical bars represent the country specific confidence intervals (margins oferror) for the point estimate for rule of law Note that this measure (and theother five also) have been scaled to lie between 25 and +25 and oriented sothat higher values correspond to better outcomes
The margins of error can be considerable and rather than a strict ranking(based on imprecise point estimates) it is deemed more useful to classify coun-tries into three color-coded groups The red light group consists of those coun-tries that should be considered to be in a crisis of governance characterized inthis example by a significant lack of operation of the rule of law (for exampleBangladesh Ecuador Guatemala Indonesia Myanmar Russian Federation)The yellow light group characterizes those countries which are vulnerable orat risk of falling into a governance crisis (Argentina Brazil Ghana PNG Tan-zania) And finally the green light group of countries may be said to have a ro-bust rule of law component of governance and not likely to be at risk ofreverting into a crisis situation (Chile Malaysia Japan S Korea CanadaGermany US The traffic lights approach is useful in identifying the most vul-nerable countries that should be high priority for reforms aimed at improvinggovernance (Thomas et al 2000)
The Development Dividend of Improving the Quality of Governance
Development outcomes such as increases in per capita income reductionsin child mortality and increases in literacy have been statistically examinedwith the data on governance measures and development outcomes The empir-ical analysis suggests that the direct impact of better governance resulting inbetter development outcomes is large (Kaufmann et al 1999a 1999bThomaset al 2000) As an illustration consider an improvement (of one standard devi-ation) in the rule of law from the low level in the Russian Federation today tothe middling level in the Czech Republic or a similar reduction in corruptionfrom that in Indonesia to that in South Korea This is associated with an in-crease in per capita incomes by two to four times a reduction in infant mortal-ity by a similar magnitude and an improvement in literacy by 15 to 25 percentpoints in the long run Consider also that much larger improvements in gover-nance from the levels in Tajikistan (in the red light group) to those in Chile(green light group) are associated with a near doubling of the development im-pacts mentioned above
Theoretical Approaches to Understanding Forest Governance 65
The relationship between various development outcomes and four mea-sures of governance are illustrated in Figure 3 The heights of the vertical barsshow the differences in development outcomes with weak average and stronggovernance and illustrate the strong correlation between good outcomes andgood governance The solid lines represent the estimated impact of improvinggovernance on development outcomes-the ldquodevelopment dividendrdquo from gov-ernance This evidence provides strong support for the argument that improv-ing governance is of crucial importance for developing countries
DATA ANALYSIS
Models of Deforestation
Studies on the causes of deforestation abound in the literature Given ourinterest in exploring policy options to control deforestation however it is nei-ther our intention nor our task to do an extensive literature review For this theinterested reader can go to a recent and comprehensive review by Kaimowitzand Angelsen (1999) Instead we will focus on the literature that deals specifi-cally with the relationship between governance and deforestation
While extensive concern has been raised regarding the impact of gover-nance on deforestation few attempts have been made at a careful analysis andmeasurement of this relationship Part of the reason may stem from the diffi-culty in getting objective measures of governance (which we try to address inthis paper) However the study by Deacon is a good attempt (Deacon 1994)Using cross-country data he tests the hypothesis that insecure ownership exac-erbates deforestation He finds consistent associations between deforestationand political variables (such as constitutional changes guerilla warfare andrevolutions) reflecting insecure ownership However the estimates are notvery robust and the author suggests the need for better data and better modelbuilding (particularly to test for the exogeneity of the political attributes)Shafik (1997) however concludes that vesting clear property rights increasesdeforestation Mainardi (1996) concludes that deforestation is likely to bemore in countries that are politically unstable Similarly Didia (1997) con-cludes that democracies are characterized by lower deforestation Palo (2001)uses Transparency Internationalrsquos Corruption Perception Index as an explana-tory variable in a cross-country regression equation for deforestation (usingthe ratio of forest to non-forest area as the dependent variable) For a sample of36 tropical countries the coefficient was found to be significant at the 10level The coefficient indicates that a 10 improvement in the Corruption Per-ception Index will increase the ratio of forest to non-forest area by 5
The results from these studies generally support the hypothesis that im-provements in governance reduce deforestation However we build on the
66 Cutting Crime Strategies for Addressing Illegal Logging in the Tropics
DevelopmentDividend
DevelopmentDividend
DevelopmentDividend
DevelopmentDividendRule of Law
Control of Curruption Regulatory Burden
Voice and Accountability
Weak
Weak Weak
WeakAverage
Average Average
AverageGood
Good Good
Good
Infant Mortality and Per Capita Income and
Literacy and Per Capita Income and
Per
Cap
ita
Inco
me
Per
Cap
ita
Inco
me
12000
10000
8000
6000
4000
2000
0
10000900080007000600050004000300020001000
0
Lit
erac
yIn
fan
tM
ort
alit
y
9876543210
100
75
50
25
0
FIGURE 3 The Development Dividend of Good Governance
Note The bars depict the simple correlation between good governance and development outcomes The line predicted value when taking into account thecausality effects (ldquoDevelopment Dividendrdquo) from improved governance to development outcomes (Drawn from Thomas et al 2000)
67
previous work by refining the model particularly through the use of morecomprehensive and objectively constructed measures of governance in orderto test our hypotheses rigorously
The Variables and Sample Size
The dependent variable used in the analysis is the annual average rate of de-forestation between 1990 and 2000 This variable is taken from the FAO esti-mates as reported in the World Development Indicators We examine 15 basicexplanatory variables The econometric estimates also test the significance ofquadratic terms (for income and rural population density) several interactionterms and dummy variables as explanatory variables In addition to the sixgovernance measures described in section III above we also include per capitaincome percentage rural population rural population density geographicalregion (1-6) forest type (tropicalothers) total roads globalization tradeopenness and a proxy for government commitment to forest protection Thelist of variables their definition and sources are given in the table in Annex 1
The total sample size of 90 countries breaks down as follows Africa (26)East Asia and the Pacific (12) Europe and Central Asia (30) Latin America(18) South Asia (2) North America (2) Only four countries in the sample(Togo Albania Macedonia and Fiji) have forested areas of less than 10000hectares 19 countries have a 1995 per capita income of more than US$10000per annum Table 1 below reports the descriptive statistics for the data
The rate of deforestation ranges from a maximum of 311 pa in the caseof Cote drsquoIvoire to a minimum of 17 in the case of Portugal In generalthe range of dispersion for most variables indicates that this is likely to be arepresentative sample of countries
A First Cut at the Role of Governance
A correlation matrix for the data shows that the simple correlation coeffi-cient between deforestation per annum and governance ranges from 022 inthe case of regulatory burden to-043 in the case of political stability (andrule of law) Thus at first blush it appears that an improvement in any of thesix dimensions of governance is likely to reduce deforestation
This finding is corroborated when we estimate a simple linear regressionfor each of the six variables on deforestation rates In each case the coefficientfor the independent variable is negative and significant at the 5 level (see ta-ble in Annex 2)
The Full Econometric Analysis
To recap we are interested in testing the hypothesis that our various mea-sures of overall governance impact the forestry sector Our a priori expecta-
68 Cutting Crime Strategies for Addressing Illegal Logging in the Tropics
tion is that an improvement in governance will have a positive impact inreducing deforestation The preliminary analysis suggests that indeed gover-nance does matter for forest management But this is clearly only a partial pic-ture Section II of the paper points out that deforestation is likely to be affectedby a large number of factors Moreover at a conceptual level these relation-ships are likely to be complex and two-way direct and indirect and strong anddiffuse (Kaimowitz and Angelsen 1999) Thus we need to incorporate sev-eral other explanatory variables in our regression estimates in order to test in arobust manner whether governance matters To the extent that reliable mea-sures are available these will be included in the econometric equations beingestimated
As a starting point deforestation is regressed on all the variables of interestin our sample-including the square of the per capita income-for the entire sam-ple of 90 countries The results are reported in panel 31 of Annex 3 The over-all explanatory power of the model is reasonable (R2 = 048) However noneof the 6 governance coefficients are statistically significant Only three coeffi-cients are significant at 10 or less per capital income the square of per ca-pita income and the total road network
Theoretical Approaches to Understanding Forest Governance 69
TABLE 1 Descriptive Statistics for Model Variables
Variable AbbreviatedName
Mean StandardDeviation
MinimumValue
MaximumValue
Percentage rate of deforestationper annum
Dfpa 045 094 -170 311
Area deforested per annum Dfarpa 84682 364283 1806300 2226400
Per Capita Income in 1995 Pppcy95 740462 763815 47400 2827400
Rural Population Density Popdenrur95 3247345 65323 574 60214
Government Commitment forForest Protection
Forprot 944 815 000 4309
Total Roads Network Roads 25666290 74180410 337000 629610700
Rural Populationa as a oftotal population
Rurpop 4601 2112 300 8750
Globalization Globalness 3101 2490 201 13712
Trade Openness Openess 284 115 100 500
Voice and Accountability Voice 027 087 162 169
Political Stability and Lack ofViolence
Polstability 002 090 259 169
Government Effectiveness Goveffect 007 084 177 199
Lack of Regulatory Burden Regburden 021 066 234 121
Control of Corruption and Graft Corrupgraft 003 090 156 209
Rule of Law Rulelaw 002 092 215 200
In a regression using the area deforested as the dependent variable the co-efficient of per capita income (PPPCY95) is negative and that for the square ofper capita income (PPCY95SQ) is positive This casts doubt on the ldquoKuznetscurverdquo hypothesis for this sector and turns out to be an important (and robust)finding of the present analysis (results available upon request) The Kuznetshypothesis states that as incomes rise deforestation will fall after an initial in-crease at a certain threshold level of income For this to happen the coeffi-cient of the income variable should be positive and the coefficient of thesquare of the income term should be negative-just the reverse of our estimates
The coefficient for the road network is significant but unexpectedly has anegative sign A priori one would expect that more roads would lead togreater clearing of forestlands One explanation for the unexpected sign on theroad variable is that because of data unavailability we measure the total roadnetwork in a country rather than the road network in forest areas The lattervariable may still be relevant to deforestation rates
The apparent contradiction between a reasonable overall R2 and individualcoefficients that are mostly insignificant suggests multicollinearity among theexplanatory variables Multicollinearity occurs when explanatory variablespredict each other and do not have individual explanatory power The simplecorrelation matrix for this data indicates a very high degree of collinearityamong our 6 governance variables with the simple correlation coefficientranging from 071 to 094 This suggests that multicollinearity is a likely prob-lem dropping some of these variables may correct the problem Changing thesample size is yet another option this has been explored by regressing on asubset of the sample but the results were not favorable Because of this prob-lem of multicollinearity subsequent regressions use only one out of the sixgovernance measures Various combinations of the governance variables weretried but none were statistically significant when income and the square of in-come were included as explanatory variables (results available upon requestfrom authors) With the qualification that the results come out much the sameno matter which governance measure is tried the rest of the analysis in this pa-per will focus on exploring the function of voice and accountability (VOICE)on the rate of deforestation
The simple correlation coefficients between per capita income (PPPCY95)and the governance measures are also high ranging from 062 to 085 Theyare also almost as highly correlated with the square of the per capita incomeThis was to be expected and it is consistent with the finding that improvementin governance leads to large increases in incomes the so-called ldquodevelopmentdividendrdquo story discussed in section III above In this data sample regressingper capita income on the governance measures individually yields high R2
(these range from 039 to 073) and coefficients that are significant at 1
70 Cutting Crime Strategies for Addressing Illegal Logging in the Tropics
level thus corroborating the Kaufman et al (1999b) results (results availableupon request from authors)
These findings suggest that governance variables are likely to have an indi-rect impact on deforestation through the per capita income variable But doesgovernance have a direct impact on deforestation In order to test this hypoth-esis we first ldquopurgedrdquo the influence of income by regressing deforestation onincome and the square of income and calculating the residuals In the secondstep these estimated residuals (DFPARES) from the first regression equationwere regressed on the other explanatory variables plus one governance mea-sure in turn
The regression equation for VOICE is reported in Annex 32 The coeffi-cient for VOICE is not statistically significant The only significant variable isDUM3 (which takes the value 1 if a country is in the Europe or Central Asia re-gion and 0 otherwise) with a negative sign indicating that all else equal if acountry belongs to the ECA region it is likely to experience less deforestationQualitatively similar results are obtained when VOICE is replaced by othermeasures of governance Thus in overall terms the message emerging fromthis data analysis is that governance measures do not have a direct impact ondeforestation but a favorable indirect impact cannot be ruled out
An additional test of whether governance has a direct impact on deforesta-tion was conducted as follows the most favorable conditions under which thiscould happen are provided by (i) not purging the influence of per capita in-come from DFPA (the dependent variable) and (ii) not including per capita in-come as an explanatory variable Annex 33 reports the regression equationusing VOICE as one of the explanatory variables The coefficient of VOICEhas a negative sign but is not statistically significant Only two variables arestatistically significant First RURPOP (which is the proportion of total popu-lation residing in rural areas) has a positive sign-indicating that a higher pro-portion of population living in the rural areas other things being equal islikely to lead to greater deforestation And second DUM3 has a negativesign-indicating that if a country belongs to the ECA region all else equal it islikely to experience less deforestation
CONCLUDING REMARKS
To test the basic hypothesis that improving governance has a favorable im-pact in reducing deforestation we have performed a variety of statistical anal-yses on a cross-country dataset for 90 countries This dataset is unique fromothers in the literature in that it includes six objectively constructed variableswhich measure various aspects of governance such as the strength of the ruleof law and the extent of civil liberties including the freedom of the press-as-
Theoretical Approaches to Understanding Forest Governance 71
pects which are expected to impact deforestation Our main conclusion is thatwith these measures of governance and with the econometric approach adoptedwe find little evidence of a direct impact of governance on deforestation
However two findings from our data analysis are significant First incomehas a statistically significant and negative impact on deforestation ie risingincomes are likely to reduce the rate of deforestation Second the governancemeasures used in this study have a statistically significant and quantitativelylarge impact in increasing incomes-ie improving governance may act as acatalyst to increasing incomes These two findings taken together imply thatimproving governance may have an indirect but strong impact on curbing de-forestation
The lack of support for a direct impact of governance variables on defores-tation is consistent with the notion that governance is a macro-level vari-able-or an ldquounderlying variablerdquo (Kaimowitz and Angelsen 1999)-and assuch its impact on the forestry sector a priori is expected to be diffuse and un-certain Our findings are also consistent with a ldquotargets and instrumentsrdquo ap-proach which states that the best policy levers are those that have (or arethought to have) the most direct impacts on the chosen targets In our case thisapproach would suggest that if the main objective is to reduce deforestation inthe short run then undertaking steps most specific to the forestry sector arelikely to be the most effective both in terms of cost and outcomes Our reviewof the literature suggests that specific strategies include reforms in forest pol-icy scientific forest management and forest law enforcement and compli-ance In the present analysis variables such as government commitment toforest protection extent of globalization trade openness rural population as apercentage of total population rural population density were included as prox-ies for these direct policy options Only the rural population density variableproved to be statistically significant (equation 33 in Annex 3) and with the ex-pected sign thus providing support for the targets and instruments approach
The measures used here are indeed incomplete and imprecise and muchmore analytical rigor is required As such the results in this paper should betreated as preliminary A key research effort in the future is to collect more andbetter data on variables measuring sector-specific actions of the type men-tioned in section II of the paper (indicators of forest policy scientific forestmanagement and forest law enforcement) Such data would enable more rigor-ous testing of the hypotheses proposed in this paper It is also important to notethat in addition to refining the formal econometric model it is crucial tocross-check our findings against site specific surveys and country case-studies(Kaimowitz and Angelsen 1999) This also includes an analysis of ldquooutliersrdquoreferred to but not pursued in this paper
Despite the lack of evidence of direct impacts of governance on deforesta-tion efforts must be made to continually improve the quality of overall gover-
72 Cutting Crime Strategies for Addressing Illegal Logging in the Tropics
nance in any economy for at least two reasons First good governance acts asa catalyst for many desirable social and economic outcomes such as improve-ments in literacy and child mortality rates and a sharper rise in growth and in-comes In turn at least some of these particularly growth in incomes havebeen shown as having beneficial impacts in controlling deforestation Andsecond we should not forget Greshamrsquos law which in the context of gover-nance is to be interpreted as stating that an overall environment of poor gover-nance will likely drive out good policies Thus in the long run policy reformsin the forestry sector will likely have a better chance of being implemented andhave lasting impacts in a situation of better overall governance in the econ-omy
REFERENCES
Baird M 2001 Forest Crimes as a Constraint to Development in East Asia Speechdelivered at the Forest Law Enforcement and Governance East Asia MinisterialConference Bali Indonesia September 11-13 2001 Available at httplnweb18worldbank orgeapeapnsf2500ec5f1a2d9bad852568a3006f557dc19065b26241f0b247256ac30010e5ffOpenDocument
Bardhan P 1997 Corruption and Development A Review of Issues Journal of Eco-nomic Literature Vol XXXV (Sept 1997) pp 1320-1346
Bekhechi M 2001 Governance and the Design and Implementation of Forest Legisla-tion Presentation at the Forest Law Enforcement and Governance East Asia Minis-terial Conference Bali Indonesia September 11-13 2001 Available at httplnweb18worldbankorgeapeapnsf2500ec5f1a2d9bad852568a3006f557dc19065b26241f0b247256ac30010e5ffOpenDocument
bin Buang A 2001 Forest Management Experiences from East Asia Paper deliv-ered at the Forest Law Enforcement and Governance East Asia Ministerial Con-ference Bali Indonesia September 11-13 2001 Available at httplnweb18worldbankorgeapeapnsf2500ec5f1a2d9bad852568a3006f557dc19065b26241f0b247256ac30010e5ffOpenDocument
Callister D J 1999 Corrupt and Illegal Activities in the Forestry Sector Current un-derstandings and implications for World Bank Forest Policy Discussion DraftMay 1999 Available at httpwbln0018worldbankorgessdforestpol-ensfHiddenDocViewBCE9D2A90FADBA73852568A3006493E0OpenDocument
Contreras-Hermosilla A 2002 Law Compliance in the Forestry Sector An OverviewWBI Working Papers World Bank Institute The World Bank 2002 Also availableat httplnweb18worldbankorgeapeapnsf2500ec5f1a2d9bad852568a3006f557dc19065b26241f0b247256ac30010e5ffOpenDocument
Deacon R 1994 Deforestation and the Rule of Law in a Cross Section of CountriesLand Economics 70(4) 1994 pp414-430
Didia D O 1997 Democracy Political Instability and Tropical DeforestationGlobal Environmental Change vol71 pp 63-76
EIA (Environmental Investigation Agency and Telepak Indonesia) 2001 TimberTrafficking September 2001 Available at httpwwweia-internationalorg
Theoretical Approaches to Understanding Forest Governance 73
Glastra R (editor) 1999 Cut and Run Illegal Logging and Timber Trade in the Trop-ics International Development Research Center IDRC Ottawa Canada
ITTO 2000 Review of Progress towards Year 2000 Objective ITTO YokohamaJapan
Johnston M and A Doig 1999 Different Views on Good Government and Sustain-able Anticorruption Strategies In Curbing Corruption Towards a Model forBuilding National Integrity by R Stapenhurst and SJ Kpundeh (editors) EDI De-velopment Studies World Bank Washington DC USA
Kaimowitz David and Arild Angelsen 1999 Rethinking the Causes of DeforestationLessons from Economic Models The World Bank Research Observer Vol 141pp 73-98 The World Bank Washington DC
Kaimowitz David 2001 Forest Crimes and Forest Law Enforcement Issues andChallenges for East Asia Keynote presentation at the Forest Law Enforcementand Governance East Asia Ministerial Conference Bali Indonesia Septem-ber 11-13 2001 Available at httplnweb18worldbankorgeapeapnsf2500ec5f1a2d9bad852568a3006f557dc19065b26241f0b247256ac30010e5ffOpenDocument
Kaufmann D A Kraay and P Zoido-Lobatoacuten1999a Aggregating Governance Indi-cators Policy Research Working Paper 2195 The World Bank Washington DCUSA
Kaufmann D A Kraay and P Zoido-Lobatoacuten 1999b Governance Matters PolicyResearch Working Paper 2196 The World Bank Washington DC USA
Kishor N 2002 Sustaining Forest by Improving Governance An Overview and Ele-ments of a Strategy Paper prepared for the PREM Anticorruption Thematic Knowl-edge Management Group of the World Bank Processed
Magrath W and R Grandalski 2001 Forest Law Enforcement Policies Strategiesand Technologies
Mainardi S 1996 An Econometric Analysis of Factors Affecting Tropical and Sub-tropical Deforestation mimeo Department of Economics University of NatalSouth Africa (Main findings summarized in Kaimowitz and Angelsen 1999)
Melle A and DeAndra Beck 2001 The US Forest Service Approach to Forest LawEnforcement Presentation at the Forest Law Enforcement and Governance EastAsia Ministerial Conference Bali Indonesia September 11-13 2001 Available athttplnweb18worldbankorgeapeapnsf2500ec5f1a2d9bad852568a3006f557dc19065b26241f0b247256ac30010e5ffOpenDocument
Palo Matti 2001 How Does Corruption Drive Deforestation in the Tropics Unpub-lished paper presented at ldquoCorruption in Forestry Roundtable Discussion on IllegalLogging and FINrdquo 10th International Anti Corruption Conference Prague October2001 Available at www10iaccorg
Poore D 1989 No Timber Without Trees Sustainability in the Tropical ForestEarthscan
Rosenbaum K L 2002 Illegal Actions and the Forest Sector A Legal PerspectivePaper presented at the ISTF conference on illegal logging at Yale University March29-30 2002
Shafik N 1997 Macroeconomic Causes of Deforestation Barking up the WrongTree In Katarina Brown and David Pearce (eds) The Causes of Tropical Defores-
74 Cutting Crime Strategies for Addressing Illegal Logging in the Tropics
tation The Economic and Statistical Analysis of Factors Giving Rise to the Loss ofTropical Forests University College London Press London
Stapenhurst R and SJ Kpundeh (editors)1999 Curbing Corruption Towards aModel for Building National Integrity EDI Development Studies World BankWashington DC USA
Thomas V M Dailami A Dhareshwar D Kaufmann N Kishor R Lopez and YWang 2000 The Quality of Growth Oxford University Press New York USASeptember 2000
World Bank 1997 Helping Countries to Combat Corruption The Role of the WorldBank Washington DC USA
World Bank 2000 Reforming Public Institutions and Strengthening Governance AWorld Bank Strategy Public Sector Group PREM Network The World Bank No-vember 2000
APPENDIX 1 Variable Definition and Data Sources
Variable amp Acronym Description and Source
Annual rate ofDeforestation(DFPA)
Average annual deforestation refers to the permanent conversion ofnatural forest area to other uses including shifting cultivation permanentagriculture ranching settlements and infrastructure developmentDeforested areas do not include areas logged but intended forregeneration or areas degraded by fuelwood gathering acid precipitationor forest fires This covers the period 1990 to 2000 Negative numbersindicate an increase in forest area Drawn from the World DevelopmentIndicators (WDI)
Per Capita Income(PPPCY95)
GDP per capita based on purchasing power parity (PPP) PPP GDP isgross domestic product converted to international dollars usingpurchasing power parity rates An international dollar has the samepurchasing power over GDP as the US dollar has in the United StatesGDP is the sum of gross value added by all resident producers in theeconomy plus any product taxes and minus any subsidies not included inthe value of the products It is calculated without making deductions fordepreciation of fabricated assets or for depletion and degradation ofnatural resources Data are in current international dollars for 1995
Rural PopulationDensity(POPDENRUR95)
Rural population density is the rural population divided by the arable landarea Rural population is calculated as the difference between the totalpopulation and the urban population Arable land includes land defined bythe FAO as land under temporary crops (double-cropped areas arecounted once) temporary meadows for mowing or for pasture land undermarket or kitchen gardens and land temporarily fallow Land abandonedas a result of shifting cultivation is excluded The information is takenfrom the WDI for 1995
Total roads network(ROADS)
Total road network includes motorways highways and main or nationalroads secondary or regional roads and all other roads in a country for1995 For more information see WDI
Theoretical Approaches to Understanding Forest Governance 75
Variable amp Acronym Description and Source
Rural Population asa of total(RURPOP)
Rural population is calculated as the difference between the totalpopulation and the urban population for 1995 For more information seeWDI
Globalization(GLOBALNESS)
Trade in goods as a share of PPP GDP is the sum of merchandiseexports and imports measured in current US dollars divided by the valueof GDP converted to international dollars using purchasing power parityrates (see WDI table 11 for a discussion of PPP) For more informationsee WDI
Governmentcommitment toprotect forests(FORPROT)
Nationally protected areas are totally or partially protected areas of atleast 1000 hectares that are designated as national parks naturalmonuments nature reserves or wildlife sanctuaries protected landscapesand seascapes or scientific reserves with limited public access The datado not include sites protected under local or provincial law Total landarea is used to calculate the percentage of total area protected For moreinformation see WDI
Trade Openness(OPENESS)
Index of trade openness developed by the Heritage Foundation and theWall Street Journal It takes a value between 1 and 5 with higher valuesrepresenting greater openness An economy earns ldquo5rdquo if it has anaverage tariff rate of less than or equal to four percentage points andorhas very few non-tariff barriers and ldquo1rdquo if the average tariff rate is greaterthan 19 and there are very high non-tariff barriers that virtually prohibitexports
Regional DummyVariables(DUM1 DUM2DUM3 DUM4DUM5)
Dum1=1 if country is from the Africa region 0 otherwise Dum2=1 ifcountry is from the East Asia and Pacific region 0 otherwise Dum3=1 ifcountry is from the Europe and Central Asia region 0 otherwise Dum4=1if country is from the Latin America and the Caribbean region 0otherwise Dum5=1 if country is from the South Asia region 0 otherwise
Voice andAccountability(VOICE)
Definition given in main text Scaled to lie between -25 and +25 withhigher values corresponding to better outcomes (Kaufmann et al 1999a)
Political Stabilityand Lack of Violence(POLSTABILITY)
Definition given in main text Scaled to lie between -25 and +25 withhigher values corresponding to better outcomes (Kaufmann et al 1999a)
GovernmentEffectiveness(GOVEFFECT)
Definition given in main text Scaled to lie between -25 and +25 withhigher values corresponding to better outcomes (Kaufmann et al 1999a)
Lack of RegulatoryBurden(REGBURDEN)
Definition given in main text Scaled to lie between -25 and +25 withhigher values corresponding to better outcomes (Kaufmann et al 1999a)
Control of Corruptionand Graft(CORRUPGRAFT)
Definition given in main text Scaled to lie between -25 and +25 withhigher values corresponding to better outcomes (Kaufmann et al 1999a)
Rule of Law(RULELAW)
Definition given in main text Scaled to lie between -25 and +25 withhigher values corresponding to better outcomes (Kaufmann et al 1999a)
76 Cutting Crime Strategies for Addressing Illegal Logging in the Tropics
APPENDIX 1 (continued)
APPENDIX 2 Deforestation and Governance Preliminary Regressions
1 regress dfpa voice robustdfpa Coef (Std Err) t value P gt t [95 Conf Interval]
voice 4289583(1164568)
368 0 06603917 019752
_cons 5605176(1095465)
512 0 03428169 0778218
R-squared 01581
2 regress dfpa Polstability robustdfpa Coef (Std Err) t value P gt t [95 Conf Interval]
polstability 4487853(0944765)
475 0 06365375 026103
_cons 4380415(089025)
492 0 02611231 061496
R-squared 01872
3 regress dfpa goveffect robustdfpa Coef (Std Err) t value P gt t [95 Conf Interval]
goveffect 434321(0900261)
482 0 06132289 025541
_cons 4780577(0950131)
503 0 02892392 0666876
R-squared 01512
4 regress dfpa regburden robustdfpa Coef(Std Err) t value P gt t [95 Conf Interval]
regburden 3061839(1576361)
194 0055 06194524 0007085
_cons 5091147(109868)
463 0 02907752 0727454
R-squared 00466
5 regress dfpa corrupgraft robustdfpa Coef (Std Err) t value P gt t [95 Conf Interval]
corrupgraft 4182503(0796322)
525 0 05765026 026
_cons 4590076(0922028)
498 0 02757739 0642241
R-squared 01608
6 regress dfpa rulelaw robustdfpa Coef (Std Err) t value P gt t [95 Conf Interval]
rulelaw 4403785(0792503)
556 0 05978719 028289
_cons 4562608(0905906)
504 0 02762311 0636291
R-squared 01859
Theoretical Approaches to Understanding Forest Governance 77
APPENDIX 3 Estimated Regression Equations
R-squared = 04760Root MSE = 76529
31
dfpa CoefRobustStd Err t Pgt|t| [95 Conf Interval]
pppcy95 0001192 0000691 172 0089 000257 0000187ppcy95sq 447e-09 234e-09 191 0060 199e-10 914e-09
popdenrur95 0000717 0001057 068 0500 0002825 0001392Rurpop 0034669 00706 049 0625 0106139 0175477Roads 270e-07 143e-07 189 0063 554e-07 147e-08Forprot 0041247 0084392 049 0627 0209562 0127068
Globalness 0009419 0049217 019 0849 010758 0088741Openess 0088526 1103738 008 0936 2289863 211281
voice 0095661 2970145 003 0974 5828106 6019429polstability 1300711 2806978 046 0645 6899051 429763
goveffect 1140439 3581059 032 0751 8282635 6001758regburden 4008919 3142829 128 0206 2259256 1027709
corrupgraft 1092471 309303 035 0725 5076382 7261324rulelaw 1136987 2987075 038 0705 7094521 4820546
dum1 279334 5497427 051 0613 8170932 1375761dum2 0020431 4917389 000 0997 9827853 9786992dum3 6086299 4543127 134 0185 1514728 2974681dum4 2056796 4971742 041 0680 7859031 1197262dum5 1123848 6016586 019 0852 1087585 1312355_cons 8505096 9084316 094 0352 9613002 2662319
R-squared = 02093Root MSE = 75325
32
dfpa CoefRobustStd Err t Pgt|t| [95 Conf Interval]
popdenrur95 0000118 0000933 013 0899 0001976 0001739Rurpop 0010213 0052154 020 0845 0114043 0093617Forprot 0009322 0070216 013 0895 0149111 0130468
Globalness 0022947 00633 036 0718 0148966 0103073Openess 0848079 1072875 079 0432 128785 2984009
voice 0922575 1438151 064 0523 1940564 3785714globaleca 0110322 0071316 155 0126 0031657 0252302
dum1 4594703 4679036 098 0329 4720542 1390995dum2 1481475 4446566 033 0740 7370958 1033391dum3 8379219 4543598 184 0069 1742483 0666389dum4 4211026 4297406 098 0330 4344452 127665_cons 246896 6044129 041 0684 145019 9563976
78 Cutting Crime Strategies for Addressing Illegal Logging in the Tropics
R-squared = 04338Root MSE = 74885
33
dfpa CoefRobustStd Err t Pgt|t| [95 Conf Interval]
popdenrur95 803e-06 0000828 010 0923 0001729 0001568Rurpop 0091163 0050173 182 0073 0008703 0191029Forprot 0011052 0075559 015 0884 0139343 0161448
Globalness 0018468 0035676 052 0606 0052544 008948Openess 0824247 097113 085 0399 1108739 2757232
voice 1053883 1426285 074 0462 3892832 1785066dum1 6128054 3934408 156 0123 1703188 139593dum2 0479116 3849347 012 0901 8141049 7182816dum3 6064678 3285722 185 0069 1260474 0475388dum4 4937404 3690511 134 0185 2408375 1228318_cons 3120502 465309 067 0504 1238225 6141243
Theoretical Approaches to Understanding Forest Governance 79
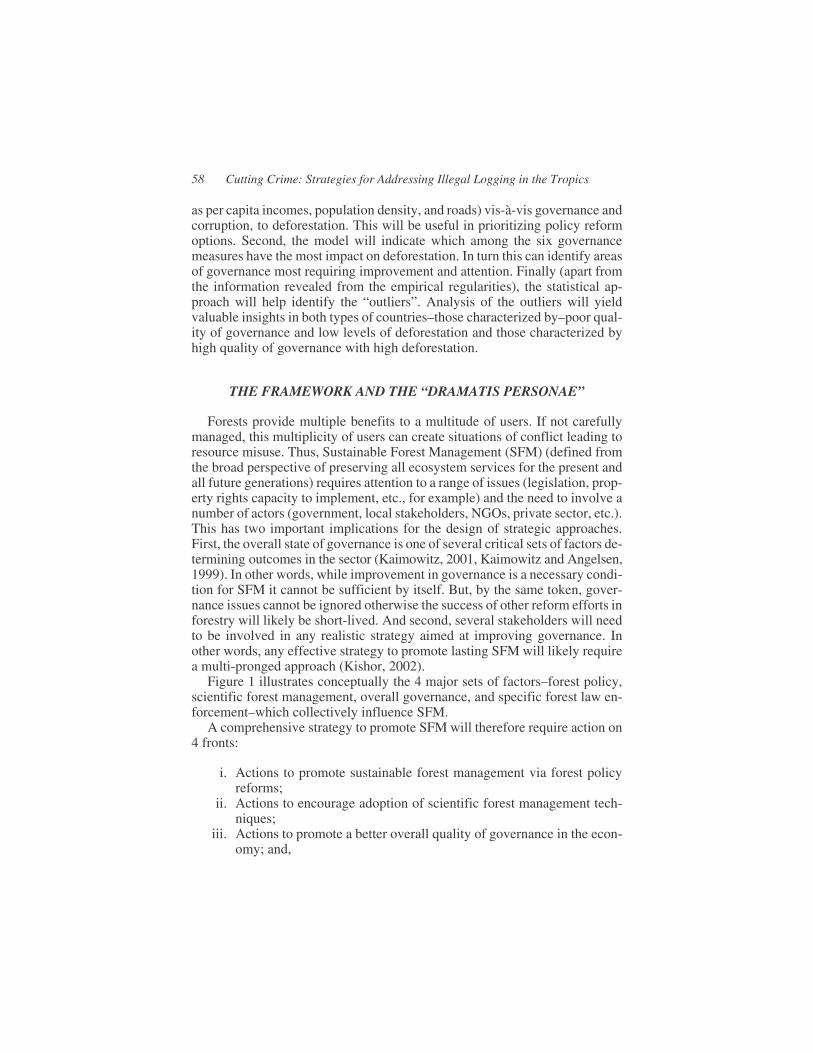
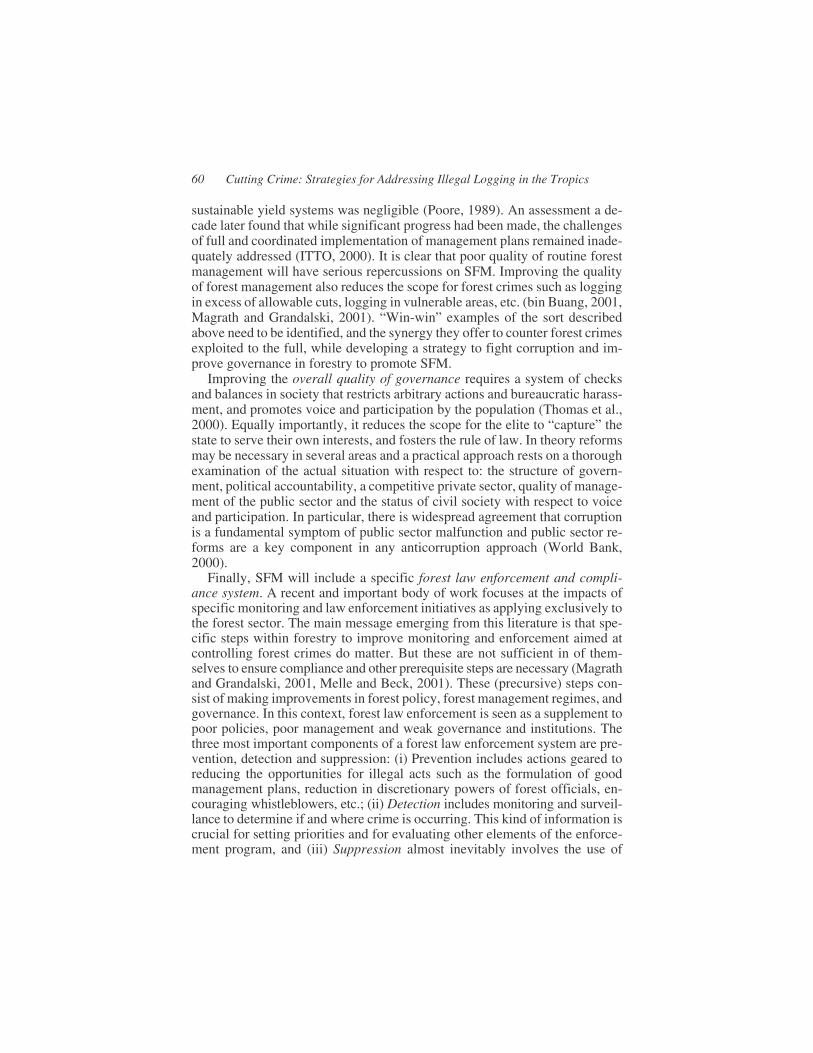
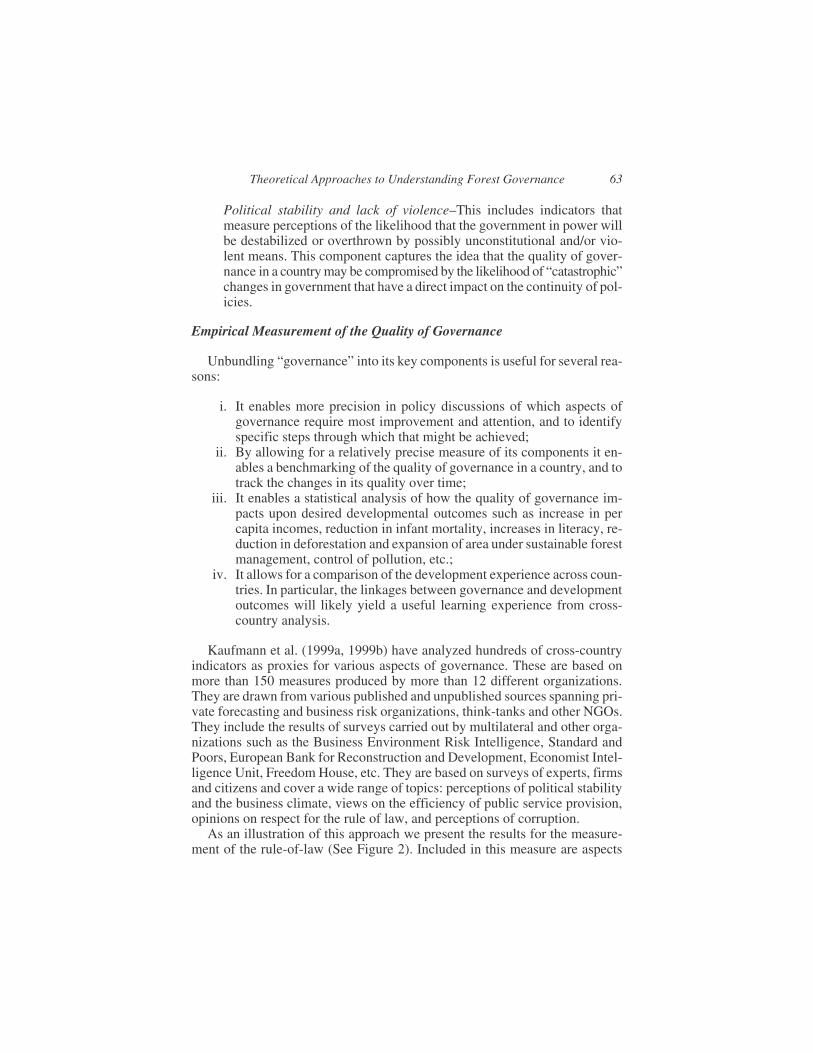

3
2
1
0
1
2
3
GOOD
Normalized Index
166 CountriesPOOR
Note Blue dots represent mean estimates forthe governance indicator The thin vertical linesrepresent standard errors around theseestimates
Congo Rep
IndonesiaEcuadorNepal
Russian Federation
VietnamBolivia Brazil
Armenia
Ghana
Belize
Philippines
Papua New Guinea
Tanzania
Argentina
Egypt Arab Rep
MalaysiaChile
Korea Rep
JapanCanadaGermany
FIGURE 2 Country Performance on the Rule of Law Index
Source ldquoGovernance Mattersrdquo by Daniel Kaufmann Aart Kraay and Pablo Zoido-Lobaton May 1999 (Kaufmann et al 1999b) httpwwwimforgex-ternalpubsftfandd200006kaufhtm
64
such as the enforceability of contracts variability in the application of the ruleof law applied across groups within the country police effectiveness in safe-guarding personal property size of a black market etc In the figure countriesare ordered along the horizontal axis according to their rankings while thevertical axis indicates the estimates of the rule of law for each country Thevertical bars represent the country specific confidence intervals (margins oferror) for the point estimate for rule of law Note that this measure (and theother five also) have been scaled to lie between 25 and +25 and oriented sothat higher values correspond to better outcomes
The margins of error can be considerable and rather than a strict ranking(based on imprecise point estimates) it is deemed more useful to classify coun-tries into three color-coded groups The red light group consists of those coun-tries that should be considered to be in a crisis of governance characterized inthis example by a significant lack of operation of the rule of law (for exampleBangladesh Ecuador Guatemala Indonesia Myanmar Russian Federation)The yellow light group characterizes those countries which are vulnerable orat risk of falling into a governance crisis (Argentina Brazil Ghana PNG Tan-zania) And finally the green light group of countries may be said to have a ro-bust rule of law component of governance and not likely to be at risk ofreverting into a crisis situation (Chile Malaysia Japan S Korea CanadaGermany US The traffic lights approach is useful in identifying the most vul-nerable countries that should be high priority for reforms aimed at improvinggovernance (Thomas et al 2000)
The Development Dividend of Improving the Quality of Governance
Development outcomes such as increases in per capita income reductionsin child mortality and increases in literacy have been statistically examinedwith the data on governance measures and development outcomes The empir-ical analysis suggests that the direct impact of better governance resulting inbetter development outcomes is large (Kaufmann et al 1999a 1999bThomaset al 2000) As an illustration consider an improvement (of one standard devi-ation) in the rule of law from the low level in the Russian Federation today tothe middling level in the Czech Republic or a similar reduction in corruptionfrom that in Indonesia to that in South Korea This is associated with an in-crease in per capita incomes by two to four times a reduction in infant mortal-ity by a similar magnitude and an improvement in literacy by 15 to 25 percentpoints in the long run Consider also that much larger improvements in gover-nance from the levels in Tajikistan (in the red light group) to those in Chile(green light group) are associated with a near doubling of the development im-pacts mentioned above
Theoretical Approaches to Understanding Forest Governance 65
The relationship between various development outcomes and four mea-sures of governance are illustrated in Figure 3 The heights of the vertical barsshow the differences in development outcomes with weak average and stronggovernance and illustrate the strong correlation between good outcomes andgood governance The solid lines represent the estimated impact of improvinggovernance on development outcomes-the ldquodevelopment dividendrdquo from gov-ernance This evidence provides strong support for the argument that improv-ing governance is of crucial importance for developing countries
DATA ANALYSIS
Models of Deforestation
Studies on the causes of deforestation abound in the literature Given ourinterest in exploring policy options to control deforestation however it is nei-ther our intention nor our task to do an extensive literature review For this theinterested reader can go to a recent and comprehensive review by Kaimowitzand Angelsen (1999) Instead we will focus on the literature that deals specifi-cally with the relationship between governance and deforestation
While extensive concern has been raised regarding the impact of gover-nance on deforestation few attempts have been made at a careful analysis andmeasurement of this relationship Part of the reason may stem from the diffi-culty in getting objective measures of governance (which we try to address inthis paper) However the study by Deacon is a good attempt (Deacon 1994)Using cross-country data he tests the hypothesis that insecure ownership exac-erbates deforestation He finds consistent associations between deforestationand political variables (such as constitutional changes guerilla warfare andrevolutions) reflecting insecure ownership However the estimates are notvery robust and the author suggests the need for better data and better modelbuilding (particularly to test for the exogeneity of the political attributes)Shafik (1997) however concludes that vesting clear property rights increasesdeforestation Mainardi (1996) concludes that deforestation is likely to bemore in countries that are politically unstable Similarly Didia (1997) con-cludes that democracies are characterized by lower deforestation Palo (2001)uses Transparency Internationalrsquos Corruption Perception Index as an explana-tory variable in a cross-country regression equation for deforestation (usingthe ratio of forest to non-forest area as the dependent variable) For a sample of36 tropical countries the coefficient was found to be significant at the 10level The coefficient indicates that a 10 improvement in the Corruption Per-ception Index will increase the ratio of forest to non-forest area by 5
The results from these studies generally support the hypothesis that im-provements in governance reduce deforestation However we build on the
66 Cutting Crime Strategies for Addressing Illegal Logging in the Tropics
DevelopmentDividend
DevelopmentDividend
DevelopmentDividend
DevelopmentDividendRule of Law
Control of Curruption Regulatory Burden
Voice and Accountability
Weak
Weak Weak
WeakAverage
Average Average
AverageGood
Good Good
Good
Infant Mortality and Per Capita Income and
Literacy and Per Capita Income and
Per
Cap
ita
Inco
me
Per
Cap
ita
Inco
me
12000
10000
8000
6000
4000
2000
0
10000900080007000600050004000300020001000
0
Lit
erac
yIn
fan
tM
ort
alit
y
9876543210
100
75
50
25
0
FIGURE 3 The Development Dividend of Good Governance
Note The bars depict the simple correlation between good governance and development outcomes The line predicted value when taking into account thecausality effects (ldquoDevelopment Dividendrdquo) from improved governance to development outcomes (Drawn from Thomas et al 2000)
67
previous work by refining the model particularly through the use of morecomprehensive and objectively constructed measures of governance in orderto test our hypotheses rigorously
The Variables and Sample Size
The dependent variable used in the analysis is the annual average rate of de-forestation between 1990 and 2000 This variable is taken from the FAO esti-mates as reported in the World Development Indicators We examine 15 basicexplanatory variables The econometric estimates also test the significance ofquadratic terms (for income and rural population density) several interactionterms and dummy variables as explanatory variables In addition to the sixgovernance measures described in section III above we also include per capitaincome percentage rural population rural population density geographicalregion (1-6) forest type (tropicalothers) total roads globalization tradeopenness and a proxy for government commitment to forest protection Thelist of variables their definition and sources are given in the table in Annex 1
The total sample size of 90 countries breaks down as follows Africa (26)East Asia and the Pacific (12) Europe and Central Asia (30) Latin America(18) South Asia (2) North America (2) Only four countries in the sample(Togo Albania Macedonia and Fiji) have forested areas of less than 10000hectares 19 countries have a 1995 per capita income of more than US$10000per annum Table 1 below reports the descriptive statistics for the data
The rate of deforestation ranges from a maximum of 311 pa in the caseof Cote drsquoIvoire to a minimum of 17 in the case of Portugal In generalthe range of dispersion for most variables indicates that this is likely to be arepresentative sample of countries
A First Cut at the Role of Governance
A correlation matrix for the data shows that the simple correlation coeffi-cient between deforestation per annum and governance ranges from 022 inthe case of regulatory burden to-043 in the case of political stability (andrule of law) Thus at first blush it appears that an improvement in any of thesix dimensions of governance is likely to reduce deforestation
This finding is corroborated when we estimate a simple linear regressionfor each of the six variables on deforestation rates In each case the coefficientfor the independent variable is negative and significant at the 5 level (see ta-ble in Annex 2)
The Full Econometric Analysis
To recap we are interested in testing the hypothesis that our various mea-sures of overall governance impact the forestry sector Our a priori expecta-
68 Cutting Crime Strategies for Addressing Illegal Logging in the Tropics
tion is that an improvement in governance will have a positive impact inreducing deforestation The preliminary analysis suggests that indeed gover-nance does matter for forest management But this is clearly only a partial pic-ture Section II of the paper points out that deforestation is likely to be affectedby a large number of factors Moreover at a conceptual level these relation-ships are likely to be complex and two-way direct and indirect and strong anddiffuse (Kaimowitz and Angelsen 1999) Thus we need to incorporate sev-eral other explanatory variables in our regression estimates in order to test in arobust manner whether governance matters To the extent that reliable mea-sures are available these will be included in the econometric equations beingestimated
As a starting point deforestation is regressed on all the variables of interestin our sample-including the square of the per capita income-for the entire sam-ple of 90 countries The results are reported in panel 31 of Annex 3 The over-all explanatory power of the model is reasonable (R2 = 048) However noneof the 6 governance coefficients are statistically significant Only three coeffi-cients are significant at 10 or less per capital income the square of per ca-pita income and the total road network
Theoretical Approaches to Understanding Forest Governance 69
TABLE 1 Descriptive Statistics for Model Variables
Variable AbbreviatedName
Mean StandardDeviation
MinimumValue
MaximumValue
Percentage rate of deforestationper annum
Dfpa 045 094 -170 311
Area deforested per annum Dfarpa 84682 364283 1806300 2226400
Per Capita Income in 1995 Pppcy95 740462 763815 47400 2827400
Rural Population Density Popdenrur95 3247345 65323 574 60214
Government Commitment forForest Protection
Forprot 944 815 000 4309
Total Roads Network Roads 25666290 74180410 337000 629610700
Rural Populationa as a oftotal population
Rurpop 4601 2112 300 8750
Globalization Globalness 3101 2490 201 13712
Trade Openness Openess 284 115 100 500
Voice and Accountability Voice 027 087 162 169
Political Stability and Lack ofViolence
Polstability 002 090 259 169
Government Effectiveness Goveffect 007 084 177 199
Lack of Regulatory Burden Regburden 021 066 234 121
Control of Corruption and Graft Corrupgraft 003 090 156 209
Rule of Law Rulelaw 002 092 215 200
In a regression using the area deforested as the dependent variable the co-efficient of per capita income (PPPCY95) is negative and that for the square ofper capita income (PPCY95SQ) is positive This casts doubt on the ldquoKuznetscurverdquo hypothesis for this sector and turns out to be an important (and robust)finding of the present analysis (results available upon request) The Kuznetshypothesis states that as incomes rise deforestation will fall after an initial in-crease at a certain threshold level of income For this to happen the coeffi-cient of the income variable should be positive and the coefficient of thesquare of the income term should be negative-just the reverse of our estimates
The coefficient for the road network is significant but unexpectedly has anegative sign A priori one would expect that more roads would lead togreater clearing of forestlands One explanation for the unexpected sign on theroad variable is that because of data unavailability we measure the total roadnetwork in a country rather than the road network in forest areas The lattervariable may still be relevant to deforestation rates
The apparent contradiction between a reasonable overall R2 and individualcoefficients that are mostly insignificant suggests multicollinearity among theexplanatory variables Multicollinearity occurs when explanatory variablespredict each other and do not have individual explanatory power The simplecorrelation matrix for this data indicates a very high degree of collinearityamong our 6 governance variables with the simple correlation coefficientranging from 071 to 094 This suggests that multicollinearity is a likely prob-lem dropping some of these variables may correct the problem Changing thesample size is yet another option this has been explored by regressing on asubset of the sample but the results were not favorable Because of this prob-lem of multicollinearity subsequent regressions use only one out of the sixgovernance measures Various combinations of the governance variables weretried but none were statistically significant when income and the square of in-come were included as explanatory variables (results available upon requestfrom authors) With the qualification that the results come out much the sameno matter which governance measure is tried the rest of the analysis in this pa-per will focus on exploring the function of voice and accountability (VOICE)on the rate of deforestation
The simple correlation coefficients between per capita income (PPPCY95)and the governance measures are also high ranging from 062 to 085 Theyare also almost as highly correlated with the square of the per capita incomeThis was to be expected and it is consistent with the finding that improvementin governance leads to large increases in incomes the so-called ldquodevelopmentdividendrdquo story discussed in section III above In this data sample regressingper capita income on the governance measures individually yields high R2
(these range from 039 to 073) and coefficients that are significant at 1
70 Cutting Crime Strategies for Addressing Illegal Logging in the Tropics
level thus corroborating the Kaufman et al (1999b) results (results availableupon request from authors)
These findings suggest that governance variables are likely to have an indi-rect impact on deforestation through the per capita income variable But doesgovernance have a direct impact on deforestation In order to test this hypoth-esis we first ldquopurgedrdquo the influence of income by regressing deforestation onincome and the square of income and calculating the residuals In the secondstep these estimated residuals (DFPARES) from the first regression equationwere regressed on the other explanatory variables plus one governance mea-sure in turn
The regression equation for VOICE is reported in Annex 32 The coeffi-cient for VOICE is not statistically significant The only significant variable isDUM3 (which takes the value 1 if a country is in the Europe or Central Asia re-gion and 0 otherwise) with a negative sign indicating that all else equal if acountry belongs to the ECA region it is likely to experience less deforestationQualitatively similar results are obtained when VOICE is replaced by othermeasures of governance Thus in overall terms the message emerging fromthis data analysis is that governance measures do not have a direct impact ondeforestation but a favorable indirect impact cannot be ruled out
An additional test of whether governance has a direct impact on deforesta-tion was conducted as follows the most favorable conditions under which thiscould happen are provided by (i) not purging the influence of per capita in-come from DFPA (the dependent variable) and (ii) not including per capita in-come as an explanatory variable Annex 33 reports the regression equationusing VOICE as one of the explanatory variables The coefficient of VOICEhas a negative sign but is not statistically significant Only two variables arestatistically significant First RURPOP (which is the proportion of total popu-lation residing in rural areas) has a positive sign-indicating that a higher pro-portion of population living in the rural areas other things being equal islikely to lead to greater deforestation And second DUM3 has a negativesign-indicating that if a country belongs to the ECA region all else equal it islikely to experience less deforestation
CONCLUDING REMARKS
To test the basic hypothesis that improving governance has a favorable im-pact in reducing deforestation we have performed a variety of statistical anal-yses on a cross-country dataset for 90 countries This dataset is unique fromothers in the literature in that it includes six objectively constructed variableswhich measure various aspects of governance such as the strength of the ruleof law and the extent of civil liberties including the freedom of the press-as-
Theoretical Approaches to Understanding Forest Governance 71
pects which are expected to impact deforestation Our main conclusion is thatwith these measures of governance and with the econometric approach adoptedwe find little evidence of a direct impact of governance on deforestation
However two findings from our data analysis are significant First incomehas a statistically significant and negative impact on deforestation ie risingincomes are likely to reduce the rate of deforestation Second the governancemeasures used in this study have a statistically significant and quantitativelylarge impact in increasing incomes-ie improving governance may act as acatalyst to increasing incomes These two findings taken together imply thatimproving governance may have an indirect but strong impact on curbing de-forestation
The lack of support for a direct impact of governance variables on defores-tation is consistent with the notion that governance is a macro-level vari-able-or an ldquounderlying variablerdquo (Kaimowitz and Angelsen 1999)-and assuch its impact on the forestry sector a priori is expected to be diffuse and un-certain Our findings are also consistent with a ldquotargets and instrumentsrdquo ap-proach which states that the best policy levers are those that have (or arethought to have) the most direct impacts on the chosen targets In our case thisapproach would suggest that if the main objective is to reduce deforestation inthe short run then undertaking steps most specific to the forestry sector arelikely to be the most effective both in terms of cost and outcomes Our reviewof the literature suggests that specific strategies include reforms in forest pol-icy scientific forest management and forest law enforcement and compli-ance In the present analysis variables such as government commitment toforest protection extent of globalization trade openness rural population as apercentage of total population rural population density were included as prox-ies for these direct policy options Only the rural population density variableproved to be statistically significant (equation 33 in Annex 3) and with the ex-pected sign thus providing support for the targets and instruments approach
The measures used here are indeed incomplete and imprecise and muchmore analytical rigor is required As such the results in this paper should betreated as preliminary A key research effort in the future is to collect more andbetter data on variables measuring sector-specific actions of the type men-tioned in section II of the paper (indicators of forest policy scientific forestmanagement and forest law enforcement) Such data would enable more rigor-ous testing of the hypotheses proposed in this paper It is also important to notethat in addition to refining the formal econometric model it is crucial tocross-check our findings against site specific surveys and country case-studies(Kaimowitz and Angelsen 1999) This also includes an analysis of ldquooutliersrdquoreferred to but not pursued in this paper
Despite the lack of evidence of direct impacts of governance on deforesta-tion efforts must be made to continually improve the quality of overall gover-
72 Cutting Crime Strategies for Addressing Illegal Logging in the Tropics
nance in any economy for at least two reasons First good governance acts asa catalyst for many desirable social and economic outcomes such as improve-ments in literacy and child mortality rates and a sharper rise in growth and in-comes In turn at least some of these particularly growth in incomes havebeen shown as having beneficial impacts in controlling deforestation Andsecond we should not forget Greshamrsquos law which in the context of gover-nance is to be interpreted as stating that an overall environment of poor gover-nance will likely drive out good policies Thus in the long run policy reformsin the forestry sector will likely have a better chance of being implemented andhave lasting impacts in a situation of better overall governance in the econ-omy
REFERENCES
Baird M 2001 Forest Crimes as a Constraint to Development in East Asia Speechdelivered at the Forest Law Enforcement and Governance East Asia MinisterialConference Bali Indonesia September 11-13 2001 Available at httplnweb18worldbank orgeapeapnsf2500ec5f1a2d9bad852568a3006f557dc19065b26241f0b247256ac30010e5ffOpenDocument
Bardhan P 1997 Corruption and Development A Review of Issues Journal of Eco-nomic Literature Vol XXXV (Sept 1997) pp 1320-1346
Bekhechi M 2001 Governance and the Design and Implementation of Forest Legisla-tion Presentation at the Forest Law Enforcement and Governance East Asia Minis-terial Conference Bali Indonesia September 11-13 2001 Available at httplnweb18worldbankorgeapeapnsf2500ec5f1a2d9bad852568a3006f557dc19065b26241f0b247256ac30010e5ffOpenDocument
bin Buang A 2001 Forest Management Experiences from East Asia Paper deliv-ered at the Forest Law Enforcement and Governance East Asia Ministerial Con-ference Bali Indonesia September 11-13 2001 Available at httplnweb18worldbankorgeapeapnsf2500ec5f1a2d9bad852568a3006f557dc19065b26241f0b247256ac30010e5ffOpenDocument
Callister D J 1999 Corrupt and Illegal Activities in the Forestry Sector Current un-derstandings and implications for World Bank Forest Policy Discussion DraftMay 1999 Available at httpwbln0018worldbankorgessdforestpol-ensfHiddenDocViewBCE9D2A90FADBA73852568A3006493E0OpenDocument
Contreras-Hermosilla A 2002 Law Compliance in the Forestry Sector An OverviewWBI Working Papers World Bank Institute The World Bank 2002 Also availableat httplnweb18worldbankorgeapeapnsf2500ec5f1a2d9bad852568a3006f557dc19065b26241f0b247256ac30010e5ffOpenDocument
Deacon R 1994 Deforestation and the Rule of Law in a Cross Section of CountriesLand Economics 70(4) 1994 pp414-430
Didia D O 1997 Democracy Political Instability and Tropical DeforestationGlobal Environmental Change vol71 pp 63-76
EIA (Environmental Investigation Agency and Telepak Indonesia) 2001 TimberTrafficking September 2001 Available at httpwwweia-internationalorg
Theoretical Approaches to Understanding Forest Governance 73
Glastra R (editor) 1999 Cut and Run Illegal Logging and Timber Trade in the Trop-ics International Development Research Center IDRC Ottawa Canada
ITTO 2000 Review of Progress towards Year 2000 Objective ITTO YokohamaJapan
Johnston M and A Doig 1999 Different Views on Good Government and Sustain-able Anticorruption Strategies In Curbing Corruption Towards a Model forBuilding National Integrity by R Stapenhurst and SJ Kpundeh (editors) EDI De-velopment Studies World Bank Washington DC USA
Kaimowitz David and Arild Angelsen 1999 Rethinking the Causes of DeforestationLessons from Economic Models The World Bank Research Observer Vol 141pp 73-98 The World Bank Washington DC
Kaimowitz David 2001 Forest Crimes and Forest Law Enforcement Issues andChallenges for East Asia Keynote presentation at the Forest Law Enforcementand Governance East Asia Ministerial Conference Bali Indonesia Septem-ber 11-13 2001 Available at httplnweb18worldbankorgeapeapnsf2500ec5f1a2d9bad852568a3006f557dc19065b26241f0b247256ac30010e5ffOpenDocument
Kaufmann D A Kraay and P Zoido-Lobatoacuten1999a Aggregating Governance Indi-cators Policy Research Working Paper 2195 The World Bank Washington DCUSA
Kaufmann D A Kraay and P Zoido-Lobatoacuten 1999b Governance Matters PolicyResearch Working Paper 2196 The World Bank Washington DC USA
Kishor N 2002 Sustaining Forest by Improving Governance An Overview and Ele-ments of a Strategy Paper prepared for the PREM Anticorruption Thematic Knowl-edge Management Group of the World Bank Processed
Magrath W and R Grandalski 2001 Forest Law Enforcement Policies Strategiesand Technologies
Mainardi S 1996 An Econometric Analysis of Factors Affecting Tropical and Sub-tropical Deforestation mimeo Department of Economics University of NatalSouth Africa (Main findings summarized in Kaimowitz and Angelsen 1999)
Melle A and DeAndra Beck 2001 The US Forest Service Approach to Forest LawEnforcement Presentation at the Forest Law Enforcement and Governance EastAsia Ministerial Conference Bali Indonesia September 11-13 2001 Available athttplnweb18worldbankorgeapeapnsf2500ec5f1a2d9bad852568a3006f557dc19065b26241f0b247256ac30010e5ffOpenDocument
Palo Matti 2001 How Does Corruption Drive Deforestation in the Tropics Unpub-lished paper presented at ldquoCorruption in Forestry Roundtable Discussion on IllegalLogging and FINrdquo 10th International Anti Corruption Conference Prague October2001 Available at www10iaccorg
Poore D 1989 No Timber Without Trees Sustainability in the Tropical ForestEarthscan
Rosenbaum K L 2002 Illegal Actions and the Forest Sector A Legal PerspectivePaper presented at the ISTF conference on illegal logging at Yale University March29-30 2002
Shafik N 1997 Macroeconomic Causes of Deforestation Barking up the WrongTree In Katarina Brown and David Pearce (eds) The Causes of Tropical Defores-
74 Cutting Crime Strategies for Addressing Illegal Logging in the Tropics
tation The Economic and Statistical Analysis of Factors Giving Rise to the Loss ofTropical Forests University College London Press London
Stapenhurst R and SJ Kpundeh (editors)1999 Curbing Corruption Towards aModel for Building National Integrity EDI Development Studies World BankWashington DC USA
Thomas V M Dailami A Dhareshwar D Kaufmann N Kishor R Lopez and YWang 2000 The Quality of Growth Oxford University Press New York USASeptember 2000
World Bank 1997 Helping Countries to Combat Corruption The Role of the WorldBank Washington DC USA
World Bank 2000 Reforming Public Institutions and Strengthening Governance AWorld Bank Strategy Public Sector Group PREM Network The World Bank No-vember 2000
APPENDIX 1 Variable Definition and Data Sources
Variable amp Acronym Description and Source
Annual rate ofDeforestation(DFPA)
Average annual deforestation refers to the permanent conversion ofnatural forest area to other uses including shifting cultivation permanentagriculture ranching settlements and infrastructure developmentDeforested areas do not include areas logged but intended forregeneration or areas degraded by fuelwood gathering acid precipitationor forest fires This covers the period 1990 to 2000 Negative numbersindicate an increase in forest area Drawn from the World DevelopmentIndicators (WDI)
Per Capita Income(PPPCY95)
GDP per capita based on purchasing power parity (PPP) PPP GDP isgross domestic product converted to international dollars usingpurchasing power parity rates An international dollar has the samepurchasing power over GDP as the US dollar has in the United StatesGDP is the sum of gross value added by all resident producers in theeconomy plus any product taxes and minus any subsidies not included inthe value of the products It is calculated without making deductions fordepreciation of fabricated assets or for depletion and degradation ofnatural resources Data are in current international dollars for 1995
Rural PopulationDensity(POPDENRUR95)
Rural population density is the rural population divided by the arable landarea Rural population is calculated as the difference between the totalpopulation and the urban population Arable land includes land defined bythe FAO as land under temporary crops (double-cropped areas arecounted once) temporary meadows for mowing or for pasture land undermarket or kitchen gardens and land temporarily fallow Land abandonedas a result of shifting cultivation is excluded The information is takenfrom the WDI for 1995
Total roads network(ROADS)
Total road network includes motorways highways and main or nationalroads secondary or regional roads and all other roads in a country for1995 For more information see WDI
Theoretical Approaches to Understanding Forest Governance 75
Variable amp Acronym Description and Source
Rural Population asa of total(RURPOP)
Rural population is calculated as the difference between the totalpopulation and the urban population for 1995 For more information seeWDI
Globalization(GLOBALNESS)
Trade in goods as a share of PPP GDP is the sum of merchandiseexports and imports measured in current US dollars divided by the valueof GDP converted to international dollars using purchasing power parityrates (see WDI table 11 for a discussion of PPP) For more informationsee WDI
Governmentcommitment toprotect forests(FORPROT)
Nationally protected areas are totally or partially protected areas of atleast 1000 hectares that are designated as national parks naturalmonuments nature reserves or wildlife sanctuaries protected landscapesand seascapes or scientific reserves with limited public access The datado not include sites protected under local or provincial law Total landarea is used to calculate the percentage of total area protected For moreinformation see WDI
Trade Openness(OPENESS)
Index of trade openness developed by the Heritage Foundation and theWall Street Journal It takes a value between 1 and 5 with higher valuesrepresenting greater openness An economy earns ldquo5rdquo if it has anaverage tariff rate of less than or equal to four percentage points andorhas very few non-tariff barriers and ldquo1rdquo if the average tariff rate is greaterthan 19 and there are very high non-tariff barriers that virtually prohibitexports
Regional DummyVariables(DUM1 DUM2DUM3 DUM4DUM5)
Dum1=1 if country is from the Africa region 0 otherwise Dum2=1 ifcountry is from the East Asia and Pacific region 0 otherwise Dum3=1 ifcountry is from the Europe and Central Asia region 0 otherwise Dum4=1if country is from the Latin America and the Caribbean region 0otherwise Dum5=1 if country is from the South Asia region 0 otherwise
Voice andAccountability(VOICE)
Definition given in main text Scaled to lie between -25 and +25 withhigher values corresponding to better outcomes (Kaufmann et al 1999a)
Political Stabilityand Lack of Violence(POLSTABILITY)
Definition given in main text Scaled to lie between -25 and +25 withhigher values corresponding to better outcomes (Kaufmann et al 1999a)
GovernmentEffectiveness(GOVEFFECT)
Definition given in main text Scaled to lie between -25 and +25 withhigher values corresponding to better outcomes (Kaufmann et al 1999a)
Lack of RegulatoryBurden(REGBURDEN)
Definition given in main text Scaled to lie between -25 and +25 withhigher values corresponding to better outcomes (Kaufmann et al 1999a)
Control of Corruptionand Graft(CORRUPGRAFT)
Definition given in main text Scaled to lie between -25 and +25 withhigher values corresponding to better outcomes (Kaufmann et al 1999a)
Rule of Law(RULELAW)
Definition given in main text Scaled to lie between -25 and +25 withhigher values corresponding to better outcomes (Kaufmann et al 1999a)
76 Cutting Crime Strategies for Addressing Illegal Logging in the Tropics
APPENDIX 1 (continued)
APPENDIX 2 Deforestation and Governance Preliminary Regressions
1 regress dfpa voice robustdfpa Coef (Std Err) t value P gt t [95 Conf Interval]
voice 4289583(1164568)
368 0 06603917 019752
_cons 5605176(1095465)
512 0 03428169 0778218
R-squared 01581
2 regress dfpa Polstability robustdfpa Coef (Std Err) t value P gt t [95 Conf Interval]
polstability 4487853(0944765)
475 0 06365375 026103
_cons 4380415(089025)
492 0 02611231 061496
R-squared 01872
3 regress dfpa goveffect robustdfpa Coef (Std Err) t value P gt t [95 Conf Interval]
goveffect 434321(0900261)
482 0 06132289 025541
_cons 4780577(0950131)
503 0 02892392 0666876
R-squared 01512
4 regress dfpa regburden robustdfpa Coef(Std Err) t value P gt t [95 Conf Interval]
regburden 3061839(1576361)
194 0055 06194524 0007085
_cons 5091147(109868)
463 0 02907752 0727454
R-squared 00466
5 regress dfpa corrupgraft robustdfpa Coef (Std Err) t value P gt t [95 Conf Interval]
corrupgraft 4182503(0796322)
525 0 05765026 026
_cons 4590076(0922028)
498 0 02757739 0642241
R-squared 01608
6 regress dfpa rulelaw robustdfpa Coef (Std Err) t value P gt t [95 Conf Interval]
rulelaw 4403785(0792503)
556 0 05978719 028289
_cons 4562608(0905906)
504 0 02762311 0636291
R-squared 01859
Theoretical Approaches to Understanding Forest Governance 77
APPENDIX 3 Estimated Regression Equations
R-squared = 04760Root MSE = 76529
31
dfpa CoefRobustStd Err t Pgt|t| [95 Conf Interval]
pppcy95 0001192 0000691 172 0089 000257 0000187ppcy95sq 447e-09 234e-09 191 0060 199e-10 914e-09
popdenrur95 0000717 0001057 068 0500 0002825 0001392Rurpop 0034669 00706 049 0625 0106139 0175477Roads 270e-07 143e-07 189 0063 554e-07 147e-08Forprot 0041247 0084392 049 0627 0209562 0127068
Globalness 0009419 0049217 019 0849 010758 0088741Openess 0088526 1103738 008 0936 2289863 211281
voice 0095661 2970145 003 0974 5828106 6019429polstability 1300711 2806978 046 0645 6899051 429763
goveffect 1140439 3581059 032 0751 8282635 6001758regburden 4008919 3142829 128 0206 2259256 1027709
corrupgraft 1092471 309303 035 0725 5076382 7261324rulelaw 1136987 2987075 038 0705 7094521 4820546
dum1 279334 5497427 051 0613 8170932 1375761dum2 0020431 4917389 000 0997 9827853 9786992dum3 6086299 4543127 134 0185 1514728 2974681dum4 2056796 4971742 041 0680 7859031 1197262dum5 1123848 6016586 019 0852 1087585 1312355_cons 8505096 9084316 094 0352 9613002 2662319
R-squared = 02093Root MSE = 75325
32
dfpa CoefRobustStd Err t Pgt|t| [95 Conf Interval]
popdenrur95 0000118 0000933 013 0899 0001976 0001739Rurpop 0010213 0052154 020 0845 0114043 0093617Forprot 0009322 0070216 013 0895 0149111 0130468
Globalness 0022947 00633 036 0718 0148966 0103073Openess 0848079 1072875 079 0432 128785 2984009
voice 0922575 1438151 064 0523 1940564 3785714globaleca 0110322 0071316 155 0126 0031657 0252302
dum1 4594703 4679036 098 0329 4720542 1390995dum2 1481475 4446566 033 0740 7370958 1033391dum3 8379219 4543598 184 0069 1742483 0666389dum4 4211026 4297406 098 0330 4344452 127665_cons 246896 6044129 041 0684 145019 9563976
78 Cutting Crime Strategies for Addressing Illegal Logging in the Tropics
R-squared = 04338Root MSE = 74885
33
dfpa CoefRobustStd Err t Pgt|t| [95 Conf Interval]
popdenrur95 803e-06 0000828 010 0923 0001729 0001568Rurpop 0091163 0050173 182 0073 0008703 0191029Forprot 0011052 0075559 015 0884 0139343 0161448
Globalness 0018468 0035676 052 0606 0052544 008948Openess 0824247 097113 085 0399 1108739 2757232
voice 1053883 1426285 074 0462 3892832 1785066dum1 6128054 3934408 156 0123 1703188 139593dum2 0479116 3849347 012 0901 8141049 7182816dum3 6064678 3285722 185 0069 1260474 0475388dum4 4937404 3690511 134 0185 2408375 1228318_cons 3120502 465309 067 0504 1238225 6141243
Theoretical Approaches to Understanding Forest Governance 79

DevelopmentDividend
DevelopmentDividend
DevelopmentDividend
DevelopmentDividendRule of Law
Control of Curruption Regulatory Burden
Voice and Accountability
Weak
Weak Weak
WeakAverage
Average Average
AverageGood
Good Good
Good
Infant Mortality and Per Capita Income and
Literacy and Per Capita Income and
Per
Cap
ita
Inco
me
Per
Cap
ita
Inco
me
12000
10000
8000
6000
4000
2000
0
10000900080007000600050004000300020001000
0
Lit
erac
yIn
fan
tM
ort
alit
y
9876543210
100
75
50
25
0
FIGURE 3 The Development Dividend of Good Governance
Note The bars depict the simple correlation between good governance and development outcomes The line predicted value when taking into account thecausality effects (ldquoDevelopment Dividendrdquo) from improved governance to development outcomes (Drawn from Thomas et al 2000)
67
previous work by refining the model particularly through the use of morecomprehensive and objectively constructed measures of governance in orderto test our hypotheses rigorously
The Variables and Sample Size
The dependent variable used in the analysis is the annual average rate of de-forestation between 1990 and 2000 This variable is taken from the FAO esti-mates as reported in the World Development Indicators We examine 15 basicexplanatory variables The econometric estimates also test the significance ofquadratic terms (for income and rural population density) several interactionterms and dummy variables as explanatory variables In addition to the sixgovernance measures described in section III above we also include per capitaincome percentage rural population rural population density geographicalregion (1-6) forest type (tropicalothers) total roads globalization tradeopenness and a proxy for government commitment to forest protection Thelist of variables their definition and sources are given in the table in Annex 1
The total sample size of 90 countries breaks down as follows Africa (26)East Asia and the Pacific (12) Europe and Central Asia (30) Latin America(18) South Asia (2) North America (2) Only four countries in the sample(Togo Albania Macedonia and Fiji) have forested areas of less than 10000hectares 19 countries have a 1995 per capita income of more than US$10000per annum Table 1 below reports the descriptive statistics for the data
The rate of deforestation ranges from a maximum of 311 pa in the caseof Cote drsquoIvoire to a minimum of 17 in the case of Portugal In generalthe range of dispersion for most variables indicates that this is likely to be arepresentative sample of countries
A First Cut at the Role of Governance
A correlation matrix for the data shows that the simple correlation coeffi-cient between deforestation per annum and governance ranges from 022 inthe case of regulatory burden to-043 in the case of political stability (andrule of law) Thus at first blush it appears that an improvement in any of thesix dimensions of governance is likely to reduce deforestation
This finding is corroborated when we estimate a simple linear regressionfor each of the six variables on deforestation rates In each case the coefficientfor the independent variable is negative and significant at the 5 level (see ta-ble in Annex 2)
The Full Econometric Analysis
To recap we are interested in testing the hypothesis that our various mea-sures of overall governance impact the forestry sector Our a priori expecta-
68 Cutting Crime Strategies for Addressing Illegal Logging in the Tropics
tion is that an improvement in governance will have a positive impact inreducing deforestation The preliminary analysis suggests that indeed gover-nance does matter for forest management But this is clearly only a partial pic-ture Section II of the paper points out that deforestation is likely to be affectedby a large number of factors Moreover at a conceptual level these relation-ships are likely to be complex and two-way direct and indirect and strong anddiffuse (Kaimowitz and Angelsen 1999) Thus we need to incorporate sev-eral other explanatory variables in our regression estimates in order to test in arobust manner whether governance matters To the extent that reliable mea-sures are available these will be included in the econometric equations beingestimated
As a starting point deforestation is regressed on all the variables of interestin our sample-including the square of the per capita income-for the entire sam-ple of 90 countries The results are reported in panel 31 of Annex 3 The over-all explanatory power of the model is reasonable (R2 = 048) However noneof the 6 governance coefficients are statistically significant Only three coeffi-cients are significant at 10 or less per capital income the square of per ca-pita income and the total road network
Theoretical Approaches to Understanding Forest Governance 69
TABLE 1 Descriptive Statistics for Model Variables
Variable AbbreviatedName
Mean StandardDeviation
MinimumValue
MaximumValue
Percentage rate of deforestationper annum
Dfpa 045 094 -170 311
Area deforested per annum Dfarpa 84682 364283 1806300 2226400
Per Capita Income in 1995 Pppcy95 740462 763815 47400 2827400
Rural Population Density Popdenrur95 3247345 65323 574 60214
Government Commitment forForest Protection
Forprot 944 815 000 4309
Total Roads Network Roads 25666290 74180410 337000 629610700
Rural Populationa as a oftotal population
Rurpop 4601 2112 300 8750
Globalization Globalness 3101 2490 201 13712
Trade Openness Openess 284 115 100 500
Voice and Accountability Voice 027 087 162 169
Political Stability and Lack ofViolence
Polstability 002 090 259 169
Government Effectiveness Goveffect 007 084 177 199
Lack of Regulatory Burden Regburden 021 066 234 121
Control of Corruption and Graft Corrupgraft 003 090 156 209
Rule of Law Rulelaw 002 092 215 200
In a regression using the area deforested as the dependent variable the co-efficient of per capita income (PPPCY95) is negative and that for the square ofper capita income (PPCY95SQ) is positive This casts doubt on the ldquoKuznetscurverdquo hypothesis for this sector and turns out to be an important (and robust)finding of the present analysis (results available upon request) The Kuznetshypothesis states that as incomes rise deforestation will fall after an initial in-crease at a certain threshold level of income For this to happen the coeffi-cient of the income variable should be positive and the coefficient of thesquare of the income term should be negative-just the reverse of our estimates
The coefficient for the road network is significant but unexpectedly has anegative sign A priori one would expect that more roads would lead togreater clearing of forestlands One explanation for the unexpected sign on theroad variable is that because of data unavailability we measure the total roadnetwork in a country rather than the road network in forest areas The lattervariable may still be relevant to deforestation rates
The apparent contradiction between a reasonable overall R2 and individualcoefficients that are mostly insignificant suggests multicollinearity among theexplanatory variables Multicollinearity occurs when explanatory variablespredict each other and do not have individual explanatory power The simplecorrelation matrix for this data indicates a very high degree of collinearityamong our 6 governance variables with the simple correlation coefficientranging from 071 to 094 This suggests that multicollinearity is a likely prob-lem dropping some of these variables may correct the problem Changing thesample size is yet another option this has been explored by regressing on asubset of the sample but the results were not favorable Because of this prob-lem of multicollinearity subsequent regressions use only one out of the sixgovernance measures Various combinations of the governance variables weretried but none were statistically significant when income and the square of in-come were included as explanatory variables (results available upon requestfrom authors) With the qualification that the results come out much the sameno matter which governance measure is tried the rest of the analysis in this pa-per will focus on exploring the function of voice and accountability (VOICE)on the rate of deforestation
The simple correlation coefficients between per capita income (PPPCY95)and the governance measures are also high ranging from 062 to 085 Theyare also almost as highly correlated with the square of the per capita incomeThis was to be expected and it is consistent with the finding that improvementin governance leads to large increases in incomes the so-called ldquodevelopmentdividendrdquo story discussed in section III above In this data sample regressingper capita income on the governance measures individually yields high R2
(these range from 039 to 073) and coefficients that are significant at 1
70 Cutting Crime Strategies for Addressing Illegal Logging in the Tropics
level thus corroborating the Kaufman et al (1999b) results (results availableupon request from authors)
These findings suggest that governance variables are likely to have an indi-rect impact on deforestation through the per capita income variable But doesgovernance have a direct impact on deforestation In order to test this hypoth-esis we first ldquopurgedrdquo the influence of income by regressing deforestation onincome and the square of income and calculating the residuals In the secondstep these estimated residuals (DFPARES) from the first regression equationwere regressed on the other explanatory variables plus one governance mea-sure in turn
The regression equation for VOICE is reported in Annex 32 The coeffi-cient for VOICE is not statistically significant The only significant variable isDUM3 (which takes the value 1 if a country is in the Europe or Central Asia re-gion and 0 otherwise) with a negative sign indicating that all else equal if acountry belongs to the ECA region it is likely to experience less deforestationQualitatively similar results are obtained when VOICE is replaced by othermeasures of governance Thus in overall terms the message emerging fromthis data analysis is that governance measures do not have a direct impact ondeforestation but a favorable indirect impact cannot be ruled out
An additional test of whether governance has a direct impact on deforesta-tion was conducted as follows the most favorable conditions under which thiscould happen are provided by (i) not purging the influence of per capita in-come from DFPA (the dependent variable) and (ii) not including per capita in-come as an explanatory variable Annex 33 reports the regression equationusing VOICE as one of the explanatory variables The coefficient of VOICEhas a negative sign but is not statistically significant Only two variables arestatistically significant First RURPOP (which is the proportion of total popu-lation residing in rural areas) has a positive sign-indicating that a higher pro-portion of population living in the rural areas other things being equal islikely to lead to greater deforestation And second DUM3 has a negativesign-indicating that if a country belongs to the ECA region all else equal it islikely to experience less deforestation
CONCLUDING REMARKS
To test the basic hypothesis that improving governance has a favorable im-pact in reducing deforestation we have performed a variety of statistical anal-yses on a cross-country dataset for 90 countries This dataset is unique fromothers in the literature in that it includes six objectively constructed variableswhich measure various aspects of governance such as the strength of the ruleof law and the extent of civil liberties including the freedom of the press-as-
Theoretical Approaches to Understanding Forest Governance 71
pects which are expected to impact deforestation Our main conclusion is thatwith these measures of governance and with the econometric approach adoptedwe find little evidence of a direct impact of governance on deforestation
However two findings from our data analysis are significant First incomehas a statistically significant and negative impact on deforestation ie risingincomes are likely to reduce the rate of deforestation Second the governancemeasures used in this study have a statistically significant and quantitativelylarge impact in increasing incomes-ie improving governance may act as acatalyst to increasing incomes These two findings taken together imply thatimproving governance may have an indirect but strong impact on curbing de-forestation
The lack of support for a direct impact of governance variables on defores-tation is consistent with the notion that governance is a macro-level vari-able-or an ldquounderlying variablerdquo (Kaimowitz and Angelsen 1999)-and assuch its impact on the forestry sector a priori is expected to be diffuse and un-certain Our findings are also consistent with a ldquotargets and instrumentsrdquo ap-proach which states that the best policy levers are those that have (or arethought to have) the most direct impacts on the chosen targets In our case thisapproach would suggest that if the main objective is to reduce deforestation inthe short run then undertaking steps most specific to the forestry sector arelikely to be the most effective both in terms of cost and outcomes Our reviewof the literature suggests that specific strategies include reforms in forest pol-icy scientific forest management and forest law enforcement and compli-ance In the present analysis variables such as government commitment toforest protection extent of globalization trade openness rural population as apercentage of total population rural population density were included as prox-ies for these direct policy options Only the rural population density variableproved to be statistically significant (equation 33 in Annex 3) and with the ex-pected sign thus providing support for the targets and instruments approach
The measures used here are indeed incomplete and imprecise and muchmore analytical rigor is required As such the results in this paper should betreated as preliminary A key research effort in the future is to collect more andbetter data on variables measuring sector-specific actions of the type men-tioned in section II of the paper (indicators of forest policy scientific forestmanagement and forest law enforcement) Such data would enable more rigor-ous testing of the hypotheses proposed in this paper It is also important to notethat in addition to refining the formal econometric model it is crucial tocross-check our findings against site specific surveys and country case-studies(Kaimowitz and Angelsen 1999) This also includes an analysis of ldquooutliersrdquoreferred to but not pursued in this paper
Despite the lack of evidence of direct impacts of governance on deforesta-tion efforts must be made to continually improve the quality of overall gover-
72 Cutting Crime Strategies for Addressing Illegal Logging in the Tropics
nance in any economy for at least two reasons First good governance acts asa catalyst for many desirable social and economic outcomes such as improve-ments in literacy and child mortality rates and a sharper rise in growth and in-comes In turn at least some of these particularly growth in incomes havebeen shown as having beneficial impacts in controlling deforestation Andsecond we should not forget Greshamrsquos law which in the context of gover-nance is to be interpreted as stating that an overall environment of poor gover-nance will likely drive out good policies Thus in the long run policy reformsin the forestry sector will likely have a better chance of being implemented andhave lasting impacts in a situation of better overall governance in the econ-omy
REFERENCES
Baird M 2001 Forest Crimes as a Constraint to Development in East Asia Speechdelivered at the Forest Law Enforcement and Governance East Asia MinisterialConference Bali Indonesia September 11-13 2001 Available at httplnweb18worldbank orgeapeapnsf2500ec5f1a2d9bad852568a3006f557dc19065b26241f0b247256ac30010e5ffOpenDocument
Bardhan P 1997 Corruption and Development A Review of Issues Journal of Eco-nomic Literature Vol XXXV (Sept 1997) pp 1320-1346
Bekhechi M 2001 Governance and the Design and Implementation of Forest Legisla-tion Presentation at the Forest Law Enforcement and Governance East Asia Minis-terial Conference Bali Indonesia September 11-13 2001 Available at httplnweb18worldbankorgeapeapnsf2500ec5f1a2d9bad852568a3006f557dc19065b26241f0b247256ac30010e5ffOpenDocument
bin Buang A 2001 Forest Management Experiences from East Asia Paper deliv-ered at the Forest Law Enforcement and Governance East Asia Ministerial Con-ference Bali Indonesia September 11-13 2001 Available at httplnweb18worldbankorgeapeapnsf2500ec5f1a2d9bad852568a3006f557dc19065b26241f0b247256ac30010e5ffOpenDocument
Callister D J 1999 Corrupt and Illegal Activities in the Forestry Sector Current un-derstandings and implications for World Bank Forest Policy Discussion DraftMay 1999 Available at httpwbln0018worldbankorgessdforestpol-ensfHiddenDocViewBCE9D2A90FADBA73852568A3006493E0OpenDocument
Contreras-Hermosilla A 2002 Law Compliance in the Forestry Sector An OverviewWBI Working Papers World Bank Institute The World Bank 2002 Also availableat httplnweb18worldbankorgeapeapnsf2500ec5f1a2d9bad852568a3006f557dc19065b26241f0b247256ac30010e5ffOpenDocument
Deacon R 1994 Deforestation and the Rule of Law in a Cross Section of CountriesLand Economics 70(4) 1994 pp414-430
Didia D O 1997 Democracy Political Instability and Tropical DeforestationGlobal Environmental Change vol71 pp 63-76
EIA (Environmental Investigation Agency and Telepak Indonesia) 2001 TimberTrafficking September 2001 Available at httpwwweia-internationalorg
Theoretical Approaches to Understanding Forest Governance 73
Glastra R (editor) 1999 Cut and Run Illegal Logging and Timber Trade in the Trop-ics International Development Research Center IDRC Ottawa Canada
ITTO 2000 Review of Progress towards Year 2000 Objective ITTO YokohamaJapan
Johnston M and A Doig 1999 Different Views on Good Government and Sustain-able Anticorruption Strategies In Curbing Corruption Towards a Model forBuilding National Integrity by R Stapenhurst and SJ Kpundeh (editors) EDI De-velopment Studies World Bank Washington DC USA
Kaimowitz David and Arild Angelsen 1999 Rethinking the Causes of DeforestationLessons from Economic Models The World Bank Research Observer Vol 141pp 73-98 The World Bank Washington DC
Kaimowitz David 2001 Forest Crimes and Forest Law Enforcement Issues andChallenges for East Asia Keynote presentation at the Forest Law Enforcementand Governance East Asia Ministerial Conference Bali Indonesia Septem-ber 11-13 2001 Available at httplnweb18worldbankorgeapeapnsf2500ec5f1a2d9bad852568a3006f557dc19065b26241f0b247256ac30010e5ffOpenDocument
Kaufmann D A Kraay and P Zoido-Lobatoacuten1999a Aggregating Governance Indi-cators Policy Research Working Paper 2195 The World Bank Washington DCUSA
Kaufmann D A Kraay and P Zoido-Lobatoacuten 1999b Governance Matters PolicyResearch Working Paper 2196 The World Bank Washington DC USA
Kishor N 2002 Sustaining Forest by Improving Governance An Overview and Ele-ments of a Strategy Paper prepared for the PREM Anticorruption Thematic Knowl-edge Management Group of the World Bank Processed
Magrath W and R Grandalski 2001 Forest Law Enforcement Policies Strategiesand Technologies
Mainardi S 1996 An Econometric Analysis of Factors Affecting Tropical and Sub-tropical Deforestation mimeo Department of Economics University of NatalSouth Africa (Main findings summarized in Kaimowitz and Angelsen 1999)
Melle A and DeAndra Beck 2001 The US Forest Service Approach to Forest LawEnforcement Presentation at the Forest Law Enforcement and Governance EastAsia Ministerial Conference Bali Indonesia September 11-13 2001 Available athttplnweb18worldbankorgeapeapnsf2500ec5f1a2d9bad852568a3006f557dc19065b26241f0b247256ac30010e5ffOpenDocument
Palo Matti 2001 How Does Corruption Drive Deforestation in the Tropics Unpub-lished paper presented at ldquoCorruption in Forestry Roundtable Discussion on IllegalLogging and FINrdquo 10th International Anti Corruption Conference Prague October2001 Available at www10iaccorg
Poore D 1989 No Timber Without Trees Sustainability in the Tropical ForestEarthscan
Rosenbaum K L 2002 Illegal Actions and the Forest Sector A Legal PerspectivePaper presented at the ISTF conference on illegal logging at Yale University March29-30 2002
Shafik N 1997 Macroeconomic Causes of Deforestation Barking up the WrongTree In Katarina Brown and David Pearce (eds) The Causes of Tropical Defores-
74 Cutting Crime Strategies for Addressing Illegal Logging in the Tropics
tation The Economic and Statistical Analysis of Factors Giving Rise to the Loss ofTropical Forests University College London Press London
Stapenhurst R and SJ Kpundeh (editors)1999 Curbing Corruption Towards aModel for Building National Integrity EDI Development Studies World BankWashington DC USA
Thomas V M Dailami A Dhareshwar D Kaufmann N Kishor R Lopez and YWang 2000 The Quality of Growth Oxford University Press New York USASeptember 2000
World Bank 1997 Helping Countries to Combat Corruption The Role of the WorldBank Washington DC USA
World Bank 2000 Reforming Public Institutions and Strengthening Governance AWorld Bank Strategy Public Sector Group PREM Network The World Bank No-vember 2000
APPENDIX 1 Variable Definition and Data Sources
Variable amp Acronym Description and Source
Annual rate ofDeforestation(DFPA)
Average annual deforestation refers to the permanent conversion ofnatural forest area to other uses including shifting cultivation permanentagriculture ranching settlements and infrastructure developmentDeforested areas do not include areas logged but intended forregeneration or areas degraded by fuelwood gathering acid precipitationor forest fires This covers the period 1990 to 2000 Negative numbersindicate an increase in forest area Drawn from the World DevelopmentIndicators (WDI)
Per Capita Income(PPPCY95)
GDP per capita based on purchasing power parity (PPP) PPP GDP isgross domestic product converted to international dollars usingpurchasing power parity rates An international dollar has the samepurchasing power over GDP as the US dollar has in the United StatesGDP is the sum of gross value added by all resident producers in theeconomy plus any product taxes and minus any subsidies not included inthe value of the products It is calculated without making deductions fordepreciation of fabricated assets or for depletion and degradation ofnatural resources Data are in current international dollars for 1995
Rural PopulationDensity(POPDENRUR95)
Rural population density is the rural population divided by the arable landarea Rural population is calculated as the difference between the totalpopulation and the urban population Arable land includes land defined bythe FAO as land under temporary crops (double-cropped areas arecounted once) temporary meadows for mowing or for pasture land undermarket or kitchen gardens and land temporarily fallow Land abandonedas a result of shifting cultivation is excluded The information is takenfrom the WDI for 1995
Total roads network(ROADS)
Total road network includes motorways highways and main or nationalroads secondary or regional roads and all other roads in a country for1995 For more information see WDI
Theoretical Approaches to Understanding Forest Governance 75
Variable amp Acronym Description and Source
Rural Population asa of total(RURPOP)
Rural population is calculated as the difference between the totalpopulation and the urban population for 1995 For more information seeWDI
Globalization(GLOBALNESS)
Trade in goods as a share of PPP GDP is the sum of merchandiseexports and imports measured in current US dollars divided by the valueof GDP converted to international dollars using purchasing power parityrates (see WDI table 11 for a discussion of PPP) For more informationsee WDI
Governmentcommitment toprotect forests(FORPROT)
Nationally protected areas are totally or partially protected areas of atleast 1000 hectares that are designated as national parks naturalmonuments nature reserves or wildlife sanctuaries protected landscapesand seascapes or scientific reserves with limited public access The datado not include sites protected under local or provincial law Total landarea is used to calculate the percentage of total area protected For moreinformation see WDI
Trade Openness(OPENESS)
Index of trade openness developed by the Heritage Foundation and theWall Street Journal It takes a value between 1 and 5 with higher valuesrepresenting greater openness An economy earns ldquo5rdquo if it has anaverage tariff rate of less than or equal to four percentage points andorhas very few non-tariff barriers and ldquo1rdquo if the average tariff rate is greaterthan 19 and there are very high non-tariff barriers that virtually prohibitexports
Regional DummyVariables(DUM1 DUM2DUM3 DUM4DUM5)
Dum1=1 if country is from the Africa region 0 otherwise Dum2=1 ifcountry is from the East Asia and Pacific region 0 otherwise Dum3=1 ifcountry is from the Europe and Central Asia region 0 otherwise Dum4=1if country is from the Latin America and the Caribbean region 0otherwise Dum5=1 if country is from the South Asia region 0 otherwise
Voice andAccountability(VOICE)
Definition given in main text Scaled to lie between -25 and +25 withhigher values corresponding to better outcomes (Kaufmann et al 1999a)
Political Stabilityand Lack of Violence(POLSTABILITY)
Definition given in main text Scaled to lie between -25 and +25 withhigher values corresponding to better outcomes (Kaufmann et al 1999a)
GovernmentEffectiveness(GOVEFFECT)
Definition given in main text Scaled to lie between -25 and +25 withhigher values corresponding to better outcomes (Kaufmann et al 1999a)
Lack of RegulatoryBurden(REGBURDEN)
Definition given in main text Scaled to lie between -25 and +25 withhigher values corresponding to better outcomes (Kaufmann et al 1999a)
Control of Corruptionand Graft(CORRUPGRAFT)
Definition given in main text Scaled to lie between -25 and +25 withhigher values corresponding to better outcomes (Kaufmann et al 1999a)
Rule of Law(RULELAW)
Definition given in main text Scaled to lie between -25 and +25 withhigher values corresponding to better outcomes (Kaufmann et al 1999a)
76 Cutting Crime Strategies for Addressing Illegal Logging in the Tropics
APPENDIX 1 (continued)
APPENDIX 2 Deforestation and Governance Preliminary Regressions
1 regress dfpa voice robustdfpa Coef (Std Err) t value P gt t [95 Conf Interval]
voice 4289583(1164568)
368 0 06603917 019752
_cons 5605176(1095465)
512 0 03428169 0778218
R-squared 01581
2 regress dfpa Polstability robustdfpa Coef (Std Err) t value P gt t [95 Conf Interval]
polstability 4487853(0944765)
475 0 06365375 026103
_cons 4380415(089025)
492 0 02611231 061496
R-squared 01872
3 regress dfpa goveffect robustdfpa Coef (Std Err) t value P gt t [95 Conf Interval]
goveffect 434321(0900261)
482 0 06132289 025541
_cons 4780577(0950131)
503 0 02892392 0666876
R-squared 01512
4 regress dfpa regburden robustdfpa Coef(Std Err) t value P gt t [95 Conf Interval]
regburden 3061839(1576361)
194 0055 06194524 0007085
_cons 5091147(109868)
463 0 02907752 0727454
R-squared 00466
5 regress dfpa corrupgraft robustdfpa Coef (Std Err) t value P gt t [95 Conf Interval]
corrupgraft 4182503(0796322)
525 0 05765026 026
_cons 4590076(0922028)
498 0 02757739 0642241
R-squared 01608
6 regress dfpa rulelaw robustdfpa Coef (Std Err) t value P gt t [95 Conf Interval]
rulelaw 4403785(0792503)
556 0 05978719 028289
_cons 4562608(0905906)
504 0 02762311 0636291
R-squared 01859
Theoretical Approaches to Understanding Forest Governance 77
APPENDIX 3 Estimated Regression Equations
R-squared = 04760Root MSE = 76529
31
dfpa CoefRobustStd Err t Pgt|t| [95 Conf Interval]
pppcy95 0001192 0000691 172 0089 000257 0000187ppcy95sq 447e-09 234e-09 191 0060 199e-10 914e-09
popdenrur95 0000717 0001057 068 0500 0002825 0001392Rurpop 0034669 00706 049 0625 0106139 0175477Roads 270e-07 143e-07 189 0063 554e-07 147e-08Forprot 0041247 0084392 049 0627 0209562 0127068
Globalness 0009419 0049217 019 0849 010758 0088741Openess 0088526 1103738 008 0936 2289863 211281
voice 0095661 2970145 003 0974 5828106 6019429polstability 1300711 2806978 046 0645 6899051 429763
goveffect 1140439 3581059 032 0751 8282635 6001758regburden 4008919 3142829 128 0206 2259256 1027709
corrupgraft 1092471 309303 035 0725 5076382 7261324rulelaw 1136987 2987075 038 0705 7094521 4820546
dum1 279334 5497427 051 0613 8170932 1375761dum2 0020431 4917389 000 0997 9827853 9786992dum3 6086299 4543127 134 0185 1514728 2974681dum4 2056796 4971742 041 0680 7859031 1197262dum5 1123848 6016586 019 0852 1087585 1312355_cons 8505096 9084316 094 0352 9613002 2662319
R-squared = 02093Root MSE = 75325
32
dfpa CoefRobustStd Err t Pgt|t| [95 Conf Interval]
popdenrur95 0000118 0000933 013 0899 0001976 0001739Rurpop 0010213 0052154 020 0845 0114043 0093617Forprot 0009322 0070216 013 0895 0149111 0130468
Globalness 0022947 00633 036 0718 0148966 0103073Openess 0848079 1072875 079 0432 128785 2984009
voice 0922575 1438151 064 0523 1940564 3785714globaleca 0110322 0071316 155 0126 0031657 0252302
dum1 4594703 4679036 098 0329 4720542 1390995dum2 1481475 4446566 033 0740 7370958 1033391dum3 8379219 4543598 184 0069 1742483 0666389dum4 4211026 4297406 098 0330 4344452 127665_cons 246896 6044129 041 0684 145019 9563976
78 Cutting Crime Strategies for Addressing Illegal Logging in the Tropics
R-squared = 04338Root MSE = 74885
33
dfpa CoefRobustStd Err t Pgt|t| [95 Conf Interval]
popdenrur95 803e-06 0000828 010 0923 0001729 0001568Rurpop 0091163 0050173 182 0073 0008703 0191029Forprot 0011052 0075559 015 0884 0139343 0161448
Globalness 0018468 0035676 052 0606 0052544 008948Openess 0824247 097113 085 0399 1108739 2757232
voice 1053883 1426285 074 0462 3892832 1785066dum1 6128054 3934408 156 0123 1703188 139593dum2 0479116 3849347 012 0901 8141049 7182816dum3 6064678 3285722 185 0069 1260474 0475388dum4 4937404 3690511 134 0185 2408375 1228318_cons 3120502 465309 067 0504 1238225 6141243
Theoretical Approaches to Understanding Forest Governance 79
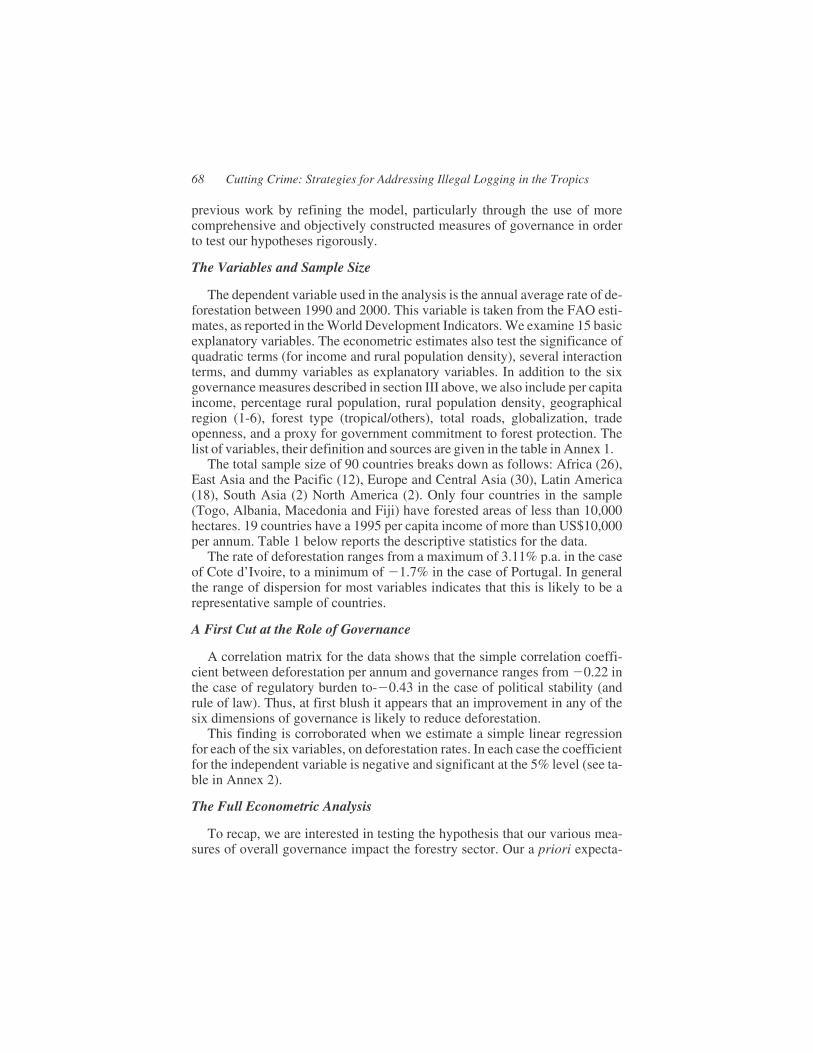
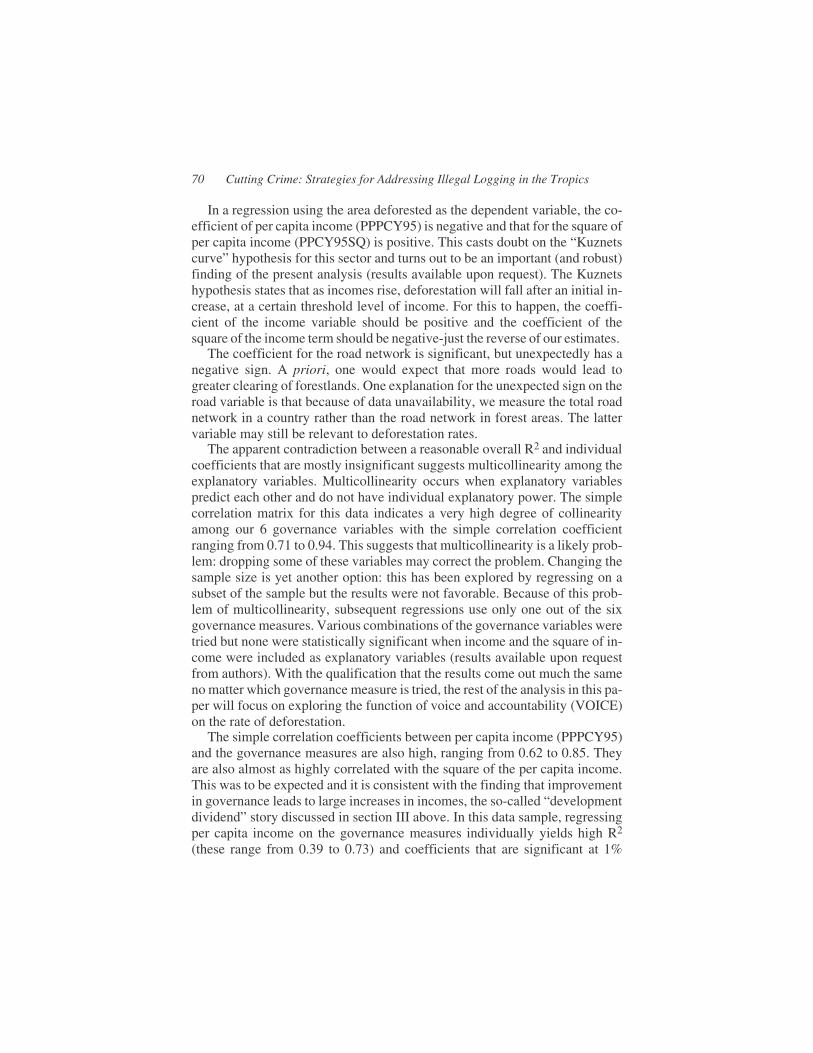
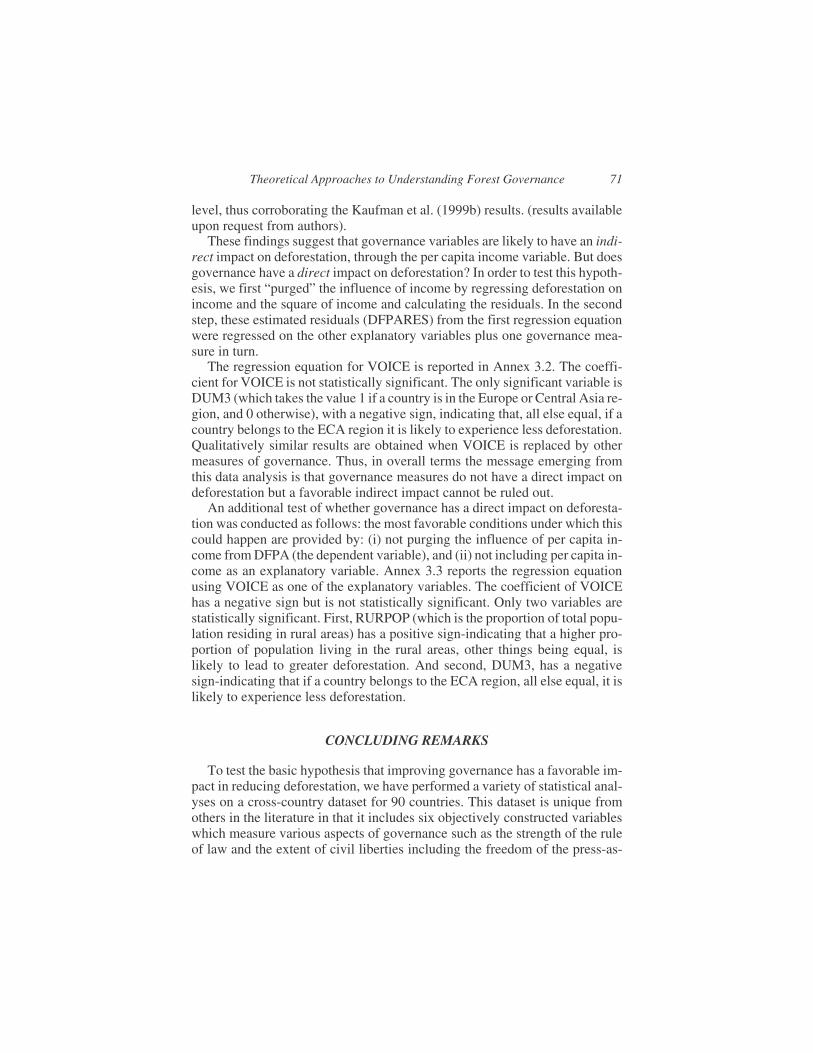