Does Foreign Aid Promote Growth? Evidence from Africa
72
Eastern Illinois University e Keep Masters eses Student eses & Publications 2016 Does Foreign Aid Promote Growth? Evidence from Africa Mai Abdulaziz Alghamdi Eastern Illinois University is research is a product of the graduate program in Economics at Eastern Illinois University. Find out more about the program. is is brought to you for free and open access by the Student eses & Publications at e Keep. It has been accepted for inclusion in Masters eses by an authorized administrator of e Keep. For more information, please contact [email protected]. Recommended Citation Alghamdi, Mai Abdulaziz, "Does Foreign Aid Promote Growth? Evidence from Africa" (2016). Masters eses. 2513. hps://thekeep.eiu.edu/theses/2513
Transcript of Does Foreign Aid Promote Growth? Evidence from Africa
Eastern Illinois UniversityThe Keep
Masters Theses Student Theses & Publications
2016
Does Foreign Aid Promote Growth? Evidencefrom AfricaMai Abdulaziz AlghamdiEastern Illinois UniversityThis research is a product of the graduate program in Economics at Eastern Illinois University. Find out moreabout the program.
This is brought to you for free and open access by the Student Theses & Publications at The Keep. It has been accepted for inclusion in Masters Thesesby an authorized administrator of The Keep. For more information, please contact [email protected].
Recommended CitationAlghamdi, Mai Abdulaziz, "Does Foreign Aid Promote Growth? Evidence from Africa" (2016). Masters Theses. 2513.https://thekeep.eiu.edu/theses/2513

The Graduate School� EAsrnRN ILLINOIS UNIVERSITY"
Thesis Maintenance and Reproduction Certificate
FOR: Graduate Candidates Completing Theses in Partial Fulfillment of the Degree Graduate Faculty Advisors Directing the Theses
RE: Preservation, Reproduction, and Distribution of Thesis Research
Preserving, reproducing, and distributing thesis research is an important part of Booth Library's responsibility to provide access to scholarship. In order to further this goal, Booth Library makes all graduate theses completed as part of a degree program at Eastern Illinois University available for personal study, research, and other not-for-profit educational purposes. Under 17 U.S.C. § 108, the library may reproduce and distribute a copy without infringing on copyright; however, professional courtesy dictates that permission be requested from the author before doing so.
Your signatures affirm the following: • The graduate candidate is the author of this thesis. • The graduate candidate retains the copyright and intellectual property rights associated with the
original research, creative activity, and intellectual or artistic content of the thesis. • The graduate candidate certifies her/his compliance with federal copyright law (Title 17 of the U.
S. Code) and her/his right to authorize reproduction and distribution of all copyrighted materials included in this thesis.
• The graduate candidate in consultation with the faculty advisor grants Booth Library the nonexclusive, perpetual right to make copies of the thesis freely and publicly available without restriction, by means of any current or successive technology, including by not limited to photocopying, microfilm, digitization, or internet.
• The graduate candidate acknowledges that by depositing her/his thesis with Booth Library, her/his work is available for viewing by the public and may be borrowed through the library's circulation and interlibrary Joan departments, or accessed electronically.
• The graduate candidate waives the confidentiality provisions of the Family Educational Rights and Privacy Act (FERPA) (20 U. S. C. § 1232g; 34 CFR Part 99) with respect to the contents of the thesis and with respect to information concerning authorship of the thesis, including name and status as a student at Eastern Illinois University.
I have conferred with my graduate faculty advisor. My signature below indicates that I have read and agree with the above statements, and hereby give my permission to allow Booth Library to reproduce and distribute my thesis. My adviser's signature indicates concurrence to reproduce and distribute the thesis.
Graduate Candidate Signature
Printed Name -
(vlt1��&- 6 f Ark \.-) G<e'1DV1Jk.f> Graduate Degree Program
Please submit in duplicate.
Faculty Adviser Signature
Printed Name
/& / Date 7 � I

Does Foreign Aid Promote Growth? Evidence From Africa
(TITLE)
BY
Mai Abdulaziz Alghamdi
THESIS
SUBMITTED IN PARTIAL FULFILLMENT OF THE REQUIREMENTS FOR THE DEGREE OF
Master of Arts in Economics
IN THE GRADUATE SCHOOL, EASTERN ILLINOIS UNIVERSITY CHARLESTON, ILLINOIS
2016 YEAR
I HEREBY RECOMMEND THAT THIS THESIS BE ACCEPTED AS FULFILLING THIS PART OF THE GRADUATE DEGREE CITED ABOVE
IJ./1/1� THESIS COMMITTEE CHAIR DATE DEPARTMENT/SCHOOL CHA¥
OR r.HAIR'C::: ni::c:::1�1\11:i=
I '-l'1 L Jct; THESIS COMMITTEE MEMBER DATE �MITTEE MEMBER
THESIS COMMITTEE MEMBER DATE THESIS COMMITTEE MEMBER
�M� DATE
tO<..�tt DATE
DATE

Does Foreign Aid Promote Growth? Evidence from Africa
Mai Alghamdi
Graduate Thesis
Department of Economics
Eastern Illinois University, Charleston, IL 61920
December 2016
Thesis Committee:
Dr. Ahmed S. Abou-Zaid (Chair)
Dr. Mukti P. Upadhyay
Dr. Tim Mason

Copyright© 20 1 6 by Mai Alghamdi All rights reserved
ii

Abstract
Taking a panel of 54 African countries and employing pooled, GLS, and panel regression,
this study investigates the impact of foreign aid, policies, and their interaction on economic
growth. This study covers a period of 35 years from 1 980 to 20 1 5 . The key variables of
this study are aid, measured by the official amount of foreign aid as a percentage of GDP
by the recipient countries and policy, measured by an index created using linear estimation
of various policy variables associated with political, economic and fiscal freedom; the
Sachs-Warner measure of openness and World bank' s Country Policy and Institution
Assessment ratings. Several potential variables that can impact economic growth is
controlled for to assess the aid-growth relationship. The :findings of this study show that
for African countries, foreign aid has positive, statistically significant but minimal effect
on economic growth. The results also suggest that the aid-growth relationship is non-linear
and foreign aid has diminishing returns as the volume of aid increases; African countries
who have been aid-recipients for a long-time were hurt by the huge influx of aid. Also, the
results confirm that better policies do not always result in aid effectiveness. Too much
reliance on foreign aid creates moral hazards and the recipient countries suffer more when
the governments and corrupted leaders used aid to satisfy their own best means. The reason
behind the aid ineffectiveness is that most of the sampled African countries used foreign
aid to service their debts so the aid never got into the proper channels so it failed to facilitate
economic development. However, the :findings of this study are not implying that aid can
never be beneficial for the sampled countries. But it certainly proposes that for aid to be
effective in driving economic development, the aid recipients need to rethink about how
the aid apparatus can properly be employed to deter abuse of foreign aid.
iii
Acknowledgement
I would like to take this opportunity to thank all the people who supported me during this
thesis and my graduate study. I am indebted to Dr. Ahmed S. Abou-Zaid for his continuous
help, support, and guidance in bringing the thesis to its present form. I am privilege to be
under his tutelage throughout this journey.
I would also like to express my heartfelt gratitude to Dr. Mukti P. Upadhyay and Dr. Tim
Mason for their contribution in this thesis. Their suggestions and guidance in improving
this thesis deserve my earnest appreciation. I would also like to thank all the professors of
the Department of Economic at Eastern Illinois University for making my graduate journey
an enjoyable one.
iv
Table of Contents
1 . Introduction . . . . . . . . . . . . . . . . . . . . . . . . . . . . . . . . . . . . . . . . . . . . . . . . . . . . . . . . . . . . . . . . . . 1
2 . Literature Review . . . . . . . . . . . . . . . . . . . . . . . . . . . . . . . . . . . . . . . . . . . . . . . . . . . . . . . . . . . . 6
3 . Methodology
3 . 1 Model Specification . . . . . . . . . . . . . . . . . . . . . . . . . . . . . . . . . . . . . . . . . . . . . . . . . . . . . 1 4
3 . 1 . 1 Model I . . . . . . . . . . . . . . . . . . . . . . . . . . . . . . . . . . . . . . . . . . . . . . . . . . . . . . . . . . . . . . . . 1 4
3 . 1 .2 Model II . . . . . . . . . . . . . . . . . . . . . . . . . . . . . . . . . . . . . . . . . . . . . . . . . . . . . . . . . . . . . . . 1 6
3 . 1 .3 Model III . . . . . . . . . . . . . . . . . . . . . . . . . . . . . . . . . . . . . . . . . . . . . . . . . . . . . . . . . . . . .. 1 7
3 .2 Description of Variables
3 .2 . 1 Model!. . . . . . . . . . . . . . . . . . . . . . . . . . . . . . . . . . . . . . . . . . . . . . . . . . . . . . . . . . . . . . . . 1 7
3 .2 .2 Model II. . . . . . . . . . . . . . . . . . . . . . . . . . . . . . . . . . . . . . . . . . . . . . . . . . . . . . . . . . . . . . . 1 9
3 .2 .3 Model III . . . . . . . . . . . . . . . . . . . . . . . . . . . . . . . . . . . . . . . . . . . . . . . . . . . . . . . . . . . . ... 22
3 .3 Selection of Countries . . . . . . . . . . . . . . . . . . . . . . . . . . . . · . . . . . . . . . . . . . . . . . . . . . . . . 23
3 .4 Data Sources and Descriptive Statistics . . . . . . . . . . . . . . . . . . . . . . . . . . . . . . .. 25
4. Results and Discussion
4. 1 . 1 Model I . . . . . . . . . . . . . . . . . . . . . . . . . . . . . . . . . . . . . . . . . . . . . . . . . . . . . . . . . . . . . . . . . 27
4. 1 .2 Model II . . . . . . . . . . . . . . . . . . . . . . . . . . . . . . . . . . . . . . . . . . . . . . . . . . . . . . . . . . . . . . . . 34
4. 1 .3 Model III . . . . . . . . . . . . . . . . . . . . . . . . . . . . . . . . . . . . . . . . . . . . . . . . . . . . . . . . . . . . . . . 4 1
5 . Conclusion . . . . . . . . . . . . . . . . . . . . . . . . . . . . . . . . . . . . . . . . . . . . . . . . . . . . . . . . . . . . . . . . . . . . . . . 49
Reference . . . . . . . . . . . . . . . . . . . . . . . . . . . . . . . . . . . . . . . . . . . . . . . . . . . . . . . . . . . . . . . . . . . . . . . . 53
Appendix . . . . . . . . . . . . . . . . . . . . . . . . . . . . . . . . . . . . . . . . . . . . . . . . . . . . . . . . . . . . . . . . . . . . . . . . . 58
v
List of Tables
Table 1 : Descriptive Statistics . . . . . . . . . . . . . . . . . . . . . . . . . . . . . . . . . . . . . . . . . . . . . . . . . . . . . . . . . . . . . . . . . 26
Table 2: Pooled, GLS and Random Effects Panel Results of Model I . . . . . . . . . . . . . . . . . . . 27
Table 3 : Pooled Regression Results of Model I by Income Status . . . . . . . . . . . . . . . . . . . . . . . .3 1
Table 4 : GLS Regression Results of Model I by Income Status . . . . . . . . . . . . . . . . . . . . . . . . . .32
Table 5 : Random Effects Panel Regression Results of Model I by Income Status . . . . . 33
Table 6 : Pooled, GLS and Random Effects Panel Results of Model II . . . . . . . . . . . . . . . . . . 34
Table 7 : Pooled Regression Results of Model I I by Income Status . . . . . . . . . . . . . . . . . . . . . . . 37
Table 8 : GLS Regression Results of Model I I by Income Status . . . . . . . . . . . . . . . . . . . . . . . . . . 39
Table 9 : Random Effects Panel Regression Results of Model I I by Income Status . . . . .40
Table 1 0 : Pooled, GLS and Random Effects Panel Results of Model III . . . . . . . . . . . . . . . . .42
Table 1 1 : Pooled, GLS and Random Effects Panel Results of Model III with Interactions
between Policy and Squared term of Aid . . . . . . . . . . . . . . . . . . . . . . . . . . . . . . . . . . . . . . . . . . . . . . . . . . . . . . 44
Table 1 2 : Pooled, GLS and Random Effects Panel estimations of the impact of Policy
Index on Aid-Growth Relationship . . . . . . . . . . . . . . . . . . . . . . . . . . . . . . . . . . . . . . . . . . . . . . . . . . . . . . . . . . . . . .46
Table 1 3 : Pooled, GLS and Random Effects Panel estimations of the impact of
Interactions between Policy Index and Aid on the Aid-Growth Relationship . . . . . . . . . . . . . .47
List of Figures
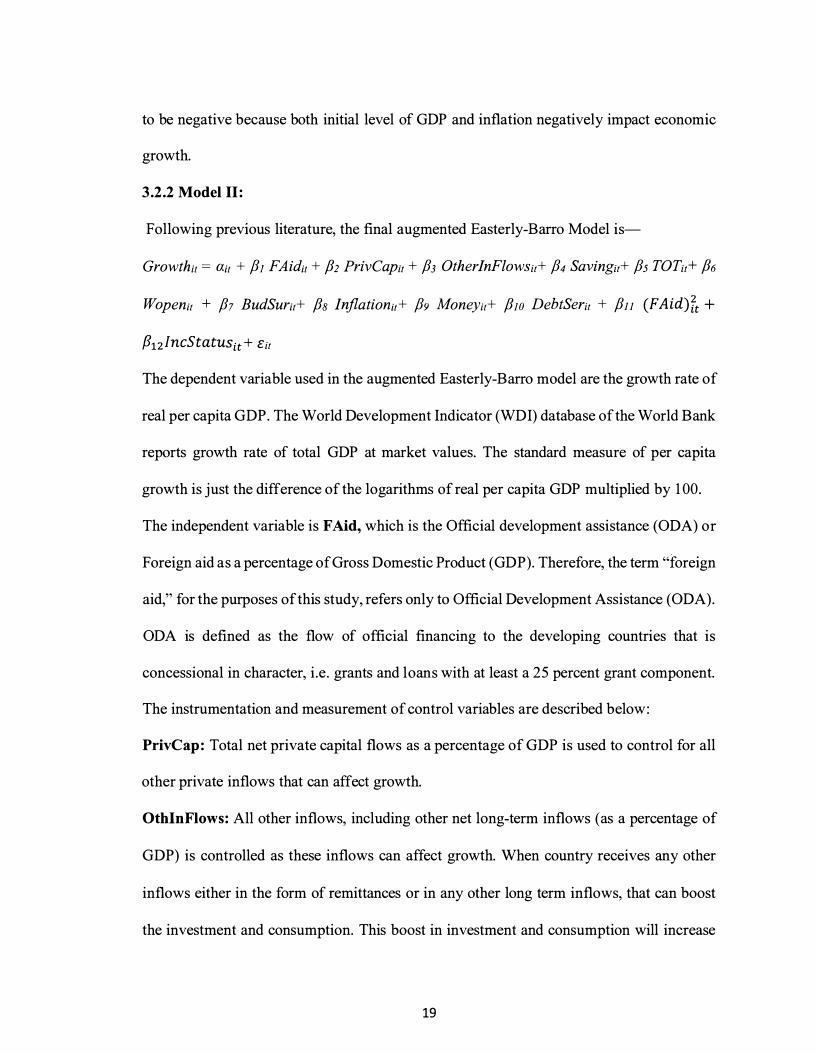
Figure 1 : Top 1 0 ODA recipients in Africa with their share of net debt relief grants . . . . . 24
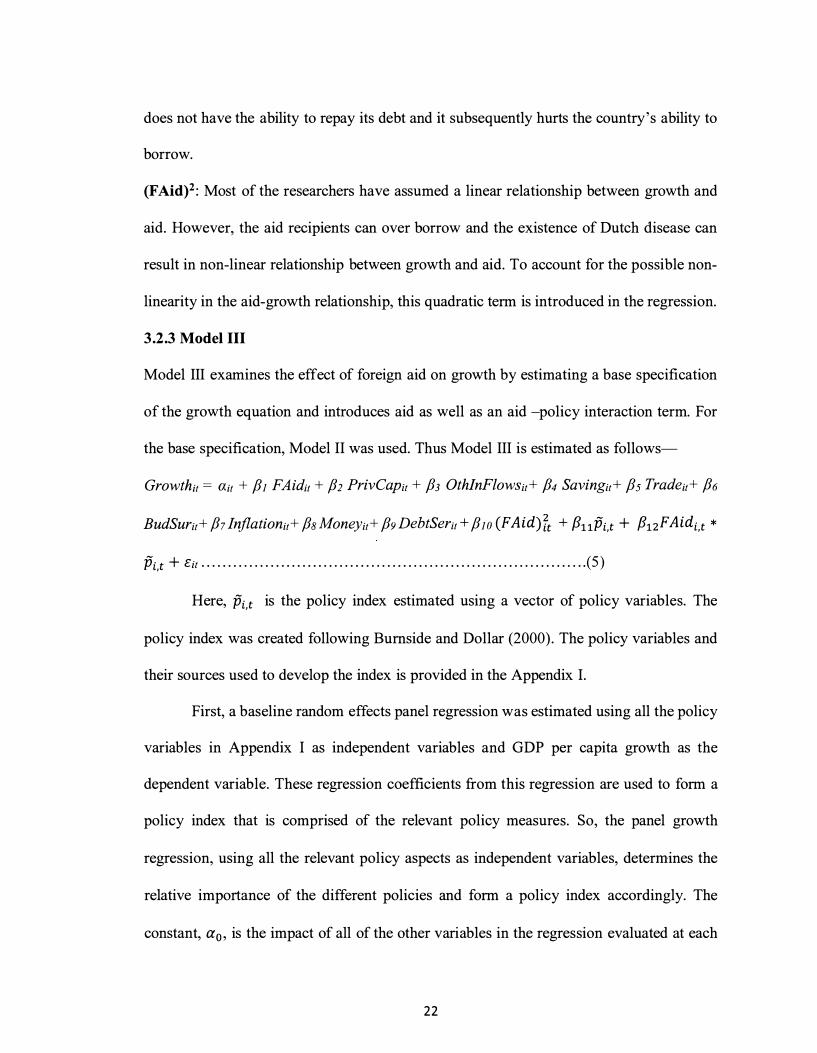
Figure 2 : Conditional Correlation between Growth and Total Aid, 1 980-20 1 5 . . . . . . . . . . . . 25
vi
Chapter 1
Introduction
The term "foreign aid," for the purposes of this study, refers only to Official Development
Assistance (ODA). ODA is defined as the flow of official financing to the developing
countries that is concessional in character, i .e. grants and loans with at least a 25 percent
grant component. Foreign aid programs were launched even before there was evidence that
aid could be beneficial for an economy. So, without the existence of compelling theory, or
compelling evidence, foreign aid flows from the developed to developing nations. The
stated goal of the foreign aid programs was to alleviate poverty and promote growth. The
massive aid programs that began after the second world war, but got its momentum in
1 960s, are an unprecedented economic experiment that continues to perplex the
economists.
ODA is generally administered with the objective of promoting the economic
development and welfare of developing countries, and comprises both bilateral aid that
flows directly from donor to recipient governments and multilateral aid that is channelled
through an intermediary lending institution like the World Bank. This definition excludes
debt relief, technical assistance, and other forms of aid. Some bilateral aid conditional
"tied" that it must be spent on goods and services from the donor country. This 'tied' aid
amounts to subsidizing Western manufacturers.
Poor countries dislike tied aid because it means higher prices than on the world
market and sometimes goods of lower quality. Traditional development economics has
long viewed foreign aid as a tool for overcoming the saving gap in developing countries.
1
Based on the assumption that the third World is poor because it lacks the capital necessary
for making income generating investments, mainstream economics literature suggests that
aid can help developing countries by closing this financing gap that otherwise leaves them
stuck in a "poverty trap." The "big push" argument depicts aid as the necessary catalyst for
investment that would, in turn, lead to growth and presumably initialize an upward path to
economic development.
Easterly (2003) pointed out that economic research on the impact of foreign aid on
economic growth often becomes a political football. Economists failed to consider the
context of such research and the result has been different than the original demonstration
of the research. The reason behind this is the fact that economic research on foreign aid has
generated mixed results for different regions of the world.
Much of the development assistance program or foreign aid to developing countries
is aimed to promote economic development and welfare. Capital has been transferred to
some developing countries for decades. A vast amount of literature has been directed
towards studying the relationship between foreign aid and economic growth. Nonetheless,
the effectiveness of foreign aid remains questionable. During the 1 960s, 1 970s and 1 980s,
economists who tried to study the impact of foreign aid on economic growth, came up with
long and inconclusive results due to limited data availability and disputation about the
specifications, mechanisms and measurements of how foreign aid would affect growth.
Boone ( 1 996) rejuvenated the literature by showing that aid finances consumption rather
than investment.
Morrissey (200 1 ) pinpointed the mechanisms by which aid can impact growth-by
increasing investment in physical and human capital and the capacity to import capital
2

goods or technology. He also argued that aid has no negative externalities that can reduce
investment or saving rate. On the other side, McGillivray McGillivray, M., Feeny, S.,
Hermes, N. and R. Lensink (2006) suggested that aid has decreasing returns and the
effectiveness of aid heavily depends on external, climatic and political conditions. They
also posited that institutional quality plays an important role in aid effectiveness.
The financial crisis of 2007-2009 has affected the economic position of many
developing nations . Though aid flows to developing countries did not suffer a huge drop,
foreign direct investment and other private flows shrank drastically. Increases in food and
oil prices resulted in budget deficits for many developing countries. Many countries were
not able to address the financial crisis due to weak fiscal policies. This resulted in an
increase in the aid flows to the developing countries- especially in African countries.
Africa is a resource-rich but poor continent. As of 20 1 6, approximately 1 .2 1 6
billion people live in 5 4 different countries in Africa. The economy of Africa consists of ·
trade, agriculture and, manufacturing. Africa is a continent that has been abundant with
natural resources but due to endemic warfare and unrest, widespread corruption, and
despotic regimes, African nations have failed to achieve the expected economic
development. Also, a high reliance on foreign debt and abuse of foreign aid have left scars
on the African economy.
Africa has been one of the largest recipients of foreign aid. The Organization for
Economic Corporation and Development (OECD, 2009b) stated that in 2008, net bilateral
official development assist�ce (ODA) from Development Assistance Committee (DAC)
donors to Africa totaled US$26 billion, of which US$22 .5 billion were offered to sub-
3
Saharan Africa. Excluding volatile debt relief grants, bilateral aid to Africa and sub
Saharan Africa rose by 1 0 .6% and 1 0% respectively in real terms.
Even though it is believed that foreign aid is primarily motivated to assist the poor
countries, substantial evidence has shown that the foreign aid programs are tailored to
various political, strategic, and welfare interests of donor countries and organizations. Each
year billions of dollars flow to Africa and various African leaders continue to call for more
aids, however, the evidence of increased economic development and reduced poverty is
yet to appear in Africa.
There is evidence that aid has been a disaster for African nations. Foreign aid to
African nations has made the poor poorer and the growth slower. The surreptitious aid
culture has left African nations more debt-laden, more inflation-prone, more defenseless to
the quirks of the currency markets and more unappealing to high quality foreign direct
investments. Also, foreign aid has increased the risk of civil conflict and unrest. For Africa,
aid has been an unmitigated political, economic and humanitarian catastrophe.
Since foreign aid is an important factor to the economies of developing countries,
it is imperative to understand the contribution of foreign aid towards the economic
wellbeing of these countries. Many empirical studies have applied econometric analyses to
study the aid-growth relationship using data from different regions of the world. Much
emphasis was given to the study of African nations. Some literature pointed out that
African nations paid the price of using immediate temporary "fix" that is a loan or aid from
. global institutions. However, most aid-growth investigations using African countries either
pre-date or have ignored recent advanced growth theories that can generate more useful
empirical growth equations.
4

This thesis aims to address the aid-growth investigation by studying the aid effectiveness
with augmentations of two endogenous growth models-Easterly' s ( 1 993) model and
Barro ' s ( 1 99 1 ) model. Easterly emphasized that stable macroeconomic policies are the
most essential element for a sustained economic growth. Several empirical studies have
validated his arguments by shown that the policy environment and institutional quality of
the recipient nation condition the developmental effect of aid. The major contribution of
this thesis is that it supplements the existing literature by through empirical analyses using
panel data and cross section econometric techniques for all African countries (54 African
nations) over a long and recent time-period ( 1 980-20 1 5) .
The thesis i s structured as follows : Chapter 2 provides a literature review of several
prominent studies involving aid-growth relationships; Chapter 3 discusses the research
methodology, models, and data, including choice of variables; Chapter 4 discusses the
panel regression results in detail.· Finally, a brief conclusion and recommendations for
future studies are presented in Chapter 5 .
5
Chapter 2
Literature Review
There is no doubt that foreign aid has extensively, intensively and forwardly maneuvered
the African economies. This is evident from the reduced school dropout rates, enhanced
accessibility of basic health services, the present coherence of militaries and the sister
security organizations, the infrastructural developments such as construction of roads,
universities, bridges and stadiums . The impact is still very persistent. But at the same time,
it is essential to notice that a remarkable paradigm shift has occurred in the respective GDPs
of the countries that receive foreign aid.
It is important to get an understanding of the extent of this impact. The key is to ask
two awakening questions- Is it the observed economic growth in terms of increases in
GDP, or is it the economic growth that involves an increase in the standard of living of a
substantial portion of the population of a country? These two questions reveal the
superficial nature of the frequently reported impact of foreign aid. It shows that the impact
of foreign aid on economic growth in Africa is ripped between the ends of a see-saw, that
is, highly raised on the side of GDP growth in a shameful co-existence with severely
lowered dwindling standards of living.
The role of foreign aid in the growth process of developing countries has been a
highly debated issue. Foreign aid i s particularly important element of growth theories for
its potential to reduce poverty in developing economies. However, previous empirical
studies on foreign aid and economic growth have reported mixed findings. A positive .
relation between foreign aid and economic growth was found out by Papanek (1973 ) ,
Dowling and Hiemenz ( 1 982), Gupta and Islam ( 1 983) , Hansen and Tarp (2000), Burnside
6
and Dollar (2000), Gomanee, K. , Girma, S . , & Morrissey, 0. (2005) , Dalgaard, C. J . ,
Hansen, H. , & Tarp, F . (2004), and Karras (2006), whereas Burnside and Dollar (2000)
and Brautigam and Knack (2004) provided evidence for negative relation between foreign
aid and gro\\1:h. In addition, Mosley (1980), Mosley, P . , Hudson, J . , & Horrell, S . (1987) ,
Boone ( 1 996), and Jensen and Paldam (2003) found no impact of foreign aid on growth.
Most of these studies employed single-equation estimation techniques and used
cross-sectional data. That could be one reason for finding mixed results. For instance,
Papanek ( 1 973) overturned the negative results found out by Griffin ( 1 970) and Griffin and
Enos ( 1970) by breaking up capital flows into foreign aid, private capital, and other
inflows. This disaggregation resulted in a positive and significant aid coefficient. To the
contrary, Voivodas ( 1 973 ) reported a negative but weak impact of aid on economic gro\\ih
for a sample of 22 Least Developed Counties (LDCs) over 1 956-1 968 . His ambiguous
findings can be attributed to poor data quality and availability.
Dowling and Hiemenz ( 1 983) studied the aid-gro\\ih relationship for the Asian
region by using data from 13 countries and employing pooled regression. They found a
positive and significant impact of aid on growth. Several policy variables such as trade,
finance and government intervention were controlled. However, using pooled regression
undermines the findings of this study. Singh ( 1 985) got similar results for a large sample
of 73 Asian countries during 1960-70 and 1 970-80 . For Sub-Saharan Africa, Levy (1988)
reported a significant positive relationship between aid and gro\\ih. He used a regression
model which included aid as a ratio of GDP as the independ�nt variable and income per
capita as the dependent variable, covering a period from 1968 to 1 982 . This study al so has
problems due to methodological issues.
7

It should be emphasized that researchers have identified many required factors that an
economy must possess for foreign aid to positively affect economic growth. Burnside and
Dollar (2000) maintained that foreign aid has positive effects only if it is combined with
good fiscal, monetary, and trade policies. However, Boone (1996) has cast doubt on the
growth effects of aid . Using a sample of LDCs, he showed that aid has had no impact on
either investment or income growth. A recent study by Doucouliagos and Paldam (2009),
using the meta-analysis covering 68 papers containing a total of 543 direct estimates,
posited that the impact of foreign aid on grovvth estimates scatter considerably, resulting in
a positive, but insignificant, effect on growth.
The mixed empirical results concerning the relationship between foreign aid and
economic growth has attracted economists for decades. Gupta ( 1 975) and Gupta and Islam
( 1 983) argued that if indirect effects of foreign aid are included in the estimation technique,
then early estimates of a negative effect of foreign aid can be overturned. By contrast,
Mosley ( 1 980) reported a weak, negative correlation between aid and growth by applying
a simultaneous equation model . Though he did find a positive, significant relationship for
the 'poorest' countries in his sample, he recognized that even this analysis is seriously
incomplete.
Kormendi and Meguire ( 1 985), Fischer ( 1 993) and Easterly ( 1 993) have
emphasized on the role of macroeconomic factors and distortionary policies in the aid
growth relationship. Kormendi and Meguire used a set of macroeconomic growth
determinants such as monetary v£}.riance, government spending, inflation, and trade when
studying the aid-growth relationship. Fischer ( 1 993) supported the Kormendi and
Meguire' s findings and suggested that stating macroeconomic stability is necessary for
8
sustainable growth is too strong a statement to put forward, but macroeconomic stability is
conducive to economic growth. He also offered the inflation rate as the best single indicator
of macroeconomic policies along with the budget surplus as a second indicator. Also,
according to Fisher, a fiscal deficit serves as an indicator of a government that is losing
control.
McGillivray (2006) showed how foreign aid to African countries not only increases
growth but also reduces poverty. Also, he pointed out that unceasing poverty in the Sub
Saharan African countries compromises the Millennium Development Goal (MDG) one of
eradicating hunger and poverty. Target 1 which was to halve, between 1 990 and 20 1 5 , the
proportion of people living in extreme poverty (earning less than $1 .25 a day) was not
achieved in these African countries. They econometrically analyzed time series data for
1 968-1 999 to conclude that the policy regimes of each country, such as inflation and trade
openness, influence the amounts of aid received and in tum impacted economic growth.
Easterly (2003) showed how foreign aid creates vicious cycle of debt and aid. He
argued that countries with a large amount of debt misuse the foreign aid. This misuse not
only results in a vicious cycle of debt and aid but also the wrong incentives on part of the
governments of the developing countries. He concluded that the misuse of aid is the reason
for the failure of foreign aid to accelerate growth.
Ouattara (2006) studied the consequences of aid flows on crucial fiscal aggregates
in Senegal. The data for this paper covered years 1 970 to 2000 and principally focused on
the in�eraction between aid and debt. He presented three pivotal findings from this study.
First, that a sizable portion of aid flows, approximately 4 1 %, were used for Senegal's debt
financing and 20% of the government' s resources are devoted to debt servicing. Second,
9
the effect of aid flows on domestic expenditures was statistically insignificant. Third that
debt servicing had a significant negative impact on domestic expenditure. His results
confirmed Easterly' s vicious cycle of aid and debt portrayal concluded that debt reduction
could have a stronger positive effect on economic growth than obtaining additional loans
to pay the outstanding loans.
Addison, Mavrotas and McGillivray (2005) studied the trends in documented
foreign aid provided to Africa over the period 1 960 to 2002. They mainly stressed on the
decrease in foreign aid over the decade as that decrease was bound to affect the standard
ofliving of Africans and have some implications for the African economy as a whole. They
argued that the unexpected decrease in foreign aid to African countries would make the
Millennium Development Goals (MD Gs) much more difficult to achieve if not impossible.
Their results suggested that aid in fact promoted growth and reduced poverty in the
sampled countries, and aid had a positive impact on public sector total to induce higher
public spending and lower domestic borrowing. Their study emphasized that the
Millennium Development Goals (MGDs) cannot be achieved using foreign aid only. To
fulfill the Millennium Development Goals (MD Gs), African countries need to explore and
exploit other innovative sources of finance.
Karras (2006) analyzed annual data from the 1 960 to 1 997 for a sample of 7 1 aid
receiving developing countries to examine the correlation between foreign aid and growth
in per capita GDP. He found a positive impact of foreign aid on economic growth that was
permanent and statistically significant. He showed that a permanent increase in foreign aid
of $20 per person led to a permanent increase in the growth rate of real GDP per capita by
10
0. 1 6%, but his results did not control for the effects of other policies and that constitutes a
huge drawback for the findings.
Gomanee, Girma, and Morrissay (2005) studied the mechanisms through which
foreign aid affects growth. They used a sample of 25 Sub-Saharan African countries over
the period 1 970 to 1 997 to establish that foreign aid had a significant positive impact on
economic growth. Also, they pinpointed "investment" as the most significant and
influential transmission mechanism. Their findings suggested that on average, each one
percentage point increase in the aid/GNP ratio contributes one-quarter of one percentage
point to the growth rate. Based o that findings, they concluded that the reason behind
Africa's poor growth is not aid ineffectiveness but some other policy factors .
Quartey (2005) used innovative research methods to study the aid effectiveness on
Ghana, instead of pooling a large amount of data for numerous developing countries. His
findings recognized that Multi-Donor Budgetary Support (MDBS) could be successful in
Ghana but only if the government of Ghana and its partners plan better and coordinate their
efforts. Quartey' s also reasoned Ghana' s the government needs to work on reducing its
debt burden so that it would not need to use its aid inflows for debt financing. His findings
made it clear that the Multi-Donor Budgetary Support (MDBS) cannot be fully successful
until it is properly synchronized and utilized with other forms of financial aid and until the
inflows become more predictable.
Ram (2004) determined that the recipient country's policies associated with the
foreign aid play the key role in determining the effectiveness of foreign aid. Ram,
disagreed, however, with the widely held opinion that redirecting aid toward countries with
better policies leads to higher economic growth and lower poverty rates . He found no
11
evidence to support the hypothesis that directing foreign aid to countries. with good
economic policies will increase the effect of foreign aid on growth or will result in a
decrease in poverty rates.
Rajan and Subramanian (2005) investigated why it might be so difficult to identify
a significant positive impact of foreign aid on economic growth. They have searched for
factors that might frustrate aid from having a positive impact on long-run growth. Their ,
findings showed that there is little evidence of a robust positive impact of foreign aid on
economic growth even though they have corrected for the biases of conventional ordinary
least square estimations procedures against finding a positive impact of aid. They found
mixed impact of foreign aid on economic growth.
Abuzeid (2009) investigated the circumstances under which aid can be ineffective
and detrimental . She argued that corruption and weak institutional structures of the
recipient country can do more harm for Sub-Saharan African countries. She pointed out
that discrimination on part of the donor countries based on the governance structure of the
recipients generates new complications in the aid-growth relationship. She proposed an
overhaul of the foreign aid paradigm that can take into account the nuanced view of
international development.
Most of these studies can be criticized on several grounds. The endogeneity
problem of single equation models is well known. In most of the studies, the feedback of
low growth to larger aid allocations is ignored. Also, using pooled regressions for a panel
data set raises questions about the magnitude of the coefficients.. Another important
limitation of much of this literature is the incompleteness of the underlying growth models.
12

Many studies modeled growth as a function of capital accumulation only, and few have
addressed model specification issues seriously.
It is obvious that the impact of foreign aid on economic growth has been a debated
issue, particularly for African countries, as the empirical results failed to provide a
generalized finding. In this thesis, I tried to check whether aid improves investment and
economic growth in African countries using the most recent available data. Several
moderating variables will be controlled to isolate the impact of aid on growth.
13

3.1 Model Specifications
3.1.1 Model I:
Chapter 3
Methodology
The study starts with a production function, in which foreign aid is introduced as an input
in addition to labor and domestic capital. In general, the production function can be
specified as follows-
Y = f(L,K,A) . . . . . . . . . . . . . . . . . . . . . . . . . . . . . . . . . . . . . . . . . . . . . . . . . . . . . . . . . . . . . . . ( 1 )
Here, Y= Gross Domestic product (GDP) per capita in real terms, L= Labor input,
K=Domestic Capital Stock and A= Stock of Foreign Aid.
Equation ( 1 ) is a linear equation, so after taking logs on both sides and differencing, the
following equation is obtained-
y = a+ {3l + 8k + (l)a . . . . . . . . . . . . . . . . . . . . . . . . . . . . . . . . . . . . . . . . . . . . . . . . . . . . . . . . (2)
Equation (2) illustrates the determinants of growth rate of Real GDP per capita. Here, l=
rate of growth oflabor, k= rate of growth domestic capital and a= rate of growth of foreign
aid. The rate of growth of capital stock is normally measured using the change in share of
investment in GDP. The rate of growth of labor is measured using growth rate of
population.
Feeny and McGillivray (2008) found an inverted U-shaped relationship between
aid and growth, that is, there are diminishing returns to aid. They identified that these
diminishing returns to aid are due to the absorptive capacity constraints of the recipient
countries.
14

To account for this diminishing returns, a squared term has been added. These changes
yield the following final model-
fJsln(GDPpcw) + {J6lnfRateit + {J7lncStatusit + eit··· . . . . . . . . . . . . . . . . . . . . . . . . . . . (3)
Here, Growthit= growth rate of real GDP per capita of country i in year t,
Pop Grit = growth rate of population of country i in year t,
Inv it= Gross capital formation of country i in year t,
F Aidit= foreign aid as a percentage of GDP of country i in year t,
(FAidit)2= foreign aid (as a percentage of GDP) squared for country i in year t,
GDPpcw= initial level of GDP of country i and
Inf Rate it= inflation rate of country i in year t
IncStatusit= income status of country i in year t
Model I tests the aid-growth relationship by using standard growth theory. The findings
and results ought to be more comparable to previous studies as most of the previous
literature use standard growth theories to study the relationship. However, the model used
in this thesis is a better choice than previous models as it uses a panel methodology with
many control variables. Three estimations-Pooled, GLS, and Random Effects Panel
regressions of Equation 3 will be conducted to compare the results and ensure robustness.
The pooled estimation is the basic estimation to generate baseline results. The GLS
estimation is used to control for any heteroskedasticity that might be existent in the data.
The Random Effects Panel model will report the unbiased estimator after controlling for
the country and time variant effects.
15

3.1.2 Model II:
The second model is built on the premises of Easterly' s ( 1 993) model and Barro' s ( 1 99 1 )
model. First cross-section techniques will b e used to investigate the effects o f data pooling
over the 1 980-20 1 5 period. This will also help be used to compare the findings with those
of previous studies. The simple cross-sectional model is-
yi = ai + /3Xi + yZi + ui . . . . . . . . . . . . . . . . . . . . . . . . . . . . . . . . . . . . . . . . . . . . . . . . . . . . . . . (3)
where, i= 1 , 2, . . . . . . . , 54
Yi = growth rate of GDP per capita for country i
Xi = vector of domestic and foreign capital sources,
Zi = vector of control variables including trade, financial repression,
macroeconomic and 'Barro ' variables and ui= error term.
The same model will be fitted using panel models to provide for the varying country and
time effects. The fitted panel model-
Yit = ait + /3Xit + yZit + Eit . . . . . . . . . . . . . . . . . . . . . . . . . . . . . . . . . . . . . . . . . . . . . . . . . . . (4)
where, i= 1 , 2, . . . . . . . , 54
Equation (4) is estimated using random effects panel model after testing using Hausman
test for 54 African countries over 1 980 to 20 1 5 . The pooled and GLS regressions were
performed to ensure robustness of the findings.
3.1.3 Model III
The third model aims to investigate how the aid-growth relationship is moderated by
governance policies. The model is built on the premise of Burnside and Dollar ( 1 997) . The
model is outlined as follows. Growthi,t represents the growth rate of real per capita GDP of
country i during period t; GDPi,t is the initial level of real per capita GDP in country i at the
16
beginning of period t; Aidi,t be the level of aid as a fraction of GDP received by country i ·
in period t; Pi.t is a P x 1 vector of policy variables in country i at time t and Xi,t is a K x 1
vector of exogenous variables. If initial income, aid, policy and some subset of other
exogenous variables affect the growth rate of real GDP then the growth equation is as
follows-
Growthi,t = �o + �iGDPi,t-1 + �zAidi,t + �3Pi,t + �4Xi,t + �sAidi,t * Pi,t + E'it···(l)
Here, E'it= zero mean and the interaction term between aid (as a percentage of GDP) and
policy allows to assess the joint effect of aid and policy on economic growth as argued by
the neo-classical growth models.
Several different policy variables need to be considered to correctly assess the
impact of aid and policies on growth. Due to the inclusion of interaction terms, introducing
every an additional policy variable will result in two additional coefficients in the growth
equation. Burnside and Dollar ( 1 997) argued that estimating all these coefficients increases
the chance of inaccurate estimation. For this reason, a scalar policy index is constructed
using ff;t = a0 + a1 Pit• as a linear combination of a set of policy variables. This policy index
is included in the estimation and is used to generate the interaction term in the growth
equation. Similarly, a freedom variable was created using the variables related to economic
freedom.
3.2 Description of Variables:
3.2.1 Model I:
The dependent variable used is the growth rate of real per capita GDP. The. growth rate of
population is used as a proxy for the growth rate of labor force (l), and the investment/GDP
ratio represents the growth rate of capital stock ( k). The labor force participation rate for
17

the sampled 52 countries over the years 1 980 to 20 1 5 was not available. So, following
Ekanayake (2009), population growth rate was used as a proxy for growth rate of labor
force (l) . The investment/GDP ratio is proxied by the Gross Fixed Capital Formation as a
percentage of GDP. To control for income class of the sample countries, a dummy variable
representing the income status of the countries is also introduced. Income status is
measured on a 4-point scale using the quartiles of the GNI per capita, calculated using the
World Bank Atlas method. Any country with GNI per capita, calculated using the Atlas
method, below the 25th percentile was defined as a low-income country. Countries with
GNI per capita between 25th and 50th percentile is defined as lower-middle while countries
with GNI per capita between 50th and 70th percentile is defined as upper-middle income
countries. Finally, countries with a GNI per capital over 70th percentile is defined as the
high-income countries.
The standard definition could not be used because of the time frame and region
covered in the thesis. Using the World Bank definition pushed all the sampled countries in
one direction because per the standard World Bank definition, most of the African counties
are low-income countries. For this thesis, the comparison is among only the African
economies so deviation from the standard definition is justified and prevalent in existing
literature. The main hypothesis is to test whether the marginal impact of foreign aid on
growth, p3, is positive or negative and statistically significant. The coefficients P1 and P2
are expected to be positive because high growth rate of labor force and investment are
expected to positively impact economic growth. The sign of p4 will reflect if the
relationship between aid and economic growth is non-linear. Finally, Ps and P6 are expected
18
to be negative because both initial level of GDP and inflation negatively impact economic
growth.
3.2.2 Model II:
Following previous literature, the final augmented Easterly-Barro Model is-
Growthit =a.it + /Ji FAidu + P2 PrivCapit + fi3 OtherlnFlowsit+ fi4 Savingit+ fi5 TOTit+ P6
Wopenit + P1 BudSurit+ Ps Injlationu+ fi9 Moneyit+ P10 DebtSerit + P11 (FAid)ft +
P12IncStatusit+ Eit
The dependent variable used in the augmented Easterly-Barro model are the growth rate of
real per capita GDP. The World Development Indicator (WDI) database of the World Bank
reports growth rate of total GDP at market values. The standard measure of per capita
growth is just the difference of the logarithms of real per capita GDP multiplied by 1 00.
The independent variable is FAid, which is the Official development assistance (ODA) or
Foreign aid as a percentage of Gross Domestic Product (GDP). Therefore, the term "foreign
aid," for the purposes of this study, refers only to Official Development Assistance (ODA).
ODA is defined as the flow of official financing to the developing countries that is
concessional in character, i .e . grants and loans with at least a 25 percent grant component.
The instrumentation and measurement of control variables are described below:
PrivCap: Total net private capital flows as a percentage of GDP is used to control for all
other private inflows that can affect growth.
OthlnFlows: All other inflows, including other net long-term inflows (as a percentage of
GDP) is controlled as these inflows can affect growth. When country receives any other
inflows either in the form of remittances or in any other long term inflows, that can boost
the investment and consumption. This boost in investment and consumption will increase
19

the aggregate demand that in tum can facilitate economic growth. So, it is wise to control
for these other inflows.
Saving: Domestic Saving (as a percentage of GDP) is introduced in the model to control
for saving.
Trade: Trade includes two measures to account for trade openness and macroeconomic
stability. Trade openness affects growth through various channels, such as greater access
to physical and technological products from abroad, broader markets and increased
specialization. Past literature on the aid-growth relationship has controlled for trade using
various measures. This thesis has used country' s terms of trade (TOT) and weighted
openness (WOpen) .
Terms of Trade (TOT) is the relative price of exports in terms of imports and is
operationalized as the ratio of export prices to import prices. Terms of Trade (TOT) data
were calculated by the World Bank staff and adopted in this thesis. Weighted openness is
calculated by using a standard openness index following Durbarry ( 1 998) . First, the
standard openness index is calculated by adding real exports (X) and real imports (Y) and
then dividing the sum by GDP, (X+M). This index is weighted by the current account GDP
balance, IX-Ml. So, the weighted openness (WOpen) is the estimation of c1x+M)1• It is better GDP X-M
to use the unweighted ratio as it recognizes the importance of both trade intensity and trade
equilibrium of a country.
BudSur: Budget surplus defined as the sum of current and capital revenue including
grants, less current and capital expenditure, and government lending minus repayments (as
a percentage of GDP).
20

Inflation: Inflation is measured using annual growth of the GDP implicit price deflator.
This is an important variable to control as Durbarry ( 1 998) argued that inflation serves as
a proxy for general macroeconomic stability.
Money: Financial repression refers to the set of rules, policies and non-market controls
used the government to prevent the financial intermediaries of an economy from
functioning at their full capacity. It is used as a dichotomous variable by many researchers
while studying economic growth as financial repression prevents the efficient allocation of
capital and thereby impairs economic growth. World Bank ( 1 989) has defined financial
repression as an average real interest rate below -5% over a period. Easterly ( 1 993)
investigated -5% and -2% interest rate thresholds as proxies for financial repression when
investigating the impact of fiscal policies on economic growth. Also, he used the actual
average real interest rate as a proxy for financial repression. Easterly (2003), Fry ( 1 98 1 ) ,
Dowling and Hiemenz ( 1 983) have used money supply (M2) as a percentage of GDP to
operationalize financial repression. If the amount of funds available in the market is low,
then the economy can be viewed as financially repressed. In this thesis, financial repression
is proxied by money supply (M2) as a percentage of GDP denoted as Money. This variable
is a control variable as the growth of a country can be affected by the monetary policy.
Small values of money supply mean financial repression and large values mean financial
liberalization.
DebtSer: This control variable accounts for the debt servicing activities of a country. This
is measured by debt service as a percentage of GDP. Debt service is the cash that is required
to cover the repayment of interest and principal on a debt for a previously agreed-upon
time. If the country does not have a good debt service ratio, that indicates that the country
21
does not have the ability to repay its debt and it subsequently hurts the country's ability to
borrow.
(F Aid)2: Most of the researchers have assumed a linear relationship between growth and
aid. However, the aid recipients can over borrow and the existence of Dutch disease can
result in non-linear relationship between growth and aid. To account for the possible non
linearity in the aid-growth relationship, this quadratic term is introduced in the regression.
3.2.3 Model III
Model III examines the effect of foreign aid on growth by estimating a base specification
of the growth equation and introduces aid as well as an aid -policy interaction term. For
the base specification, Model II was used. Thus Model III is estimated as follows
Growthu =au + P1 FAidu + P2 PrivCapu + p3 OthlnFlowsu+ p4 Savingu+ Ps Tradeu+ P6
BudSuru+ Pdnflationu+ PsMoneyu+ p9DebtSeru+ P10 (FAid)ft + f311Pi,t + {312FAidi,t *
Pi,t + Eu • • . • • . . . . . . . . . . . . . . . . • . . . . . . . . . . . . . . • . . . . . . . . . . . . . . . . . . . • • . . . . . . . . . . . . . . • (5)
Here, Pi,t is the policy index estimated using a vector of policy variables. The
policy index was created following Burnside and Dollar (2000) . The policy variables and
their sources used to develop the index is provided in the Appendix I.
First, a baseline random effects panel regression was estimated using all the policy
variables in Appendix I as independent variables and GDP per capita growth as the
dependent variable. These regression coefficients from this regression are used to form a
policy index that is comprised of the relevant policy measures. So, the panel growth
regression, using all the relevant policy aspects as independent variables, determines the
relative importance of the different policies and form a policy index accordingly. The
constant, a0, is the impact of all of the other variables in the regression evaluated at each
22

variable's mean. The calculated policy index, referred to as policy in the thesis, can be
interpreted as a country's predicted growth rate given its different policies related to its
economy and politics, if it had the mean values of the other characteristics after controlling
for the country and time effects. For the Freedom variable, the same procedures were used
to get a country's predicted growth rate given its economic freedom, if it had the mean
values of the other characteristics after controlling for the country and time effects. Before
selecting the possible policy and freedom related factors, pairwise correlation coefficients
were evaluated. Also, the calculated policy and freedom were evaluated using pairwise
correlation coefficients before including them in the regression. There were no
multicollinearity issue associated with the policy and freedom variables.
3.3 Selection of Countries
The thesis is focused on studying the aid-growth relationship in Africa. The context is
important because Africa is the largest recipient of Foreign aid. All the African nations
have received at least one foreign aid of some kind during the 1 980 to 20 1 5 . The top 1 0
aid recipient countries are showed in the following figure 1 . As can be seen from the figure,
Egypt has received the highest average amount of ODA in the 3-year period from 20 1 2-
20 1 4.
It is known that almost all the African countries have received foreign aid from
various of donors. The study covers 54 African sovereign countries over a 36-year period
starting from 1 980 to 20 1 5 . The alphabetical list of the sampled countries is provided in
Appendix II.
23
o Net d�.;)t relief grant$
e --· - ------------ - -- ---- -- --- --- -------·--------
Figure 1: Top 10 ODA recipients in Africa with their share of net debt relief grants, Source
OECD
Among these 54 countries, the graph is shown the top 10 ODA recipient in Africa
reported by OECD, Egypt have received more than 5 billion dollars in 2013 , developmental
and peacekeeping assistance. Ethiopia is the second-most populous country in Sub-Saharan
Africa with a population of99.4 million, and population growth rate of2.5% in 2015. One
of the world· s oldest civilizations, Ethiopia is also one of the world's poorest countries.
The country ' s per capita income of $590 is substantially lower than the regional average
(Gross National Income, Atlas Method) despite the amount of aid they receive as foreign
aid. Tanzania is a democratic republic of over 53 million people, with an average annual
gross domestic product growth rate of nearly 7 percent over the past decade. Despite recent
economic growth, over 46 percent of the population lives below the extreme poverty
threshold of$1.90 a day (2011).
24
co
co .,.;
I.{)
0
• E R i • AN G • S EY • U GA
• EG Y
• B U N
• CA R
• M OZ
• ETH
. 5 1 1 . 5 Aid Cond it iona l on Other Covariates
• EO U
2
Figure 2 : Conditional Correlation between Growth and Total Aid, 1 980-20 1 5
3.4 Data Sources and Descriptive Statistics
Most of the data for this study were collected from the Word Bank. The data on foreign aid
were collected from the Organization for Economic Corporation and Development
(OECD). The Economic freedom data were collected from The Economic Freedom of the
World database. The policy variables were collected from the Global Economy database.
A detailed listing of the variable sources used in the three models is presented in Appendix
I and Appendix III .
The summary statistics in Table 1 present the mean, standard deviation, and umber
of observations for each variable. The descriptive statistics presented in Table 1 show that
the mean GDP per capita growth rate of 1 .26 percent per year with a standard deviation of
7 .99 percent. The mean foreign aid as a percentage of GDP received by the sampled
counties is 4 1 .57 percent with a standard deviation of 295.07 percent.
25

Table 1: Descriptive Statistics
Growth (%) Popg
Variable
Inv/GDP (% of GDP) F Aid (% of GDP) (FAid)2
ln(GDP_Ini) Inflation (% Change of GDP Deflator) Pricap (% of GDP) Saving (% of GDP) Other Inflow (% of GDP) BudSur (% of GDP) Money (% of GDP) Inc Status TOT (% of GDP) Wopen DebtSer (% of GDP) Policy_ Index F Aid *Policy_ Index
Obs 1 940 1 940 1 578 1 7 1 1 1 7 1 1 1404 1 770 1 044 1 628 1 672 1 940 1 680 1 7 1 5 1 70 1 1 669 1 884 1 52 1 14 14
Mean 1 .26 2.52
22.03 41 .57 8.87 -0.86 39.77 -4.66 9.46 1 8.78 - 1 .0 1 55.25 1 .38
75.92 1 .34 4. 1 5 7.79 1 .41
Std. Dev. 7.99 1 . 1 1
1 6.09 295.07 1 1 4.68 6.83
263.83 1 6.77 23.73 1 6.26 8.26
623.82 0.64
48.04 3.23 5.45 1 .00 2.08
The mean rate of inflation is 39 .77% with a standard deviation of 263 .83%. The
high standard deviation is due to the existence of higher inflation rate in some of the
sampled countries. The mean money supply is 5 5 .25% of GDP with a standard deviation
of 623 .82 . This value gives an idea about the average money supply of the sampled
countries. The mean policy index is 7 .79 with a standard deviation of 1 .00. The mean of
the interaction term between foreign aid and policy index is 1 .4 1 with a standard deviation
of 2 .08 .
26
Chapter 4
Results & Discussion
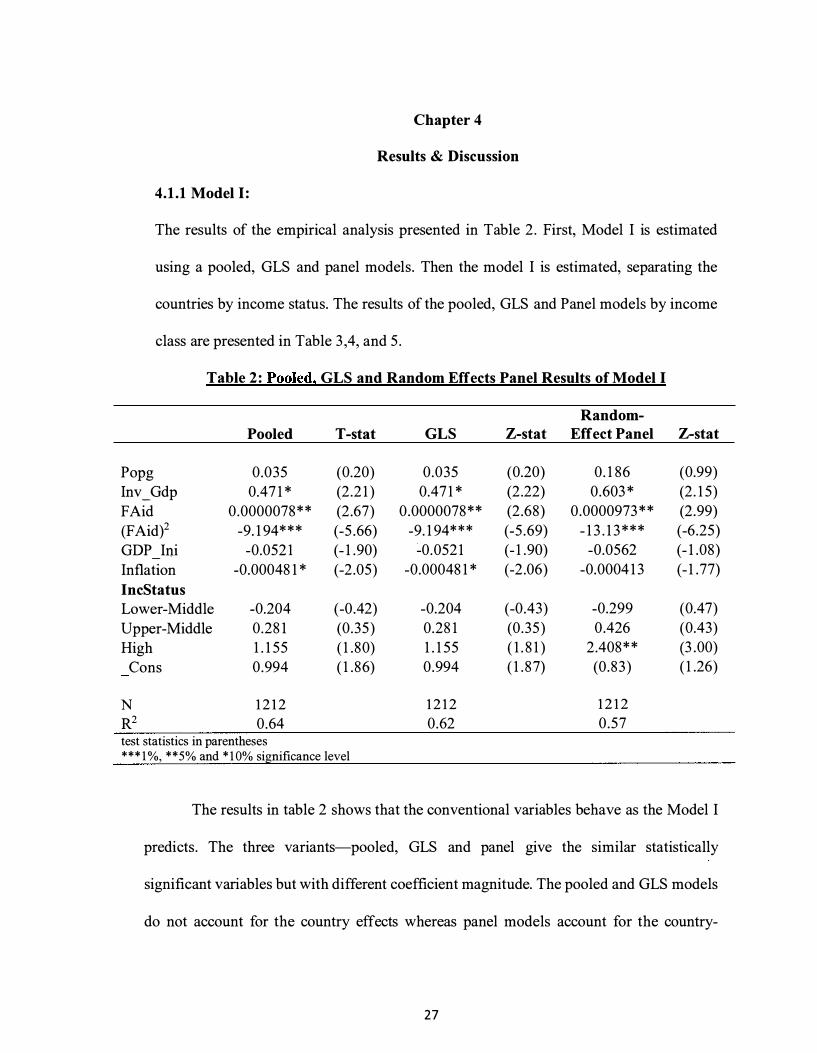
4.1.1 Model I:
The results of the empirical analysis presented in Table 2 . First, Model I is estimated
using a pooled, GLS and panel models. Then the model I is estimated, separating the
countries by income status. The results of the pooled, GLS and Panel models by income
class are presented in Table 3 ,4, and 5 .
Table 2: Pooled, GLS and Random Effects Panel Results of Model I
Random-Pooled T-stat GLS Z-stat Effect Panel Z-stat
Popg 0 .035 (0.20) 0 .035 (0.20) 0 . 1 86 (0.99)
Inv_Gdp 0.47 1 * (2 .2 1 ) 0.47 1 * (2 .22) 0 .603 * (2 . 1 5)
FAid 0 .0000078 * * (2 .67) 0 .0000078** (2 .68) 0 .0000973 * * (2.99)
(FAid)2 -9. 1 94* * * (-5 .66) -9. 1 94* * * (-5 .69) - 1 3 . 1 3 * * * (-6 .25)
GDP_Ini -0.052 1 (- 1 .90) �0.052 1 (- 1 .90) -0.0562 (- 1 .08)
Inflation -0.00048 1 * (-2 .05) -0.00048 1 * (-2 .06) -0.0004 1 3 (- 1 .77)
IncStatus Lower-Middle -0.204 (-0 .42) -0.204 (-0 .43) -0.299 (0.47)
Upper-Middle 0 .28 1 (0 .35) 0 .28 1 (0 .35) 0 .426 (0.43)
High 1 . 1 55 ( 1 . 80) 1 . 1 55 ( 1 . 8 1 ) 2 .408* * (3 .00)
Cons 0 .994 ( 1 . 86) 0 .994 ( 1 . 87) (0 .83) ( 1 .26)
N 1 2 1 2 1 2 1 2 1 2 1 2 R1 0.64 0 .62 0 .57 test statistics in parentheses *** 1 %, **5% and * 1 0% significance level
The results in table 2 shows that the conventional variables behave as the Model I
predicts. The three variants-pooled, GLS and panel give the similar statistically
significant variables but with different coefficient magnitude. The pooled and GLS models
do not account for the country effects whereas panel models account for the country-
27

specific random variations. The GLS estimation of Model I provides slightly better and
more robust result than the pooled.
The coefficients of first two variables are expected to be positive and the results are
consistent. The labor growth variable proxied by population growth is not significant. The
reason is most of the African countries are not labor driven and relies on natural resources .
This could explain why labor growth not coming significant. The capital growth variable
proxied by investment is significant. That is, high investment as a percentage of GDP is
associated with high GPD per capita growth. In the standard growth model investment is a
component of aggregate demand. So, an increased investment will help to boost aggregate
demand and therefore economic growth. Also, increases in investment results m an
increase in capital spending which in turn increases economic growth.
The foreign aid variable has a positive sign and is statistically significant. The sign
of the foreign aid variable suggest that foreign aid appears to have a positive impact on
economic growth. However, the size of the coefficient is very small, suggesting that the
impact of foreign aid on economic growth is very small. So, even with a positive and
statistically significant coefficient, foreign aid seems to bring no advantage for these
sampled African countries. The squared term of foreign aid is found to be statistically
significant and negative supporting the predictions of model I. The significant and negative
coefficient of the quadratic term verifies that the relationship between aid and growth is
non-linear and aid is detrimental to economic growth if the country is receiving aid for a
long period. That is, aid can be beneficial for a small period but as time passes aid will
have adverse effect on the economy. Increased dependence on aid will bring negative
consequences for the economy.
28
The coefficient of the initial GDP of the sample countries is negative but insignificant. The
negative sign is because initial GDP drives the later GDPs and most of the sampled
countries are poor with a low initial GDP. These countries are expected to continue to grow
more slowly than countries with high initial GDPs per capita. However, the variable is not
statistically significant. The explanatory power of initial GDP is low in the sampled African
countries because the initial GDP per capita is volatile in the sampled countries. Inflation
has the expected negative sign and is statistically significant in the pooled and GLS model;
but was statistically significant in the panel model. Inflation has long been associated with
negative economic growth and the results support these previous findings. Inflation affects
the spending power of a country' s population and results in increased nominal consumption
expenditure. The increases in consumption expenditure decrease the aggregate amount of
saving and therefore slows economic growth. In the panel estimation, after controlling for
the country-specific variations, inflation seems to have little power in explaining changes
in economic growth.
Model I also controls for the relative income status of the sampled countries. The
reference category is low-income countries (i . e. Central African Republican, Chad,
Comoros etc.) . Compared to low income countries, the remaining income classes are
expected to have higher rates of economic growth. However, the relative income status of
lower-middle (i .e. Gabon, Mauritius, Namibia etc.) and upper-middle (i .e . Egypt, South
Africa etc.) income classes are not significant in the pooled, GLS and panel estimation. All
these countries are aid recipien�s yet their income classes do not matter since they all face
the negative consequence of too much reliance on aid. Most of these countries participated
in the IMF Structural Adjustment Programs and hence made some drastic changes in their
29
budget and institutional structures per the requirements of IMF. That, in tum, affected their
growth path and these countries experienced slow economic growth rates . Only a high
income country (i.e. Seychelles, Libya) status was correlated, positively with faster
economic growth and in the random-effects panel model.
Model I is built on the standard growth model that takes labor and capital growth
as the determining forces of economic growth. To study the impact of aid on economic
growth, foreign aid was introduced in the model along with a quadratic term to account for
the non-linear relationship of aid and growth. The findings suggest that foreign aid has a
negligible positive impact on economic growth and that the relationship between aid and
economic growth indicates diseconomies of scale. Though model I is not a sophisticated
growth model, it showed that foreign aid seems not to be a forceful factor affecting
economic growth. Also, it showed that too much reliance on foreign aid will bring adverse
effects on the economy of the aid-recipient as the relationship between aid and economic
growth is non-linear. These finding are important as they can be used to develop beneficial
policies regarding foreign aid.
Tables 3 , 4, and 5 provide the results of pooled, GLS and panel estimations of
Model I by income class of the sampled countries. Since most of the sampled countries
belong to low and middle-income countries, I limit my dissertation to those income classes.
30
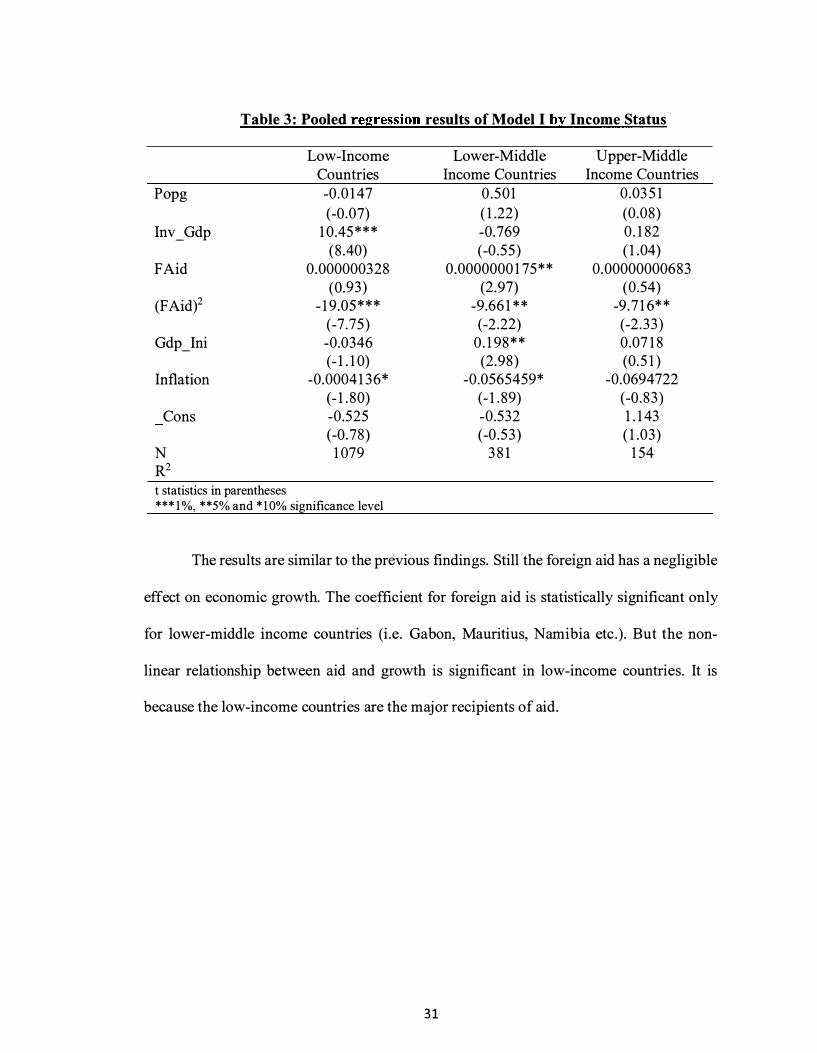
Table 3: Pooled regression results of Model I by Income Status
Low-Income Lower-Middle Upper-Middle Countries Income Countries Income Countries
Popg -0.0 1 47 0 .501 0 .03 5 1
(-0 .07) ( 1 .22) (0 .08) Inv_Gdp 1 0 .45 * * * -0.769 0 . 1 82
(8 .40) (-0 .55) ( 1 .04) FAid 0 .000000328 0 .0000000 1 75* * 0.00000000683
(0.93) (2 .97) (0.54) (FAid)2 - 1 9 .05* * * -9.66 1 * * -9 .7 1 6* *
(-7 .75) (-2 .22) (-2 .33) Gdp_lni -0.0346 0 . 1 98 * * 0 .07 1 8
(- 1 . 1 0) (2 .98) (0. 5 1 ) Inflation -0.0004 1 36* -0.0565459* -0.0694722
(- 1 . 80) (- 1 . 89) (-0 .83) Cons -0.525 -0.532 1 . 1 43
(-0. 78) (-0 .53) ( 1 .03) N 1 079 3 8 1 1 54 R2
t statistics in parentheses *** 1 %, **5% and * 1 0% significance level
The results are similar to the previous findings. Still the foreign aid has a negligible
effect on economic growth. The coefficient for foreign aid is statistically significant only
for lower-middle income countries (i .e. Gabon, Mauritius, Namibia etc.) . But the non-
linear relationship between aid and growth is significant in low-income countries. It is
because the low-income countries are the major recipients of aid.
3 1
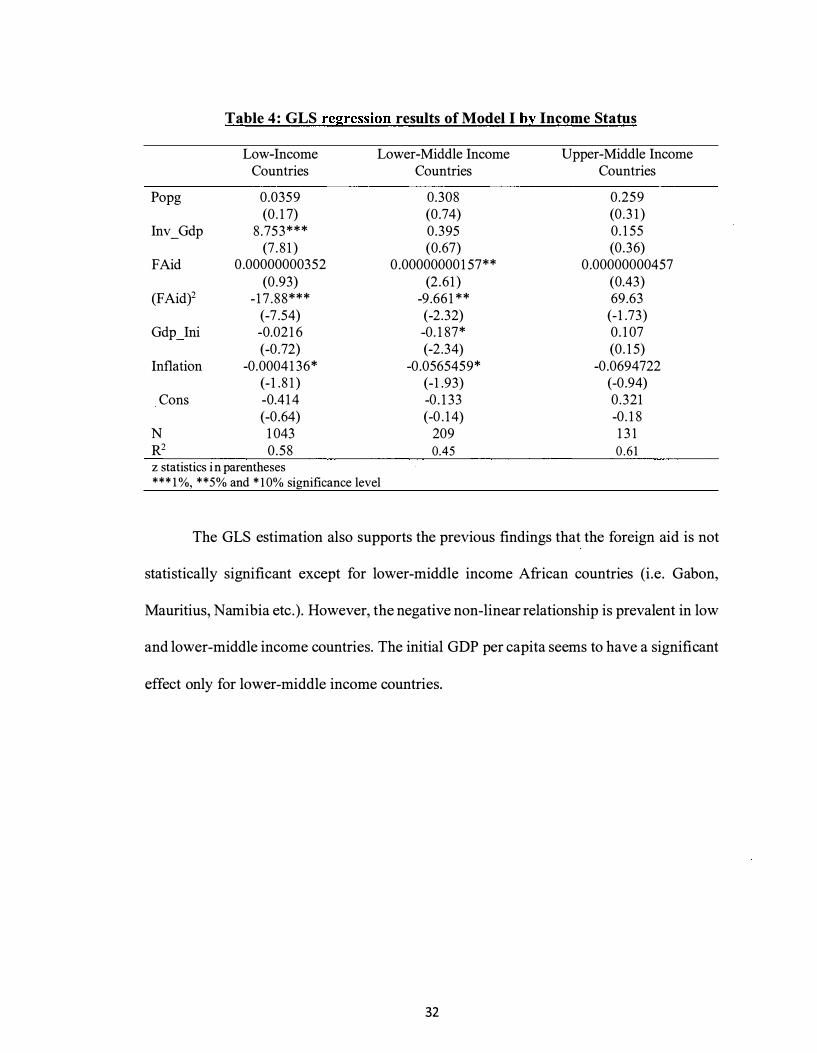
Table 4: GLS regression results of Model I by Income Status
Low-Income Lower-Middle Income Upper-Middle Income Countries Countries Countries
Popg 0.0359 0.308 0.259 (0 . 1 7) (0 .74) (0 .3 1 )
Inv_Gdp 8 .753*** 0 .395 0 . 1 55 (7 . 8 1 ) (0.67) (0 .36)
FAid 0 .00000000352 0 .00000000 1 57** 0 .00000000457 (0 .93) (2 .6 1 ) (0.43)
(FAid)2 - 1 7 . 88*** -9.66 1 ** 69.63 (-7 .54) (-2 .32) (- 1 .73)
Gdp_Ini -0.02 1 6 -0 . 1 87* 0 . 1 07 (-0 .72) (-2 .34) (0 . 1 5)
Inflation -0.0004 1 36* -0 .0565459* -0 .0694722 (- 1 . 8 1 ) (- 1 .93) (-0 .94)
Cons -0.4 1 4 -0 . 1 33 0 .321 (-0 .64) (-0 . 1 4) -0 . 1 8
N 1 043 209 1 3 1 Rz 0 .58 0.45 0 .6 1 z statistics in parentheses *** 1 %, **5% and * 1 0% significance level
The GLS estimation also supports the previous findings that the foreign aid is not
statistically significant except for lower-middle income African countries (i .e . Gabon,
Mauritius, Namibia etc.) . However, the negative non-linear relationship is prevalent in low
and lower-middle income countries. The initial GDP per capita seems to have a significant
effect only for lower-middle income countries.
32

Table 5 : Random Effects Panel regression results of Model I by Income Status
Low-Income Lower-Middle Income Upper-Middle Income Countries Countries Countries
Popg 0.235 0.462 0.259 ( 1 .04) (0 .89) (0.28)
Inv_Gdp 1 0 .28*** 0.43 8 0 . 1 55
(8 .0 1 ) (0.66) (0.32) Aid 0 .000000364 0.000000 1 29 0 .000000493
(0.93) ( 1 . 77) (0 .3 8)
Aid_Gdp2 - 1 9 . 1 4*** -8 .279 69.63
(-6 .83) (- 1 .62) ( 1 .56) Gdp_Ini -0.0227 -0. 1 55 -0. 1 07
(-0 .4 1 ) (- 1 .20) (-0. 1 3) Inflation -0.000377 1 * -0.0690577* * 0 .0694722
(- 1 .65) (-2 .20) (0 .83)
Cons - 1 .2 1 3 -0 .562 0 .32 1 (- 1 .56) (-0 .43) (0. 1 6)
N 1 043 209 1 3 1
R2 0.48 0.47 0.42 z statistics in parentheses *** 1 %, **5% and * 1 0% significance level
Fitting the panel regression by income class shows that foreign aid is not
statistically significant in affecting economic growth at any income levels . An important
point to note is that investment seems to be important for low-income countries. Investment
has a positive impact on economic growth for low income countries. Another important
finding is that foreign aid seems to have no effect on economic growth for these African
countries. The fact that these countries has received foreign aid has complicated the aid-
growth relationship. These countries are heavily reliant on foreign aid and that is not
working on their favor.
33

4.1.2 Model II:
Model II is different from Model I as it controls for several macroeconomic factors. The
results of the empirical estimation of Model II are presented in Table 6 . Model II is also
estimated using the pooled, GLS artd panel models to ensure robustness of the results.
Then same as before Model II is estimated for the four income classes. Table 7,8, and 9
shows the results of pooled, GLS and Panel results by income class.
Table 6: Pooled, GLS and Random Effects Panel results of Model II
Pooled T-stat GLS Z-stat Panel Z-stat FAid 0 .00000097*** (3 .66) 0 .00000097*** (3 .67) 0 .00000095 *** (3 .40) PrivCap 1 .739 ( l .28) 1 .739 ( 1 .28) 1 .444 ( 1 .03)
(FAid)2 -0 .007 1 1 *** (-4 . 1 9) -0 .007 1 1 *** (-4 .20) -0.008 1 7*** (-4 .72)
Saving 0.0222** (2 .80) 0 .0222** (2 .8 1 ) 0 .0227** (2 .69)
Other Inflow 0.024 1 * (2 . 1 2) 0 .024 1 * (2 . 1 3) 0 .0295* (2 .33)
BudSur 0 .0456 ( 1 . 1 5) 0 .0456 ( 1 . 1 5) 0 .0449 ( 1 . 14)
Money -0 .00678 (-0 .24) -0 .00678 (-0 .24) -0 .00736 (-0 .26)
Inflation -0 .0005 (- 1 . 88) -0 .0005 (- 1 . 89) -0 .00045 (- 1 .72)
TOT 0 .0453 *** ( 1 1 .36) 0 .0453 *** ( 1 1 .4) 0 .0479*** ( 1 0 .88)
Wopen 0. 1 0457*** (4 .80) 0 . 1 0547*** (4 .8 1 ) 0 . 1 0596*** (4. 80)
lncStatus Lower-Middle - 1 .690** (-2 .3 1 ) - 1 .690** (-2 .34) - 1 .309 (- 1 .56)
Upper-Middle 0.277 (0.29) 0.277 (0.29) 0 .885 (0 .80)
High 1 .929* (2.24) 1 .929* (2.27) 2 .948** (2 .95) DebtSer -7 .927628 *** (-2 .63) -7 .927628*** (-2 .64) -6 .035549* (- 1 .94)
Cons - 1 .366** (-2 .89) - 1 .366** (-2 .90) - 1 .367* (-2 .57)
N 1 904 1 904 1 904
R2 0 .6 1 0 .65 0.65 test statistics in parentheses *** 1 %, **5% and * 1 0% significance level
The results show that the foreign aid has significant impact on economic growth
under all the three estimations. But the magnitude of the coefficient is very small. So, in
effect foreign aid has no predicted impact on the economic growth of these African
countries. Also, the significant quadratic term confirms the existence of non-linear aid-
growth relationship. The negative sign of the aid squared term supports the conclusion of
34
Hadjimichael, Ghura, Miihleisen, Nord, and U9er ( 1 995), who found that receiving too
much foreign aid hurts the developing countries.
The results in table 6 also show that the impact of foreign aid on economic growth
in Africa is negligible but positive and statistically significant. Also, the impact of private
inflows of capital on economic growth is positive but not statistically significant. Also, the
squared foreign aid term is negative and statistically significant that reflects diseconomies
of scale.
Saving is a significant factor explaining economic growth in African nations. The
coefficient of saving is bigger than that of foreign aid, suggesting that increased saving can
bring desired results in these sampled countries. Saving increases investments and thereby
imposes a positive impact on economic growth. Also, the "other inflows" such as
remittances and all long-term inflows affect economic growth positively. The coefficient
of the other inflows is bigger in magnitude and significant. So, foreign aid does not have
great impact in driving economic growth. In contrary, domestic saving, private capital
inflows, and all other long-term private inflows have a greater impact on economic growth.
The fiscal policy variable, proxied by budget surplus has the positive sign but this
variable is insignificant in explaining growth. The positive sign is expected as higher
budget surpluses result in faster economic growth. However, the variable is not significant.
Most of these countries has received structural adjustment loans that required these
countries to follow IMF guidelines to restructure their economies. The structural
adjustment programs were criticized as these restructures of the economies brought
negative consequences for the African countries. So, the fiscal policies failed to impact
35
economic growth of these countries as the Government of these countries failed to take
proper and corrective fiscal measures .
The financial repression measure represented by the Money variable, is not
significant and the coefficient size is close to zero, suggesting that financial repression or
liberalization is not an explanatory factor for economic growth.
As expected, inflation variable has a negative sign. Stable inflation is more
conducive to economic growth, whereas, high inflation is harmful for an economy. The
inflation variable is not statistically significant and the size of the coefficient is very small.
So, inflation is not a crucial explanatory factor contributing to economic growth in these
African countries. The sampled countries have widely dispersed inflation rates and those
with the high inflation rates are realizing slower economic growth for them.
Trade freedom of the African countries were measured using terms of trade (TOT)
and weighted openness (Wopen) . Both terms of trade (TOT) and weighted openness
(Wopen) are positive and statistically significant. However, the weighted openness term
bigger coefficients than those of the terms of trade. Trade openness is an important driving
force for economic growth. As noted by Levine and Renelt ( 1 992), trade openness
measures tend to show negligible but significant impact on economic growth and, they had
minimal impact on the other estimated parameters.
It is important to understand whether the impact of aid differs by income status. So,
the income status dummy was introduced to assess the aid effectiveness in different income
classes. The countries with low income status are the reference category. So, compared to
low income countries, being in the lower middle income class tends to have negative
impact on economic growth. However, being a country in the high income class tends to
36

increase economic growth. Only the lower middle and high income classes are significant
in explaining economic growth in the sampled countries.
Tables 7, 8 , and 9 provide the results of pooled, GLS and panel estimations of
Model II by income class of the sampled countries. Since most of the sampled countries
belong to low and middle-income countries and high income countries have greater access
to international markets and do not rely on foreign aids, the analysis is limited to those
countries.
Table 7: Pooled regression results of Model II by Income Status
Low-Income Countries Lower-Middle Upper-Middle Income Countries Income Countries
FAid 0.00000000646* 0 .0000000 1 37* -0 . 00000000586 (2 . 1 4) (2 .44) (-0.40)
PrivCap 0.625 5 .325 0 .0379
(0 .33) ( 1 . 1 3) (0 .03) (FAid)2 -0 .533 -0. 1 22 1 . 1 79
(- 1 .3 1 ) (-0.27) (0. 1 5) Saving 0.0296** 0 .0063 1 0 .0 1 3 8
(3 . 1 9) (0.26) ( 1 . 30) Other Inflow 0.0267 0.00262 0 .0433
( 1 .20) (0. 1 5) (0.75) BudSur 0. 1 29* 0.407*** 0 .045 1
(2 . 1 ) (3 .56) (0 . 35) Money -0.0224 -0.0000909 -0.008 1 5
(- 1 .35) (-0.47) (-0 .39) Inflation -0.000507* -0.0502* -0.0 1 22
(-2 .24) (- 1 .99) (-0 .35) TOT 0.0205 ** 0 .02 1 5 * * 0 .003 9 1
(3 .0 1 ) (2 .62) (0.27) Wopen 0.0432 0 .0627 0 .4902
(0.49) (0 . 88) ( 1 . 1 4) DebtSer -5 .934 -8 .5 -20 .38
(- 1 .56) (- 1 .43) (- 1 . 36) Cons -0 .425 0 .873 2 .477
(-0 . 82) (-0 .94) (- 1 .47) N 1 080 298 1 1 3 R2 0.52 0 .45 0 .42
t statistics in parentheses *** 1 %, **5% and * 1 0% significance level
37

The results in Table 7 yields similar implications as those in table 6 with some important
differences due to the income class. Foreign aid still has positive, statistically significant
but negligible impact on economic growth, for the low and lower-middle income countries .
Upper-middle income countries now show a negative but insignificant coefficient for
foreign aid supporting the expectation that aid is not helpful in case of securing sustained
economic growth for countries with upper-middle and/or high incomes. The quadratic aid
term is negative for the low and lower-middle income countries, whereas it is positive but
insignificant for upper-middle income countries. Upper-middle income countries seem to
have low reliance on foreign aid.
Saving continues to be an important factor for economic growth in case of low
income countries than in lower-middle and upper-middle income countries. Chenery and
Strout ( 1 966) developed the "dual-gap" model which argues that if labor skills and the
savings gap are binding, then investment limited growth will follow and, alternatively,
when the balance-of-payments constrain is binding, then foreign exchange limited growth
will follow. The model considers that the role of foreign aid is to remove either a saving or
balance-of-payments gap by an increased inflow of foreign or providing the necessary
foreign exchange. The difference in the significance of saving on economic growth among
these three relative income status groups may be due to low income countries having higher
marginal propensities to consume. In high-income countries, common basic needs have
been satisfied for most of their · citizens, and all the additional increments in income are
saved, resulting in higher marginal propensities to save. On the other hand, in a low-income
country, the basic needs cannot be fully satisfied, so additional increments of income go to
increase consumption, resulting in a higher marginal propensity to consume and a lower
38
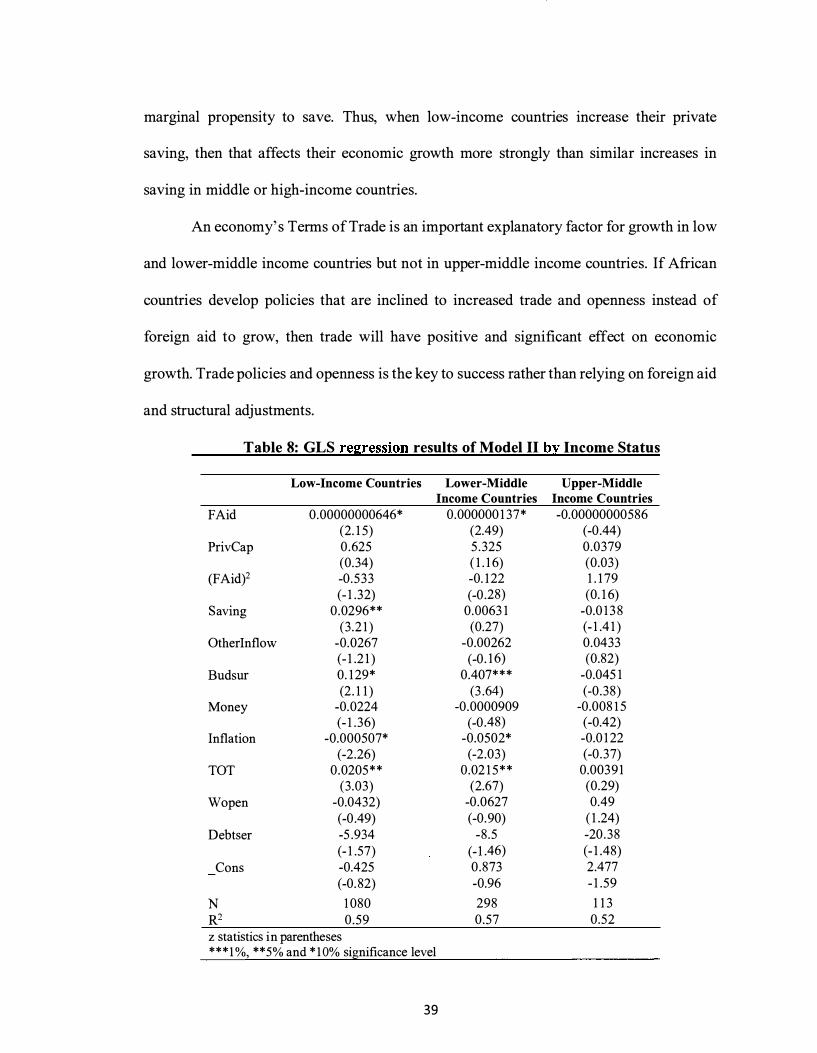
marginal propensity to save. Thus, when low-income countries increase their private
saving, then that affects their economic growth more strongly than similar increases in
saving in middle or high-income countries.
An economy' s Terms of Trade is ah important explanatory factor for growth in low
and lower-middle income countries but not in upper-middle income countries. If African
countries develop policies that are inclined to increased trade and openness instead of
foreign aid to grow, then trade will have positive and significant effect on economic
growth. Trade policies and openness is the key to success rather than relying on foreign aid
and structural adjustments.
Table 8: GLS regression results of Model II h:r Income Status
Low-Income Countries Lower-Middle Upper-Middle Income Countries Income Countries
FAid 0.00000000646* 0.000000 1 37* -0.00000000586 (2. 1 5) (2.49) (-0 .44)
PrivCap 0 .625 5 .325 0.0379 (0.34) ( 1 . 1 6) (0.03)
(FAid)2 -0 .533 -0. 1 22 1 . 1 79 (- 1 .32) (-0 .28) (0. 1 6)
Saving 0.0296** 0.0063 1 -0.0 1 3 8 (3 .2 1 ) (0.27) (- 1 .4 1 )
Other Inflow -0.0267 -0.00262 0.0433 (- 1 .2 1 ) (-0 . 1 6) (0.82)
Budsur 0. 1 29* 0.407* * * -0.045 1 (2 . 1 1 ) (3 .64) (-0 .38)
Money -0.0224 -0.0000909 -0.008 1 5 (- 1 .36) (-0 .48) (-0.42)
Inflation -0.000507* -0.0502* -0.0 1 22 (-2 .26) (-2 .03) (-0 .37)
TOT 0.0205 * * 0.02 1 5 * * 0.0039 1 (3 .03) (2.67) (0.29)
Wopen -0.0432) -0.0627 0.49 (-0 .49) (-0.90) ( 1 .24)
Debtser -5 .934 -8 .5 -20 .38 (- 1 .57) (- 1 .46) (- 1 .48)
Cons -0.425 0 .873 2.477 (-0. 82) -0.96 - 1 .59
N 1 080 298 1 1 3 Rz 0.59 0.57 0.52 z statistics in parentheses *** 1 %, **5% and * 1 0% significance level
39
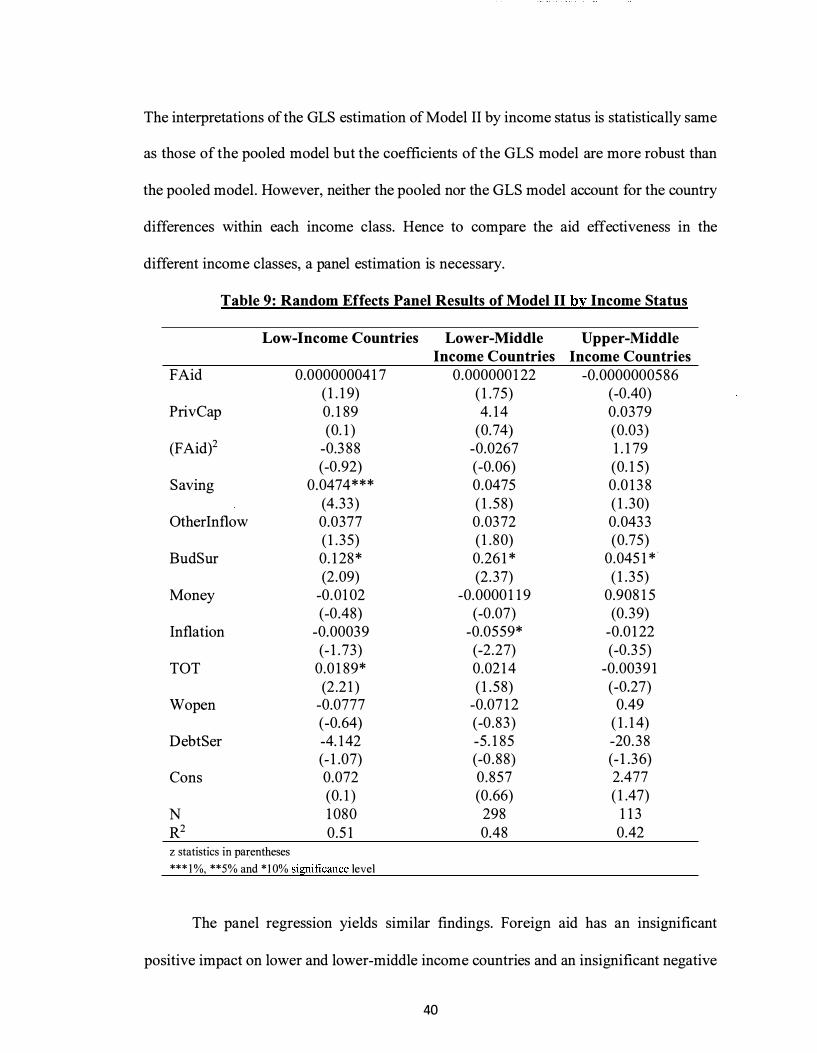
The interpretations of the GLS estimation of Model II by income status is statistically same
as those of the pooled model but the coefficients of the GLS model are more robust than
the pooled model. However, neither the pooled nor the GLS model account for the country
differences within each income class. Hence to compare the aid effectiveness in the
different income classes, a panel estimation is necessary.
Table 9: Random Effects Panel Results of Model II by Income Status
Low-Income Countries Lower-Middle Upper-Middle Income Countries Income Countries
FAid 0.000000041 7 0 . 000000 1 22 -0.0000000586 ( 1 . 1 9) ( 1 .75) (-0 .40)
PrivCap 0. 1 89 4. 1 4 0.0379 (0. 1 ) (0.74) (0.03)
(FAid)2 -0.3 88 -0.0267 1 . 1 79 (-0 .92) (-0.06) (0. 1 5)
Saving 0.0474*** 0 .0475 0 .0 1 3 8 (4 .33) ( 1 . 58) ( 1 . 30)
Other Inflow 0.0377 0 .0372 0 .0433 ( 1 . 35) ( 1 . 80) (0.75)
BudSur 0. 1 28 * 0.26 1 * 0 .045 1 * " (2 .09) (2 .37) ( 1 . 35)
Money -0 .0 1 02 -0.0000 1 1 9 0.908 1 5 (-0 .48) (-0 .07) (0 .39)
Inflation -0.00039 -0.0559* -0.0 1 22 (- 1 . 73) (-2 .27) (-0.3 5)
TOT 0.0 1 89* 0 .02 1 4 -0.0039 1 (2 .2 1 ) ( 1 . 58) (-0.27)
Wopen -0.0777 -0.07 1 2 0.49 (-0.64) (-0 .83) ( 1 . 1 4)
DebtSer -4. 1 42 -5 . 1 85 -20. 38 (- 1 .07) (-0 . 88) (- 1 .36)
Cons 0.072 0 .857 2.477 (0. 1 ) (0 .66) ( 1 .47)
N 1 080 298 1 1 3 R2 0.5 1 0.48 0.42 z statistics in pai:entheses *** I %, **5% and * I 0% significance level
The panel regression yields similar findings. Foreign aid has an insignificant
positive impact on lower and lower-middle income countries and an insignificant negative
40
effect for upper-middle income countries. Also, the aid-growth relationship is non-linear
in case of lower and lower-middle income countries but in case of upper-middle income
countries the relationship does not seem non-linear. Trade and saving continue to be an
important factor for lower income countries while Trade is important factor for lower
middle income countries. Having a budget surplus tends to be effective in having a positive
impact on economic growth. Budget surplus implies effective fiscal policies and if African
countries develop and implement effective fiscal policies then that can lead to sustained
economic growth. Finally, financial repression, measured by Money supply shows that for
the lower and lower-middle income countries, money supply is negative whereas for upper
middle income countries, money supply is positive explanatory factor for economic
growth.
4.1.3 Model III
Model III introduces freedom and two policy variables to assess if policy affects the aid
growth relationship. The freedom variable, "Freedom" is a measure of economic and
regulatory freedom. The policy variable, "Policy" is an index that incorporates various
policy variables. These two variables are introduced in the pooled, GLS and panel
regressions along with policy interacted with the Faid variable to assess if policy has any
moderating effect on the aid-growth relationship. Table 1 0 presents the results of model III
estimated using the pooled, GLS and panel regressions.
41
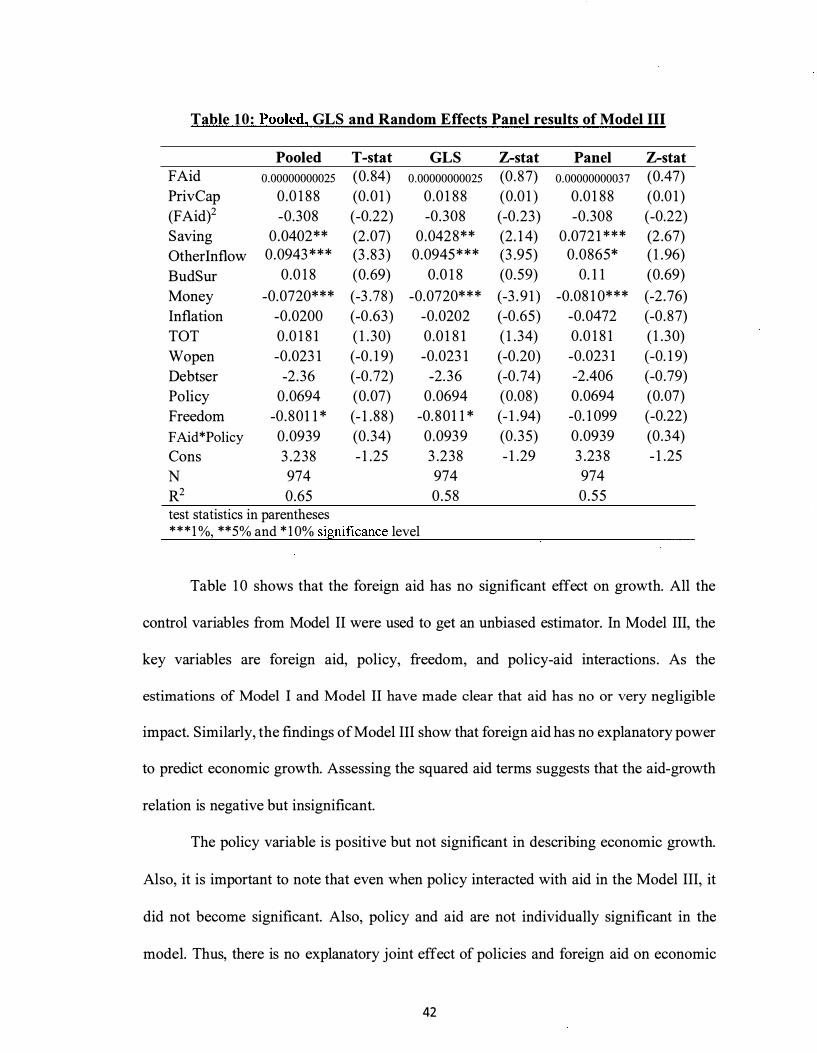
Table 10 : Pooled, GLS and Random Effects Panel results of Model III
Pooled T-stat GLS Z-stat Panel Z-stat FAid 0.00000000025 (0. 84) 0.00000000025 (0 . 87) 0.00000000037 (0.47) PrivCap 0.0 1 88 (0.0 1 ) 0 .0 1 88 (0.0 1 ) 0 .0 1 88 (0.0 1 )
(FAid)2 -0 .308 (-0.22) -0 .308 (-0 .23) -0 .308 (-0.22) Saving 0.0402** (2 .07) 0 .0428** (2 . 1 4) 0 .072 1 * ** (2 .67)
Otherlnflow 0.0943 *** (3 .83) 0 .0945 *** (3 .95) 0 .0865* ( 1 .96)
BudSur 0.0 1 8 (0.69) 0.0 1 8 (0 .59) 0. 1 1 (0.69)
Money -0.0720*** (-3 .78) -0.0720*** (-3 . 9 1 ) -0.08 1 0*** (-2 .76)
Inflation -0.0200 (-0 .63) -0.0202 (-0 .65) -0.0472 (-0 . 87)
TOT 0.0 1 8 1 ( 1 . 30) 0 .0 1 8 1 ( 1 .34) 0.0 1 8 1 ( 1 . 30)
Wopen -0.023 1 (-0 . 1 9) -0.023 1 (-0 .20) -0.023 1 (-0. 1 9)
Debtser -2 .36 (-0 .72) -2 .36 (-0 .74) -2 .406 (-0 .79)
Policy 0.0694 (0.07) 0 .0694 (0.08) 0.0694 (0.07)
Freedom -0 . 801 1 * (- 1 . 88) -0. 80 1 1 * (- 1 .94) -0. 1 099 (-0.22)
F Aid*Policy 0 .0939 (0 .34) 0 .093 9 (0 . 35) 0 .0939 (0 .34)
Cons 3 .238 - 1 .25 3 .238 - 1 .29 3 .23 8 - 1 .25
N 974 974 974
R2 0.65 0 .58 0 .55 test statistics in parentheses * ** 1 %, **5% and * 1 0% significance level
Table 1 0 shows that the foreign aid has no significant effect on growth. All the
control variables from Model II were used to get an unbiased estimator. In Model III, the
key variables are foreign aid, policy, freedom, and policy-aid interactions. As the
estimations of Model I and Model II have made clear that aid has no or very negligible
impact. Similarly, the findings of Model III show that foreign aid has no explanatory power
to predict economic growth. Assessing the squared aid terms suggests that the aid-growth
relation is negative but insignificant.
The policy variable is positive but not significant in describing economic growth.
Also, it is important to note that even when policy interacted with aid in the Model III, it
did not become significant. Also, policy and aid are not individually significant in the
model. Thus, there is no explanatory joint effect of policies and foreign aid on economic
42
growth. So, we cannot conclude that better policies associated with better management of
foreign aid will be inductive to economic growth and ineffective policies will result in poor
management of foreign aid that in turn will lead to lower economic growths and debt
burdens on the country. Also, the freedom variable is negative and significant in pooled
and GLS but insignificant in panel estimations. It can be argued that due to the prominence
of corrupted policies in the sampled African countries, economic and trade freedom could
not achieve its intended goals. So, both policy and economic freedom aspects of these
African countries failed to impact economic development at an expected level because of
the high reliance on foreign aid and haphazard structural adjustments.
Two important questions arise from the above analysis. The first one is whether
economic growth is a function of both the level of aid and the level of policies. To answer
this question another interaction term is introduced in estimating the Model III. The
interaction term between policy and the quadratic aid term is included in the Model III.
Table 1 1 depicts the pooled, GLS and Panel estimation of the model.
43
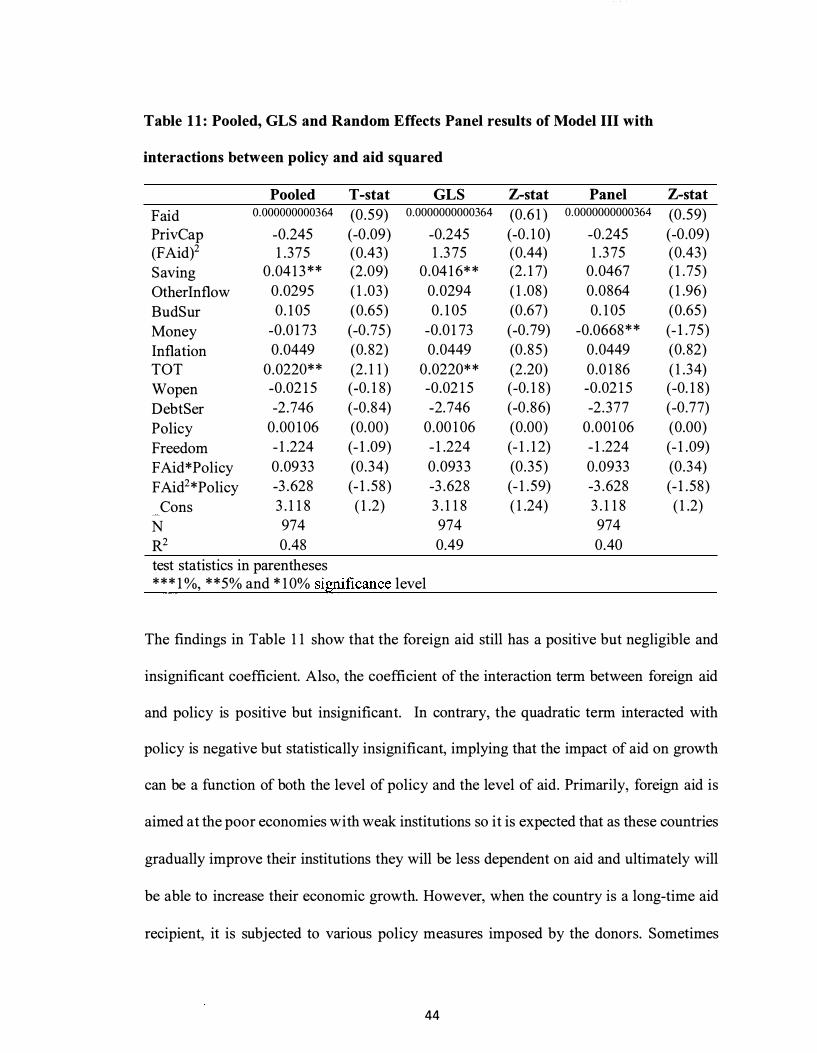
Table 1 1: Pooled, GLS and Random Effects Panel results of Model III with
interactions between policy and aid squared
Pooled T-stat GLS Z-stat Panel Z-stat
Paid 0.000000000364 (0 .59) 0.0000000000364 (0.6 1 ) 0.0000000000364 (0 .59)
PrivCap -0.245 (-0 .09) -0.245 (-0 . 1 0) -0.245 (-0 .09) (FAid)2 1 .375 (0.43) 1 .3 75 (0.44) 1 .375 (0.43)
Saving 0 .04 1 3 ** (2 .09) 0 .04 1 6* * (2 . 1 7) 0 .0467 ( 1 . 75)
Other Inflow 0.0295 ( 1 .03) 0 .0294 ( 1 .08) 0 .0864 ( 1 .96)
BudSur 0 . 1 05 (0.65) 0 . 1 05 (0 .67) 0. 1 05 (0.65)
Money -0.0 1 73 (-0 .75) -0.0 1 73 (-0 .79) -0.0668* * (- 1 .75)
Inflation 0 .0449 (0. 82) 0 .0449 (0 . 85) 0 .0449 (0. 82)
TOT 0 .0220** (2 . 1 1 ) 0 .0220* * (2 .20) 0 .0 1 86 ( 1 .34)
Wopen -0.02 1 5 (-0. 1 8) -0.02 1 5 (-0. 1 8) -0.02 1 5 (-0. 1 8)
DebtSer -2 .746 (-0.84) -2.746 (-0 . 86) -2 .377 (-0.77)
Policy 0 .00 1 06 (0.00) 0 .00 1 06 (0.00) 0 .001 06 (0.00)
Freedom - 1 .224 (- 1 .09) - 1 .224 (- 1 . 1 2) - 1 .224 (- 1 .09)
F Aid*Policy 0 .0933 (0 .34) 0 .0933 (0 .35) 0.0933 (0 .34)
F Aid2*Policy -3 .628 (- 1 . 58) -3 .628 (- 1 . 59) -3 .628 (- 1 . 58)
Cons 3 . 1 1 8 ( 1 .2) 3 . 1 1 8 ( 1 .24) 3 . 1 1 8 ( 1 .2)
N 974 974 974
R2 0.48 0.49 0.40
test statistics in parentheses * * * 1 %, * *5% and * 1 0% significance level
The findings in Table 1 1 show that the foreign aid still has a positive but negligible and
insignificant coefficient. Also, the coefficient of the interaction term between foreign aid
and policy is positive but insignificant. In contrary, the quadratic term interacted with
policy is negative but statistically insignificant, implying that the impact of aid on growth
can be a function of both the level of policy and the level of aid. Primarily, foreign aid is
aimed at the poor economies with weak institutions so it is expected that as these countries
gradually improve their institutions they will be less dependent on aid and ultimately will
be able to increase their economic growth. However, when the country is a long-time aid
recipient, it is subjected to various policy measures imposed by the donors. Sometimes
44

those policy measures are not suitable or beneficial . So, even after receiving aid these
countries cannot grow.
Apart from the severe policy restructures imposed by the donors, some countries
may prefer to receive aid as its government consider aid to be an easy source of revenue.
Abuzeid (2009) argued that aid distorts the reforms of incentive structure for public actors,
and may therefore delay pressures for institutional reform. Aid creates a moral hazard issue
for the recipient country and the country faces a soft budget constraint in the form of aid.
If a country' s government is too reliant on foreign aid, then it always views foreign aid as
a way out when things go wrong.
Also, Abuzeid (2009) pointed out that whenever the government run into a budget
crisis, it attempts to negotiate foreign aid. Since the accountability of the government to
the taxpayers in recipient countries is weak, the government is under no pressure to reflect
proper application of fiscal discipline and sound judgment. For these countries, foreign aid
serves as insurance and hampers the search for alternative revenue sources through wise
policies that encourage self-sustaining investments. Leaders tend to make risky, even
reckless decisions when they are under pressure and aid might be viewed as a temporary
solution that can yield short term results. Unfortunately, as the results of this study suggest,
for the African countries, foreign aid is not an answer to their growth questions. Instead
too much reliance on the foreign aid by these African nations are causing harm to their
economic and institutional structures leading to persistent lower economic growth.
It is important to assess the impact of policy on aid-growth relationship. To check
robustness of the previous findings and any biasness due to using a proxied policy variable,
two variations of the Model III were estimated. In these variations, the relationship among
45

aid, policy, and economic growth is studied without controlling for the other variables
following Rajan and Subramanian (2005) . Also, for these variations, the policy variable is
measured using both the Sachs-Warner measure ( 1 995) updated by Warcziarg and Welch
(2003), and the World Bank's CPIA ratings. Table 1 2 and 1 3 present the results of these
estimations using pooled, GLS, and panel analyses.
Table 12: Pooled, GLS, and Random Effects Panel estimations of the impact of
policies on aid-growth relationship
Pooled T-stat GLS Z-stat Panel Z-stat FAid 0 .0000000 1 13 *** (3 .99) 0 .0000000 1 13 *** (4.00) 0 .0000000 1 1 6*** (3 . 89)
(FAid)2 -2 .6366 (-0.90) -2 .6366 (- 1 .56) -4.6 1 58 *** (-2 .66) Policy_ Index 0.09524 ( 1 .50) 0.09524 ( 1 .50) 0 .0833 ( 1 .3 1 )
Cons 1 .906* * * (4.34) 1 .906* * * (4.34) 1 .906* * * (4 .34)
N 1 077 1 077 1 077
R1 0 .56 0.52 0 .58 Test statistics in parentheses *** 1 %, **5% and * 1 0% significance level
The results on Table 1 2 shows that the findings are similar to those found in Table
1 0 . Foreign aid still has a small positive impact with a negative squared term. That suggests
the non-linear relationship between aid and economic growth and aid has a diminishing
return for the sampled countries. Table 1 0 also reports the same sign for foreign aid and
squared term for foreign aid but then the coefficients were insignificant. It is important to
note that using Sachs-Warner measure of policy index, updated by W arcziarg and Welch
(2003) did not seem to affect growth. The coefficient of the policy index is positive and
insignificant similar to that of Table 1 0 so, policies do not have any substantial effect on
economic growth for the African countries.
46
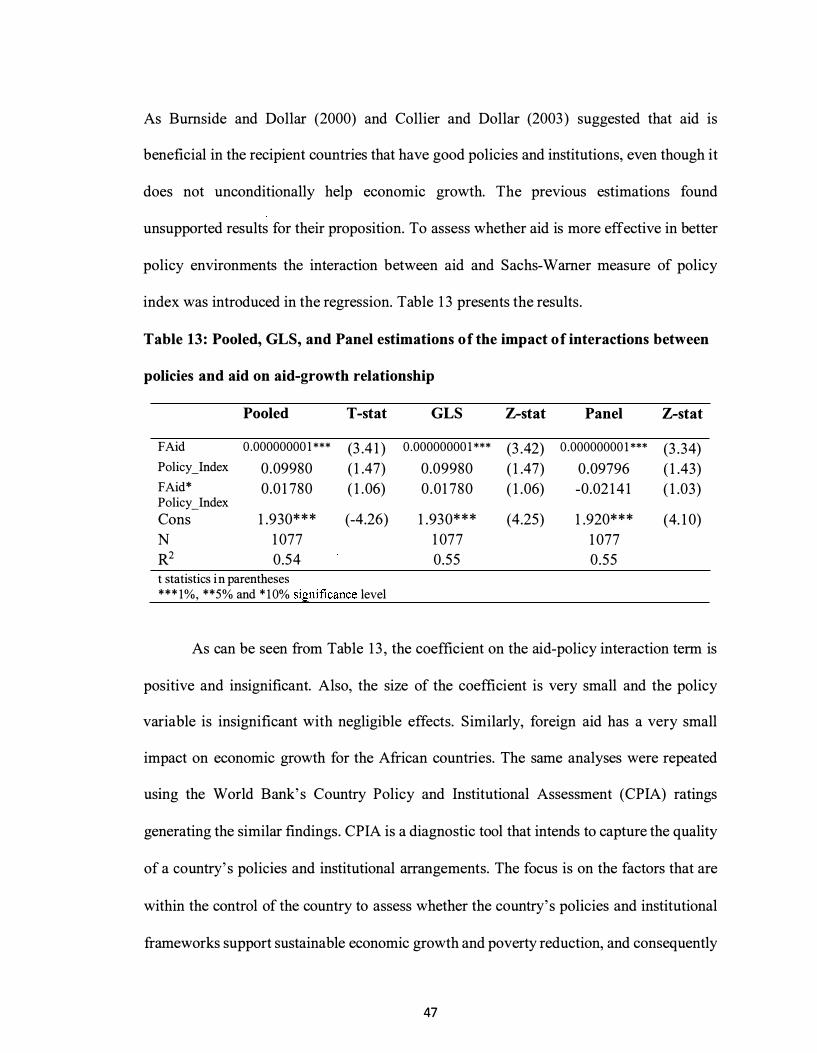
As Burnside and Dollar (2000) and Collier and Dollar (2003) suggested that aid is
beneficial in the recipient countries that have good policies and institutions, even though it
does not unconditionally help economic growth. The previous estimations found
unsupported results for their proposition. To assess whether aid is more effective in better
policy environments the interaction between aid and Sachs-Warner measure of policy
index was introduced in the regression. Table 1 3 presents the results.
Table 13: Pooled, GLS, and Panel estimations of the impact of interactions between
policies and aid on aid-growth relationship
Pooled T-stat GLS Z-stat Panel Z-stat
FAid 0 .00000000 1 *** (3 .4 1 ) 0 .00000000 1 *** (3 .42) 0 .00000000 1 *** (3 .34) Policy_Index 0.09980 ( 1 .47) 0.09980 ( 1 .47) 0 .09796 ( 1 .43) FAid* 0.0 1 780 ( 1 .06) Policy _Index
0 .01 780 ( 1 .06) -0.02 1 4 1 ( 1 .03)
Cons 1 .930* * * (-4.26) 1 .930* * * (4.25) 1 .920*** (4. 1 0)
N 1 077 1 077 1 077
R2 0.54 0.55 0 .55 t statistics in parentheses *** 1%, **5% and * 1 0% significance level
As can be seen from Table 1 3 , the coefficient on the aid-policy interaction term is
positive and insignificant. Also, the size of the coefficient is very small and the policy
variable is insignificant with negligible effects. Similarly, foreign aid has a very small
impact on economic growth for the African countries. The same analyses were repeated
using the World Bank' s Country Policy and Institutional Assessment (CPIA) ratings
generating the similar findings. CPIA is a diagnostic tool that intends to capture the quality
of a country' s policies and institutional arrangements. The focus is on the factors that are
within the control of the country to assess whether the country' s policies and institutional
frameworks support sustainable economic growth and poverty reduction, and consequently
47
lead to the effective utilization of development assistance provided to the country. The
CPIA score is a scaled score on a scale of 1 (low) to 6 (high), consisting of sixteen criteria
grouped under four clusters. These ratings are normally calculated and published by World
Bank. The results are presented in Appendix IV.
From these additional analyses, it is evident that for the sampled African nations,
foreign aid has minimal positive effect on economic growth. Also, foreign aid seems to
have diminishing returns for the countries receiving foreign aid over a long period. The
underlying policy variables, using three measurements, also seem to have positive but
negligible impact. The coefficient of interaction term between policy and foreign aid is not
significant in any of the estimations. Also, the impact of the interaction term on economic
growth is always minimal or negligible. So, better policies will always result in better aid
management is not supported in these estimations using data from African countries.
48

Chapter 5
Conclusion
This thesis presents in one place, using three frameworks, the findings on the different
aspects of the aid-growth relationship in African economies, employing pooled, GLS, and
panel contexts. The central conclusion of the findings of the estimations is that there is a
negligible positive impact of foreign aid on economic growth and receiving aid for a longer
time-period hurts the associated countries and the relationship between aid and economic
growth is non-linear. Foreign aid has diminishing returns and countries that are too reliant
on foreign aid will face detrimental effects of foreign aid.
Foreign aid flows from developed to developing countries seem like relief to the
plights of the people in developing countries. However, the influx of burdensome amounts
of foreign aid can have deleterious effects on aid-recipient countries and can end up doing
more harm than good in various circumstances. Given that Africa is the largest recipient of
foreign aid, it is crucial to understand whether this foreign aid is adding any boost these
countries economic growth.
The results of the estimations show that even though the effect of foreign aid on
economic growth is positive and significant, the magnitude of the benefit of foreign aid is
very small, which suggest that foreign aid does not result in drastic increases in economic
growth. The interesting point to note is the non-linear relationship between aid and
economic growth.
Foreign aid has diminishing returns as the volume. of aid increases. The non-linear
relationship between aid and economic growth was not investigated prior to the mid- 1 990s.
Since the 1 990s the majority of researchers have found a non-linear relationship between
49
foreign aid and economic growth. This non-linearity is existent in the sample African
countries too.
The theorists who argue that foreign aid can lead to higher economic growth argue
that aid augments saving, finances investment, and adds to the capital stock. So, the low
income countries that are unable to save sufficient amounts to finance investment will not
be able to initiate growth, or at best can initiate only very slow growth. This is where the
essence of financing gap model can explain the aid-ineffectiveness for the low-income
countries : the low-income countries are supposed to use the aid to augment investment but
instead these countries tend to use aid for debt servicing.
The poor countries ' governments are often under huge debt burden so whenever
they receive aid, they tend to service their debts and thus the inflows of foreign aid never
get into the channels to facilitate growth. This scenario holds true even under the
assumption of fiscal discipline and sound judgment by the government of the recipient
countries. The countries might have strong fiscal and monetary policies and strong
institutional quality but foreign aid still fails to do any good as it is diverted away from the
investment.
However, the scenario is not simple. Most recipient country governments abuse
foreign aid. Aid induces an increase in the size of the government sector that indirectly
harms governance, thereby increasing the opportunities for corruption. The corrupted
government and leaders view foreign aid as a quick solution that can, at best, yield quick
positive short-term results, but are ultimately not in the best interests of the countries in
terms of economic development. Foreign aid also increases rent-seeking and lobbying
activities that are harmful for the economic development.
so
Lane and Tomell ( 1 998) pointed out that in an economy with powerful groups but weak
institutions, as is the case in many African countries, the intensified lobbying and rent
seeking activities that followed a resource windfall has caused a more than proportional
increase in redistribution. This is called the voracity effect which results in lower rates of
returns to the investment and a net social loss.
Some recipient countries tend to take foreign aid for granted which result in moral
hazards for the recipient countries. Also, in pursuit of higher foreign aid, the recipient
countries sometimes agree to undertake drastic changes in its fiscal and monetary policies
and alterations in its institutions. Such changes sometimes become harmful as either the
country is not ready for implementing such policies or the policies are not suitable for the
countries. Under either circumstance, the country is bound to face negative consequences
associated with foreign aid.
To sum up, there are two important implications of the findings of this thesis. First,
it shows that foreign aid is not as beneficial as it is perceived to be for the African
economies. Most of the African countries who are long time aid recipients are likely to
have suffered due to their high reliance on foreign aid. Also, the measure and structural
adjustments that these countries undertook according to the guidelines of the donors seem
to do little in fostering their economic growth. Second, better policies do not necessarily
always bring better results from aid. Even though the aid recipients have better fiscal and
monetary policies, aid can still be detrimental if the recipients take foreign aid for granted
and a short-term solution to service debt. The aid apparatus in terms of how, to whom,
under what conditions, and in what form the aid will be delivered to the recipients needs to
reevaluated if a country wants to positively affect its aid-economic growth relationship.
5 1
Also, it should be stressed that the findings of this thesis are based on past performance of
the recipient countries, do not imply that aid cannot be beneficial in the future for the
African nations. These findings propose that for aid to be effective, the recipient nations
need to rethink how and where the foreign aid can be used to facilitate economic growth
and the extent to which they will depend and rely on foreign aid.
52

References
Abuzeid, F . (2009) . Foreign Aid and the" Big Push" Theory: Lessons from Sub-Saharan
Africa. Stanford Journal of international relations, 1 1 ( 1 ) , 1 6-23 .
Addison, T . , Mavrotas, G. , & McGillivray, M. (2005) . Development assistance and
development finance: evidence and global policy agendas . Journal of International
Development, 1 7(6), 8 1 9-836 .
Barro, R. J . ( 1 99 1 ) . A cross-country study of growth, saving, and government. In National
saving and economic pe1formance (pp. 27 1 -304). University of Chicago Press.
Barro, R. J. and Sala-i-Martin, X. ( 1 995) . Economic Growth.
Brautigam, D . A. , & Knack, S . (2004) . Foreign aid, institutions, and governance in sub
Saharan Africa. Economic development and cultural change, 52(2), 255-2 8 5 .
Boone, P . ( 1 996) . Politics and the effectiveness of foreign aid. European economic review,
40(2), 289-329.
Burnside, A. C. , & Dollar, D . ( 1 997) . Aid, policies, and growth. World Bank policy
research working paper, (569252) .
Burnside, C . , & Dollar, D . (2000) . Aid, grovvth, the incentive regime, and poverty
reduction. The World Bank: Structure and Policies, 3, 2 1 0.
Chenery, H . B . , and Strout, A. M. ( 1 966) . Foreign assistance and economic
development. The American Economic Review, 56(4) , 679-733 .
Collier, P . , & Dollar, D . (2002) . Aid allocation and poverty reduction. European Economic
Review, 46(8) , 1 475-1 500 .
Dalgaard, C . J . , Hansen, H . , & Tarp, F . (2004) . On the empirics of foreign aid and growth.
The Economic Journal, 1 14(496), F 1 9 1 -F2 1 6 .
53
Doucouliagos, H., & Paldam, M. (20 1 0) . Conditional aid effectiveness : A meta-study.
Journal oflnternational Development, 22(4), 39 1 -4 1 0 .
Dowling, M., & Hiemenz, U. ( 1 982) . Aid, Saving and Growth in the Asian Region.
Economic Office Report Series 3, Asian Development Bank: Manila.
Durbarry, R., Gemmell, N. , & Greenaway, D. ( 1 998) . New evidence on the impact of
foreign aid on economic growth. Nottingham: Centre for Research in Economic
Development and International Trade, University of Nottingham.
Easterly, W., and Rebelo, S . ( 1 993) . Fiscal policy and economic growth. Journal of
monetary economics, 32(3) , 4 1 7-458 .
Easterly, W . (2003) . Can foreign aid buy growth? The journal of economic perspectives,
1 7(3), 23-48 .
Easterly, W. , Levine, R. and Roodman D. (200 1 ), Aid, policies, and growth: comment,
American Economic Review, 94, 774-780.
Ekanayake, E., and Dasha, C. (2009) . The Effect of Foreign Aid on Economic Growth in
Developing Countries. Journal of international Business and cultural studies.
Fischer, S . ( 1 993) . The role of macroeconomic factors in growth. Journal of moneta1y
economics, 32(3 ) , 485-5 1 2 .
Feeny, S . and M. McGillivray (2008), Aid allocation to fragile states : absorptive capacity
constraints, Journal of International Development, 20(7), 1 03 1 - 1 050.
Gomanee, K., Girma, S. , & Morrissey, 0. (2003) . Aid and Growth in Sub-Saharan Africa.
Journal of International Development, 1 7(8), 1 055- 1 05 . .
Griffin, K.B . ( 1 970) . Foreign capital, Domestic saving and Economic development, Oxford
University Institute of Economics and Statistics, 32, 99- 1 12 .
54

Griffin, K. B . , and Enos, J . L. ( 1 970). Foreign Assistance: Objectives and Consequences.
Economic development and cultural change, 18(3) , 3 1 3-327 .
Gupta, K. L. ( 1 975) . Foreign capital inflows, dependency burden, and saving rates in
developing countries : A simultaneous equation model. Kyklos, 28(2), 358 -374.
Gupta, K. L. and M. A. Islam ( 1 983), Foreign Capital, Saving and Growth-An
International Cross-Section Study, Reidel Publishing Company: Dordrecht.
Hadjimichael M.T. , Ghura, D. , Miihleisen, M., Nord, R. and U9er, E.M. ( 1 995) "Sub
Saharan Africa: growth, saving, and investment, 1 986-93", Occasional Paper 1 1 8,
International Monetary Fund.
Hansen, H. , & Tarp, F. (2000) . Aid effectiveness disputed. Foreign Aid and Development:
Lessons Learnt and Directions for the Future, 1 03 - 1 28 .
Hansen, H . , & Tarp, F . (200 1 ) . Aid and growth regressions. Journal of development
Economics, 64(2) , 547-570.
Hudson, J . (2004) . Introduction: Aid and development. The Economic Journal, 1 1 4(496) ,
F 1 85-F 1 90 .
Jensen, P . S . , Paldam, M (2003) . Can the New Aid-Growth Models Be Replicated?,
Working Paper No.2003-1 7, Institute for Economics : Aarhus.
Karras, G. (2006) . Foreign aid and long-run economic growth: empirical evidence for a
panel of developing countries. Journal of International Development, 18( 1 ) , 1 5-28 .
Kormendi, R . C . , & Meguire, P . G. ( 1 985) . Macroeconomic determinants o f growth: cross
country evidence. Journal of Monetary economics, 1 6(2) , 1 4 1 - 1 63 .
Tomell, A., and Lane, P . R. ( 1 998) . Voracity and growth. National bureau o f economic
research, No . w6498
55

Levine, R. , and Renelt, D. ( 1 992) . A Sensitivity Analysis of Cross-Country Growth
Regressions . American Economic Review, LXXXII, 942-963 .
Levy, V. ( 1 988) . Aid and growth in Sub-Saharan Africa: The recent experience. European
Economic Review, 32(9), 1 777- 1 795 .
McGillivray, M. , Feeny, S . , Hermes, N., & Lensink, R. (2006) . Controversies over the
impact of development aid : it works; it doesn't; it can, but that depends . . . . Journal
of International Development, 1 8(7), 1 03 1 - 1 050.
Morrissey, 0. (200 1 ) . Does aid increase growth? . Progress in Development Studies, 1 ( 1 ) ,
3 7-50 .
Mosley, P . ( 1 980) . Aid, saving and growth revisited. Oxford Bulletin of Economics and
Statistics, 42(2), 79-95.
Mosley, P. , Hudson, J . , & Horrell, S . ( 1 987) . Aid, the public sector and the market in less
developed countries. The Economic Journal, 9 7(3 87) , 6 1 6-64 1 . ·
Organisation for Economic Co-operation and Development (Paris) . (2008) . OECD
Factbook 2009: Economic, Environmental and Social Statistics . OECD,
Organisation for Economic Co-operation and Development.
Ouattara, B . (2006) . Foreign aid and government fiscal behaviour in developing countries :
Panel data evidence. Economic Modelling, 23(3 ), 506-5 1 4 .
Papanek, G. F . ( 1 973 ) . The effect of aid and other resource transfers on saving and growth
in less developed countries. The Economic Journal, 82(327), 934-950.
Quartey, P . (2005) . Innovative ways of making aid effective in Ghana: tied aid versus direct
budgetary support. Journal of international development, 1 7(8) , 1 077- 1 092.
56
Ram, R. (2004) . Recipient country's 'policies' and the effect of foreign aid on economic
growth in developing countries : additional evidence. Journal of International
Development, 1 6(2), 20 1 -2 1 1 .
Raj an, R. G., & Subramanian, A. (2005) . A id and growth: What does the cross-country
evidence really show? (No . w l 1 5 1 3) . National Bureau of Economic Research.
Sachs, J. D. , Warner, A. , Aslund, A., and Fischer, S. ( 1 995) . Economic reform and the
process of global integration. Brookings papers on economic activity, 1995( 1 ), 1 -
1 1 8 .
Singh, R. D . ( 1 985) . State intervention, foreign economic aid, saving and growth in LDCs:
Some recent evidence. Kyklos, 38(2), 2 1 6-232 .
Tavares, J . (2003) . Does foreign aid corrupt? Economics Letters, 79( 1 ) , 99- 1 06 .
Wacziarg, R. , and Welch, K. H. (2008) . Trade liberalization and growth: New
evidence. The World Bank Economic Review, 22(2), 1 87-23 1 .
World Bank ( 1 989). Adjustment Lending: An Evaluation of Ten Years or Experience.
Policy and Research Series Paper 1 .
Voivodas, C. S . ( 1 973) . Exports, foreign capital inflow and economic growth. Journal of
International Economics, 3(4) , 3 37-349.
57
A
Algeria
Angola
B
Benin
Botswana
Burkina Faso
Burundi
c
Caho Verde
Cameroon
Central African
Republic (CAR)
Chad
Comoros
Congo, Democratic
Republic of the
Congo, Republic of
the
Cote d'Ivoire
D
Djibouti
E
Egypt
Equatorial Guinea
Eritrea
Ethiopia
Appendix I
Alphabetical list of countries in Africa
G
Gabon
Gambia
Ghana
Guinea
Guinea-Bissau
K
Kenya
L
Lesotho
Liberia
Libya
M
Madagascar
Malawi
Mali
Mauritania
Mauritius
Morocco
Mozambique
N
Namibia
Niger
Nigeria
R
Rwanda
58
� Sao Tome and
Principe
Senegal
Seychelles
Sierra Leone
Somalia
South Africa
South Sudan
Sudan
Swaziland
T
Tanzania
Togo
Tunisia
u
Uganda
z
Zambia
Zimbabwe

Income Status of the Countries in Africa
Country Income Status Low Lower-Middle Unner-Middle Rich Total
Algeria 27 7 1 0 35 Angola 23 6 0 0 29 Benin 36 0 0 0 36 Botswana 24 5 7 0 36 Burkina Faso 36 0 0 0 36 Burundi 36 0 0 0 36 Caho Verde 32 1 0 0 33 Cameroon 36 0 0 0 36 Central African Republican 36 0 0 0 36 Chad 36 0 0 0 36 Comoros 33 0 0 0 33 Congo, Dem. Rep. 23 0 0 0 23 Congo, Rep. 36 0 0 0 36 Cote d'Ivoire 36 0 0 0 36 Dj ibouti 1 4 0 0 0 1 4 Egypt, Arab Rep. 36 0 0 0 36 Equatorial Guinea 23 1 6 4 34 Eritrea 1 8 0 0 0 1 8 Ethiopia 33 0 0 0 33 Gabon 4 2 1 1 1 0 36 Gambia 35 0 0 0 35 Ghana 36 0 0 0 36 Guinea 28 0 0 0 28 Guinea-Bissau 36 0 0 0 36 Kenya 36 0 0 0 36 Lesotho 35 0 0 0 35 Liberia 29 0 0 0 29 Libya 0 4 5 4 1 3 Madagascar 36 0 0 0 36 Malawi 36 0 0 0 36 Mali 36 0 0 0 36 Mauritania 35 0 0 0 35 Mauritius 1 6 1 0 1 0 0 36 Morocco 36 0 0 0 36 Mozambique 34 0 0 0 34 Namibia 24 8 2 0 34 Niger 36 0 0 0 36 Nigeria 35 0 0 0 35 Rwanda 36 0 0 0 36 Sao Tome and Principe 1 2 0 0 0 1 2 Senegal 36 0 0 0 36 Seychelles 8 4 1 5 9 36 Sierra Leone 36 0 0 0 36 South Africa 19 7 1 0 0 36
59

Country Income Status Low Lower-Middle Upper-Middle Rich Total
South Sudan 6 0 0 0 6 Sudan 36 0 0 0 36 Swaziland 24 2 0 0 26 Tanzania 26 0 0 0 26 Togo 36 0 0 0 36 Tunisia 27 9 0 0 36 Uganda 32 0 0 0 32 Zambia 36 0 0 0 36 Zimbabwe 36 0 0 0 36 Total 1 543 85 67 1 7 1 7 1 2
60
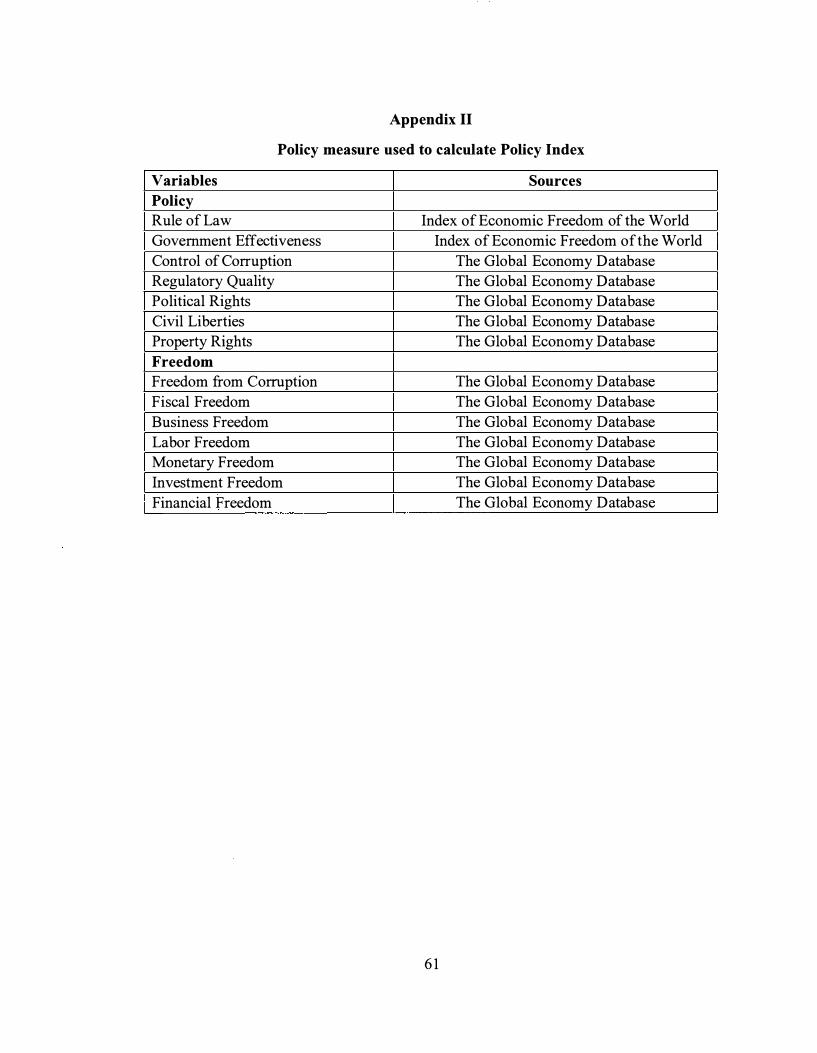
Appendix II
Policy measure used to calculate Policy Index
Variables Sources Policy Rule of Law Index of Economic Freedom of the World
Government Effectiveness Index of Economic Freedom of the World
Control of Corruption The Global Economy Database
Regulatory Quality The Global Economy Database
Political Rights The Global Economy Database
Civil Liberties The Global Economy Database
Property Rights The Global Economy Database
Freedom Freedom from Corruption The Global Economy Database
Fiscal Freedom The Global Economy Database
Business Freedom The Global Economy Database
Labor Freedom The Global Economy Database
Monetary Freedom The Global Economy Database
Investment Freedom The Global Economy Database
Financial Freedom The Global Economy Database
6 1
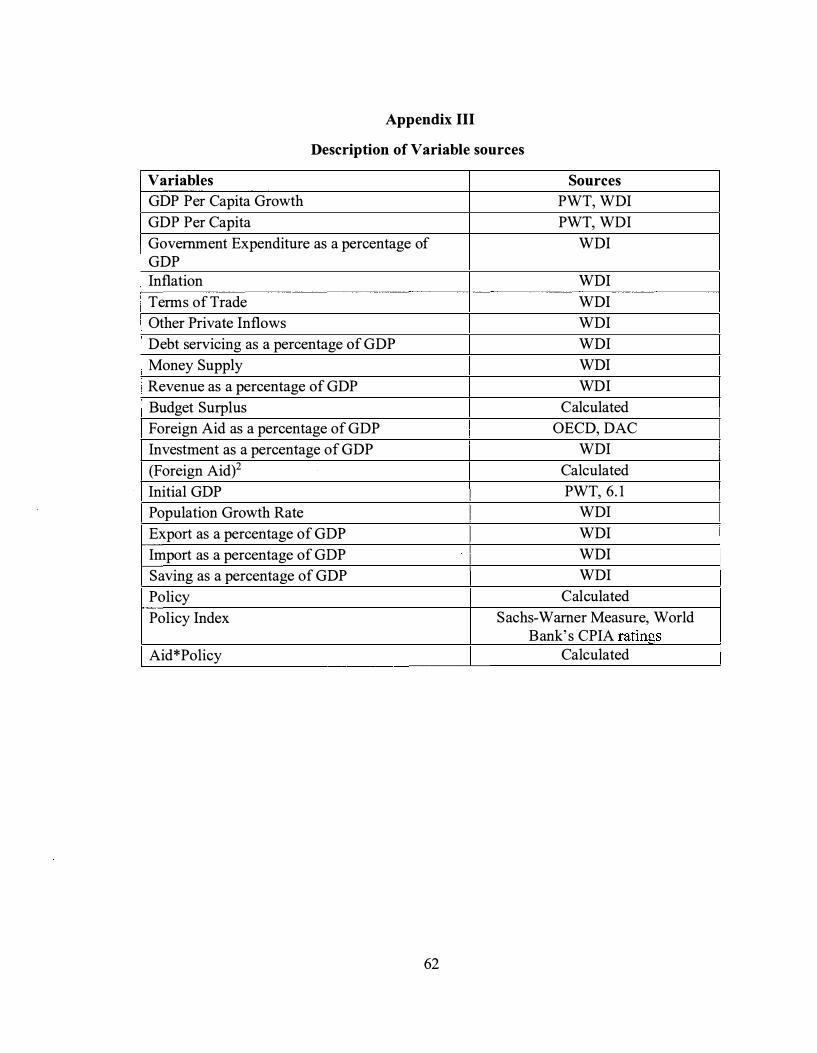
Appendix III
Description of Variable sources
Variables Sources
GDP Per Capita Growth PWT, WDI
GDP Per Capita PWT, WDI
Government Expenditure as a percentage of WDI GDP Inflation WDI
Terms of Trade WDI
Other Private Inflows WDI
Debt servicing as a percentage of GDP WDI
Money Supply WDI
Revenue as a percentage of GDP WDI
Budget Surplus Calculated
Foreign Aid as a percentage of GDP OECD, DAC
Investment as a percentage of GDP WDI
(Foreign Aid)2 Calculated
Initial GDP PWT, 6. 1
Population Growth Rate WDI
Export as a percentage of GDP WDI
Import as a percentage of GDP WDI
Saving as a percentage of GDP WDI
Policy Calculated
Policy Index Sachs-Warner Measure, World Bank' s CPIA ratings
Aid*Policy Calculated
62

Appendix IV
Impact of the interaction term on economic growth using CPIA ratings as a measurement
Table 14: Pooled, GLS, and Random Effects Panel estimations of the impact of
policies on aid-growth relationship using CPIA ratings to measure policy
Pooled T-stat GLS Z-stat Panel Z-stat FAid 0.0000000239 ( 1 .09) 0 .0000000239 ( 1 .09) 0 .0000000239 ( 1 .09) (FAid)2 -0.00285 (-0 .90) -0.00285 (-0 .90) -0.00285 (-0.90)
Policy_Index 0.000479* ( 1 .45) 0 .000479* ( 1 .45) 0.00029 1 ( 1 .07) Cons 1 .906*** (4.34) 1 .906* * * (4.36) 1 .906*** (4.34)
N 1 077 1 077 1 077
Rz 0.59 0 .48 0 .58 test statistics in parentheses * * * 1 %, **5% and * 1 0% significance level
Table 15: Pooled, GLS, and Random Effects Panel estimations of the impact of
interactions between policies and aid on aid-growth relationship using CPIA ratings
to measure policy
Pooled T-stat GLS Z- Panel Z-stat stat
FAid 0.0000000242 (0 .68) 0.0000000242 (0 .68) 0.0000000238 (0.65) Policy_ Index 0.0003 89* ( 1 .45) 0.0003 89* ( 1 .45) 0.000309 ( 1 .0 1 ) FAid*Policy_lndex 0.0000502 ( 1 .06) 0 .0000603 ( 1 .06) 0.000065 1 ( 1 .03)
cons 1 .930*** (4.23) 1 .930* * * (4 .25) 1 .920*** (4 . 1 0)
N 1 077 1 077 1 077
Rz 0.52 0 .52 0 .50 test statistics in parentheses * * * l %, **5% and * 1 0% significance level
63