DOE_injection molding.pdf
27
INTRODUCTION In this fast paced world of ours, it seems everyone is trying to get “there” more quickly. Board a plane in stead of a bus. Send E-mail instead o f a l etter. No matter what the technology, the pace just gets faster and faster. The same situation exists in the injecti on molding industry. Increasing cu stomer demands are really “turning up the heat” on injectio n molders. Customers are demanding that injecti on molders get “there” more quickly. Customers are demanding tighter tolerances, lower costs and shortened de velopment times. As a response to this increase d “heat,” many injection molders fi nd themselves in const ant “fire-fighting” mode. As one injection molder stated, “You think the pressure in the mold is high, sometimes the pressure on the engineers in t his industry is ov erwhelming.” As a result of this increasing pressure, a revolution is taking place in the injection molding indust ry. Clearly, injection molders want to meet customer demands AND make money. There is an easy technique injection molders can use that takes them out of fire- fighting mode and allows them to not only remain competitive, but also increase their profits. No matter which plastics process is your speciality, design of experiments can help make it more efficient and productive. Experimental desi gn was first developed in England during the early 1 900's. A statistician (and agricultural scientist) named Ronald Fisher is credited by many with some of the first applications of the tool as well as developing much of the fundamental mathematical theory underlying s tatistical exp erimental design. Injection molders are now learning that experimental design applied in conjunction with ample knowledge of molding processes can be an efficient characterization, optimization, and set-up strategy. "Change only one variable at a time" was once a common theme in injection molding. Thanks to Exp erimental Design, al l has changed. Experimental Des ign is a powerful set-up and tro ubleshooting tool for t he in jection molder. With this tool, the us er conducts a family of tests, making multiple simultaneous changes in variable settings. Analysis techniques (using software) have recently emerged which allow the user to quickly characterize and determine t he best settings for the pro cess. Use of Experimental Design was once reserved for only those with a specialized knowledge of mathematics and statistics (being able to interpret an ANOVA table is not an innate skill for the injection molder!). Today comp uter software makes analysis and optimization easy. All one really needs to be able to do is operate in the Windows environment and to interpret a few graphs. Instead of spendi ng days attemp ting to set up a new job or troubleshooting a problem, molders have frequently found they can get a solution in a
Transcript of DOE_injection molding.pdf

8/13/2019 DOE_injection molding.pdf
http://slidepdf.com/reader/full/doeinjection-moldingpdf 1/27
INTRODUCTION
In this fast paced world of ours, it seems everyone is trying to get “there” more quickly.
Board a plane instead of a bus. Send E-mail instead of a letter. No matter what the
technology, the pace just gets faster and faster.
The same situation exists in the injection molding industry. Increasing customerdemands are really “turning up the heat” on injection molders. Customers are demanding
that injection molders get “there” more quickly. Customers are demanding tighter
tolerances, lower costs and shortened development times. As a response to this increased
“heat,” many injection molders find themselves in constant “fire-fighting” mode. As one
injection molder stated, “You think the pressure in the mold is high, sometimes the
pressure on the engineers in this industry is overwhelming.”
As a result of this increasing pressure, a revolution is taking place in the injection
molding industry. Clearly, injection molders want to meet customer demands AND make
money. There is an easy technique injection molders can use that takes them out of fire-
fighting mode and allows them to not only remain competitive, but also increase their
profits.
No matter which plastics process is your speciality, design of experiments can help make
it more efficient and productive.
Experimental design was first developed in England during the early 1900's. A
statistician (and agricultural scientist) named Ronald Fisher is credited by many with
some of the first applications of the tool as well as developing much of the fundamental
mathematical theory underlying statistical experimental design. Injection molders are
now learning that experimental design applied in conjunction with ample knowledge of
molding processes can be an efficient characterization, optimization, and set-up strategy.
"Change only one variable at a time" was once a common theme in injection molding.
Thanks to Experimental Design, all has changed. Experimental Design is a powerful
set-up and troubleshooting tool for the injection molder. With this tool, the user
conducts a family of tests, making multiple simultaneous changes in variable settings.
Analysis techniques (using software) have recently emerged which allow the user to
quickly characterize and determine the best settings for the process. Use of Experimental
Design was once reserved for only those with a specialized knowledge of mathematics
and statistics (being able to interpret an ANOVA table is not an innate skill for theinjection molder!). Today computer software makes analysis and optimization easy. All
one really needs to be able to do is operate in the Windows environment and to
interpret a few graphs. Instead of spending days attempting to set up a new job or
troubleshooting a problem, molders have frequently found they can get a solution in a

8/13/2019 DOE_injection molding.pdf
http://slidepdf.com/reader/full/doeinjection-moldingpdf 2/27
matter of hours.
Successful application of design of experiments involves the blending of several skills.Foremost among these skills is knowledge of the technology of injection molding.
Fortunately, often the process experts in injection molding know what the three or four
most important variables are likely to be and what the appropriate ranges are for these
variables. What they likely do not know, however, is the best settings for these key
variables in order to get desirable results for more than one quality characteristic
(response). Without some knowledge of what the key variables are and what the likely
best range of settings is, the molder will have little success with the technique. In
addition to technical knowledge, team planning, communication, DOE software, and
Windows skills are also important. There are a number of DOE software packages in
the marketplace. One the authors prefer, because of its ease-of-use and power, is a
package called DOE Wisdom.
Essential to the successful use of experimental design by the molder is the recognition
that injection molding is controlled by the fundamentals of science. Although it might
appear at times that no matter how many controls are in place, the plastic is going “to do
as it darn well pleases,” there is a scientific reason for all that takes place in the molding
of a part. Practitioners need to look at the challenge of setting up a job from the
perspective of plastics science.
The concept of Decoupled MoldingSM (Scientific Molding) has generated significant
interest in the injection molding community over the last several years. Proponents of
this approach have documented substantial improvements using these techniques
(citation: Injection Molding magazine, 55 Madison St., Suite 770, Denver, CO 80206).
The concepts of Scientific Molding certainly make a great deal of sense. Some of the basic premises are:
The focus of molding is the performance of the polymer in the mold.
One should think about what is happening from the plastics standpoint.
Scientific molding is a machine-independent process (make job set-up
robust).
One should develop a universal set-up card for each material/mold.
Molding is not a "black art"; there is a logical reason for everything that
happens.
Implementation of scientific molding, particularly for a small custom molding shop, may
appear at first to be cost prohibitive. Pressure sensors must be placed in the mold.Sensors need to be positioned in the right place. Data collection and timely reaction
systems need to be implemented. Fortunately, using design of experiments to set up and
troubleshoot your process is a viable option. Additionally, studies by experts in the field
vividly demonstrate that inserting pressure sensors in a mold more than pays for itself
over the life of the job (citation: RJG Associates, Traverse City, MI 616-947-3111). The

8/13/2019 DOE_injection molding.pdf
http://slidepdf.com/reader/full/doeinjection-moldingpdf 3/27
combination of design of experiments and the use of pressure sensors in the cavities of
long running molds is the ideal approach and (for most molders) is not cost prohibitive.
There are five stages that the injection molder must go through in order to successfully
apply experimental design. They are:
Planning
Selecting an Orthogonal Array (family of tests)
Conducting the Experiment
Performing the Analysis
Confirming the Results
To be successful at the first stage, planning , a team must know :
Customer Requirements
Company Goals Technology (machines, molds, characteristics of the resin, etc.)
Team Skills
Facilitation Skills
Communication Skills
Resources/time availability of machines and people
The second activity, selecting an orthogonal array, was once shrouded in a high degree
of statistical mysticism. In the recent past, if an engineer or technician wanted to conduct
a designed experiment, he/she would select possible factors and levels and pay a visit to
the local statistical wizard. The engineer or technician would hand off the pertinent
information and leave abruptly as the statistician grumbled to come back in a couple of
days. The statistician would lay out an intricate fractional factorial design. A couple ofdays later, the engineer would return to accept the worksheet, having no idea how the
runs were generated.
Times have changed. Designs no longer need to be generated manually. Tabled
orthogonal arrays and easy-to-use software provide the molder with tools to fit his/her
needs.
The third stage, conducting an experiment , requires a detailed plan, discipline in
following the plan, and an understanding of what the experiment is intended to
accomplish. Many texts on experimental design give little or no information about this
stage. Therefore, this is one of the biggest reasons why people get poor results from an
experiment. Those involved must realize that the only changes to be made are those
called out by the orthogonal array. All other potential sources of variation must be heldconstant, or as close to constant as possible.
Analyzing data is still seen by some, unfortunately, as what experimental design is all
about. For example, many courses and texts on experimental design may spend as much
as 80 to 90 percent of their attention on this area. Analysis of variance and regression

8/13/2019 DOE_injection molding.pdf
http://slidepdf.com/reader/full/doeinjection-moldingpdf 4/27
Introduction 4
typically are touted as the techniques of choice. Recent revelations have shown that byusing simple graphs only, we can obtain a solid understanding of the results of a designed
experiment. Analysis of Variance and regression output tables generated by the
computer can, of course, provide additional information from the data.
The last stage, confirmation and conclusions, is the true test. As the name implies, we
take the predicted best settings from the analysis stage and run those combinations with
20 to 30 shots, depending on the budget. If the results of the confirmation match the
predicted values, all goes well. The experiment has confirmed. If not, this shows that
one or more of our assumptions is invalid. Failure to confirm directs us to look for and
find reasons for the unpredictable behavior before starting more experiments. (Note:
Successful confirmation does not necessarily imply process capability. Determining
process capability requires a much more detailed study. For more information on processcapability studies, the authors recommend the Statistical Process Control (SPC)
Reference Manual which can be obtained from the Automotive Industry Action Group.
(248-358-3570))
Getting good at the application of this approach takes practice. Too often, people will try
experimental design once, find the approach felt awkward, and not try it again. We like
to stress to people the "510" rule. One needs to participate in at least 5 experiments to
understand what the techniques can do. (Completing 10 makes one really good at the
technique.) "Getting good" does involve making an investment. The payback, however,
will be huge. Molders typically see a 50 percent (or more) improvement in the efficiency
and effectiveness of their setup and optimization efforts once they become skillful.
Experimental Design is a powerful tool for the setup and troubleshooting of injection
molding processes. It requires a number of important skills including solid technical
knowledge of the process. Thanks to the availability of powerful computers and
graphical output from easy-to-use software, the injection molder can quickly combine
his/her injection molding knowledge with simple experimental design for quick solutions.

8/13/2019 DOE_injection molding.pdf
http://slidepdf.com/reader/full/doeinjection-moldingpdf 5/27
Introduction 5
Preface
Being successful as an injection molder was once a simple proposition. Line up some
capital, hire a few key people with some knowledge of injection molding, link up with a
couple of customers, and start making money.
Times have changed. Customers are becoming much more demanding. Margins are now
smaller. Machines are more complex. New and exotic resins are being used to meet
wider usage environments. Competition is now on a world-wide basis. The auto industry
will charge you for their downtime if your component shuts down their line. Medical
device customers (at the urging of the FDA) are demanding that you validate your processes. Customers (especially in the auto industry and medical device industry) are
recommending molders use tools like experimental design to characterize and further the
understanding of their processes.
Some advocates of experimental design suggest that all you need is designed
experiments. No knowledge of injection molding is required. We disagree with this
statement. Blending a fundamental knowledge of experimental design with ample
knowledge of machines and materials is the key to successful application for the injection
molder. By wisely combining experimental design with knowledge of the technology,
you can continuously improve your understanding of designed experiments and injection
molding technology.
Unfortunately, design of experiments (DOE) has gotten a bad reputation as being a
complex and confusing topic. The authors aim to change this perception. Our approach is
to make design of experiments easily understood and helpful to the injection molder. The
first chapters of this book walk you through the basics of experimental design. Simple
analysis techniques are discussed as they relate to the injection molding industry.
Thanks to the power of readily available software, it is easy to apply design of
experiments to injection molding processes. This book includes a special version of DOE
Wisdom software. Chapter 6 actually walks the reader through an injection molding
example using the software.
Later chapters of the book are intended to discuss more advanced experimental design
topics and to describe how DOE can help you meet some of the unique requirements of
the plastics industry. For those readers who want to dive into more complicated
mathematical concepts, Appendix A has been included.
It is our hope that this book will take the mystery out of experimental design. It does not

8/13/2019 DOE_injection molding.pdf
http://slidepdf.com/reader/full/doeinjection-moldingpdf 6/27
Introduction 6
have to be complicated and confusing. For the most part, simple mathematics can beused. Real world injection molding examples have been used extensively throughout this
book to help molders better understand how DOE applies to their industry and how it can
be used to help them better compete on a world-wide basis!
NOTE: Our mission is to continuously improve this text. With your help we can meet
this goal. If you see a typographical error, sentence structure or
technological error, please bring it to our attention. You can reach us at 719-
282-1143 or e-mail us at [email protected].

8/13/2019 DOE_injection molding.pdf
http://slidepdf.com/reader/full/doeinjection-moldingpdf 7/27
Introduction 7
Table of Contents
Introduction
1
Chapter 1: Design of Experiments - The Simple Facts
The Real World 5When to Apply Design of Experiments 5What is a Designed Experiment? 6What is a Process Diagram? 6What is a Factor? 6What is a Response? 7Planning Your Experiment 8 A Process Diagram for an Injection Molding Experiment 9 An Orthogonal Array 10Let’s Collect Some Data 13
The Pareto Chart 14The Main Effects Plot 15The Contour Plot 17Summary 18
Chapter 2: Fractional Factorial DesignsYou Can’t Get Something for Nothing 21What is an Interaction? 21 Aliasing 22Resolution 25Process Diagram for Fractional Factorial Design 25The Worksheet 27
Potential Pitfalls of Data Collection 27The Pareto Chart 29Statistical Analysis 30Terminology 30Key Information 33The Main Effects Plot 34

8/13/2019 DOE_injection molding.pdf
http://slidepdf.com/reader/full/doeinjection-moldingpdf 8/27
Introduction 8
Confirmation Runs 35Summary 36
Chapter 3: Optimizing More Than One ResponseWhat if I have multiple responses I want to optimize? 39Desirability Functions 39Desirability Function Example 40
Background 40Experiment Objective 41Factor Settings and Design Matrix 41Responses 42Data 42
Main Effects Plot 42Software 44Response Surface Graph 45Contour Plot 45Experiment Conclusion 47Confirmation Runs 48
Desirability Function Summary 48
Chapter 4: Other Design TypesIntroduction 51Plackett-Burman Designs 51Taguchi Designs 51
Taguchi Example 60Background 60Experiment Objective 60Factor Settings and Design Matrix 61Responses 62 Analysis 62Conclusion 66Confirmation 66
Taguchi Signal-to-Noise Ratio 66Smaller is Better 66Larger is Better 66Nominal is Better 67
Taguchi Summary 67Modeling Designs 68Box-Behnken Designs 68Central Composite Designs 69D-optimal Designs 70Summary 71
8/13/2019 DOE_injection molding.pdf
http://slidepdf.com/reader/full/doeinjection-moldingpdf 9/27
Introduction 9
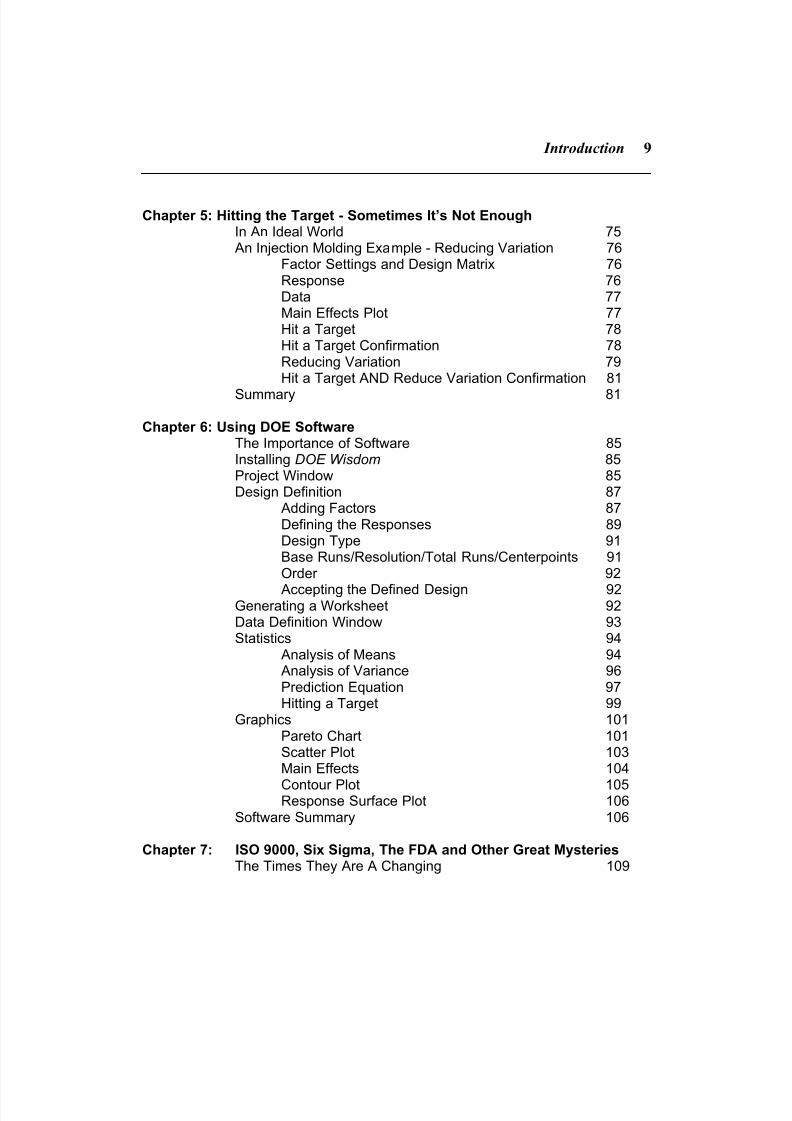
Chapter 5: Hitting the Target - Sometimes It’s Not EnoughIn An Ideal World 75 An Injection Molding Example - Reducing Variation 76
Factor Settings and Design Matrix 76Response 76Data 77Main Effects Plot 77Hit a Target 78Hit a Target Confirmation 78Reducing Variation 79Hit a Target AND Reduce Variation Confirmation 81
Summary 81
Chapter 6: Using DOE Software The Importance of Software 85Installing DOE Wisdom 85Project Window 85Design Definition 87
Adding Factors 87Defining the Responses 89Design Type 91Base Runs/Resolution/Total Runs/Centerpoints 91Order 92
Accepting the Defined Design 92Generating a Worksheet 92Data Definition Window 93Statistics 94
Analysis of Means 94 Analysis of Variance 96Prediction Equation 97Hitting a Target 99
Graphics 101Pareto Chart 101Scatter Plot 103Main Effects 104
Contour Plot 105Response Surface Plot 106
Software Summary 106
Chapter 7: ISO 9000, Six Sigma, The FDA and Other Great Mysteries The Times They Are A Changing 109

8/13/2019 DOE_injection molding.pdf
http://slidepdf.com/reader/full/doeinjection-moldingpdf 10/27
Introduction 10
Six Sigma Review 110How Design of Experiments Can Help with Six Sigma 110ISO 9000 Review 111How Design of Experiments Can Help with ISO 9000 111The FDA - Process Validation 114How DOE Can Help with Process Validation 115Summary 119
Chapter 8: The World of PlasticsIntroduction 123Key Concepts 123Viscosity 123
Fountain Flow 125Cavity Pressure Gradients 128Resin Type Impacts on Shrinkage 131Summary 132
Chapter 9: Case StudiesTaguchi L8 - Printer Part Material Evaluation 135Box-Behnken Design - Bearing Component 142¼ Fractional Factorial Molding Experiment 149Full Factorial - Connector O-ring Diameter Evaluation 157
Appendix A 163
Index

8/13/2019 DOE_injection molding.pdf
http://slidepdf.com/reader/full/doeinjection-moldingpdf 11/27
Introduction 11
CHAPTER
Design of Experiments - The Simple Facts
The Real World In the early and mid 70’s the injection molding world was more stable. Foreign
competition was minimal. Unlike today, complacency reigned in the marketplace; after
all, inefficiencies could always be passed on to the customer.
This “business as usual” mind set received a severe jolt in the late 70’s and early 80’s.
American industry awoke to the fact that they were faced with tough worldwide
competition. Higher quality and lower costs were attracting U.S. consumers to foreign
produced products. Cost and quality had replaced complacency as the predominate
features of the market place.
By the 1990’s, a third consideration had joined quality and cost issues in assuming
dynamic significance on the global stage - the time-to-market factor. No longer could

8/13/2019 DOE_injection molding.pdf
http://slidepdf.com/reader/full/doeinjection-moldingpdf 12/27
Introduction 12
leading companies retain drawn-out development and design cycles and hope to remaincompetitive. Businesses which prioritized quick response time across their organization
consistently outperformed their slower competitors in terms of growth and profitability
[1].
Everywhere, the lament of management is the same:
“In contrast to only five years ago, we must now develop new
products in half the time (or less!), the job must be done with
fewer people, and the product must be right with the first
shipment.”
Obviously, traditional approaches are no longer adequate in meeting the challenge. In
response to widespread demand, experimental design has emerged as THE premier toolin allowing technical groups to make faster, more informed decisions about product
concepts, designs, and processes. Properly applied, companies realize a 50% - or greater
- improvement in their efficiency and effectiveness.
When to Apply Design of Experiments Don’t wait until the manufacturing phase of the new product.
Design of Experiments is an effective tool to use in the R&D, Product Design and
Process Design phases.
Use when setting up new molds and troubleshooting problem jobs. What is a Designed Experiment?
A designed experiment involves systematic, controlled changes of the Inputs (factors) toa process in order to observe corresponding changes in the Outputs (responses). A
designed experiment is an observation process where tests are conducted in a rigorous,
systematic manner. For each test, important outputs are measured. Analysis of the
resultant data is used to characterize, optimize, or troubleshoot an injection molding
process.
What is a Process Diagram?A Process Diagram is a graphic which assists in planning a designed experiment.
Pictorially, it is as follows:
EARLY
8/13/2019 DOE_injection molding.pdf
http://slidepdf.com/reader/full/doeinjection-moldingpdf 13/27
As shown above, the Process Diagram allows us to list inputs and outputs for the process.
Selecting the correct inputs and outputs to study in a designed experiment (DOE) requiresknowledge of what you wish to improve as well as strong knowledge of the technology
of injection molding [2,3,4,5]. In a typical injection molding scenario, the molder might
choose to call the inputs process parameters and the outputs the customer requirements.
In DOE, the inputs are frequently referred to as factors and the outputs are referred to as
responses.
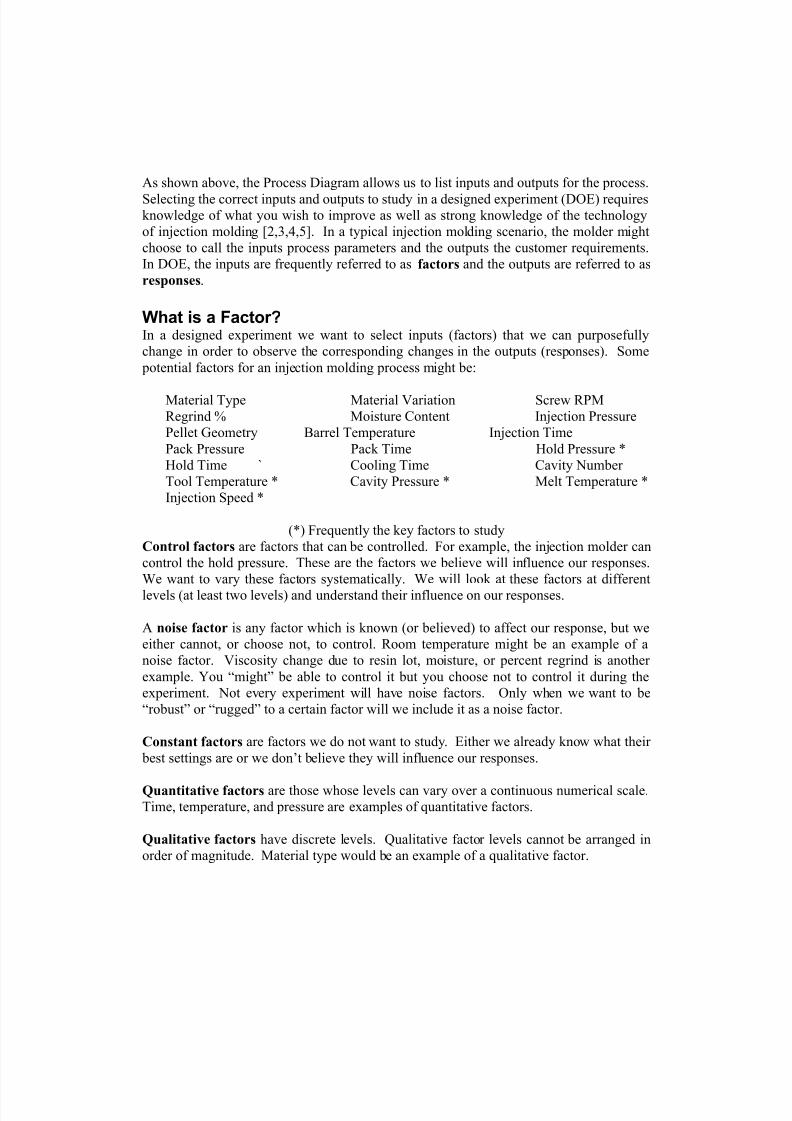
What is a Factor? In a designed experiment we want to select inputs (factors) that we can purposefully
change in order to observe the corresponding changes in the outputs (responses). Some
potential factors for an injection molding process might be:
Material Type Material Variation Screw RPM
Regrind % Moisture Content Injection Pressure
Pellet Geometry Barrel Temperature Injection Time
Pack Pressure Pack Time Hold Pressure *
Hold Time ` Cooling Time Cavity Number
Tool Temperature * Cavity Pressure * Melt Temperature *
Injection Speed *
(*) Frequently the key factors to study
Control factors are factors that can be controlled. For example, the injection molder can
control the hold pressure. These are the factors we believe will influence our responses.
We want to vary these factors systematically. We will look at these factors at different
levels (at least two levels) and understand their influence on our responses.
A noise factor is any factor which is known (or believed) to affect our response, but we
either cannot, or choose not, to control. Room temperature might be an example of a
noise factor. Viscosity change due to resin lot, moisture, or percent regrind is another
example. You “might” be able to control it but you choose not to control it during the
experiment. Not every experiment will have noise factors. Only when we want to be
“robust” or “rugged” to a certain factor will we include it as a noise factor.
Constant factors are factors we do not want to study. Either we already know what their
best settings are or we don’t believe they will influence our responses.
Quantitative factors are those whose levels can vary over a continuous numerical scale.Time, temperature, and pressure are examples of quantitative factors.
Qualitative factors have discrete levels. Qualitative factor levels cannot be arranged in
order of magnitude. Material type would be an example of a qualitative factor.

8/13/2019 DOE_injection molding.pdf
http://slidepdf.com/reader/full/doeinjection-moldingpdf 14/27
Design of Experiments - The Simple Facts 14
What is a Response?Selecting the appropriate response or quality characteristic to measure is critical to
successful experimentation. Your experiment will be driven by the process output
(response) that you choose to observe. Of course, meaningful and measurable responses
will help us have a more successful experiment. Some potential responses for an
injection molding process might be:
Dimensions Color
Bowing
Cavity Pressure Tensile Strength
Specks
Blisters BlushSink
Marks
Flash
Delamination
Knit
Lines
Weight
It is preferable to select a response that is measurable on a continuous basis. The
dimension of the part is an example of this type of response. Categorical responses such
as “pass/fail” require much larger sample sizes. Many injection molders have responses
that are based upon a visual examination. If you are measuring sink marks, you shouldtry to have more than just “pass/fail” criteria. It is better to set up a scale from 1 to 5 and
rank the number of sink marks based upon this criteria.
Planning Your Experiment Experimental design does not replace your engineering knowledge. As a matter of fact,
you are counting on that knowledge to help you select the proper factors, factor levels
and responses. You should sit down with the appropriate people and brainstorm what
response(s) you want to optimize. Before you set up a designed experiment, list what
you already know about your process.
Before selecting a response, make sure your measurement system is reliable. We have
seen too many otherwise well conceived experiments decimated by measurement systems
which were not reliable. Let’s say you want to optimize the dimension of your product
with the following specification limits: Minimum = 2.367 inches Nominal = 2.375 inches Maximum = 2.383 inches
A measurement repeatability study on your equipment shows that it can only

8/13/2019 DOE_injection molding.pdf
http://slidepdf.com/reader/full/doeinjection-moldingpdf 15/27
Design of Experiments - The Simple Facts 15
discriminate to +/-0.1 inches. The same part measured three times on this equipmentgives the following readings:
2.4 inches 2.3 inches 2.5 inches
Clearly this measurement equipment would not be adequate to use for your experiment.
No matter how well you conduct your designed experiment, the results will be erratic if
your measurement system is not repeatable and reliable. The Statistical Process Control
(SPC) Reference Manual gives an excellent explanation of how to evaluate your
measurement equipment [6].
Once you have chosen the response(s) you would like to optimize and have determined
that the measurement devices are repeatable and reliable, you must now choose your
factors for the experiment. Here is where your engineering knowledge really comes into play. An injection molding process has many potential factors. We have heard of
molders attempting to study as many as 20 factors in a designed experiment and
consequently not obtaining useful information. If you have good technical knowledge of
your process, most injection molding experiments should not include more than four or
five factors [2,3,5]. This greatly increases your chances of obtaining useful information.
Given the response you have chosen to optimize, determine which factors you believe
will have the greatest influence on that response.
Once you have chosen the factors, you must now select the factor levels you wish to
explore. The levels for each factor represent the ranges over which you wish to explore
the influence of the factor on the response.
DOE is not a panacea, it is a tool. It is not a substitute for knowledge of your technology.
DOE incorporates current understanding of your technology. If you know “something”
about your technology and use DOE wisely, it can help you tremendously. A Process Diagram for an Injection Molding Experiment Suppose our customer requests that we make a hinged box with a length of 16 +/- 0.20
inches. The thickness of the box will be 0.070 inches. The resin being used is GP
polystyrene with a melt index of 8. We will be using a 100 ton press machine with a
single cavity mold. We have already set the transfer point and performed a gate seal test.
We have decided to fix all settings except for the Mold Temperature and the Hold
Pressure. The response we wish to optimize is Length. Our Process Diagram appears as
follows:

8/13/2019 DOE_injection molding.pdf
http://slidepdf.com/reader/full/doeinjection-moldingpdf 16/27
Design of Experiments - The Simple Facts 16
Below is a summary of the control factors, constant factors and the response for this
experiment:
CONTROL FACTORSMold Temperature
Low Level = 70oF
High Level = 90oF
Hold Pressure
Low Level = 5000 psi High Level = 7000 psi
CONSTANT FACTORSFront Zone Temp. 400oF
Middle Zone Temp. 400oFRear Zone Temp. 400oF
Injection Limit Time 5 seconds
Holding Time 5 seconds
Mold Closed Time 25 seconds
Mold Open Time 3 seconds Clamp Force 60 tons
Screw RPM 100
Screw Back 7 inches
Max. Inj. Pressure 20,000 psiBack Pressure 2500 psi
RESPONSE Length inches

8/13/2019 DOE_injection molding.pdf
http://slidepdf.com/reader/full/doeinjection-moldingpdf 17/27
Design of Experiments - The Simple Facts 17
An Orthogonal Array A design type or design matrix (array) is a way to organize and track an experiment. In
our example, we would like to conduct an experiment with the two factors at different
settings and record the length of the part for each combination. Our technical knowledge
suggests that the relationship between the factors and the response is linear. Therefore,
we decide to look at only two levels of each factor -- a low level and a high level. The
factors and corresponding levels would be:
FACTOR LOW LEVEL HIGH LEVEL
Mold Temp 70oF 90
oF
Hold Press. 5000 psi 7000 psi
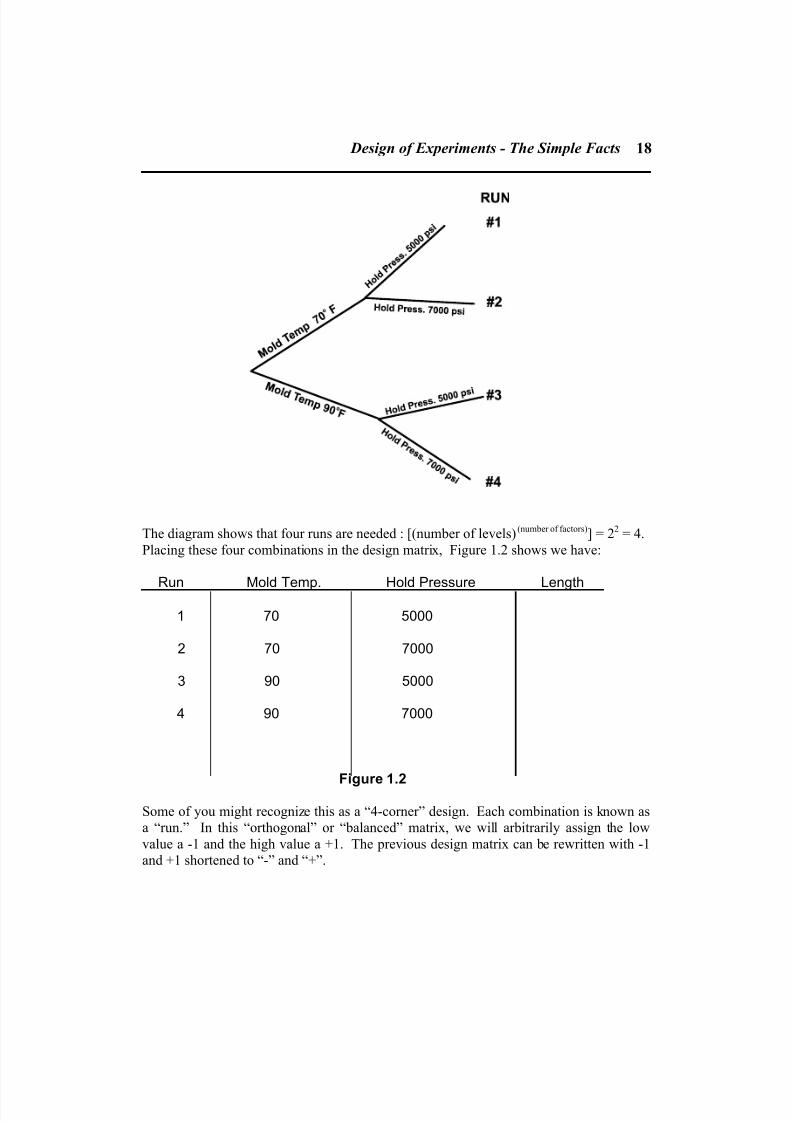
The tree diagram shown in Figure 1.1 illustrates the number of runs required if we were
to experiment
at all possible
combinations
of the factorsettings.
8/13/2019 DOE_injection molding.pdf
http://slidepdf.com/reader/full/doeinjection-moldingpdf 18/27
Design of Experiments - The Simple Facts 18
The diagram shows that four runs are needed : [(number of levels)(number of factors)] = 22 = 4.
Placing these four combinations in the design matrix, Figure 1.2 shows we have:
Run Mold Temp. Hold Pressure Length
1 70 5000
2 70 7000
3 90 5000
4 90 7000
Figure 1.2
Some of you might recognize this as a “4-corner” design. Each combination is known as
a “run.” In this “orthogonal” or “balanced” matrix, we will arbitrarily assign the low
value a -1 and the high value a +1. The previous design matrix can be rewritten with -1
and +1 shortened to “-” and “+”.

8/13/2019 DOE_injection molding.pdf
http://slidepdf.com/reader/full/doeinjection-moldingpdf 19/27
Design of Experiments - The Simple Facts 19
Run Mold Temp. Hold Pressure Length
1 _ _
2 _ +
3 + _
4 + +
The matrix we have just built is orthogonal. That is, it is both vertically and horizontally
balanced. For each factor, we will test at an equal number of high and low values
(vertical balancing). For each level within each factor, we are testing an equal number of
high and low values from each of the other factors (horizontal balancing).
Mathematically speaking, vertical balancing occurs if the sum of each factor column is
zero. If the sum of each product column (Mold Temp x Hold Pressure in this example)
is zero, then the matrix is horizontally balanced. A design is orthogonal if it is both
horizontally and vertically balanced.
Run Mold Temp. Hold Pressure Mold Temp. X Length
Hold Pressure
1 _ _ +
2 _ + _
3 + _ _
4 + + +
Sum 0 0 0
If we test all possible combinations of our factors, our design matrix will be referred to as
a full factorial. This will always be one of our design options; however, it is typically
not our most efficient option.
Notice that in the table above, which illustrates horizontal balancing, we have created a
new column in the design matrix. This will be used to examine the interaction between

8/13/2019 DOE_injection molding.pdf
http://slidepdf.com/reader/full/doeinjection-moldingpdf 20/27
Design of Experiments - The Simple Facts 20
Mold Temperature and Hold Pressure. The Mold Temperature × Hold Pressure columnis simply the product of the Mold Temperature column and the Hold Pressure column,
row by row. The primary benefit of an orthogonal array is that it allows us to perform
simple (but powerful) analysis and predictions.
Let’s Collect Some Data As you will recall from Figure 1.2, our design matrix is as follows:
Run Mold Temp. Hold Pressure Length
1 70 5000
2 70 7000
3 90 5000
4 90 7000
Computer programs will often print out a “Worksheet” that looks similar to the design
matrix above. This “worksheet” is given to the appropriate operators/engineers so they
know how to set up the equipment for the experiment. Remember to set the constant
factors to their appropriate values.
We will now conduct run 1 of the experiment by setting the Mold Temperature to 70 o Fand the Hold Pressure to 5000 psi. After completing the injection molding process under
these conditions, we found the length to be 15 inches. For this example, we used
SimTech-1 the Injection Molding Machine Simulator from Paulson Training Programs,
Inc.[2].
We will now conduct run 2 of the experiment by setting the Mold Temperature to 70 o F
and the Hold Pressure to 7000 psi. After completing the injection molding process under
these conditions, we found the length to be 19 inches.
We will now conduct run 3 of the experiment by setting the Mold Temperature to 90 o F
and the Hold Pressure to 5000 psi. After completing the injection molding process under
these conditions, we found the length to be 12 inches.
We will now conduct run 4 of the experiment by setting the Mold Temperature to 90 o F
and the Hold Pressure to 7000 psi. After completing the injection molding process under
these conditions, we found the length to be 17 inches.

8/13/2019 DOE_injection molding.pdf
http://slidepdf.com/reader/full/doeinjection-moldingpdf 21/27
Design of Experiments - The Simple Facts 21
Our completed worksheet will now appear as shown in Figure 1.3.
Run Mold Temp. Hold Pressure Length
1 70 5000 15
2 70 7000 19
3 90 5000 12
4 90 7000 17
Figure 1.3
The Pareto Chart Now it’s time to let the software do the work. The purpose of this book is to simplify the
design of experiments process. We could consume chapters discussing complicated
statistical calculations but have discovered that often people get so overwhelmed by the
calculations that they decide that design of experiments is not for them. It is unfortunate
because DOE is a great tool to use! The good news is that there are several design of
experiment software packages available to do the calculations for you. We have chosen
to use DOE Wisdom for the examples in this book. The authors have worked as
process/quality engineers in “the real world” for many years and realize that most of the“real workers” do not have three weeks to learn a software package. We have designed
DOE Wisdom to be very user friendly yet very powerful. There is a special version of
DOE Wisdom in the back of this book and Chapter 6 walks you through an example using
the software.
DOE Wisdom will generate a Pareto chart for you. Figure 1.4 shows the Pareto Chart for
our example. (NOTE: Appendix A discusses the calculations used for the Pareto Chart.)
The Pareto Chart plots the impact (or effect) of the variable on the y-axis and the source
of the effect on the x-axis.

8/13/2019 DOE_injection molding.pdf
http://slidepdf.com/reader/full/doeinjection-moldingpdf 22/27
Design of Experiments - The Simple Facts 22
A Pareto Chart is a chart of bars that arearranged in order of decreasing size. Thebars represent the effect the factors haveon the response.
If we look at the Pareto Chart in Figure 1.4, it appears that Hold Pressure has the most
effect on the length of our part.
The Main Effects Plot Figure 1.5 shows the Main Effects Plot for our example.

8/13/2019 DOE_injection molding.pdf
http://slidepdf.com/reader/full/doeinjection-moldingpdf 23/27
Design of Experiments - The Simple Facts 23
The Main Effects Plot is a plot of the average of thedata points at the low factor setting and the averageof the data points at the high factor setting. Thegreater the slope, the more important the effect.
This plot gives us our first clue about how to set the factors to achieve a certain response.
If we wanted to maximize the length of our box, we would set Mold Temperature at the
low level (70oF) and Hold Pressure at the high level (7000 psi). If we wanted to
minimize the length of our box, we would set Mold Temperature at the high level (90oF)
and Hold Pressure at the low level (5000 psi). (NOTE: We will examine an interaction
plot later in this book.) In our example, we want to hit a target other than the minimum
or the maximum length. We want a length of 16 +/- 0.2 inches. We therefore need to
look at the Contour Plot.
The Contour PlotWith the Contour Plot, we can target our response (length). Figure 1.6 shows the
Contour Plot for this example.

8/13/2019 DOE_injection molding.pdf
http://slidepdf.com/reader/full/doeinjection-moldingpdf 24/27
Design of Experiments - The Simple Facts 24
Contour Plots are projections of lines of constantresponse from the response surface onto the twodimensional “factor” plane. Contour Plots provide theability to graphically “see” those factor settings that
The horizontal and vertical axes represent the settings for the two factors in the
experiment. The interior of the plot provides settings for the predicted length. If we
would like to hit a length of 16 inches, all combinations of Mold Temperature and Hold
Pressure settings that fall on the 16 inch line will be the correct predicted settings.
(Caution: These are only predicted settings ... we need to conduct additional tests to
confirm the settings really do work!)
Figure 1.7 shows that Mold Temperature set at 81.7 and Hold Pressure set at 6200 gives a
length of 16.0 inches. Additionally, Mold Temperature set at 74.3 and Hold Pressure set
at 5800 also gives a length of 16.0 inches. Your particular choice of settings will depend
on other considerations, such as lower cost or lower variability settings.

8/13/2019 DOE_injection molding.pdf
http://slidepdf.com/reader/full/doeinjection-moldingpdf 25/27
Design of Experiments - The Simple Facts 25
Summary The purpose of this chapter was to give an overview of the basics of experimental design.
In your real experiments, it is likely you will study more than two factors (3,4, or 5 arevery typical for molders). Additionally, you most likely will have more than one
response (length, width, appearance, etc.). The good news is that what we have covered
so far is the foundation. If you understand the basics covered in this chapter, you are well
on your way to understanding DOE. “Real world” experiments will merely build upon
these fundamentals.
Design of Experiments is an excellent tool to use for evaluating injection molding
processes. It can save time and money and can help injection molding companies
increase their profit margins. DOE is not a difficult tool to learn. With the help of
software, an experiment can be analyzed quickly and efficiently.
The Pareto Chart, the Main Effects Plot and the Contour Plot provide the basis for theanalysis of any experiment. Probably 90% of what we need to know from an experiment
can be obtained by interpreting these graphs. Of course there are other graphs and
analysis techniques that help us know that additional 10% and they are discussed later in
this book. These include:

8/13/2019 DOE_injection molding.pdf
http://slidepdf.com/reader/full/doeinjection-moldingpdf 26/27
Design of Experiments - The Simple Facts 26
Scatter PlotsInteraction Graphs
Response Surface Graphs
Analysis of VarianceAnalysis of Means
Desirability Functions
Orthogonal arrays are typically used for designed experiments and in Chapter 1 we have
looked at a full-factorial design. In Chapter 2 we will look at using fractional-factorialdesigns.
Chapter 1 Bibliography
1. Robert G. Launsby and Daniel L. Weese, Straight Talk on Designing
Experiments. Colorado Springs, CO: Launsby Consulting, 1995 (719-282-1143).
2. RJG Technologies, Inc., 3111 Park Drive, Traverse City, MI 49686 (616-947-3111).
3. Injection Molding, 55 Madison St., Suite 770, Denver, CO 80206 (303-
321-2322).
4. Richard G. Griskey, Polymer Process Engineering. New York, NY:
Chapman & Hall, 1995.

8/13/2019 DOE_injection molding.pdf
http://slidepdf.com/reader/full/doeinjection-moldingpdf 27/27
Design of Experiments - The Simple Facts 27
5. Robert A. Malloy, Plastic Part Design for Injection Molding . Cincinnati,OH: Hanser/Gardener Publication, Inc., 1994.
6. Automotive Industry Action Group, Statistical Process Control (SPC)
Reference Manual . Troy, MI: Automotive Industry Action Group, 1991.
7. Paulson Training Programs, Inc., SimTech-1 Injection Molding Machine
Simulator . Chester, CT: (860-526-3099).
8. S.R. Schmidt and R.G. Launsby, Understanding Industrial Designed
Experiments, 4th Edition. Colorado Springs, CO: Air Academy Press,1994.
9. Box and Draper, Empirical Model-building and Response Surfaces. JohnWiley & Sons, Inc.
10. J.A. Cornell, Experiments with Mixtures, 2nd
Edition. New York: John
Wiley & Sons, Inc.
11. RS Discover Users Guide, BBN Software Products Corporation,
Cambridge, MA.
12. William J. Diamond, Practical Experiment Designs. Lifeline Learning
Publications.
13. D.C. Montgomery, Design and Analysis of Experiments, Third Edition.
John Wiley & Sons, Inc., 1991.