DOE Tight Oil Flammability & Transportation Spill Safety Project ...
43
Sandia National Laboratories is a multi-program laboratory managed and operated by Sandia Corporation, a wholly owned subsidiary of Lockheed Martin Corporation, for the U.S. Department of Energy’s National Nuclear Security Administration under contract DE-AC04-94AL85000. Photos placed in horizontal position with even amount of white space between photos and header DOE Tight Oil Flammability & Transportation Spill Safety Project Update by David Lord, Ph.D. Sandia National Laboratories Albuquerque, NM [email protected] Crude Oil Quality Association Technical Meeting Marriott West Loop Houston, TX Feb 19, 2015 PRELIMINARY DATA
Transcript of DOE Tight Oil Flammability & Transportation Spill Safety Project ...
Sandia National Laboratories is a multi-program laboratory managed and operated by Sandia Corporation, a wholly owned subsidiary of Lockheed Martin Corporation, for the U.S. Department of Energy’s National Nuclear Security Administration under contract DE-AC04-94AL85000.
Photos placed in horizontal position with even amount
of white spacebetween photos
and header
Photos placed in horizontal position
with even amount of white space
between photos and header
DOE Tight Oil Flammability & Transportation Spill Safety Project Update
byDavid Lord, Ph.D.
Sandia National LaboratoriesAlbuquerque, [email protected]
Crude Oil Quality Association Technical MeetingMarriott West Loop
Houston, TXFeb 19, 2015
PRELIMINARY DATA

Preliminary Data
Information given in this presentation is based on preliminary analysis prepared for the DOE Tight Oils Study Committee project review, November 19‐20, 2014, Albuquerque, NM
Abridged versions were subsequently presented at the American Petroleum Institute Crude Oil Physical Properties ad‐hoc Technical Group meeting, Houston, Nov 21, 2014 and Crude Oil Quality Association meeting, Houston, Feb 19, 2015
A more thorough analysis of these data and modeling results is forthcoming, and will be documented in written reports to the DOE sponsor in CY2015
2
PRELIMINARY DATA

Outline
Project Management and Technical Team Project Workflow and Problem Statement Executive Summary Tight Oils Operating Environment Crude Oil Properties Combustion Events
3
PRELIMINARY DATA

Project management
DOE funding agency point‐of‐contact Richard Elliott, PE, CEM
U.S. Department of Energy, Office of Fossil Energy, Office of Oil & Natural Gas
[email protected] 202‐566‐0859
Sandia project manager David Borns, Ph.D.
Sandia National Laboratories, Geotechnology & Engineering Department [email protected] 505‐844‐7333
4
PRELIMINARY DATA

Technical team
David Lord (Ph.D., Env E.), Principal member of technical staff Geotechnology & Engineering Department, Sandia National Laboratories
Anay Luketa (Ph.D., Mech E.), Principal member of technical staff Fire Science & Technology Department, Sandia National Laboratories
Chad Wocken (B.S., Chem E.), Senior research manager University of North Dakota Energy & Environmental Research Center
Steven Schlasner (Ph.D., Chem E., MBA), Research engineer, PE (OH, OK) University of North Dakota Energy & Environmental Research Center
Ray Allen (B.S. Chem E.), PE (TX) President of Allen Energy Services engineering consulting firm
David Rudeen (B.S. Applied Math), Code developer and data analyst GRAM, Inc. technical services company
5
PRELIMINARY DATA

Project Workflow
Problem definition phase (current SNL/EERC work scope) Define crude oil properties that have a bearing on handling and
transport safety with attention to flammability risks in spill scenarios
Experimental phase (possible SNL/EERC future work scope) Measure parameter ranges for relevant crude properties in transport
system, compare with literature and other parallel efforts (PHMSA, API, CCQTA)
Explore if/how these properties affect the degree of hazard realized in scenarios where fire may be involved
Application phase (all stakeholders) Utilize knowledge gained during above phases to inform decisions on
industry best practices, standards, regulatory requirements to assure safe, economical transport of crude to market
6
PRELIMINARY DATA

Deliverables
Literature Survey of Crude Properties Relevant to Handling and Fire Safety in Transport Draft version is in review at DOE sponsor (as of mid‐Feb 2015) Intended to be available for public release ~March 2015
Sampling and Analysis Plan Written to identify and close important knowledge gaps Initial version currently being drafted, preliminary stages DOE will administer a formal peer review process to include external
stakeholders Timeline is uncertain right now due to iterative process of peer
review, but expecting public release in CY 2015
7
PRELIMINARY DATA

Focus for today’s presentation
Highlights of literature survey Tight oils operating
environment Crude oil properties, data
comparisons Potential combustion events
relevant to rail transport
8
PRELIMINARY DATA

Executive Summary Objective is to describe physical properties of crude oil relevant to flammability
and transport safety If and how these properties will relate to fire and explosion hazard is the key
research question we need to address The vapors (not liquid) from a flammable liquid actually burn, so understanding
what leads to vapor formation during handling, transport and spill scenarios is key to understanding the flammability risks
General lack of uniformity in methods and QA/QC across industry makes comparisons of crude oil vapor pressure difficult, leaving room for improvement
Bakken crude, a representative tight oil, exhibits statistically higher vapor pressure than typical oils stored at SPR due to slightly higher mole fractions of light hydrocarbons
Several combustion events (pool fire, BLEVE, fireball, explosion, flash fire, flare) can occur from an accidental release of a liquid hydrocarbon
No single parameter defines the degree of flammability of a fuel; rather, several parameters are relevant
In an accident scenario enough energy will be generated to cause ignition, far exceeding any hydrocarbon flammability classification threshold
9
PRELIMINARY DATA

TIGHT OIL OPERATING ENVIRONMENT
10
PRELIMINARY DATA

Coverage in Written Report
11
PRELIMINARY DATA

Tight Oils
12
Oil produced from low‐permeability reservoir rock Typically stimulated with hydraulic fracturing to produce at
economic rates
Crude API gravity
Sulfur (wt%)
Bakken 40-43 0.1
WTI 37-42 0.42
LLS 36-40 0.39
Eagle Ford 47.7 0.1
Eagle Ford Light
58.8 0.04
Source: Auers, J. R., R. M. Couture and D. L. Sutton (2014). "The North Dakota Petroleum Council Study on Bakken Crude Properties." Bakken Crude Characterization Task Force. North Dakota Petroleum Council, Bismarck, ND 58501. 4-Aug-2014.
PRELIMINARY DATA
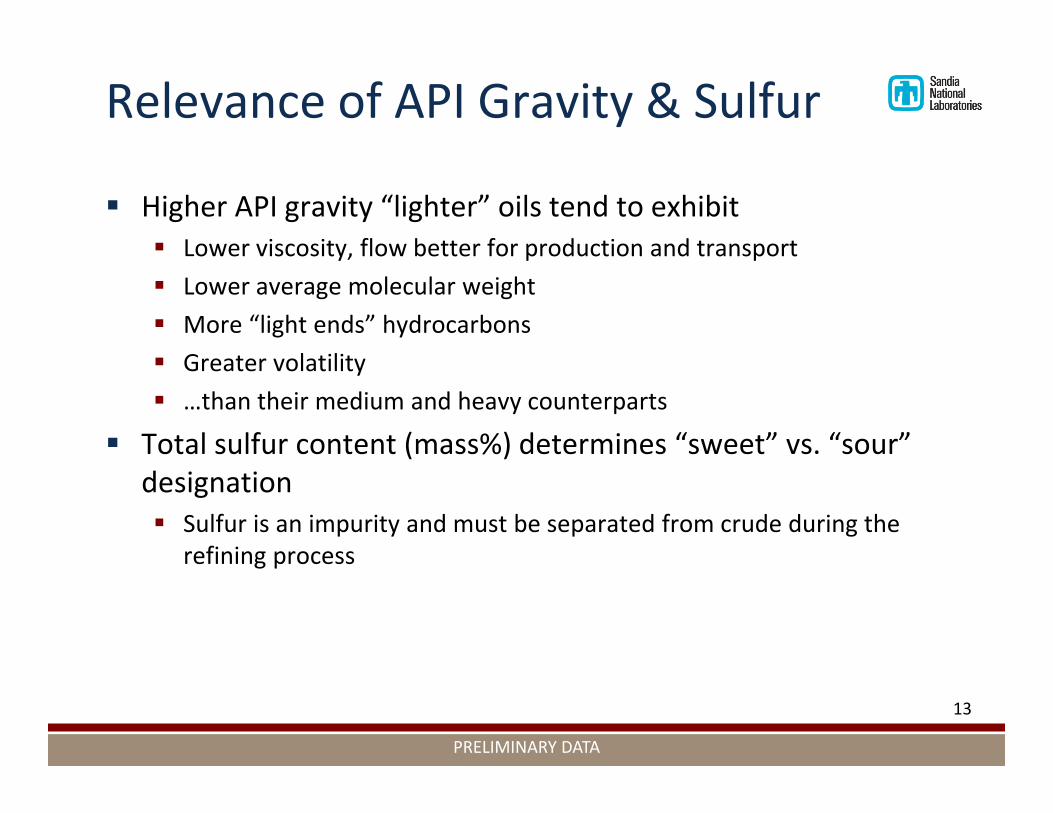
Relevance of API Gravity & Sulfur
Higher API gravity “lighter” oils tend to exhibit Lower viscosity, flow better for production and transport Lower average molecular weight More “light ends” hydrocarbons Greater volatility …than their medium and heavy counterparts
Total sulfur content (mass%) determines “sweet” vs. “sour” designation Sulfur is an impurity and must be separated from crude during the
refining process
13
PRELIMINARY DATA

CRUDE OIL PROPERTIES
14
PRELIMINARY DATA

Properties of interest
Useful to predicting combustion‐related events, fire sciences perspective Heat of combustion Flammability limits Fuel composition in liquid phase Fuel composition in evaporating phase Density Molecular weight Boiling point temperatures
15
PRELIMINARY DATA
Already have these for many oils in U.S. Strategic Petroleum Reserve (SPR)• True vapor pressures• Flash gas compositions• Whole oil compositions• Avg. MW• Liquid density

Importance of Phase Behavior
A primary motivation for this study is understanding the fire and explosion hazards associated with accidental release of crude oil in the transport environment It is the vapor emissions from a “flammable liquid” that actually burn Conditioned/stabilized crude is typically tested, transported, and sold
in the liquid phase and associated vapor losses during handling and transport, if any, are not well‐characterized
Vapor losses may not cause measurable financial impact from a sales perspective but could lead to elevated risk from a hazards perspective
It is therefore prudent to examine the phase behavior of crude, specifically the potential for formation of vapor phase emissions, in order to understand the conditions that contribute to fire and explosion hazards around spills
16
PRELIMINARY DATA

Vapor Pressure of Crude Oil Terms vapor pressure, Reid, and true vapor pressure are often used in
literature with reference to crude oils, sometimes interchangeably, leading to considerable confusion
Crude oil true vapor pressure Total pressure exerted by a gas phase in equilibrium with a liquid at a
specified temperature and V/L Bubblepoint pressure is a special case at V/L = 0 Maritime/tanker references to true vapor pressure as P @ V/L = 0
Reid Vapor Pressure (ASTM D323) Routinely measured oil quality parameter Introduces air saturation and cooling/heating steps with 4:1 V/L, so not
directly applicable as a material property of the crude
ASTM 6377: VPCR(x) Applied to crude oils where x (= V/L) can vary from 0.02 to 4 Best coupled with closed sampling to minimize light ends loss during sample
collection 17
PRELIMINARY DATA
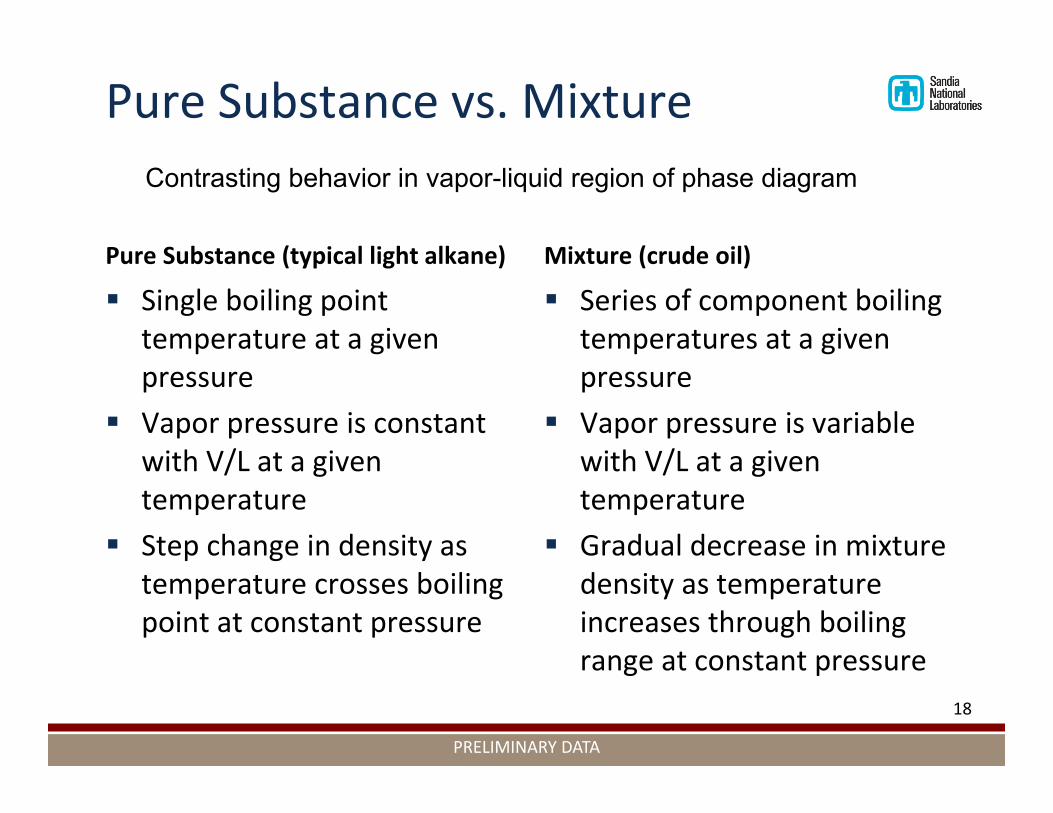
Pure Substance vs. Mixture
Pure Substance (typical light alkane)
Single boiling point temperature at a given pressure
Vapor pressure is constant with V/L at a given temperature
Step change in density as temperature crosses boiling point at constant pressure
Mixture (crude oil)
Series of component boiling temperatures at a given pressure
Vapor pressure is variable with V/L at a given temperature
Gradual decrease in mixture density as temperature increases through boiling range at constant pressure
18
Contrasting behavior in vapor-liquid region of phase diagram
PRELIMINARY DATA

Pure Substance vs. Mixture
19
Pre
ssur
e
Volume gas / Volume Liquid (or V/L)
0 0.5 1.0 1.5
Liquid
Vapor
2.0
Pure Substance
@ Constant temperature
PRELIMINARY DATA

Flash gas composition
20
SPR crude oil WH108, April 2011, API = 37.2
PRELIMINARY DATA

Flash gas composition
21
SPR crude oil WH108, April 2011, API = 37.2N2 and C1 decrease, C2-C6 increase with drop in confining pressure from 18.1 →14.7 psia Vapor space
composition will change to favor incrementally heavier components with decrease in confining pressure and/or increase in V/L
PRELIMINARY DATA

Mixture PVT Behavior, SPR Example
22
PRELIMINARY DATA

DATA COMPARISONSPhysical/chemical properties of Bakken and SPR oils
23
PRELIMINARY DATA

Sources
Auers, J. R., R. M. Couture and D. L. Sutton (2014). "The North Dakota Petroleum Council Study on Bakken Crude Properties." Bakken Crude Characterization Task Force. North Dakota Petroleum Council, Bismarck, ND 58501. 4‐Aug‐2014. Referred to as “NDPC report”
PHMSA (2014). "Operation Safe Delivery Update." U.S. Department of Transportation, Washington, D.C. Jul‐2014. Referred to as “PHMSA report”
Strategic Petroleum Reserve (SPR) vapor pressure program data Crude receipts 1999‐2012
One Bakken pipeline sample from December 2012 (oAPI = 42)
Oils in storage24
PRELIMINARY DATA

Challenges for Comparison Sampling methods are not consistent
NDPC study used open catch with sealed glass jar Small number of floating piston cylinder
PHMSA used open catch sampling method Small number of closed syringe‐style
SPR used closed tight‐line or floating piston‐cylinder
Test conditions not consistent NDPC and PHMSA ran ASTM D6377 VPCR4(100 F) SPR ran flash separator at 100°F and imported into EOS to simulate
VPCR(100 F)
Short Timeline Many sources of Reid Vapor Pressure, but we did not have time to
process and interpret for this project review Did not have time to carefully analyze PHMSA and NDPC closed
sample results 25
PRELIMINARY DATA

Bases for comparisons
API gravity Vapor pressure @ 100°F
VPCR4 Bubblepoint pressure (BPP), where V/L = 0
Gas‐oil ratio (GOR) @ 100°F and P = 1 atm Standard cubic feet of gas per barrel of liquid
Oil composition Light ends vol%, wt%
26
PRELIMINARY DATA

V/L expansion = 4
Appears to have origins in Reid method, though relevance to current operating conditions is not clear
Experimental method ASTM D6377 Standard Test Method for Determination of Vapor
Pressure of Crude Oil, VPCR4 (Expansion Method) Expand crude oil sample to selected V/L at fixed T, measure P
Numerical modeling method Utilize equation of state (EOS) model to estimate P Requires knowledge of “whole” oil compositions SPR does not collect expansion data at VPCR(4) SPR VPCR4 is simulated with an EOS model
SPR collects flash separator data for compositions at VLE SPR collects some VPCR0.05, 0.2, 0.5 (90, 100, 120F) data
27
Vapo
r
V/L
= 0
V/L
= 4
Exp
and
cylin
der
PRELIMINARY DATA
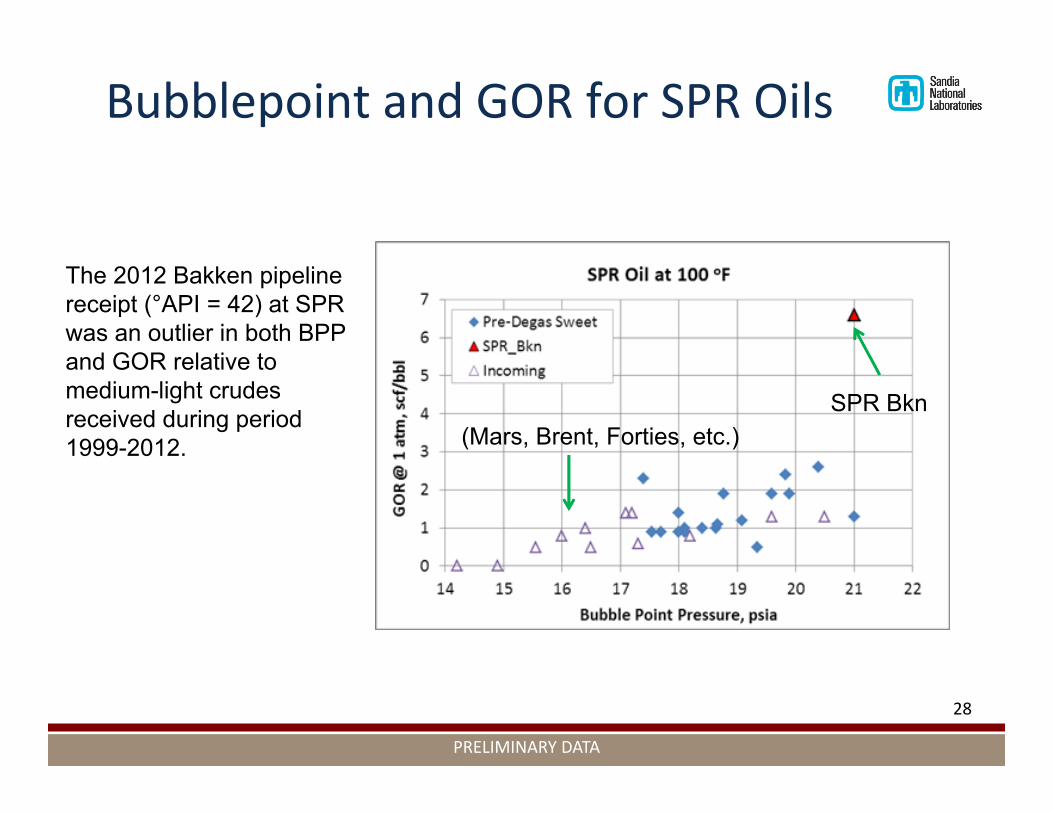
Bubblepoint and GOR for SPR Oils
28
SPR Bkn(Mars, Brent, Forties, etc.)
The 2012 Bakken pipeline receipt (°API = 42) at SPR was an outlier in both BPP and GOR relative to medium-light crudes received during period 1999-2012.
PRELIMINARY DATA
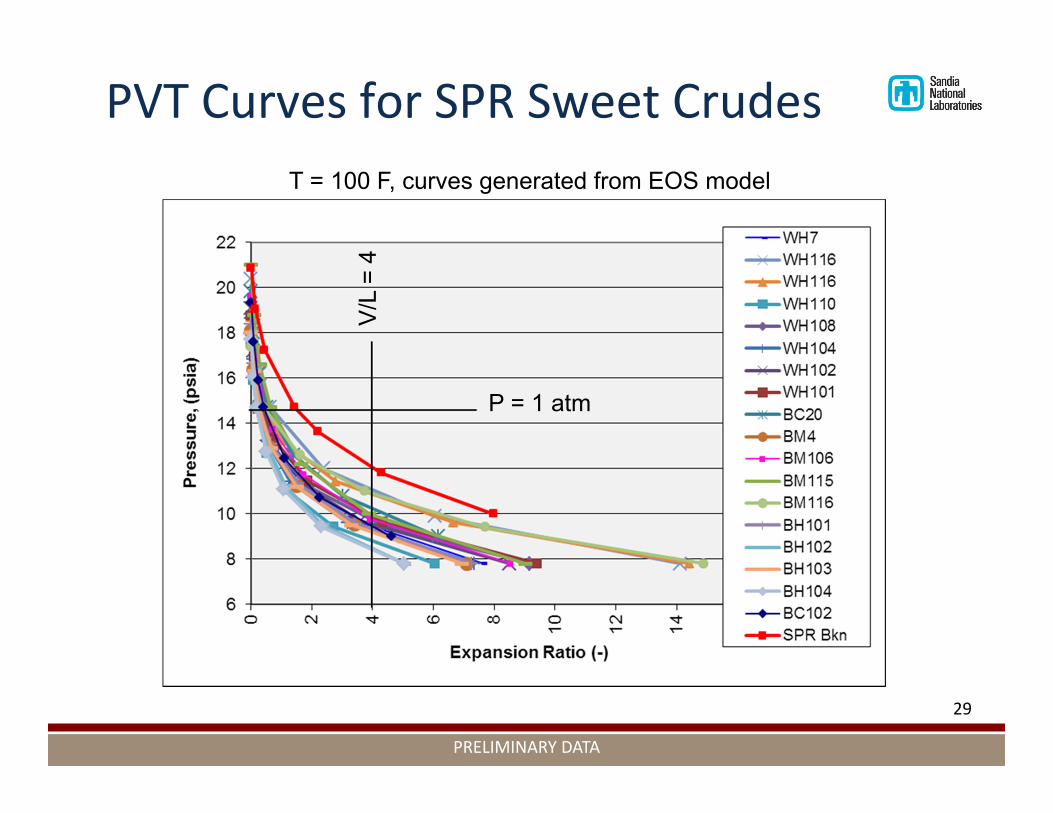
PVT Curves for SPR Sweet Crudes
29
T = 100 F, curves generated from EOS model
P = 1 atmV
/L =
4
PRELIMINARY DATA

Flash Comps, SPR Bkn vs. WH108
30
C2, C3, C4 prevalent in higher GOR flash gases
BPP [psia]
GOR [scf/bbl]
SPR Bkn 21.0 6.6
SPR WH108
18.1 1.4
PRELIMINARY DATA

Whole Oils, SPR Bkn vs. WH108
31
SPR Bkn WH108mole fra c mole frac
Nitroge n 0.0004 0.0006Carbon Monoxid 0.0000 0.0000Carbon Dioxide 0.0002 0.0007Argon 0.0000 0.0000Oxygen 0.0000 0.0000Hydrogen Sulfid 0.0000 0.0000Methane 0.0009 0.0004Etha ne 0.0073 0.0035Propane 0.0345 0.0285Iso-Buta ne 0.0145 0.0126N-Buta ne 0.0541 0.0468Iso-Pe ntane 0.0300 0.0301N-Pe ntane 0.0468 0.0443N-Hexane 0.1172 0.1173He ptane s 0.1110 0.0927Benze ne 0.0044 0.0096T oluene 0.0105 0.0162Ethyl Be nze ne 0.0034 0.0042Xylene s 0.0211 0.0183Re sidua l 0.5438 0.5745
PRELIMINARY DATA
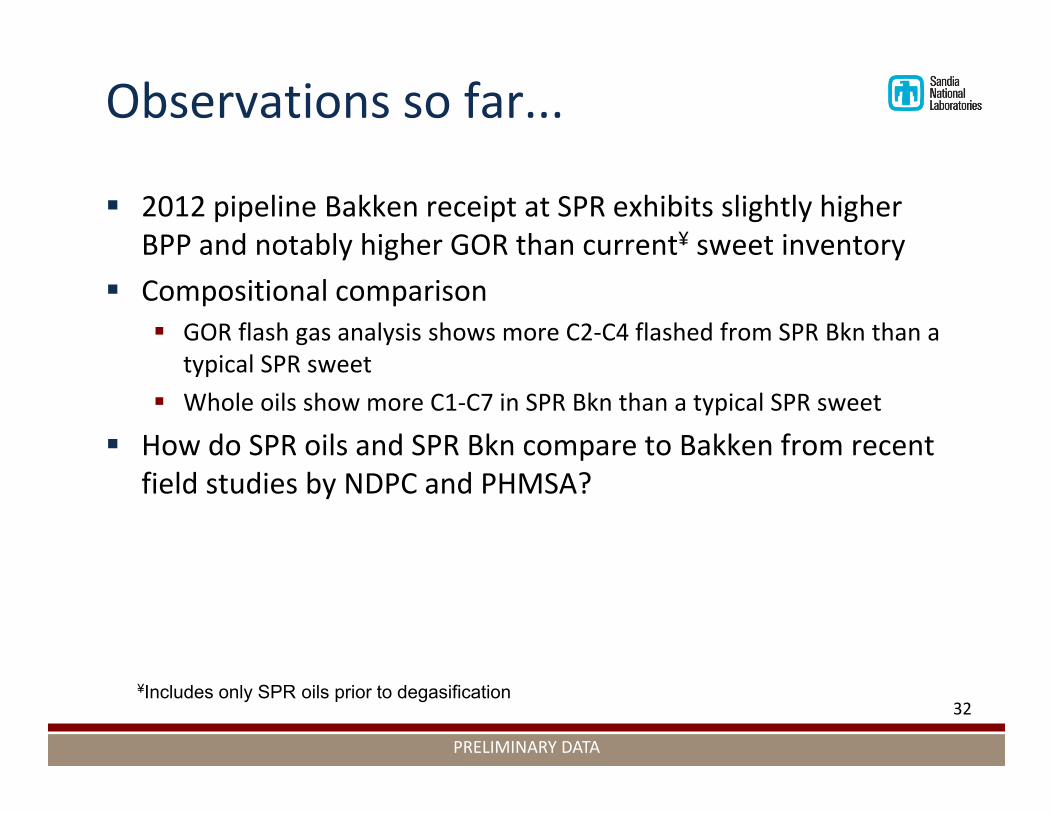
Observations so far...
2012 pipeline Bakken receipt at SPR exhibits slightly higher BPP and notably higher GOR than current¥ sweet inventory
Compositional comparison GOR flash gas analysis shows more C2‐C4 flashed from SPR Bkn than a
typical SPR sweet Whole oils show more C1‐C7 in SPR Bkn than a typical SPR sweet
How do SPR oils and SPR Bkn compare to Bakken from recent field studies by NDPC and PHMSA?
32¥Includes only SPR oils prior to degasification
PRELIMINARY DATA

VPCR4(100F) vs. API Gravity
33
• NDPC rail data from “Appendix 6 - Lab Data – Rail”• PHMSA data from “Table E”
PRELIMINARY DATA
VP
CR
4(10
0F),
psia
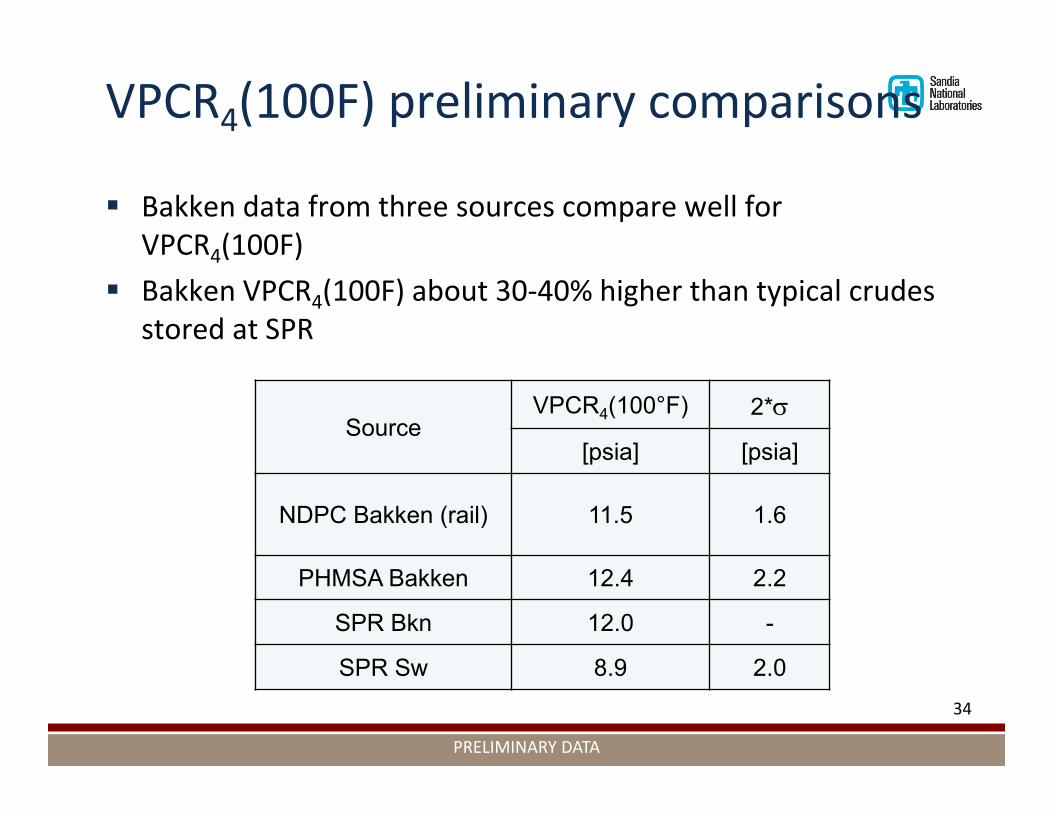
VPCR4(100F) preliminary comparisons
34
Bakken data from three sources compare well for VPCR4(100F)
Bakken VPCR4(100F) about 30‐40% higher than typical crudes stored at SPR
PRELIMINARY DATA
SourceVPCR4(100°F) 2*
[psia] [psia]
NDPC Bakken (rail) 11.5 1.6
PHMSA Bakken 12.4 2.2
SPR Bkn 12.0 -
SPR Sw 8.9 2.0

Light Ends Comparisons
35
Averaged NDPC Appendix 8 – IP344 Light Ends Data – Rail, vol% for Bakken samples
Averaged PHMSA table E Light Ends Liq vol % SPR Bkn and SPR WH108 samples
PRELIMINARY DATA

Comparisons in Summary
Sampling and analysis techniques differ among NDPC, PHMSA, and SPR, so direct comparison is difficult
In spite of above, VPCR4(100F) appear to compare well for Bakken data from different sources
Light ends (C2‐C6) also compare well among Bakken samples from different sources No‐detect on methane and absence of nitrogen masks some
important players C2‐C6 vol % of SPR WH108 sample all lower than avg. Bakken
VPCR4(100F) of Bakken independent of source (PHMSA, NDPC, SPR Bkn) is avg. ~30‐40% higher than typical crude stored at SPR
36
PRELIMINARY DATA

POTENTIAL COMBUSTION EVENTSContext for hazards in a crude oil rail car breach
37
PRELIMINARY DATA

Coverage in Written Report
PRELIMINARY DATA
38

Combustion Event Tree
39
Tank rupture
non-BLEVEBLEVE
• Fireball• High speed
projectiles• Overpressures
Delayed ignition
Immediate ignition
pool fire
flash fire
Vapor cloud explosion
detonationdeflagration
flare

Combustion events
These events can occur with any liquid hydrocarbon Severity of an accident will depend upon the amount of fuel,
surrounding infrastructure, and environment No single parameter defines the degree of flammability
Lower flashpoint, wider range of flammability limits, lower auto‐ignition temperature, lower minimum ignition energy, and higher maximum burning velocity is considered more flammable
In an accident scenario enough energy will be generated to cause ignition, far exceeding any hydrocarbon flammability classification threshold
40
PRELIMINARY DATA

Properties for Hazard Calculations
Large‐scale tests
41
Combustion Event Properties Scale
Pool fire measurements • Burn rate• Surface emissive power• Flame height
• ~1 to 10 m, • bund and free spill
Fireball/BLEVE • Geometry• Surface emissive power• Duration• Fragment
characterization (velocities, geometry, range)
• Overpressures
Rail car(could help design/test
the modified rail car)
Vapor cloud (flash fire, explosion)
• Composition Rail car(‘Damaged’ mock)

Executive Summary Objective is to describe physical properties of crude oil relevant to flammability
and transport safety If and how these properties will relate to fire and explosion hazard is the key
research question we need to address The vapors (not liquid) from a flammable liquid actually burn, so understanding
what leads to vapor formation during handling, transport and spill scenarios is key to understanding the flammability risks
General lack of uniformity in methods and QA/QC across industry makes comparisons of crude oil vapor pressure difficult, leaving room for improvement
Bakken crude, a representative tight oil, exhibits statistically higher vapor pressure than typical oils stored at SPR due to slightly higher mole fractions of light hydrocarbons
Several combustion events (pool fire, BLEVE, fireball, explosion, flash fire, flare) can occur from an accidental release of a liquid hydrocarbon
No single parameter defines the degree of flammability of a fuel; rather, several parameters are relevant
In an accident scenario enough energy will be generated to cause ignition, far exceeding any hydrocarbon flammability classification threshold
42
PRELIMINARY DATA

END OF PREPARED SLIDES
43
PRELIMINARY DATA