DOCUMM7 O. 04232 i~i4Sn~ MAY 1970
89
DOCUMM7 O. 04232 -20 i~i4Sn~ MAY 1970 FlAL t-,5 t (2 U91 r>CO , ~(t9 #in~iI~~' \, EE.Prt, E"- amm t~1iJ.~(Jstii p ~~-~ I (-k- /u zv 'A M Q5~'Lta !IIU _ (CJ dcc:, SEVI r0 i riN21 https://ntrs.nasa.gov/search.jsp?R=19700029761 2020-03-23T19:01:56+00:00Z
Transcript of DOCUMM7 O. 04232 i~i4Sn~ MAY 1970

DOCUMM7 O. 04232
-20i~i4Sn~ MAY 1970
FlAL
t-,5t (2U91 r>CO ,
~(t9#in~iI~~'
\,
EE.Prt,
E"- amm
t~1iJ.~(Jstii
p
~~-~ I(-k
/u zv 'A M Q5~'Lta !IIU _
(CJ
dcc:,
SEVI r0 i riN21
https://ntrs.nasa.gov/search.jsp?R=19700029761 2020-03-23T19:01:56+00:00Z

N70-39077
LABORATORY CAMERA
MODEL HIGH RESOLUTION TELEVISION
A. B. Schechner
General Electric Valley Forge Space Center Philadelphia, Pennsylvania
20 May 1970
80..0
0 O
~Disiributed.,,,'to foster, serve
and promote the nation's economic development
and technological advancement.'
NATIONAL TECHNICAL INFORMATION SERVICE
005*5 0 @5.
0@.: 0
0 000 00.
0
..*
0. US. EPA RTME NT oFCOM MECE
*0
000*0 0
This document has been approved for public release and sale.

NOTICE
This document has been reproduced from the best copy
furnished us by the sponsoring agency. Although it is
recognized that certain portions are illegible, it is
beiig released in the interest of making available as
much information as possible.

DOCUMENT NO. 70SD4232 20 MAY 1970
F!NAL REPORT
LABORATORY MODEL HIGH RESOLUTION
TELEVISION CAMERA
PREPARED FOR
MANNED SPACECRAFT CENTER NATIONAL AERONAUTICS AND SPACE ADMINISTRATION
HOUSTON, TEXAS
-PREPARED UNDER
CONTRACT NO. NAS-98887
PREPARED BY
A.B. SCHECHNER
GENERALS ELECTRoC SPACE SYSTEMS ORGANIZATION
Valley Forge Space Center-
P.0. Box 8555 - Philadelphia, Penna. 19101

TABLE OF CONTENTS
Section Page
INTRODUCTION ............... vii
I SENSOR DEVELOPMENT . . .......... 1-1
1. 1 Ultra High Resolution (UIHR) Vidicon.. .. 1-1 1. 2 Slow Scan Photoconductor (Selenium Doped) 1-3
1.2.1 Sensitivity........ .. . 1-3 1. 2.2 Spectral Response..... ..... 1-7 1.2.3 Resolution ......... 1-7'_ ... 1.2.4 Target Voltage...... . ; . . . 1-7 1.-2; 5 Dark Current .i.........1-7 1. 2. 6 Temperature....... ..... 1-7 1. 2.7 Residual Signal .......... 1-10
2 FPS-5 HIGH RESOLUTION TELEVISION . ....... 2-1
2.1 Sync Generator............ . 2-7 2.2 Deflection Circuitry ............ 2-15
2,2.1 Commercial Rates ......... 2-16 2.2.2 Shading Correction. ......... 2-16
2.3 Video Preamplifier ........... 2-16
2.4 Video Processor. . .......... 2-20 2.5 Bias System Power Supplies .. ........ 2-23 2.6 Line Drivers.. . ............ 2-24 2.7 Failsafe and Blanldng. .......... 2-24
3 CAMERA OPERATION ............. 3-1
3.1 Camera Startup ............. 3-1 3.-2 Operating Parameters .......... 3-2
3.2.1 Grid 1 ... .. . ........ .. 3-2 3,2.2- Grid2 .. ........... 3-2 3.2.3 Grid 4 .......... .... 3-2 3.2.4 Grid 5............ . 3-3
3.2.5 Mesh ............. 3-3 3.2. 6 Target ......... ...... 3-3
3.2.7 Focus and Prefocus Coils ........ 3-3 3.2. 8 Deflectrons ........... 3-3 3.2.9 Bias . . .. . . . .. . . . . 3-4 3.2.10 Alignment Coil . ... ........ 3"4
,O-- LIMED.
PRECEO1D/G Diii
RECrDING P: !T

TABLE OF CONTENTS (Cont'd)
Section Page
4 CAMERA itVALUATION ......... ..... 4-1
4. 1 Determination of Illumination ........ 4-1 4.2 Setting Up the Test Chart . ........... 4-2 4. 3 Limiting Resolution . ........... 4-4 4.4 Gray Scale . .............. 4-5 4. 5 Signal/Noise .............. 4-5 4. 6 Shading........... . .... . 4-5 4.7 Lag . . ............... 4-5 4. 8 System Video Response........ . .... 4-6 4. 9 Gamma Correction ............ 4-6
5 DATA EVALUATION .............. 5-1
5.1 Resolution .. . _............ 5-1 5.2 Transfer Characteristic .......... 5-2 5.3 Image Lag . .............. 5-2
6 CONCLUSIONS ................ 6-1
6. 1 Scene Contrast. ............ 6-i 6.2 Scene Illumination ............ 6-2 6.3 Off-Axis Resolution . ........... 6-2
....6.4 Storage Time _._. .. ... .... 6-2 6.5 Camera Design Improvement. ........ 6-2
6.5.1 Reduce Frame Rate . ........ 6-2 6.5.2 Aperture Response Correction ..... 6-3 6.5.3 Camera Evaluation at Reduced Frame
Rate . ............. 6-3
WPPENDIX A: DOYLE CHART . ................. A-i
APPENDIX B: RETMA CHART.. .......... . . .. B-i
APPENDIX C: EXPLANATION OF RETMA CHART ..... .... C-i
APPENDIX D: TUBE PIN LAYOUT . ... ........... D-1i
iv

LIST OF ILLUSTRATIONS
Figure Page
1-1 Basic Structure of UHR Vidicon Type FPS-5 .. ..... 1-2 1-2 THR Vidicon, Type FPS-5 . .. ......... 1-2 1-3 Signal Output versus Illurnination . .............. 1-4 1-4 Signal and Dark Current versus Target Voltage . . ... 1-5 1-5 Signal Output versus Frame Time. .. ._.... .1-6 1-6 Relative Spectral Response of Slow Scan Vidicons . . . 1-8 1-7 Typical Resolution versus Storage Time 1-9
2-1 Camera System, Block Diagram....... . ..... 2-2 2-2 Camera System Layout ............. 2-3 2-3 Cable Diagram .. .............. 2-5 2-4 Sync Generator Circuit Diagram .. ......... .2-9 2-5 Sweeps, Blanking and Failsafe Circuit Diagram ..... 2-17 2-6 Video Preamplifier Circuit Diagram. ........ 2-19 2-7 Video Processor Block Diagram .......... 2-20
.2-8 Video Processor Circuit Diagram ... ....... 2-21 2-9 Bias Network ............. .... 2-24 2-1-0 Power Supplies and Bias, Circuit Diagram ...... 2-25 2-11 Focus Current Regulator and Alignment Coil ...... 2-29
3-1 Horizontal Sweep Adjustments . .......... 3-5 3-2 Vertical Sweep Adjustments. ........... 3-5
4-1 Optical Path........ . ... ....... 4-2 4-2 Image of Double Doyle Chart on Target. H Centering
Shifted to Include Right Side of Target (Inner Circle) . . 4-3 4-3 Image of Left Side..... .... . ..... 4-3 4-4 Resolution ............. ..... 4-7 4-5 Gray Scale ................. 4-7 4-6 Signal Output .... ........... .... 4-8 4-7 Noise.... ....... ... . 4-8..... 4-8 Noise . ............. .... ... 4-8 4-9 Shading.......... ....... . . 4-9 4-10 Lag.......... ........... 4-9 4-11 System Video Response ............. 4-10 4-12 Gamma Correction .............. 4-10 4-13 Gamma Correction ..... ......... 4-10
v

LIST OF ILLUSTRATIONS (Cont'd)
Figure Page
5-1 Modulation Transfer Function Corrected for Lens Response ..... ............. 5-3
5-2 S/N versus Resolution. 5-4 5-3 Optical Transfer Function .. ........ ... 5-5 5-4 Modulation Transfer Function Corrected for Lens
Response .... ......... . ...... 5-6 5-5 Square Wave Response - S/N versus Resolution ..... 5-7 5-6 Square Wave Response ..... ............... 5-8 5-7 Limiting Resolution versus Percent Contrast...... . 5-9 5-8 Signal Amplitude versus Faceplate Illumination ..... 5-10 5-9 FPS-5 Vidicon Image Lag ............ 5-11
vi

INTRODUCTION
The UHR Laboratory Model Vidicon Camera System was built for the NASA/Manned Space
craft Center under Contract No. NAS 9-8887. The objective was twofold: 1) to construct
a television camera system utilizing the newly developed FPS-5 vidicon pick-up tube from
General Electric's IDO facility in Syracuse, N. Y., and 2) to conduct a measurement pro
gram aimed at learning the features of this tube and its performance capabilities.
The camera design had to take into account some ten bias voltages and four deflection
signals, whose nominal values were not known to a sufficient degree when the program began.
Consequently, a control network resulted that was, perhaps, even more flexible than needed
in light of what has been learned since. Specifications were drawn up at the start of the
program and the most significant of these, with final results, are shown in Table I. In
all, the camera performed as well as or better than anticipated, pointing the way to various
applications.
Contained in this report are the following:
1. A discussion of UIH Sensor Development
2. A description of the system with photographs, drawings and schematics
3. Camera operating parameters
4. Test Procedures and Photographs
5. Results and Analysis
6. Recommendations
7. Appendix, supporting material
This opportunity is taken to acknowledge the contributions and advice of Dr. X. Schlesinger,
regarding the sensor; A. Baran, J. Smith and C. Mazzocco for Electronic Design;
F. M. Leccese and G. J. Rayl for their consultation and support.
vii

--
Table 1. High Resolution TV Camera System
Parameter
Resolution
Signal Level
Signal-to-Noise
Gray Steps
Shading
Lag
Light Intensity
Gamma
Bandwidth
Frame Time
Scan Line No.
Jitter in'Scan
Power Consumption
Specification
4000 TVL/picture height
1 V P-P into 50 ohms
26 dB min
6
15% edge-to-edge
50%
2 ft-candles
1.2 - 0.7
+ 2 dB over operating range
< 10 seconds
+ 0. 01%
50 watts nom.
Measured Performance
4200 X and Y
1.45 V P-P
39.4 dB
9
+ 10%
45%
0. 9 ft-candles for all measurements
1.29 --. 0.7
+ 1 dB 8 Hz to 12 mHz
1 second
5499
<"0. 0035%
80 watts
viii

SECTION 1
SENSOR DEVELOPMENT
1. 1 ULTRA HIGH RESOLUTION (UHR) VIDICON
A UHR vidicon with 2. 5-inch slow scan photoconductor was developed for application to this
high resolution camera. This tube is referred to as Type FPS-5. It was designed to scan
a square format (aspect ratio 1:1) on a minimum usable target diagonal of 2. 5 inches.
Resolution was specified as 4000 TV lines per picture height. This implies a spot size of
approximately 0.4 mil or 10 microns. Present developmental tubes yield consistent
readings of 0.28 mil = 7 microns, spot size in the paraxial region.
The basic design of the FPS-5 is shown in Figure 1-1 and a photograph of the tube is shown
in Figure 1-2. This shows a high-intensity source with a small-spot defining apetture
(0. 005-inch) at (4). * This object is followed by an imaging system comprising two mag
netic lenses (2) and (3). Lens (3) is a shielded lens with short focus. It is powered by less
than 1 watt and projects a real image of the aperature (4) with a demagnification of 1:1/3.
The result is an extremely sharp (3. 5 microns) "primary focus" F 1 whose position at the
entrance to the FPS cavity can be controlled to some extent by varying the focal length of
lens (3). Lens (2) is adjusted to focus on target a 1:1 real image of this. primary focus.
This "secondary focus" (F 2 ) sweeps the target under the influence of crossed electric (1)
and magnetic (2) fields generated within the FPS cavity. Given a sufficiently narrow beam
divergence at F 1 (half-angle - 2 degrees) spherical-aberration in the relaying lens (2) can
be kept under control. This is borne out by experimental evidence.
To prove this concept of tube design, two tubes of the type shown in Figure 1-1 were built
and tested. The first of these tube samples proved the superiority of magnetic prefocusing
over an electrostatic lens system which had also been incorporated within thb same envelope.
• Numbers in parentheses refer to numbers called out in Figure 1-1.
1-!

Ua ____ ------
Figure 1-1. Basic Structure of UHR Vidicon, Type FPS-5
Figure 1-2. UHR Vidicon, Type FPS-5
1-2
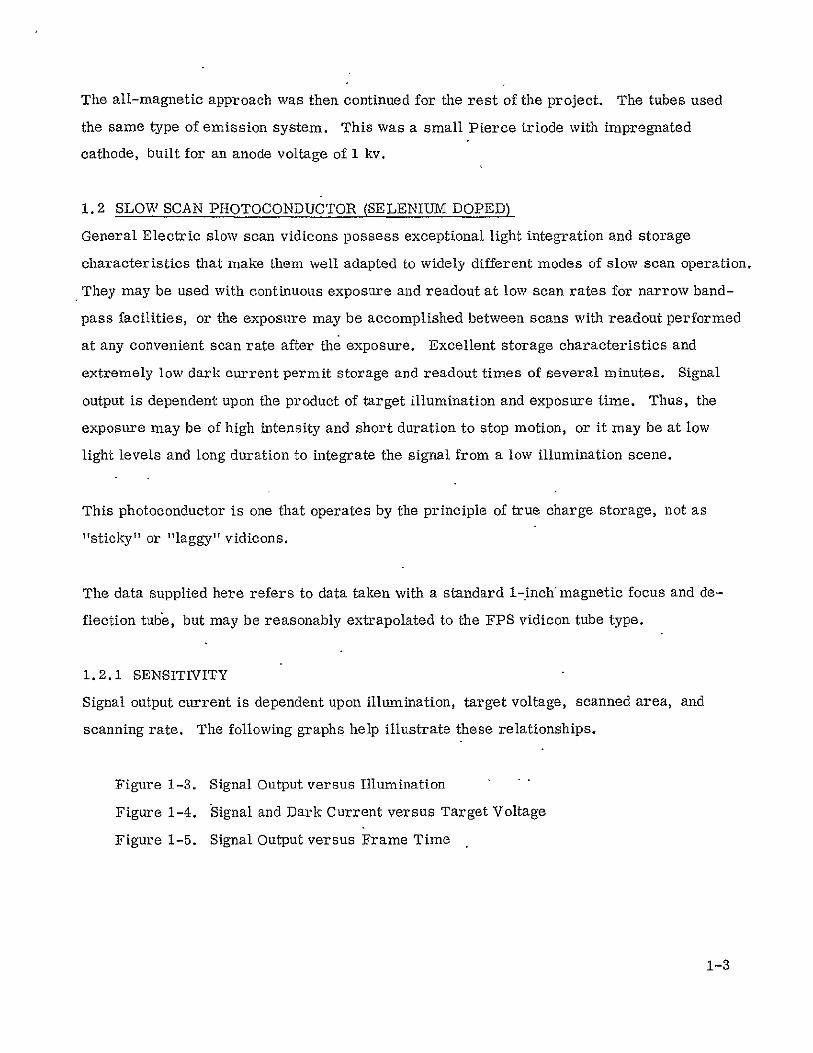
The all-magnetic approach was then continued for the rest of the project. The tubes used
the same type of emission system. This was a small Pierce triode with impregnated
cathode, built for an anode voltage of 1 kv.
1.2 SLOW SCAN PHOTOCONDUCTOR (SELENIUM DOPED)
General Electric slow scan vidicons possess exceptional light integration and storage
characteristics that make them well adapted to widely different modes of slow scan operation.
They may be used with continuous exposure and readout at low scan rates for narrow band
pass facilities, or the exposure may be accomplished between scans with readout performed
at any convenient scan rate after the exposure. Excellent storage characteristics and
extremely low dark current permit storage and readout times of several minutes. Signal
output is dependent upon the product of target illumination and exposure time. Thus, the
exposure may be of high intensity and short duration to stop motion, or it may be at low
light levels and long duration to integrate the signal from a low illumination scene.
This photoconductor is one that operates by the principle of true charge storage, not as
"sticky" or "laggy" vidicons.
The data supplied here refers to data taken with a standard 1-inch magnetic focus and de
flection tube, but may be reasonably extrapolated to the FPS vidicon tube type.
1.2.1 SENSITIVITY
Signal output current is dependent upon illumination, target voltage, scanned area, and
scanning rate. The following graphs help illustrate these relationships.
Figure 1-3. Signal Output versus Illumination
Figure 1-4. Signal and Dark Current versus Target Voltage
Figure 1-5. Signal Output versus Frame Time
1-3

I-. 0.10
0.05
00
0.01
HTICS
o 0.005
"/ /,.TYPICAL
vl
SLOW-SCAN TUBE LIGHT TRANSFER CHARACTERTS-
UNDER STANDARD TV CONDITIONS. CONTINUOUS EXPOSURE. 30 CPS FRAME RATE. 1/2 X 3/8 INCH SCANNED AREA
0.001 IIa {{ 0.05 0.1 0.5 1.0 5.0
FACEPLATE ILLUMINATION (FOOT-CANDLES)
Figure 1-3. Signal Output versus Illumination

STANDARD TV SCAN 1/30 SEC FRAME TIME
1/2 X 3/8 INCH SCAN AREA 1.0 FT CANDLE ILLUMINATION
0[1
S0.01
TYPICAL SIGNAL CURRENT VS TARGET VOLTAGE
'-
6
0.001
TYPICAL DARK CURRENT VS TARGET VOLTAGE
0. 0001 05
Figure 1-4.
_ 0 15 20
TARGET VOLTS
Signal and Dark Current versus Target Voltage
25 30
1-5

0.01
0. 005
p4 4
V.0001
SGAOUPTCRENT VS.
SCANNED AREA: 1/2 X 3/8 INCH
0.00
0.00 0TIL -0 1S0 50
FRAME TBIE (SECONDS)
Figure -5. Signal Output versus Frame Time
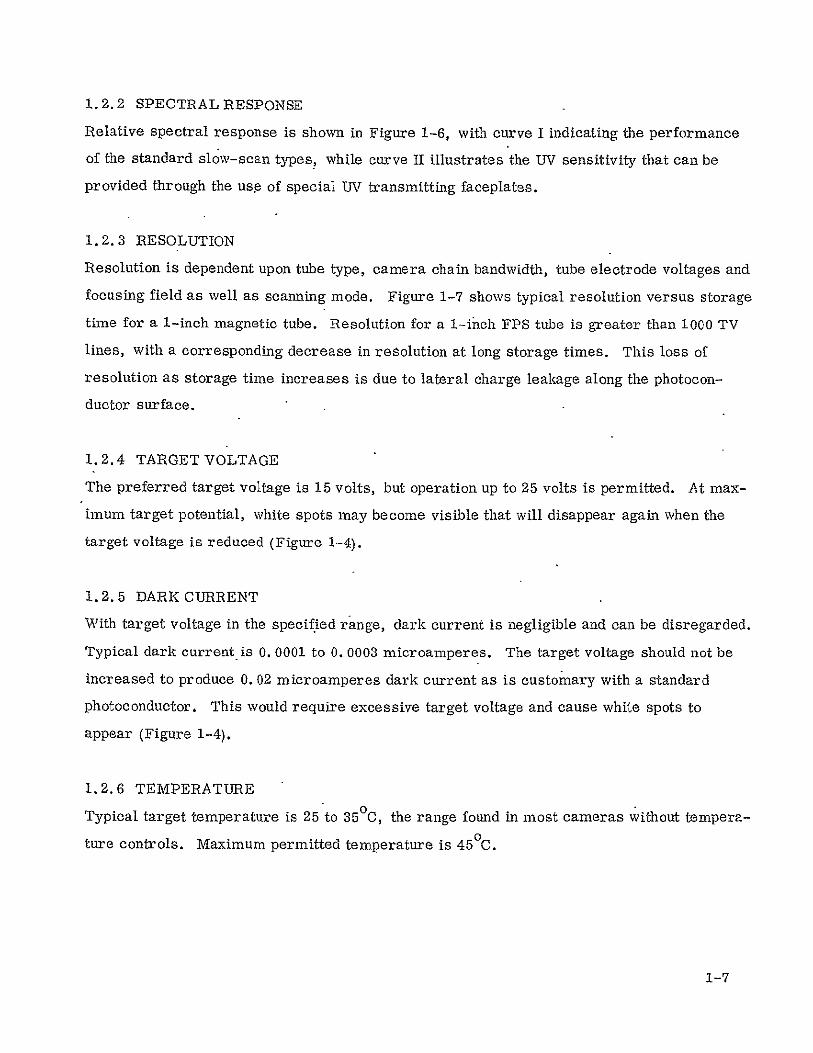
1.2.2 SPECTRAL RESPONSE
Relative spectral response is shown in Figure 1-6, with curve I indicating the performance
of the standard slow-scan types, while curve II illustrates the UV sensitivity that can be
provided through the use of special UT transmitting faceplates.
1.2.3 RESOLUTION
Resolution is dependent upon tube type, camera chain bandwidth, tube electrode voltages and
focusing field as well as scanning mode. Figure 1-7 shows typical resolution versus storage
time for a 1-inch magnetic tube. Resolution for a 1-inch FPS tube is greater than 1000 TV
lines, with a corresponding decrease in resolution at long storage times. This loss of
resolution as storage time increases is due to lateral charge leakage along the photocon
ductor surface.
1.2.4 TARGET VOLTAGE
The preferred target voltage is 15 volts, but operation up to 25 volts is permitted. At max
imum target potential, white spots may become visible that will disappear again when the
target voltage is reduced (Figure 1-4).
1.2.5 DARKCURRENT
With target voltage in the specified range, dark current is negligible and can be disregarded.
Typical dark current is 0. 0001 to 0. 0003 microamperes. The target voltage should not be
increased to produce 0. 02 microamperes dark current as is customary with a standard
photoconductor. This would require excessive target voltage and cause white spots to
appear (Figure 1-4).
1.2.6 TEMPERATURE
Typical target temperature is 25 to 35 0C, the range found in most cameras without tempera
ture controls. Maximum permitted temperature is 45 0C.
1-7

100
Z
S80
CURVE I - STANDARD TYPE
CURVE 31 - U. V. SENSITIVE TYPE
40
0
2000
TFigture 1-6.
3000 4000
WAVFLENGTII (ANGSTROMS)
REelative Spectral Response of Slow Scan Vidicons
.5000

Boo
700
600
II500
z
0 400
200
100
I I' I 11111 5 10
Figure 1-7.
1/2 X 3/8 INCH SCANNED AREA
I I I iti iil I 50 100
STORAGE TIME (SECONDS)
- Typical Resolution versus Storage Time
I I 500 1000

1.2.7 RESIDUAL SIGNAL
The slow scan vidicons operate by the principle of charge storage, rather than photoconductive
lag, thus it is possible to have short lag, yet storage times of several minutes. Typical
third field lag with standard 30 frame TV operation is approximately 30 percent. Using long
frame times, photoconductive lag may be neglected and residual signal after scanning depends
only on the beam current used. By proper adjustment of beam current, residual signal is
negligible, making the tube well suited for imaging a new scene with each frame.
1-10

SECTION 2
FPS-5 HIGH RESOLUTION TELEVISION
The entire FPS-5 High Resolution Television System includes the camera tube, synchronizing
circuit, video preamplifier, video processor, sync buffers (line drivers), electrostatic
deflection circuit and power supplies (Figure 2-1). In this configuration it is similar to other
cameras. The differences appear in the unusual deflection and bias requirements, long
vertical frame rate and other features such as the inclusion of target cooling and power supply
sequencing. Figure 2-2 shows the layout of the camera.
The video preamplifier is built on a ring-shaped printed boar& that surrounds the vidicon
target, within an aluminum cylinder that also supports the lens. target, mesh and test
point connections exist within this structure and are accessed from outside the cylinder.
Bias circuitry, size and position, video gain, blanking and focus and all associated controls
are Located on the front panel. Both coarse and fine controls are available where needed.
Fourteen meters on this panel allow constant monitoring of operating parameters. It was
deemed important that this amount of flexibility exist in a laboratory camera using a new
type sensor,
All other electronics are located in five printed circuit boards in a plug-in matrix. There
is a panel for all power supplies but the two high voltage types, which are isolated for safety.
A low pressure air pipe provides cooling air for the vidicon target and controls two vacuum
timing switches that sequence the power supplies, again a safety measure.
The structure is completed by the focus coil, wound on and shielded by an aluminum bobbin,
which encloses the entire length of the larger diameter portion of the tube. Prefocus and
alignment coils rest on the neck of the tube.
An overall cabling diagram is shown in Figure 2-3 (Schematic No. 4000-24C).
2-1

N'
l' POWER SUPPLJES
O
++500
,
BIAS SUPPLY
AND FOCUS CURRENT
REGULATOR
+3500 + 500 VDC +1200 VDC
VDC -75 VDC 420 VDC+20 VDC -20 VDC
+5 VDC +9 + 3 VDC
AIR PRESSURE SITCH
+ ;
FPS-VVCON PR AEM VIEO VIDEO PROCESSOR VIDEO
z HSYNC
., 04
H AND V SWEEPS'
CAMERA BLANKING AND
FAIL-SAFE
,V DRIVE
H DRIVE
COMP DRIVE
V DRDIE
COMP BLANK
V DRIVE
SYNC CENERATOR H BLANK
+ 2 +r
Figure 2-1. Camera System, Block Diagram

I,11," 1,7
'7
441,\
K? tf
Fiue -. aer yse Lyu 2-/

III 10
o7
A P
*P. ~ ~ To- - P-p
Pp-i? PT/ PP-e FP- - PP-RI (P-
E
PTl
P-0l
3-
FFPP3 PAP P-Plz
VIDEO PROC
EXTENDER CAPD
SYNC GEN
LINE DRIVER
nH~Z SWEEP
P FP2 1
-F-P6
Pl0
"I
P34 2, P35P1
P SCtA',
m
PPiI
Z.2 25
P"9
P3
P?
P3
AIA'-8s6
E20
-E-2i
PF. P2!
L26
SP
P25
P14
3
?P EllP3
m
-
'~
a22 p=5A.
26
A
'30
PS?D-
P36 P"5~
-
rouurFLw -

X'0 - TB aP A7 , A ~
24KI Is4
1?.~~~A TB PS-2~'FP-
G213< I5 " p-.
, rp.35 a S2~ Q; ' s
PA-t8A-P P3- a 5o..
- - + t uSA. -1
1. - 750;p$-32twv.PF. C33 -2
ASP PS- P,-,:
'M (' p P$-6
PS PS_PP-Pta6 31 PP-A ~ ) I
p -WEALGNEN-CILAS 4'4b
5rP-F
-F -J
I-ti Pot' R P
P13S ss-85EWITN0
AI5 IT 0 AI Figur 2-. abe iara
p, &tDur2-5/

- 2.1 SYNC GENERATOR
The sync generator design consists of a master oscillator, integrated circuit (TTL), count
down circuit, burst oscillator, logic and line driver circuits as shown in Figure 2-4
(Schematic No. 4000-031, 3 parts).
The master oscillator is a modified, crystal-controlled Butler oscillator. It will be operated
at any one of the following three frequencies: 5499 Hz, 5525 Hz, or 6223 Hz. These fre
quencies were selected to generate the horizontal line rate of the camera system. The frame
rate is fixed at 1 Hz. The horizontal frequencies were selected to accommodate scan formats
of 4:3, 1:1 or 3:4, with the accompanying variation in number of scan lines. A frequency of
5499 Hz was chosen to provide a 1 x 1 format.
The countdown circuits utilize the Signetics 8281 integrated circuits. These units contain
four flip-flops per package. By connecting the preset input to B+ or ground, any count
from 1 to 8192 can be obtained. The countdown circuit is laid out on a printed wiring board
and proper selection of jumper wires will generate any of the above frequencies selected.
A burst oscillator (750 kHz) is turned on with each line (horizontal) timing pulse. The burst
oscillator output is fed into a countdown circuit from which the proper timing pulses are
selected, via logic circuits, to generate the horizontal sync, drive, and blanking pulses.
At the end of the horizontal blanking period, the burst oscillator is turned off. This technique
was chosen to minimize jitter in the horizontal timing pulses.
The line drivers are designed to drive 50-ohm coaxial lines to the sweep circuits, video
processor and monitor.
The vertical blanking pulse is one line period long and is generated by triggering a flip-flop
with the countdown output and resetting the flip-flop with the next line pulse.
2-7/8

c
IAASTCRP OSCILLA47CK
E/ I
All.O
yl0
K,- __c 'ai7O'1
r00* c c 2,~ct1
4 -1 4
40
IQ'7
ra -' -*5b'

1 4 I 3 2 REVISIONS
ZONE LIR DESCRIPTION ROVED
Lb
4 C ,. .1 .4
R C21 R2" C c ,
Si C, EP2>~ 5 CP2 13 M31CP C,
C'' C, G-C-t pG. CPI IVZ.pD
pz£"
I.. A 4__+
-V o P
ro
>33
"': * 3 LACA.EIMAS 'SUR4. Pd=
' I
(~ta
C. IOCPCESGi S +
GPONDA-2,
MENIAL CTi
I 11c rE
O',T
C ' b
G A
+Y4IJEATflCP 3
S3
UN'i>STM
DIMESION
PLACDECIMAL+
AREE
A L-.T-
IN
Fiur
SCAL I
2-4.
E
--
Sync GnrtorssCictDag
Ios (SetI f3
0t1
-H~
0N,29i
m
JOL0RD0E ONRI- Set f3

7' C
0 -P4
+4iV
R7
CC
B ~ c~jCKall,
7&, PPW.E INt0.

5 2 43 2C
ZONELTR CESCRIPTIN DATE APPROVED
E
Macan'.aL 01,
oc&to
4=l"o
/CI
c
CRC
.j- -
(S."' C..
22-t
FOLD
_€.T , T-. -,,
-S j ,." r3 ~~
UNLESSOTHERtt5$ESpECIPIED '" SIbTI{Soa 5GIbkTUI:ES DIM4ENSIONSAREIS INCHES- .jn' TOLERANCES-ON.
2 PLACEDECIMALS± ALL
PLACEDECIMALS-± SURP.iUP...
IL + '1 E Ffigure±2A4.
I [°AO Y
-
- '-SNLELS
g E R A L '' E LE CT RIC DE~OPT LOG
IRCUIT ThIASRArA
Synb GeeaH iga(ATERIAL-
SHENES9IIDSGATRS0E9ERALEL E TE 2
bI"A9 0.7 2 PLAI(SheetM2ioftO.nou 3)AL 2-11/12MLS

_Z.FA _7-
Z C - Z. I)4 ~ 34 23
2i3 -4 3
72 . 0 -sv +X
2 - L s C ___
27-d 0 0 -C
-,0 0-SV '
s__PTR- o 0
081 0 0 $CV
rob*S P9J Sllbr V
0.0-DU 0 0M

5 4 !3 I2 IC,.
DATE APPROVEDDESCRIPTIONZOE ER
E:
2"?-1 9010cool0
ISV - -
9V' 0
00
Q
o oSV
-I-t v
C
0on
oSV
"+S-V
ts+v
___
____
!D
D
tAL 9t-2~ Q.+sV
z-__ __
FOLD
o 0 0____
0
5i
UNLESS SPECIFIED SSIGGW.GDEUIENS{OtNSAREIN INCHES-- n .G
LEMShES on PDLOE DECIFALS ALL3w PLCEDECIMALS SURFsu ....
FRACTIONS 6 A-+ MATERIAL_-
,SIZE
l~B 4 1
FTHERWISE t EnSE C i r DiEI
3.o.f3 O2 2-IPRCLAT D INGRA M
S yt e.Gq F-.AI TO R',
CODEIDENT140
C4000 - 031 SCALE I SMEEr3 o .F
.=
Figure 2-4. Sync Generator Circuit Diagramn
(Sheet 3 of 3) 2-13/14
FOLDOUT FRAWfr -4

The vertical drive pulse is one-half the line period in width. The.vertical drive flip-flop
is triggered with the countdown output and reset by the opposite polarity pulse of the master
oscillator output. This pulse occurs for one-half the line period if the master oscillator
output is a symmetrical square wave.
The following table lists the parameters involved in the 1 x 1 format chosen:
H and V Rates
H. Freq. 5499 Hz Aspect Ratio I x 1 V. Freq. 1 Hz V. Drive <91 Ps (.091%) V. Blank 182 ;is (. 18%) V. Flyback 9 1 tis (.091%) H. Drive 6.5 gs (3.6%) H. Blank 20 Ms (5. 5%) H. Flyback 20 gs (11%) H. Period 181.8 ts Active Scan 161.8 is
The vertical pulses are quite short (0. 18 percent) compared with the more standard 7.5 per
cent. This is to allow the maximum number of useful raster lines. It was planned to use
short horizontal pulses (5.5 percent) to permit the maximum number of horizontal resolu
tion elements. Practical considerations such as difficulty in obtaining short retrace in the
deflection circuit have limited the useful retrace time to no less than 20 microseconds (11 per
cent). The useful sweep timne is therefore s 160 microseconds.
2.2 DEFLECTION CIRCUITRY
Drive requirements for the FPS-5 deflections exceed those of most other cameras. In
order to scan a square inscribing the target, a sweep voltage of 350 volts, peak-to-peak/plate
is needed. At the same time, the capacitance between the deflectrons is 300 picofarads, a
considerably high value. At the horizontal rate of 5499 Hz, the retrace waveforms (10 micro
seconds) can be distorted due to the low capacitive reactance, The result would be a loss of
2-15

net sweep amplitude, a widening of the retrace time and unwanted pickup in the video channel.
This is overcome by driving the deflectrons with a low impedance amplifier.
The circuits (both H and V) consist of a constant-current integrator, reset by the appropriate
drive pulses. The integrator is followed by an amplifier with feedback which increases the
deflection voltage to the proper value, while maintaining linearity. On-board controls are
shown on Figure 2-5 (Schematic No. 4000-025). Emitter followers supply the push-ptl
deflection voltages via coupling capacitors to the deftectrons. Dc bias voltages are added to
the deflectrons to provide an "Electron Lens". By adjusting these voltages, astigmatism may
be minimized and centering of the raster achieved.
2.2.1 COMMERCIAL RATES
During the testing phase, switchable integrating time constants were added to the sweep
boards to allow the generation of commerciat scanning rates (15750 Hz horizontal, 60 Hz
vertical). With an external sync generator connected properly (replacing the internal sync
drive and blank signals) the camera output may be displayed on a commercial monitor. The
resolution woutd then obviously be only 300-400 lines, but if the test chart is underscanned,
resolution information can be obtained. This technique was not pursued during the initial
testing phase.
2.2.2 SHADING CORRECTION
A shading control was originally included on the X and Y deflection boards but not put into
Iuse. Instead the alignment controls were used to correct for non-uniformity.
2.3 VIDEO PREAMPLIFIER
The preamplifier schematic is shown in Figure 2-6 (Schematic No. 4000-037). Two MOSFET's
are operated in parallel to provide a high effective gfs and a low noise resistance. These are
followed by a compensation amplifier whose rising response compensates for the input RC
roll-off. The last two transistors form a low impedance driver with a direct coupled output.
Due to the large amount of gain in the preamp, considerable decoupling of the power lines is
required.
2-16

at1 Ct 7
RII TIy SIXS
att
0.1 N 3' f
1 3w:'I-IJ
20P/4 47 n 3 a,- c0 :~ B '
-'.3
Sg ec -A ~cL 4
411
20K
I~ iox r P2IJ0L
A~f 0365
P2(qn
K
F
cot
CROUIAO
ALL ft.SiiroR1 54%IVqe7 ,2Q2~'JAlt C4ICItOAZ "I, AL come zvI.Q2
ALL U5411 010015 ARE IM9257A q AALL D0t(S3 API suS'%Y (0 5 tD1:ZXZ7) GQII
TO1.TDOUT FRAME7

7 043Z
,?20 I 926 SAL.,P! it~7 " 2 t i O = , ,! Fr20? 390
KI ,~ I C2 P5O
p• 2KP2.,5 0
-. ps - VWP
1 '04 1 C 1 VS1CV
9 R28 R29hI .Ri..---o
QSSo-s" l"9 pg - c 39# Ro--
I C1 oO po,Cio,R2 , [ -3l:9,20o, :L .,45
H T vs,s %1o T&.9 5 LZ'5I PSI
2
I2 o3/" PZJ,t427G
Sy I 1
_:f 3<V C3 R0
7 -
SAL2
PI3
17 "XQ21 p1R11 I
2i 4Xv
; 5""5
620 K
022
2 4f =S a I !or SO Ciruit ara=- I
P3
P5VDIO
423 9102 P ________ _20,f.1
2)22 j. ro ________
:145730
asL FRM DA ORUM Q2Circuit Diagram
K FODU FRAM 2-17/18o2

4 4 3 I 2ff....1,,t REVISIONS
ZONE LTR DESCRIPTION DATE APPROVED
D D
R3 3
N5 Q NL SSO3 E-IS
15K
ci 2OQNClH 3. LSM) a j AIl. 2J'8l92i
7 q.4 ..01 100 I UPOT
ZNI)S S(N SE-LECT 7
SC3)AL L. ,! JS . INSH mS ' kw
S 24___ 4)LS Z R4cTIO.1OKCINOLTED0 H N.5 a6 -05]6
AAP4 MEN ±UFE± to 0.' O IVIT DIH)RprI I
Figure 2-6. Video Preamplifier Circuit Diagram
CD

Assuming a signal shunt capacitance of 25 picofarads or less, the preamp meets the
original specification, that is, an equivalent noise current of less than 4.4 na over a 13
MHz bandwidth.
2.4 VIDEO PROCESSOR
A block diagram of the video processor is shown in Figure 2-7. A detailed circuit diagram
is shown in Figure 2-8 (Schematic No. 4000-036).
IN FROMI GI TG KILE3DCeIhP B A K N
hiUTGI T OUTPUT DRIVER VID)EO
IMYO ISECONOX
GAIN CONTROL
COMPOSITE PULSE CONDX [
BLANKING
Figure 2-7. Video Processor Block Diagram
2-20

P1.01 R5i
5, 7 2N 6 1
fOLO 0
COMN;
V2o0
qt MIDN
T~o
Dig3 LMZS
z.'
S IwN-rs
ii
* ~ ~
UO~5 F--~P~t~TLO IllUS.
(06
5-tl
31 PA~
PI sRLJ 3S

539 2 SC REVISIONS
NEDESCiTIN DATE APPROVED
E
T (9• 7a.-n''-
"5 - ,39K C5 7PI5 zj7
CIO 750 G~, 4 360
2*44010 CiQ73,
R16R
6h IPR 'sn2?oK
C8C
¢i' oDS 22- [.oo .
so1 ___'._ _ - --{[ } -T# )
MG/ R41S iqP 9
R Z) DIO '2 31 P 4 L-0U.D
W914 6f, tAT -7pFA CKIL (,,
3 T isazI.J I "s7
t ~ ~ 2- 7Z QJ(0EI f" I I ?ie PR4eso
2~P± APLC EC3L
T S I UNLS OI IS I I
2 OLACEDECI + C -21/ANGLES
'-WiH T+~5r-A~i4(bFRACTIONS2E5 ±+ 114K N~~~~ATERIAL- CIC T DIN Rh
.3- -3 -jTUE VIDEO PROOXSSOR Figur2,-8 Vlie Processo CicutDal n
SIZE CODEIDENTN
C N 4000 -036 SNEUr J PSCALE52 4 1
Figure 2-8. - Video Processor Circuit Diaigram
2-21/22

The initial-g hnage consists of Z1, a wideband adjustable gain inverting amplifier. This
feeds QI, an emitter follower to provide the proper impedance level for-the keyed clamp.
Q2 is the pulse conditioner of the keyed clamp, Q3. The function of Q3 is to clamp the video
to a fixed de voltage for a portion of the retrace interval. 'This voltage is held for a line
period by the 0.47 microfarad capacitor. This dc level (black level), is updated every line.
Q4 is an emitter follower to provide isolation. Q5 is the blanking mixer. A small amount
of emitter peaking is used here to make up for any loss of bandwidth. The blanking pulses
are conditioned by Q9 and Q10. Q6 is an emitter follower used to provide a low impedance
for the gamma circuit. The gamma circuit itself consists of a non-linear adjustable thres
hold voltage divider. Q7 and Q8 provide adjustable low dc impedance voltage sources for the
load resistors. Q12 and Q13 form a gain stage. Q1l drives a silicon raysistor to provide a
remote adjustable video gain control. Z2 is a low output impedance thick film driver.
The video processor will provide 1 volt peak-to-peak video signal into a 50-ohm load with a
bandwidth of 15 MHz. Since this circuit is direct-coupled from the keyed clamp to the out
put, -it should provide excellent low frequency response.
2.5 BIAS SYSTEM POWER SUPPLIES
Figure 2-9 shows the basic bias network. They are shown in more detail in Figure 2-10
(Schematic No. 4000-038, -2 parts). Six power supplies, shared with other camera circuits,
are used to provide sensor tube voltages and currents. Nominal operating values are indi
cated. Most of the controls consist of both coarse and fine adjustments. Of these, focus,
prefocus and target are the most critical, see Figure 2-11 (Schematic No. 4000-032). Grid
4 is least critical and is operated from a fixed supply at its nominal value. Grid 1 may be
biased with either positive or negative values, so a bipolar power source is used. Grid 2
(anode) operates nominally at 2 kv, but may be varied along with Grid I to control beam
current. The last power supply provides a dc bias for the deflectrons, Grid 5 and mesh, all
of which are practically at the same potential.
2-23

VTARGET
0 TO +25 V
-100\VI -9 070. 90.11
-so o ..soA Focus
100 MA
10 V PflEOCUS 400 NA
OOKG2, 3 -2000 V
01 K ,DEFLECTION AVERAGE
CENZTERINGX.
DEFLtCflOT
0 EFSII 0,G5 SIS
+1000 V
Figure 2-9. Bias Network
2.6 LINE DRIVERS
This collection of circuits on a printed circuit board interfaces betveen the sync generator
and video processor and display/readout. It provides correct polarity pulses at the proper
source impedance and voltage levels.
2.7 FAILSAFE AND BLANKING
A 30-volt dc level is produced on the vertical deflection board in the event that vertical sweep
fails. This voltage is produced by rectifying the output deflection voltage. The 20 volts is
summed with a similar voltage on the horizontal board through diode gates so that if either
sweep fails, the composite blanking circuit will be disabled, putting the cathode at 20 volts.
These circuits are shown with the deflection circuitry on Schematic No. 4000-025.
2-24

C
7 ,
POWER
Rs. I
P S.a PS. 3 RS. 4 PS, 5 2S.6 P. 7
2S.. PS. 9 PS.10 P5.11 P. S. 12
P S.13 P.S.Iq
MOTE-S:
I.Re(
5UPPLY A251G/IAEvmT ,
D-L-c&D
P-5.1-OTSOA P-SLLI-07,50A .J:
HFC-3.0-O75oA HFC-30 0-QSO-A P-9.6-O,37$A P-100O-QO5OA
DUL ETcD HFC-500.0-OCSOU DELETED DP-LTE D
HFC-1,5O-.05EY
NVSO-502Av HVSO-502M
bwGt 1ooo-0 2q
2:
C)5
C+)29 .c-)20 (- o )5I00
500 32-.-.
(Yxt ADi)
(xT, AD. (EXT.Ao)
Z. A01. TO -t15 Vbt1A6C SCOt" IVStLA7IWOA
TURA1 OM SeyL'MC6 'A. tTCD LIVE, r.,S 2)3,))!a
-S- s",s 79 C. 2 DEZA Y pS 's _.Z4
A ALL RESISToRs 2w S5%)comPO rloIJ Au CAPACrrORS 0.01 F 3 KV
FOLDOUT FRAA 4

,C5 4 3 2 HI I ZE REV
ZONE LTR DESCRIPTION "DATE APPROVED
B/A35v, - (-- 0 Via
10V1542( S 14)0 ---.- '-1
I .aC FP-2110 FP-R2ml2 FF-RWORI72a U K10
rEzCOAPSC1 FhUF FP-R2, FP-P23 FP-R28 H1.CENT -A4&'=o /-/E8ook Z , S - Iz-
-* SY/CFOC.
) VIDEO1 H, SW?, VtbJP o -"skt F=RG
" L FPPOG DVItrO, tOe.. .. 0 0 o
B/A-S (YI5,9) p
"32, H. SWpe/A5 V "wK m
( F ) . -OOK FG-s:; FP-RIl.R-154-
ADS) FIL, t -, FE - FOLD
A)T.) C-2/3 P-IR3 -1
P -lARGE.£M VE
-100 o o..-
(. 7)
2 CA Y -5
Ac. I I
FP-T 't
ALtIfO TRAU - AurO 7eA~2I -a1.
NSr 4ooo-oz 7
UNLESSOTHERWISESPECIED SIGNATURES StY
A2 E L ECERIAREININCHES- A2- G TOLERANCES DIMENSIONS .
Z4ON 2 PIACC DECIMALS ALL 3PLACE DECIMALS- SURF. Z7 70 C/fl lT D/A RA M ANGLLES± AFRACTIONS+ MATERIAL- M 10 -
SIZE CODEIDERT140
C z/000 - 0 5 8 A
5 4a
Figure 2-10. Power Supplies and Bias, Circuit Diagram (Sheet 1 of 2)
2-25/26 FRAME (2FOLDOUT

7 6
E
MD
c+
77
FoI-o
C .oo

22 435
DATE A.''CVEDZONELTR DESCrIPTON
.I
R S
FP-RZ7
- - FROAIT RAMI, -FP-R2Z
i.5o FIL
E
0 -t20 D
-0 -20
- oo
I ~ AXo L_
C
C 7'Ll
0
A - 5x ICHD Z MI
8- /IT T//4 DELAY
C- 2 ea TIME/ O.-AY
;.u
UNLESSOTHERWISES CIFIE DIiENSIONS AREIN INCHES-TOLERAiCES ON'=
2PLACEDECIMALS± ALL 3PLCE IS+ SURF. ra+TrtT ±
SIGtATURES
a
DAT .o
_ 7
6 E H E R A L E L E C T R I BEJ1[EPiA tI
OI/RCU IT DIAGRAA4 POWr? 3UPPtI/MS A/ID
MATERIAL- -
SI.4 S SSIZE CODE IDENTNC O00-O A -
j-ICALEI-OVE I 7SHEEr 21. -
5 I 4
Figure 2-10. Power Supplies and Bias, Circuit Diagram (Sheet 2 of 2)
2-27/28FVOL13U

7 I6
E t P34V
F?-R31 F" P
477
I *
P144
3470 A' -4
FP-R3 P20
PS40I P14P
0.1
A FPRIIN ?K2
FP-R32 P20
F.MFI RINEDII
2
U2'
TRAMPN
-C
P'A
' 35

2ONE LTR DESCRIPTION DATE APPROVED
E
C 4
1oo A; /so
P2~ I
K P29
C.
"V7
GLo" J
Ag nC
4o00- 0-2c2--Z~pLCS OECUAL
2It'2 I/ ,C,2Sas 3 P E ECUIPSSUR I "
29 1
I ~ ~SCIC ~ ~IGZTU ~ CL INESSHEETS
DISENSONS AP II. EES- BAligE mA n j Ec ilC
TOLEFOMDOU ONRAME. -I~~rODU ~ pic FRAME4E

SECTION 3
CAMERA OPERATION
3.1' CAMERA STARTUP
This sequence consists of: 1) providing air pressure (, 10 psig), and 2) activating the ON
switch at the top right of the panel. Note the filament voltage and current at, the appropriate
meters. Readings should be 8 volts and 900 ma, respectively (ignore initial surge). Filament
voltage is preset with a labeled, locked control. This should be readjusted only upon obtaining
a new sensor tube, if the new tube's specifications are different. The peak filament voltage
available is 15 volts, which would damage the sensor.
The following nominal values should be present immediately:
Focus Current 100 ma Prefocus Current 400 ma G1 0 G2/3 0 G4 0 G5, Mesh 0 Target 0 I ok 0
Also, at this.time, sync pulses will be available from the camera.
After a delay of 25 seconds, the readings will be:
Focus Current 100 ma Prefocus Current . 400 ma G1 +30 volts G2/3 0 G4 +500 volts G5, Mesh 0 Target 0 to +25 volts Ik 0
3-1

The next time delay of 25 seconds will bring G2, 3 to +2000 volts and bias (on V and H meters)
to +1000 volts. These are nominal values. The 1 second vertical sweep voltage will be noted
oscillating on the V meters after the first delay. After the second delay, the do reading on
these meters will gradually rise over a period of perhaps 60 seconds to the bias voltage.
This is due to ac coupling in the vertical deflectron circuit.
Full cathode (or G2) current is not immediately available, as the cathode must "warm-up",
f process that requires at least 10 minutes. A cathode current of 600 ga to 900 ga appears
to be best.
3.2 OPERATING PARAMETERS
Most of the voltages and currents to the sensor tube may be varied over a range of values
and a video output will still be available. There are, however, optimum values that have
been arrived at through on-the-air testing. It is recommended that all experiments begin
with these values. Observed effects and interactions per parameter are discussed here.
3.2.1 GRID 1
This is the main control of cathode current, along with G2. At least 600 pa should be avail
able. G1 may operate positive ornegative, so long as the cathode current does not exceed
1000 ga. If G1 goes more positive, the current may be lowered by decreasing G2. Camera
sensitivity is somewhat affected by these changes. Nominal G1 is 30 volts.
13.2.2 GRID 2
As mentioned, Grid 2 controls cathode current and may vary, going as high as 3600 volts.
Approximately 99.9 percent of the cathode current is removed at G2 (first anode). The
remaining current is focused on the target. No significant effects result from adjustment
of G2 as long as such changes are counteracted by changes in G1. Nominal G2 is 2000 volts.
3.2.3 GRID 4
Grid 4 has no significant effects; fixed bias is 500 volts.
3-2

3.2.4 GRID 5
Grid 5 is biaged at deflectron average value, !000 volts. No control.
3.2.5 MESH
Mesh is biased at deflectron average value. Some control is provided, but it is not significant.
3.2.6 TARGET
The signal element, or target, operates between zero and 25 volts. There is an optinum
value for maximum video output, which is a function of GI, beam current and alignment
current. Nominal target voltage is 17 volts.
3.2.7 FOCUS AND PREFOCUS COILS
These coils provide the magnetic fields required to bring the beam to a focus at the target
surface. One complements the other, so that a change in one current requires a change in
the other, up to the point of achieving maximum resolution. It must not be overlooked that
the lens be brought into focus. This may be accomplished by a first gross adjustment of
electrical focus followed by a lens adjustment, etc., until best resolution is achieved. A
high resolution test chart must be used, as explained later.
Lowering the focus current increases the deflection sensitivity. With the sweep voltages
available, this must be done in order to see the entire target at once. Best focus cannot be
maintained, however, at this setting. Nominal values are 400 ma prefocus, 100 ma focus.
3.2.8 DEFLECTRONS
The deflectron sensitivity is approximately 200 volts/inch per plate, or 400 vp between plates.
The plate-to-plate capacitance is 300 pf. Horizontal sweep retrace is affected by this large
capacitance and is effectively lengthened to 20 usecond. The two voltages for a pair of de
flectrons will not be affected equally, so the waveforms must be adjusted by small poten
tiometers on the circuit boards, while in the camera. Periodic adjustments should be made
for best performance by using a dual trace oscilloscope (1500-volt input breakdown) with a
probe on each of the two Y or H deflectrons. Location of these controls is shown in
3-3

Figure 3-1. The procedure consists of turning both sweep amplitudes to 75 percent (front
panel) and adjusting controls in this order: feedback, bhlance, repeat. Adjust linearity if
necessary. Feedback controls the maximum amplitude a ailable. The oscilloscope may be
used in either "sampled" mode or subtractive (tune for minimum differential error).
Figure 3-2 shows vertical board control placements.
3.2.9 BIAS
The deflectrons form a part of the electron optics and as such require a dc bias voltage,
nominally 1000 volts. Changing this value will cause loss of focus (correctable)- and mis
alignment such as "portholing". Unbalancing the dc potential between X and Y deflectrons
may also cause or correct this condition (astigmatism). Unbalancing the dc potential between
X or between Y deflectrons causes de-centering. In the case of vertical centering, a time
period of about 15 seconds should be allowed for the position to stabilize.
3.2.10 ALIGNMENT COILS
Alignment coils are critical for minimum shading, maximum signal and best focus. Attaining
these goals is the criterion for adjusting alignment coil current.
3-4

CONNECTOR
R89 FEEDBACK
E8iBALANCE
R95 LINEARITY
.
RS LINEARITY
f 34 FEEDBACK
R1l 1ALANCE
H40 SHADING
C cn
Figure 3-1. Horizontal Sweep Adjustments Figure 3-2. Vertical Sweep Adjustments

SECTION 4
CAMERA EVALUATION
Tests were conducted to study the following basic parameters:
1. Resolution
2. Gray Scale
3. Signal-to-Noise Ratio
4. Shading
5. Lag
6. Video Channel Characteristics
The procedure for each test will be discussed since the techniques vary. Two main problems
were encountered. First, the lack of a high resolution display, and second the annoyance
of making adjustahents with a one-second delay. In most cases, the standard oscilloscope
with 12mHz+ bandwidth and delaying sweep will suffice for an A-trace display. In some
cases, however, it is good to have an X-Y display, to check centering, size, shading and
other gross effects. By overscanning the display, smaller portions of the image at a
higher display resolution may be observed. Most oscilloscopes will be limited by spot size,
phosphor spreading and insufficient beam current. Adjustments must be made in small
increments as some parameters are quite sensitive. This is indicated in the test procedures.
4.1 DETERMINATION O-F ILLUMINATION
Using a Spectra Physics Spot Brightness meter, a brightness of 80 foot-lamberts was
measured. The light-box source was operating on 76 vdc to eliminate 60-cycle modulation
on the lamps that would be picked up by the sensor tube. At the commercial vertical scan
rate of 60 frames/second, such modulation might only have a minor shading effect on the
sensor video output, but at one frame/second, with an ac-operated light box, a false raster
of 60 lines could appear in the display.
4-I

The light source was placed so that the horizontal dimension of 9 inches imaged on the
target as 175 inches, giving an M 1. 75 0. 195. The lens aperture was f/4 (see Figure
4-1).
1.75 INCHES 9 INCHES
([ LENS
Figure 4-1. Optical Path
To find illumination, the formula for finite conjugates is used:
BT 2T where F = illumination
B = brightness = 80
T = transmission = 1
f = aperture = 4
= 0.87 foot-candles m = demag. - 0.195
4.2 SETTING UP THE TEST CHART
Standard test charts have usable dimensions of 7 x 9.3 inches. A gross estimate of position
may be made by simple geometry, knowing the focal length of the lens. An accurate setting
may be found by displaying the video output on an X-Y display. The available deflection
voltage is insufficient to fully scan the 2. 5-inch target, so a compromise was found. By
adjusting the horizontal centering, both sides of the target may be seen (Figures 4-2 and 4-3)
and the image size determined. The image should be in reasonably sharp focus. Knowing
4-2

I 'II
Figure 4-2. Image of Double Doyle Chart on Target. H Centering
Shifted to Include Right Side of Target (Inner Circle)
//
Figure 4-3. Image of Left Side
4-3

this, the desired scan voltage may be determined by the A trace, allowing 160 microseconds
for scan. For example, if the chart is imaged less than 1.75 x 1.75 inches on the target,
and the scanned area = 1.75 x 1.75 inches, the ratio of image size/1.75 inches determines
the percentage scan time of the sweep on the image and may be set up on the oscilloscope.
If the image equals 1.1 inches, the scan time equals:
0 1.11.1
175 x160 is = ps
based on this, the sweep voltages may be set to produce desired scan coverage.
4.3 LIMITING RESOLUTION
A test chart with markings spaced to represent 4000 TV lines with a 1. 75-inph image was
not available, so the following expedient was adopted: A Doyle chart (maximum resolution -
1000 TV lines/picture height) was photographically reduced by 1/2, and four such slides
combined to produce a 2000 TV lines/picture height chart. By imaging the chart at 1. 1
inches on the target, the equivalent resolution of the chart across 1.75 inches on the
target equals
4/3 x x 20001.1
= 4200 TV lines total. I In making the resolution measurement,
microseconds).
of course, the entire 1.75 inch is scanned (in 160
Procedure
The camera should be set up at all nominal values, and the proper light source placed as
indicated previously to bring the lens to focus. This can best be done by observing fine
detail in the test chart on the A-trace (one line displayed). Now, Electrical Focus should be
brought up as fine as possible. It may be necessary to repeat this process a number of times.
4-4 I

Alignment current and target voltage changes might be necessary to obtain maximum signal
level. Laboratory results are shown in Figure 4-4.
4.4 GRAY SCALE
A RETMA chart was used, although any gray scale chart with the right step ratio may be
substituted (see Appendix C). An auxilliary X-Y display might be useful to observe shading
and correct deficiencies with alignment controls. Figure 4-5 consists of a single line
*through the horizontal gray scale.
4.5 SIGNAL/NOISE
With a white field (no test chart in lightbox) tune for maximum signal without saturating
either Target or Video Amplifier. This involves Target, Gi, and alignment coils. Figure
4-6 shows maximum signal obtained and Figures 4-7 and 4-8 show noise with a minimum
signal and with the lens capped. The result was 39.4 dB. It was found convenient to mask
off part of the left and right sides of the light-box to obtain a clearly defined signal well
apart from the blanking pulses, which would have confused the reading.
4.6 SHADING
In this case, the image was 1.75 x 1.75 inches and fully scanned to measure edge-to-edge
shading. Using Target, X and Y alignment coils, and Focus coil, the field was brought to
considerable flatness. The double (2X) Doyle chart was used. (Figure 4-9).
O 4.7 LAG
With the light box used as in Section 4.5, and grossly imaged at 1.1 inch, the scan was
reduced to 1.1 x 1.1 inch. Using a Polaroid camera with electric remote shutter and an
observer at the oscilloscope, the following procedure took place: Operator No. 1 observing
the scope gave a synchronizing command at the appearance of a line trace. Operator No. 2
then shuttered the high resolution camera and film camera simultaneously. A time exposure
for four frames yielded the decay pattern shown in Figure 4-10. This procedure was repeated
six times to obtain an average, but all photos agreed within 5 percent. A manual technique
such as this is, of course, possible only at slow-scan rates.
4-5

4.8 SYSTEM VIDEO RESPONSE
Using a Kay Marka-Sweep Generator applied to the preamplifier input (schematic 4000-037,
J2) the preamplifier and processor in series were swept with frequencies from dc to 20 mHz.
The bandwidth of Figure 4-li is nominally 1 volt peak-to-peak, + 1.6 dB from 8 Hz to 12
mHz with some continuing response beyond. The input signal was equivalent to 230 na-
full video gain.
U
4.9 GAMMA CORRECTION
A low frequency triangular wave was inserted into the video processor (solid line, Figures
4-12, 4-13) and the gamma control set to its two extremes. The range of 1.29 to 0.7 was
produced in the output (chopped by blanking pulses).
4
I
i I I
*
4-61

7 2 X Doyle Chart One Horizontal Line Displayed Last Burst = 4200 T.V. L. 1. 0 v/cm Full Chart Scan Target.scanned 1-3/4 x 1-3/4 inches 12 mHz B.W.
Figure 4-4. Resolution
Video Signal 0.2 v/cm
20 Ms/cm 9 Shades Visible
Figurp 4-5. Gray Scale
4-7

7777777!
............
[One
' ... :
1.45 v peak into 51 £ Noise v.vp-p
S/N = 20 Log 6S/N
Scale 0. 5 v/era
20 ns/cm
Noise on Peak Video = 0. 1 v p-pline/frame readout
5 consecutive 12 mHz B.W.
fr es
Figure 4-6. Signal Output
I
Signal output 0.2 v Noise 0. 1 v p-p Scale = 0.2 v/cm
= 20 ps/cm 12 mHz B.W. Same Readout Technique.
I
~I Figure 4-7. Noise
~I
Lens Capped Noise 0. 1 v p-p Scale = 0.2 v/cm
20 ps/cm
4-8
-
Figure 4-8.
Same Readout Technique
Noise

2 x Doyle Chart Image on Target
1.75 x 1.75 inches 0.9 ft-candles
t 0.5 v/cm 10% shading
Figure 4-9. Shading
Light Source - white field Display - one line/frame (4 frames) Lens shuttered at first trace. 2nd trace 45% 0.2 v/cm 20 Ms/cm
Figure 4-10. Lag
4-9 9-.

Input to preamp 230 NA . Output shown Is composite video
across 51 O2termination, 0.5 v/cm.
I.Response 0 + 1.6 dB 12 mHz B. XV.
Figure 4-11. System Video Response
Triangular Wave input OutputGamma(V) =1.29 0.2 v/cm
i4i
I Figure 4-12. Gamma Correction
-, Same Input I Output Gamma 0.7
Figure 4-13. Gamma Correction
4-10

SECTION 5
DATA EVALUATION
5.1 RESOLUTION
As described in Section 4 the camera system resolution was measured with the use of the
Doyle Chart, as modified for the higher spatial frequency capability. A line of video taken
through one burst of frequencies on the chart was used and the peak-to-peak video signal was
measured for each frequency. The signal-to-noise (S/N) measured at essentially zero
spatial frequency was 37.0 dB. As previously indicated the S/N measured against a *white
field was 39.4 dB. Thus, it was assumed that the reduction was due to a chart contrast of
85 percent. The data was corrected for this chart attenuation and is presented for 100 per
cent contrast.
Figure 5-1 shows the relative square wave response as measured with the equivalent rms
noise level indicated. The last data point taken was at approximately 3800 TV lines/picture
height with the extrapolation to the noise level showing a limiting resolution of 4400 TV lines/
picture height. The square wave response in terms of S/N is shown in Figure 5-2. The con
tract specification of 26 dB S/N is seen to occur at 2500 TV lines/picture height.
The lens used for these measurements is a Nikkor, 63 mm focal length, f/3.5. The optical
transfer function for this lens was measured as shown in Figure 5-3. The system square
wave response data was converted to sine wave response by means of a Fourier transforma
* tion and then corrected for the lens optical transfer function. The results are shown in
Figures 5-4, 5-5, and 5-6. From this data the sensor limiting resolution is projected as
4850 TV lines/picture height or 48 line pairs/mm.
An estimate of the limiting resolution for less than 100 percent contrast was made by using
the data of Figures 5-1 and 5-4. These curves were proportionately scaled down for a given
contrast value and the intersection of the resultant curve with the equivalent rms noise was
designated as the limiting resolution. The results are shown in Figure 5-7. For example, a
5-1

10 percent contrast scene would have a limiting system resolution of 3100 TV lines/picture
height. Based upon the square wave response data, a limiting sensor resolution of 3350 TV
lines/picture height is arrived at based upon the data corrected for the lens response.
5.2 TRANSFER CHARACTERISTIC
The transfer characteristic of the vidicon was measured with the gray scale on the RETMA
Chart. Signal amplitudes were measured for each of the blocks in the gray scale and pre-
O' ted as a function of faceplate illumination. The result is shown in Figure 5-8. The data
was taken with the gamma correction circuit in the video processor disconnected; the measured
gamma of 0. 86 is the vidicon response. The intersection of the transfer characteristic with
the rms noise level shows a limiting sensitivity of approximately 0.01 foot-candles.
5.3 IMAGE LAG
The results of the image lag measurement as previously described is shown in Figure 5-9.
The second readout shows the signal amplitude at 45 percent of the initial scan without the
amplitude down to 8 percent on the fourth readout.
I
i
I
I.
5-2

~--~-- m- - - - - - - - -
-A
.$
w
'.4
€0 Figure 5-1. Modulation Transfer Function Corrected far Lens Response

- - - --- - - - - -- - - - - - - ---- - - - - -- - - -
- - - - - - - - - - -
-- - - - - ---- - -- - - - - -
-- ----- ----------
e-n
FI
rA U1
Figure-- -/N 2.----- Versu u---n -- - qM
I - - - - - -I. m-m-m-m-m-m-m------N4
Alp ;I
04
4-4
,14 -4t
P, Figure 5-2. SIN Versus Resolution

- - - - - - -
L 0 I.J-
o
z ,0V) !lJ
20 0
Cl
SPATriAL FR~aIJENCv," L-P/w,,
Figure 5-3. Optical Transfer Function

IH I
hOL L
+H ;-------- L
Iz --- -- -0
,~f-,x-- .r ---
s------- ---m m~n 4
UL

-o
o.o oojl000 I - 4000 -\//\CTURE- H-4--
Figure 5-5. Square Wave Response - S/N Versus Resolution

000 - - - - - - -
1'1 1i i l 1 n r E
- - - -- - I ; 6 1 1 T
C-
I--
IA- m---- - m -

&I-AUTT-lIQ ME!. r1HP 11W N tfl + 1;l~ -l -- - f
5 i K f
" :!c
l!.
ic
1a9nfo7
id~i 1 iANl
_
WiQ
_
Q
Si4Li
T
ya na 4+c;t+
45
alf 1& ii i
mII-7 t . ill
-
s
l1 loil 7tt
1 1:42 2r1 :ho, , q : .. f 1 : P ± S1
in ot1jitj {J Hj1 l t H,A Ain[111It!tj i i*h4 +7 ,
R-1 1~
c!t
'Emu!
o i
t
L it.n'I U T
i i 1'L 4 -.!
H At4' T lp
ill Hi2
P4 Q14
I-,- 22
m: 1 t1 .. ~~~~~~ ....in t+i A i
4+.h
L4111 LL
i+i1i
t±L
+
W W
IVi;+,I
a
i; i
:2aU
i +4it+
ifi l iffW
Cg Fi ur Li ii g R s l to4es s P r e t C n r s it7

w !I3 aI 1 Ht 1 3 . 6 2 1~
I1fR 1, 'M 1 1 0 1i Ofil 11111 111 llt 1l I Ifl fl Ii :141 M NV g: i
2lfI
dyu QMHi ji JI: r JAI fly - :J44 1 Ifli
ft t 4 I i H p IVIA RM J7tt1i4 1, I P MH1 R II MET11
1t0 H91, i T l]i
...... I t........ " jftw1
mH - tK t XImm-0,s , _
)
Figure 5-8. Signal Amplitude Versus Faceplate Illumination

Figure 5-9. FPS-5 Vidicon Image Lag "•
5-11/12

SECTION 6
CONCLUSIONS
The initial evaluation of the High Resolution Television Camera System with the selenium-doped
antimony trisulfide photoconductor FPS-5 vidicoa has shown encouraging resolution and sig
nal-to-noise performance. This data has been taken on-axis with a high contrast scene and
fixed illumination condition. The camera operating parameters were a 1 second frame time,
5500 line scan, and 12 MHz bandwidth. Proposed applications for this system indicate the
requirement for operating at a slower frame rate reducing the electronics bandwidth, and
viewing low contrast scenes at a varying illumination level. This indicates the desirability
of a measurement program to. obtain further useful performance data. The following are
recommended.
6.1 SCENE CONTRAST
Predictions from data obtained at 100 percent scene contrast have indicated the expected
resolution performance at reduced contrast. However, in order to verify this estimate,
measurements of resolution should be made at variable scene contrast. The results would
be presented in terms of the modulation transfer function (MTF) for various scene contrasts.
From this data the limiting resolution can be determined for reduced contrast scenes.
An Ealing Variable Modulation Test Target could be used for these tests. This instrument
is a test target display where the viewed contrast between the light and dark portions of the
test pattern can be varied from zero to 97 percent in a continuous and predictable manner,
while automatically maintaining a constant average intensity over the whole field of view.
A test target is used that has fifteen bars at each spatial frequency (1 line pair/mm to 1000
line pairs/mm) providing a better approximation to an unbounded domain and avoiding the
boundary errors produced with three-or four-bar targets.
6-1

6.2 SCENE ILLUMINATION
These measurements involve obtaining transfer characteristic data (signal-to-noise versus
photocathode illumination) for different tube operating parameters (target voltage and beam
current) to establish the sensitivity, dynamic range and gamma of the tube. Also the MTF
would be measured at various illumination levels to determine the limiting resolution as a
function of photocathode illumination.
eEaling Test Target should be used for these measurements with a series of neutral density
ers for varying the illumination level. A fixed optical f-number must be maintained to
minimize the effect of-optics resolution on the results. A high resolution display would be
used for correlation of the observable resolution with limiting MTF resolution measurement.
6.3. OFF-AXIS RESOLUTION
The vidicon MTF can be measured off-axis with the camera system focused for best resolu
tion in the center of the photoconductor and then re-focused for best edge resolution. The
results of this test will show the amount of off-axis resolution degradation and provide informa
tion as to the necessity and/or requirements for dynamic focus correction.
6.4 STORAGE TIME
This measurement would consist of illuminating the tube for a fixed time interval with the
electron beam turned off and then reading out the signal after a varying period of time
(nominally 1 through 60 seconds). In this manner the effect of the charge storage time on
jjnal-to-noise and resolution can be determined.
6.5 CAMERA DESIGN IMPROVEMENT
6.5.1 REDUCE FRAME RATE
The camera electronics could be modified to obtain the 5500 line scan in a 2 or 3 second frame
time rather than the present frame time of 1 second. This will result in a bandwidth reduction
from the present 12 MHz to 6 MHz or 4 MHz, respectively, which would reduce the noise by
a factor of 3 or 4. The signal current will also be reduced at the slower rate, however, the
6-2

net effect will be an increase of about 1. 5 to 2 in signal-to-noise. Operation at tie slower
rate provides a bandwidth that is more compatible with sp~aceborne video recorders and
transmission links, thus it appears the evaluation of the ca'mera at this rate is desirable.
6.5.2 APERTURE RESPONSE CORRECTION
An aperture response correction circuit can be designed and integrated with the present
camera system. Its function will be to enhance the response at the higher spatial frequencies
Ito provide a flatter MTF response out to 2500-3000 TV lines/picture height. The addition
of this feature will add some noise, thereby sacrificing the low spatial frequency signal-to
noise ratio for the improved higher frequency response. The reduction of the frame rate
will enable the correction to be accomplished at a lower electrical frequency, which will
simplify the implementation and improve the overall signal-to-noise.
6.5.3 CAMERA EVALUATION AT REDUCED FRAME RATE
The standard resolution, signal-to-noise, image Lag, shading and transfer characteristic
measurements may be performed on the camera system at the reduced rate and compared
to the 1 frame per second rate data. Also, the measurements outlined in Section 6.1 should
be performed at the reduced rate. The aperture response correction would be evaluated for
its effect on the MTF and signal-to-noise.
6-3/4

APPENDIX A
DOYLE CHART

Wertl nghouse RESOLUTION CHART ET-1332A
To simplify the taking of accurate and objective resolution data this new type of resolurion chart ET-1332A was designed by Westinghouse. The chart in combination with a line selector oscilloscope makes it possible to obtain from a single oscilloscope presentation all the data necesscry to plot a complete square-wave aperture response curve.
The basic format of the chart is 8 x 10" while the inside reference height is 7 inches and the width is 9% inches. There are nine resolution patterns within the chart, each of which contains a wide black and white reference bar followed by ten sets of 4 black and 3 white bars. The wide bars represent 100% response factor and the ten barsets of decreasing width represent from 100 to 1000 TV lines per raster height in 100 line increments.
The bcr width and TV lines per raster height equivalent are given below:
TV Line Equivalent Bar Width (Inches) 1 7', ljj j ' '4 I
100 0.070 200 0.035 300 0.0233 ......
400 0.0175 iiI~1U lbAI~Il IllL 61I So0 0.0140 iI 600 0.0117 © ® ® 700 0.0100 800 0.0088 "'900 0.0078
1000 0.0070 I
The dimensional width of the bars which represent from 600 to 1000 TV lines is within ± 0.0003 inch while the tolerance for the remaining bars' is better than ±0.0005 inch. In addition to the bar groups the chart contains eightf$@ patterns whose diameters decrease from 0.50 inch to 0.044 inch as afunction of the square root of two.
The chart is normally set-up in a light box so that the area of the chart determihed by the small triangular marks just fits the imaging region to be evaluated. The tube and/or system to be evaluated is than adjusted for the desired operating conditions while the video signal is fed into an oscilloscope with delayed sweep such as the Tektronix 545A. The oscilloscope is set to select the desired horizontal raster line and from its signal presentation all the data required to plot a square wave aperture response curve are available without recourse to oscilloscope settings, amplifier gains, etc.
Thus, this chart in coordination with an osctlloscope makes it possible to obtain, from even the simplest of imaging systems, complete and objective resolution measurements.
WESTINGHOUSE ELECTRIC CORPORATION, ELECTRONIC TUBE DIVISION, ELMIRA, NEW YORK
A-if/

APPENDIX B
RETMA CHART

Designed for Tomorrow.- Available NOWI
The NEW 503-7681 >-A
%V
25 9007
%> ines_200 ~2
- 4 -700-' 200
m-400 1 800
STOCK. M.,1, 200 to 1600Pol ...,. . lines
Diamond's advanced technology in the manufacture
of High Resolution Closed Circuit Television Systems required an advanced quality test pattern to measure
the increased picture quality.
* Our Photo-Test Materials Lab developed this pattern because of the numerous requests we have had from our customers.
Now you can obtain this high resolution test pattern in an 8" x 10" transparency from stock.
Order it by stock number 503-7681 at $15., F.O.B.
Lancaster, Ohio.
DIAMOND POWER Diamond Power Specialty Corporation Post Office Box 415 Lancaster. Ohio 43130 Telephone: 653-6540
n-1 /2

APPENDIX C
EXPLANATION OF RETMA CHART

INSTRUCTIONS FOR RETMA RESOLUTION CHART 1956
1. PURPOSE
The RETMA Resolution Chart 1956 was designed to provide a standard reference for measur
ing resolution of television cameras and as an aid in testing for streaking, ringing, interlace,
shading, scanning linearity, aspect ratioand gray scale reproduction.
The horizontal resolution which may be obtained from many camera chains is limited by the
resolving capabilities of the camera tube, and not by the bandwidth of the video amplifiers
employed. Therefore, much useful information concerning the limiting resolution, percent
response at various line numbers, and degradation of resolution with aging of camera tubes
can be obtained from a test chart containing a high number of lines. For these reasons the
horizontal and vertical wedges of the RETMA Resolution chart 1956 have been arranged to
permit resolution measurements from 200 to 800 lines, whereas the wedges in the original
RIIA Resolution Chart 1946 extend from 200 to 600 lines. The reflection density of the
various steps of the "paste-on" gray scales used w--ith the 1956 chart are very accurately
maintained in the manufacturing-process, while the reflection density of the gray scale steps
on the 1946 chart were not as accurately controlled.
2. DESCRIPTION
With the exception of the changes in the resolution wedges and gray scales the new chart is
identical to the RMA Resolution Chart 1946.
The center horizontal and vertical wedges are copposed of four black lines separated by
three equal width white lines. The numbers printed alongside the wedges e'orrespond to the
total number of lines (black and white) of. the indicated thickness that may be placed adjacent
to one another in the height of the chart. For example, if black and white lines having the
same thickness as those indicated at the 320 positbn were placed adjacent to one another a
total of 320 (black and white) lines could fit into fm-height of the chart. Since the aspect
ratio of the chart is 4 to 3, a total of (320 x 4) or 26.7 of these same thickness Lines could
C-I

be placed in the width of the chart. The fundamental frequency developed in scanning through
the 320 position of one vertical wedge may be calculated as follows:*
Horizontal Scanning Frequency = 15,750 Hz
H = time for Active Scan 4: Hor. Blanking 63.5 1 see
Assume Horizontal Blanking = 0.17 H
Hence active scan 0.83 H
And, active scanning time = 52.7 A sec
Total number of vertical black and white lines, having thickness indicated at 320 position,
that could be placed adjacent to one another in width of chart is 426.7 lines.
426.7Since a complete cycle includes one black and one white line there would be---- or
213.3 cycles in 52.7 p see. cyclic variations in scanning this pattern.
52.7Time to horizontally scan one black and one white line would be = 0.25 g see.
Fundamental Vid&o Frequency = 4 mHz
f=}1
From this example it can be seen that the fundamental video frequencies generated by scan
aing through different parts of the vertical wedges may be determined from the following
formula.
N N = indicated line number on chart T K f = fundamental video frequency in mHz per second.
320 lines = MHz K= 8 04 mHz I(6
Nf =-80
• Based upon FCC Television Standards
0-2

The fundamenaal video frequencies generated in scanning through various parts of the
vertical wedges are tabulated in Table 1.
Table 1. :Fundamental Video Frequencies Generated By Scanning Through Various Parts of Vertical Wedges (FCC Television Stahdards)
-Line Number of Vertical Wedge Fundamental Video Frequency (mHz per sec)
200 2.5 240 3.0" 280 3.5 320 4.0 400 5.0 480 6.0 560 7.0 640 8.0 720 9.0 800 10.0
The four ten-step gray scales cover a contrast range of approximately 30 to 1. The reflec
tance of step No. 1 is determined by the reflection density of the chart material comprising
the center circle. The nine step "paste-on" gray scales cover a nominal contrast range of
20 to 1, step No. 2 having a reflectance of 60 percent and step No. 10 a reflectance of 3 per
cent. The steps are arranged in logarithmic dedreasing values of reflectance such that the
difference in reflection density between adjacent steps is equal to 0.16. Table 2 gives the
reflectance azd reflection density of the steps on the gray scales. The background reflectance
of the outer useful area of the chart is 40 + 5 percent.
C-3

Table 2. Specifications for Gray Scales.
Gray Scale Number Nominal Reflectance Nominal Reflection Relative to MgO (1%) Density
(Center -Circle) 1 >60.0 > 0.22
2 -60.0 0.22 3 41.7 0.38 4 28.2 0.55 5 19.5 0.71 6 13.5 0.87 7 9.3 1.03 8 6.3 1.20 9 4.4 1.36
10 3.0 1.52
3. SHADING
Shading may be checked by visual inspection of the picture monitor to determine if the back
ground is an even gray, and if the same number of gray steps are discernible on all four gray
scales. A wave form monitor may also be used to determine if the average picture signal
axis is parallel to the black level line at both line and field frequencies.
4. STREAKING
Streaking of the horizontal black bars at the top or bottom of the large circle is an indication
of low frequency phase shift or of poor do restoration. The black bars are also very useful for
ad3usting the high peaking circuits which are used in camera chains to compensate for the high
Aeqency roll off of the coupling network between the camera tube and first video amplifier.
5. INTERLACE
The four diagonal black lines inside the square formed by the gray scales may be used to check
interlace. A jagged line indicates pairing of the interlaced lines.
6. GRAY SCALE REPRODUCTION
The transfer characteristic of the camera, for. given operating conditions, may be determined
by using an oscilloscope with a line selector.
C-4

The gray scale reproduction achieved will depend on the amount of gamma correction ema
ployed, the manner in which the camera tube is operated, and the adjustment of the picture
monitor. The user will have to standardize these operating conditions if comparative sub
jective measurements are to be made.
7. RINGING
The two sections of single line widths located in the upper right hand portion, and lower
left hand portion of the square formed by the gray scale may be used to check ringing. These
lines are included because the multiple lines in the wedges are confusing for checks of this
type. The lines in the upper right hand section have widths from 350-550 (350, 400, 450, 500,
550) and the lines in the lower left hand section have widths from 100-300 (100, 150, 200, 250,
300).
C-5/6

APPENDIX D
TUBE PIN LAYOUT

F.P.S. V - 7
TWO LAYER SELENIUM TARGET
QINT. CONN. 0
x
D-1/2


![contract labour (regulation and abolition) act-1970 Labour (Regulation and Abolition) Act, 1970 [No.37 OF 1970] C O N T E N T S [September 5, 1970] CHAPTER I Sections Preliminary I.](https://static.fdocuments.in/doc/165x107/5afedaa37f8b9a8b4d8f8a36/contract-labour-regulation-and-abolition-act-1970-labour-regulation-and-abolition.jpg)